Adsorption of Scandium and Neodymium on Biochar Derived after Low-Temperature Pyrolysis of Sawdust


1
School of Mineral Resources Engineering, Technical University of Crete, 73100 Chania, Greece
2
School of Mining and Metallurgical Engineering, National Technical University of Athens, 15780 Zografos, Greece
*
Author to whom correspondence should be addressed.
Minerals 2017, 7(10), 200; https://doi.org/10.3390/min7100200
Submission received: 30 August 2017
/
Revised: 12 October 2017
/
Accepted: 17 October 2017
/
Published: 20 October 2017
Abstract
:The objective of this study was to investigate the adsorption of two rare earth elements (REEs), namely scandium (Sc) and neodymium (Nd), on biochar produced after low temperature pyrolysis (350 °C) of wood sawdust. The biochar was characterized with the use of several analytical techniques, namely X-ray diffraction (XRD), scanning electron microscopy (SEM), Fourier transform infrared spectroscopy (FTIR) and thermogravimetric (TG) analysis, while the pH at point of zero charge (pHPZC) was also determined. The experimental conditions were: absorbent concentration 1–10 g·L−1, REE concentration in solution 20 mg·L−1, contact time for equilibrium 24 h, temperature 25 °C and stirring speed 350 rpm. The efficiency of biochar was compared to that of a commercial activated carbon. Geochemical modelling was carried out to determine speciation of Nd and Sc species in aqueous solutions using PHREEQC-3 equipped with the llnl database. The experimental results indicated the potential of low temperature produced biochar, even though inferior to that of activated carbon, to adsorb efficiently both REEs. The equilibrium adsorption data were very well fitted into the Freundlich isotherm model, while kinetic data suggested that the removal of both REEs follows the pseudo-second order kinetic reaction. Finally, the most probable adsorption mechanisms are discussed.
1. Introduction
The rare earth elements (REEs) are a group of 17 chemical elements that are more abundant in the Earth’s crust compared to gold, silver and platinum. However, since they are not present in concentrated forms, their extraction is challenging and their economic value high. Today, REEs are regarded both by the European Union (EU) and the United States (U.S.) as some of the most critical elements [1,2,3,4].
REEs are used in small quantities, but they are essential for the production of several components that are used in numerous devices, including mobile phones, hard drives in computers, fluorescent light bulbs, catalysts, magnets, refrigerators and other everyday products; they are also used in airplanes, hybrid cars, electric vehicles and wind turbines [5]. The need for the production of more sophisticated devices in several high-tech sectors, clean energy and more efficient transport and communication systems indicates that the demand for these elements is likely to increase rapidly in the coming years [6].
By taking into account that exploration of new deposits progresses slowly, despite the strong interest shown in the last few years, the today’s supply of REEs to satisfy the increasing demand still depends heavily on China. It has to be underlined though that until the late 1990s, most REEs were produced in the United States, but soon after that period, production declined quickly due to rising production costs [7,8].
Biochar is a solid, porous and rich in carbon material, which is produced after thermal treatment of biomass, involving slow or fast pyrolysis, conventional or flash carbonization and gasification, under a low or oxygen-free atmosphere [9]. The sources of biochar include agricultural and animal wastes (e.g., waste wood, rice husk, wheat straw, nutshells, manure, poultry litter), energy crop residues (e.g., oilseed rape, corn, cereals, wood pellets), sewage sludge and others [10,11,12,13].
Biochar has beneficial physical and chemical properties that mainly depend on the composition of the raw material, the type of thermal treatment and the temperature used. It can be used as soil amendment to improve among others aggregate stability, cation exchange capacity, water retention and aeration. Furthermore, it is considered as a renewable energy source, and due to the high stability of carbon, it contributes to carbon sequestration in soils and the mitigation of global warming. It can also be used as slow release fertilizer and adsorbent to inhibit mobilization of organic and inorganic contaminants in soils and prevent groundwater contamination [14,15,16,17,18,19]. Therefore, through its numerous uses, biochar can contribute to agricultural waste valorization, preservation of resources, improvement of the economy especially in degraded areas and overall to the development of sustainable agriculture [20,21,22]. Beyond that, it can also be considered as an alternative energy source to replace fossil fuels and reduce the carbon footprint of ferronickel and steel production [23,24].
The use of biochar for the adsorption of inorganic and organic contaminants present in waters and wastewaters has been so far sufficiently investigated, as indicated by the increasing number of publications produced over the last few years. In these studies, emphasis is given indicatively to the type of feedstock and the effect of pyrolysis temperature on biochar properties [25,26,27], solution pH and the presence of other ions [28], surface area before and after modification [29,30,31] and the way these factors affect adsorption kinetics and cost efficiency [32,33,34].
The number of available publications in international literature investigating the adsorption of REEs from waters and wastewaters is rather modest. The most recent and indicative ones involve the use of adsorbents such as modified silica gel [35], carbon black derived from recycled tires [36], carbonized polydopamine nano carbon shells [37], EDTA-β-cyclodextrin [38], chitosan benzoyl thiourea derivatives [39], glutamic acid crosslinked with polyvinyl alcohol [40], cell surface display of lanthanide binding tags [41], polyamidoamine dendrimer functionalized soy hull [42] and sponge biomass [43]. A very good review of recent literature that assesses the efficiency of various materials to adsorb REEs has been recently published [44].
On the other hand, the number of studies investigating the adsorption of REEs on biochar is extremely limited. Wang et al. [45] assessed the efficiency of ammonium citrate-modified biochar as adsorbent for La(III) ions from aqueous solution, as well as its regeneration, while Hadjittofi et al. [46] investigated the removal of trivalent samarium from aqueous solutions by activated biochar derived from cactus fibers. Thus, the present study has a sufficient innovation potential since it investigates the adsorption of scandium (Sc) and neodymium (Nd) on biochar derived after low-temperature pyrolysis sawdust, compares its efficiency with a commercial activated carbon, uses several analytical techniques for its characterization, determines the speciation of Sc and Nd species in solution through geochemical modelling, provides kinetics and equilibrium data and discusses potential adsorption mechanisms.
2. Materials and Methods
2.1. Adsorbents
Pine wood sawdust (Sd), used as feedstock in the present study, was obtained from a carpentry workshop located in the area of Akrotiri, City of Chania, region of Crete, Greece, and subjected to slow pyrolysis at 350 and 550 °C for the production of biochar (Sd350 and Sd550, respectively). Pyrolysis was carried out using small quantities of feedstock, e.g., 50 g in porcelain capsules placed in a modified laboratory furnace, Ν-8L SELECTA. The retention time was 60 min, and the heating rate was maintained at 10 °C·min−1. N2 gas was fed to the furnace for 60 min at a rate of 100 mL·min−1 to remove air. The overall biochar production route followed was based on previous studies carried out in our laboratory. Activated carbon (AC) with a particle size of 1.5–4.0 mm was purchased from Donau Chemie, Vienna, Austria, and used as a reference material.
Prior to use, both adsorbents were pulverized (FRITSCH pulverizer) to a grain size <100 μm; the particle size distribution was determined with the use of a Mastersizer S particle size analyzer (Malvern Instruments, Worcestershire, UK).
After thermal treatment, pyrolysis yield (yP), pH (Hanna 211 pH/Eh meter, Bedfordshire, UK), electrical conductivity (EC) (Hanna EC215 conductivity meter, Bedfordshire, UK), surface area (NOVA Surface Area Analyzer, Quantachrome instruments, Boynton Beach, FL, USA), porosity (Micromeritics AutoPore 9400 porosimeter, Communications Dr. Norcross, GA, USA) and volatile matter (VM) content were determined for the produced biochars; pH and EC were measured in solution using a solid:liquid ratio of 1:10. The char fraction, consisting of partially or fully ashed inorganic material and/or any unconverted organic and carbonaceous materials, was calculated as the difference between 100% and %VM. The fixed carbon (FC) content consisting of the elemental carbon of the feedstock and the carbonaceous residue remaining after heating, was calculated as the % difference between char and ash content.
The elemental C, H, S and N content was determined using a Flash 2000 Elemental Analyzer (Thermo Scientific, Waltham, MA, USA) calibrated using 2,5-bis(5-tert-butyl-2-benzo-oxazol-2-yl)thiophene (BBOT) carbon containing standards; the oxygen content was subsequently calculated as % difference. The produced biochar was also subjected to thermogravimetric (TG) analysis using a differential thermogravimetric analyzer TGA-6/DTG of Perkin Elmer (Akron, OH, USA).
X-ray diffraction (XRD) analysis was performed using a Bruker AXS (D8 Advance type) diffractometer (Bruker, Karlsruhe, Germany). Scanning electron microscopy (SEM) analysis was performed with a JEOL 6380LV scanning electron microscope equipped with an EDS INCA microanalysis system (JEOL Ltd., Freising, Germany), while Fourier transform infrared spectroscopy (FTIR) analysis was carried out using a Perkin-Elmer Spectrum 1000 spectrometer (Akron, OH, USA). Further details on the analytical techniques used are provided in other recent publications of our group [26,30].
For the determination of the pH at the point of zero charge (pHPZC) of sawdust and activated carbon, different experimental methods may be used [47]. The approach followed in this study is quite similar to the one reported in [48]. More specifically, 5 mg of pulverized (<100 μm) feedstocks were added in a 20 mL 0.005 M CaCl2 solution, which was first boiled to remove dissolved CO2 and then cooled at room temperature. The initial suspension pH was adjusted to values ranging between pH 1 and pH 7 using 0.5 M HCl and 0.5 M NaOH solutions. After pH adjustment, the solution was agitated on an orbital shaker for 24 h at room temperature (~25 °C) to reach equilibrium. The final suspension pH was again measured, and then initial and final pH values were plotted to determine the pHPZC. All tests were carried out in triplicate, and average values are given.
2.2. Geochemical Modelling
Geochemical modelling was carried out to determine speciation of Nd and Sc species in aqueous solutions using PHREEQC-3 [49] equipped with the llnl database. The database was extended by additional solubility data obtained from other sources in order to increase reliability where appropriate [50,51,52,53]. Aqueous geochemical modelling enabled the calculation of the dominant Nd and Sc species and the determination of the solubility-controlling phases through the use of the Saturation Index (SI) at the specific conditions (pH, concentration and composition) prevailing in the adsorption experiments conducted in this study. Phase saturation indices were calculated as SI = log (IAP/Ksp), where IAP is the ion activity product for the relevant reaction at various pH values and Ksp is the solubility product constant [54]. Saturation indices greater than zero indicate supersaturation, below zero indicate under-saturation, while values close to zero indicate equilibrium with a mineral phase.
2.3. Kinetic and Equilibrium Experiments
Kinetic and equilibrium experiments were carried out in 500-mL conical flasks, with an operating volume of 250 mL. Two solutions with concentration of Nd and Sc 20 mg·L−1 were prepared by dissolving the required quantities of Nd2(SO4)3·8H2O, 99.9% (Alfa Aesar) and Sc2(SO4)3·xH2O (in our case, x equals zero), 99.9% (Alfa Aesar), respectively, in distilled water. The pH of the initial solutions was 5.44 and 4.13, respectively and was adjusted to 3 using 0.5 Μ H2SO4, 95%–97% (Merck). Experiments were carried out at this pH based on geochemical modelling data and the pHPZC of the adsorbents (data are shown later in the text).
For the kinetic experiments, the concentration of both adsorbents used (Sd350 and AC) was 10 g·L−1, while the concentration of Nd and Sc in each solution was 20 mg·L−1. Agitation took place with a Vibromatic (Spain) rocking mixer at 350 rpm and room temperature. At various time intervals (15 min, 2 h, 6 h, 24 h and 48 h), 10 mL of liquid samples were withdrawn and filtered through Whatman filters (0.45 μm) for the determination of Nd and Sc concentrations through a inductively-coupled plasma mass spectrometry (ICP-MS) analyzer, Agilent Technologies 7500cx (Santa Clara, CA, USA). After each sampling, an equal volume of distilled water was added in the flasks to keep the volume constant. The adsorbed Nd and Sc mass was calculated as the difference between the initial and the final concentration. All tests were carried out in triplicate.
The kinetics of Sc and Nd adsorption on Sd350 and AC was studied using the pseudo-first and pseudo-second order Lagergren kinetic models [55,56].
The pseudo-first order Lagergren kinetic model is described by Equation (1):
The pseudo-second order kinetic model of Lagergren is described by Equation (2):
where qt and qe (mg·g−1) are the adsorbed REE per unit weight of adsorbent at time t, while k1 and k2 (h−1) are the rate constants for the pseudo-first and pseudo-second order kinetics, respectively.
Plotting log(qe − qt) and t values from Equation (1) determines k1 and qe values for the pseudo-first order model, while plotting of t/qt and t values from Equation (2) determines k2 and qe for the pseudo-second order model.
Equilibrium experiments were carried out using varying concentrations of the adsorbents (Sd350 and AC), namely 1, 2, 5 and 10 g·L−1, while the concentration of Nd or Sc was kept constant at 20 mg·L−1. Contact time to reach equilibrium, as indicated by kinetic experiments, was 24 h. Furthermore, in this series, all tests were carried out in triplicate.
The Freundlich and Langmuir models were used to describe adsorption. The Freundlich model assumes a heterogeneous energetic distribution of active sites on the adsorbent and multilayer sorption accompanied by interactions between adsorbed ions (Equation (3)):
where Kf (L·g−1) is a constant related to the adsorption capacity of the adsorbent and 1/n is a constant related to the adsorption intensity.
The Langmuir model assumes that the number of adsorption sites on the adsorbent is constant and that uptake occurs by monolayer sorption on a homogenous surface (Equation (4)):
where qmax is the maximum adsorption capacity of the adsorbent (mg·g−1) and b (L·mg−1) is the Langmuir constant, which is related to the energy of the adsorption; qe and Ce have been explained before. Finally, the Gibbs free energy change (kJ·mol−1) that indicates the spontaneity of adsorption of REEs was calculated using the following two equations:
where R is the universal gas constant (J mol−1 K−1), T is the absolute temperature (K), Kc is the distribution coefficient for adsorption and and Ce the equilibrium concentration of each REE on the adsorbent and in solution, respectively.
3. Results and Discussion
3.1. Characterization of Biochar
3.1.1. Properties
Table 1 shows the properties of the raw materials used (Sd and AC) and the produced biochar after pyrolysis at 350 °C (Sd350). First of all, it is seen that pyrolysis results in a relatively low yield (yP), 30.2%, due to the condensation of aliphatic compounds and the loss of CH4, H2 and CO. Other studies show that the further increase of temperature results in even lower yields [25,26]. Pyrolysis results also in the decrease of pH, EC and VM content for the produced biochar. On the other hand, it results in a substantial increase of the char content. The surface area of the produced biochar increases after pyrolysis to 4.71 m2·g−1 at 350 °C, but it is still much smaller than the surface area of AC. Finally, pyrolysis results in increased total carbon content and decreased hydrogen, nitrogen and oxygen content. The properties of the produced biochar are in general similar to those mentioned in other studies; differences, such as a higher pH, are noticed when different feedstocks and pyrolysis temperatures are used [57,58]. Based on the objectives of each study, it is deduced that a balance among the desired properties of biochar, yield and cost, which mainly depend on the pyrolysis temperature, needs to be reached.
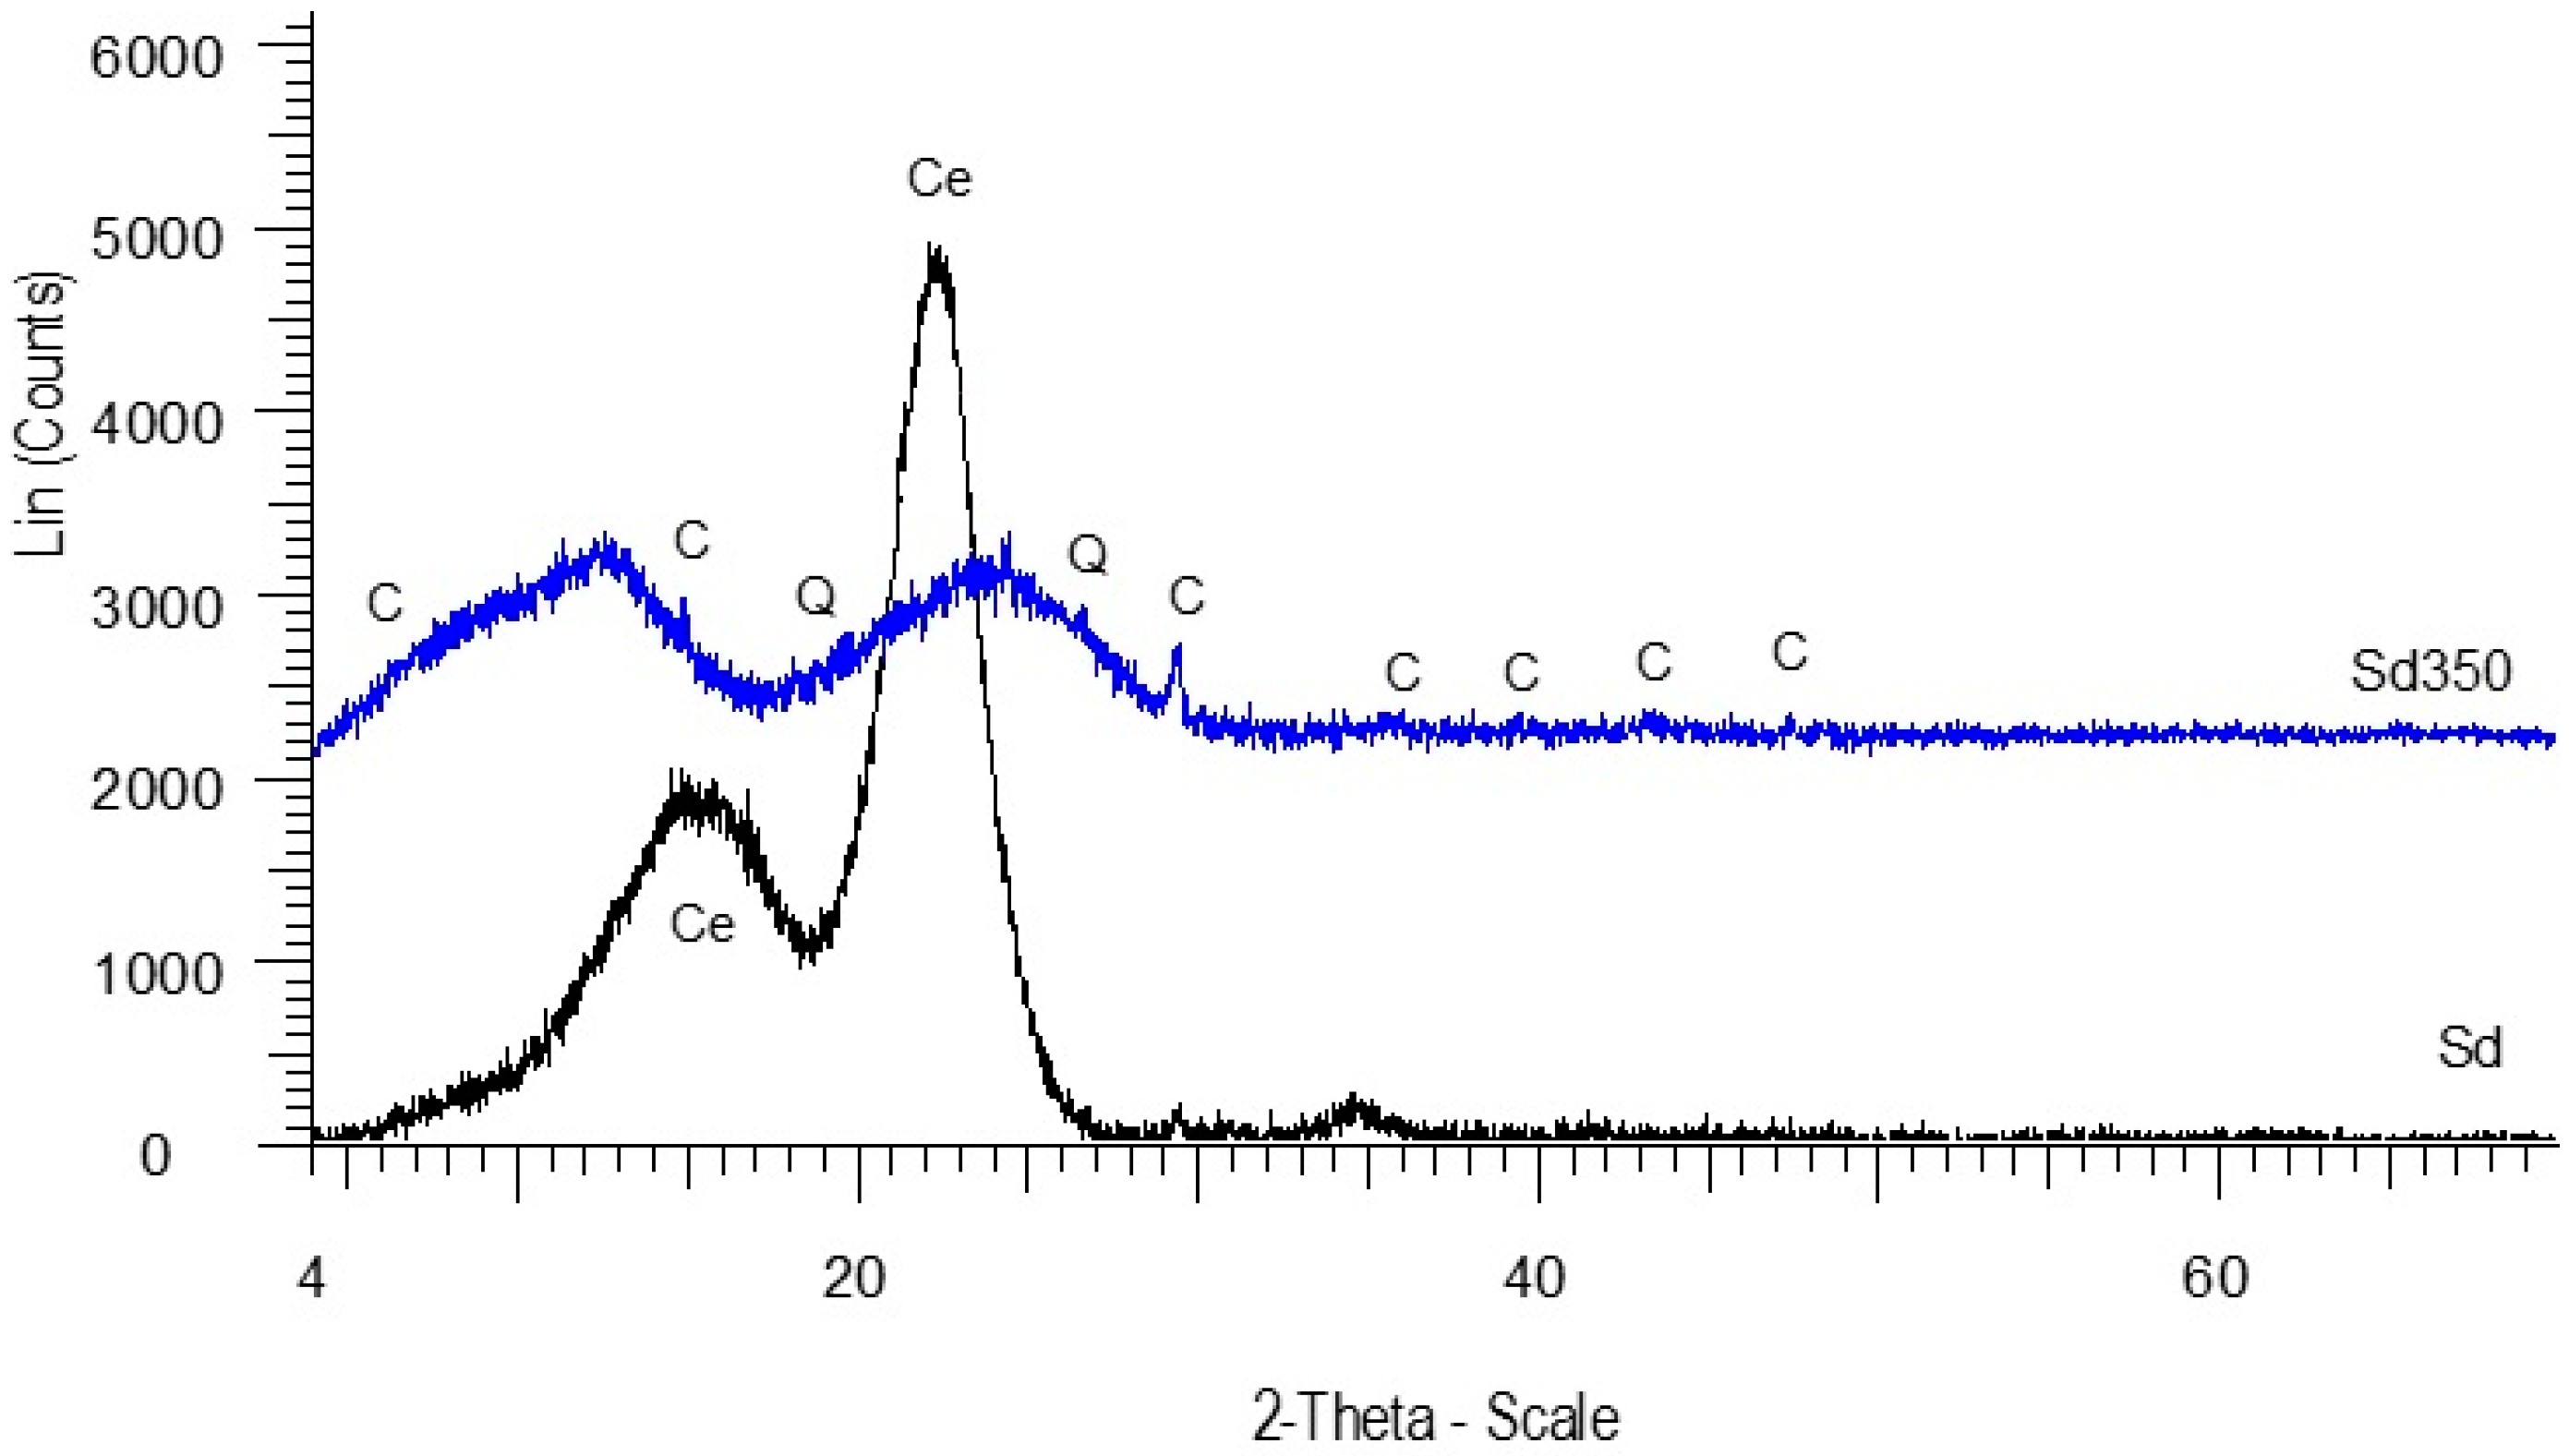
3.1.2. Mineralogical Analysis
Figure 1 shows the XRD patterns of the feedstock (Sd) and biochar Sd350. The feedstock is characterized by the characteristic peaks of cellulose, (C6H10O5)n, which is the main structural component of the primary cell wall in wood products. The elevated background shown between 16 and 26° 2θ indicates the presence of organic matter.
After pyrolysis (350 °C), the content of cellulose drops, due to the decomposition of organic matter, and some residual inorganic phases such as calcite (CaCO3) and quartz (SiO2) appear [26].
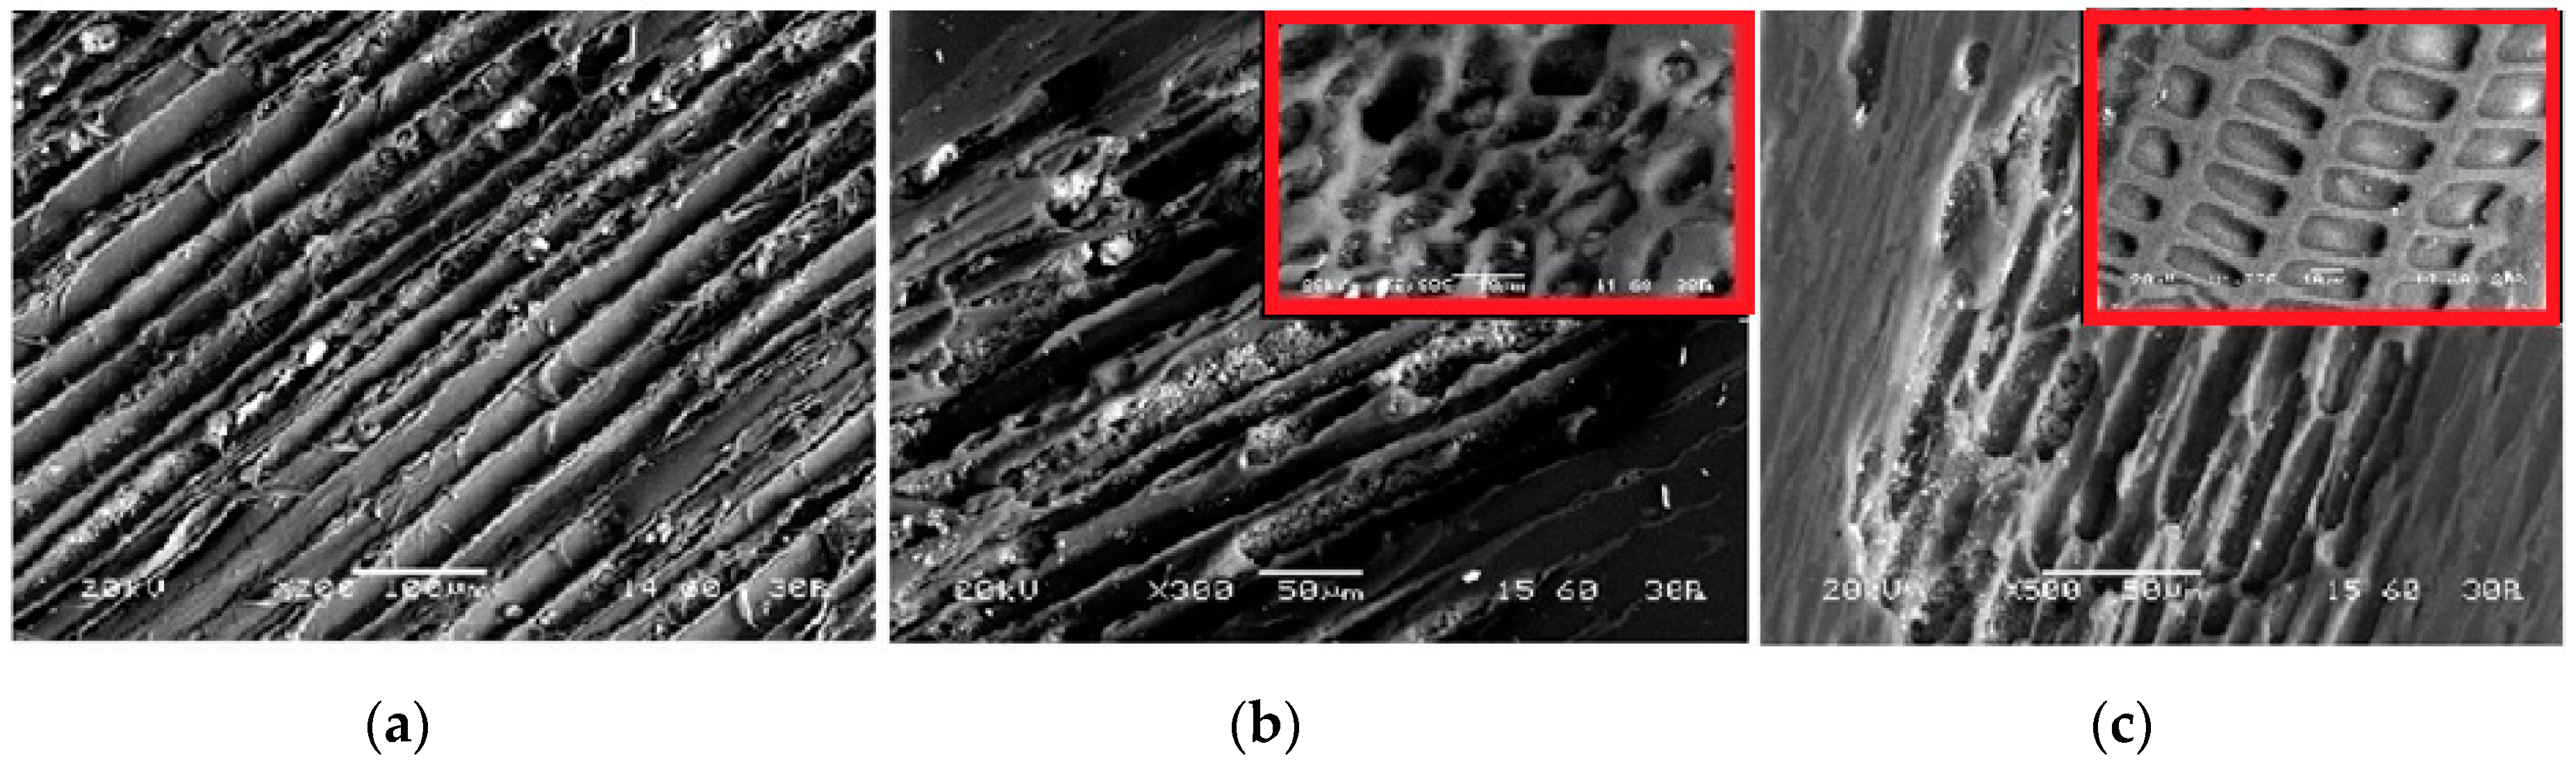
3.1.3. Morphology
SEM backscattered electron images (BSI) of Sd and biochar Sd350 are shown in Figure 2. It is seen that the feedstock (Sd) has pores on its surface that are well arranged in rows (Figure 2a). However, it is observed that the fiber structure of Sd is modified after pyrolysis due to the release of high molecular weight volatiles, which affects the number and diameter of pores; smaller pores with a size of 9–16 μm and larger pores with a size of 21–48 μm are observed. It is also shown that several well-oriented cellular pores with sharp and curvy edges are formed (Figure 2b,c). The porosity increases (Table 1) due to the transformation of aliphatic C structures to aromatic C structures [26,30,59].
3.1.4. Thermogravimetric Analysis
Figure 3 shows the TG (weight loss) and DTG (weight loss rate) vs. temperature evolution for Sd and biochar Sd350. It is seen that the total weight loss differs substantially between the two materials and accounts for 89% and 49% for Sd and Sd350, respectively (Figure 3a). The weight loss observed for Sd is sharp between 275°C and 350 °C, whereas the biochar produced at 350 °C exhibits gradual weight loss.
DTG curves (Figure 3b) indicate that the major weight loss of Sd is initiated at around 300 °C and is completed at 380 °C; the distinct peak shown in the region 275–350 °C is due to the decomposition of cellulose. Lignin decomposes gradually in the region 275–500 °C, and this is indicated by the flat section of the curves [26].
3.1.5. FTIR Analysis
Figure 4 shows the FTIR spectra of Sd and biochar Sd350. It is seen that the spectrum of the feedstock is typical of an oxygenated hydrocarbon containing cellulose; after pyrolysis, major bands disappear, indicating loss of chemical diversity.
The broad band seen for Sd at around 3400 cm−1 indicates the presence of free and intermolecular bonded hydroxyl group (−OH) stretching. In biochar produced after pyrolysis at 350 °C, this band disappears, indicating the absence of hydroxyl groups and the increase of hydrophobicity. The band at 2900 cm−1, present only in Sd, is the result of aliphatic C−H deforming vibrations. The small peak at 2398 cm−1 is due to minor carbonation with atmospheric carbon dioxide.
The band at 1746 cm−1, present in both materials, is assigned to ν(C=O) vibration in the carbonyl group or the presence of carboxylic bonds. The band at around 1580 cm−1 is due to the presence of aromatic C=O ring stretching (likely –COOH) or C=C stretching of lignin aromatic groups, indicating the presence of residual lignin after decomposition. This band reflects the degree of charring of cellulose in biochars.
The characteristic peaks, which appear between 1400 cm−1 and 1500 cm−1 only in the feedstock and disappear in biochar, are attributed to C6 ring modes. The band shown at 1020 cm−1 only for Sd is characteristic of a C−C−O or C−O−C asymmetric stretching. This band disappears in biochar Sd350, indicating the decomposition of organic matter [26,60].
3.1.6. pHPZC
It is known that solution pH influences the surface charge of adsorbents, the dissociation of functional groups on the adsorbent active sites and the degree of ionization of ions present in solution. Our experimental studies indicated that the pHPZC for Sd350 is 2.8, while the respective value for AC is higher and reaches a value of six. The pHPZC values determined in this study for both adsorbents are within the ranges indicated in other studies. It is mentioned though that in the literature, pHpZC values for biochars vary greatly, while those of commercial activated carbons fall within a much narrower range [48,61,62,63]. This is due to the fact that biochar is amphoteric in nature as a result of the presence of functional groups on its surface. Thus, pHPZC values, which indicate its electrokinetic behavior, usually vary and depend on the properties of the raw material, the type of the thermal treatment carried out and the pyrolysis temperature [64].
By taking into account that the pHPZC of the Sd350 surface is 2.8, it is understood that a negative charge develops on its surface at pH above pHPZC and a positive charge below that value. Therefore, it is anticipated that the adsorption of Sc and Nd on the surface of biochar will be favored for solution pH values higher than 2.8 where increased electrostatic interactions may take place.
3.2. Speciation Studies: Identification of Potential Solubility-Controlling Phases
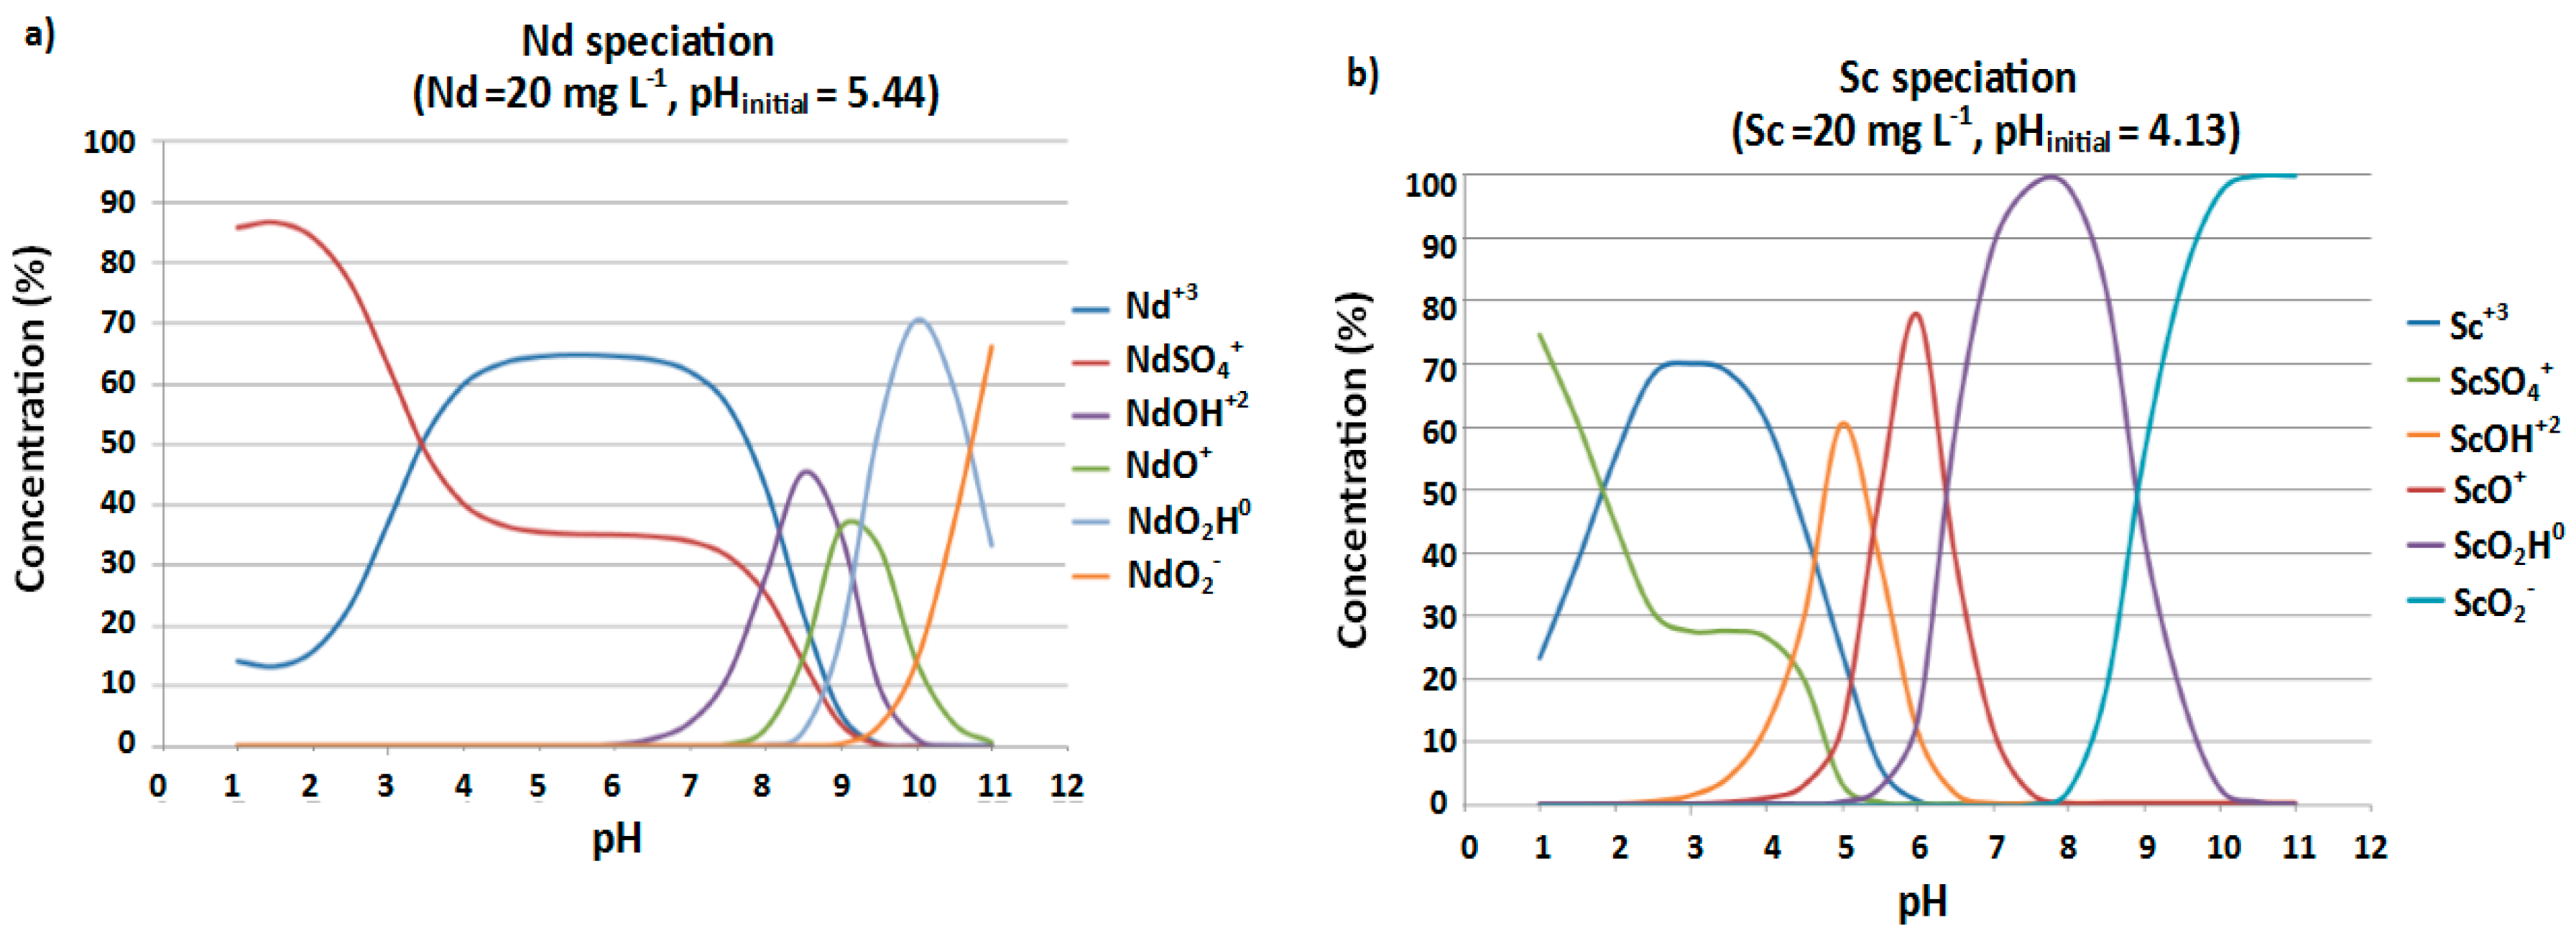
The Nd and Sc speciation diagrams obtained with the use of PHREEQC software are shown as a function of pH in Figure 5a,b, respectively. PHREEQC-3 simulations indicated that under highly acidic conditions, Nd is predominantly present with its positively-charged species of Nd3+ and NdSO4+. In the pH range 3.5–7.8, the free ionic form (Nd3+) represents the most abundant species, accounting for 50%–65% of the total REE concentration, while the percentage of NdSO4+ species remains almost stable (30%–35%) until neutral conditions are reached and then decreases as pH increases to the value of 9.5. Similar speciation modeling results for Nd in aqueous solutions at 25 °C were also reported by [65]. Complexes, i.e., NdOH2+ and NdO+, represent up to 45% and 35% of the total species content, respectively. The uncharged NdO2H0 species is dominantly present (52%–70%) in the pH range 9.5–10.8, whereas the presence of the only negatively-charged Nd species (NdO2−) is predicted by PHREEQC-3 under highly alkaline conditions, reaching up to 66% of the total speciation at pH 11.
Regarding Sc, ScSO4+ is the only inorganic complex present in solution under extremely high acidic conditions, accounting for up to 75% of the total species content. On the other hand, with the exception of solution pH values below 1.9, Sc is predominantly present in its free ionic form (Sc3+) accounting for 50%–70% of the total concentration. The speciation of Sc is quite complex in terms of ion and charge balance diversity under acidic and neutral conditions. It is dominated by the presence of ScOH2+ and ScO+ species over the pH range 4.6–6.6 and by ScO2H0 species at pH > 6.6; for example, at pH 6, the PHREEQC-3 calculated values are approximately 12%, 77% and 11%, respectively. Under alkaline conditions (pH > 8), ScO2H0 and ScO2− are the only prevalent species in solution reaching distributions even 100% of the total speciation at pH values of 8.6 and 10.4, respectively.
Potential solubility-controlling phases were also predicted by PHREEQC-3 for Nd and Sc and are shown in Figure 6a,b, respectively. It is seen that only Nd(OH)3 and Sc(OH)3 exhibited positive SI values (above dashed lines equal to zero), implying that possible precipitation of these phases may occur at pH values over 6.7 and 4.8, respectively. On the other hand, PHREEQC-3 predicted under-saturation with respect to the corresponding REE oxides (Nd2O3 and Sc2O3) over the entire pH range.
The determination of the pHPZC and the results of geochemical modelling provide useful insights regarding the selection of the most appropriate pH for adsorption experiments. In the present study, we investigated adsorption at pH 3 since some reliability problems were encountered during the ICP determination of Sc and Nd concentrations in solution at pH higher than 4. Based on the results of our speciation studies, hydrolysis of Sc and Nd is not expected to occur at low pH. It has to be mentioned though that Bruque et al. [66] reported that the tendency for hydrolysis of lanthanides increases with increasing atomic number and some precipitation as hydroxides may occur at pH lower than 6; based on these results, the recovery of REEs adsorbed on clay minerals through leaching with ammonium sulfate was investigated at pH 3–4 [67].
3.3. Morphology of the Adsorbents
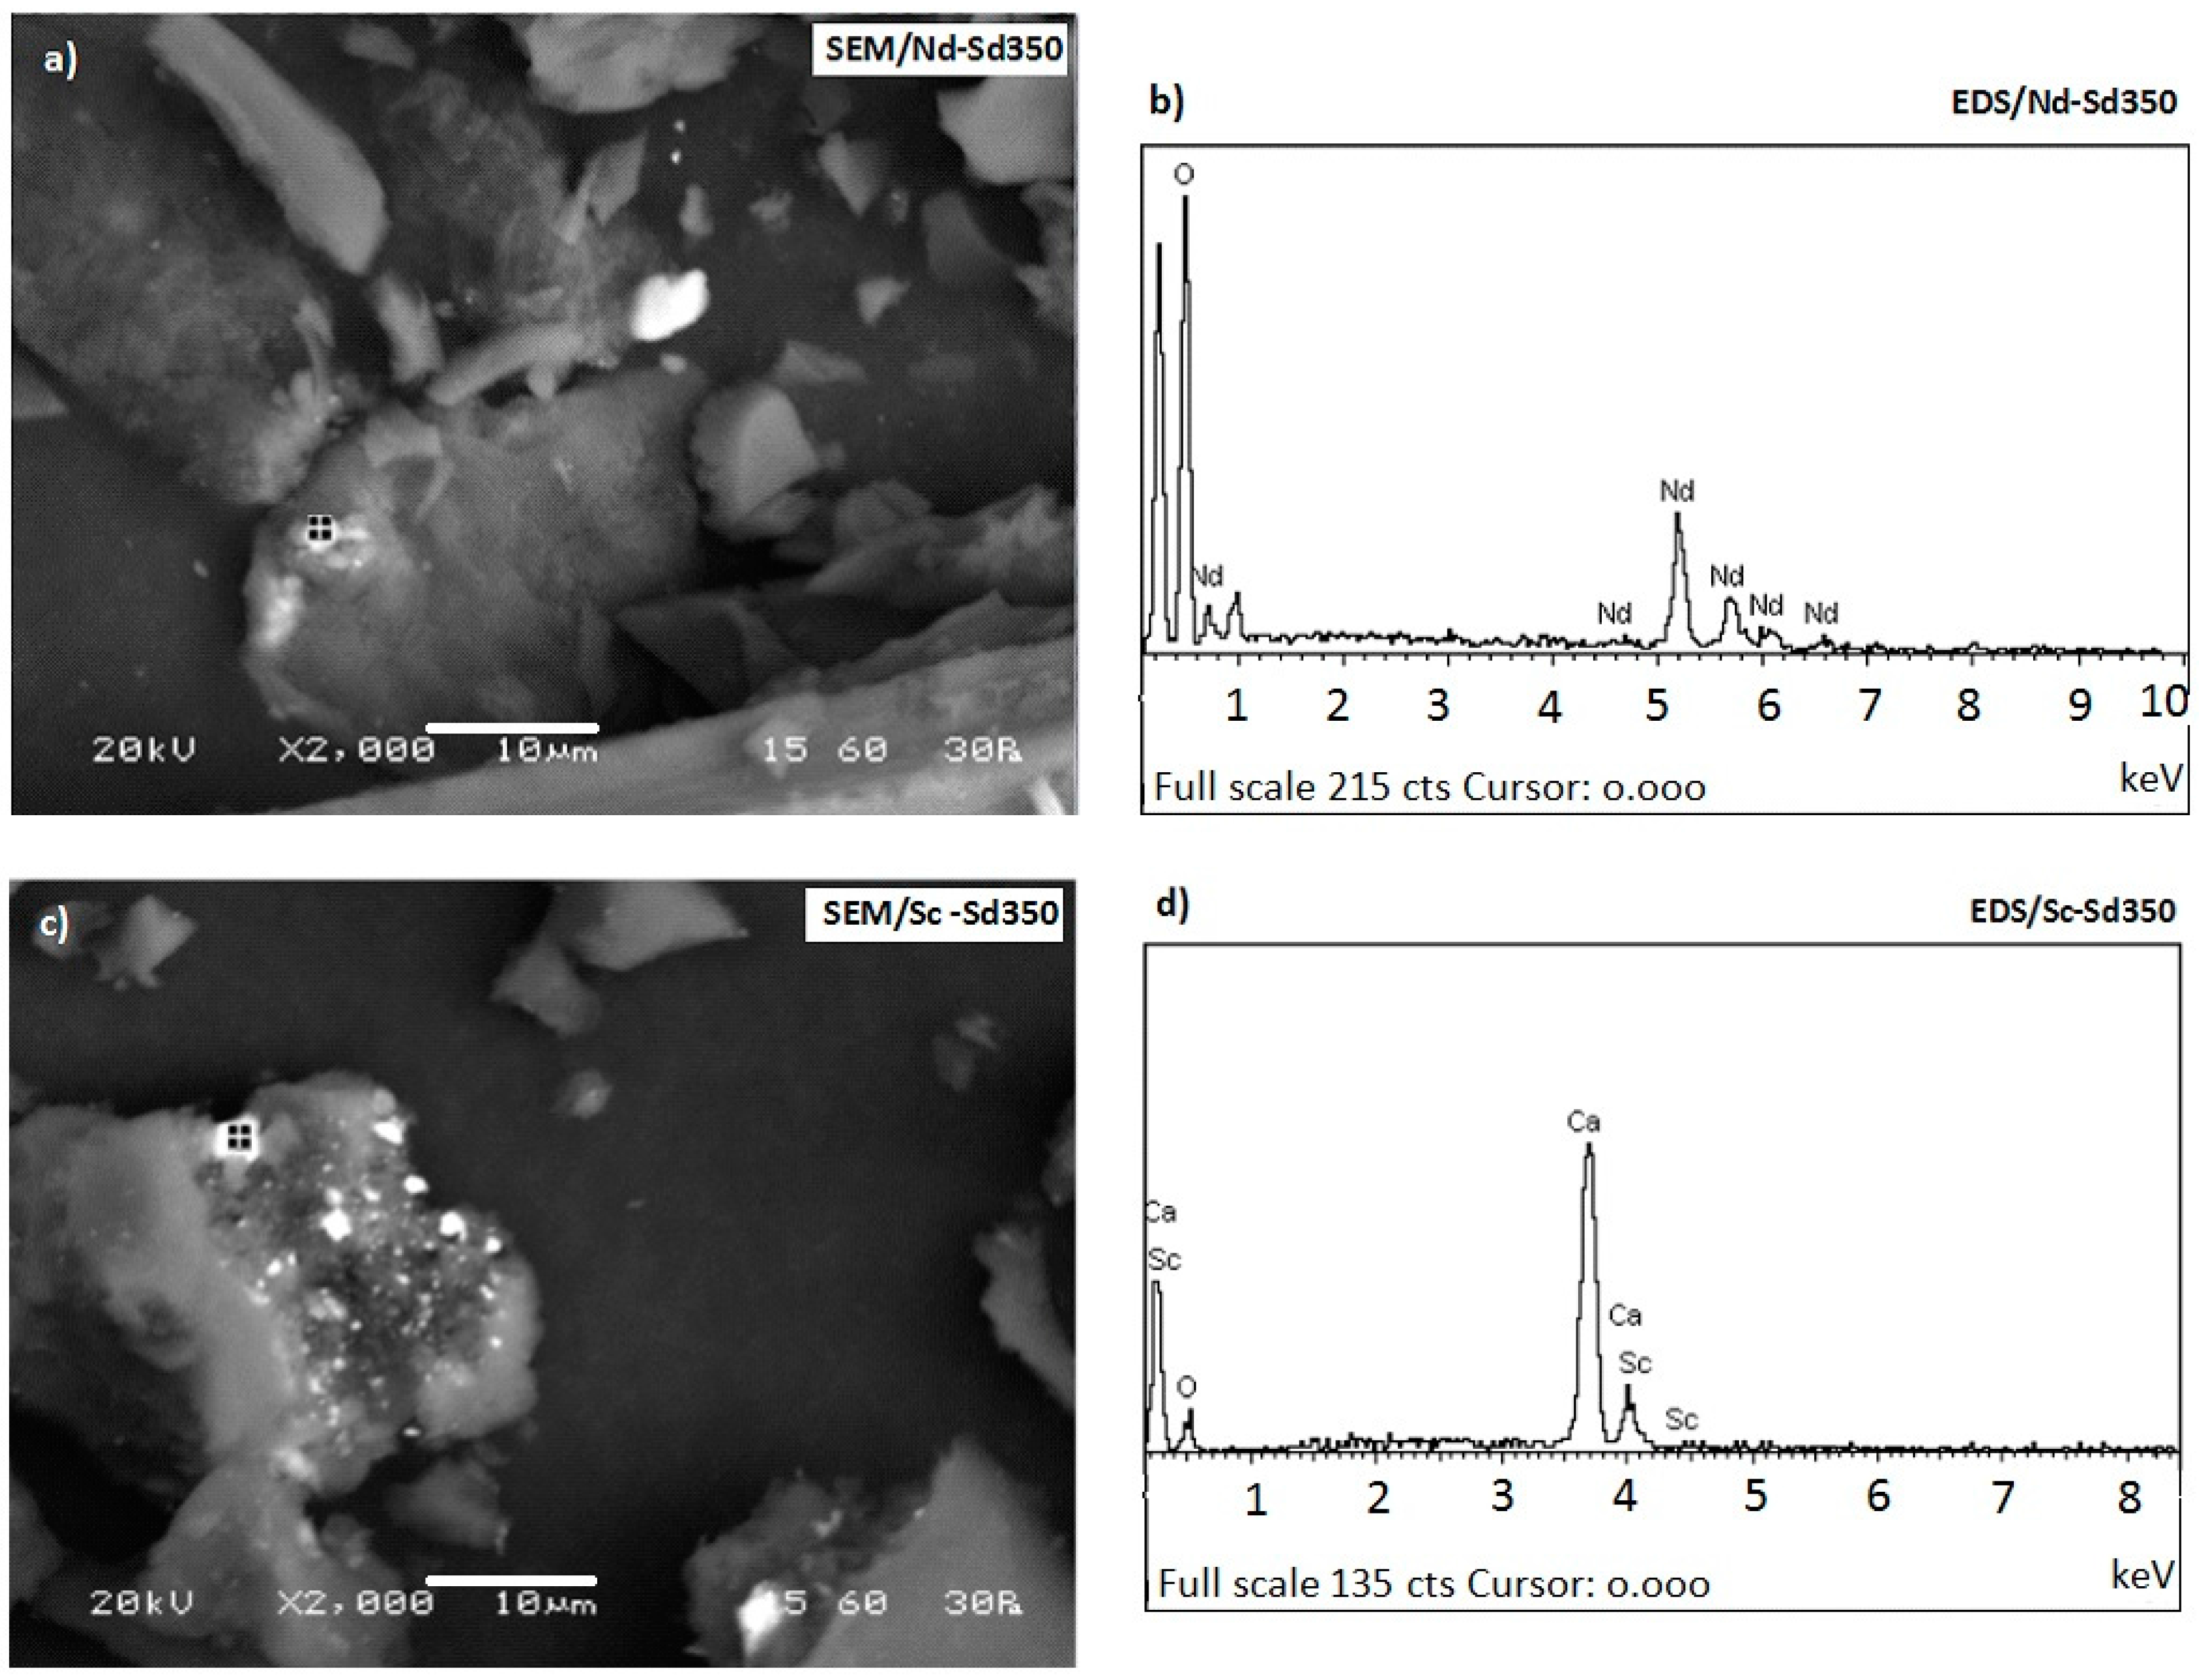
In order to evaluate the surface physical morphology and the porous structure of the adsorbents after adsorption, SEM analysis was carried out, and SEM images along with the corresponding EDS spectra of Sd350 and AC are shown in Figure 7a–d and Figure 8a–d, respectively. SEM images show that the initial surface of biochar Sd350, which was smooth and porous (Figure 2b), after adsorption became uneven with a rough texture; besides, several bright spots, associated with Sc and Nd, were observed in micro-caves and pores (Figure 7a,c). The EDS spectrum analysis identified the presence of Nd and Sc on the Sd350 surface. Apart from Sc, residual Ca appears due to the presence of calcite in Sd350 biochar (Figure 1).
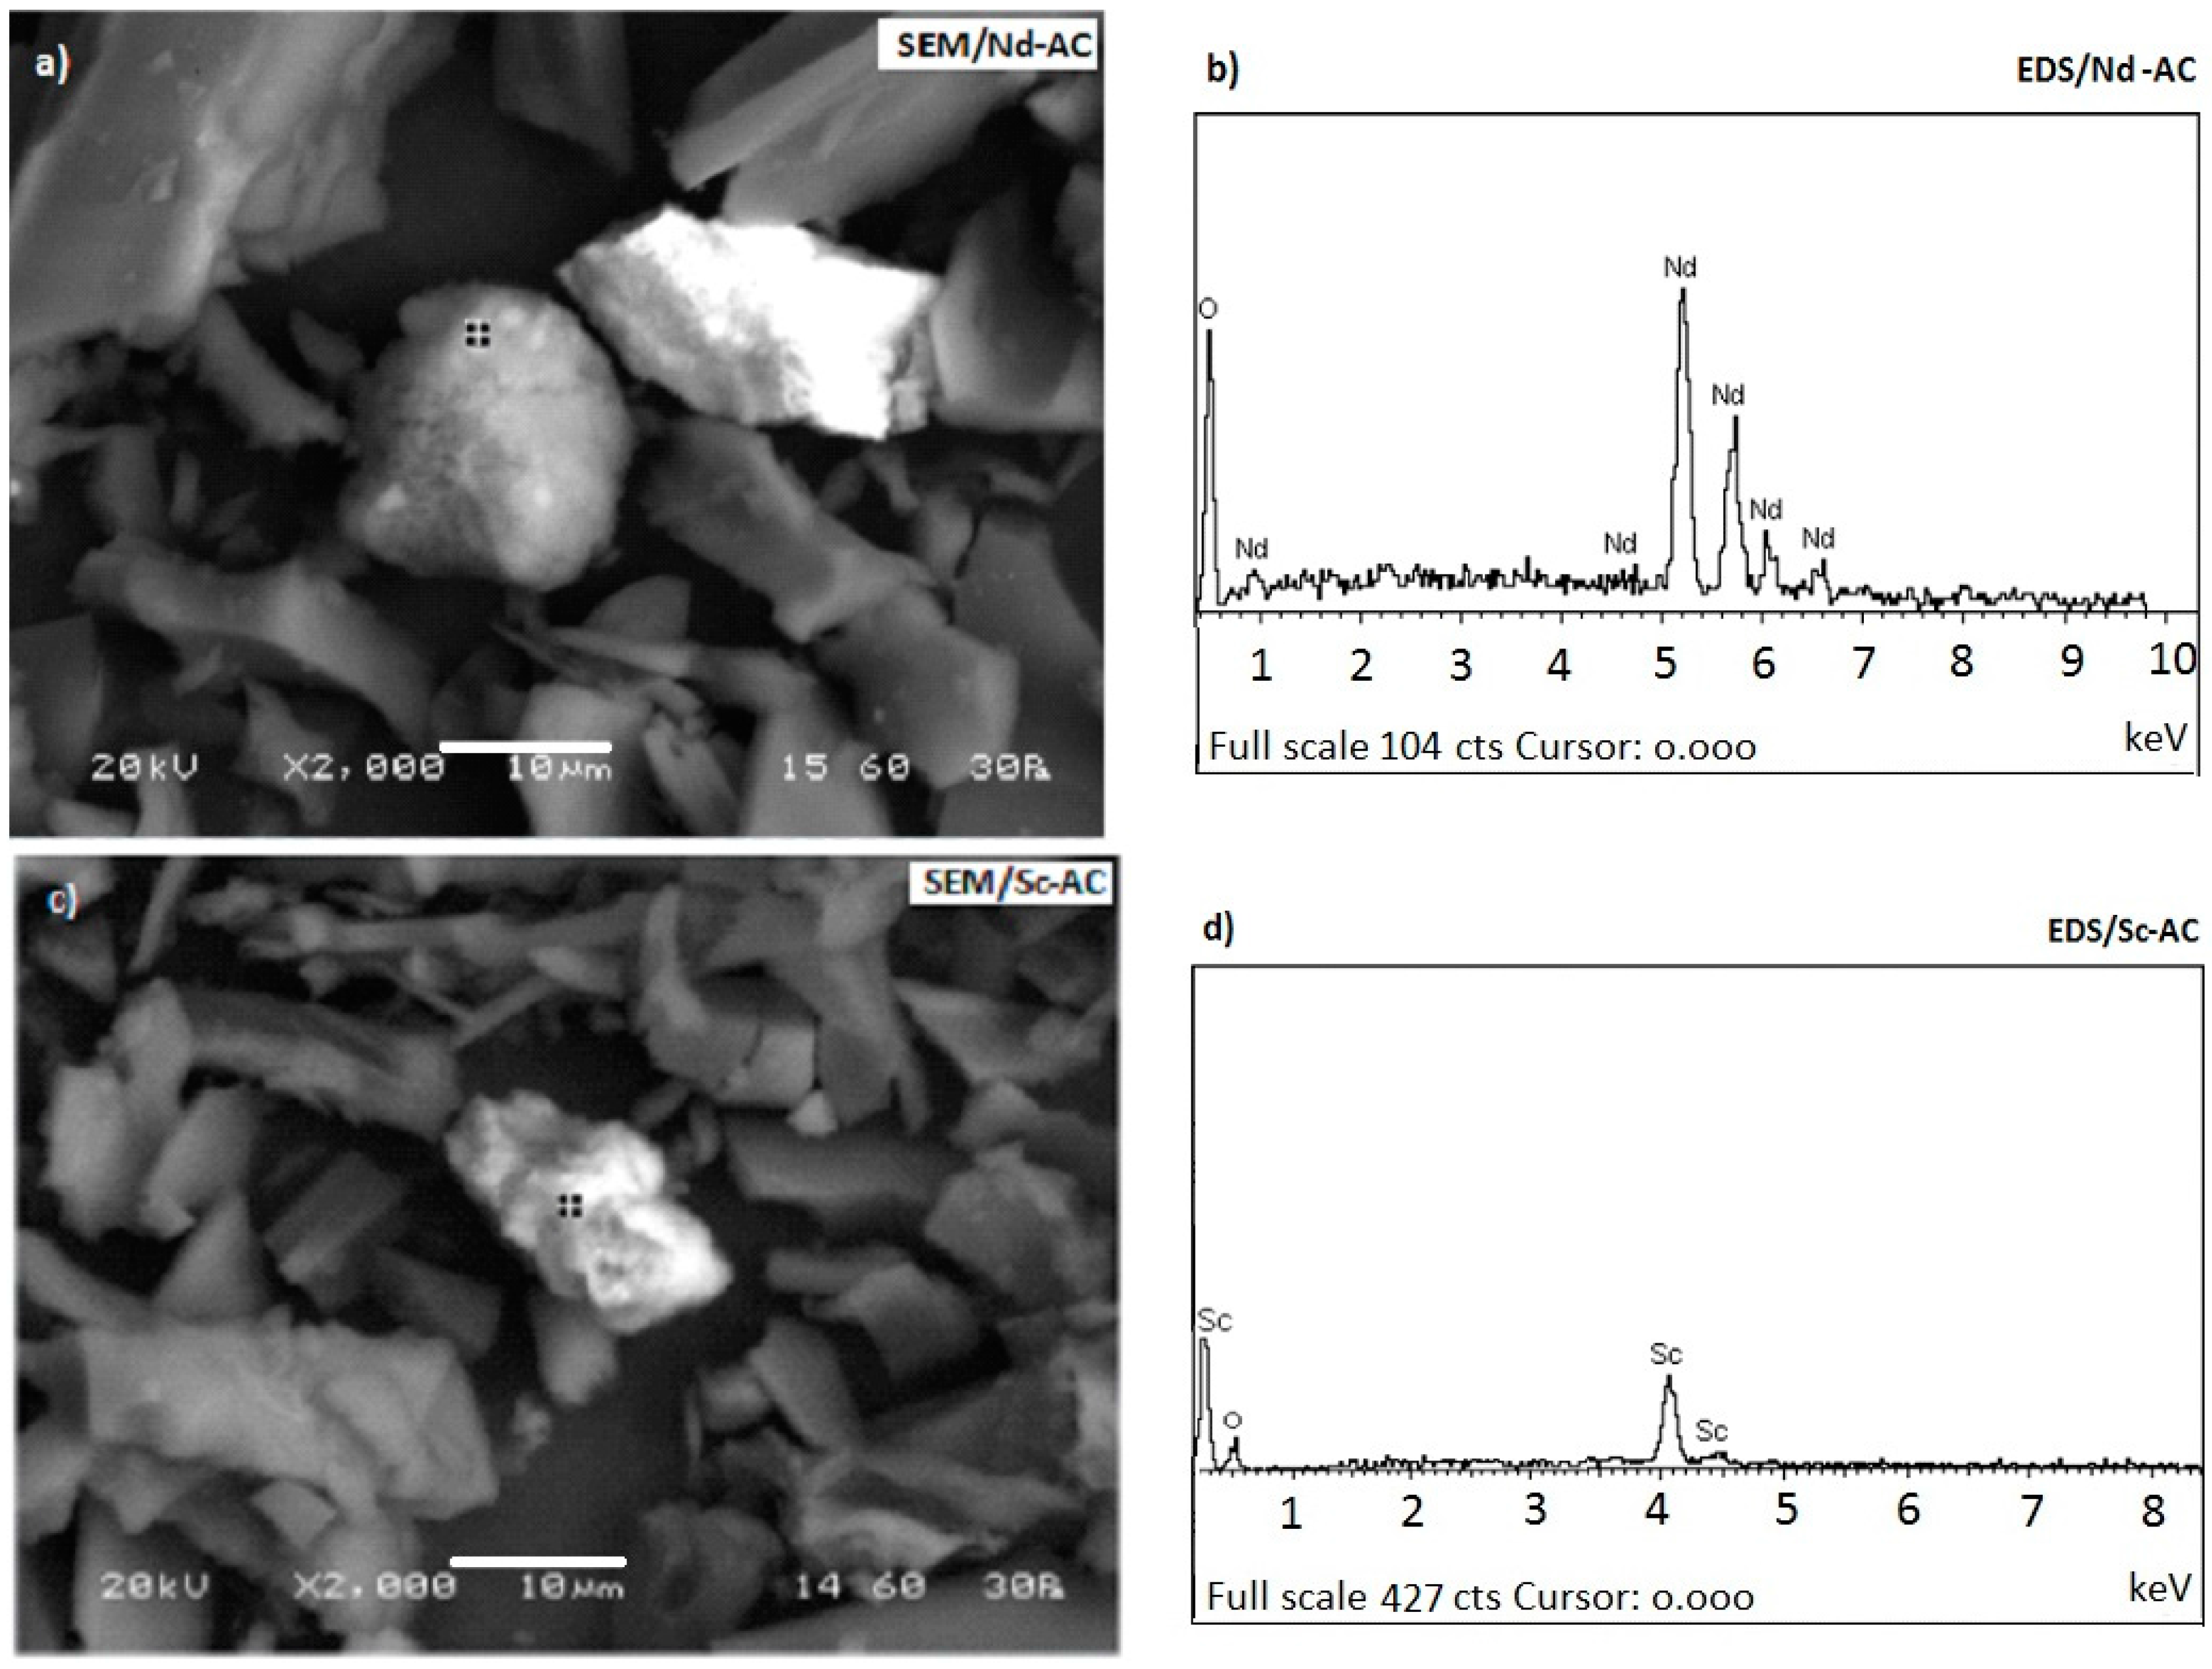
The surface morphology of AC was also altered after adsorption. Figure 8a,c indicates the presence of several bright spots of different shapes and sizes, which are widely distributed in its pores. It is important to note that in all experiments, EDS spectra showed higher Nd loading compared to Sc for both studied absorbents. This result is in agreement with the higher tendency for adsorption exhibited by Nd as seen in the kinetic studies (see the next section).
3.4. Determination of Adsorbents Efficiency
3.4.1. Kinetic Studies
Table 2 shows the parameters for the pseudo-first and pseudo-second order of Lagergren kinetic models. It is seen that for both adsorbents, Sd350 and AC, the pseudo-second order Lagergren model fits the data very well for both Sc and Nd (R2 values are either 0.999 or 1.000), indicating that the reaction rate depends on the number of active sites existing on their surface. By taking into account that adsorption is affected by both surface or pore diffusion, the accurate determination of which type of diffusion is the rate limiting step requires additional studies [45,68,69,70]. The pseudo-first order model fits the data well only in the case of biochar Sd350 during the adsorption of both REEs.
Table 3 provides data on Sc and Nd adsorption, as % and rate (mg·g−1), on biochar Sd350 and AC for different adsorbent concentrations, ranging from 1–10 g·L−1. As mentioned earlier, the initial concentration of each REE in solution was 20 mg·L−1. Solution pH was kept constant at 3, and equilibrium was reached after 24 h.
It is shown that for all adsorbent concentrations considered (1, 2, 5 and 10 g·L−1), AC exhibited the highest adsorption efficiency for both Nd and Sc, which reached almost 88% and 77% at its highest concentration (10 g·L−1) when the number of available adsorption sites was maximum. This was anticipated since AC apart from being an established commercial adsorbent has a much larger specific surface area (912.10 m2·g−1) compared to biochar Sd350 (4.71 m2·g−1); the adsorption percentages calculated though are not proportional to the surface area of each adsorbent. For both adsorbents, Nd exhibited the highest tendency for adsorption compared to Sc, and this may be the result of its larger ionic radius (112.3 pm (porometers) for Nd and 88.5 pm for Sc) [26,71]. Finally, both adsorbents exhibit quite similar adsorption rates for Nd and Sc, which decrease with increasing adsorbent concentration.
3.4.2. Isotherm Models
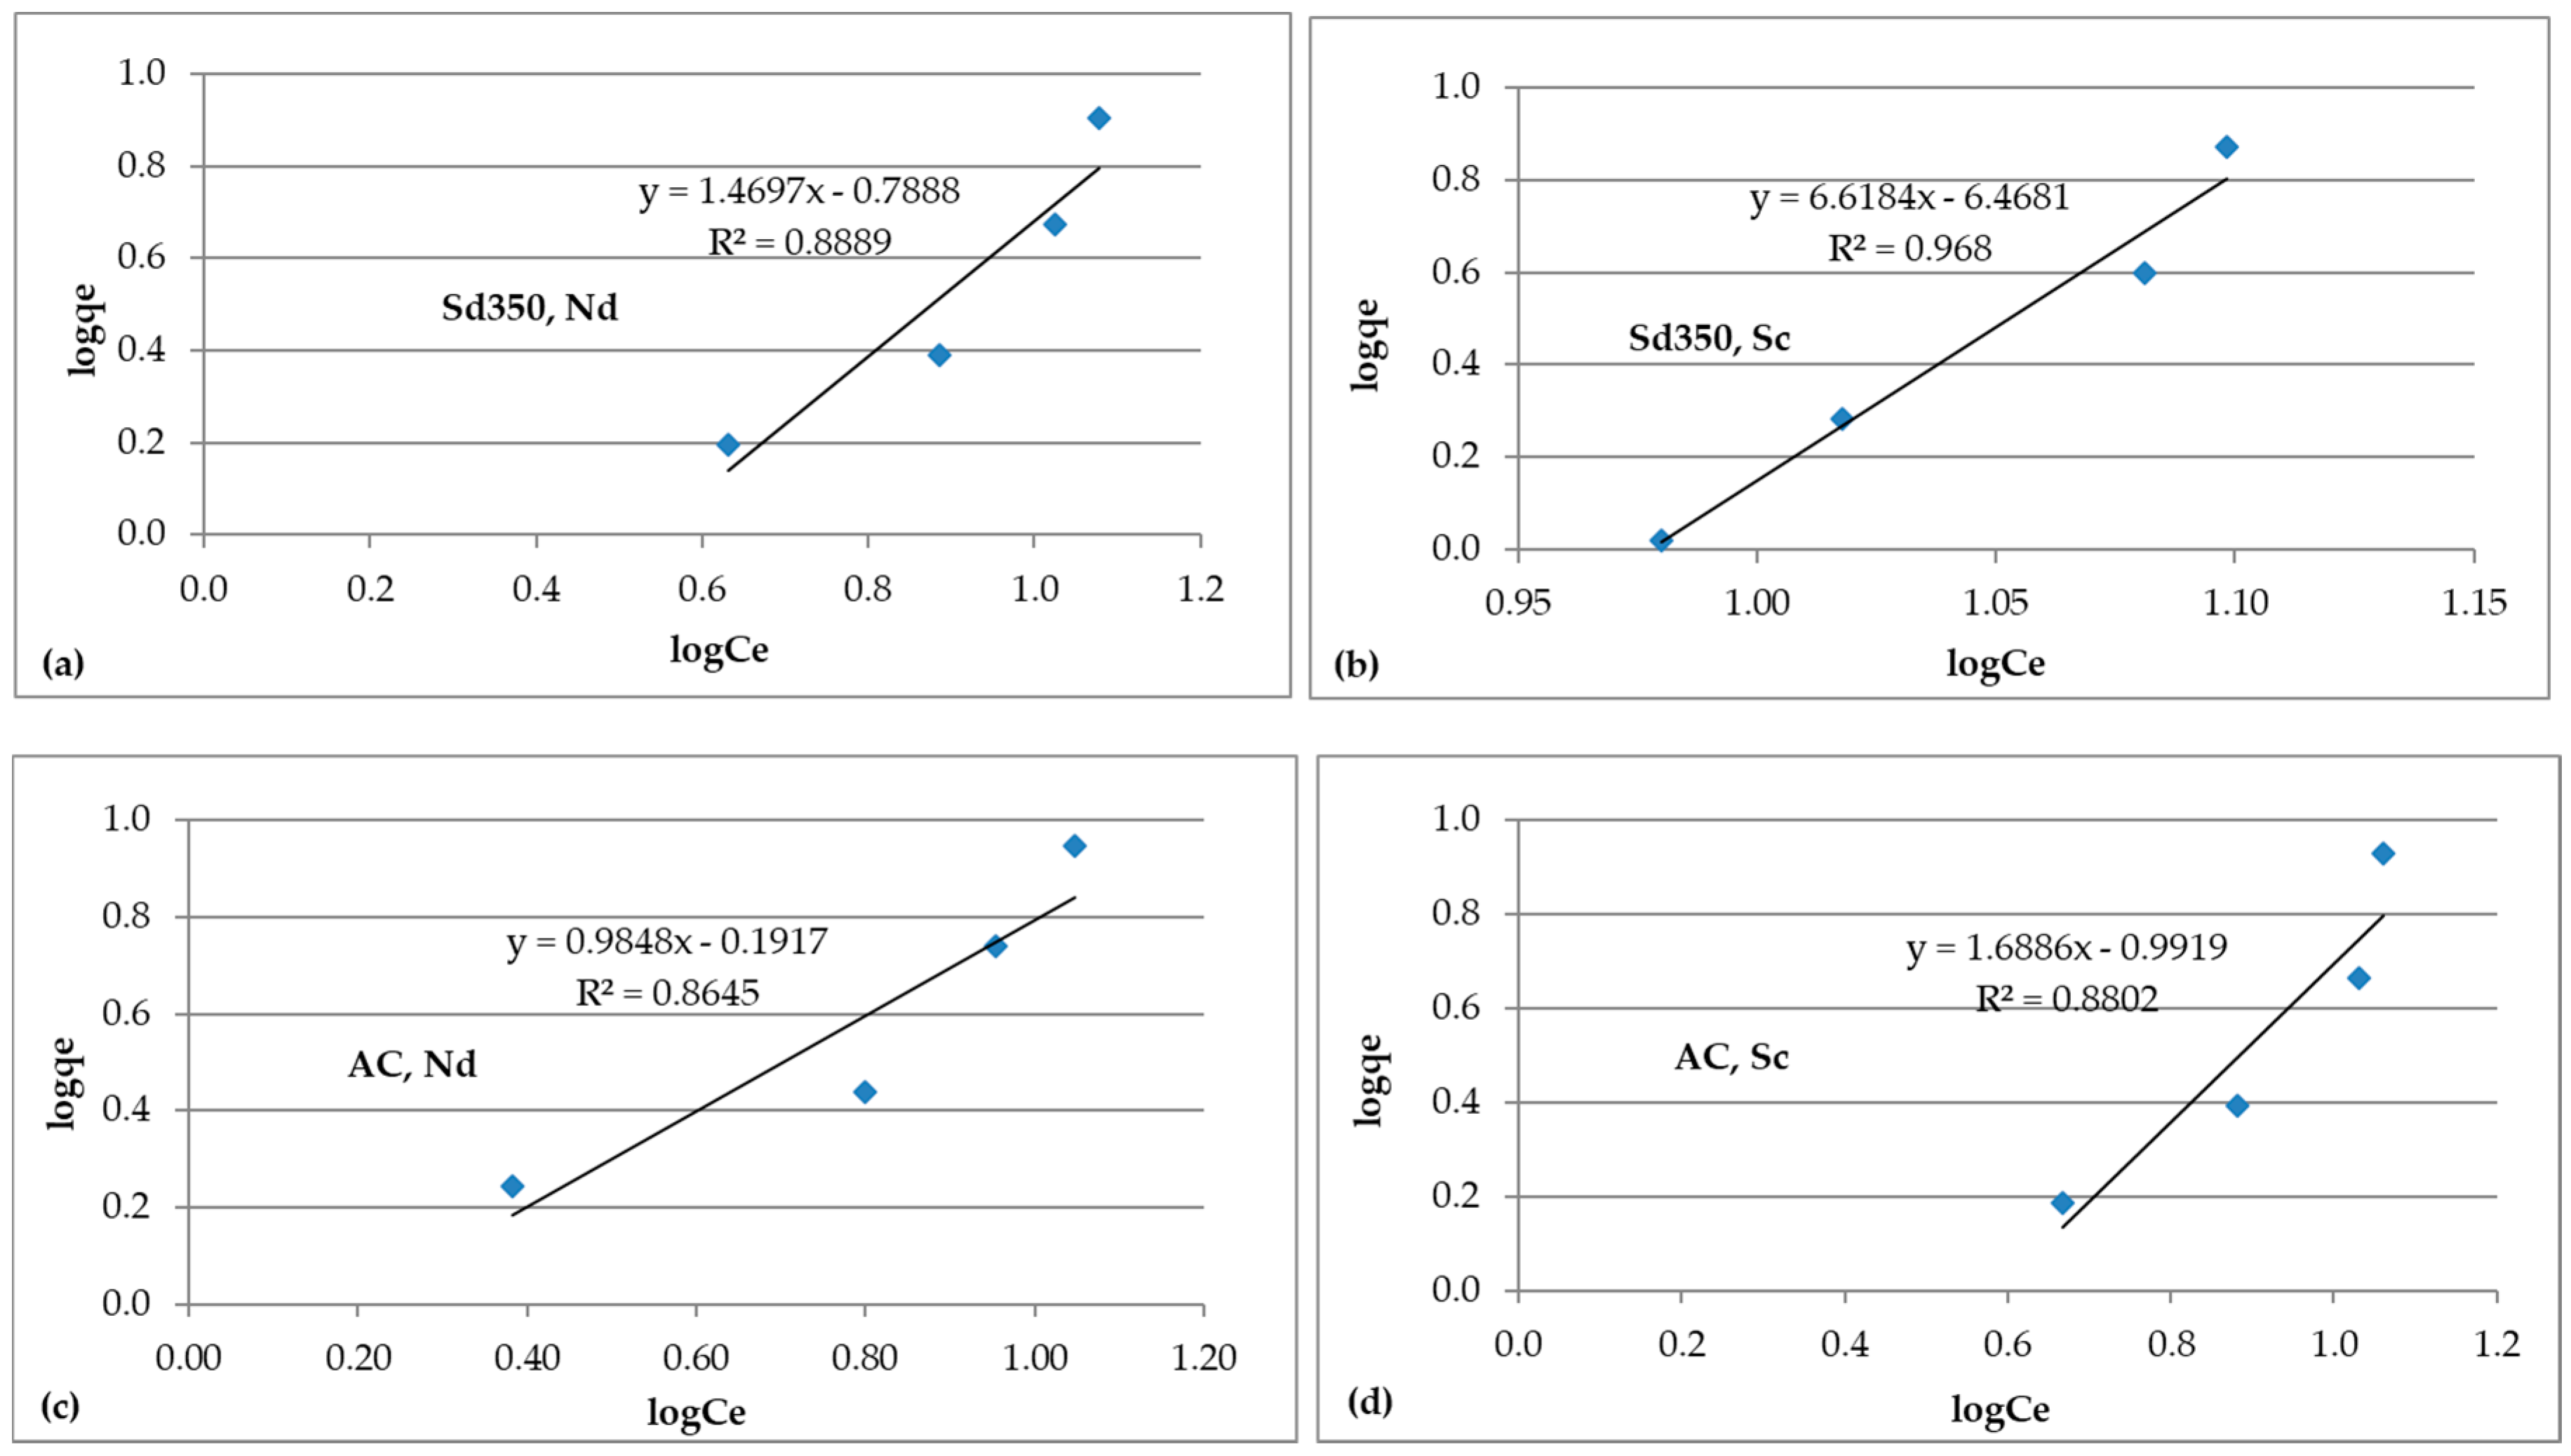
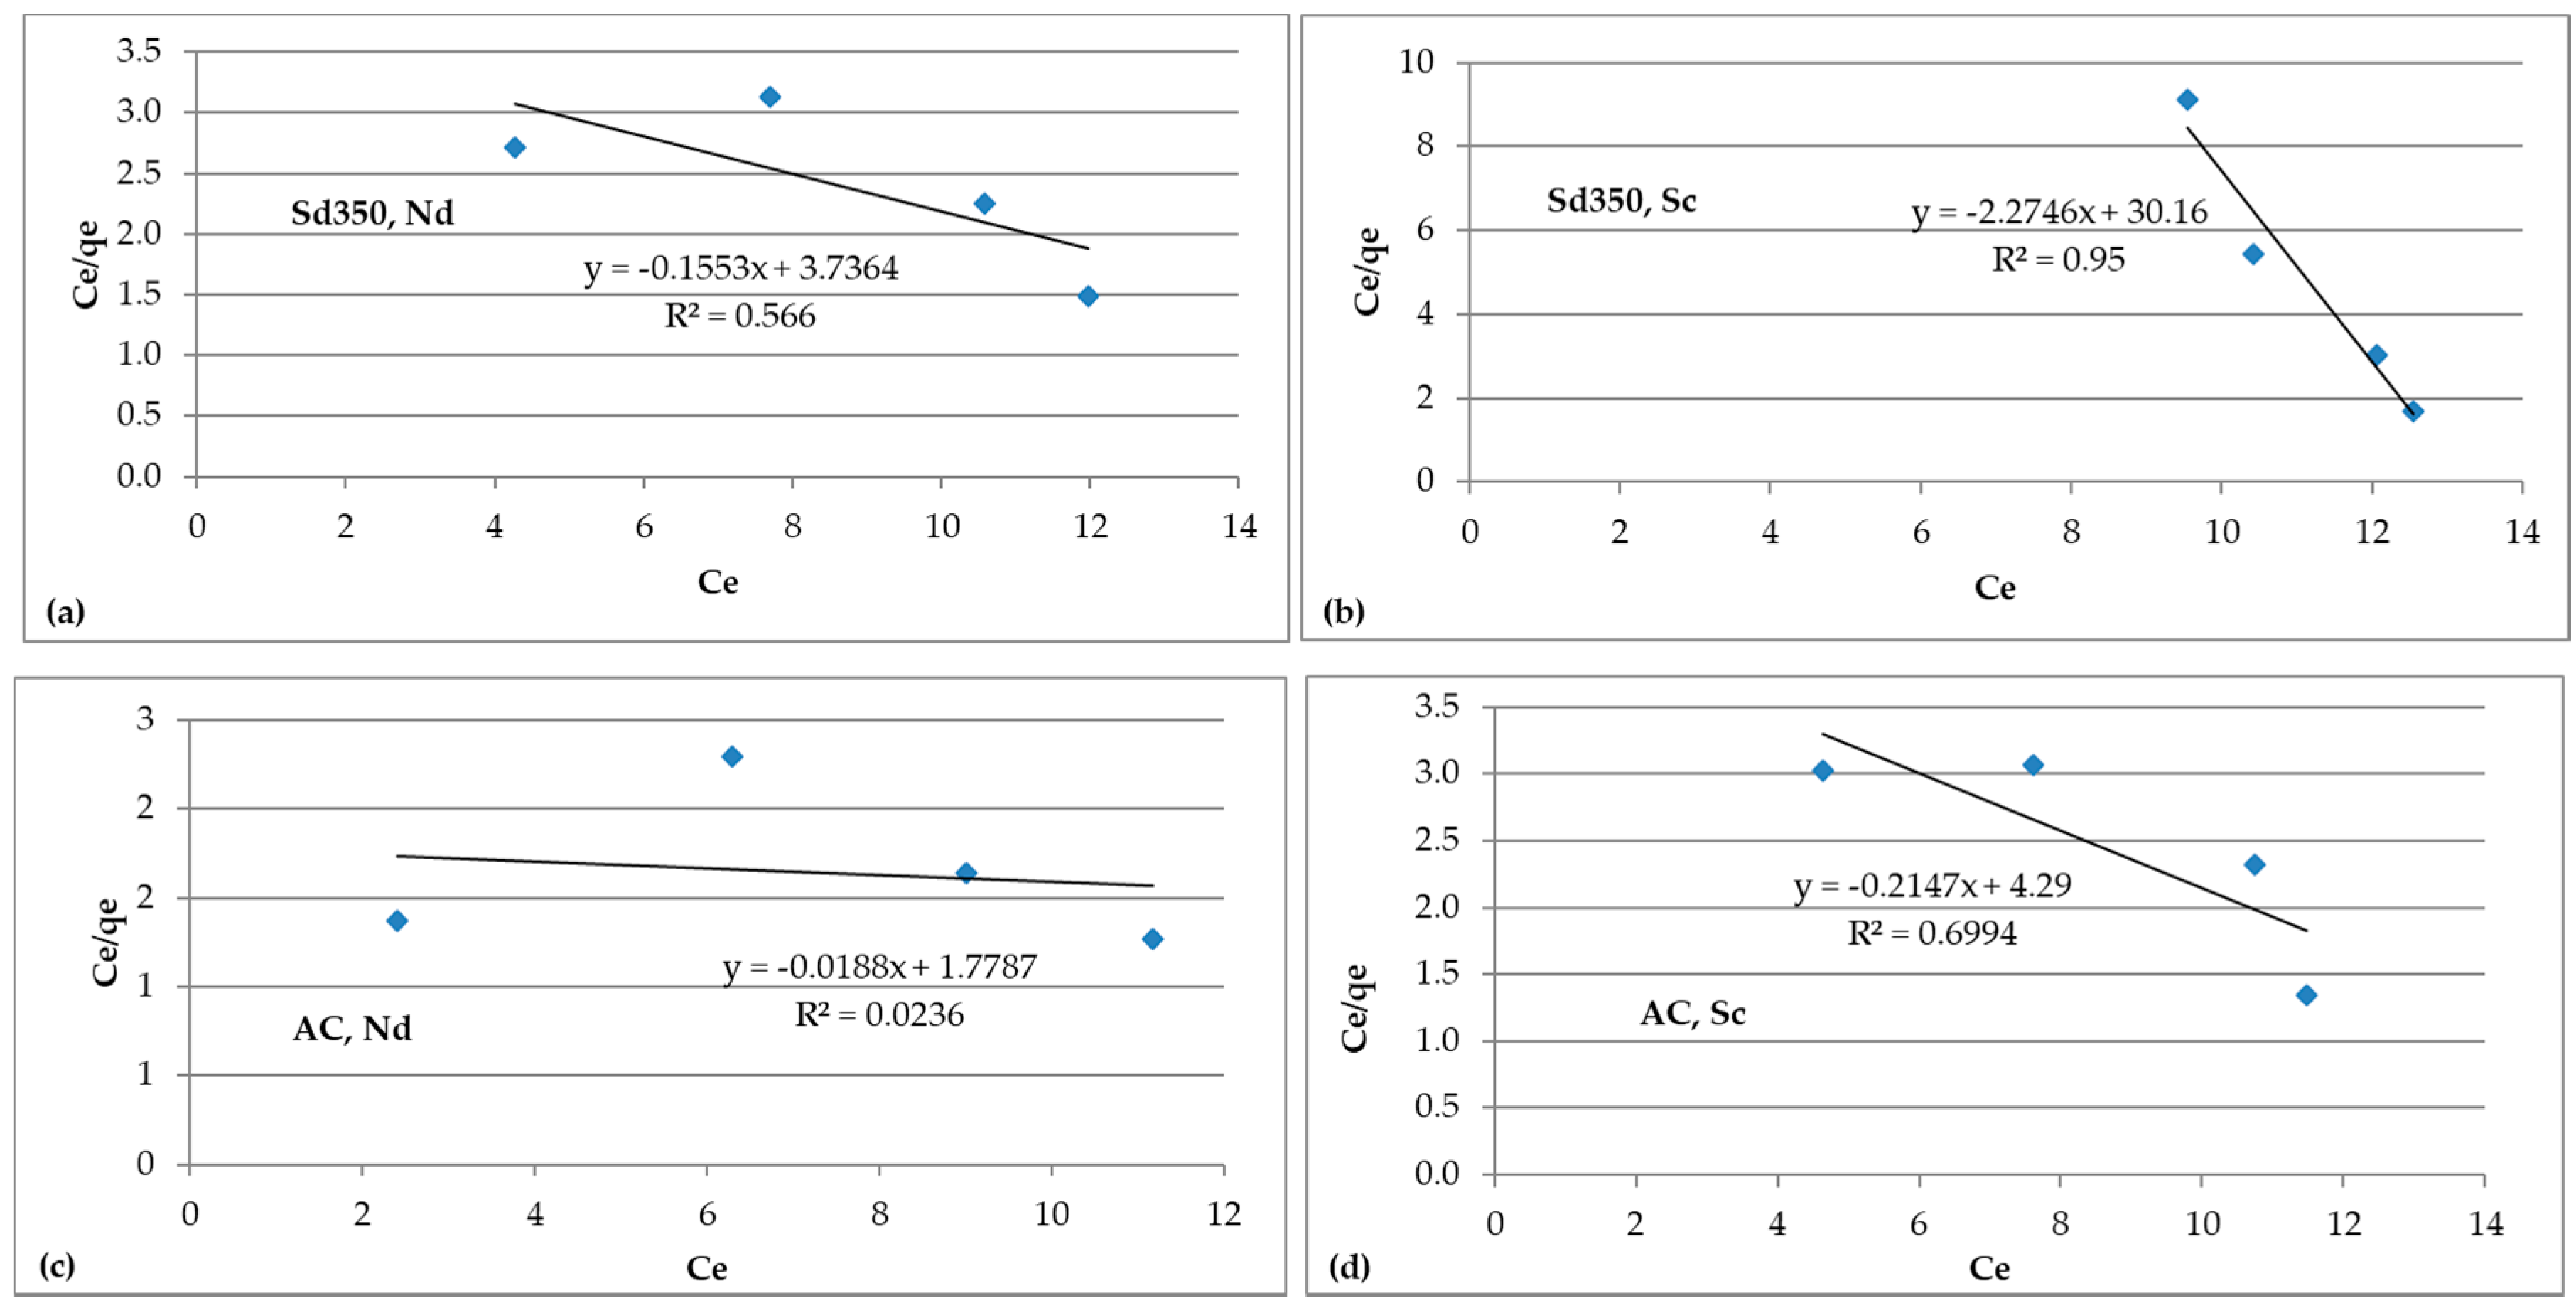
The Freundlich and Langmuir isotherms for Nd and Sc adsorption on biochar Sd350 and AC are presented in Figure 9 and Figure 10, respectively. The respective equations and the correlation coefficients R2, which were determined using the equilibrium concentration of Nd and Sc in solution for four different Sd350 and AC concentrations, are also shown in these figures.
It is shown that for both adsorbents, the Freundlich model (Figure 9a–d) gives a much better fit compared to the Langmuir model (Figure 10a–d), while the highest R2 values correspond to the Sd350 biochar for both Nd (Figure 10a) and Sc (Figure 10b). It is believed that the Freundlich model describes sorption much better as a result of the surface heterogeneity of Sd350, the pore size distribution and the presence of functional groups [72]. In the only similar available study in the literature [45] in which ammonium citrate-modified biochar was used to adsorb La(III) ions from solution, it was found that (i) adsorption followed also the pseudo-second-order kinetic model; and (ii) the Langmuir equation fitted the experimental results better; this indicates that the modification of biochar resulted in a more homogeneous surface that favors monolayer adsorption.
Table 4 presents the (kJ·mol−1) values of adsorption of REEs on Sd350 and AC. It is seen from this data that the negative values of confirm that adsorption of both REEs on each adsorbent is feasible and spontaneous in nature at room temperature and that AC is a more efficient adsorbent.
3.4.3. Adsorption Mechanism
The most important factors that define the adsorption efficiency of a carbon-rich material are the pore structure, the pore size distribution and the presence of surface functional groups [73]. The degree to which each factor contributes to adsorption depends on the characteristics of the initial raw material and the type of treatment applied, namely chemical or thermal, that defines the physico-chemical properties of the produced biochar or a commercial adsorbent. The increase of porosity and the development of micropores (0–2 nm) and mesopores (2–50 mn) that will increase the adsorption capacity of biochars can be accomplished through activation. Another issue that needs to be considered is potential blocking of pores as a result of mineralogical transformations occurring during pyrolysis or due to competition of ions present in solution [74,75,76].
Sd350 as deduced from the analyses carried out in the frame of the present study, mainly FTIR and SEM, is characterized by the presence of various active groups, such as the carbonyl, and quite well distributed adsorption sites, which enable adsorption of several metal and other ions present in aqueous solutions. Adsorption may be implemented through the involvement of several mechanisms, namely electrostatic interaction, chelation and complexation. In the present study, the results of speciation analysis indicate that the main species present in solution at pH 3 are Nd3+ and NdSO4+ for Nd and Sc3+, ScSO4+ and some ScOH2+ for Sc. It is thus believed that the main adsorption mechanism is cation exchange between –COOH and Sc or Nd as indicated in earlier studies [40,77]. Chemical adsorption and ion exchange were also proposed as potential mechanisms during the adsorption of light REEs (Y, La, Ce, Nd and Sm) on carbon black derived from recycled tires [36].
Furthermore, it is anticipated that electrostatic interactions may occur above the pHPZC between the previously mentioned positively-charged species of Nd and Sc and the carboxylic groups present in Sd350 and result in the formation of inner sphere chelated complexes [46]. It has been mentioned in a recent study, investigating sorption of Sc(III) onto carbon-based materials in acidic solutions, that competition between hydrogen and metal ions for the same sites may reduce sorption efficiency. Increase of pH charges the carbon surface more negatively, enhances electrostatic interactions between Sc and the sorbents and results in higher metal retention [78]. Finally, in a study investigating the adsorption of Eu3+ on Fe3O4@cyclodextrin magnetic composite at low pH, it was mentioned that at higher pH, precipitation of REE may also take place [79]. As our speciation analysis shows though, precipitation of Nd and Sc species is not probable at the studied acidic pH.
4. Conclusions
The results of the present study indicate that biochar produced after low-temperature pyrolysis of sawdust may be used as an alternative adsorbent, even though inferior to activation carbon, for the adsorption of REEs, such as Nd and Sc, from aqueous solutions. Kinetic data indicate that adsorption follows the pseudo-second-order kinetic reaction, while equilibrium data show that it obeys the Freundlich isotherm model. The main adsorption mechanisms include chemical adsorption and ion exchange.
The selection of the most efficient biochar and the optimum experimental conditions to enable maximum adsorption efficiency should be based on the results of geochemical modelling and speciation analysis, as well as the determination of pHPZC.
The development of inexpensive and efficient adsorbents from agricultural and other wastes is an intriguing research issue since their production contributes to waste valorization and is in line with the principles of circular economy. Based on the results of the present study, it is proposed that further investigations are required to (i) assess the adsorption efficiency of biochars produced from different agricultural wastes; (ii) optimize biochar production through different types of pyrolysis in order to balance yield and process economics and at the same time improve its properties (e.g., structure, porosity, surface area, presence of specific functional groups and available active sorption sites); and (iii) determine the effect of surface modification that may affect pHPZC and enable adsorption of REEs over a much wider pH range.
Acknowledgments
K.K. would like to acknowledge the support of European Commission in the frame of Horizon 2020 project “Metal recovery from low-grade ores and wastes”, http://metgrowplus.eu/, Grant Agreement No. 690088.
Author Contributions
K.K. conceived of the idea, designed the experiments, analyzed the results and reviewed the paper. D.Z. performed the experiments and wrote part of the paper. G.B. performed the SEM analysis, carried out geochemical modelling and wrote part of the paper, and G.A. was involved in characterization studies with the use of analytical techniques and wrote part of the paper.
Conflicts of Interest
The authors declare no conflict of interest. The founding sponsors had no role in the design of the study; in the collection, analyses or interpretation of data; in the writing of the manuscript; nor in the decision to publish the results.
References
- Massari, S.; Ruberti, M. Rare earth elements as critical raw materials: Focus on international markets and future strategies. Resour. Policy 2013, 38, 36–43. [Google Scholar] [CrossRef]
- European Commission. Communication from the Commission to the European Parliament, the Council, the European Economic and Social Committee and the Committee of the Regions on the 2017 List of Critical Raw Materials for the EU, Brussels, 13.9.2017, COM(2017) 490 Final. Available online: http://eur-lex.europa.eu/legal-content/EN/TXT/PDF/?uri=CELEX:52017DC0490&from=EN (accessed on 10 October 2017).
- Kennedy, J. Rare earth production, regulatory USA/International constraints and Chinese dominance; The economic viability is bounded by geochemistry and value chain integration. In Rare Earths Industry: Technological, Economic, and Environmental Implications; De Lima, I.B., Leal, W., Eds.; Elsevier: Amsterdam, The Netherlands, 2015; pp. 37–55. [Google Scholar]
- Kamenopoulos, S.; Agioutantis, Z.; Komnitsas, K. A new Hybrid Decision Support Tool for evaluating the sustainability of mining projects. Int. J. Min. Sci. Technol. 2017. [Google Scholar] [CrossRef]
- ERECON (European Rear Earth Competency Network). Strengthening the European Rare Earths Supply Chain: Challenges and Policy Options. Kooroshy, J., Tiess, G., Tukker, A., Walton, A., Eds.; 2015. Available online: http://reinhardbuetikofer.eu/wp-content/uploads/2015/03/ERECON_Report_v05.pdf (accessed on 14 August 2017).
- Haque, N.; Hughes, A.; Lim, S.; Vernon, C. Rare earth elements: Overview of mining, mineralogy, uses, sustainability and environmental impact. Resources 2014, 3, 614–635. [Google Scholar] [CrossRef]
- Binnemans, K.; Jones, P.T.; Van Acker, K.; Blanpain, B.; Mishra, B.; Apelian, D. Rare-earth economics: The balance problem. JOM 2013, 65, 846–848. [Google Scholar] [CrossRef]
- Kiggins, R.D. The Strategic and Security Implications of Rare Earths. In The Political Economy of Rare Earth Elements: Rising Powers and Technological Change; Kiggins, R.D., Ed.; Palgrave Macmillan: Basingstoke, UK, 2015; pp. 1–19. ISBN 978-1-137-36424-1. [Google Scholar]
- Manyà, J. Pyrolysis for Biochar Purposes: A Review to Establish Current Knowledge Gaps and Research Needs. Environ. Sci. Technol. 2012, 46, 7939–7954. [Google Scholar] [CrossRef] [PubMed]
- Moussavi, G.; Khosravi, R. Preparation and characterization of a biochar from pistachio hull biomass and its catalytic potential for ozonation of water recalcitrant contaminants. Bioresour. Technol. 2012, 119, 66–71. [Google Scholar] [CrossRef] [PubMed]
- Agrafioti, E.; Kalderis, D.; Diamadopoulos, E. Arsenic and chromium removal from water using biochars derived from rice husk, organic solid wastes and sewage sludge. J. Environ. Manag. 2014, 133, 309–314. [Google Scholar] [CrossRef] [PubMed]
- Kung, C.-C.; Kong, F.; Choi, Y. Pyrolysis and biochar potential using crop residues and agricultural wastes in China. Ecol. Indic. 2015, 51, 139–145. [Google Scholar] [CrossRef]
- Cole, A.J.; Paul, N.A.; de Nys, R.; Roberts, D.A. Good for Sewage Treatment and Good for Agriculture: Algal Based Compost and Biochar. J. Environ. Manag. 2017, 200, 105–113. [Google Scholar] [CrossRef] [PubMed]
- McHenry, M.P. Agricultural bio-char production, renewable energy generation and farm carbon sequestration in Western Australia: Certainty, uncertainty and risk. Agr. Ecosyst. Environ. 2009, 129, 1–7. [Google Scholar] [CrossRef]
- Ding, W.; Dong, X.; Ime, I.M.; Gao, B.; Ma, L.Q. Pyrolytic temperatures impact lead sorption mechanisms by bagasse biochars. Chemosphere 2014, 105, 68–74. [Google Scholar] [CrossRef] [PubMed]
- Jia, F.; Gan, J. Comparing black carbon types in sequestering polybrominated diphenyl ethers (PBDEs) in sediments. Environ. Pollut. 2014, 184, 131–137. [Google Scholar] [CrossRef] [PubMed]
- Rajapaksha, A.U.; Chen, S.S.; Tsang, D.C.W.; Zhang, M.; Vithanage, M.; Mandal, S.; Gao, B.; Bolan, N.S.; Ok, Y.S. Engineered/designer biochar for contaminant removal/immobilization from soil and water: Potential and implication of biochar modification. Chemosphere 2016, 148, 276–291. [Google Scholar] [CrossRef] [PubMed]
- Rao, M.A.; Di Rauso Simeone, G.; Scelza, R.; Pellegrino Conte, P. Biochar based remediation of water and soil contaminated by phenanthrene and pentachlorophenol. Chemosphere 2017, 186, 193–201. [Google Scholar] [CrossRef] [PubMed]
- Zhou, D.; Liu, D.; Gao, F.; Li, M.; Luo, X. Effects of biochar-derived sewage sludge on heavy metal adsorption and immobilization in soils. Int. J. Environ. Res. Public Health 2017, 14, 681. [Google Scholar] [CrossRef] [PubMed]
- Singh, R.; Babu, J.N.; Kumar, R.; Srivastava, P.; Singh, P.; Raghubanshi, A.S. Multifaceted application of crop residue biochar as a tool for sustainable agriculture: An ecological perspective. Ecol. Eng. 2015, 77, 324–347. [Google Scholar] [CrossRef]
- Komnitsas, K.; Doula, M. Framework to improve sustainability of agriculture in small islands: The case of Pistacia vera L. cultivation in Aegina, Greece. Environ. Forensics 2017, 18, 1–12. [Google Scholar] [CrossRef]
- Qambrani, N.A.; Rahman, M.M.; Won, S.; Shim, S.; Ra, C. Biochar properties and eco-friendly applications for climate change mitigation, waste management, and wastewater treatment: A review. Renew. Sustain. Energy Rev. 2017, 79, 255–273. [Google Scholar] [CrossRef]
- Bartzas, G.; Komnitsas, K. Life cycle assessment of FeNi production in Greece: A case study. Resour. Conserv. Recycl. 2015, 105, 113–122. [Google Scholar] [CrossRef]
- Mousa, E.; Wang, C.; Riesbeck, J.; Larsson, M. Biomass applications in iron and steel industry: An overview of challenges and opportunities. Renew. Sustain. Energy Rev. 2016, 65, 1247–1266. [Google Scholar] [CrossRef]
- Komnitsas, K.; Zaharaki, D.; Pyliotis, I.; Vamvuka, D.; Bartzas, G. Assessment of pistachio shell biochar quality and its potential for adsorption of heavy metals. Waste Biomass Valor. 2015, 6, 805–816. [Google Scholar] [CrossRef]
- Komnitsas, K.; Zaharaki, D.; Bartzas, G.; Kaliakatsou, G.; Kritikaki, A. Efficiency of pecan shells and sawdust biochar on Pb and Cu adsorption. Desalin. Water Treat. 2016, 57, 3237–3246. [Google Scholar] [CrossRef]
- Higashikawa, F.S.; Conz, R.F.; Colzato, M.; Cerri, C.E.P.; Alleoni, L.R.F. Effects of feedstock type and slow pyrolysis temperature in the production of biochars on the removal of cadmium and nickel from water. J. Clean. Prod. 2016, 137, 965–972. [Google Scholar] [CrossRef]
- Yao, Y.; Gao, B.; Inyang, M.; Zimmerman, A.R.; Cao, X.; Pullammanappallil, P.; Yang, L. Removal of phosphate from aqueous solution by biochar derived from anaerobically digested sugar beet tailings. J. Hazard. Mater. 2011, 190, 501–507. [Google Scholar] [CrossRef] [PubMed]
- Guo, X.; Dong, H.; Yang, C.; Zhang, Q.; Liao, C.; Zha, F.; Gao, L. Application of goethite modified biochar for tylosin removal from aqueous solution. Colloids Surf. A 2016, 502, 81–88. [Google Scholar] [CrossRef]
- Komnitsas, K.; Zaharaki, D. Morphology of modified biochar and its potential for phenol removal from aqueous solutions. Front. Environ. Sci. 2016, 4, 26. [Google Scholar] [CrossRef]
- Shimabuku, K.K.; Kearns, J.P.; Martinez, J.E.; Mahoney, R.B.; Moreno-Vasquez, L.; Summers, R.S. Biochar sorbents for sulfamethoxazole removal from surface water, stormwater, and wastewater effluent. Water Res. 2016, 96, 236–245. [Google Scholar] [CrossRef] [PubMed]
- Mohan, D.; Pittman, C.U.; Bricka, M.; Smith, F.; Yancey, B.; Mohammad, J.; Steele, P.H.; Alexandre-Franco, M.F.; Gómez-Serrano, V.; Gong, H. Sorption of arsenic, cadmium, and lead by biochars produced from fast pyrolysis of wood and bark during bio-oil production. J. Colloid Interface Sci. 2007, 310, 57–73. [Google Scholar] [CrossRef] [PubMed]
- Baral, N.R.; Shah, A. Techno-economic analysis of utilization of stillage from a cellulosic biorefinery. Fuel Process. Technol. 2017, 166, 59–68. [Google Scholar] [CrossRef]
- Smebye, A.B.; Sparrevik, M.; Schmidt, H.P.; Cornelissen, G. Life-cycle assessment of biochar production systems in tropical rural areas: Comparing flame curtain kilns to other production methods. Biomass Bioenerg. 2017, 101, 35–43. [Google Scholar] [CrossRef]
- Ogata, T.; Narita, H.; Tanaka, M. Adsorption behavior of rare earth elements on silica gel modified with diglycol amic acid. Hydrometallurgy 2015, 152, 178–182. [Google Scholar] [CrossRef]
- Smith, Y.R.; Bhattacharyya, D.; Willhard, T.; Misra, M. Adsorption of aqueous rare earth elements using carbon black derived from recycled tires. Chem. Eng. J. 2016, 296, 102–111. [Google Scholar] [CrossRef]
- Sun, X.; Luo, H.; Mahurin, S.M.; Liu, R.; Hou, X.; Dai, S. Adsorption of rare earth ions using carbonized polydopamine nano carbon shells. J. Rare Earths 2016, 34, 77–82. [Google Scholar] [CrossRef]
- Zhao, F.; Repo, E.; Meng, Y.; Wang, X.; Yin, D.; Sillanpää, M. An EDTA-β-cyclodextrin material for the adsorption of rare earth elements and its application in preconcentration of rare earth elements in seawater. J. Colloid Interface Sci. 2016, 465, 215–224. [Google Scholar] [CrossRef] [PubMed]
- Atrees, M.S.; Metwally, E.; Demerdash, M.; Salem, H. Sorption behavior of Pr and Nd upon chitosan benzoyl thiourea derivatives. J. Radiat. Res. Appl. Sci. 2016, 9, 207–216. [Google Scholar] [CrossRef]
- Gao, Y.; Zhang, S.; Zhao, K.; Wang, Z.; Xu, S.; Liang, Z.; Wu, K. Adsorption of La3+ and Ce3+ by poly-γ-glutamic acid crosslinked with polyvinyl alcohol. J. Rare Earths 2015, 33, 884–891. [Google Scholar] [CrossRef]
- Park, D.M.; Reed, D.W.; Yung, M.C.; Eslamimanesh, A.; Lencka, M.M.; Anderko, A.; Fujita, Y.; Riman, R.E.; Navrotsky, A.; Jiao, Y. Bioadsorption of rare earth elements through cell surface display of lanthanide binding tags. Environ. Sci. Technol. 2016, 50, 2735–2742. [Google Scholar] [CrossRef] [PubMed]
- Zhang, C.; Zhan, F.; Li, L.; Zhang, K. Adsorption rare earth metal ions from aqueous solution by polyamidoamine dendrimer functionalized soy hull. Waste Biomass Valor. 2016, 7, 1211–1219. [Google Scholar] [CrossRef]
- Liu, C.; Yan, C.; Zhou, S.; Ge, W. Fabrication of sponge biomass adsorbent through UV-induced surface-initiated polymerization for the adsorption of Ce(III) from wastewater. Water Sci. Technol. 2017, 75, 2755–2764. [Google Scholar] [CrossRef] [PubMed]
- Anastopoulos, I.; Bhatnagar, A.; Lima, E.C. Adsorption of rare earth metals: A review of recent literature. J. Mol. Liq. 2016, 221, 954–962. [Google Scholar] [CrossRef]
- Wang, Y.-Y.; Lu, H.-H.; Liu, Y.-X.; Yang, S.-M. Ammonium citrate-modified biochar: An adsorbent for La(III) ions from aqueous solution. Colloids Surf. A 2016, 509, 550–563. [Google Scholar] [CrossRef]
- Hadjittofi, L.; Charalambous, S.; Pashalidis, I. Removal of trivalent samarium from aqueous solutions by activated biochar derived from cactus fibres. J. Rare Earths 2016, 34, 99–104. [Google Scholar] [CrossRef]
- Mahmood, T.; Saddique, M.T.; Naeem, A.; Westerhoff, P.; Mustafa, S.; Alum, A. Comparison of Different Methods for the Point of Zero Charge Determination of NiO. Ind. Eng. Chem. Res. 2011, 50, 10017–10023. [Google Scholar] [CrossRef]
- Suliman, W.; Harsh, J.B.; Abu-Lail, N.I.; Fortuna, A.-M.; Dallmeyer, I.; Garcia-Perez, M. Modification of biochar surface by air oxidation: Role of pyrolysis temperature. Biomass Bioenerg. 2016, 85, 1–11. [Google Scholar] [CrossRef]
- Parkhurst, D.L.; Appelo, C.A.J. Description of Input and Examples for PHREEQC Version 3-A Computer Program for Speciation, Batch-Reaction, One-Dimensional Transport, and Inverse Geochemical Calculations; U.S. Geological Survey Techniques and Methods; U.S. Geological Survey: Reston, WV, USA, 2013; Book 6, Chapter A43; p. 497. Available online: https://pubs.usgs.gov/tm/06/a43/ (accessed on 12 April 2017).
- Haynes, W.M.; Bruno, T.J.; Lide, D.R. Section 4: Properties of the Elements and Inorganic Compounds. In CRC Handbook of Chemistry and Physics, 96th ed.; Haynes, W.M., Ed.; CRC Press/Taylor and Francis: New York, NY, USA, 2015; pp. 4–145. ISBN 1-4822-6096-4. [Google Scholar]
- Horovitz, C.T. Biochemistry of Scandium and Yttrium, Part 1: Physical and Chemical Fundamentals; Springer Science: New York, USA, 1999; p. 313. ISBN 978-1-4615-4313-8. [Google Scholar]
- Jordan, D.S.; Saslow, S.A.; Geiger, F.M. Exponential sensitivity and speciation of Al(III), Sc(III), Y(III), La(III), and Gd(III) at fused silica/water interfaces. J. Phys. Chem. A 2011, 115, 14438–14445. [Google Scholar] [CrossRef] [PubMed]
- Martell, A.E.; Smith, R.M.; Motekaitis, R.J. NIST Critically Selected Stability Constants of Metal Complexes Database 46; Version 8; Standard Reference Data Program; National Institute of Standards and Technology/U.S. Department of Commerce: Gaithersburg, MD, USA, 2004.
- Komnitsas, K.; Bartzas, G.; Paspaliaris, I. Modeling of Reaction Front Progress in Fly Ash Permeable Reactive Barriers. Environ. Forensics 2006, 7, 219–231. [Google Scholar] [CrossRef]
- Ho, Y.-S.; McKay, G. Pseudo-second order model for sorption processes. Process Biochem. 1999, 34, 451–465. [Google Scholar] [CrossRef]
- Ho, Y.-S. Review of second-order models for adsorption systems. J. Hazard. Mater. 2006, B136, 681–689. [Google Scholar] [CrossRef] [PubMed]
- Gaskin, J.W.; Steiner, C.; Harris, K.; Das, K.C.; Bibens, B. Effect of low-temperature pyrolysis conditions on biochar for agricultural use. Trans. ASABE 2008, 51, 2061–2069. [Google Scholar] [CrossRef]
- Dai, Z.; Meng, J.; Muhammad, N.; Liu, X.; Wang, H.; He, Y.; Brookes, P.C.; Xu, J. The potential feasibility for soil improvement, based on the properties of biochars pyrolyzed from different feedstocks. J. Soils Sediments 2013, 13, 989–1000. [Google Scholar] [CrossRef]
- Gray, M.; Johnson, M.G.; Dragila, M.I.; Kleber, M. Water uptake in biochars: The roles of porosity and hydrophobicity. Biomass Bioenerg. 2014, 61, 196–205. [Google Scholar] [CrossRef]
- Socrates, G. Infrared and Raman Characteristic Group Frequencies, 3rd ed.; John Wiley & Sons Ltd.: Chistester, UK, 2001; ISBN 978-0-470-09307-8. [Google Scholar]
- Kosmulski, M. pH-dependent surface charging and points of zero charge. IV. Update and new approach. J. Colloid Interface Sci. 2009, 337, 439–448. [Google Scholar] [CrossRef] [PubMed]
- Liu, N.; Charrua, A.B.; Weng, C.-H.; Yuan, X.; Ding, F. Characterization of biochars derived from agriculture wastes and their adsorptive removal of atrazine from aqueous solution: A comparative study. Bioresour. Technol. 2015, 198, 55–62. [Google Scholar] [CrossRef] [PubMed]
- Kołodyńska, D.; Krukowska, J.; Thomas, P. Comparison of sorption and desorption studies of heavy metal ions from biochar and commercial active carbon. Chem. Eng. J. 2017, 307, 353–363. [Google Scholar] [CrossRef]
- Mondal, S.; Bobde, K.; Aikat, K.; Halder, G. Biosorptive uptake of ibuprofen by steam activated biochar derived from mung bean husk: Equilibrium, kinetics, thermodynamics, modeling and eco-toxicological studies. J. Environ. Manag. 2016, 182, 581–594. [Google Scholar] [CrossRef] [PubMed]
- Bentouhami, E.; Bouet, G.M.; Meullemeestre, J.; Vierling, F.; Khan, M.A. Physicochemical study of the hydrolysis of rare-earth elements (III) and thorium (IV). C. R. Chim. 2004, 7, 537–545. [Google Scholar] [CrossRef]
- Bruque, S.; Mozas, T.; Rodriguez, A. Factors influencing retention of lanthanide ions by montmorillonite. Clay Miner. 1980, 15, 413–420. [Google Scholar] [CrossRef]
- Moldoveanu, G.A.; Papangelakis, V.G. Recovery of rare earth elements adsorbed on clay minerals: II. Leaching with ammonium sulfate. Hydrometallurgy 2013, 131, 158–166. [Google Scholar] [CrossRef]
- Mohan, D.; Sarswat, A.; Ok, Y.S.; Pittman, C.U., Jr. Organic and inorganic contaminants removal from water with biochar, a renewable, low cost and sustainable adsorbent—A critical review. Bioresour. Technol. 2014, 160, 191–202. [Google Scholar] [CrossRef] [PubMed]
- Li, Y.; Du, Q.; Wang, X.; Xia, Y. Removal of lead from aqueous solution by activated carbon prepared from Entermorpha prolifera by zinc chloride activation. J. Hazard. Mater. 2010, 183, 583–589. [Google Scholar] [CrossRef] [PubMed]
- Hui, C.-W.; Chen, B.; McKay, G. Pore-Surface Diffusion Model for Batch Adsorption Processes. Langmuir 2003, 19, 4188–4196. [Google Scholar] [CrossRef]
- Lin, L.-C.; Thirumavalavan, M.; Wang, Y.-T.; Jiunn-Fwu Lee, J.-F. Effect of Preparation Conditions on the Adsorption of Heavy Metal Ions from Aqueous Solution by Mesoporous Silica Materials Prepared Using Organic Template (HDTMAB). J. Chem. Eng. Data 2010, 55, 3667–3673. [Google Scholar] [CrossRef]
- Girods, P.; Dufour, A.; Fierro, V.; Rogaume, Y.; Rogaume, C.; Zoulalian, A.; Celzard, A. Activated carbons prepared from wood particleboard wastes: Characterisation and phenol adsorption capacities. J. Hazard. Mater. 2009, 166, 491–501. [Google Scholar] [CrossRef] [PubMed]
- Oh, S.-Y.; Seo, Y.-D. Sorption of halogenated phenols and pharmaceuticals to biochar: Affecting factors and mechanisms. Environ. Sci. Pollut. Res. 2016, 23, 951–961. [Google Scholar] [CrossRef] [PubMed]
- Iriarte-Velasco, U.; Zudaire, L.; Ayastuy, J.L. Preparation of a porous biochar from the acid activation of pork bones. Food Bioprod. Process. 2016, 98, 341–353. [Google Scholar] [CrossRef]
- Kong, M.; Liu, Q.; Guo, F.; Jiang, L.; Yao, L.; Ren, S.; Yang, J. Physicochemical properties of pine-derived bio-chars modified by metal oxides and their performance in the removal of NO. J. Energy Inst. 2017. [Google Scholar] [CrossRef]
- Sun, Y.; Zhang, J.P.; Wen, C.; Zhang, L. An enhanced approach for biochar preparation using fluidized bed and its application for H2S removal. Chem. Eng. Process. 2016, 104, 1–12. [Google Scholar] [CrossRef]
- Xiong, C.; He, R.; Pi, L.; Li, J.; Yao, C.; Jiang, J.; Zheng, X. Adsorption of Neodymium(III) on Acrylic Resin (110 Resin) from Aqueous Solutions. Sep. Sci. Technol. 2015, 50, 564–572. [Google Scholar] [CrossRef]
- Kilian, K.; Pyrzyńska, K.; Pęgier, M. Comparative Study of Sc(III) Sorption onto Carbon-based Materials. Solv. Extr. Ion Exch. 2017. [Google Scholar] [CrossRef]
- Guo, Z.; Li, Y.; Pan, S.; Xu, J. Fabrication of Fe3O4@cyclodextrin magnetic composite for the high-efficient removal of Eu(III). J. Mol. Liq. 2015, 206, 272–277. [Google Scholar] [CrossRef]
Figure 1.
XRD patterns of Sd and biochar Sd350 (Ce: cellulose, C: calcite, Q: quartz).

Figure 2.
SEM-BSI images of the Sd (×200) (a), Sd350 (×300 and ×2000) (b) and Sd350 (×500 and ×1000) (c).
Figure 2.
SEM-BSI images of the Sd (×200) (a), Sd350 (×300 and ×2000) (b) and Sd350 (×500 and ×1000) (c).

Figure 3.
TG (a) and DTG curves (b) versus temperature evolution, for Sd and biochar Sd350.
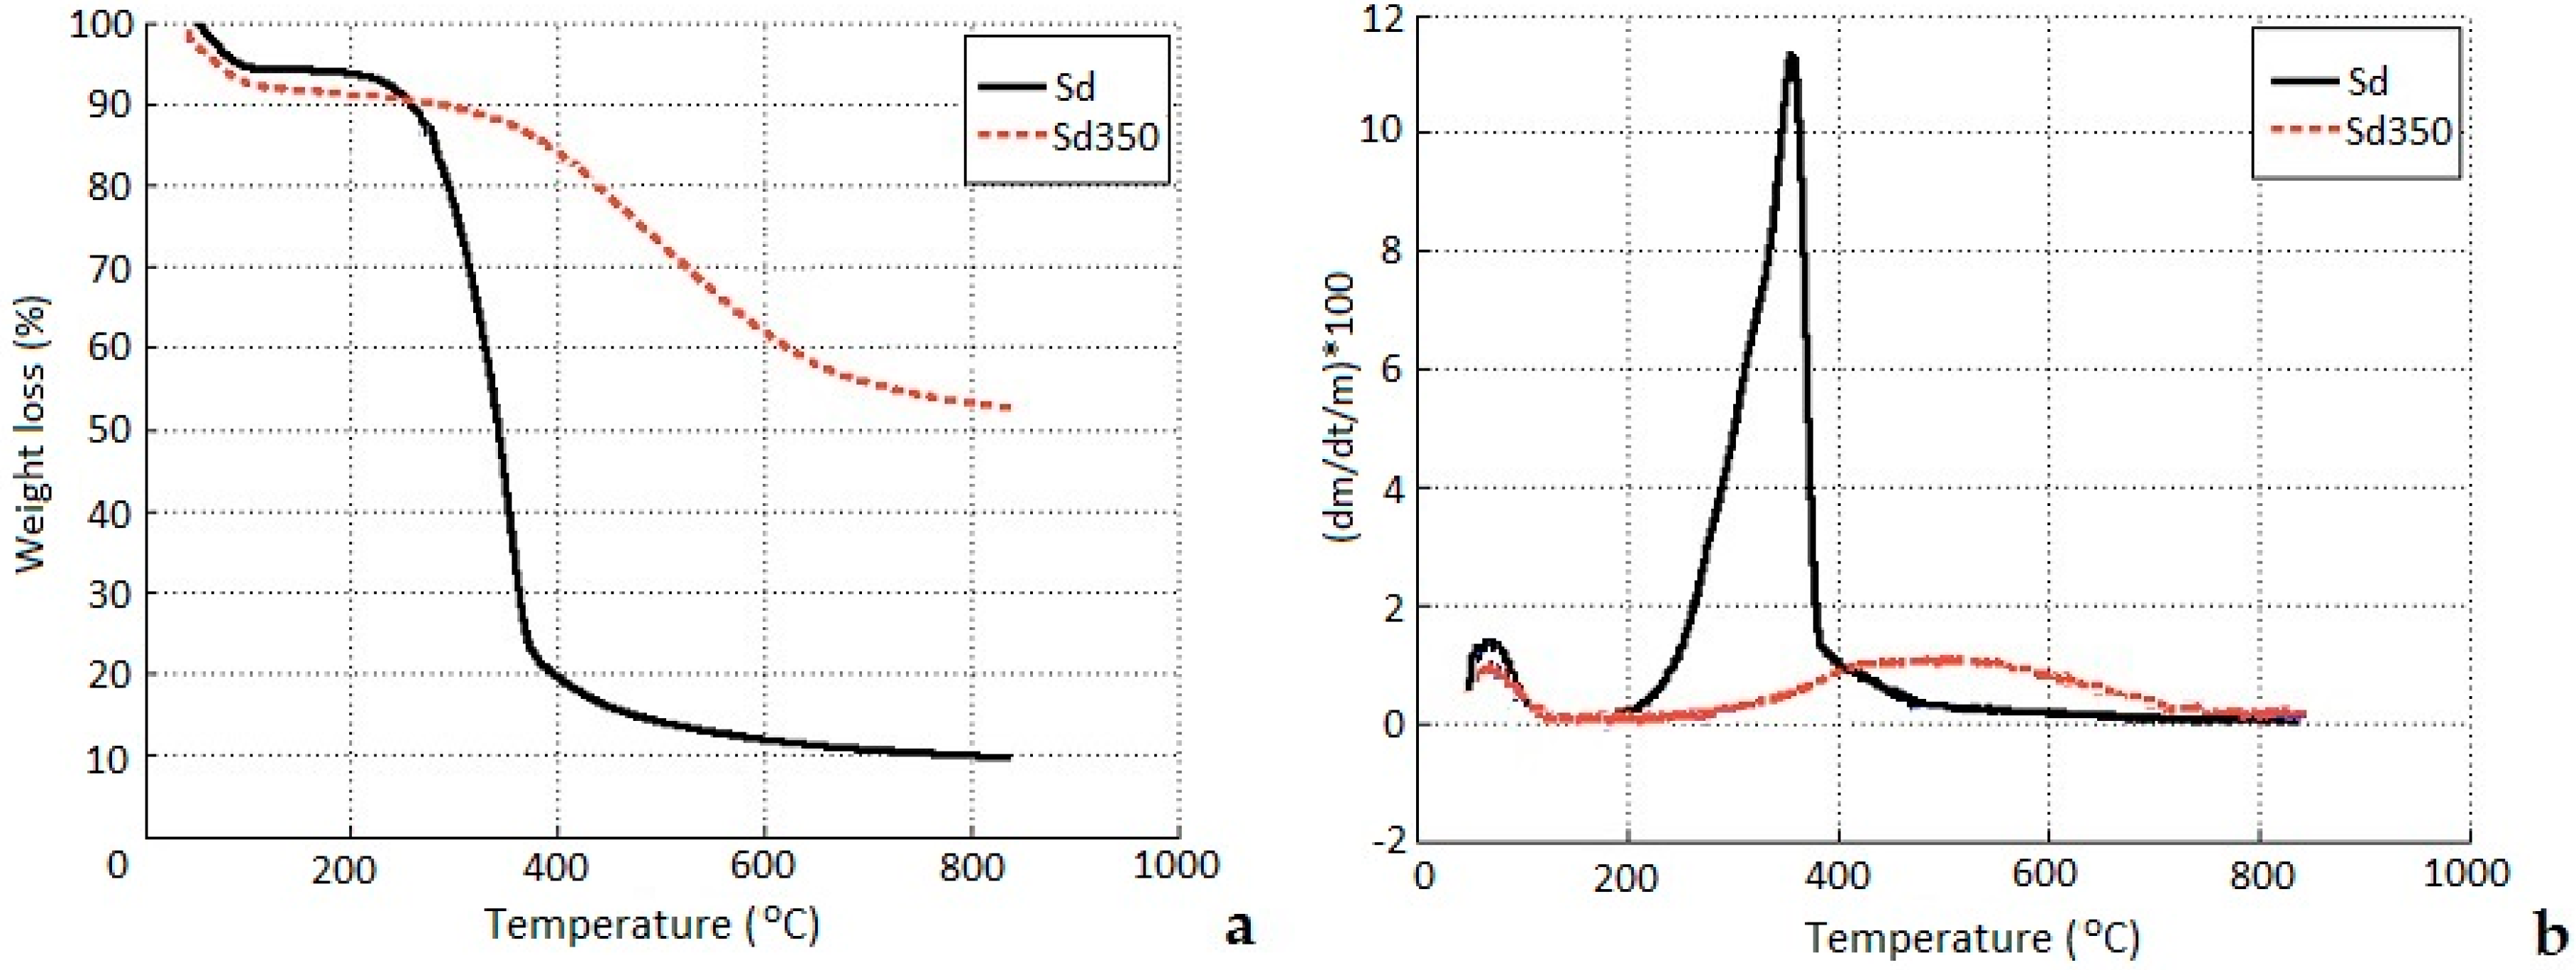
Figure 4.
FTIR spectra of Sd and biochar Sd350.
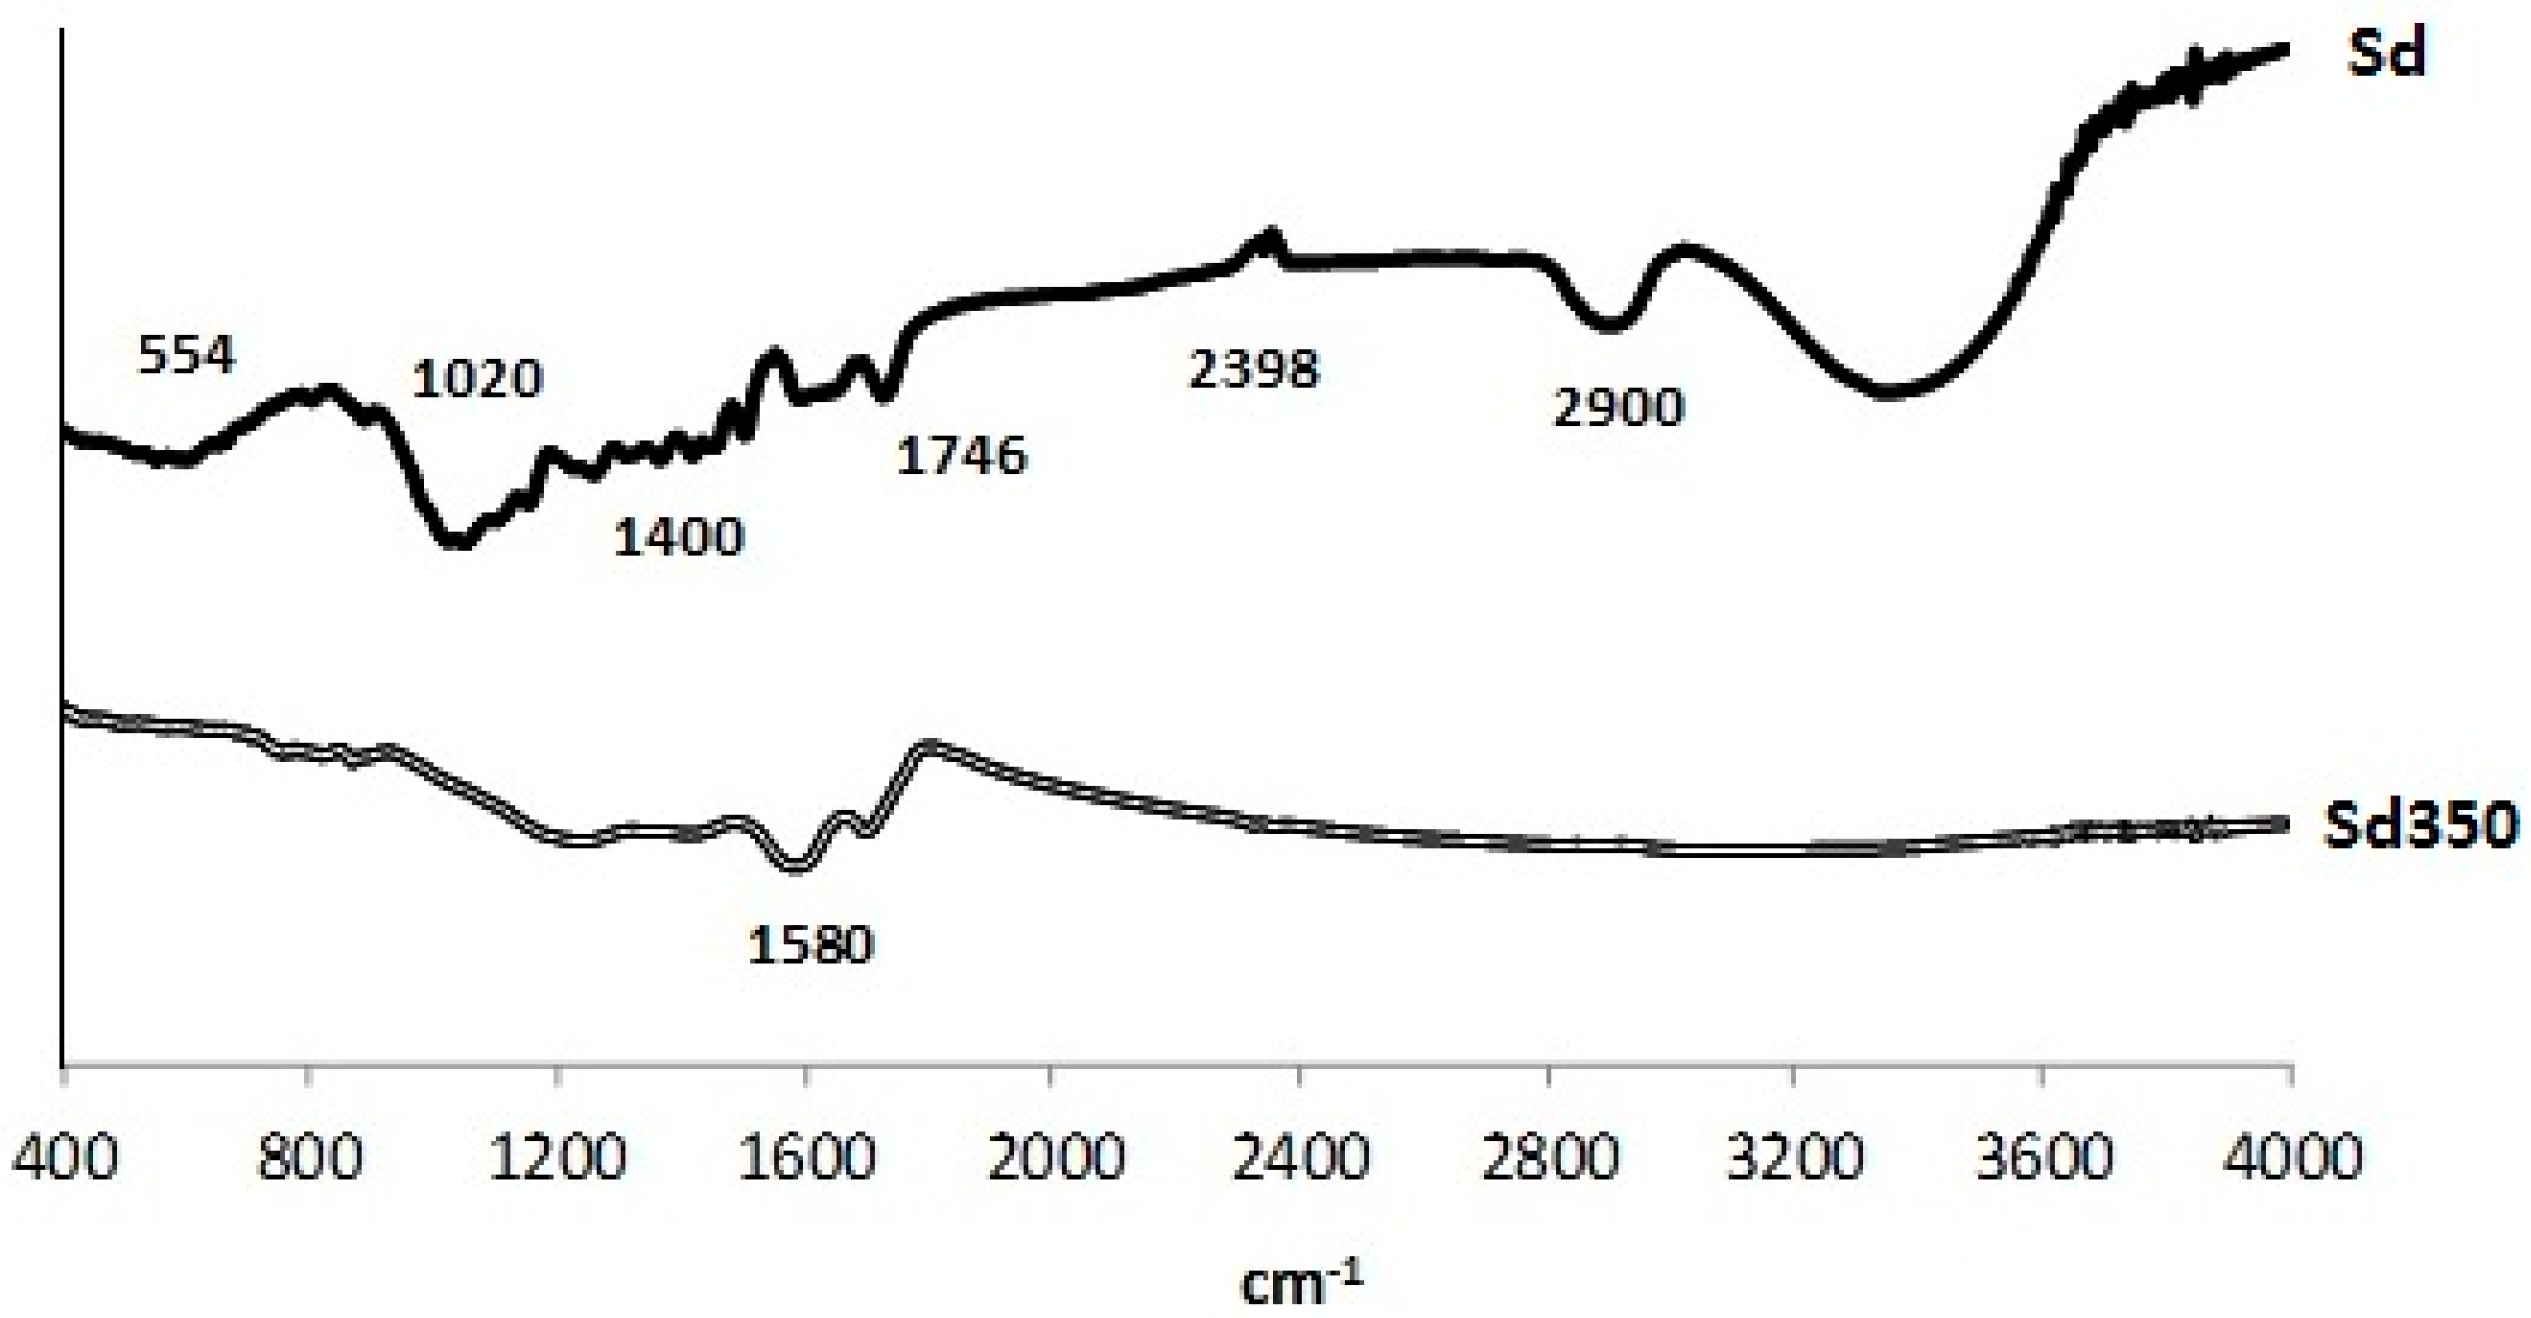
Figure 5.
PHREEQC-3 calculated speciation diagrams of (a) Nd; and (b) Sc in aqueous solutions as a function of pH.
Figure 5.
PHREEQC-3 calculated speciation diagrams of (a) Nd; and (b) Sc in aqueous solutions as a function of pH.

Figure 6.
PHREEC-3 calculated saturation index (SI) values of potential solubility-controlling phases as a function of pH for (a) Nd and (b) Sc.
Figure 6.
PHREEC-3 calculated saturation index (SI) values of potential solubility-controlling phases as a function of pH for (a) Nd and (b) Sc.
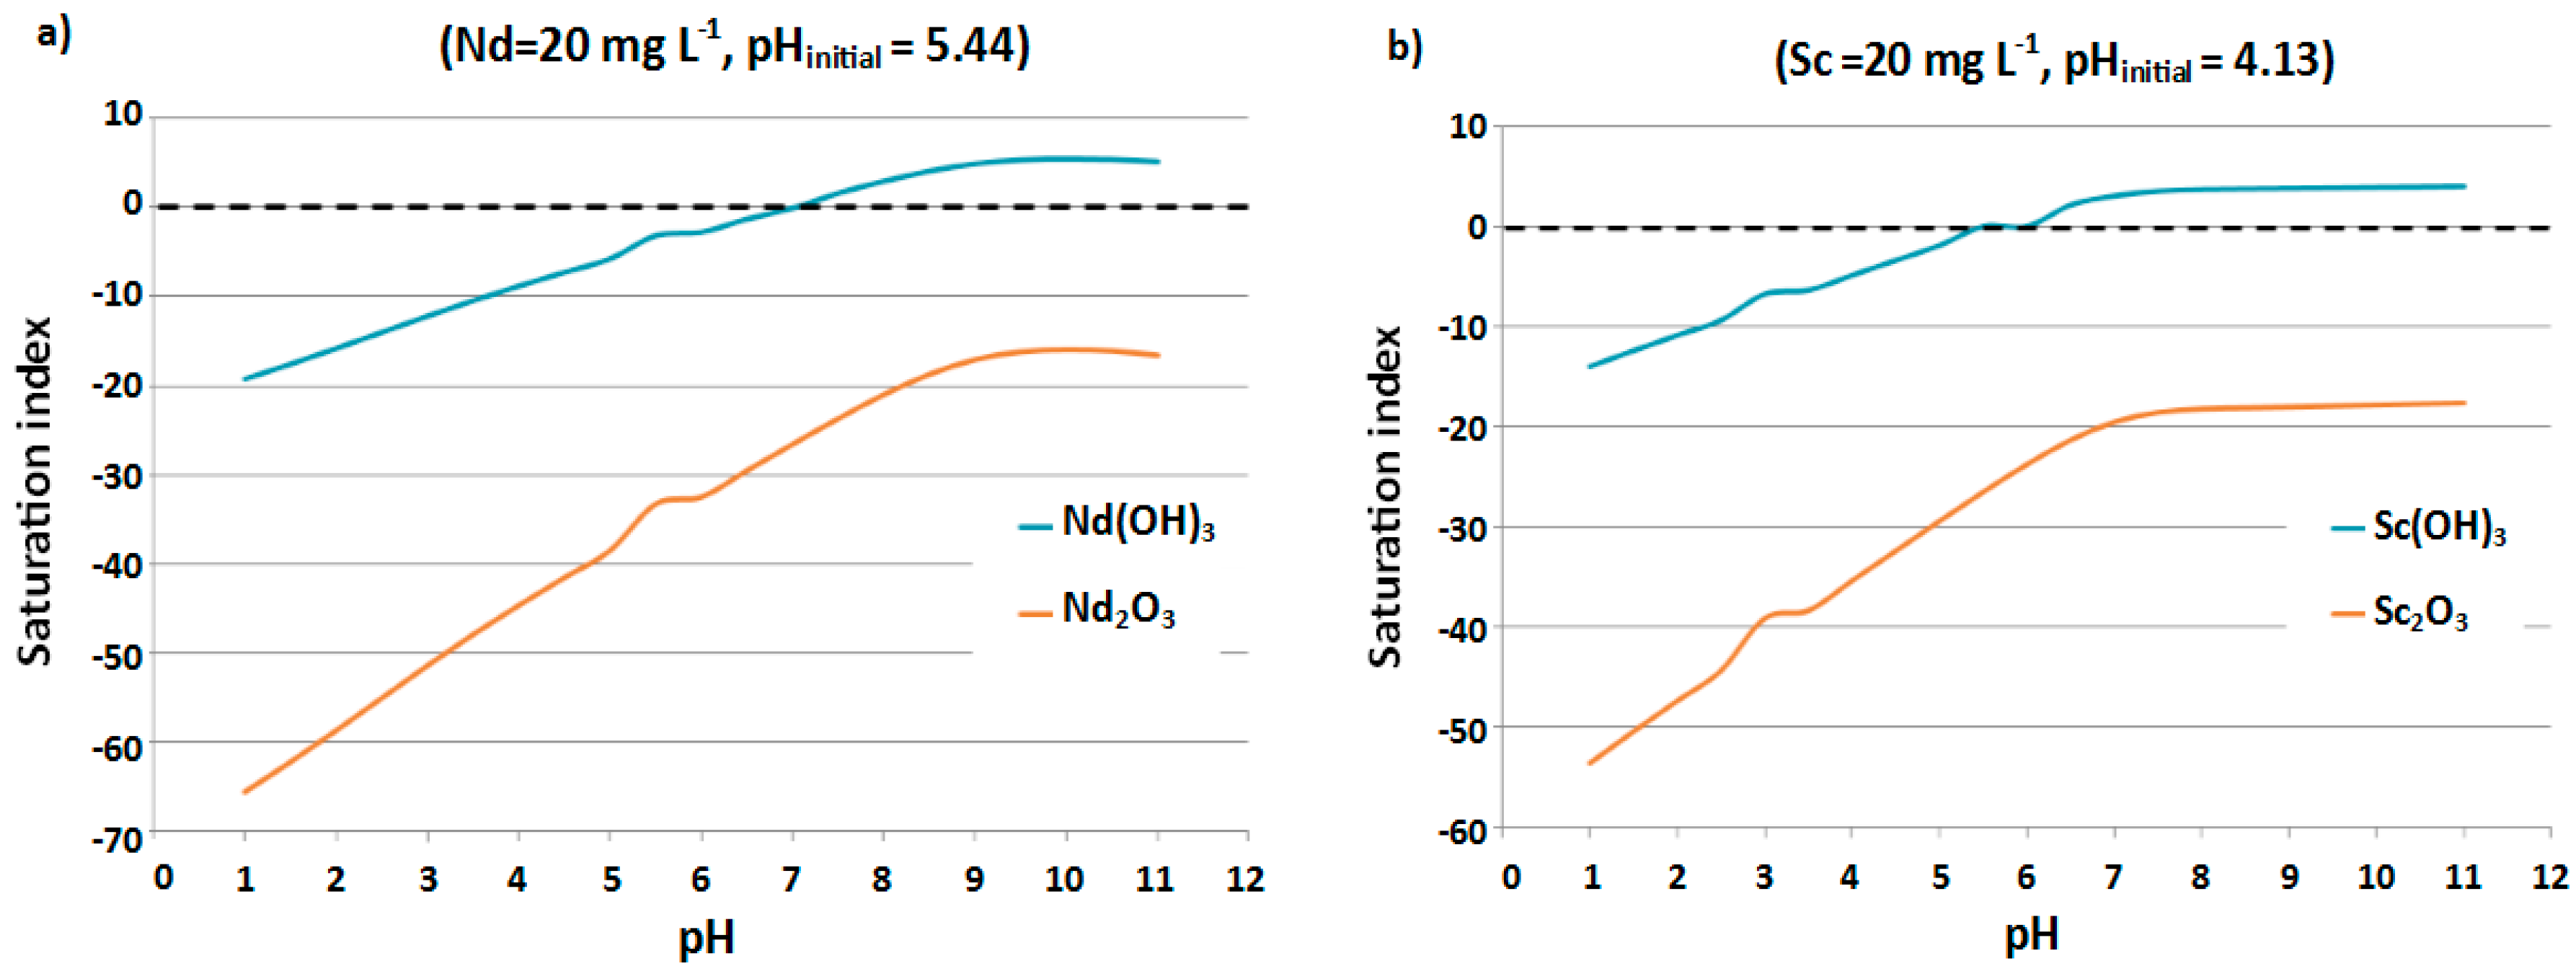
Figure 7.
SEM micrographs at 2000× and corresponding EDS spectra of Sd350 biochar after Nd (a,b) and Sc (c,d) adsorption, respectively.
Figure 7.
SEM micrographs at 2000× and corresponding EDS spectra of Sd350 biochar after Nd (a,b) and Sc (c,d) adsorption, respectively.

Figure 8.
SEM micrographs at 2000× and corresponding EDS spectra of AC after Nd (a,b) and Sc (c,d) adsorption, respectively.
Figure 8.
SEM micrographs at 2000× and corresponding EDS spectra of AC after Nd (a,b) and Sc (c,d) adsorption, respectively.

Figure 9.
Freundlich isotherms for Nd and Sc adsorption on biochar Sd350 (a,b) and AC (c,d).

Figure 10.
Langmuir isotherms for Nd and Sc adsorption on biochar Sd350 (a,b) and AC (c,d).


Table 1.
Characterization of the raw materials and biochar sawdust subjected to slow pyrolysis at 350 °C (Sd350). AC, activated carbon; EC, electrical conductivity; VM, volatile matter; FC, fixed carbon.
Table 1.
Characterization of the raw materials and biochar sawdust subjected to slow pyrolysis at 350 °C (Sd350). AC, activated carbon; EC, electrical conductivity; VM, volatile matter; FC, fixed carbon.
| Parameter | Sd | Sd350 | AC |
|---|---|---|---|
| yP, % | - | 30.20 | - |
| pH | 5.4 | 3.7 | 10.2 |
| EC, mS·cm−1 | 0.34 | 0.24 | - |
| Surface area, m2·g−1 | - | 4.71 | 912.10 |
| Porosity, % | 10.4 | 20.41 | - |
| VM, % | 87.9 | 42.11 | - |
| Char, % | 12.1 | 54.17 | - |
| FC, % | 10.5 | 52.46 | - |
| Ash, % | 1.6 | 1.71 | - |
| % C | 46.7 | 62.23 | 78.91 |
| % H | 5.8 | 2.24 | - |
| % N | 0.51 | 0.34 | - |
| % O | 47 | 35.19 | - |
Table 2.
Parameters of the pseudo-first and pseudo-second order of Lagergren kinetic models for Sc and Nd adsorption on biochar Sd350 and activated carbon (AC).
Table 2.
Parameters of the pseudo-first and pseudo-second order of Lagergren kinetic models for Sc and Nd adsorption on biochar Sd350 and activated carbon (AC).
| Adsorbent-REE | Pseudo-First Order | Pseudo-Second Order | ||||
|---|---|---|---|---|---|---|
| k1 (min−1) | qe (mg·g−1) | R2 | k2 (g·mg−1·min−1) | qe (mg·g−1) | R2 | |
| Sd350-Sc | 0.287 | 0.361 | 0.989 | 2.723 | 1.059 | 0.999 |
| AC-Sc | 0.519 | 0.166 | 0.774 | 13.799 | 1.539 | 0.999 |
| Sd350-Nd | 0.187 | 0.688 | 0.991 | 0.875 | 1.611 | 0.999 |
| AC-Nd | 0.179 | 0.331 | 0.719 | 2.258 | 1.772 | 1.000 |
Table 3.
% Sc and Nd adsorption (initial concentration 20 mg·L−1) on biochar Sd350 and AC for different adsorbent concentrations (1–10 g·L−1).
Table 3.
% Sc and Nd adsorption (initial concentration 20 mg·L−1) on biochar Sd350 and AC for different adsorbent concentrations (1–10 g·L−1).
| Adsorbent | Adsorbent Conc. (g·L−1) | % Nd Adsorbed | Nd Adsorption Rate (mg·g−1) | % Sc Adsorbed | Sc Adsorption Rate (mg·g−1) |
|---|---|---|---|---|---|
| Sd350 | 1 | 40.2 | 8.0 | 37.9 | 7.5 |
| 2 | 47.1 | 4.7 | 39.7 | 4.0 | |
| 5 | 61.5 | 2.5 | 47.9 | 1.9 | |
| 10 | 78.6 | 1.6 | 52.3 | 1.1 | |
| AC | 1 | 44.2 | 8.8 | 42.6 | 8.5 |
| 2 | 55.0 | 5.5 | 46.3 | 4.6 | |
| 5 | 68.5 | 2.7 | 62.0 | 2.5 | |
| 10 | 87.9 | 1.8 | 76.8 | 1.5 |
Table 4.
(kJ·mol−1) values of adsorption of REEs on Sd350 and AC.
| Adsorbent | Nd | Sc |
|---|---|---|
| Sd350 | −3.23 | −0.23 |
| AC | −4.92 | −2.96 |
© 2017 by the authors. Licensee MDPI, Basel, Switzerland. This article is an open access article distributed under the terms and conditions of the Creative Commons Attribution (CC BY) license (http://creativecommons.org/licenses/by/4.0/).
Share and Cite
MDPI and ACS Style
Komnitsas, K.; Zaharaki, D.; Bartzas, G.; Alevizos, G. Adsorption of Scandium and Neodymium on Biochar Derived after Low-Temperature Pyrolysis of Sawdust. Minerals 2017, 7, 200. https://doi.org/10.3390/min7100200
AMA Style
Komnitsas K, Zaharaki D, Bartzas G, Alevizos G. Adsorption of Scandium and Neodymium on Biochar Derived after Low-Temperature Pyrolysis of Sawdust. Minerals. 2017; 7(10):200. https://doi.org/10.3390/min7100200
Chicago/Turabian StyleKomnitsas, Konstantinos, Dimitra Zaharaki, Georgios Bartzas, and Georgios Alevizos. 2017. "Adsorption of Scandium and Neodymium on Biochar Derived after Low-Temperature Pyrolysis of Sawdust" Minerals 7, no. 10: 200. https://doi.org/10.3390/min7100200
Note that from the first issue of 2016, this journal uses article numbers instead of page numbers. See further details here.