Stress Ratios in Entire Mine Stopes with Cohesionless Backfill: A Numerical Study


1
School of Architecture and Civil Engineering, Xi′an University of Science and Technology, 58 Yanta Rd., Xi′an 710054, China
2
Research Institute on Mines and Environment, Department of Civil, Geological and Mining Engineering, École Polytechnique de Montréal, C.P. 6079, Succursale Centre-Ville, Montréal, QC H3C 3A7, Canada
*
Author to whom correspondence should be addressed.
Minerals 2017, 7(10), 201; https://doi.org/10.3390/min7100201
Submission received: 20 September 2017
/
Revised: 15 October 2017
/
Accepted: 17 October 2017
/
Published: 20 October 2017
Abstract
:Evaluation of stress states in backfilled mine stopes (or similar openings), using arching theory, can be largely impacted by the value selected for the earth pressure coefficient, K = σ′h/σ′v. Recently, the current study’s authors addressed the debate about the value of K near the opening center, based on Rankine’s active coefficient (Ka) and at-rest coefficient (K0). Here, stress ratios in vertical backfilled stopes are numerically assessed (in two dimension, 2D), considering both the independent and related backfill internal friction angle (ϕ′) and Poisson’s ratio (ν). Emphasis is placed on the backfill state near stope walls, where local rotation of stresses occurs, so the coefficient (K) and principal stress ratio, Kps (= σ′3/σ′1), should be distinguished. Parametric analyses indicate that values of K and Kps depend on the position and the relationship between ϕ′ and ν. Near the opening center, K (= Kps) is close to Ka when ν or ϕ′ is below a critical value; otherwise the value approaches K0, defined from ν. Near both walls, Kps is always close to Ka, while K is near K0 for related ν − ϕ′ cases and depends on their respective values for independent ν and ϕ′. Additional simulations conducted with interface elements indicate that the stress ratios near the opening center line are insensitive to interface roughness and are almost identical to values obtained without interfaces, but the stress ratios near walls may change for less rough or smooth interfaces.
1. Introduction
Backfilling mine wastes into stopes has become a common practice in underground mines worldwide [1,2,3]. The stress state in backfilled stopes is critical for the design of mine backfill and its retaining structures [4,5,6,7]. Arching theory has been commonly used to evaluate the stress state in backfilled mine stopes and various similar openings (silo, trench) [8,9,10,11]. The vertical (σ′v) and horizontal (σ′h) effective stresses in two-dimensional backfilled openings with cohesionless fills are often estimated from the following arching solution based on [9]:
where γ (kN/m3) is the backfill unit weight; B (m) is the opening width; h (m) is the depth from the backfill surface; δ′ (°) is the interface effective friction angle along the fill-wall contact, and its value is commonly taken as the backfill effective friction angle ϕ′ (°) for very rough and stiff rock surfaces; K (= σ′h/σ′v) is the earth pressure coefficient, defined as the stress ratio of the horizontal over vertical effective stresses. In geotechnical engineering, the value of K is commonly related to the movement of the retaining wall. When the retaining wall moves away enough due to the pressure from the retained soil, the horizontal stress can decrease as the soil tends to yield. The ratio of the horizontal to vertical stresses may then correspond to the Rankine’s active earth pressure coefficient (Ka), defined as follows for cohesionless soils with a horizontal surface and smooth walls:
If the retaining wall does not move, the semi-infinite soil is considered to remain in an at-rest (K0) state. The value of K is then usually estimated from the well-known Jaky’s semi-empirical equation, expressed as follows for loose granular soils [12,13]:
The value of K0 has also been related to Poisson’s ratio (ν), based on Hooke’s law applied to a semi-infinite isotropic, homogenous and linear elastic mass [14,15,16]:
Considering a unique and consistent value of K0, the two different definitions of K0 (Equations (4) and (5)) lead to the following relationship for elastoplastic models [17,18,19,20]:
The stresses in backfilled openings calculated with Equations (1) and (2) can be significantly influenced by the value of the earth pressure coefficient K [10,21,22]. Near the center of a vertical backfilled mine stope, the K value has sometimes been associated with the at-rest earth pressure coefficient K0 [23,24,25,26,27], whereas others have stated that the Rankine’s active earth pressure coefficient Ka is more representative [21,22,28,29,30]. Recently, Yang [31] performed numerical simulations to help clarify this debated issue. It was found that near the opening center, the coefficient K could be either represented by Ka or K0, depending on the values of the backfill Poisson’s ratio (ν) and internal friction angle (ϕ′) and their mutual relationship. The dependency mechanism of the backfill state near the opening center was further analyzed by Yang [31], considering linear elasticity and yielding of the backfill based on the commonly used Mohr-Coulomb elasto-plastic model. Jahanbakhshzadeh et al. [32] investigated the non-uniform distribution of K in inclined backfilled stopes using the related backfill parameters, ν and ϕ′.
In previous studies, the stress ratio, K, has not been investigated in detail for locations near the opening walls, where the backfill state could be of particular interest for mining engineers. As the stresses are not uniform across the stope width [33,34], due to shear stresses developing between the fill and walls, applying a constant K to the entire opening is not representative [20,32]. In addition, the value of the principal stress ratio, Kps (= σ′3/σ′1; defined as the ratio of the minor to major principal stresses) can differ from that of K near opening walls where the horizontal and vertical stresses may be different from the minor and major principal stresses. Therefore, there is a need to evaluate both stress ratios K and Kps near the walls, where rotating stresses may be of particular interest for stability and displacement analyses. Also, interface elements were not considered in the previous numerical simulations (mentioned above) when analyzing the value of K. This approach is valid for most backfilled stope cases, as yielding usually takes place in the fill material near very rough rock surfaces [11,35]. For planar and smooth interfaces, yielding may, however, occur along fill-rock contacts [36]. It is thus deemed necessary to take this aspect into account.
In this paper, the earth pressure coefficient (K) and the principal stress ratio (Kps) in vertical openings with cohesionless fills are numerically analyzed. For the sake of completeness, the numerical results of the K value near the opening center are also briefly recalled. The focus is placed on the stress ratios K and Kps near the opening walls, considering both independent and related (through Equation (6)) values of ν and ϕ′ of backfill. A systematic parametric analysis is performed to assess the influence of various factors. The effect of fill-rock interfaces on the two stress ratios is also investigated.
2. Numerical Model
Previous investigations have shown that the finite difference code FLAC [37] can be used to help assess the behaviour of backfilled stopes [21,22,31,32,35,36,38,39,40]. Figure 1 shows the reference FLAC model of a backfilled opening under plane strain conditions. The width of the opening is denoted by B and the backfill is placed to a height (H) of 40 m (with the top surface left open). Elements of 0.2 m × 0.2 m are used for the backfill and radial meshes are used for the surrounding rock mass, based on sensitivity analyses (see details in [31]). The rock mass is modeled as a linear-elastic material; its mechanical properties are shown in Figure 1. The backfill obeys the Mohr-Coulomb criterion and elasto-plastic constitutive model; its dry unit weight (γ) is 18 kN/m3, effective cohesion (c′) is nil, and dilation angle (ψ) is 0° (non-associated flow rule). The backfill Young’s modulus (E), internal friction angle (ϕ′) and Poisson’s ratio (ν) are taken as variables.
Figure 1 also illustrates that the base of the modeled rock mass is fixed in all directions, while the two side outer boundaries are only allowed to move vertically. The vertical opening is created instantaneously and then backfilled in 40 layers (1 m/layer). The excavation-induced displacements are zeroed before backfilling, corresponding to the “delayed backfill” deposited after the entire stope is mined out (i.e., full convergence of the stiff rock walls) [39].
The program of calculations is given in detail in Table 1 for independent (Cases 0 to 5) and linked (Cases 0′ to 4′; through Equation (6)) values of ν and ϕ′, respectively. Interface elements between the backfill and the surrounding rock walls considered in Cases 5 and 4′ are characterized by the effective interface friction angle (δ′), and the normal (Kn) and shear (Kt) stiffnesses [37].
3. Numerical Results Obtained without Interface Elements
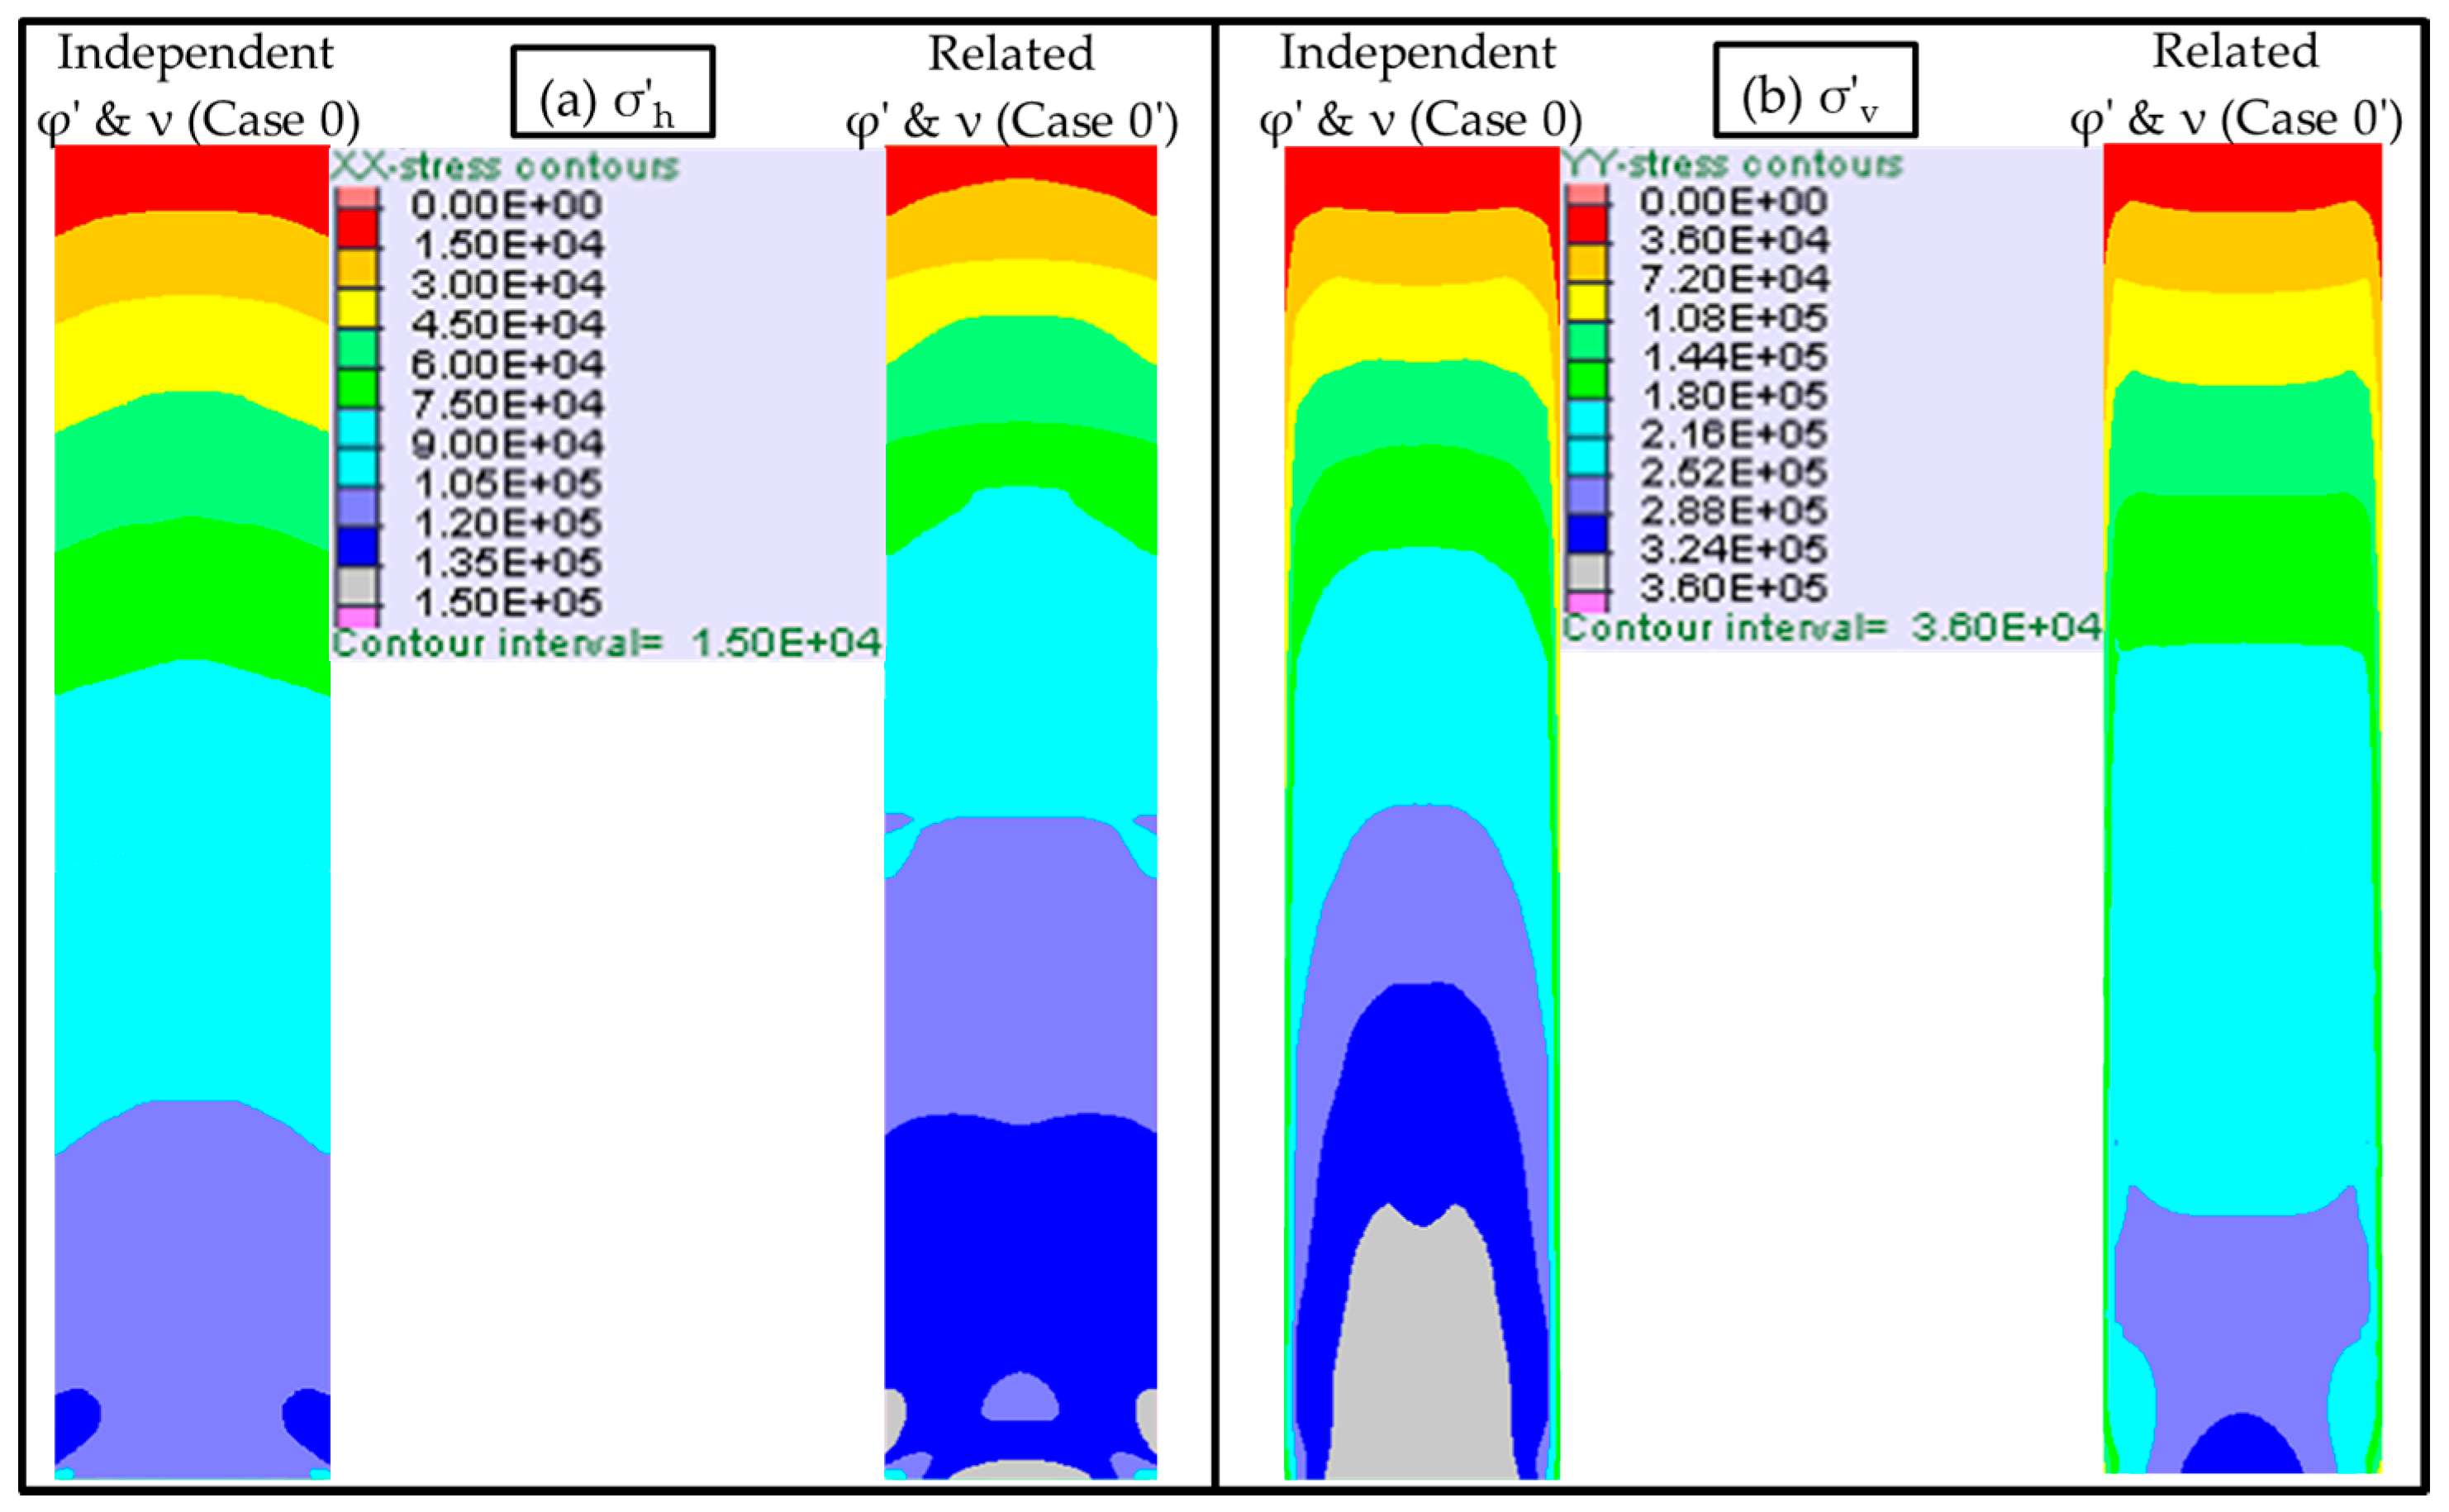
Figure 2 illustrates the stress contours obtained from FLAC simulations for independent (Case 0 in Table 1) and interrelated (Case 0′ in Table 1) values of ν and ϕ′. In FLAC, positive stresses indicate tension and negative stresses indicate compression by default. The signs of the stresses obtained from numerical modelling with FLAC were inversed to follow the sign convention (positive in compression and negative in tension) used in geotechnical engineering. The results show that an arching effect develops within the backfill for both cases (with σ′v smaller than the overburden at depth). A non-uniform distribution across the opening width is observed for both the vertical and horizontal stresses. At a given depth, it can be seen that the stresses near the walls were lower than those at the center. These indicate that the values of K along the vertical center line (VCL) and near rock walls (RW) could be different.
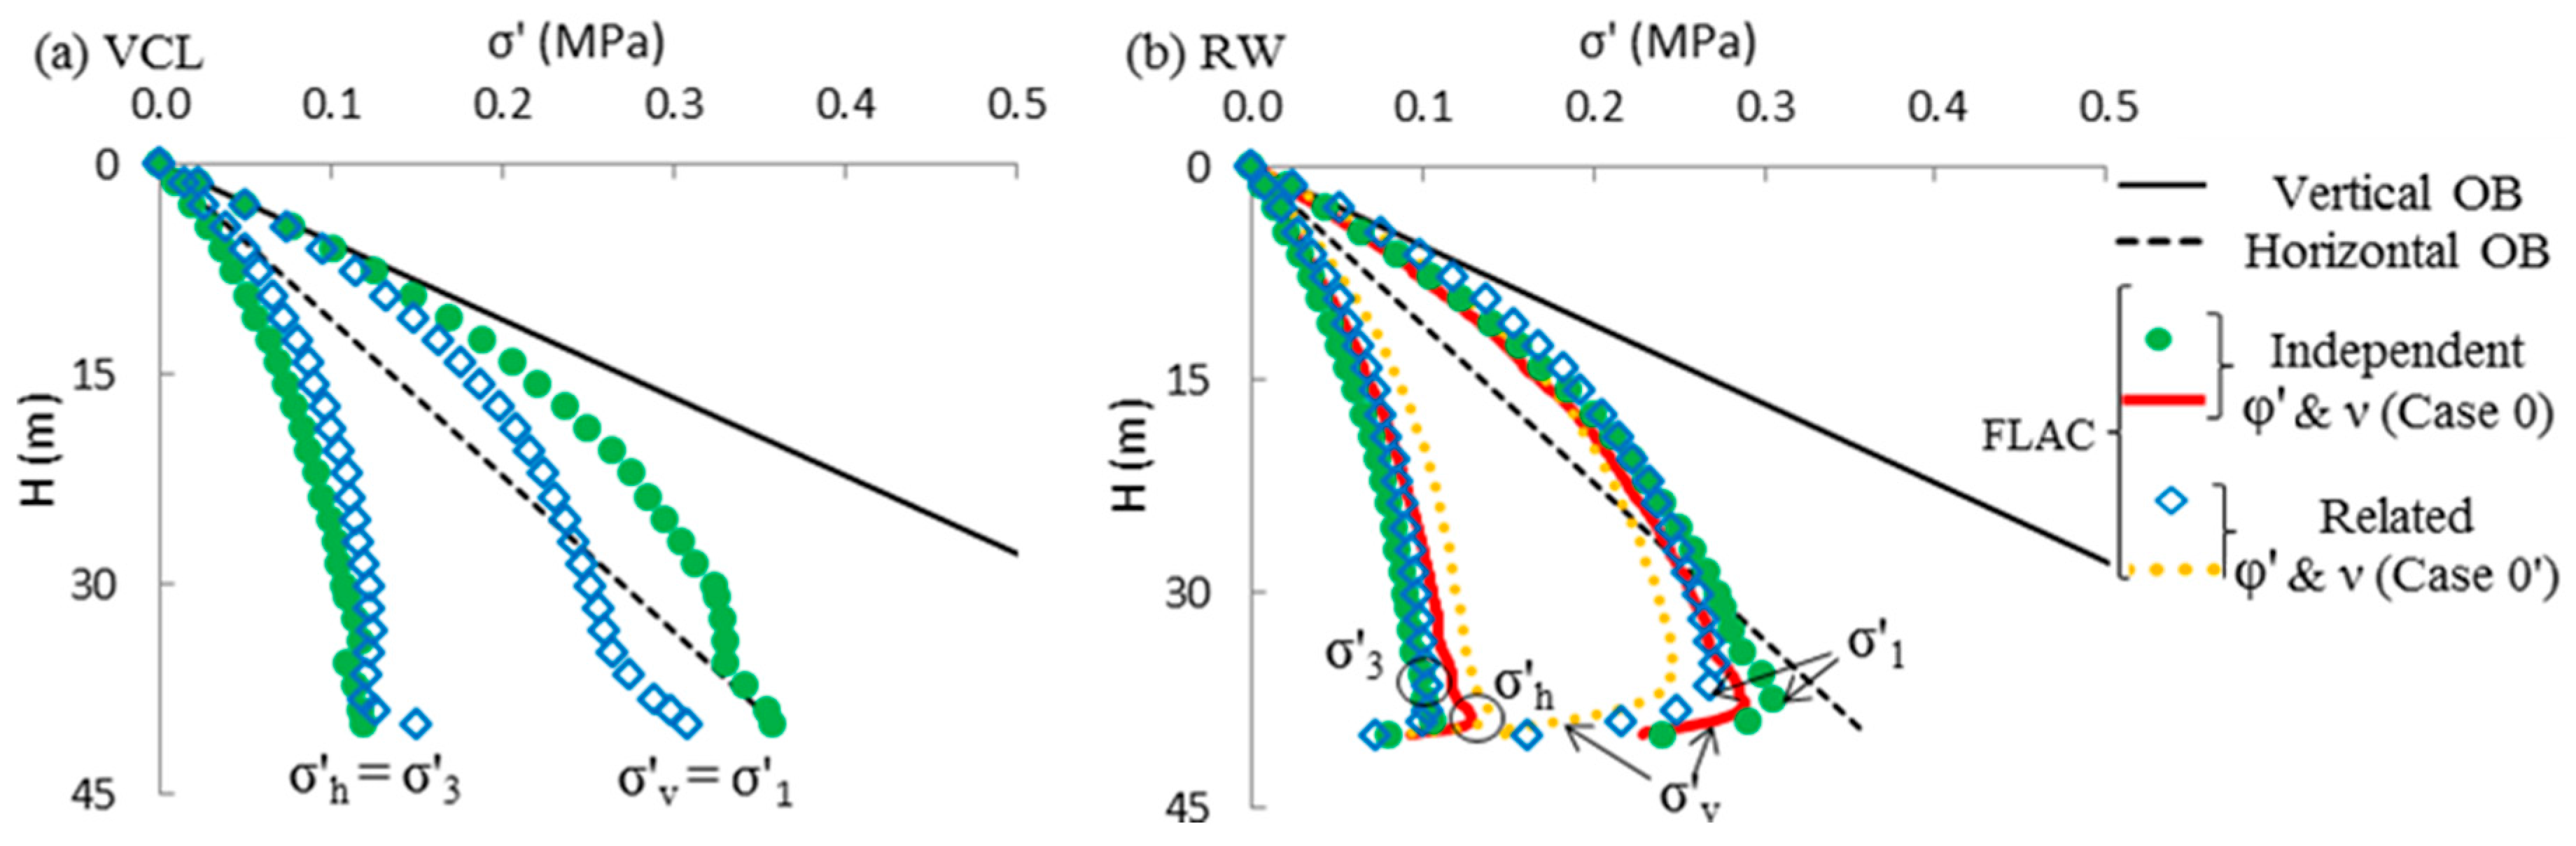
Figure 3a presents the stress distributions along the VCL in the backfilled stope for both Case 0 (independent ν and ϕ′; ν = 0.2, ϕ′ = 30°) and Case 0′ (related ν and ϕ′ through Equation (6); ν = 0.333 and ϕ′ = 30°); Figure 3b shows the principal (σ′1 and σ′3) stresses and horizontal (σ′h) and vertical (σ′v) stresses near the RW, respectively. The vertical and horizontal stresses due to overburden (OB) were also plotted, based on σ′v = γh and σ′h = (K0)ϕ′σ′v. The stresses along the RW correspond to a vertical line located at a distance of 0.2 m (one element size) from the rock. For both cases, Figure 3 shows that the values of σ′v and σ′h were significantly lower than those based on the OB, especially near the base of the backfilled opening.
Along the VCL of the two-dimensional opening, the major and minor principal stresses are the vertical and horizontal stresses, respectively. The principal stress ratio Kps (= σ′3/σ′1) is thus the same as the earth pressure coefficient K (= σ′h/σ′v).
For ϕ′ = 30°, when the value ν increases from 0.2 (Case 0, independent ν and ϕ′) to 0.333 (Case 0′, with Equation (6)), Figure 3a shows that the vertical principal stress (σ′v = σ′1) along the VCL tends to decrease significantly while the horizontal principal stress (σ′h = σ′3) slightly increases. Near the RW, the principal stresses and the vertical and horizontal stresses are nearly insensitive to the change of ν, except near the base of the opening, where the major principal stress (σ′1) and the vertical stress (σ′v) decrease slightly when ν goes from 0.2 to 0.333 (Figure 3b). These results tend to indicate that the two stress ratios (Kps and K) obtained from the two assumptions may differ somewhat. This effect is also illustrated in Figure 4, which shows that the values of Kps and K along the VCL (Figure 4a) and near the RW (Figure 4b) all increase when ν varies from 0.2 (Case 0) to 0.333 (Case 0′), with a larger variation along the VCL.
3.1. K = Kps along the Vertical Center Line (VCL)
Numerical results reported by Yang [31] indicated that the coefficient K (= Kps) along the VCL of backfilled openings is close to Ka when the backfill Poisson’s ratio is below a critical value defined from its internal friction angle ϕ′ (i.e., for ν ≤ (1 − sin ϕ′)/2), suggesting that the fill is yielding and approaching an active state near the opening center. Beyond this critical value (i.e., for ν > (1 – sin ϕ′)/2), the ratio K (= Kps) along the VCL becomes close to K0 defined from the Poisson’s ratio (Equation (5)). As a special case of the latter situation, with related ν and ϕ′ through Equation (6), ν = (1 − sin ϕ′)/(2 − sin ϕ′) is always larger than the critical value of ν (= (1 − sin ϕ′)/2) suggested by Yang [31]. The corresponding coefficient K (= Kps) along the VCL of backfilled stopes is thus close to K0 when this condition applies. These results have been explained by Yang [31] using the Mohr-Coulomb elasto-plastic model.
3.2. Kps and K near the Rock Wall (RW)
In this section, additional simulation results are presented to illustrate the effect of various parameters on stress ratios, K and Kps, near the RW of backfilled openings for different cases with independent and linked values of ν and ϕ′.
3.2.1. Independent ϕ′ and ν
Figure 5 shows the variations of Kps and K near the RW as a function of the opening width (B) (Figure 5a; Case 1) and backfill Young’s modulus (E) (Figure 5b; Case 2) for independent values of ϕ′ and ν. In both cases, it is seen that the values of Kps near the RW are close to Rankine’s active earth pressure coefficient Ka (Equation (3)) for changing values of B (from 4 to 20 m) and E (from 10 MPa to 1 GPa), except very near the surface and base of the opening. Figure 5 also indicates that the value of K (about 0.4) near the RW is between K0 and Ka for these ranges of B (4 to 20 m) and E (10 MPa to 1 GPa). These results indicate that the stress ratios (K and Kps) are almost unchanged by the variation of opening width and backfill Young’s modulus (for these conditions).
Figure 6 illustrates the vertical profiles of Kps (Figure 6a) and K (Figure 6b) near the RW for different values of ϕ′ with constant ν (Case 3). It can be observed from Figure 6a that the principal stress ratio Kps near the RW is always very close to Rankine’s coefficient (Ka) for ϕ′ increasing from 10° to 40°. Figure 6b shows that the K values near the RW stay close to Jaky’s K0 for ϕ′ = 10°. As the ϕ′ value increases, K tends to diverge from K0 and move towards Ka; K ≈ Ka when ϕ′ = 40°. It is also seen that the K value (about 0.4) near the RW is between K0 and Ka for ϕ′ = 30°, as shown above in Case 1 (Figure 5a) and Case 2 (Figure 5b).
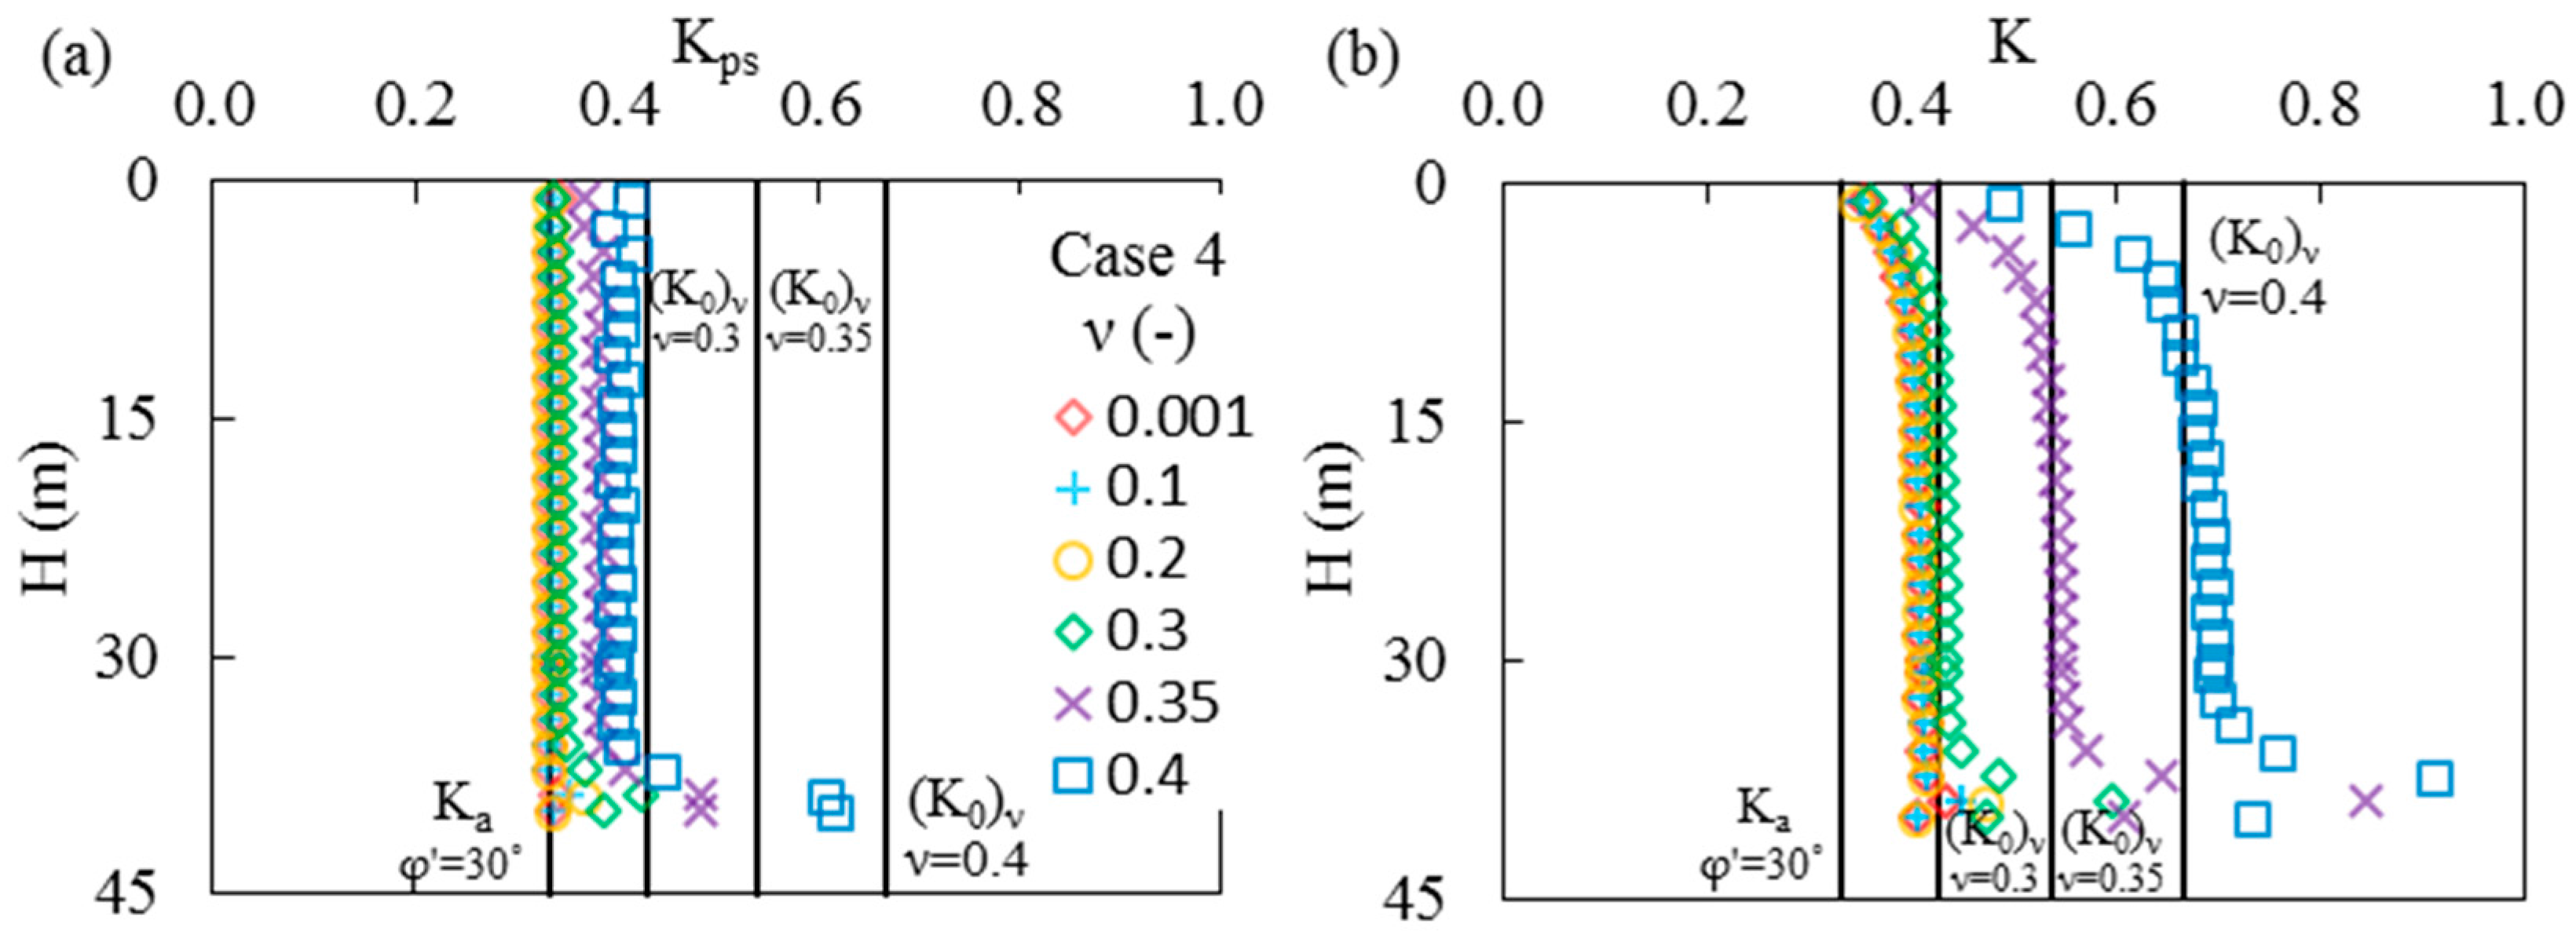
Figure 7 shows the variations of Kps (Figure 7a) and K (Figure 7b) near the RW for different values of Poisson’s ratio ν (constant ϕ′ = 30°; Case 4). It can be seen from Figure 7a that the values of principal stress ratio Kps near the RW are almost constant and close to Ka for ν ≤ 0.3. These values are similar to those of Kps near the RW in Cases 1 to 3 (with ν = 0.2) presented above. The Kps values slightly increase (but stay close to Ka) for ν > 0.3. The value of K near the RW shown in Figure 7b indicates that it remains nearly constant for ν ≤ 0.3 and close to (K0)ν obtained with ν = 0.3. When ν is above 0.3, the K values tend to increase and can be estimated by (K0)ν, except very near the surface and base of the opening.
3.2.2. Related ϕ′ and ν
In the case of related values of ν and ϕ′ (through Equation (6)), the values of the at-rest earth pressure coefficient K0 estimated from the angle ϕ′ (Equation (4)) and Poisson’s ratio ν (Equation (5)) are unique and consistent.
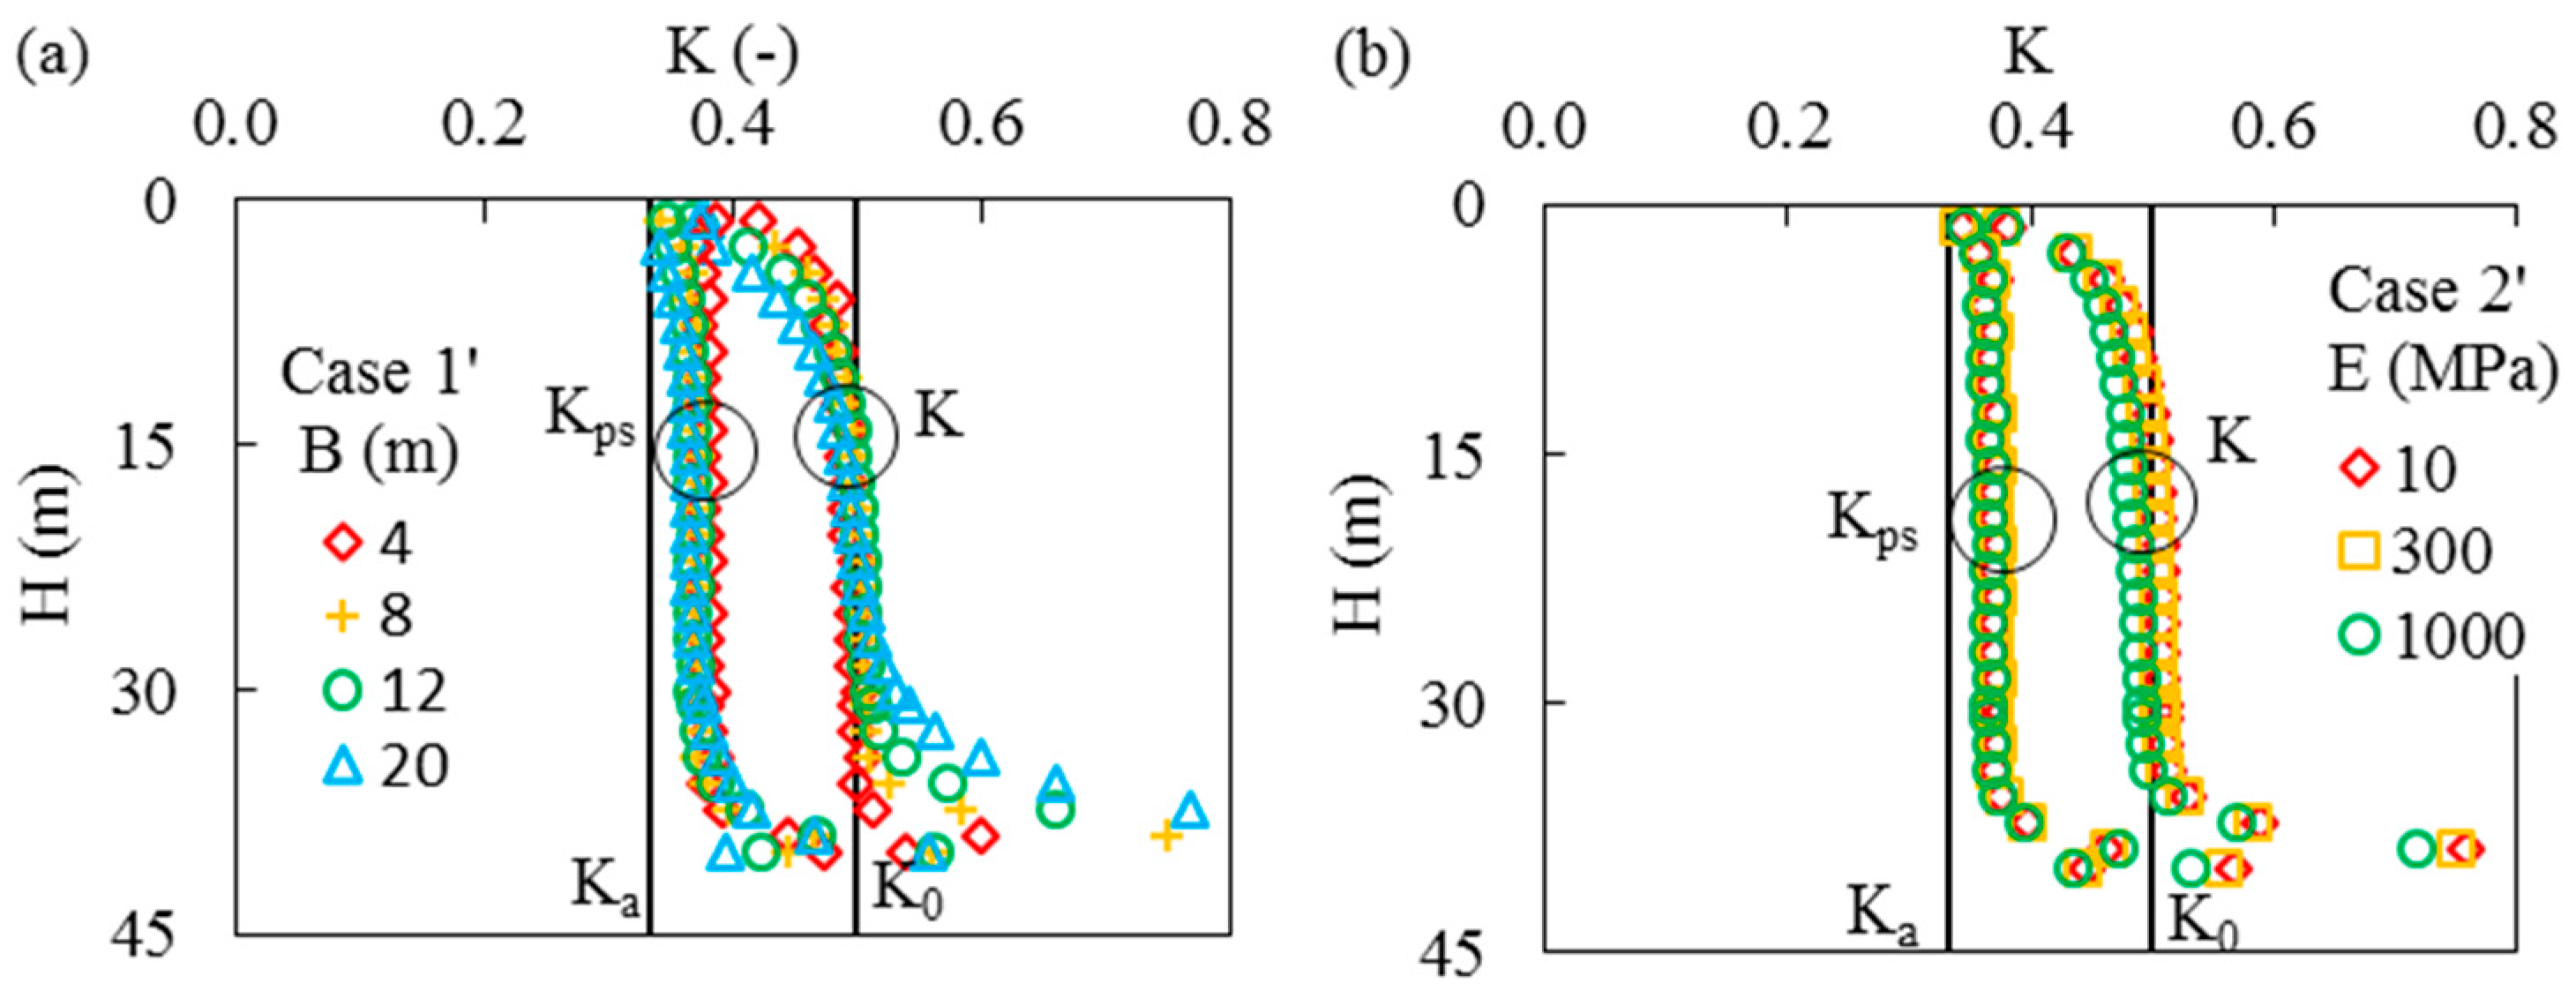
Figure 8 illustrates the vertical profiles of K and Kps near the RW for different values of opening width (B) (Figure 8a; Case 1′) and backfill Young’s modulus (E) (Figure 8b; Case 2′) when ϕ′ and ν are connected (Equation (6)). As B increases from 4 to 20 m, Figure 8a shows that the values of K near the RW are close to the at-rest earth pressure coefficient K0 while those of Kps are close to Rankine’s coefficient Ka, except very near the opening surface and base. The K values near the RW (Figure 8b) are almost superposed with K0 when the value of E varies from 10 MPa to 1 GPa. The Kps near the RW is close to Ka, as shown in Figure 8b. These results indicate that the opening width and Young’s modulus have little effect on the earth pressure coefficient and principal stress ratio for the investigated ranges.
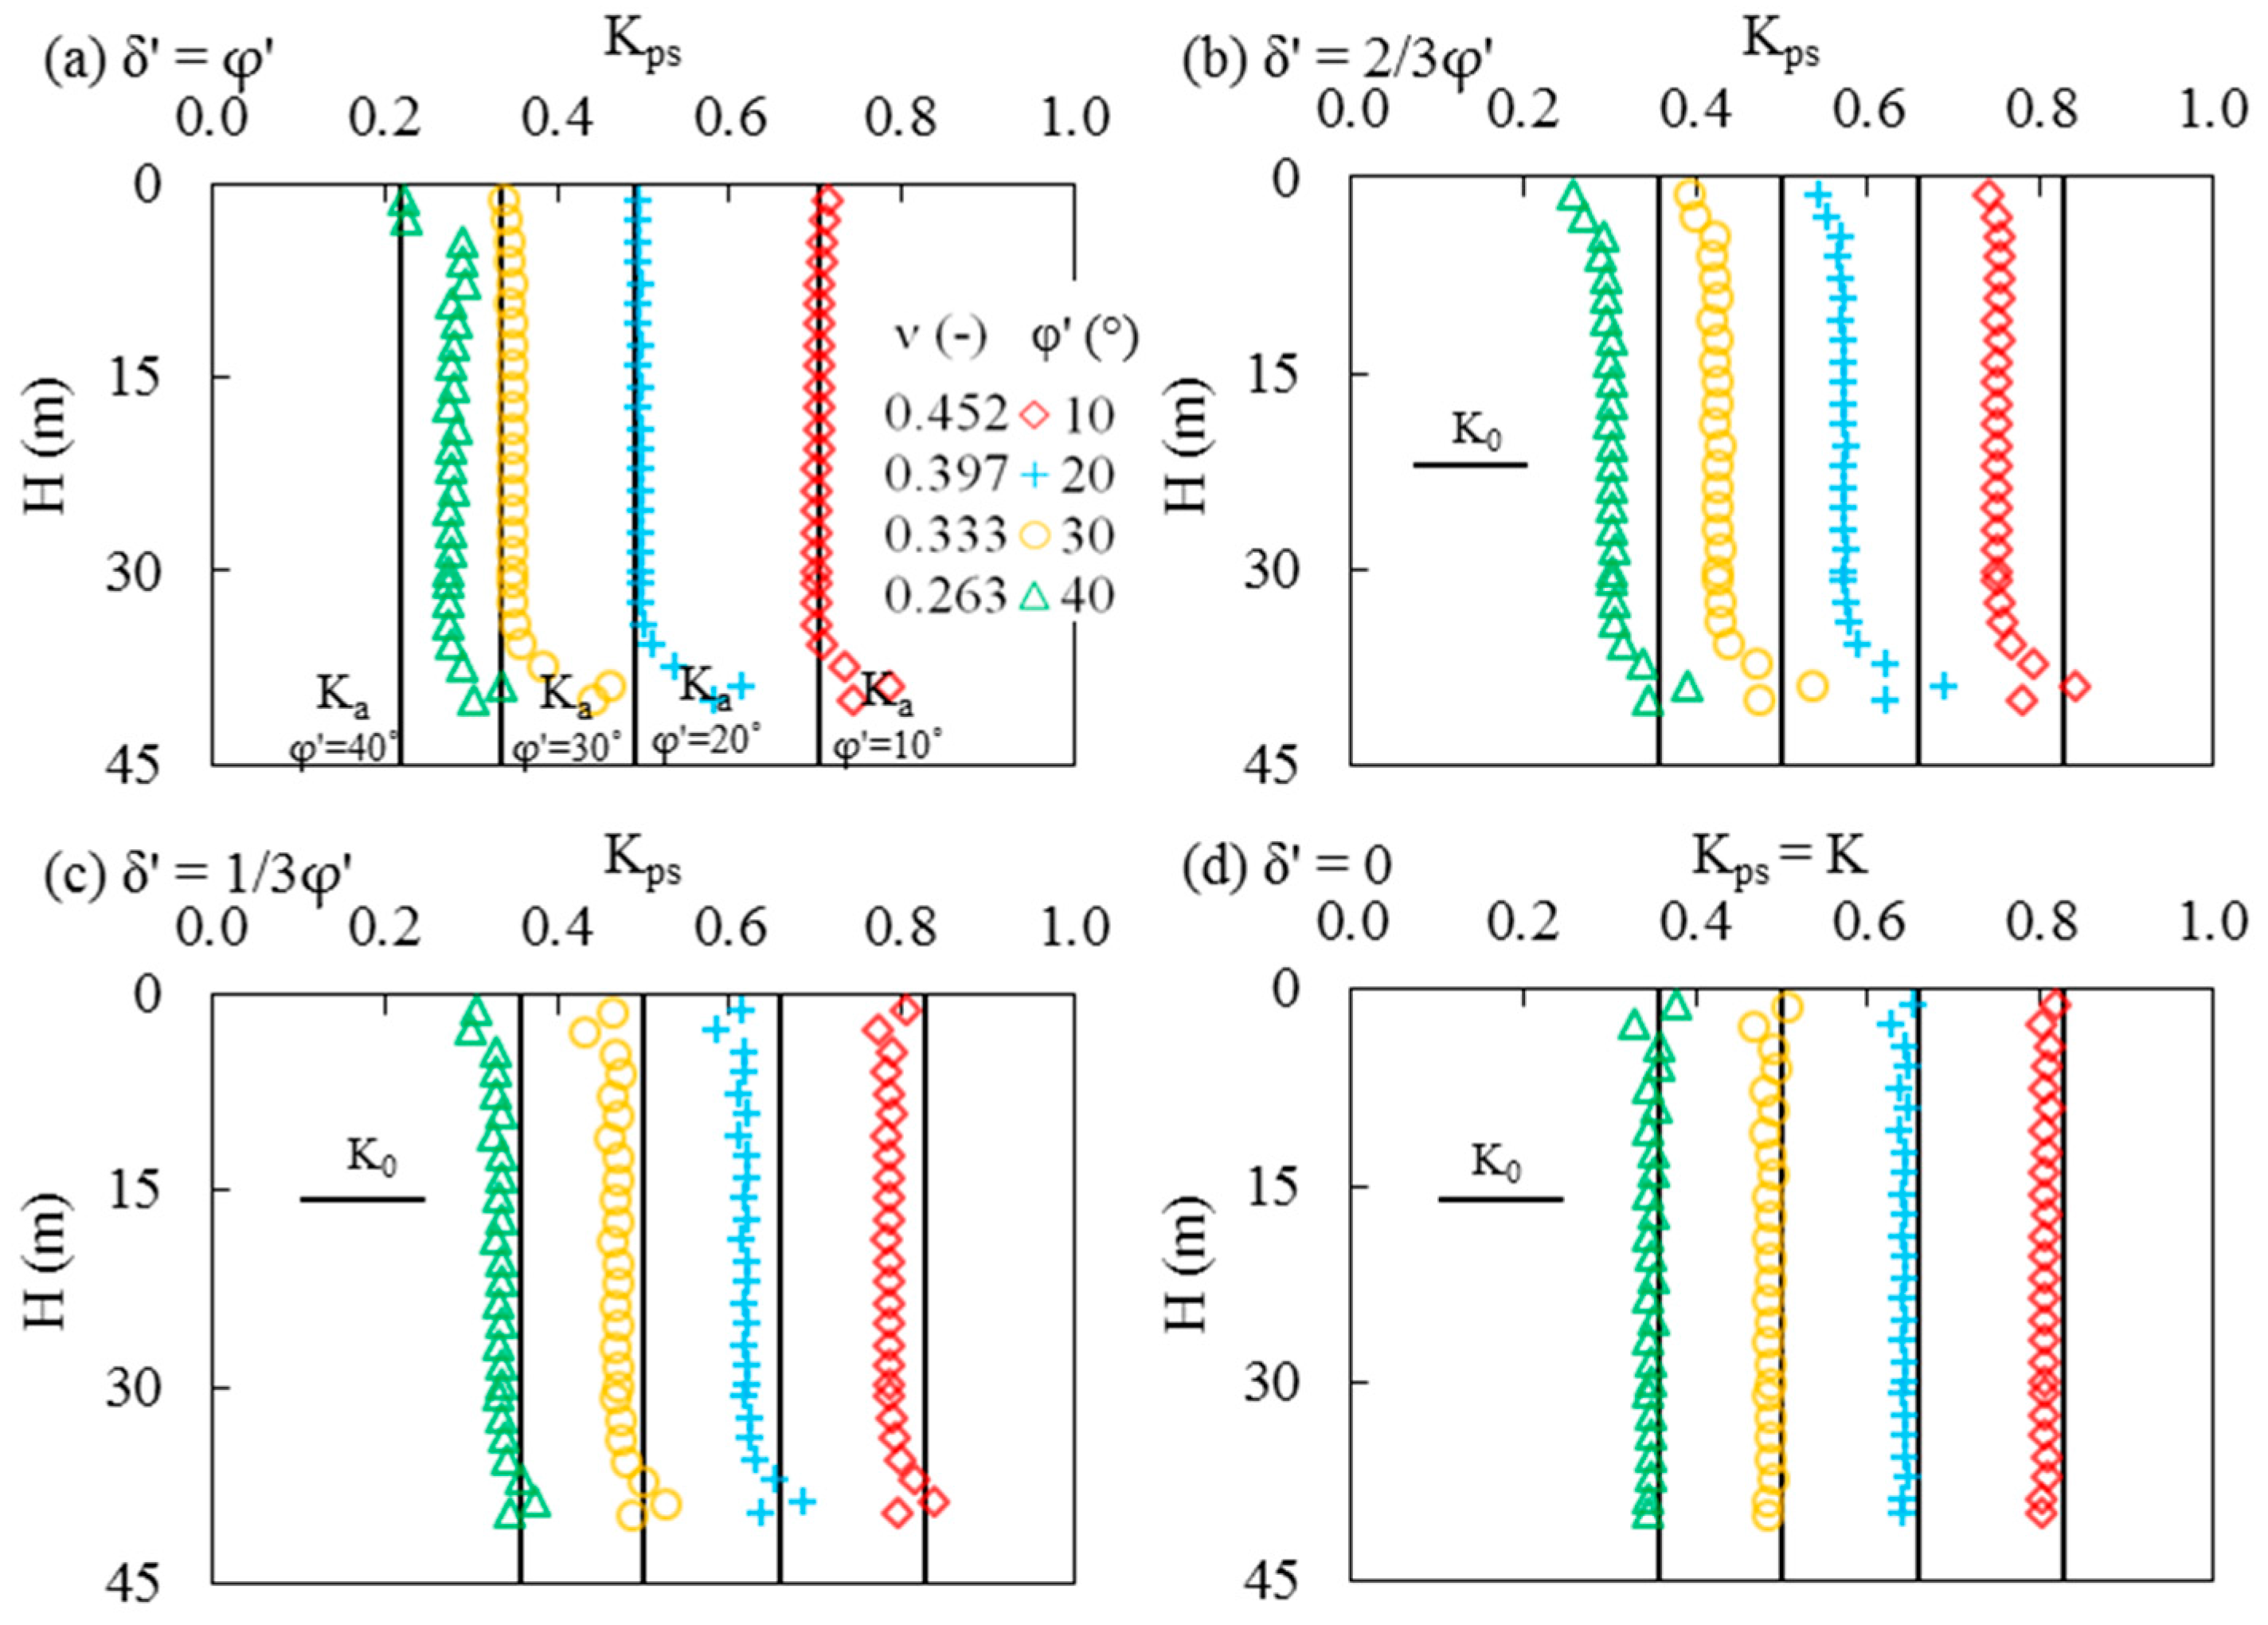
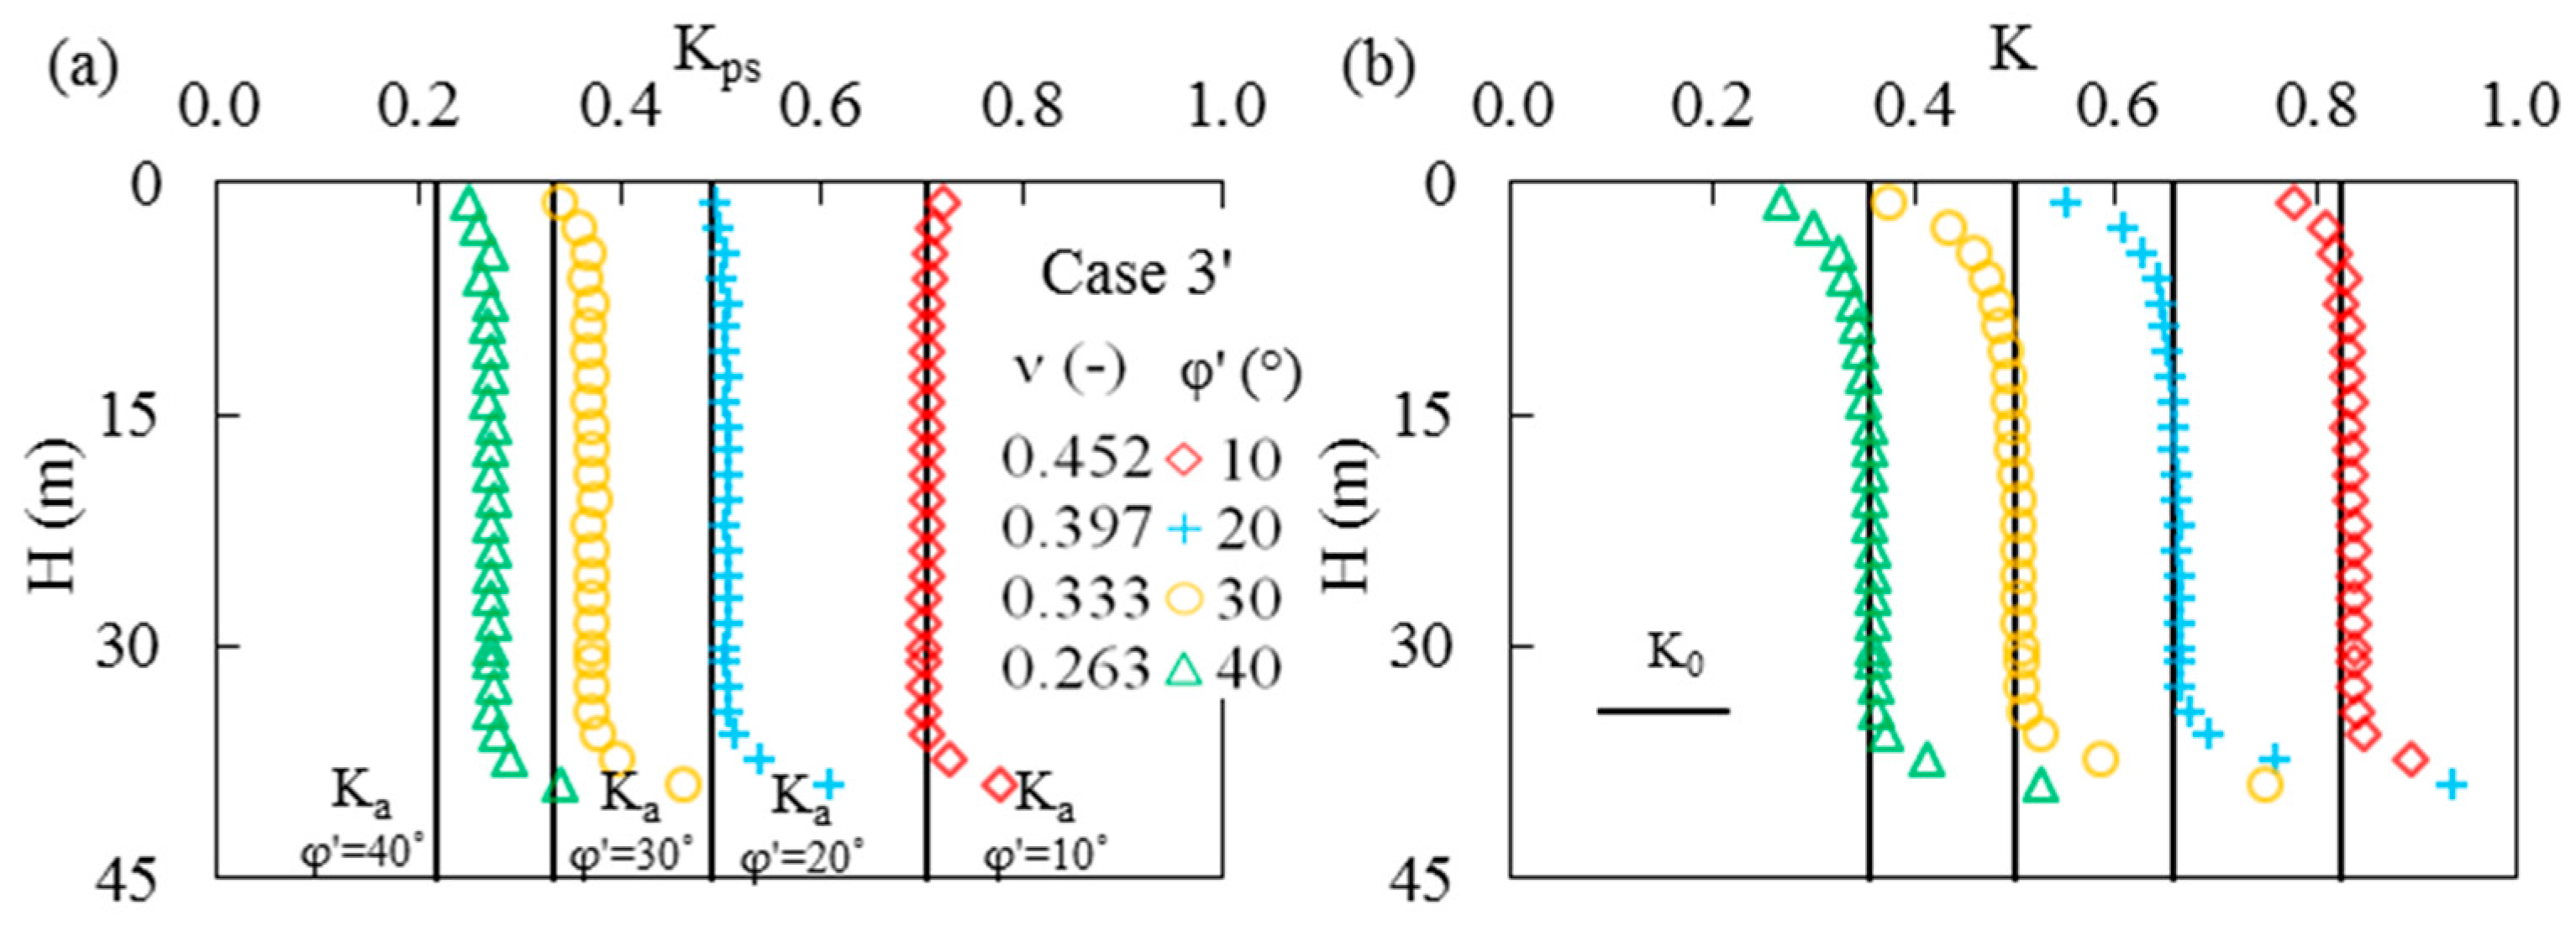
Figure 9 shows the variations of Kps (Figure 9a) and K (Figure 9b) near the RW (Case 3′ in Table 1), when ϕ′ increases from 10° to 40° (and related ν changes from 0.452 to 0.263, through Equation (6)). Figure 9a illustrates that the principal stress ratio Kps near the RW tends to slightly exceed Ka, as the ϕ′ value goes from 10° to 40°. Figure 9b indicates that earth pressure coefficient K near the RW tends to decrease with the increase in ϕ′ (and decrease in ν); the value of K agrees very well with K0.
Figure 10 illustrates the distributions of Kps and K across the stope width B at different heights for related ν and ϕ′ (Case 0′ in Table 1). It can be seen that Kps changes gradually from K0 near the center to a value close to Ka near the walls; this variation is due to the frictional shear stresses developing along the rock walls, which affect the magnitude and orientation of the principal stresses. Figure 10 also indicates that the values of K remains close to K0 across the opening width; this is in agreement with the simulations results obtained by Jahanbakhshzadeh et al. [32].
4. Numerical Results Obtained with Interface Elements
The results presented above have been obtained from numerical simulations conducted without interface elements between the backfill and rock walls. Additional simulations are performed to investigate the effect of the interface characteristics on the stress ratios in backfilled openings.
The stiffness of the interface elements between the backfill and rock walls are determined using the approach suggested in the FLAC manual [37] to ensure stable numerical results [36]. The tensile strength and cohesion along the interfaces are nil. The backfill and interfaces properties used in these simulations conducted with interface elements (Cases 5 and 4′) are given in Table 1 above. The interface friction angle (δ′) can vary from zero (frictionless interface) to a maximum value corresponding to the backfill internal friction angle (ϕ′) (rough interfaces).
In various civil engineering applications, pressure estimation is often made by assuming δ′ = 2ϕ′/3 along fill-wall interfaces [41,42]. In underground mine stopes, rough interfaces are commonly encountered due to production blasting (with δ′ = ϕ′). The effect of the angle (δ′) on stress ratios (Kps and K), near the center and walls of a vertical backfilled opening, is analyzed here for both independent and related values of ϕ′ and ν.
4.1. K = Kps along the Vertical Center Line (VCL)
New numerical results indicate that stress ratios, Kps = K along the VCL of openings are insensitive to the value of angle δ′ and remains almost the same as those given by calculations without interface elements, for both independent and related cases of ϕ′ and ν (see details in [31]). Such numerical results obtained without interface elements have been presented by Yang [31] and are thus not repeated here.
4.2. Kps and K near the Rock Wall (RW)
4.2.1. Independent ϕ′ and ν
For independent values of ϕ′ and ν, the simulated stress ratios, Kps and K, near the RW may be influenced by the value of the angle δ′.
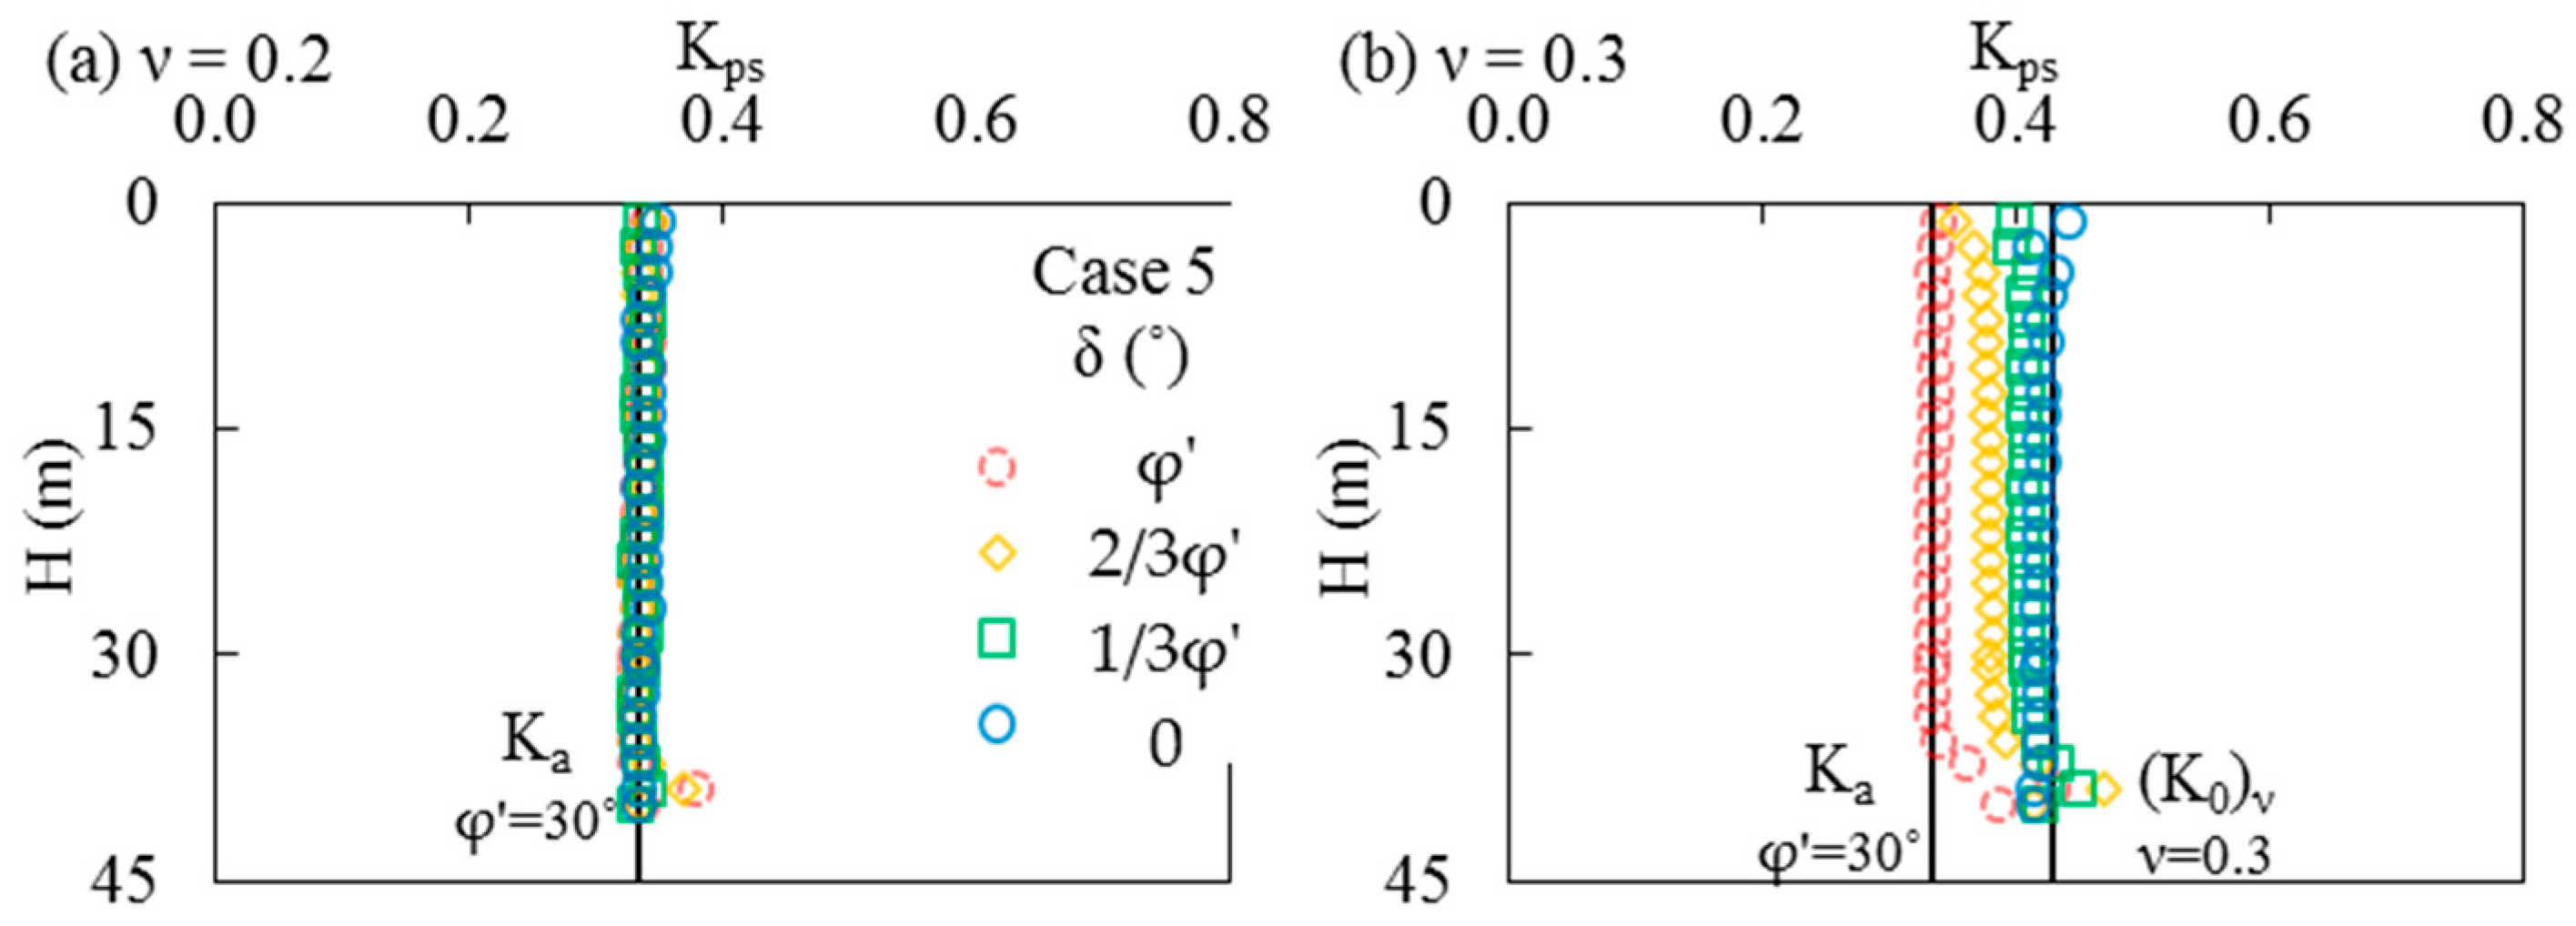
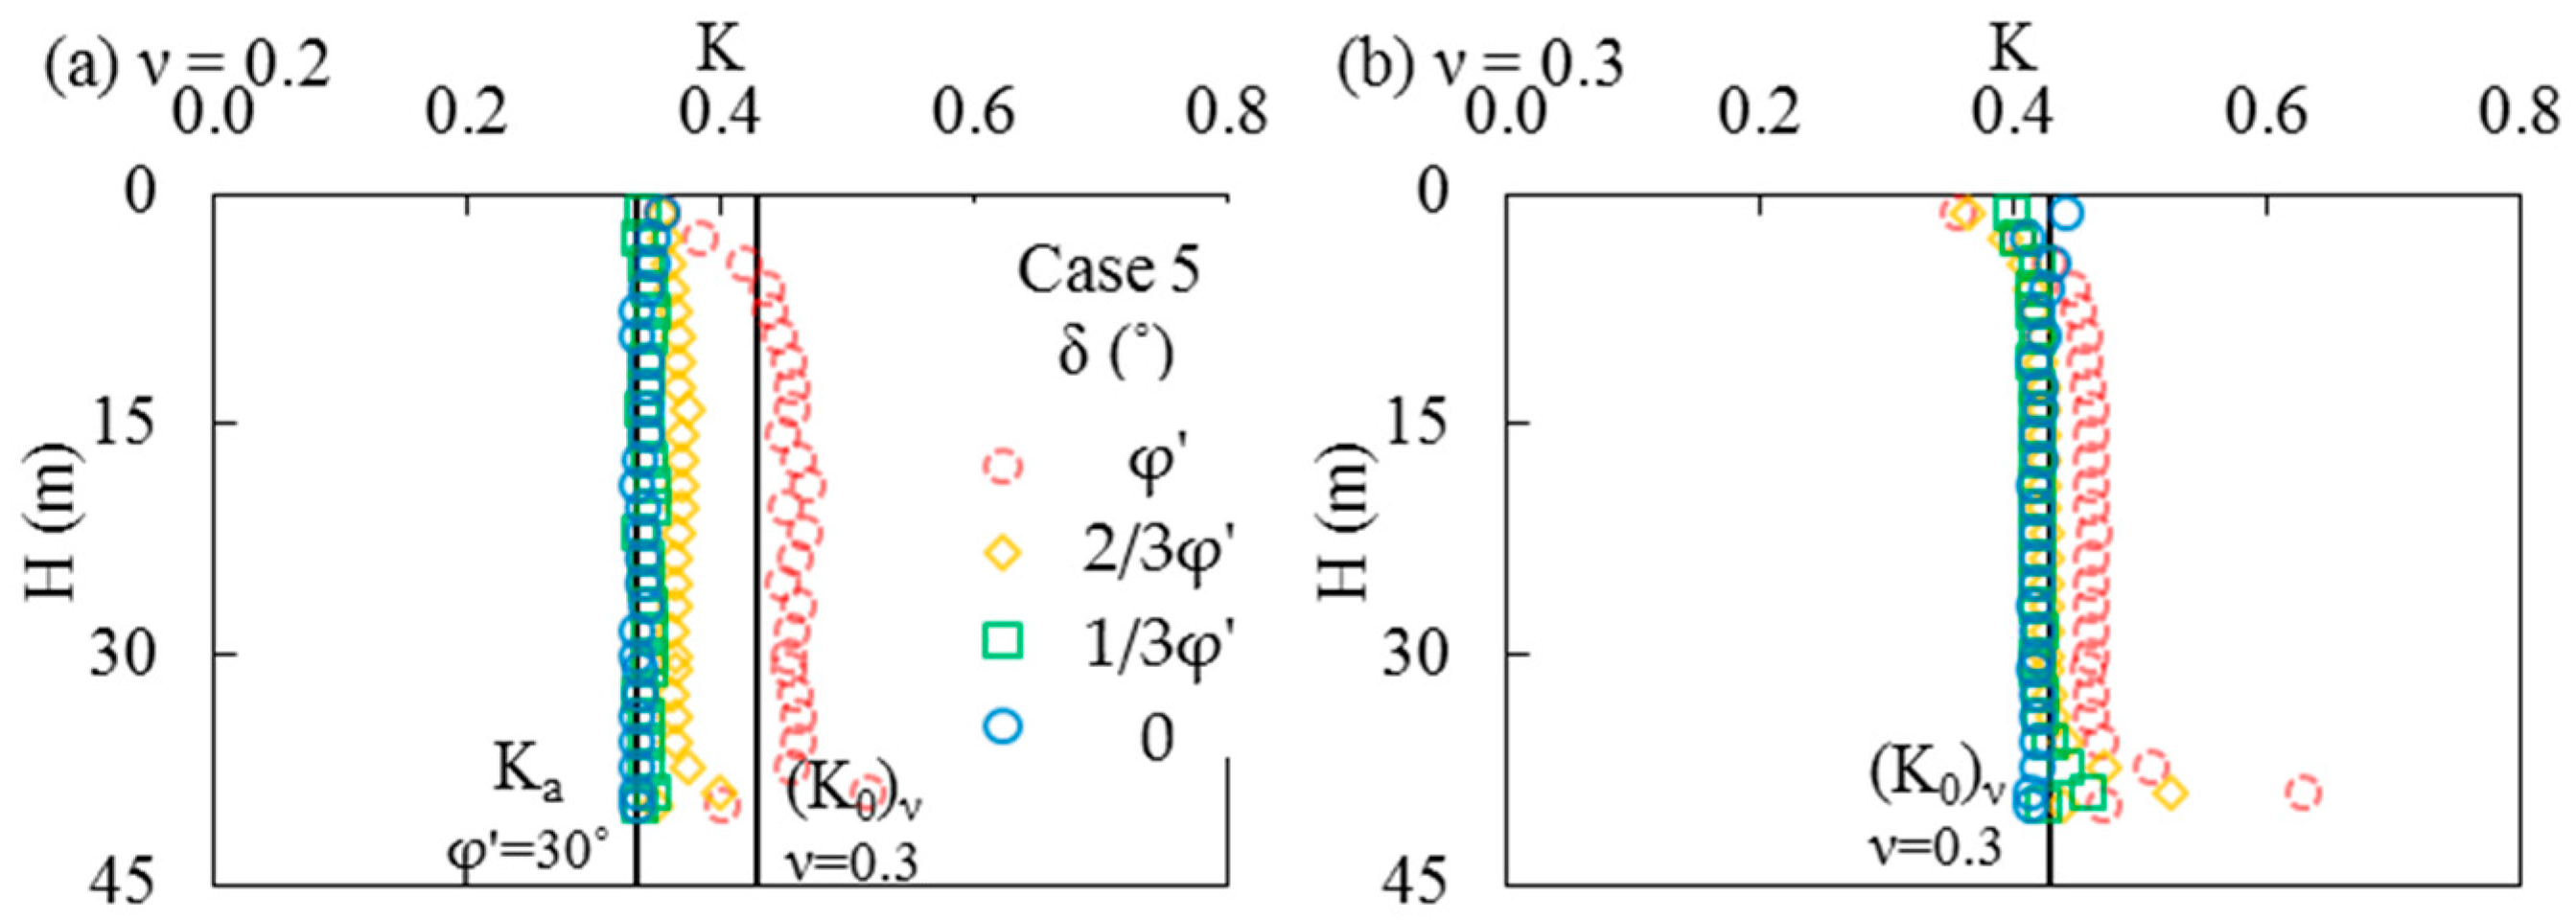
Figure 11 illustrates the vertical profiles of the principal stress ratio Kps near the walls when ν = 0.2 and 0.3 (for constant ϕ′ = 30°), for different values of δ′ (Case 5 in Table 1). It can be seen that for δ′ = ϕ′, the value of Kps near the RW is close to Ka, which is similar to Case 4 without interfaces (Figure 7a). When the δ′ value decreases from ϕ′ to zero, the value of Kps near the walls remains close to Ka for ν = 0.2 (Figure 11a), while it tends to rise and approach coefficient (K0)ν for ν = 0.3 (Figure 11b). These results indicate that the value of Kps near the walls tends to approach the value that prevails near the opening center line, for an angle (δ′) between ϕ′ and zero. A similar trend was observed for the value of coefficient K near the walls, as illustrated in Figure 12, which shows the variations of K near the walls with the angle δ′, for ν = 0.2 and 0.3 (with constant ϕ′ = 30°; Case 5 in Table 1). It can be seen from Figure 11 and Figure 12 that the values of Kps and K near RW tend to approach each other as the angle δ′ diminishes from ϕ′ to zero, and finally became equal at δ′ = 0.
4.2.2. Related ϕ′ and ν
For related values of ν and ϕ′, the coefficient K near the RW is found to be independent of the angle δ′ and remains almost identical to cases obtained without interface elements (i.e., close to the at-rest coefficient K0; see Figure 8, Figure 9 and Figure 10). These similar results are thus not presented here. It is however, observed that the principal stress ratio Kps near the RW could be affected by the value of the angle δ′.
Figure 13 shows the vertical profiles of the principal stress ratio Kps near the RW as a function of ν and ϕ′ for different values of δ′ (when ϕ′ and ν are related; Case 4′ in Table 1). For δ′ = ϕ′, Figure 13a shows results that are very similar to those in Figure 9a for the simulations performed without interface elements. Additional results (not shown here) also indicate that the value of Kps varies gradually from Ka near the walls to a value close to K0 near the center of the opening (similarly to the tendency shown in Figure 10a). As the δ′ value decreases from ϕ′ to zero, the Kps value near the walls tends to approach coefficient K0 (for the whole range of ϕ′ and ν); the latter also represents the stress ratios near the opening center. It can also be seen that the value of Kps near the RW tends to approach that of K near the RW when angle δ′ diminishes; both ratios become identical for δ′ = 0 (Figure 13d). For δ′ = 1/3ϕ′ and δ′ = 0, the stress ratios near the RW are very similar (Figure 13c,d), and remain close to coefficient K0 across the width of the opening (detailed results not shown here; see [31]).
In general, as the angle δ′ reduces from ϕ′ to zero, it can be seen from Figure 11, Figure 12 and Figure 13 (and other results not shown here but presented in [31]) that the stress ratios Kps and K near the walls generally tend to become close to each other, with both ratios becoming almost identical to those near the opening center line. This is due to the smaller rotation of the principal stresses with the reduced δ′, thereby leading to principal stresses that approach the vertical and horizontal stresses even near the rock walls. It was also observed that stress ratios obtained with δ′ = 1/3ϕ′ and δ′ = 0 were quite close to each other.
5. Discussion
The numerical results presented above were obtained with both independent and linked (through Equation (6)) values of the internal friction angle (ϕ′) and Poisson’s ratio (ν) of the backfill. Simulated stress ratios in backfilled openings were shown to be influenced by which of these two different assumptions is applied (see also [31]). The latter is based on the consistency of obtaining a single value of K0 with the elasto-plastic model in numerical simulations [19,20,40]. These two assumptions were investigated to assess their effects on the stress state in the backfill. More work is underway to evaluate, more specifically, the nature of the relationship between ϕ′ and ν from experimental results and thus the significance of Equation (6).
The results presented above indicate that near the opening walls, the Kps value is close to Ka in all simulations conducted with both independent and related ν and ϕ′, for cases without interface elements and with such elements for rough walls (i.e., δ′ = ϕ′). These results indicate that the fill is approaching an active state, due to its yielding associated with the large shear stresses developing near the rough rock faces (see also Figure 11 and Figure 13). Near the opening center, the backfill may approach an active state when the values of ϕ′ and ν are below the critical values defined above. This indicates that the wall movement is not a necessary condition to induce an active state in backfilled openings [30]. More work is underway to better define the conditions leading to these conditions.
It is worth mentioning that the validity of any numerical analyses, such as those presented here, should be checked using other approaches such as close form solutions or experimental data. The latter type of validation would require the measurement of horizontal and vertical stresses near the center and walls of backfilled openings, and the assessment of backfill internal friction angle and Poisson’s ratio. This combination of data does not yet exist (to the authors’ knowledge). Experimental data are hence urgently needed for this purpose.
It is also recalled that the displacements of the rock walls are considered negligible after placement of the backfill in the simulations. This is representative of isolated stopes with “delayed backfilling”, when the fill is deposited after the complete convergence of stiff rock walls. Cases where two interacting stopes are excavated and filled in sequence, with movements of the walls, have been analyzed by [40].
Other factors, such as pore water pressures and binder-induced cohesion within the backfill and along the interfaces, may also impact the stress distribution in backfilled openings [35,36,39,43]. These aspects were not considered in the numerical simulations conducted here. Neglecting additional influence factors allowed for a direct assessment of the earth pressure coefficient introduced in the arching solution used for estimating stresses in cohesionless dry backfill. Nevertheless, these aspects should be considered in future work.
6. Conclusions
Numerical simulations were performed to analyze the values of stress ratios (earth pressure coefficient, K = σ′h/σ′v and principal stress ratio, Kps = σ′3/σ′1) in vertical openings with cohesionless fills, considering both the independent and related backfill internal friction angle (ϕ′) and Poisson’s ratio (ν). The numerical results presented above indicate that both values of K and Kps depend on the position (near the walls or center line) and the relationship between ϕ′ and ν.
Near the center of the opening, K = Kps and this value is close to Rankine’s earth pressure coefficient Ka when Poisson’s ratio ν or the internal friction angle ϕ′ is below a critical value, defined by the Coulomb criterion. Otherwise, the value of K (= Kps) correlates well with K0 defined from Poisson’s ratio.
Near the opening walls, the Kps value is typically close to Ka, suggesting that the fill is yielding and approaching an active state due to the shearing stresses developing near the rock surface. The K value near these walls depends on the respective values of ν and ϕ′ when considered independently, while K is close to K0 for the related backfill parameters ν and ϕ′.
Simulation results obtained with interface elements indicate that the stress ratios (Kps and K) near the opening center are independent of interface roughness, with values almost identical to those obtained without interfaces for both independent and related parameters. As the interface friction angle (δ′) reduces from ϕ′ to zero, the stress ratios Kps and K near the rock walls generally tend to approach each other, becoming very close to those obtained near the opening center line.
These results help clarify the use of the analytical solution given by Equations (1) and (2), and how to evaluate the value of the earth pressure coefficient K.
Acknowledgments
The authors acknowledge the financial aid from the Natural Sciences and Engineering Research Council of Canada (402318), the Institut de recherche Robert-Sauvé en santé et en sécurité du travail (2013-0029), and the Fonds de recherche du Québec—Nature et Technologies (2015-MI-191676). This work is also supported by the industrial partners of the Research Institute on Mines and Environment (RIME UQAT-Polytechnique; http://rime-irme.ca/). The anonymous reviewers are gratefully acknowledged for the constructive comments.
Author Contributions
Pengyu Yang performed the numerical simulations, analyzed the results and wrote the manuscript. Li Li and Michel Aubertin initiated the project and revised the paper. All authors have contributed substantially to the achievement of this paper.
Conflicts of Interest
The authors declare no conflict of interest.
References
- Potvin, Y.; Thomas, E.; Fourie, A. Handbook on Mine Fill; Australian Centre for Geomechanics (ACG): Perth, Australia, 2005. [Google Scholar]
- Liu, G.S.; Li, L.; Yao, M.; Landry, D.; Malek, F.; Yang, X.C.; Guo, L.J. An investigation of the uniaxial compressive strength of a cemented hydraulic backfill made of alluvial sand. Minerals 2017, 7, 4. [Google Scholar] [CrossRef]
- Qiu, J.P.; Yang, L.; Sun, X.G.; Xing, J.; Li, S.B. Strength characteristics and failure mechanism of cemented super-fine unclassified tailings backfill. Minerals 2017, 7, 58. [Google Scholar] [CrossRef]
- Li, L.; Aubertin, M. Horizontal pressure on barricades for backfilled stopes. Part I: Fully drained conditions. Can. Geotech. J. 2009, 46, 37–46. [Google Scholar] [CrossRef]
- Yang, P.Y.; Li, L.; Aubertin, M. A new solution to assess the required strength of mine backfill with a vertical exposure. Int. J. Geomech. 2017, 17, 04017084. [Google Scholar] [CrossRef]
- Yang, P.Y.; Li, L. Evolution of water table and pore water pressure in stopes with submerged hydraulic fill. Int. J. Geomech. 2017, 17, 04017052. [Google Scholar] [CrossRef]
- Yang, P.Y.; Li, L.; Aubertin, M.; Brochu-Baekelmans, M.; Ouellet, S. Stability analyses of waste rock barricades designed to retain paste backfill. Int. J. Geomech. 2017, 17, 04016079. [Google Scholar] [CrossRef]
- Janssen, H.A. Versuche uber getreidedruck in silozellen. Z. Ver. Dtsch. Ing. 1895, 39, 1045–1049. [Google Scholar]
- Marston, A. The theory of external loads on closed conduits in the light of latest experiments. In Proceedings of the 9th Annual Meeting of the Highway Research Board, Washington, DC, USA, 12 December 1929. [Google Scholar]
- Terzaghi, K. Theoretical Soil Mechanics; John Wiley and Sons: New York, NY, USA, 1943. [Google Scholar]
- Aubertin, M.; Li, L.; Arnold, S.; Belem, T.; Bussière, B.; Benzaazoua, M.; Simon, R. Interaction between backfill and rock mass in narrow stopes. In Proceedings of the 12th Panamerican Conference on Soil Mechanics and Geotechnical Engineering, Essen, Germany, 22–26 June 2003. [Google Scholar]
- Jaky, J. The coefficient of earth pressure at-rest. J. Soc. Hung. Arch. Eng. 1944, 78, 355–358. [Google Scholar]
- Jaky, J. Pressure in silos. In Proceedings of the 2nd International Conference on Soil Mechanics and Foundation Engineering, Rotterdam, The Netherlands, 21–30 June 1948. [Google Scholar]
- Bishop, A.W. Test requirements for measuring the coefficient of earth pressure at-rest. In Proceedings of the Brussels Conference on Earth Pressure Problems, Brussels, Belgium, September 1958. [Google Scholar]
- Blight, G.E. Pressure exerted by materials stored in silos. Part I: Coarse materials. Géotechnique 1986, 36, 33–46. [Google Scholar] [CrossRef]
- McCarthy, D.F. Essentials of Soil Mechanics and Foundations: Basic Geotechnics, 7th ed.; Prentice Hall: Upper Saddle River, NJ, USA, 2007. [Google Scholar]
- Yang, K.H.; Liu, C.N. Finite element analysis of earth pressures for narrow retaining walls. J. GeoEngin. 2007, 2, 43–52. [Google Scholar]
- Duncan, J.M.; Bursey, A. Soil modulus correlations. In Proceedings of the Foundation Engineering in the Face of Uncertainty: Honoring Fred H. Kulhawy, San Diego, CA, USA, 3–7 March 2013. [Google Scholar]
- Falaknaz, N. Analysis of the Geomechanical Behavior of Two Adjacent Backfilled Stopes Based on Two and Three Dimensional Numerical Simulations. Ph.D. Thesis, Polytechnique Montreal, Montreal, QC, Canada, 2014. [Google Scholar]
- Jahanbakhshzadeh, A. Analyse du Comportement Géomécanique des Remblais Miniers dans des Excavations Souterraines Inclinées. Ph.D. Thesis, Polytechnique Montreal, Montreal, QC, Canada, 2016. [Google Scholar]
- Li, L.; Aubertin, M.; Simon, R.; Bussière, B.; Belem, T. Modelling arching effects in narrow backfilled stopes with FLAC. In Proceedings of the 3th International FLAC Symposium, Sudbury, ON, Canada, 21–24 October 2003. [Google Scholar]
- Li, L.; Aubertin, M.; Belem, T. Formulation of a three dimensional analytical solution to evaluate stresses in backfilled vertical narrow openings. Can. Geotech. J. 2005, 42, 1705–1717. [Google Scholar] [CrossRef]
- Helinski, M. Mechanics of Mine Backfill. Ph.D. Thesis, University of Western Australia, Perth, Australia, 2007. [Google Scholar]
- Pirapakaran, K.; Sivakugan, N. Arching within hydraulic fill stopes. Geotech. Geol. Eng. 2007, 25, 25–35. [Google Scholar] [CrossRef]
- Pirapakaran, K.; Sivakugan, N. A laboratory model to study arching within a hydraulic fill stope. Geotech. Test. J. 2007, 30, 496–503. [Google Scholar]
- Fahey, M.; Helinski, M.; Fourie, A. Some aspects of the mechanics of arching in backfilled stopes. Can. Geotech. J. 2009, 46, 1322–1336. [Google Scholar] [CrossRef]
- Ting, C.H.; Shukla, S.; Sivakugan, N. Arching in soils applied to inclined mine stopes. Int. J. Geomech. 2011, 11, 29–35. [Google Scholar] [CrossRef]
- Li, L.; Aubertin, M. Influence of water pressure on the stress state in backfill with cohesionless stopes. Geotech. Geol. Eng. 2009, 27, 1–11. [Google Scholar] [CrossRef]
- Li, L.; Aubertin, M. A three-dimensional analysis of the total and effective stresses in submerged backfilled stopes. Geotech. Geol. Eng. 2009, 27, 559–569. [Google Scholar] [CrossRef]
- Sobhi, A.M.; Li, L.; Aubertin, M. Numerical investigation of the earth pressure coefficient along the center line of backfilled stopes. Can. Geotech. J. 2017, 54, 138–145. [Google Scholar] [CrossRef]
- Yang, P.Y. Investigation of the Geomechanical Behavior of Mine Backfill and its Interaction with Rock Walls and Barricades. Ph.D. Thesis, Polytechnique Montreal, Montreal, QC, Canada, 2016. [Google Scholar]
- Jahanbakhshzadeh, A.; Aubertin, M.; Li, L. A new analytical solution for the stress state in inclined backfilled mine stopes. Geotech. Geol. Eng. 2017, 35, 1151–1167. [Google Scholar] [CrossRef]
- Li, L.; Aubertin, M. An improved analytical solution to estimate the stress state in subvertical backfilled stopes. Can. Geotech. J. 2008, 45, 1487–1496. [Google Scholar] [CrossRef]
- Li, L.; Aubertin, M. An analytical solution for the nonlinear distribution of effective and total stresses in vertical backfilled stopes. Geomech. Geoeng. 2010, 5, 237–245. [Google Scholar] [CrossRef]
- Liu, G.S.; Li, L.; Yang, X.C.; Guo, L.J. A numerical analysis of the stress distribution in backfilled stopes considering nonplanar interfaces between the backfill and rock walls. Int. J. Geotech. Eng. 2016, 10, 271–282. [Google Scholar] [CrossRef]
- Liu, G.S.; Li, L.; Yang, X.C.; Guo, L.J. Numerical analysis of stress distribution in backfilled stopes considering interfaces between the backfill and rock walls. Int. J. Geomech. 2017, 17, 06016014. [Google Scholar] [CrossRef]
- Itasca. FLAC-Fast Lagrangian Analysis of Continua; User’s Guide; Itasca Consulting Group: Minneapolis, MN, USA, 2011. [Google Scholar]
- Emad, M.Z.; Mitri, H.; Henning, J.G. Effect of blast vibrations on the stability of cemented rockfill. Int. J. Min. Reclam. Environ. 2012, 26, 233–243. [Google Scholar] [CrossRef]
- Li, L.; Aubertin, M. Numerical investigation of the stress state in inclined backfilled stopes. Int. J. Geomech. 2009, 9, 52–62. [Google Scholar] [CrossRef]
- Falaknaz, N.; Aubertin, M.; Li, L. Numerical investigation of the geomechanical response of adjacent backfilled stopes. Can. Geotech. J. 2015, 52, 1507–1525. [Google Scholar] [CrossRef]
- Bowles, J.E. Foundation Analysis and Design; McGraw-Hill: New York, NY, USA, 1988. [Google Scholar]
- Terzaghi, K.; Peck, R.B.; Mesri, G. Soil Mechanics in Engineering Practice; John Wiley and Sons: New York, NY, USA, 1996. [Google Scholar]
- Thompson, B.D.; Grabinsky, M.W.; Bawden, W.F. In situ measurements of cemented paste backfill at Cayeli Mine. Can. Geotech. J. 2012, 49, 755–772. [Google Scholar] [CrossRef]
Figure 1.
Numerical model of a backfilled opening built with a finite difference code FLAC.
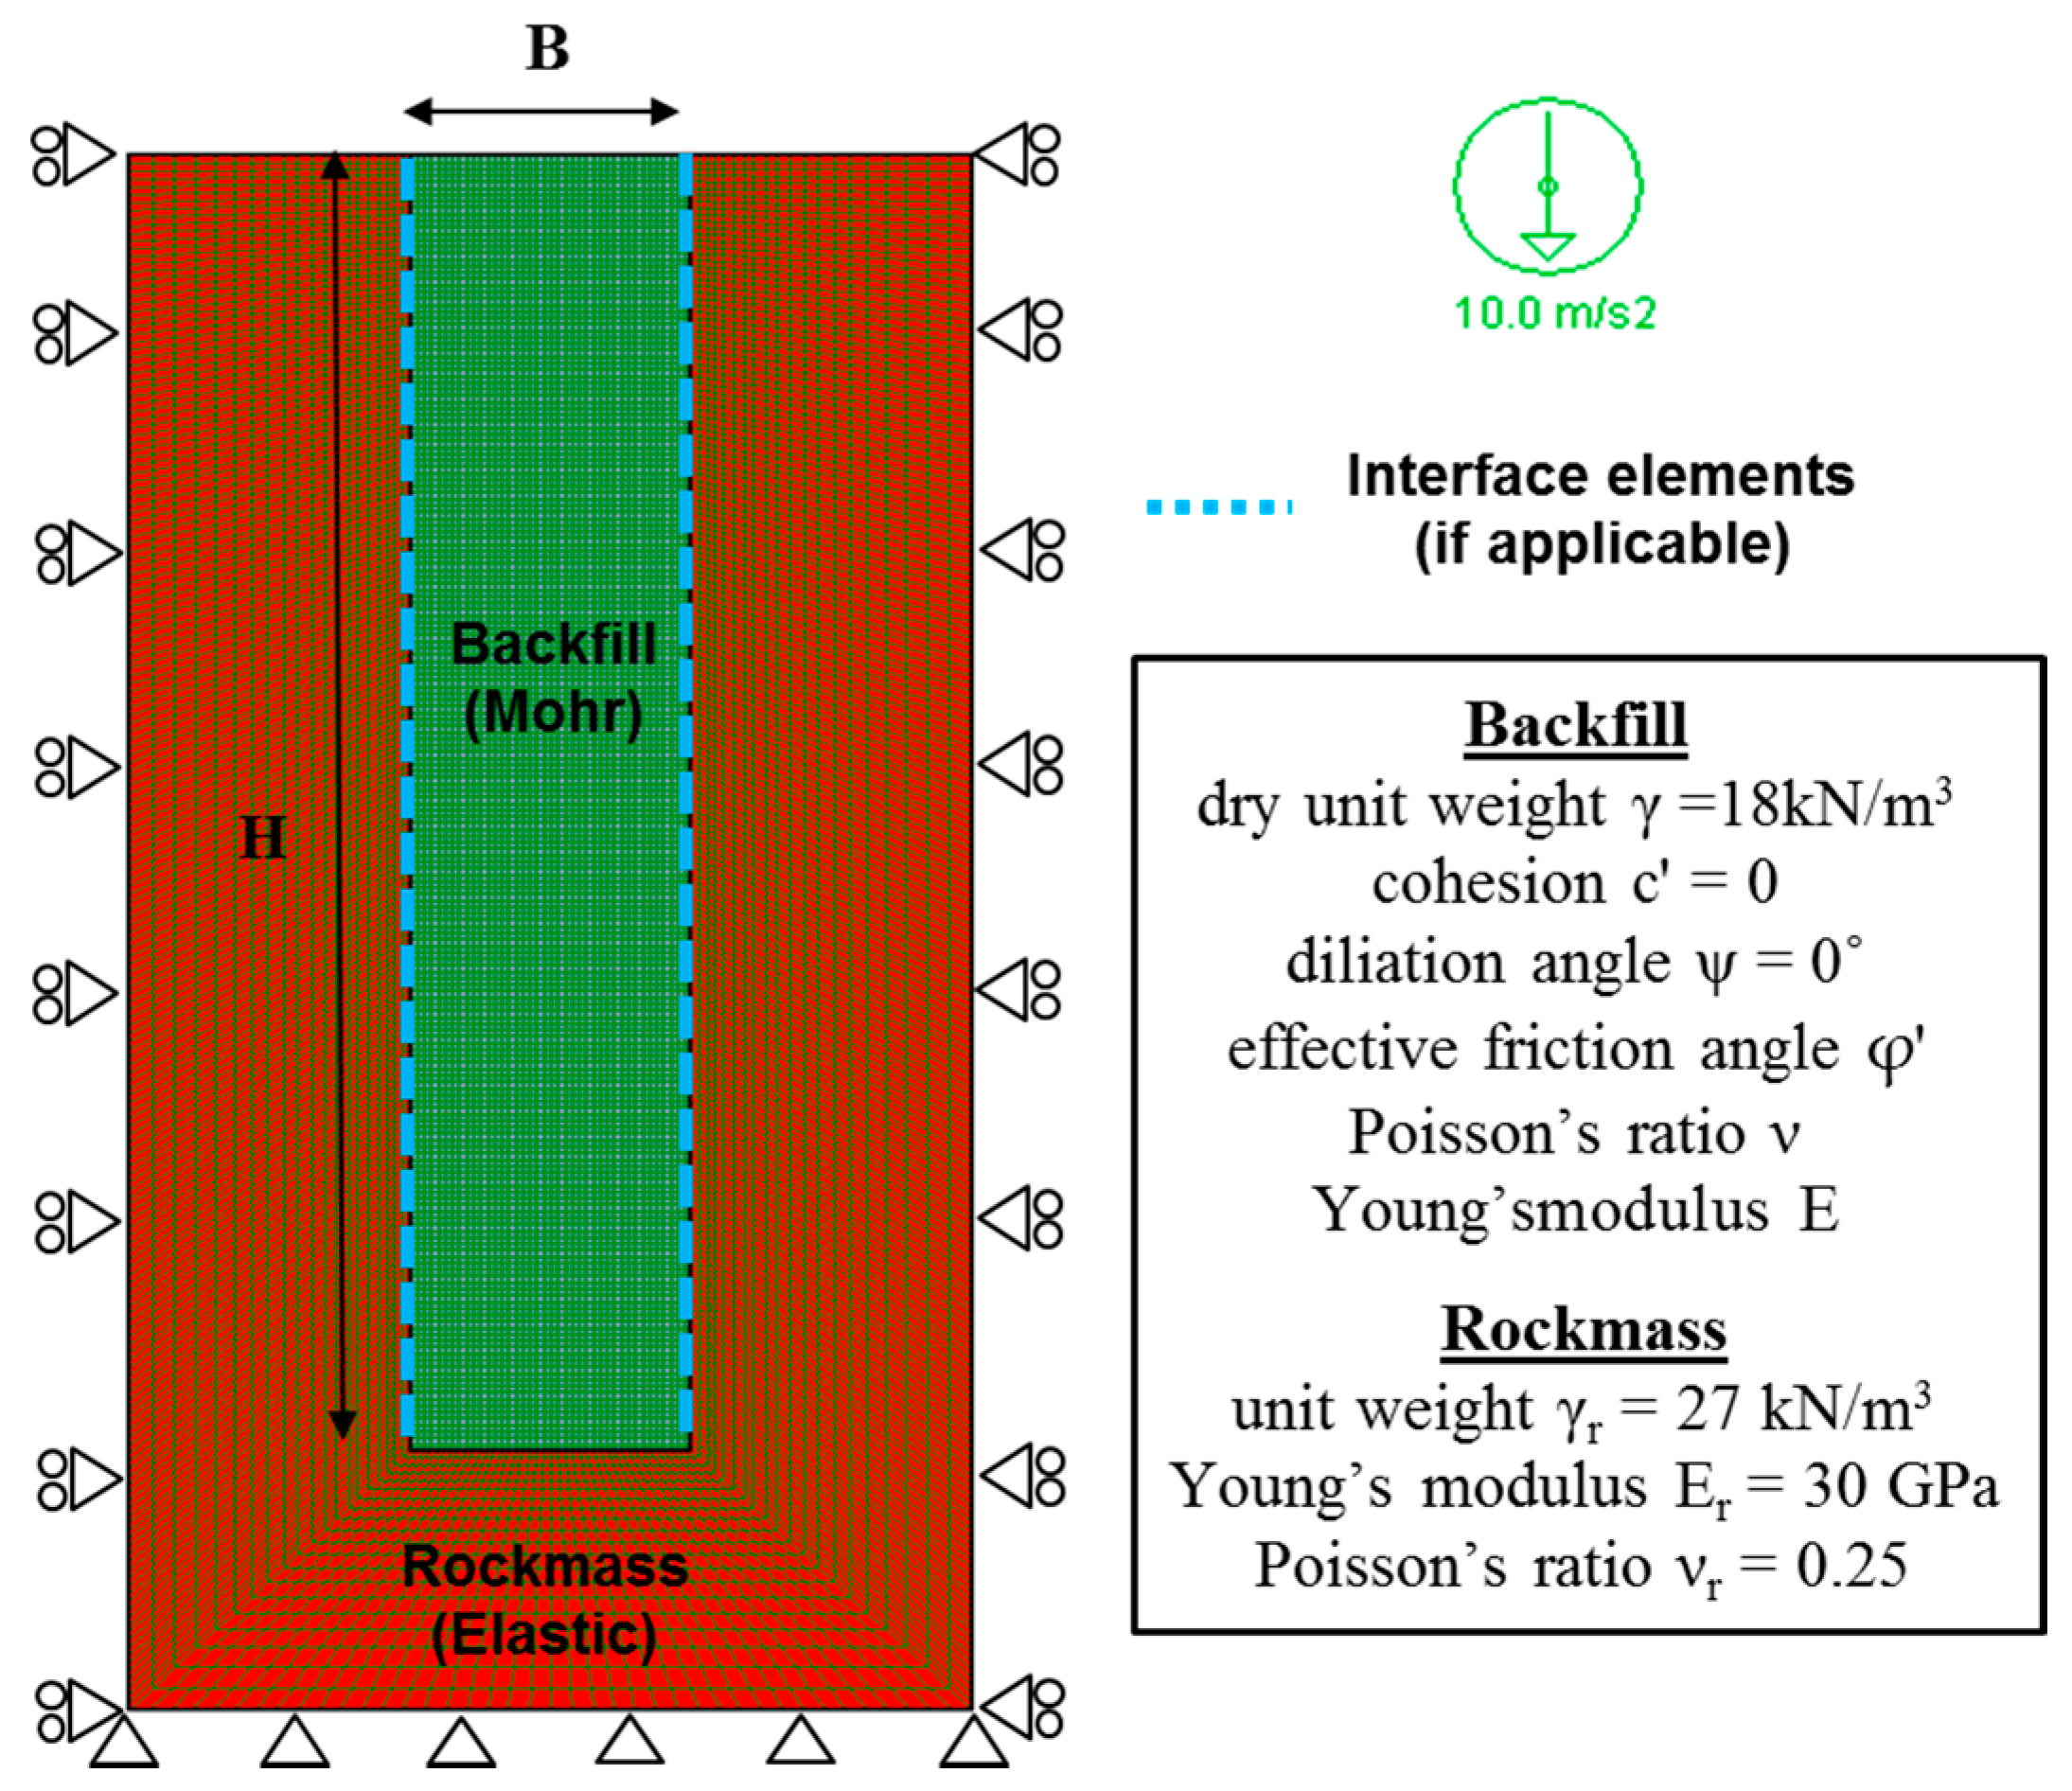
Figure 2.
Horizontal (a) and vertical (b) stress (in Pa) contours from FLAC simulations conducted for independent (Case 0) and interrelated (Case 0′) values of ν and ϕ′ (see Table 1 for details).
Figure 2.
Horizontal (a) and vertical (b) stress (in Pa) contours from FLAC simulations conducted for independent (Case 0) and interrelated (Case 0′) values of ν and ϕ′ (see Table 1 for details).

Figure 3.
Stress distributions (a) along the vertical center line (VCL) and (b) near the rock walls (RW) in the backfill for independent (Case 0) and related (Case 0′) values of ν and ϕ′ (see Table 1 for details).
Figure 3.
Stress distributions (a) along the vertical center line (VCL) and (b) near the rock walls (RW) in the backfill for independent (Case 0) and related (Case 0′) values of ν and ϕ′ (see Table 1 for details).

Figure 4.
Vertical profiles of the earth pressure coefficient K and the principle stress ratio Kps (a) along the VCL and (b) near the RW, for independent (Case 0) and related (Case 0′) values of ν and ϕ′ (see Table 1 for details).
Figure 4.
Vertical profiles of the earth pressure coefficient K and the principle stress ratio Kps (a) along the VCL and (b) near the RW, for independent (Case 0) and related (Case 0′) values of ν and ϕ′ (see Table 1 for details).
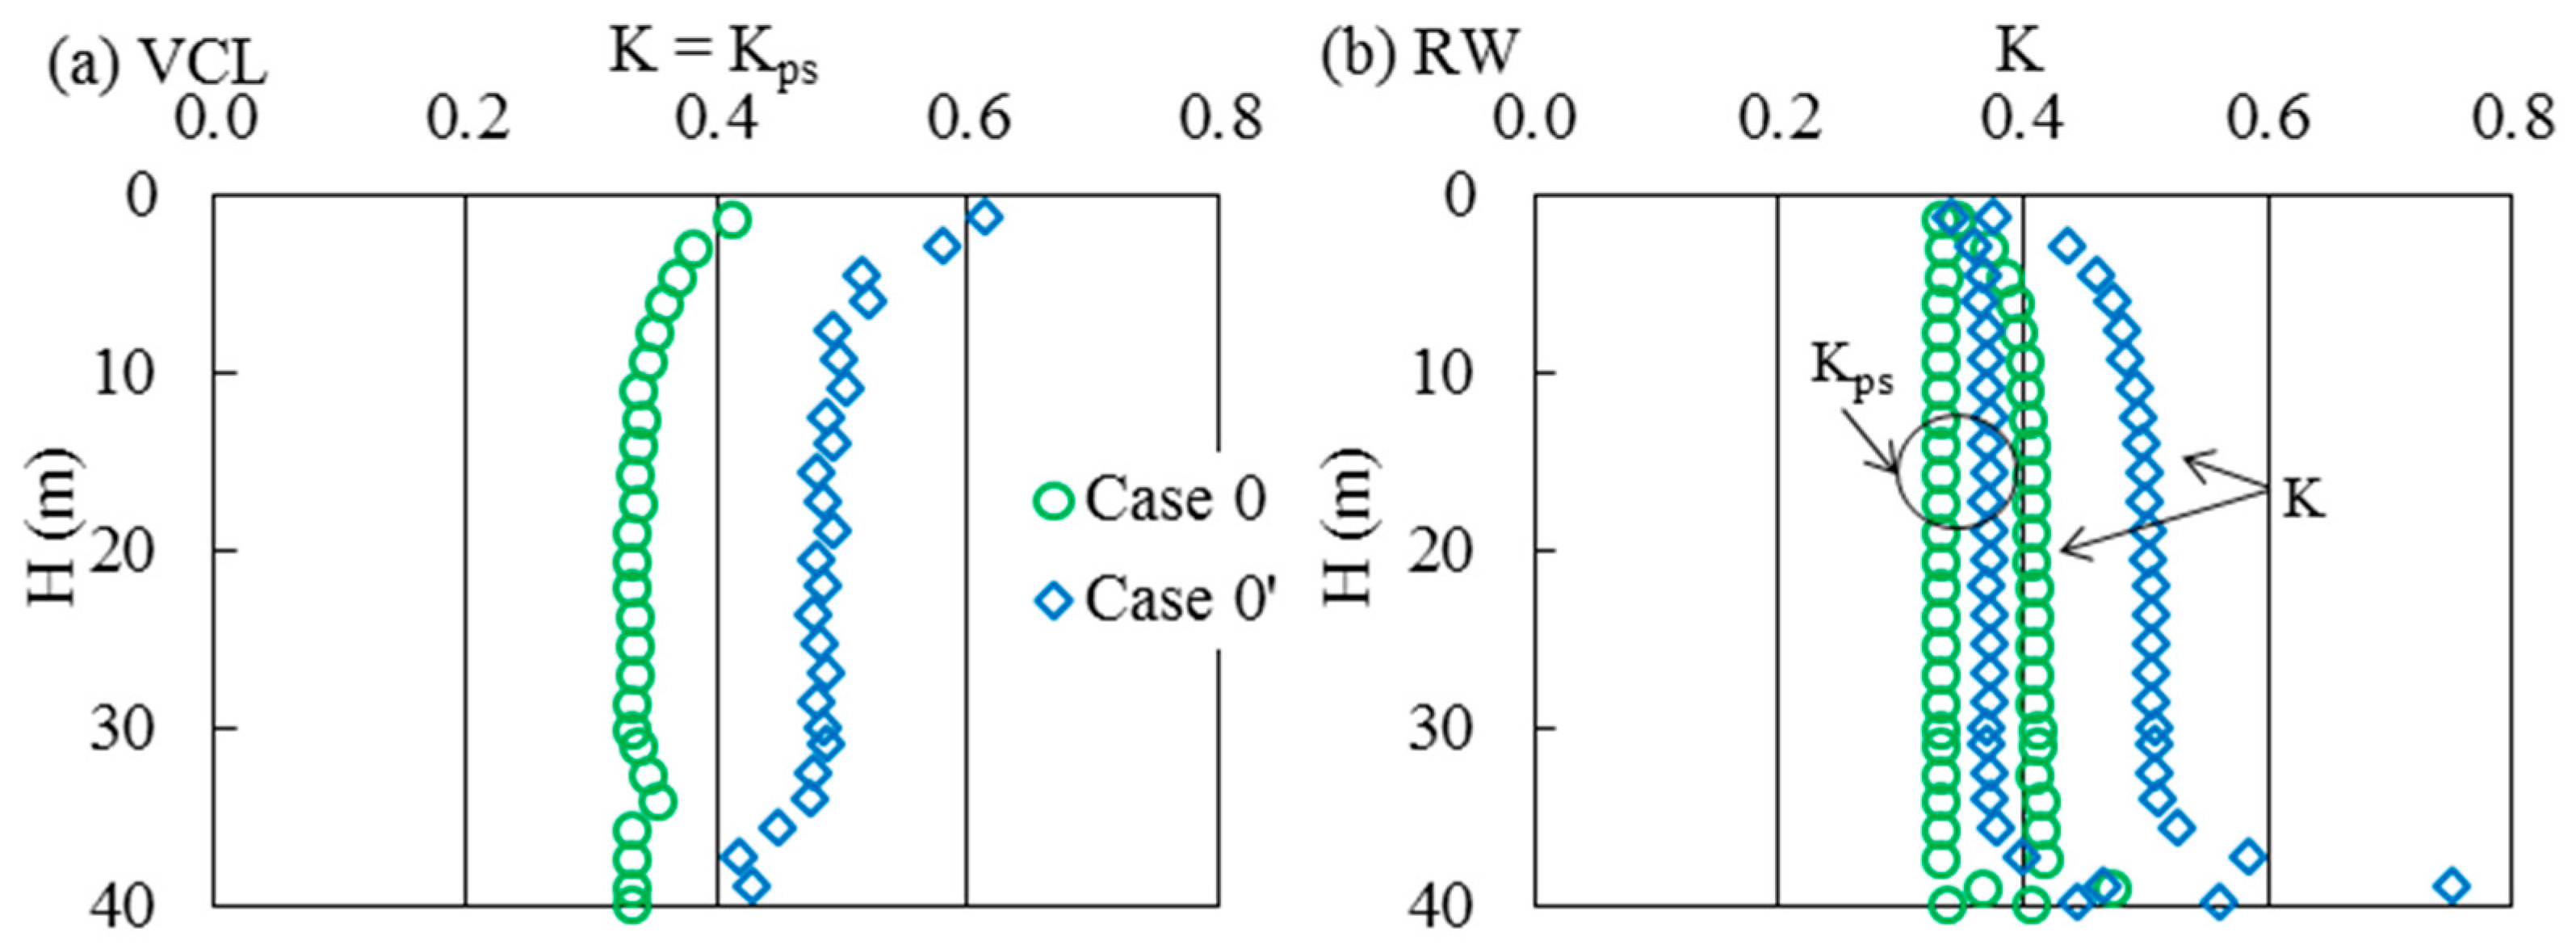
Figure 5.
Vertical profiles of Kps and K near the RW for different values of (a) B (Case 1 in Table 1) and (b) E (Case 2 in Table 1) for independent values of ν and ϕ′.
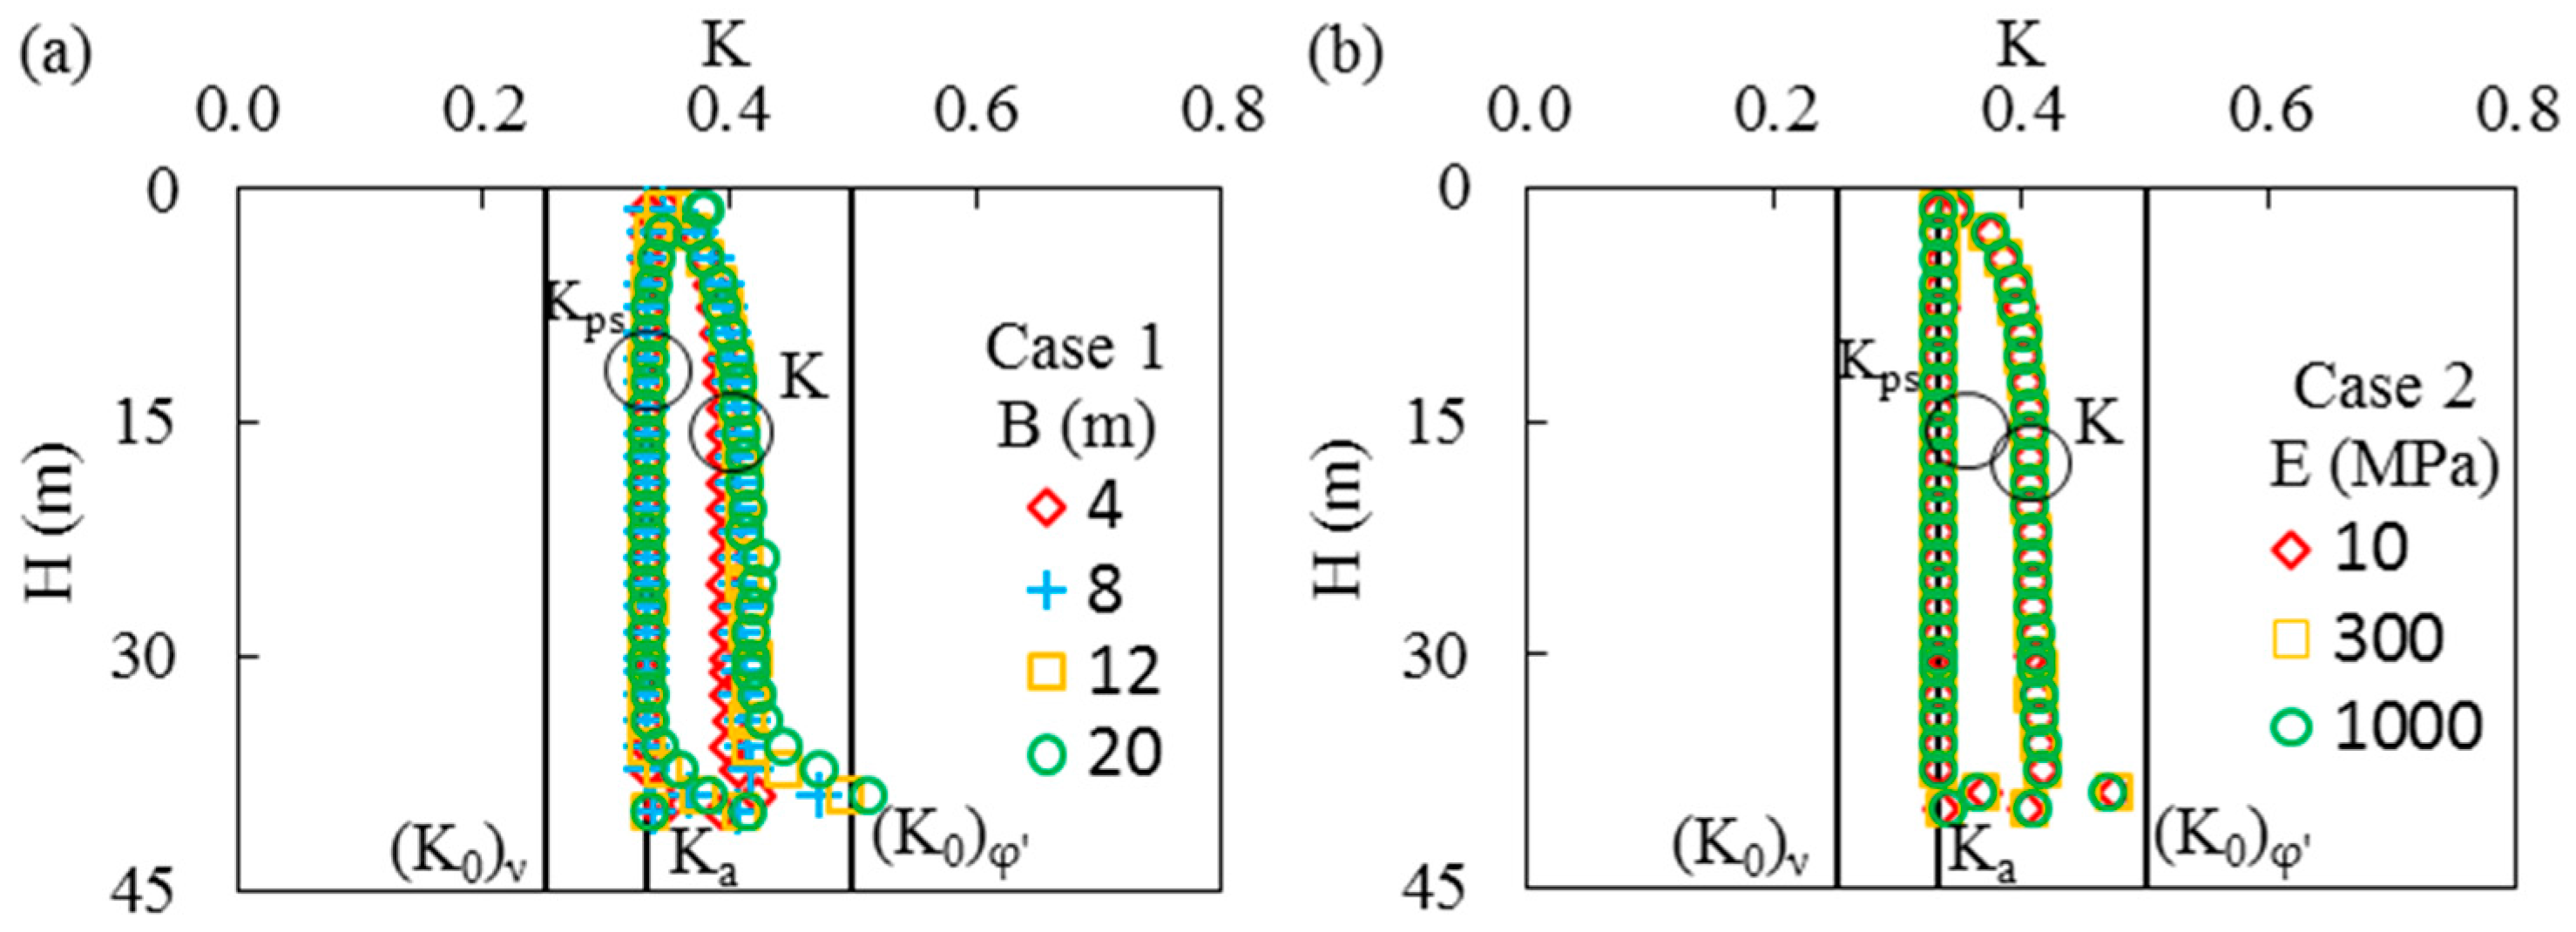
Figure 6.
Vertical profiles of (a) Kps and (b) K near the RW for different values of ϕ′ with a constant ν value (Case 3 in Table 1).
Figure 6.
Vertical profiles of (a) Kps and (b) K near the RW for different values of ϕ′ with a constant ν value (Case 3 in Table 1).
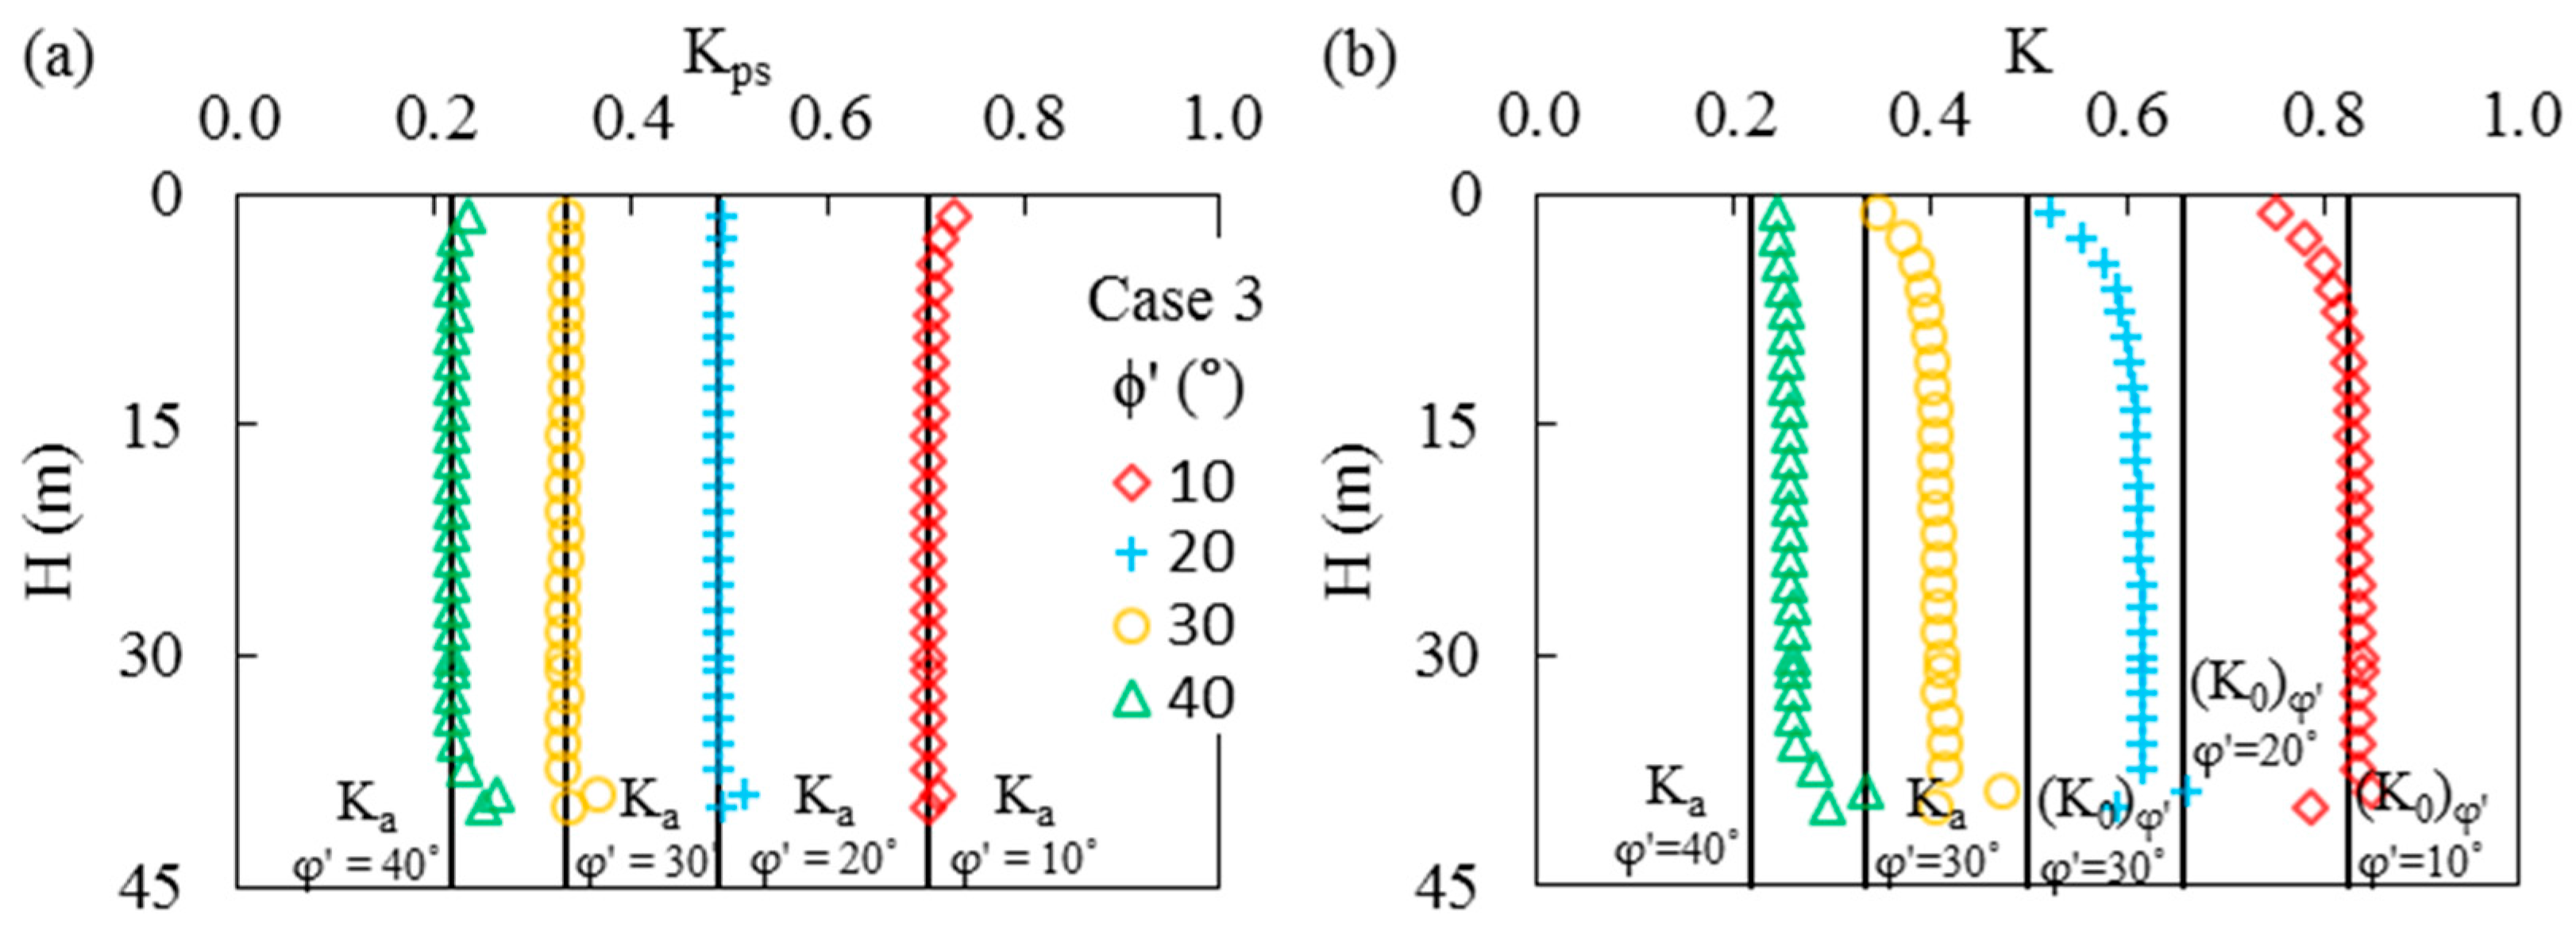
Figure 7.
Vertical profiles of (a) Kps and (b) K near the RW for different values of ν, independent from the ϕ′ value (Case 4 in Table 1).
Figure 7.
Vertical profiles of (a) Kps and (b) K near the RW for different values of ν, independent from the ϕ′ value (Case 4 in Table 1).

Figure 8.
Vertical profiles of Kps and K near the RW for different values of (a) B (Case 1′ in Table 1) and (b) E (Case 2′ in Table 1) for linked ν and ϕ′ values.

Figure 9.
Vertical profiles of (a) Kps and (b) K near the RW for different ϕ′ values related to ν values (Case 3′ in Table 1).
Figure 9.
Vertical profiles of (a) Kps and (b) K near the RW for different ϕ′ values related to ν values (Case 3′ in Table 1).

Figure 10.
Distributions of Kps and K across the opening width (B) at different heights for related values of ν and ϕ′ (Case 0′ in Table 1).
Figure 10.
Distributions of Kps and K across the opening width (B) at different heights for related values of ν and ϕ′ (Case 0′ in Table 1).

Figure 11.
Vertical profiles of Kps (= σ′3/σ′1) near the RW as a function of the angle δ′ for ν = (a) 0.2 and (b) 0.3, obtained with a constant value of ϕ′ = 30° (Case 5 in Table 1).
Figure 11.
Vertical profiles of Kps (= σ′3/σ′1) near the RW as a function of the angle δ′ for ν = (a) 0.2 and (b) 0.3, obtained with a constant value of ϕ′ = 30° (Case 5 in Table 1).

Figure 12.
Vertical profiles of K (= σ′h/σ′v) near the RW as a function of the angle δ′ for ν = (a) 0.2 and (b) 0.3, obtained with a constant value of ϕ′ = 30° (Case 5 in Table 1).
Figure 12.
Vertical profiles of K (= σ′h/σ′v) near the RW as a function of the angle δ′ for ν = (a) 0.2 and (b) 0.3, obtained with a constant value of ϕ′ = 30° (Case 5 in Table 1).

Figure 13.
Vertical profiles of Kps (= σ′3/σ′1) near the RW as a function of ν for the angles δ′ = ϕ′ (a), 2/3ϕ′ (b), 1/3ϕ′ (c) and 0 (d), obtained with related values of ν and ϕ′ (Case 4′ in Table 1).
Figure 13.
Vertical profiles of Kps (= σ′3/σ′1) near the RW as a function of ν for the angles δ′ = ϕ′ (a), 2/3ϕ′ (b), 1/3ϕ′ (c) and 0 (d), obtained with related values of ν and ϕ′ (Case 4′ in Table 1).

Table 1.
Various geometric and mechanical characteristics used in numerical simulations conducted with independent (Cases 0 to 5) and linked (Cases 0′ to 4′) values of ν and ϕ′.
Table 1.
Various geometric and mechanical characteristics used in numerical simulations conducted with independent (Cases 0 to 5) and linked (Cases 0′ to 4′) values of ν and ϕ′.
| Case | Figure No. | B (m) | E (MPa) | ϕ′ (°) | ν (-) | δ′ (°) | |
|---|---|---|---|---|---|---|---|
| Independent ϕ′ and ν | 0 | 2, 3, 4 | 8 | 300 | 30 | 0.2 | - |
| 1 | 5a | Variable | 300 | 30 | 0.2 | - | |
| 2 | 5b | 8 | Variable | 30 | 0.2 | - | |
| 3 | 6 | 8 | 300 | Variable | 0.2 | - | |
| 4 | 7 | 8 | 300 | 30 | Variable | - | |
| 5 | 11, 12 | 8 | 300 | 30 | 0.2, 0.3 | Variable a | |
| Related ϕ′ and ν | 0′ | 2, 3, 4, 10 | 8 | 300 | 30 | 0.333 | - |
| 1′ | 8a | Variable | 300 | 30 | 0.333 | - | |
| 2′ | 8b | 8 | Variable | 30 | 0.333 | - | |
| 3′ | 9 | 8 | 300 | Variable | - | ||
| 4′ | 13 | 8 | 300 | Variable | Variable a | ||
- not applicable; a with interface elements. B represents the opening width and δ′ represents the effective interface friction angle.
© 2017 by the authors. Licensee MDPI, Basel, Switzerland. This article is an open access article distributed under the terms and conditions of the Creative Commons Attribution (CC BY) license (http://creativecommons.org/licenses/by/4.0/).
Share and Cite
MDPI and ACS Style
Yang, P.; Li, L.; Aubertin, M. Stress Ratios in Entire Mine Stopes with Cohesionless Backfill: A Numerical Study. Minerals 2017, 7, 201. https://doi.org/10.3390/min7100201
AMA Style
Yang P, Li L, Aubertin M. Stress Ratios in Entire Mine Stopes with Cohesionless Backfill: A Numerical Study. Minerals. 2017; 7(10):201. https://doi.org/10.3390/min7100201
Chicago/Turabian StyleYang, Pengyu, Li Li, and Michel Aubertin. 2017. "Stress Ratios in Entire Mine Stopes with Cohesionless Backfill: A Numerical Study" Minerals 7, no. 10: 201. https://doi.org/10.3390/min7100201
Note that from the first issue of 2016, this journal uses article numbers instead of page numbers. See further details here.