Article

Joint Application of Fractal Analysis and Weights-of-Evidence Method for Revealing the Geological Controls on Regional-Scale Tungsten Mineralization in Southern Jiangxi Province, China

1
School of Resources and Environmental Engineering, Jiangxi University of Science and Technology, Ganzhou 341000, China
2
Jiangxi Key Laboratory of Mining Engineering, Jiangxi University of Science and Technology, Ganzhou 341000, China
3
School of Water Resource and Environment, China University of Geosciences, Beijing 341515, China
4
Geological Team of Ganzhou City, Ganzhou 341000, China
*
Author to whom correspondence should be addressed.
Minerals 2017, 7(12), 243; https://doi.org/10.3390/min7120243
Submission received: 27 October 2017 / Revised: 5 December 2017 / Accepted: 6 December 2017 / Published: 11 December 2017
(This article belongs to the Special Issue Geological Modelling)

Abstract

:
The Southern Jiangxi Province (SJP) hosts one of the best known districts of tungsten deposits in the world. Delineating spatial complexities of geological features and their controls on regional-scale tungsten mineralization by using an integrated fractal and weights-of-evidence (WofE) method can provide insights into the understanding of ore genesis and facilitate further prospecting in this area. The box-counting fractal analysis shows that most of the tungsten occurrences are distributed in regions with high fractal dimensions of faults and fault intersections, suggesting ore-forming favorability of areas with highly complex structural patterns. The WofE-derived indices are employed to quantitatively measure the controls of analyzed features on mineralization, which illustrate that tungsten anomalies, faults, Yanshanian granites, and manganese anomalies have high contrast values, implying a spatially strong correlation of these features with tungsten occurrences. In particular, high manganese anomalies in host rock may provide a novel indication for mineral prospecting in this area. A predictive map is extracted based on the combination of fractal and WofE results, providing intuitive guides for future prospectivity in this area. Regions identified by high posterior probability in conjunction with high fractal dimensions of both faults and fault intersections are evaluated as the most favorable targets.

1. Introduction

Mineral deposits are formed by nonlinear coupling of various geological processes and conditioned by controls that favor their formation [1,2,3]. The geological features genetically associated with ore-forming processes can therefore provide significant information relevant to understanding ore genesis and facilitating mineral exploration by focusing prospective targets on regions where these favorable features are concentrated [3,4,5]. However, such spatial associations, being the end-products of complex coupled processes, are themselves complicated, and additionally overlain by numerous random influences, temporal alteration, and/or spatial deviation [6]. It is a challenge to extract and delineate spatial correlations between geological features and mineral occurrences from a large number of multi-source exploratory data that inevitably involve non-correlative background information [2,7,8,9]. For solving this problem, some emerging quantitative methods, including fractal analysis and the weights-of-evidence (WofE) approach, are much more powerful than traditionally empirical descriptive methods because of their geological informative abundance, depictive precision, and practical flexibility [1,10,11].
The fractal geometry, since it was proposed by Mandelbrot [12], has become an important tool for studying nonlinear patterns of complex natural distribution and their internal dynamic mechanism. It is well documented by many published literatures that ore-forming processes in the Earth’s crust can result in mineral deposits and related geological features being fractal in various spatial aspects, such as clustering of ore occurrences [13,14,15], scaling distribution of fracture networks [16,17], and concentration of mineralized elements [18,19]. Thus, during the last two decades, fractal analysis has been widely employed to provide a highly effective quantification for characterizing the complex distributions of mineralized systems [20,21,22,23]. The spatial association between geological features and mineral occurrences can be revealed by analyzing the links among different fractal patterns [24,25]; however, it still needs to be delineated in a more objective and accurate way [26]. The WofE method has been convincingly demonstrated to quantitatively infer geological controls on mineralization [27,28,29,30]. Indices calculated from the WofE approach are instructive in weighting the relative significance of spatial associations between certain geological features and known mineral occurrences [31]. In addition, the analytical results from the WofE method can be easily developed into a predictive map, thus providing intuitive guides for mineral prospectivity.
The Southern Jiangxi Province (SJP) contains the best known district of quartz vein-type wolframite deposits in the world, including 8 large-scale, 18 medium-scale, and 46 small-scale deposits with a total reserve of 1.5 Mt [32,33]. Although an empirical model, namely, the “five-floors mineralization pattern”, has been proposed and effectively applied to mineral prospecting in the last few decades [32,34], it now meets a bottleneck as most deposits which are easily recognized by their characteristic mineralization patterns have been fully discovered. It becomes necessary to introduce some new methods to facilitate tungsten prospectivity on the basis of the previous exploratory data. The primary aim of this study is to quantitatively evaluate the complexity of key geological features and their controls on tungsten mineralization through a combined method of fractal analysis and the WofE approach. Furthermore, the analytical results yielded in this study provide relevant criteria for further prospecting.

2. Materials and Methods

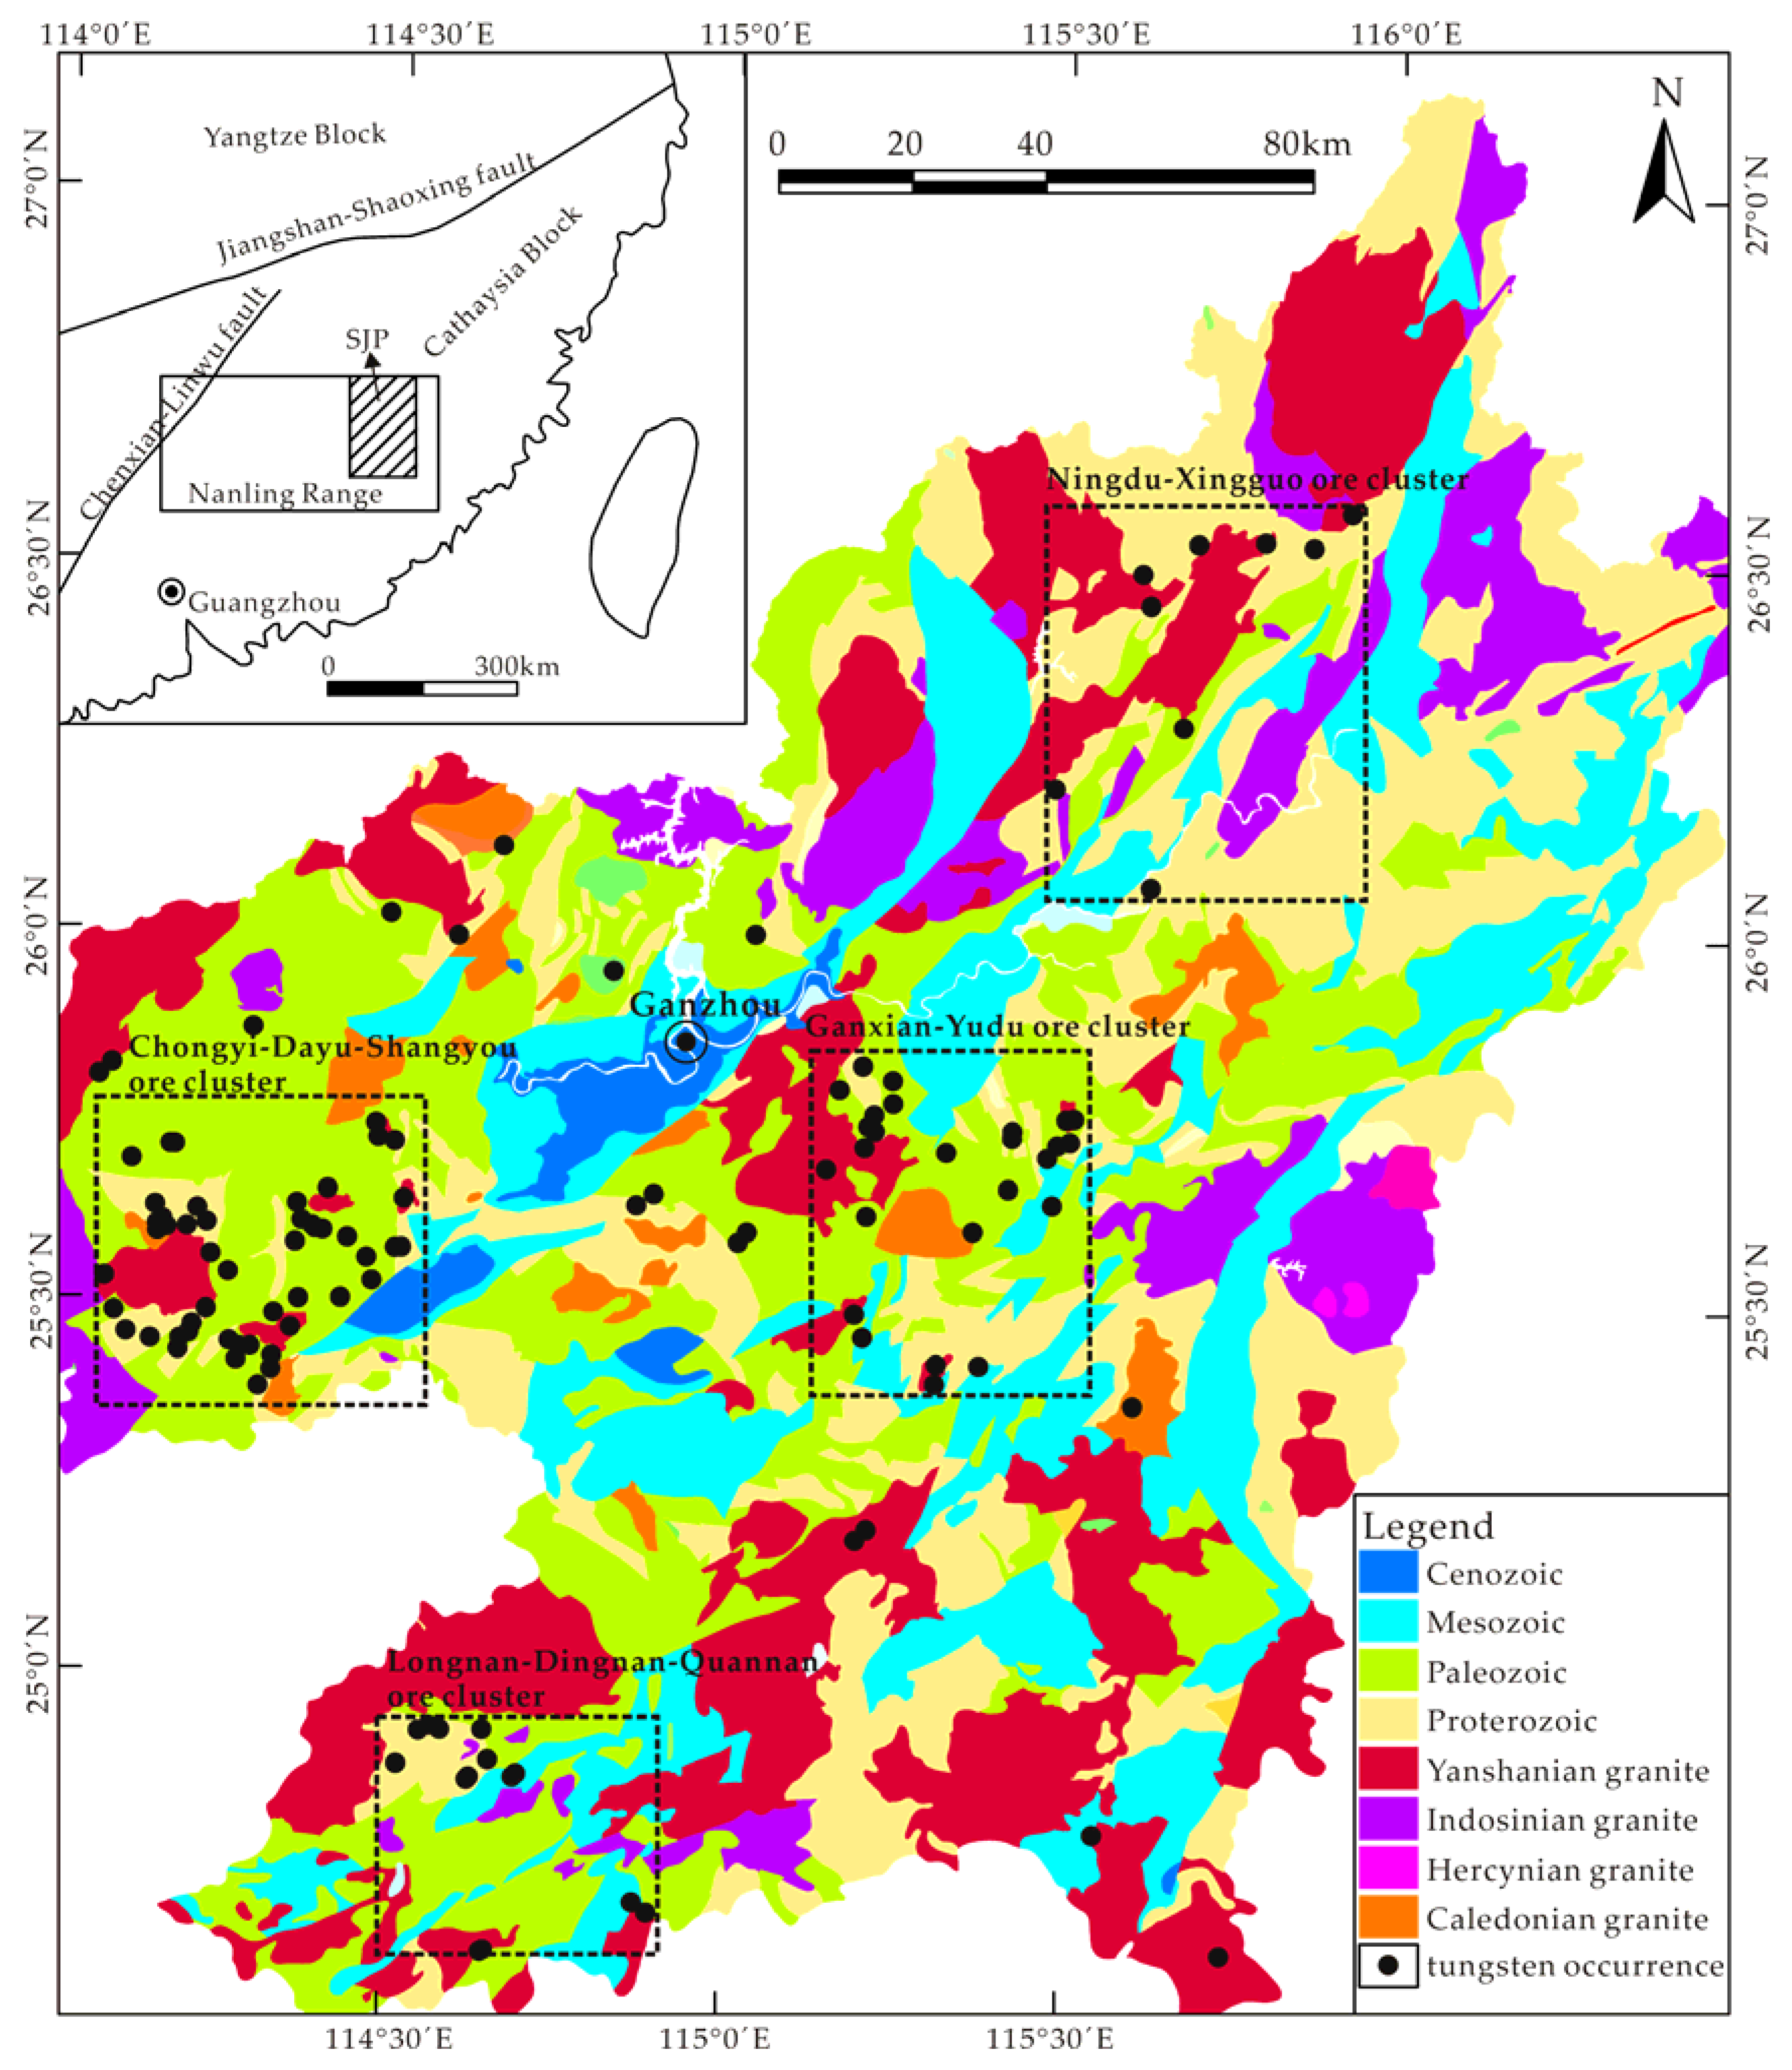
2.1. Study Area and Input Data

The SJP is situated in the central part of the Cathaysia block of the south Yangtze Craton, belonging to the eastern segment of the giant Nanling metallogenic belt (Figure 1). The ages of strata exposed in the study area span from Neoproterozoic to Cenozoic, with the absence of Silurian and Triassic units. The strata can be divided into three lithological sequences (Figure 1): the Precambrian to Ordovician lower greenschist facies clastic rocks constitute the basement of this region, which are covered by the Devonian to Permian shallow marine carbonate and siliclastic rocks, and the Jurassic to Quaternary succession consisting of volcaniclastics and terrigenous red-bed sandstone is preserved in faulted basins [35]. The tectonic framework of the SJP is mainly composed of two fault systems, trending approximately NE and EW, which control the intrusion and emplacement of granitic magma. The SJP has four main episodes of granitic magmatism, including Caledonian (Early to Middle Paleozoic), Hercynian (Late Paleozoic), Indosinian (Early Mesozoic), and Yanshanian (Late Mesozoic) [36], resulting in numerous granitic plutons with an outcropped area of approximately 14,000 km2 (Figure 1). Yanshanian tectonic–magmatic activity is believed to be responsible for the extensive tungsten mineralization in this region [34,37,38]. The widespread outcropped Yanshanian granites mainly comprise biotite monzogranite, monzonite, and porphyritic monzogranite [35]. The widely distributed tungsten deposits in the SJP are dominated by quartz vein-type, with lesser amounts of skarn- and greisen-types [34]. Four important ore districts containing most of the tungsten occurrences in this area are highlighted in Figure 1, namely Chongyi-Dayu-Shangyou, Ganxian-Yudu, Longnan-Dingnan-Quannan, and Ningdu-Xingguo.
The tungsten occurrences including known deposits and prospects were extracted from the Database of Ganzhou Bureau of Mineral Resources (DGBMR). The regional faults (as line objects), fault intersections (as point objects), and Yanshanian granites (as areal surface objects) were also extracted from DGBMR and investigated as potential controls since they had already been shown to be associated with tungsten mineralization to some extent by previous geochemical and geotectonic studies [32,36,39,40]. The quality of input data is critical for generating reliable results of spatial analysis [26]; thus, it should be evaluated before further analysis. Potential limitations mainly lie in the quality and homogeneity of data and effect of cover. All the mineralized, structural, and magmatic information was extracted from the same database built based on field work of 1:300,000 scale regional mapping, therefore avoiding potential heterogeneities induced by multi-source data. The quality of the geological data was then examined via different ways. These occurrences were examined by comparing with the data from the Database of Mineral Resources of China [41]. The regional faults under analysis were confined to those outcropped in the shallow rocks, whereas the inferred basement faults stored in the database are excluded in this study because (1) they are not confirmed by reliable means, and (2) they may impose different constraints on mineralization when compared with outcropped faults. The ages of extracted Yanshanian granites were examined by the geochronological data in the published literature [34,35,36,37,40]. The effect of cover cannot be easily evaluated and reduced before spatial analysis [26]; however, a discussion about cover effect on analytical results was made after spatial analysis in the subsequent sections in this paper, and those results that are strongly affected by cover effect were not taken into account for providing predictive criteria.
All the examined original data were compiled to vector formats and imported into the ArcGIS 10.0 platform (Environmental Systems Research Institute, Redlands, CA, USA) for the subsequent spatial analyses (Figure 2).

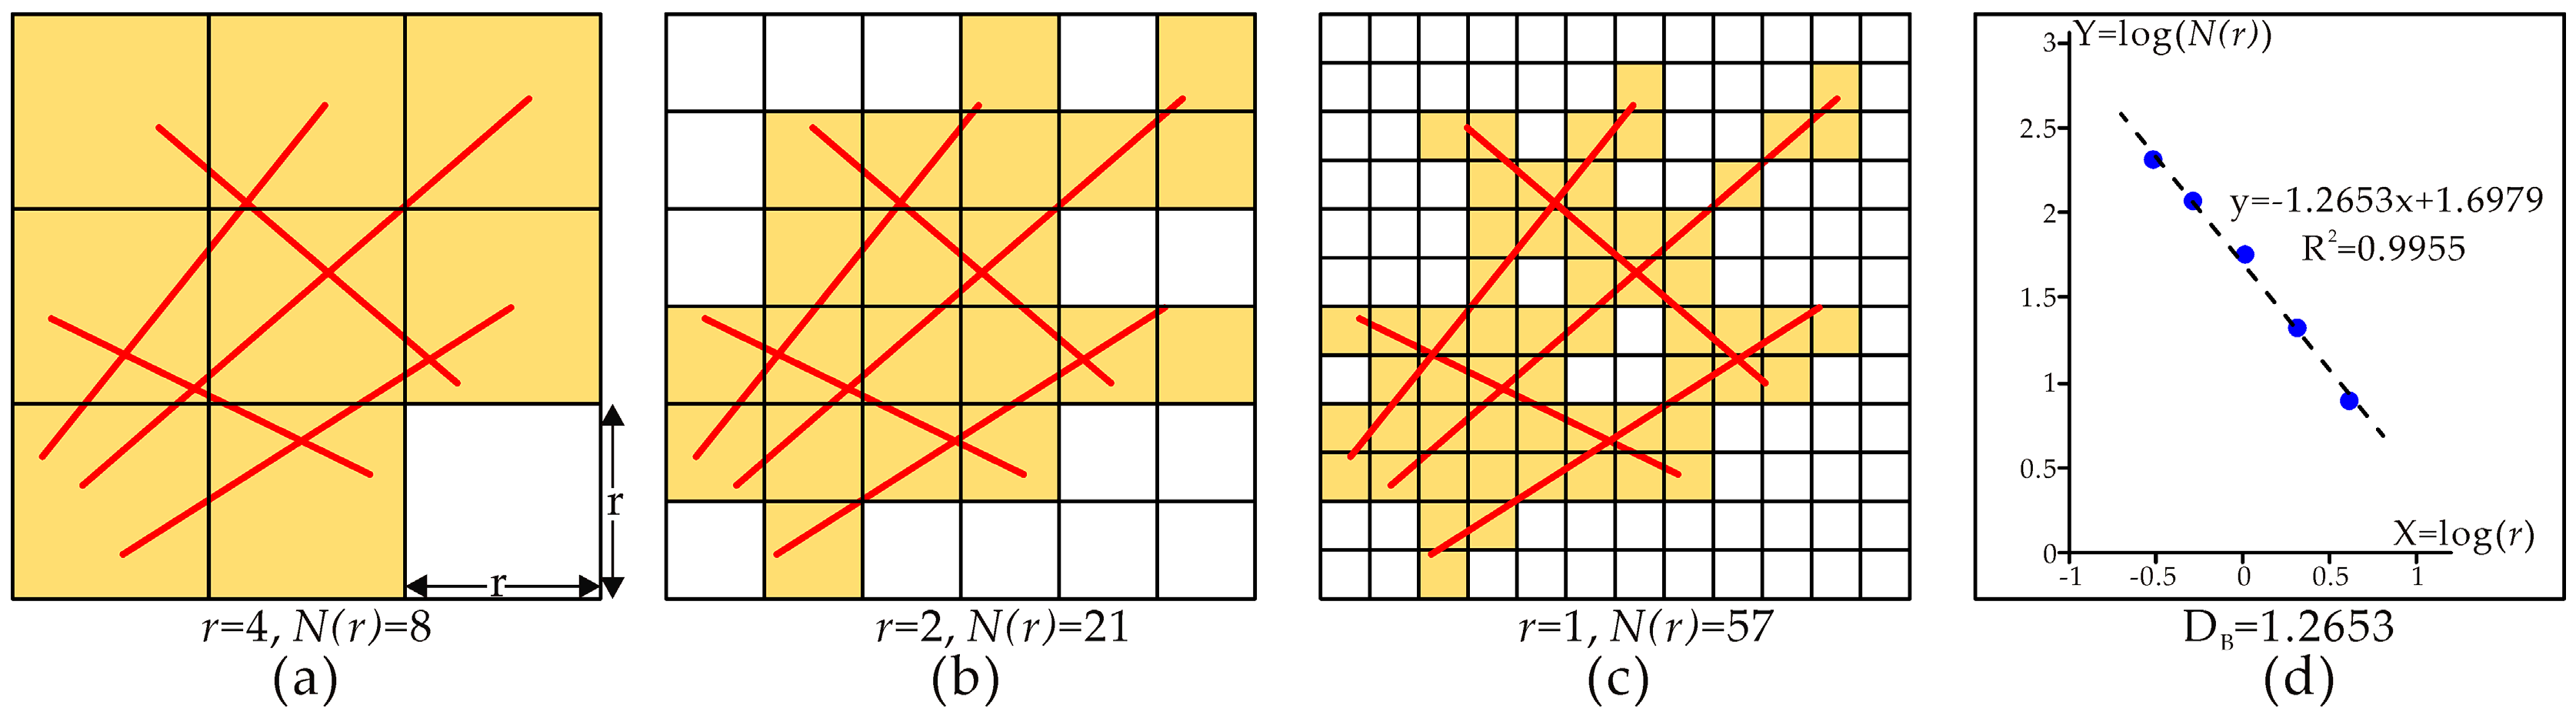
2.2. Box-Counting Fractal Analysis

A “fractal” pattern has an exclusive characteristic of self-similarity which consists of parts that are more or less similar to the whole pattern in some geometrical attributes (e.g., shape, length, or density). This scale-invariance can be represented by a power law type of proportional relationship between a measurement and its scale [12]. The box-counting method is most commonly used in geological pattern analyses. In this method, the study area featured with geological constraints is overlain by a grid or raster which comprises square boxes or cells with side length r, and then the number N(r) of those boxes containing parts of geological features is counted (Figure 3a). The above process is repeated using a different size r to obtain a corresponding box number N(r) (Figure 3b,c). If the pattern under analysis is a fractal pattern, the relationship between N(r) and r should follow a power law function, which can be expressed as [12]
N ( r ) A r D
where D is the box-counting fractal dimension (DB), and A is a constant. Practically, a graph of log(N(r)) versus log(r) is plotted and a best-fit regression line is drawn using the least square method, while the slope of the regression line represents the box-counting fractal dimension (Figure 3d).
The study area was divided into 30 subregions with side lengths of 40 km × 40 km (see Figure 2a for the location and ID of each subregion), and the routine of the box-counting method was performed in each subregion. It is important to note in the implementation that (1) the grids with different box size r should cover exactly the same area, and (2) the box size r should be determined in a reasonable range so that the minimum size can reflect the variance of scales and the maximum size cannot exceed the total size of the study region [26]. On the basis of this consideration, the scaling box sizes in this study were determined as 0.5 km, 1 km, 2 km, 5 km, and 10 km in the iterative processes.

2.3. Weights of Evidence Method

The WofE method is a data-driven statistical method which was originally developed for medical diagnosis, and was then introduced into geoscientific fields for studying the relative importance of geological objects and minimizing subjective bias [42,43]. The WofE method offers a quantitative measurement of spatial association between a given geological feature and target occurrences, e.g., mineral deposits, prospects, or geological anomalies [44].
A detailed mathematical description of the WofE method can be found in Bonham-Carter (1994). In the GIS-based application of an ore-related analysis, the WofE analysis is implemented on the basis of binary pattern using a log–linear format of the Bayesian probability model [42]. Firstly, the study area is divided into T units of equal size, among which D units are occupied by mineral occurrences. The prior probability can be defined as
P p r i o r = P ( D ) = D T ,
and the relative importance of spatial association between geological feature Bi and mineralization is estimated by a pair of weights, namely, the positive weight W+ and the negative weight W, which can be given by
W + = ln { P ( B | D ) P ( B | D ¯ ) } ,   W = ln { P ( B ¯ | D ) P ( B ¯ | D ¯ ) } ,
where P() denotes the corresponding probability; B and B ¯ are the presence and absence of geological features; and D and D ¯ are the presence and absence of mineral occurrences. P(B|D), for example, represents the probability of B occurring given the presence of D. The contrast C is defined as an overall measurement of spatial correlation, which is given by
C = W + W .
A geological feature is considered to be closely related to mineral occurrences if their contrast C is greater than a threshold value of 0.5 [26]. Finally, the posterior odds can be calculated by the following equation [42]:
O p o s t e r i o r = exp { ln [ P ( D ) 1 P ( D ) ] + j = 1 n W j } ,
where Wj is the weight of geological feature j, and the posterior probability can be given by [42]
P p o s t e r i o r = O p o s t e r i o r 1 + O p o s t e r i o r .
In order to evaluate the uncertainty of the contrast C, the Studentized contrast, obtained from a Student t-test, is employed here and defined as
C s = C S ( C ) = C S 2 ( W + ) + S 2 ( W )
where S() denotes the standard deviation of the corresponding parameter. Practically, a widely accepted threshold is determined as 1.96, above which spatial association of analyzed features can be considered statistically significant [42].
Taking into consideration the scale of the original data map and the minimum distance between neighbor mineral occurrences, a cell of 2 km × 2 km was used in the WofE calculation in this study. A total of 16,800 cells were established for the subsequent WofE analysis.

3. Results and Discussion

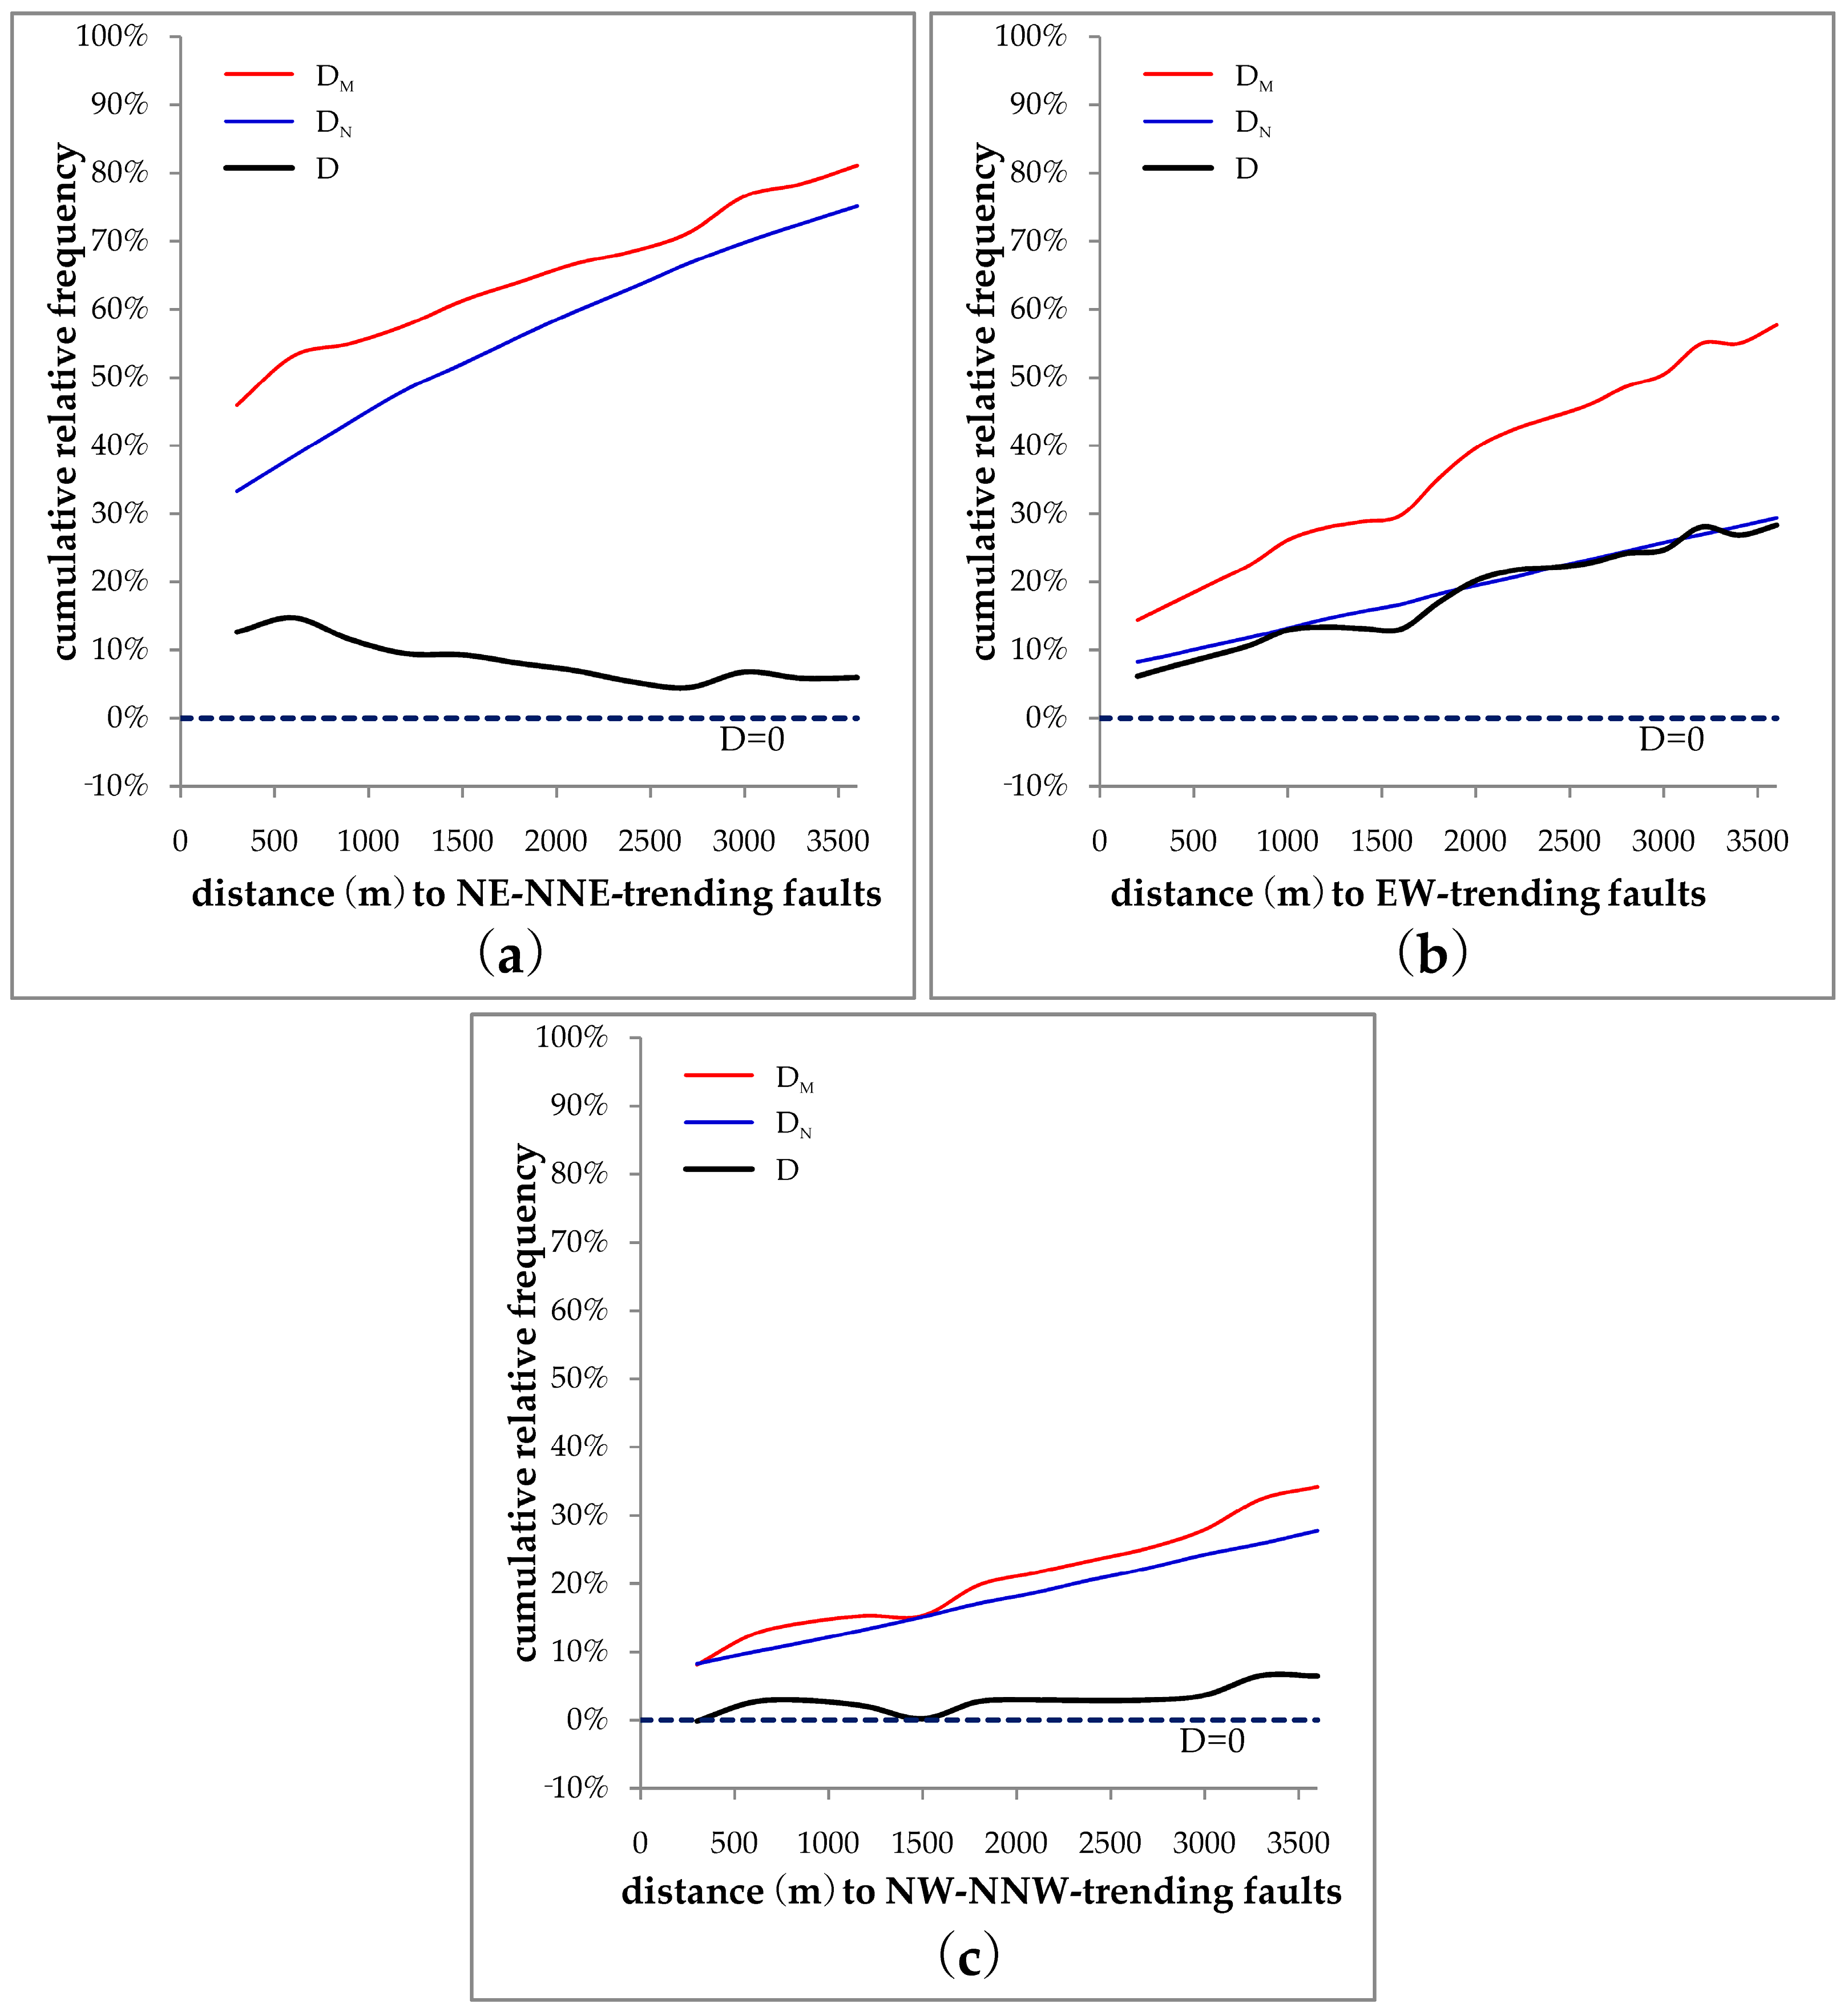
3.1. Selection of Ore-Related Faults

The fracture system in the SJP is complex. Although it has been well documented that the NE and EW-trending basement faults control the emplacement of Yanshanian granites and the following tungsten mineralization [32,34,39], the densely distributed faults outcropped in the shallow rocks may be the products of tectonic events developed in various episodes spanning from Caledonian to Yanshanian [36,45]. In order to identify the roles of these faults in different orientations as related to tungsten mineralization, a distance distribution analysis has been performed. In this analysis, we calculated the cumulative relative frequency according to a given distance from a certain geological feature to (1) mineral occurrence locations (denoted by DM) and (2) non-occurrence locations (denoted by DN). DN represents a naturally random probability density distribution of a regular pattern within the buffering range of the given distance, while DM indicates a non-random probability density distribution of the mineralized pattern, characterized by unevenly clustering within the range. The difference D, which is calculated by (DMDN), represents how much the cumulative frequency of mineral occurrences (i.e., DM) is higher or lower than that expected due to chance (i.e., DN), implying a positive or negative spatial distribution of the analyzed geological feature with mineralization.
The results show that NE–NNE-trending and EW-trending faults have positive spatial association with tungsten occurrences. According to the curve of D, there is an at most 15% higher occurrence frequency than that which would be expected due to change within 600 m from NE–NNE-trending faults (Figure 4a). Within 3200 m from EW-trending faults, there is an at most 28% higher occurrence frequency than that which would be expected (Figure 4b). These results are reasonable as NE–NNE-trending faults are more likely syn-metallogenic structures controlling the localization of ore deposits in a local scale [46], and the EW-trending faults were formed and reactivated several times in different tectonic episodes before Yanshanian [32,46], more possibly as a regional-scale factor, show their controlling effect in a wider range. The NW–NNW-trending faults, however, exhibit a very weak spatial association with tungsten occurrences. Within the 3000 m from NW-trending faults, there is an at most 3% higher occurrence frequency than expected (Figure 4c). The nearly random distribution pattern implies that NW–NNW-trending faults and tungsten mineralization are spatially independent. Combined with the phenomenon that NE–NNE-trending and EW-trending faults are usually cut by NW–NNW-trending faults in many locations (Figure 2b), it is plausible that NW–NNW-trending faults were not activated to form favorable pathways for ore-forming fluid during the metallogenic period or they were formed after the mineralization. Thus, only NE–NNE (marked in red in Figure 2b) and EW (marked in blue in Figure 2b) trending faults, as well as the intersections of the faults oriented in these directions (marked in red in Figure 2c), were employed for the fractal and WofE analyses in the following sections.

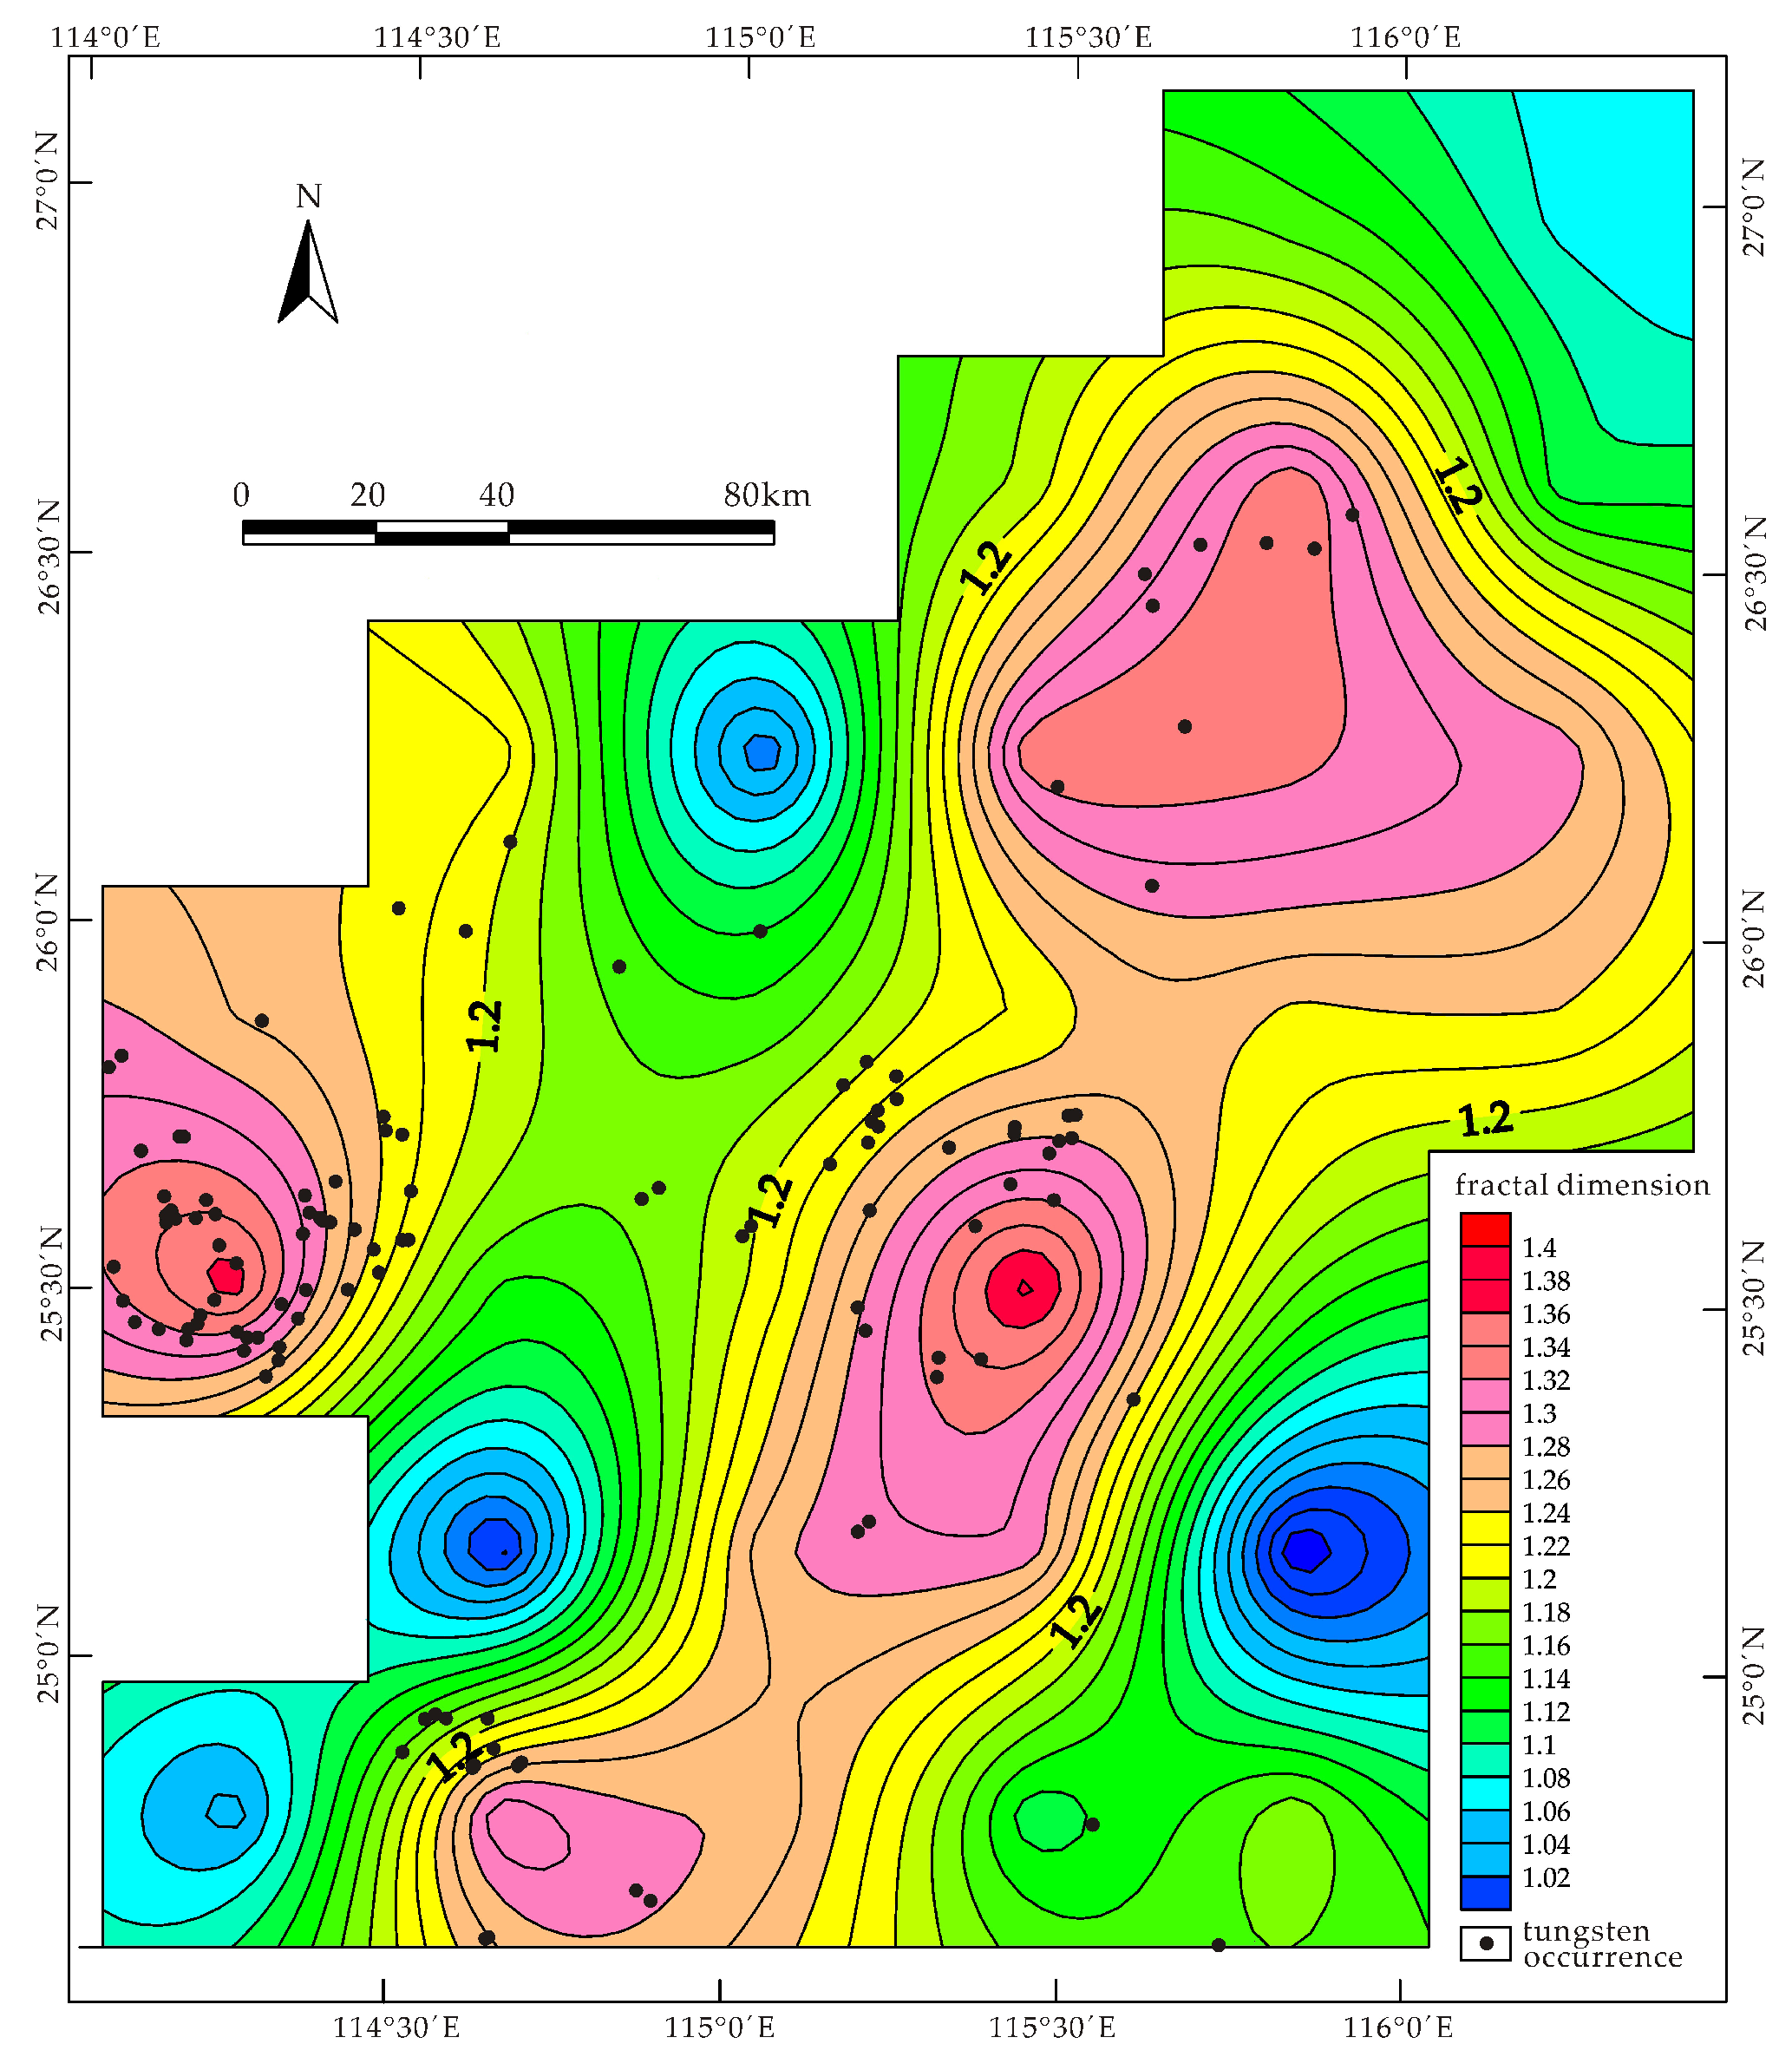
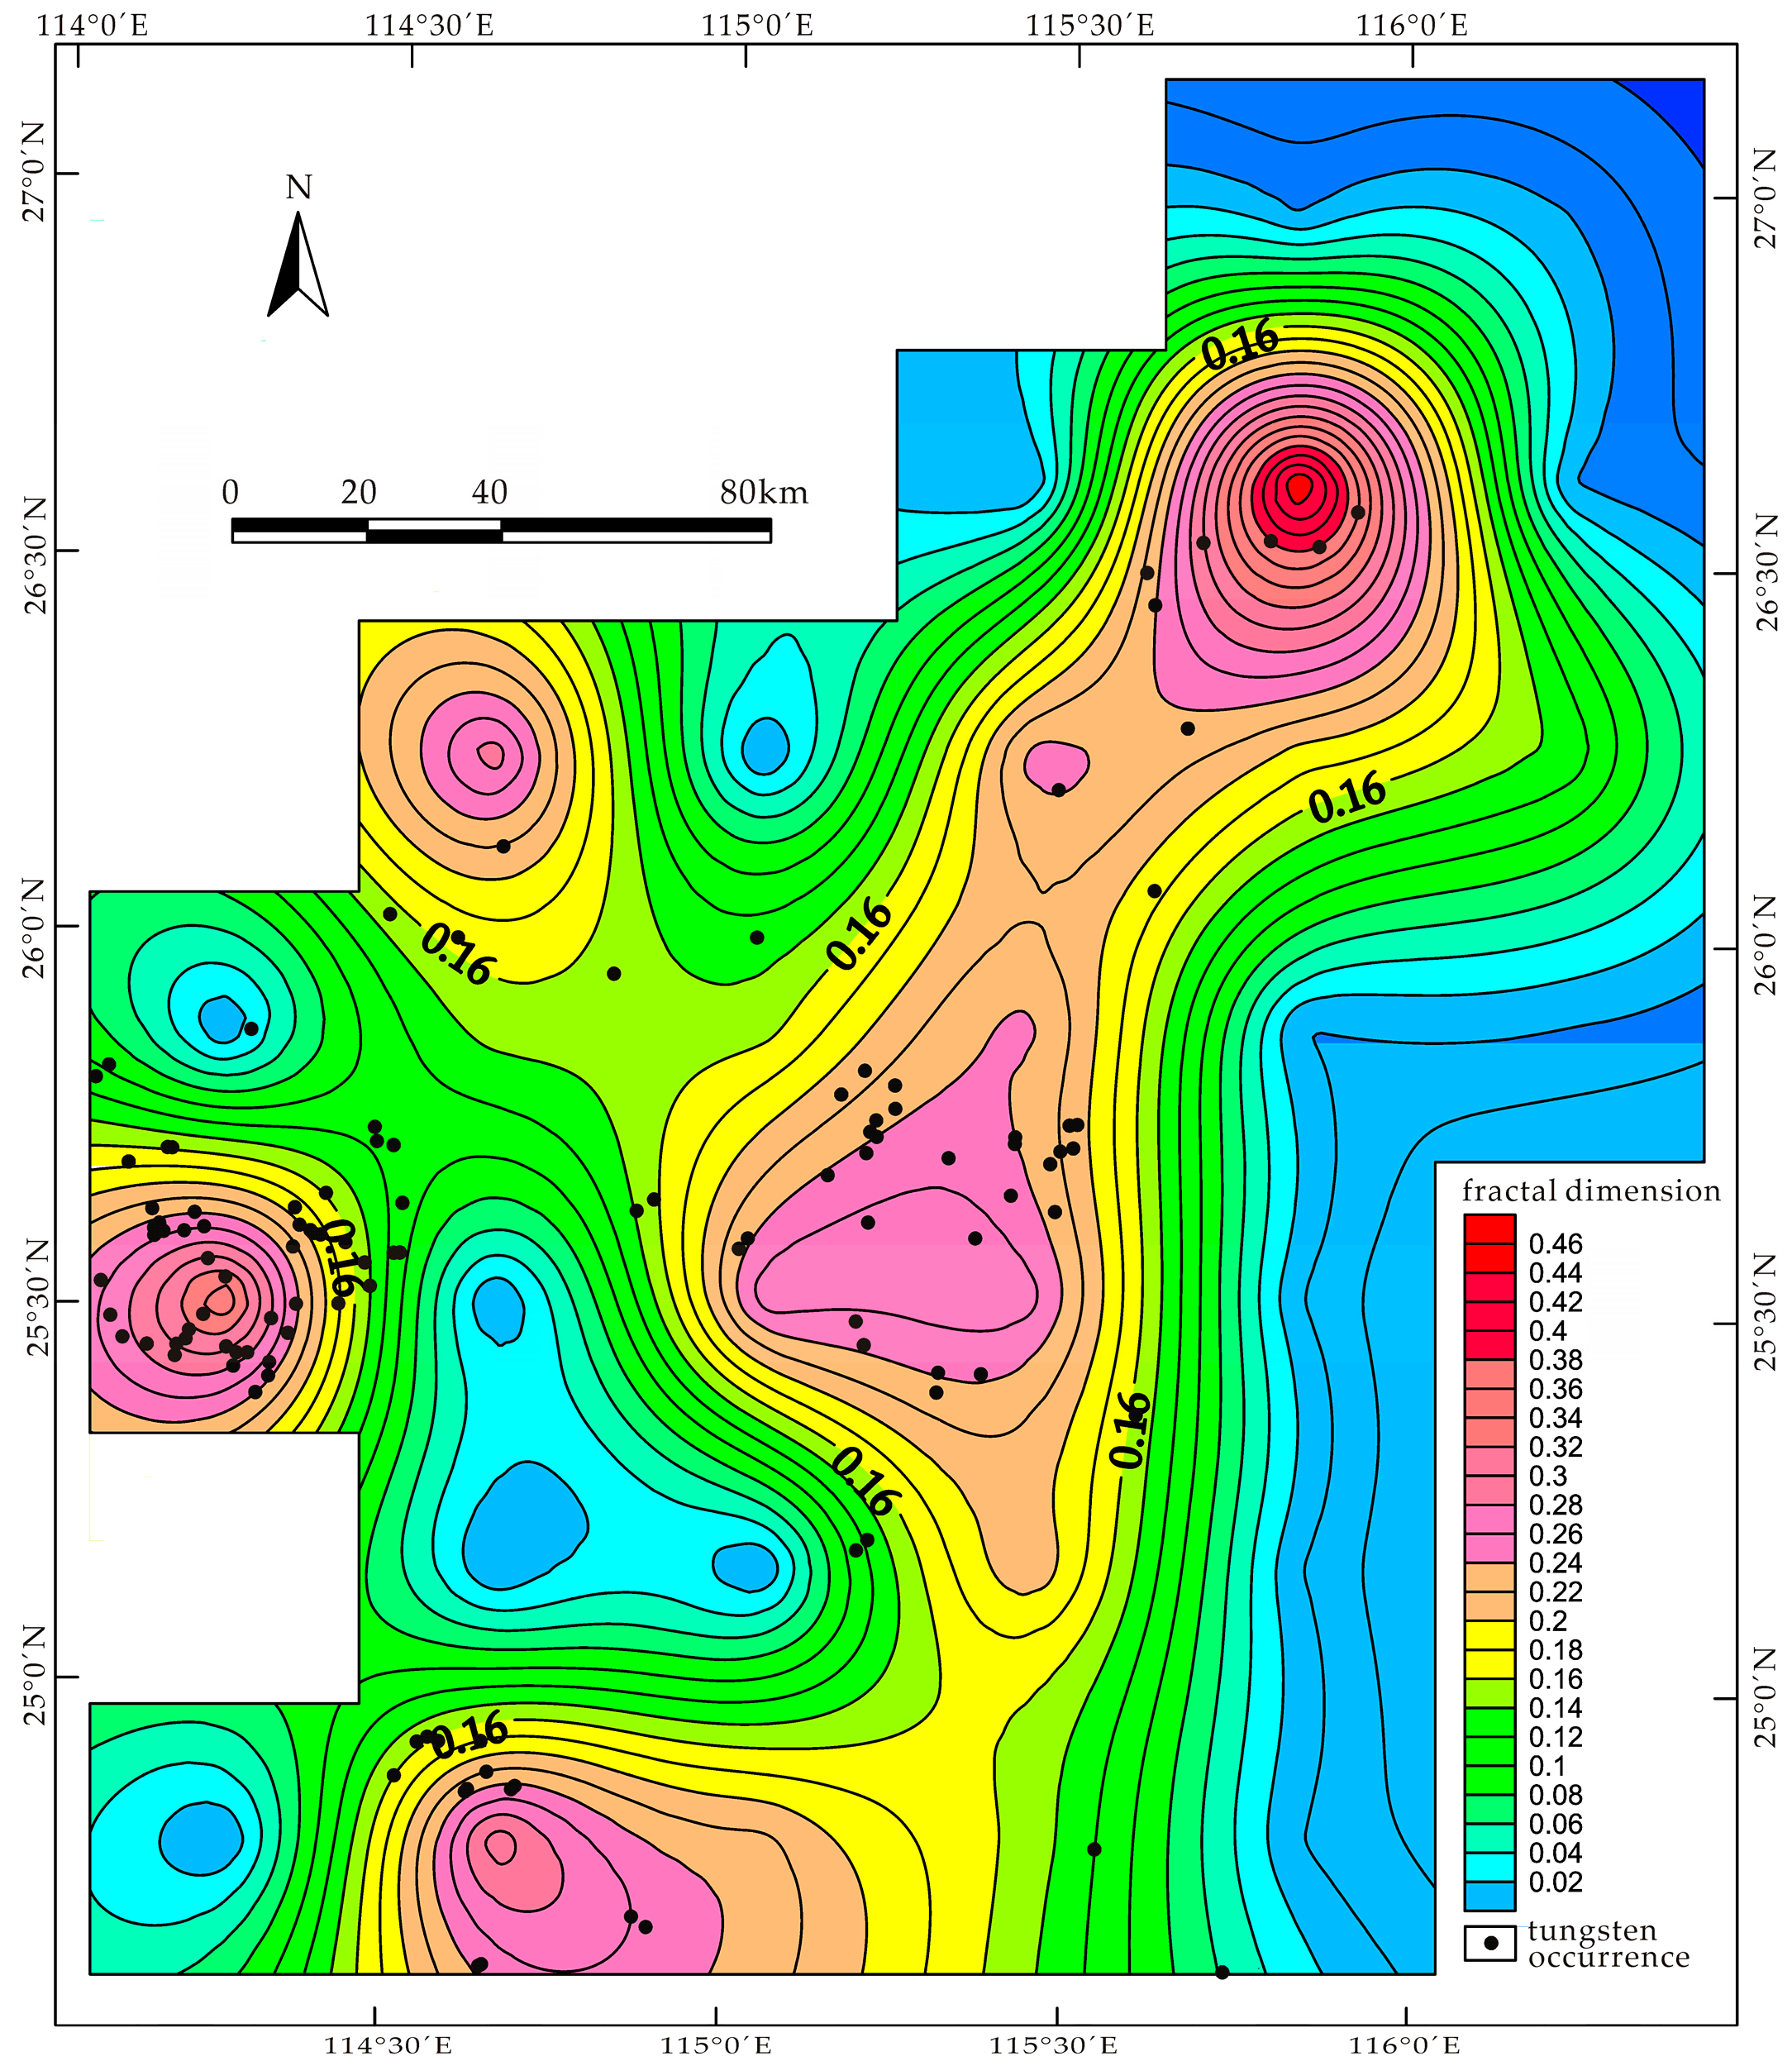
3.2. Fractal Characteristics of Geological Features

The box-counting fractal dimensions of regional faults yield a variation of 1.389 in Region 20 to 0.938 in Region 25 (Table 1). There is a good correlation between the fractal dimensions of faults and the tungsten occurrences. The three regions containing the highest fractal dimensions pertain to the Ganxian-Yudu (Region 20, DB = 1.389), the Chongyi-Dayu-Shangyou (Rigion 17, DB = 1.373), and the Ningdu-Xingguo (Region 04, DB = 1.341) ore districts (Table 1), followed by Region 27 with the sixth highest fractal dimension (1.319) belonging to the Longnan-Dingnan-Quannan ore district. More specifically, a contour map was utilized to visualize the variation of fractal dimensions in the study area, which is generated by spatial interpolation after assigning calculated fractal dimensions to the centers of the corresponding subregions. As depicted in Figure 5, most of the tungsten occurrences are located in those regions where the fractal dimensions of faults are greater than 1.2. However, it is notable that Region 13, pertaining to the Ganxian-Yudu ore district, also contains nine tungsten occurrences but has a relatively low value of fractal dimension (DB = 1.148). The reason for this may be the lack of effective outcrop, as Ganzhou City, the biggest city of Southern Jiangxi Province, is situated in this area.
The fractal dimensions of fault intersections vary from 0.468 in Region 4 to 0.134 in Region 10, and exhibit a close correlation with tungsten occurrences. As illustrated in Figure 6, most of the mineral occurrences are distributed in the regions where fractal dimensions are greater than 0.16. The low threshold value is due to null values caused by insufficient fault intersection of NE–NNE- and EW-trending faults. The maximum value of the fractal dimension is derived from Region 4, which belongs to the Ningdu-Xingguo ore district. Region 17 (DB = 0.360) in the Chongyi-Dayu-Shangyou ore district, Region 27 (DB = 0.313) in the Longnan-Dingnan-Quannan ore district, and Regions 19 (DB = 0.273) and 20 (DB = 0.268) in the Ganxian-Yudu ore district all have high fractal dimensions, ranking as the top six of all subregions.
As shown in Figure 5 and Figure 6, the contour maps are highlighted by several concentrated centers of high fractal dimension. All of the four centers in Figure 4 and four out of the five centers in Figure 5 coincide with four main ore districts in the SJP, suggesting a regional control of areas with high structural fractal dimension on tungsten mineralization.
The fractal dimensions of Yanshanian granite intrusions range from 1.859 in Region 03 to 1.159 in Region 15. It seems that the correlation between Yanshanian intrusions and tungsten occurrences is weak. Regions 17, 27, 19, 20, and 13, which contain dense tungsten occurrences, have intermediate values of fractal dimensions (Table 1). As shown in Figure 7, the tungsten occurrences are distributed in a wide range with irregularly varying fractal dimensions rather than in a clustering trend around some concentrated centers of high fractal dimension.
The complexity of geological features related to mineralization can be effectively and quantitatively measured by fractal analysis. Nonetheless, the correlation between these geological features and mineral occurrences can only be discussed in a qualitative way. To overcome this drawback, we have conducted a WofE analysis to quantitatively evaluate the correlation of geological features and mineralization.

3.3. Quantitative Measurement of Spatial Association and Implications for Further Prospectivity

Buffer analysis and Student’s t-test were employed to determine the optimum influencing range of geological features used in the WofE analysis, based on which the spatial associations between these geological features and tungsten occurrences have been measured and discussed.

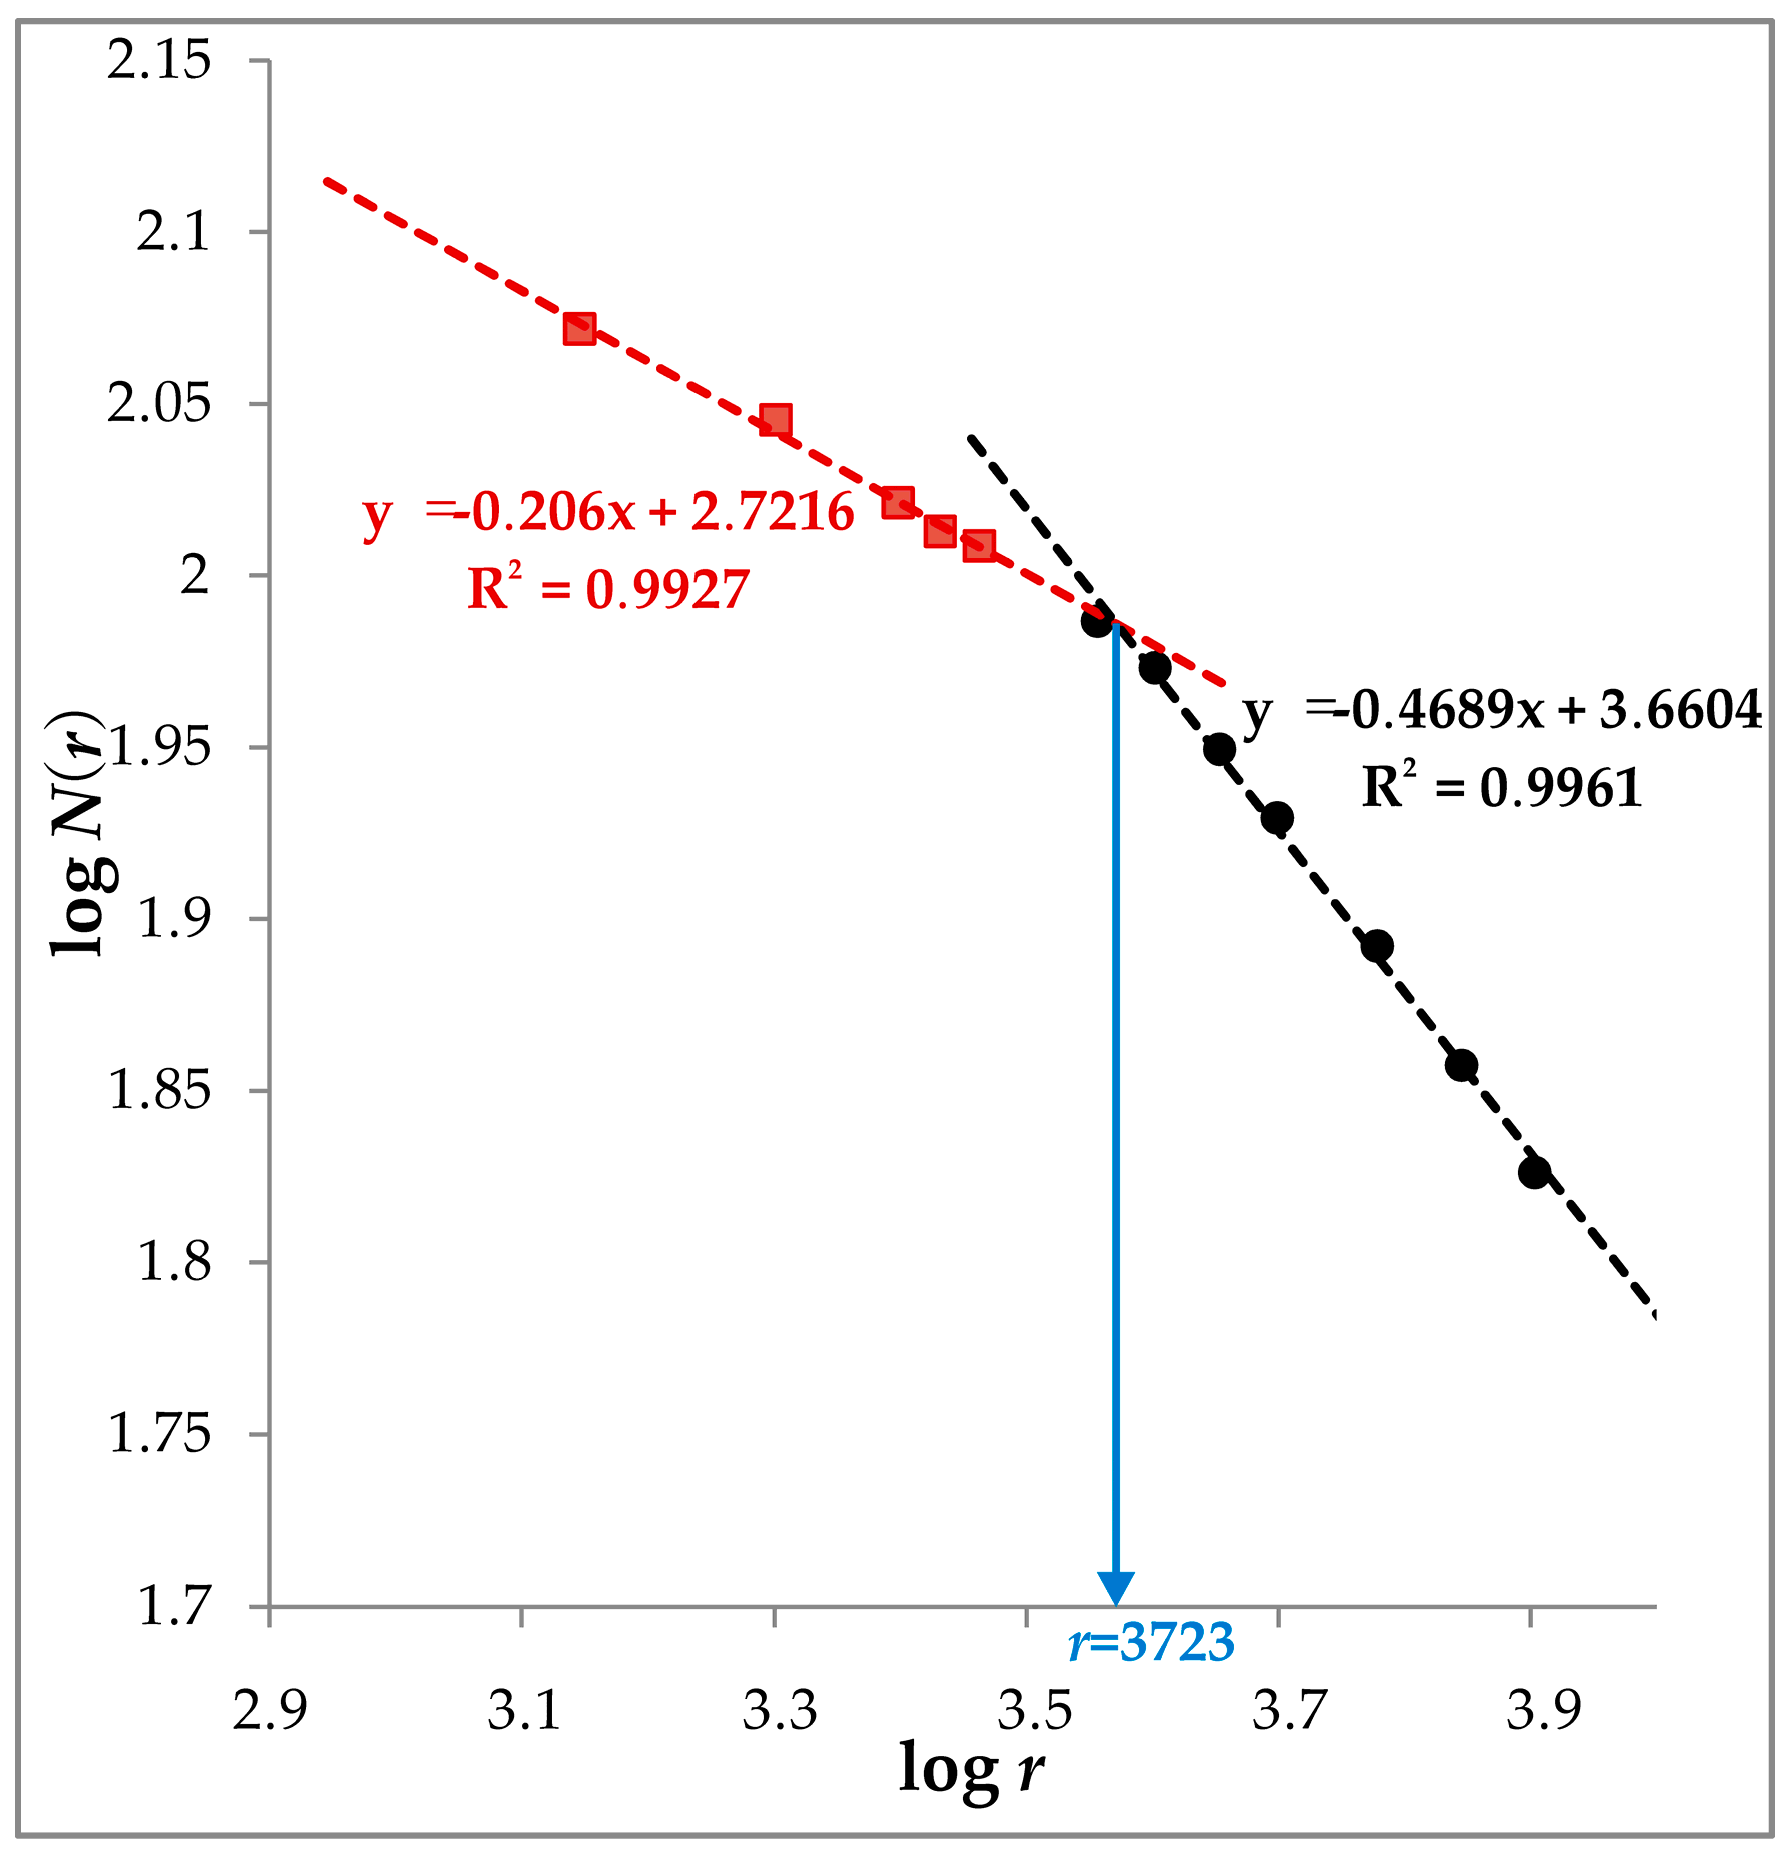
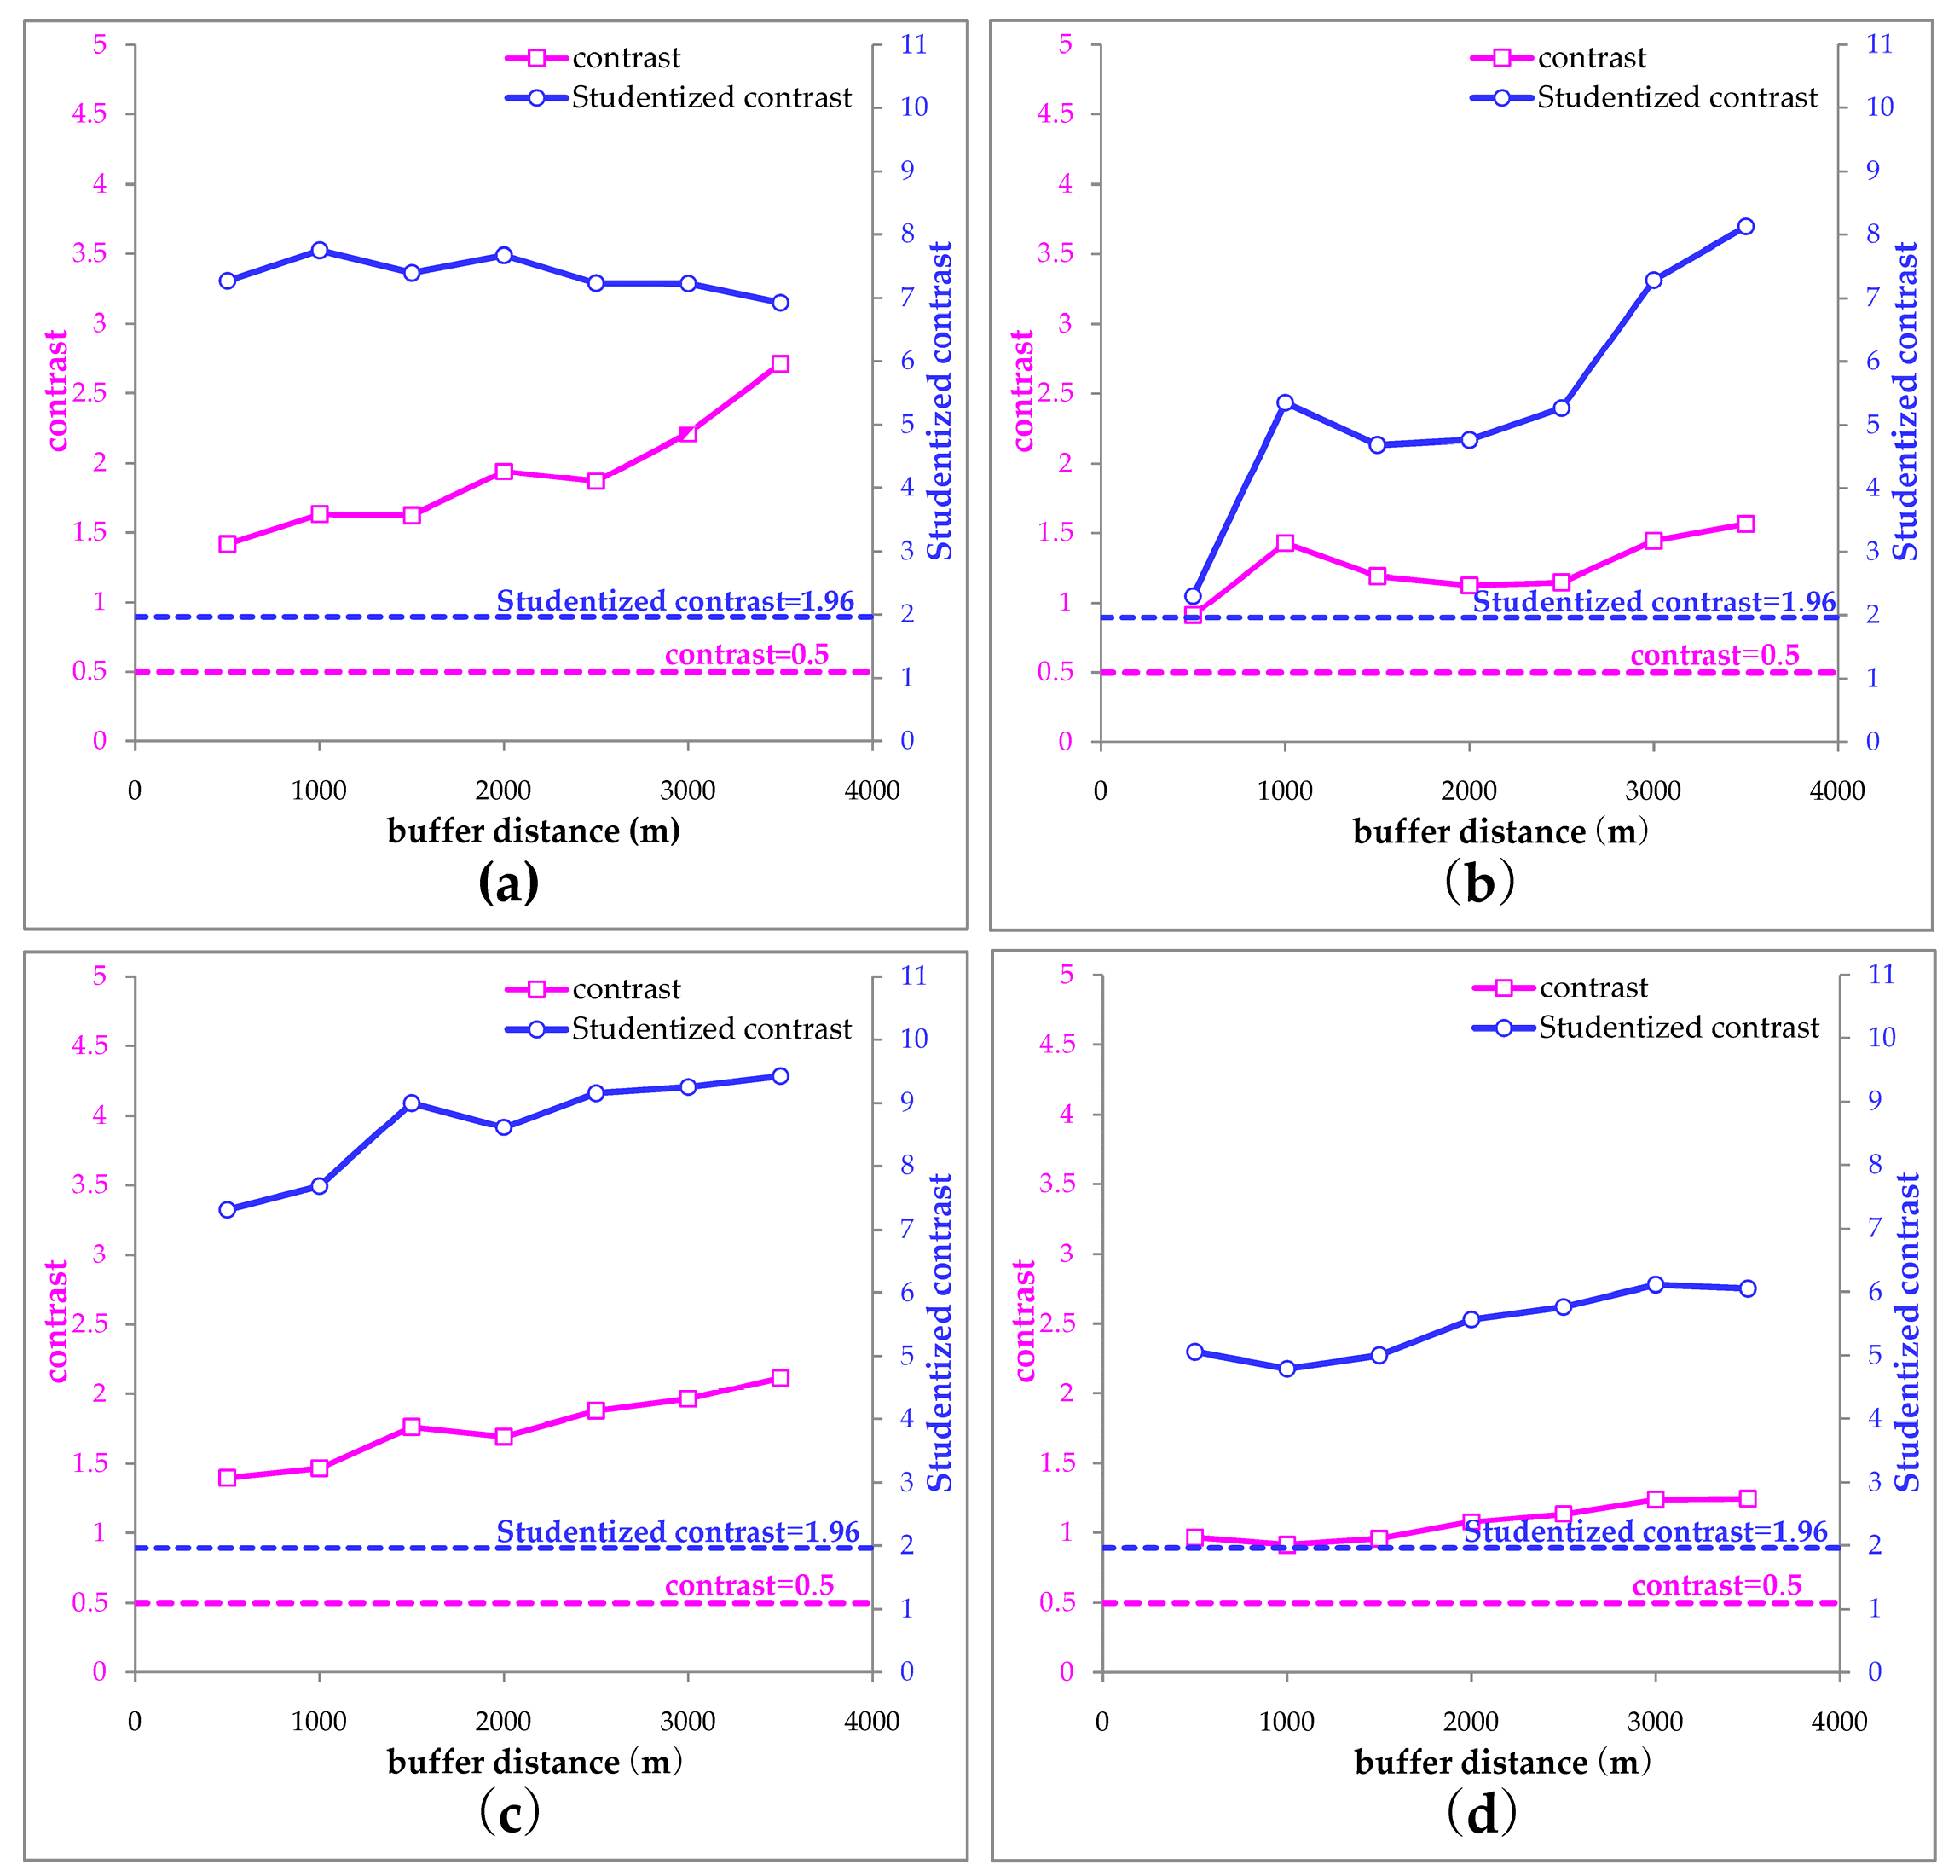
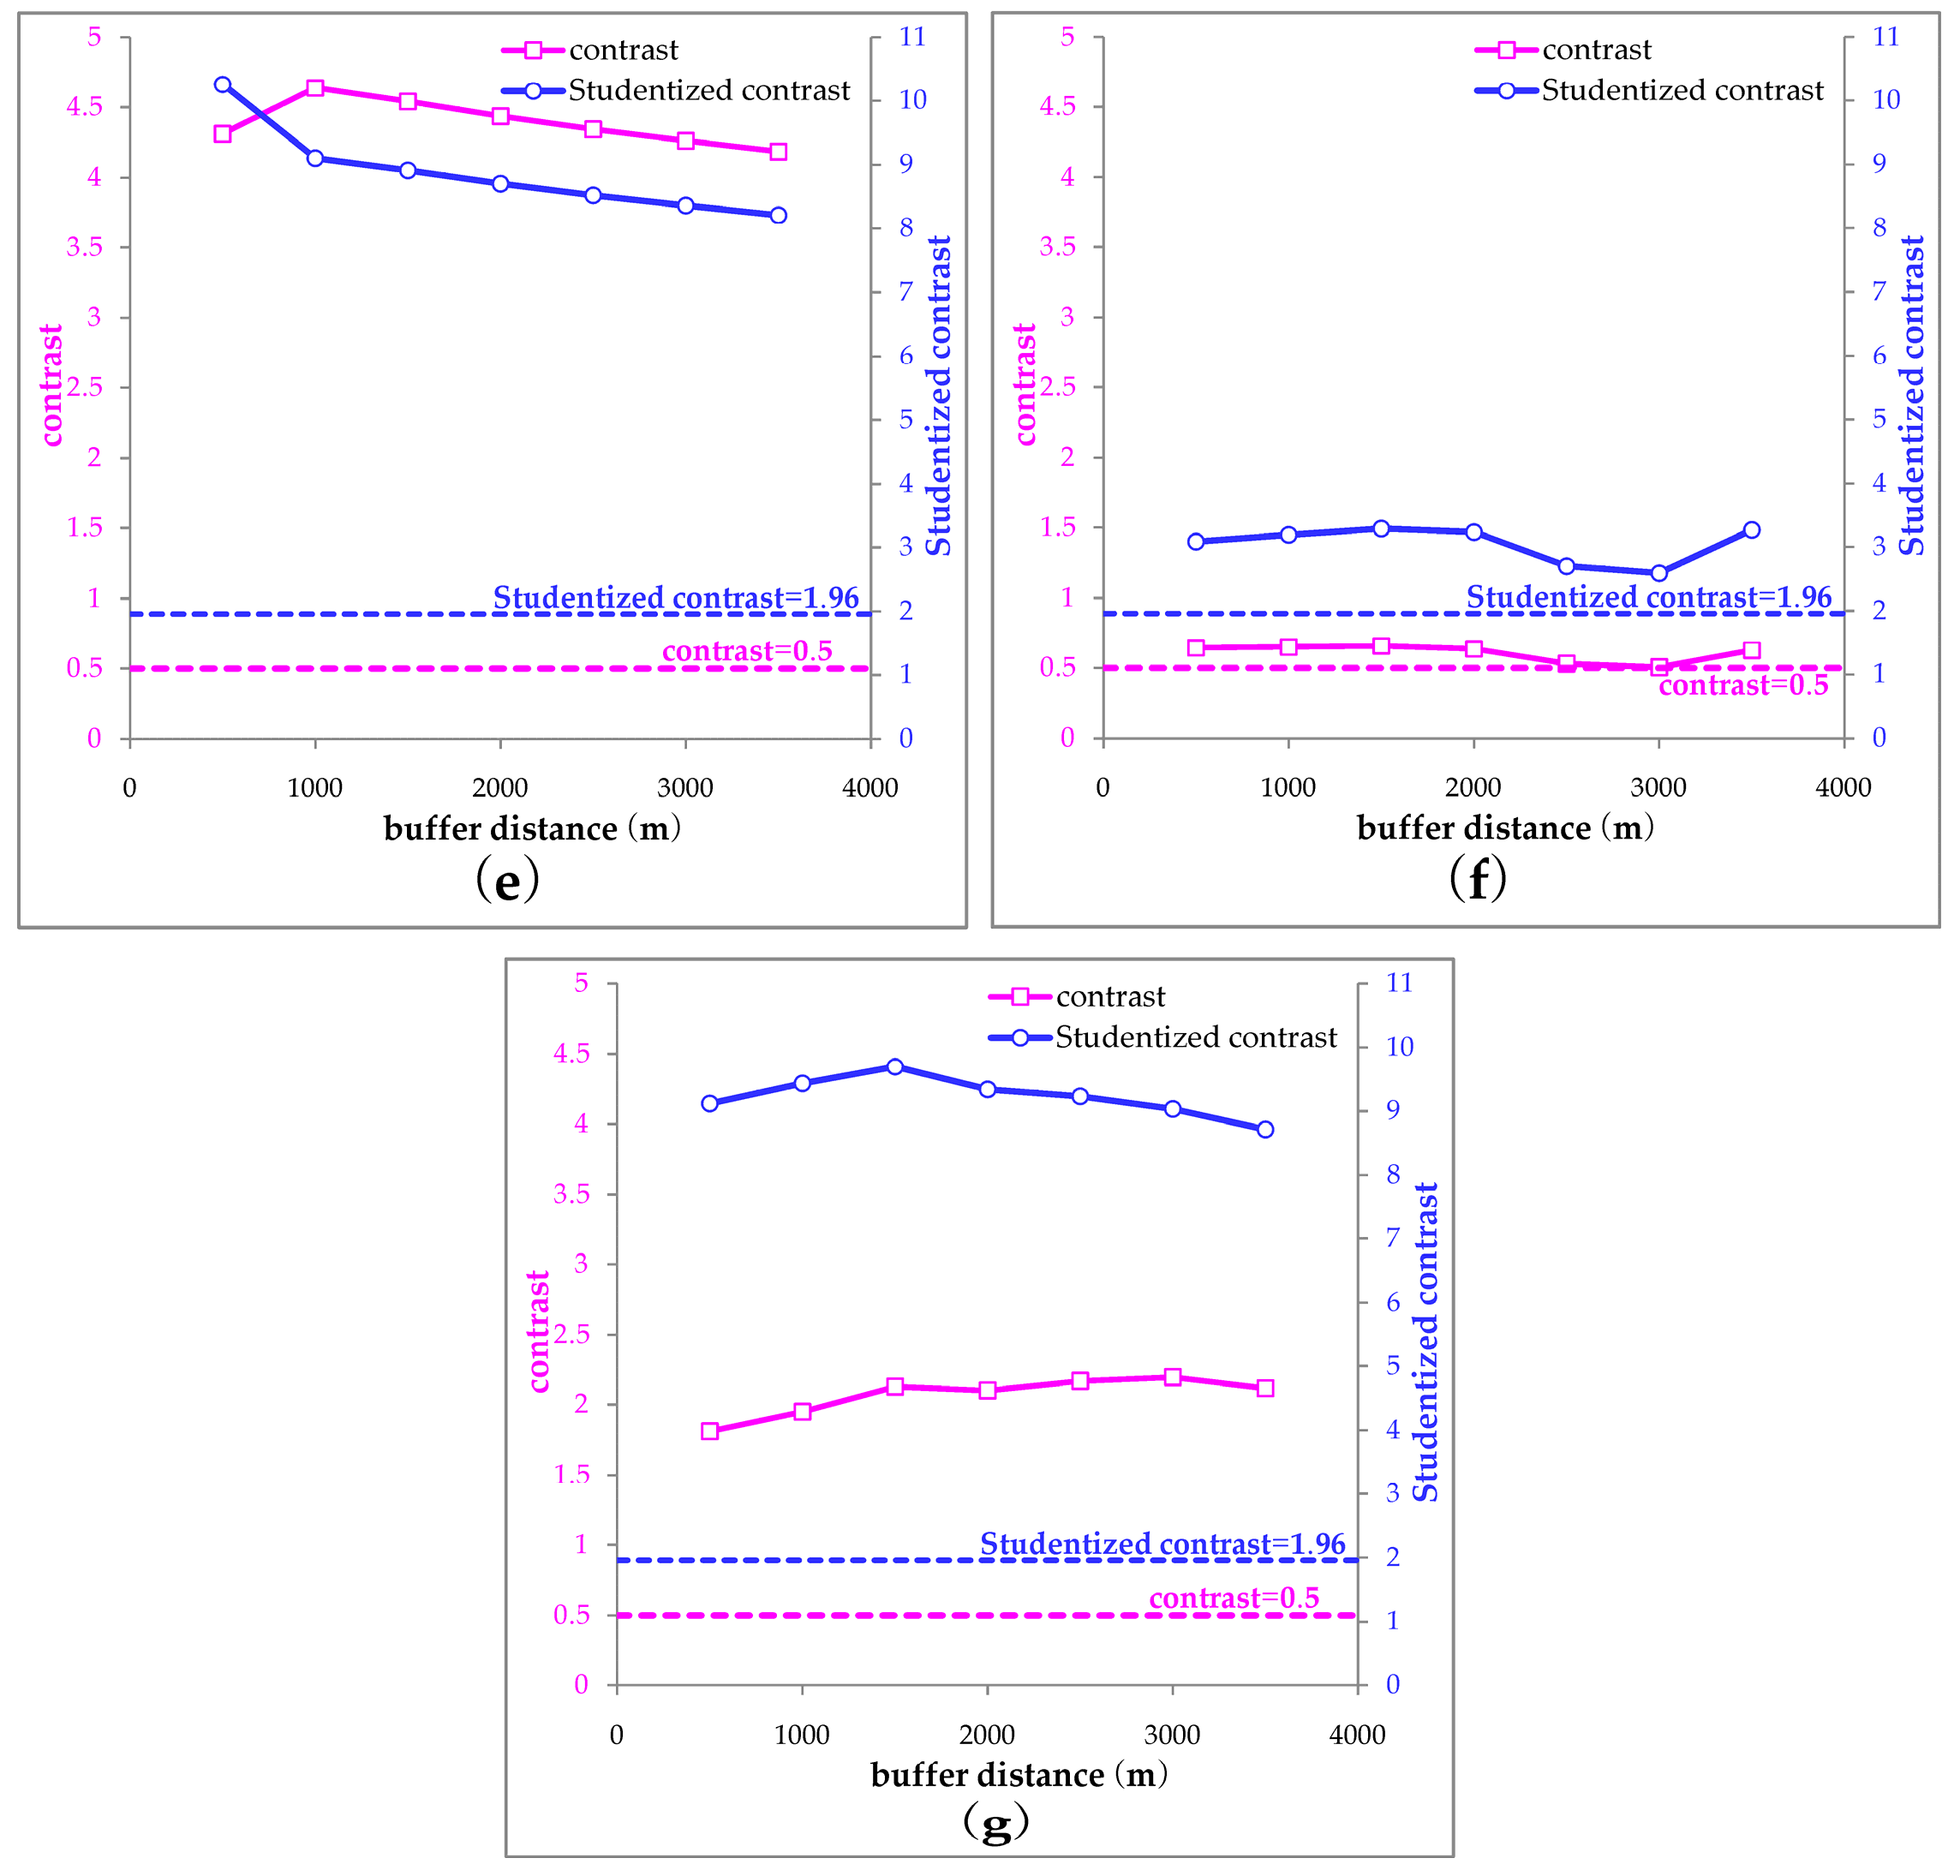
3.3.1. Determination of Buffer Range
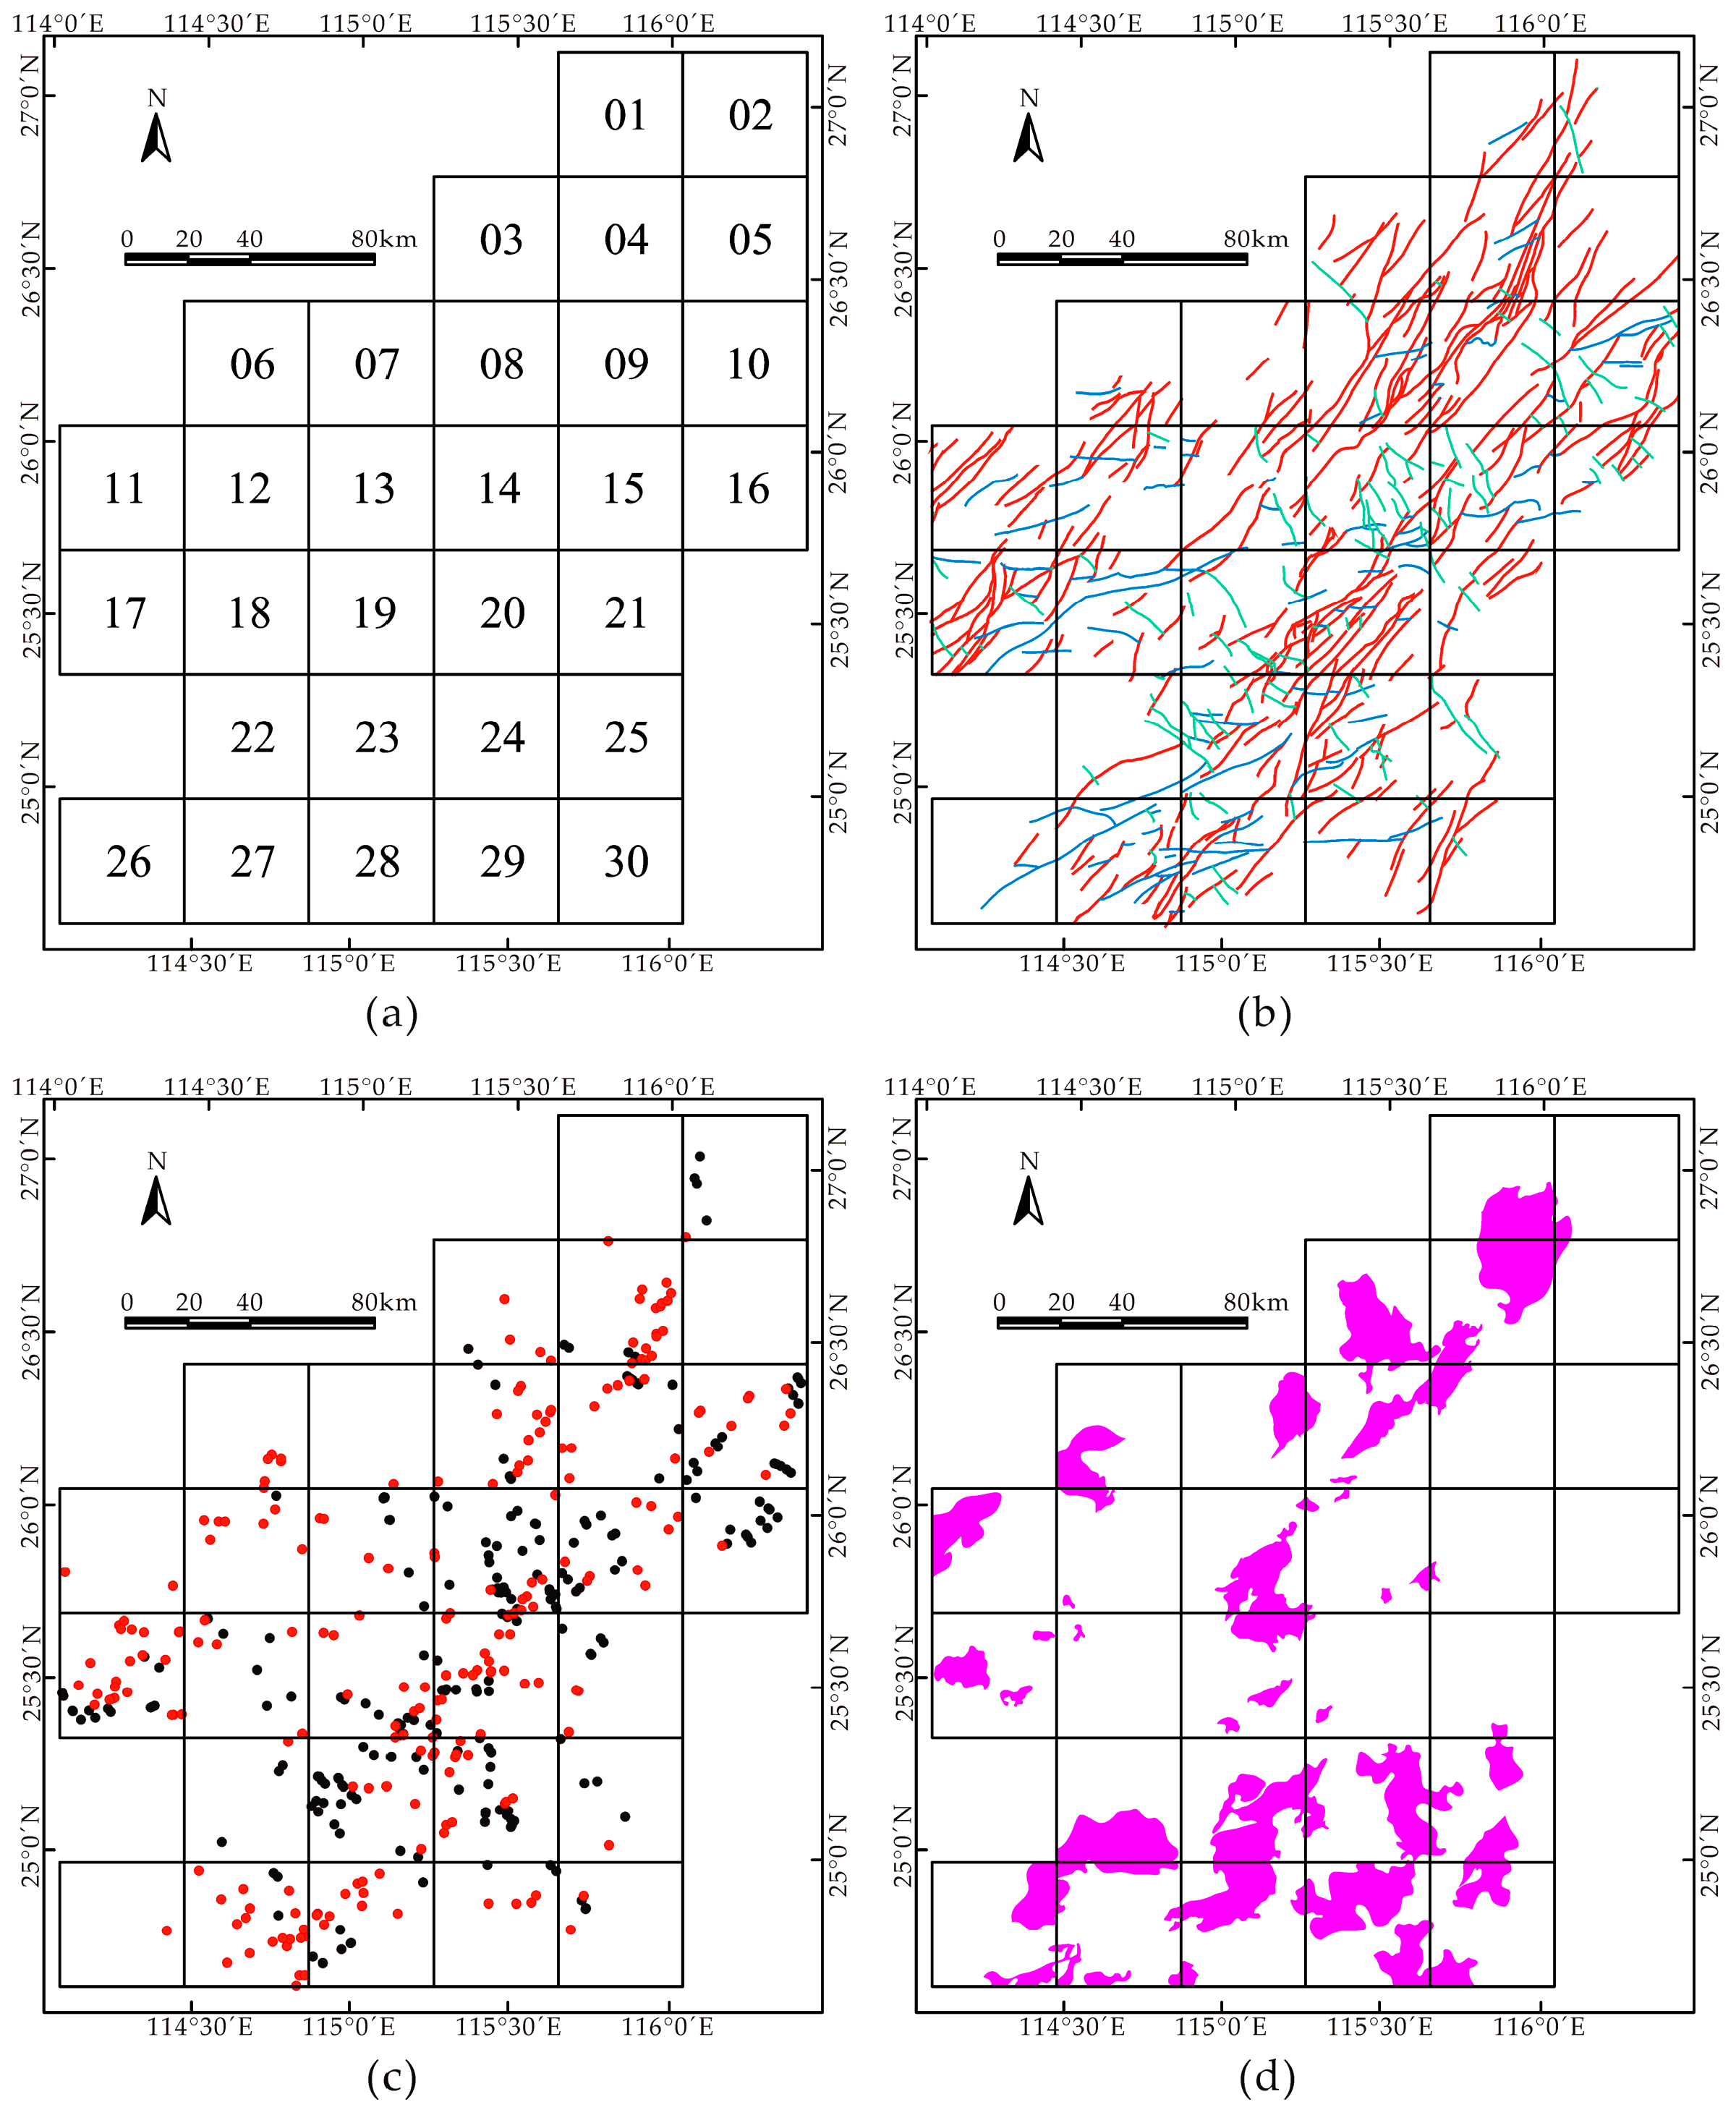
The range of buffer distances is crucial for the buffer analysis and would greatly affect the subsequent WofE calculation. An unlimited buffer distance may lead to the overestimation of the influencing effect of geological features. In this study, we determined the buffering range based on the fractal results of tungsten occurrences. As depicted in Figure 8, the known mineral occurrences in the SJP show a bifractal pattern, i.e., two regression lines must be drawn in order to fit the points representing the power law relationship of box number and box size. This indicates that the scale-invariance distribution of occurrences exists in two ranges, implying that the nonlinear clustering of mineral occurrences was controlled by different mechanisms. The breakpoint of two regression lines refers to a box size of 3723 m, which can be considered as a range of local clustering of mineral occurrences. Accordingly, the buffer analysis was performed in various buffer distances ranging from 0 to 3500 m.

3.3.2. Structure

The NE–NNE- and EW-trending faults show a strong correlation with tungsten occurrence. The contrast exhibits a generally rising curve with increasing buffer distances, reaching a peak value of 2.707 at the distance of 3500 m (Figure 9a). The Studentized contrasts maintain high values fluctuating around 7, which are remarkably greater than 1.96 and thus imply statistical significance of the fault–mineralization association. The spatial association between the fault intersections and tungsten mineralization is relatively weaker but still statistically significant, delineated by a peak contrast of 1.564 and a maximum Studentized contrast of 8.127 at a 3500 m buffer (Figure 9b). Therefore, the NE–NNE-trending and EW-trending faults with a buffer distance of 3500 m, as well as the intersections of these faults with the same buffer range, are selected as evidence layers for the following WofE analysis.
The results from WofE analysis are coincident with those from fractal analysis of faults and fault intersections which exhibit a close correlation between the areas with high fractal dimension and the locations of tungsten occurrences. From a generalized fractal point of view, higher fractal dimensions of faults and fault intersections indicate a more spatially complex distribution of the fault system, resulting in high degrees of interconnectivities of fractures and high permeability of rocks, which are both beneficial for the focusing of ore-forming fluid and thus for facilitating the formation of hydrothermal deposits. This geodynamic condition is particularly critical for the vein-type tungsten deposits in the SJP.

3.3.3. Granites

Yanshanian granites exhibit a strongly positive association with tungsten occurrences within the buffer distance of 2000 m, as indicated by a contrast value of 1.761 (Figure 9c). The contrast reaches a maximum value of 2.117 at the 3500 m buffer, which makes a favorable evidence layer for the WofE analysis.
It is interesting to note that remarkably inconsistent inferences have been drawn from the fractal results and the WofE analysis. The fractal analysis suggests a weak correlation between the Yanshanian granites and mineral occurrences, while the WofE analysis shows a strong granites–mineralization association. This is probably due to the fact that both the fractal analysis and WofE method are sensitive to the degree of granite outcrop. Different levels of surface cover may affect the evaluation of granites on mineralization. In the fractal analysis, only those regions with granite outcrop were counted in the box-counting method, disregarding the regions with concealed granite intrusions at depth. In the WofE method, the buffer analysis was conducted with a consideration of the potential influencing range of granite outcrop, reducing the shielding effect of cover to some extent. Since the close association of Yanshanian granites and tungsten mineralization has been strongly supported by the WofE analysis and also many previous geochronological studies [34,35,37,38], the fractal results of Yanshanian granites will be excluded in the subsequent analysis.

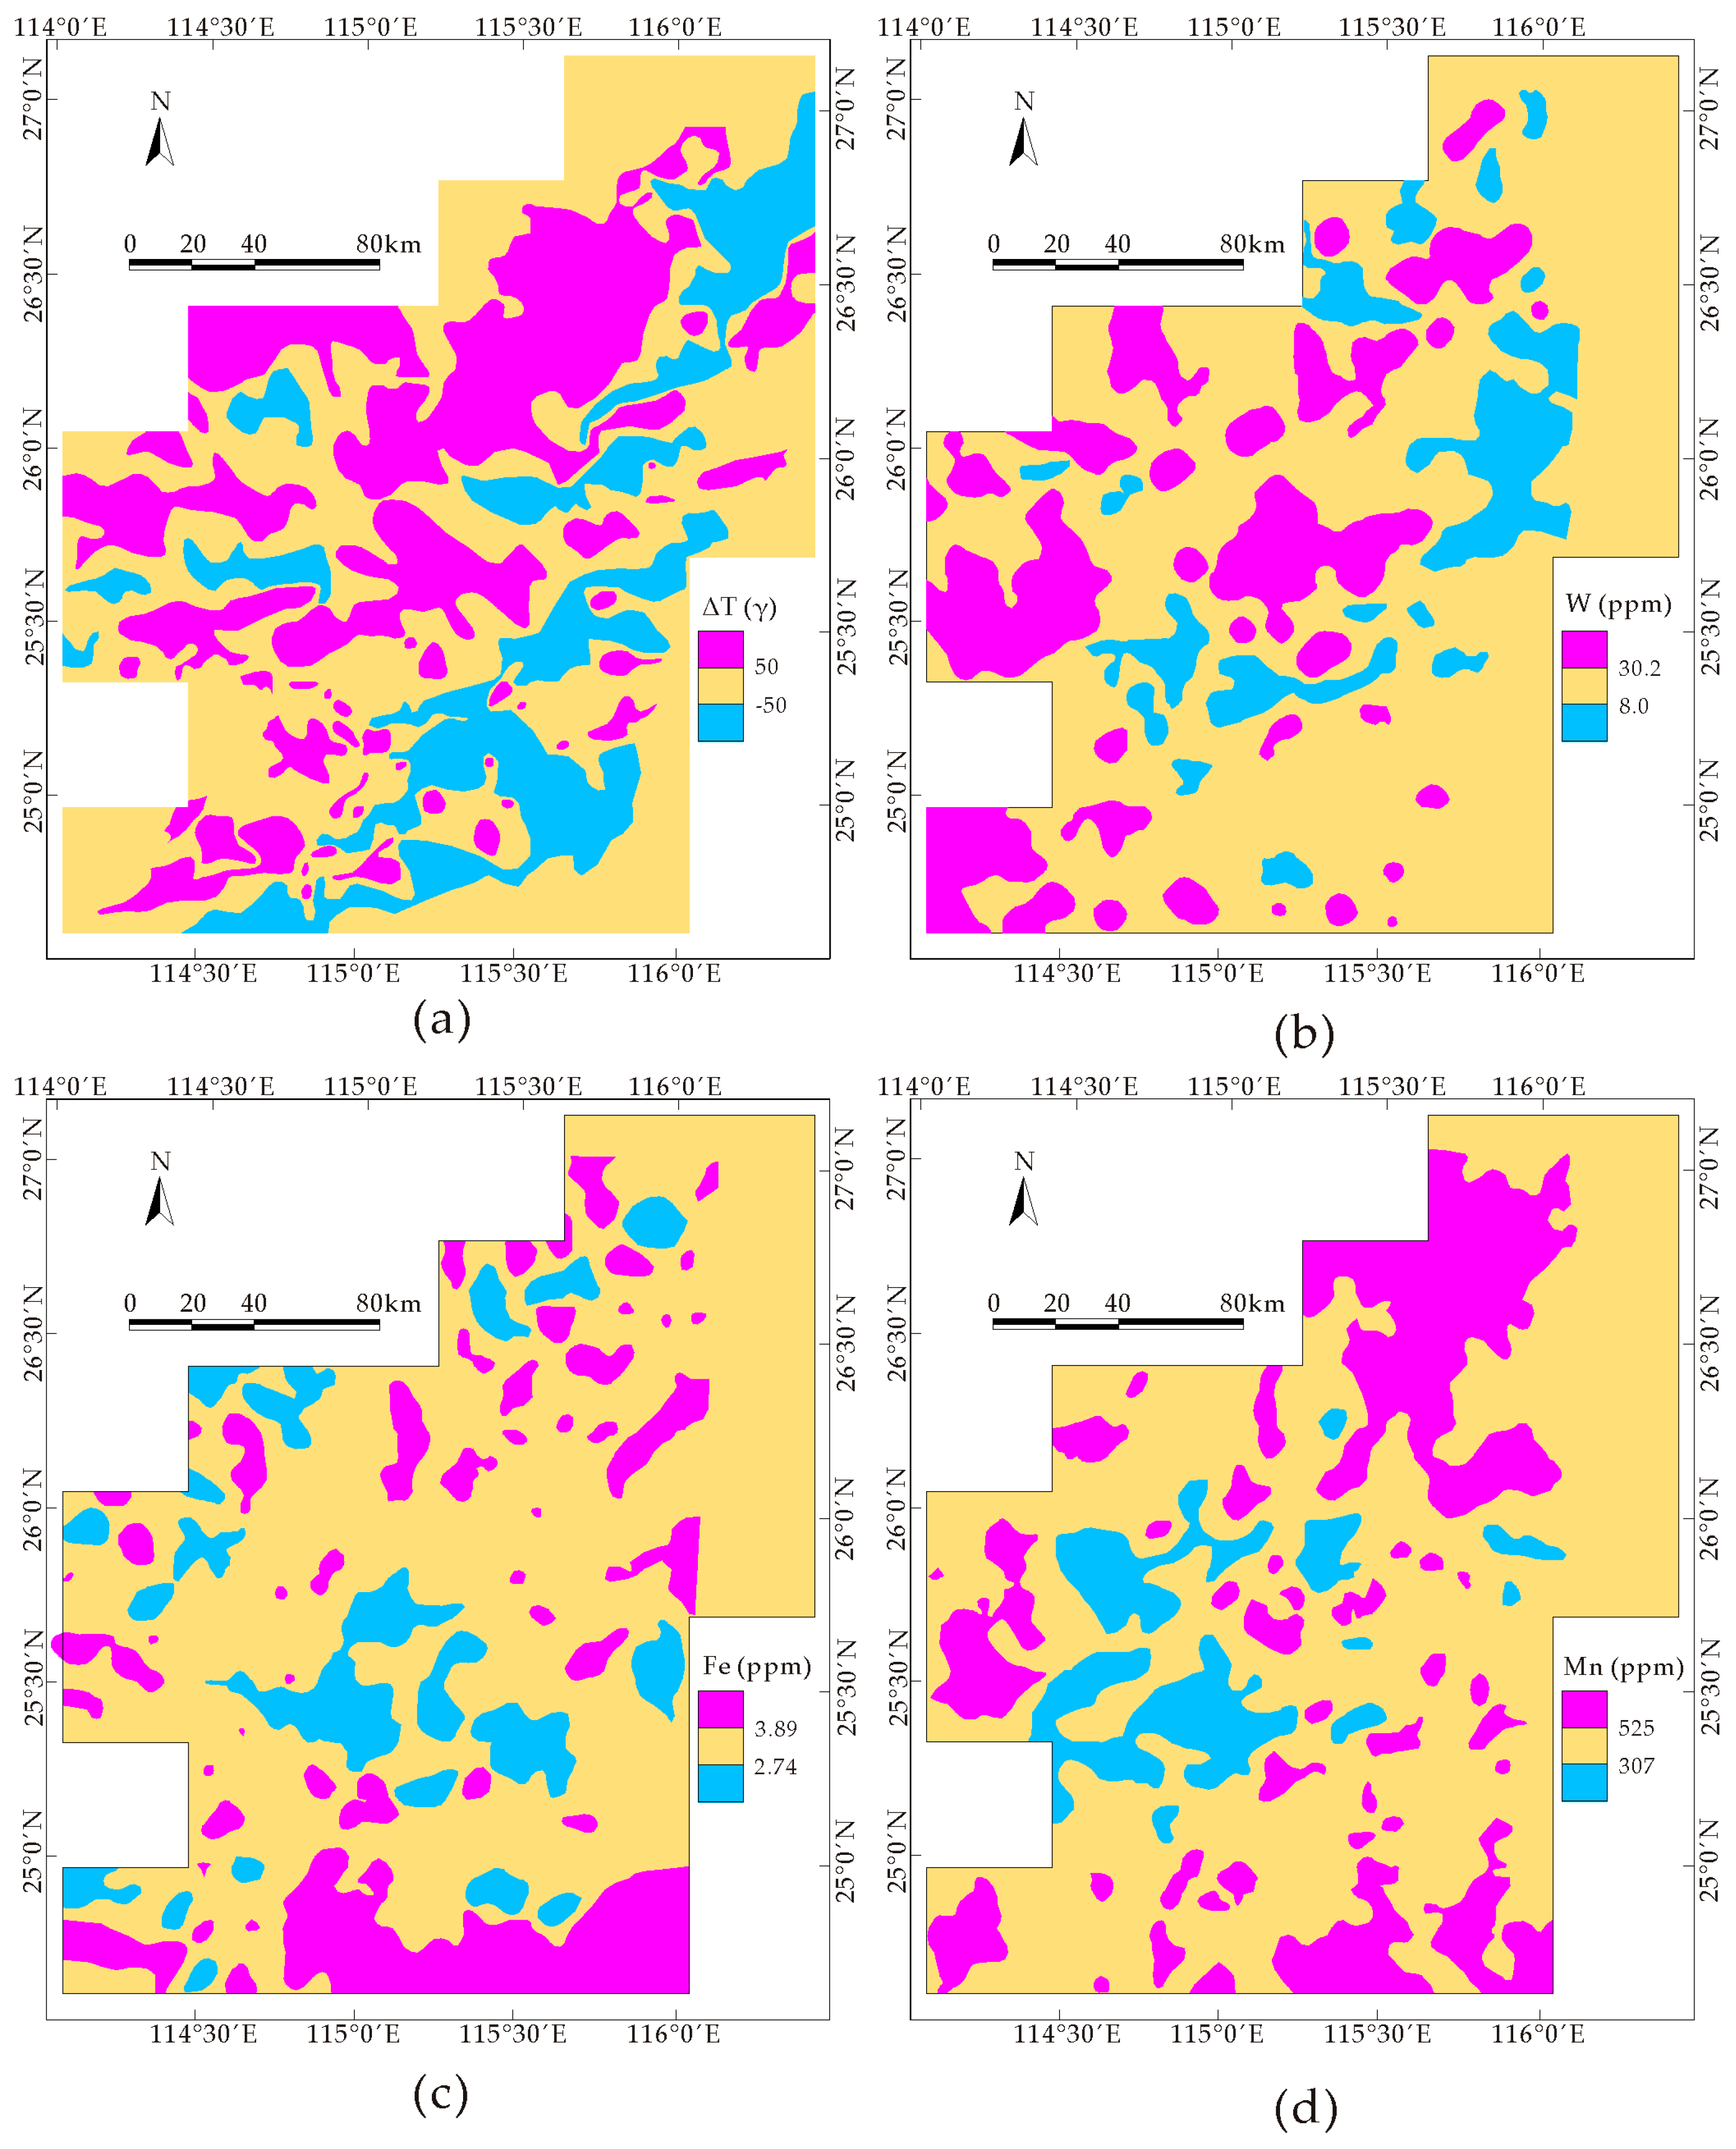
3.3.4. Geophysical Anomalies

As the intensity of granites–mineralization association may be underestimated in the fractal and WofE analyses by the shielding effect of cover, we introduced magnetic anomalies to study the correlation of concealed granites with tungsten occurrences because magnetic highs could be interpreted to indicate areas of intrusive granites at depth [47] (Figure 10a). The magnetic anomalies show a positive association with tungsten occurrences beyond the buffer distance of 1500 m, reaching a peak contrast of 1.243 at a 3000 m buffer (Figure 9d). The greatest contrast value of 6.109 at this buffer supports the statistical significance of the contrast. Thus, the magnetic anomalies with a 3000 m buffer are considered as an evidence layer in the WofE analysis.

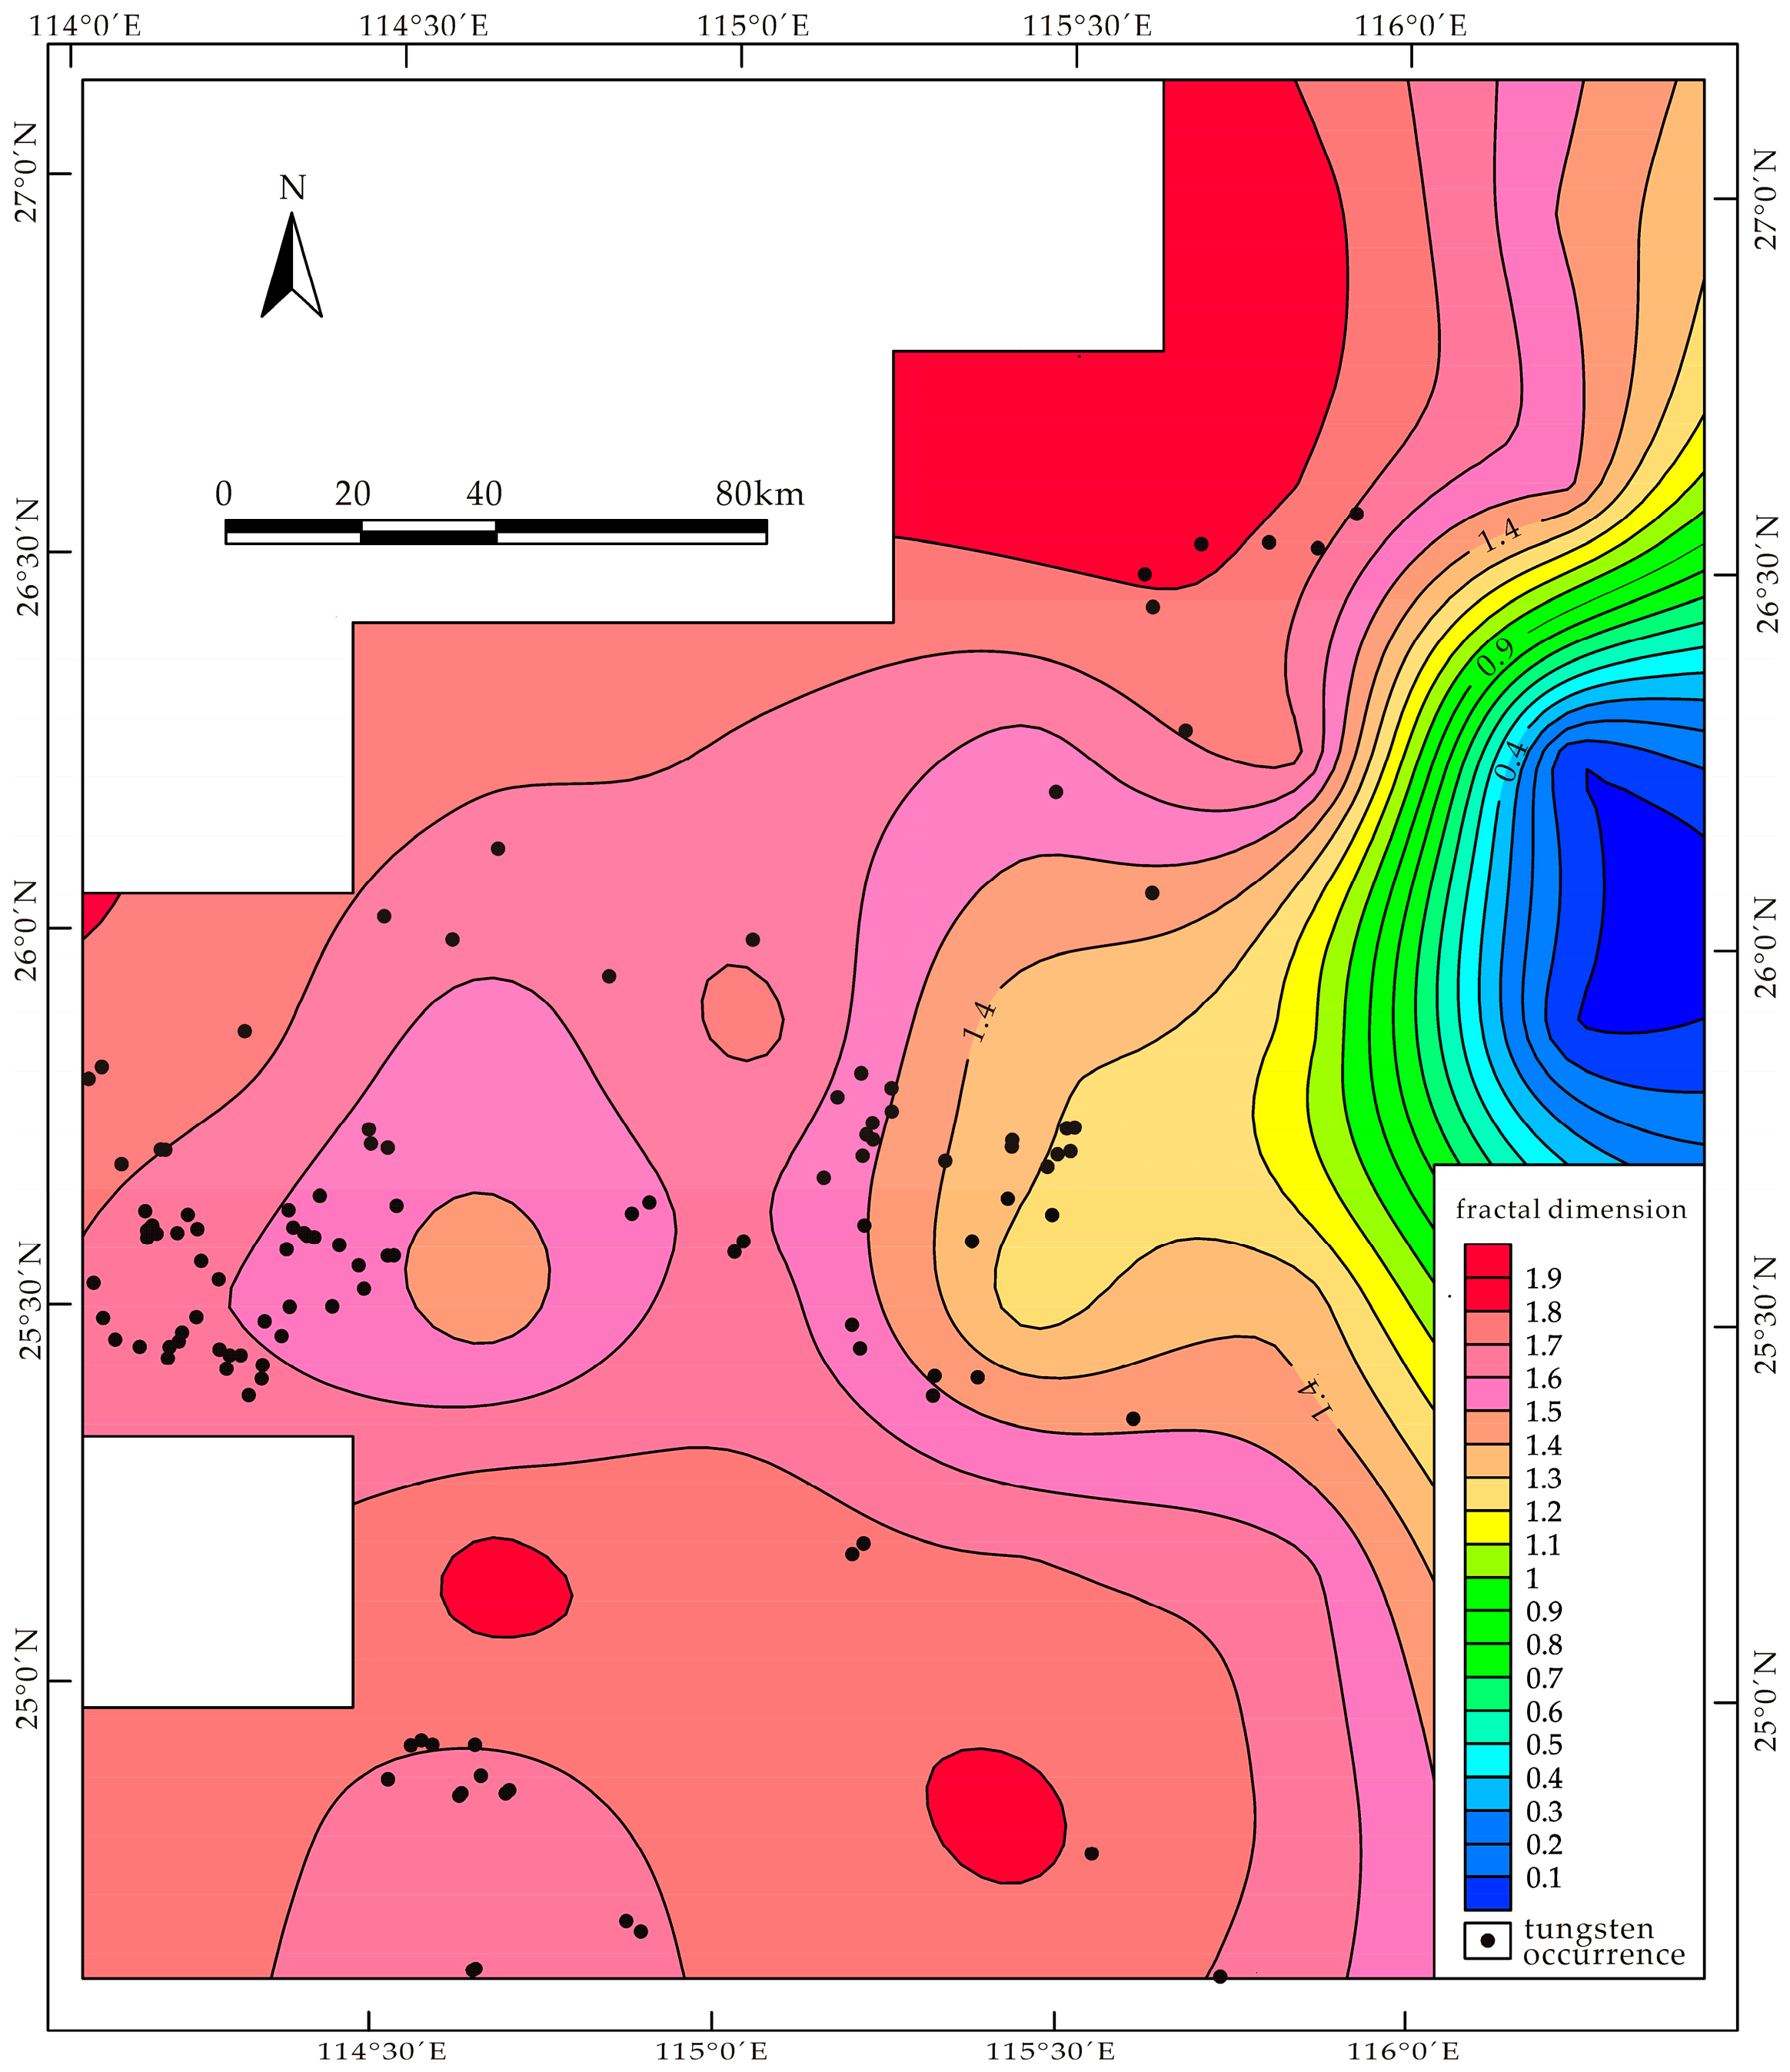
3.3.5. Geochemical Anomalies

In this study, tungsten anomalies were extracted from geochemical maps of Nanling range [48] and used for WofE analysis (Figure 10b). The result indicates that the tungsten anomalies have the strongest association with tungsten occurrences, reaching a peak contrast of 4.638 and a Studentized contrast of 9.101 (Figure 9e).
The iron and manganese anomalies (Figure 10c,d) were also taken into consideration because they are important components of wolframite which dominates the tungstate of the ores in the SJP. These anomalies were commonly neglected in the previous mineral prospectivity studies in this area since the point of view that iron and manganese in the wolframite are derived from magmatic fluid had been widely accepted. However, Lecumberri-Sanchez et al. demonstrated in a newly published paper that a combination of soluble tungsten from magmatic fluid as well as iron and manganese contributed by host rock exerts a decisive control on wolframite precipitation [49]. They inferred that the predominance of ferberite (FeWO4) in the tungsten ores at Panasqueira (Portugal) is due to the iron enrichment in the host rock. Nevertheless, the buffer analyses of iron and manganese distribution in the SJP produced a different result. The spatial association of iron anomalies and tungsten mineralization is very weak, with a maximum contrast value of 0.656 that is slightly higher than the threshold value of 0.5 (Figure 9f). In contrast, manganese anomalies show a strong correlation with tungsten occurrences, delineated by a peak contrast of 2.194 and the corresponding Studentized contrast of 9.03 at the optimum distance of 3000 m (Figure 9g). This result is in good agreement with an inference from an unpublished work conducted by Wu (one of the co-authors of this paper). He found that manganese enrichment, caused by the presence of a considerable amount of pyrophanite (MnTiO3), extensively occurs in the altered host rocks around wolframite-bearing quartz veins in the SJP. Our findings support the tungsten ore-forming contribution made by iron and manganese in the host rock, and also infer that the high manganese anomalies could be considered as an important indicator for tungsten prospecting in the study area.
It can be seen from Figure 9 and Table 2 that the analyzed geological features show a statistically significant association with tungsten mineralization, and can be arranged in the following order according to the intensity of spatial association delineated by their contrasts: tungsten anomalies > faults > manganese anomalies > Yanshanian granites > fault intersections > magnetic anomalies > iron anomalies. The contrast and Studentized contrast values show the statistical significance of the correlation of these features with tungsten occurrences. These features with corresponding buffers can be considered as sound evidence layers for WofE calculation. A predictive map was created by spatial interpolation based on calculated posterior probabilities assigned to every cell in the study area (Figure 11).

3.4. Predictive Targets Delineated by Combined Fractal and WofE Results

As the results from fractal analysis and WofE analysis exhibit significantly close associations with the tungsten mineralization, the integration of their results provides some important implications for further prospecting in this area. As shown in Figure 11, the areas with high posterior probabilities derived from WofE analysis are overlain by regions with high box-counting fractal dimensions of faults and fault intersections (i.e., top 6 regions out of 30 subregions with highest fractal dimensions), from which three levels of prospecting favorability are classified as follows.
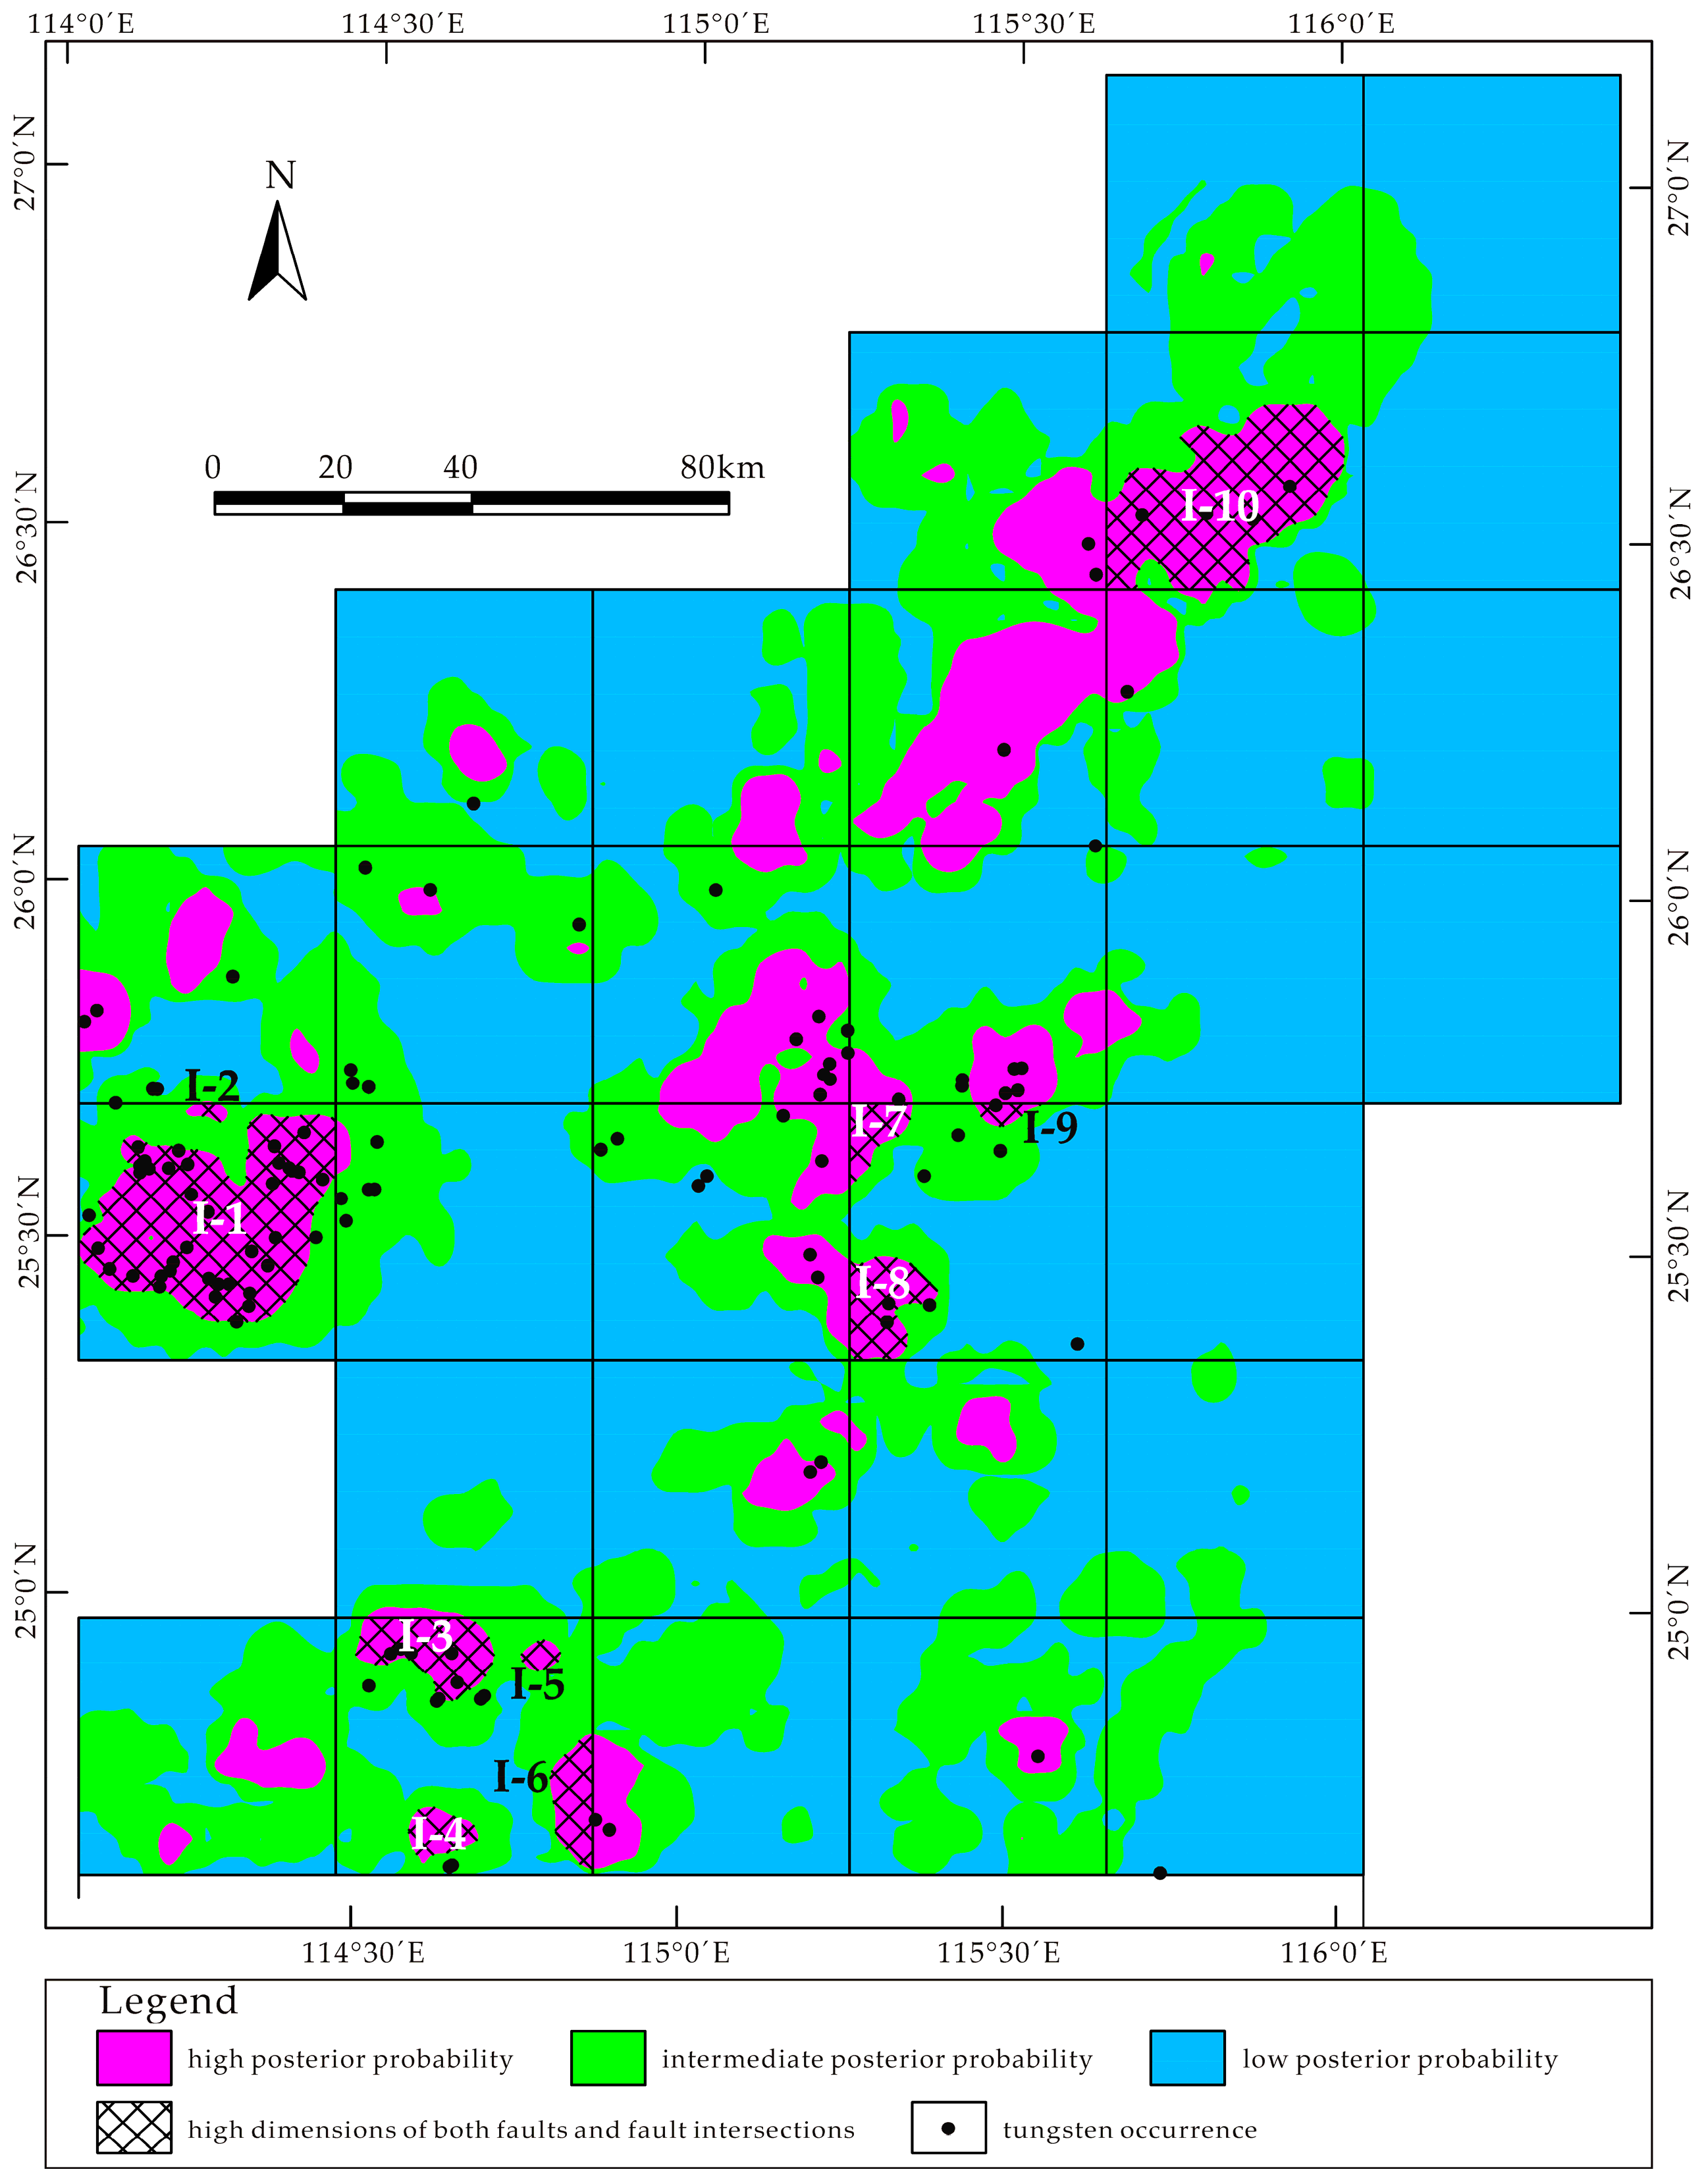
  • Prospectivity I: zones delineated by high posterior probabilities in combination with high fractal dimension of faults and high fractal dimension of fault intersections. Ten Level I zones are extracted and filled with cross lines in Figure 11. A total of 70 tungsten occurrences, occupying 58.47% of all the occurrences in the SJP, fall within or proximal (<3 km) to these zones. The occurrence density of level-I zones reaches a value of 0.0325/km2 compared with a background value of 0.0025/km2. It is inferred that Zones I-4, I-5, and I-7 containing no occurrence at present have great potential of prospectivity and can be considered as the most favorable targets in future exploration.
  • Prospectivity II: zones with high posterior probabilities excluding Level I zones. A total of 25 tungsten occurrences are included in these zones, reaching an occurrence density of 0.0078/km2 which is three times the value of background. Level II zones have good prospective potential and are considered as favorable targets in future exploration.
  • Background: zones with intermediate to low posterior probability. Twenty mineral occurrences are located in zones with intermediate posterior probability, accounting for an occurrence density of 0.0016/km2. The remaining 4 occurrences are situated in zones with low posterior probability. These zones should not be considered for exploratory targeting.

4. Conclusions

In this study, the spatial association between certain geological features and tungsten mineralization in the SJP is investigated with the help of fractal analysis and the WofE method. The fractal box-counting analyses of faults and fault intersections indicate that most of the tungsten occurrences in the SJP are distributed in those regions with high fractal dimensions, implying significant controls of fault complexity on tungsten mineralization. This constraint may be attributed to the increasing interconnectivity and permeability of rocks indicated by high fractal dimensions which are favorable for the focusing of ore-forming fluid and the formation of hydrothermal deposits. The WofE analyses yield a quantitative estimation of the correlation between geological features and tungsten occurrences, which illustrates that tungsten anomalies, NNE–NE- and EW-trending faults, manganese anomalies, and Yanshanian granites have high contrast values, suggesting that these features are strongly associated with tungsten mineralization and can be considered as important indicators for mineral prospectivity.
The predictive map produced by WofE approach together with fractal dimensions can provide intuitive guides for indicating the locations of potential tungsten mineralization. Regions identified by high posterior probability in conjunction with high fractal dimensions of both faults and fault intersections have the greatest potential for further tungsten exploration, especially for those regions where no deposits have been discovered.

Acknowledgments

The research leading to this paper was jointly supported by National Natural Science Foundation of China (Grant No. 41602335), China Postdoctoral Science Foundation (Grant No. 2015M582530), Natural Science Foundation of Jiangxi Province (Grant No. 20161BAB213084), Science and Technology Project of Jiangxi Provincial Department of Education (Grants No. GJJ150625 and No. GJJ160595) and Program of Qingjiang Excellent Young Talents, Jiangxi University of Science and Technology. We thank two anonymous Minerals reviewers for their constructive comments and suggestions that greatly improved the manuscript.

Author Contributions

T.S. conducted the GIS-based computational experiments, analyzed the results and wrote the draft paper; K.W. and L.C. participated in the discussion of experimental results; W.L. supplemented the calculation scheme; Y.W. and C.Z. collected the original data.

Conflicts of Interest

The authors declare no conflict of interest.

References

  1. Zhao, C.B.; Hobbs, B.E.; Ord, A. Fundamentals of Computational Geoscience: Numerical Methods and Algorithms; Springer: Berlin, Germany, 2009; pp. 1–26. [Google Scholar]
  2. Liu, L.M.; Wan, C.L.; Zhao, C.B.; Zhao, Y.L. Geodynamic constraints on orebody localization in the Anqing orefield, China: Computational modeling and facilitating predictive exploration of deep deposits. Ore Geol. Rev. 2011, 43, 249–263. [Google Scholar] [CrossRef]
  3. Haddad-Martim, P.M.; Filho, C.R.D.S.; Carranza, E.J.M. Spatial analysis of mineral deposit distribution: A review of methods and implications for structural controls on iron oxide-copper-gold mineralization in Carajás, Brazil. Ore Geol. Rev. 2017, 81, 230–244. [Google Scholar] [CrossRef]
  4. Li, X.H.; Yuan, F.; Zhang, M.M.; Jia, C.; Jowitt, S.M.; Ord, A.; Zheng, T.K.; Hu, X.Y.; Li, Y. Three-dimensional mineral prospectivity modeling for targeting of concealed mineralization within the Zhonggu iron orefield, Ningwu Basin, China. Ore Geol. Rev. 2015, 71, 633–654. [Google Scholar] [CrossRef]
  5. Prasad, J.; Venkatesh, A.S.; Sahoo, P.R.; Singh, S.; Kanouo, N.S. Geological controls on high-grade iron ores from Kiriburu-Meghahatuburu Iron Ore Deposit, Singhbhum-Orissa Craton, Eastern India. Minerals 2017, 7, 197. [Google Scholar] [CrossRef]
  6. Thiergärtner, H. Theory and Practice in Mathematical Geology—Introduction and Discussion. Math. Geol. 2006, 38, 659–665. [Google Scholar] [CrossRef]
  7. Manuel, R.; Brito, M.; Chichorro, M.; Rosa, C. Remote Sensing for Mineral Exploration in Central Portugal. Minerals 2017, 7, 184. [Google Scholar] [CrossRef]
  8. Castañón, C.; Arias, D.; Diego, I.; Martin-lzard, A.; Ruiz, Y. Minerals Resource and Reserve Calculation in Seam-Shaped Mineral Deposits; A New Approach: “The Pentahedral Method”. Minerals 2017, 7, 72. [Google Scholar] [CrossRef]
  9. Guo, J.T.; Wu, L.X.; Zhou, W.H.; Jiang, J.Z.; Li, C.L. Towards Automatic and Topologically Consistent 3D Regional Geological Modeling from Boundaries and Attitudes. ISPRS Int. J. Geo-Inf. 2016, 5, 17. [Google Scholar] [CrossRef]
  10. Cheng, Q.M. Non-Linear Theory and Power-Law Models for Information Integration and Mineral Resources Quantitative Assessments. Math. Geosci. 2008, 40, 503–532. [Google Scholar] [CrossRef]
  11. Sun, T.; Liu, L.M. Delineating the complexity of Cu–Mo mineralization in a porphyry intrusion by computational and fractal modeling: A case study of the Chehugou deposit in the Chifeng district, Inner Mongolia, China. J. Geochem. Explor. 2014, 144, 128–143. [Google Scholar] [CrossRef]
  12. Mandelbrot, B.B. Fractals: Form, Chances and Dimension; W.H. Freeman: New York, NY, USA, 1977; pp. 1–23. [Google Scholar]
  13. Carranza, E.J.M. Controls on mineral deposit occurrence inferred from analysis of their spatial pattern and spatial association with geological features. Ore Geol. Rev. 2009, 35, 383–400. [Google Scholar] [CrossRef]
  14. Carranza, E.J.M.; Owusu, E.A.; Hale, M. Mapping of prospectivity and estimation of number of undiscovered prospects for lode gold, southwestern Ashanti Belt, Ghana. Miner. Depos. 2009, 44, 915–938. [Google Scholar] [CrossRef]
  15. Gumiel, P.; Sanderson, D.J.; Arias, M.; Roberts, S.; Martín-lzard, A. Analysis of the fractal clustering of ore deposits in the Spanish Iberian Pyrite Belt. Ore Geol. Rev. 2010, 38, 307–318. [Google Scholar] [CrossRef]
  16. Zhao, J.N.; Chen, S.Y.; Zuo, R.G.; Carranza, E.J.M. Mapping complexity of spatial distribution of faults using fractal and multifractal models: Vectoring towards exploration targets. Comput. Geosci. 2011, 37, 1958–1966. [Google Scholar] [CrossRef]
  17. Kruhl, J.H. Fractal-geometry techniques in the quantification of complex rock structures: A special view on scaling regimes, inhomogeneity and anisotropy. J. Struct. Geol. 2013, 46, 2–21. [Google Scholar] [CrossRef]
  18. Cheng, Q.M.; Agterberg, F.P.; Ballantyne, S.B. The separation of geochemical anomalies from background by fractal methods. J. Geochem. Explor. 1994, 51, 109–130. [Google Scholar] [CrossRef]
  19. Zuo, R.G.; Wang, J. Fractal/multifractal modeling of geochemical data: A review. J. Geochem. Explor. 2016, 164, 33–41. [Google Scholar] [CrossRef]
  20. Roberts, S.; Sanderson, D.J.; Gumiel, P. Fractal analysis of Sn-W mineralization from central Iberia; insights into the role of fracture connectivity in the formation of an ore deposit. Econ. Geol. 1998, 93, 360–365. [Google Scholar] [CrossRef]
  21. Afzal, P.; Alghalandis, Y.F.; Khakzad, A.; Moarefvand, P.; Omran, N.R. Delineation of mineralization zones in porphyry Cu deposits by fractal concentration–volume modeling. J. Geochem. Explor. 2011, 108, 220–232. [Google Scholar] [CrossRef]
  22. Agterberg, F.P. Fractals and Spatial Statistics of Point Patterns. J. Earth Sci. 2013, 24, 1–11. [Google Scholar] [CrossRef]
  23. Chen, G.X.; Liu, T.Y.; Sun, J.S.; Cheng, Q.M.; Sahoo, B.; Zhang, Z.J.; Zhang, H.L. Gravity method for investigating the geological structures associated with W-Sn polymetallic deposits in the Nanling Range, China. J. Appl. Geophys. 2015, 120, 14–25. [Google Scholar] [CrossRef]
  24. Mirzaie, A.; Bafti, S.S.; Derakhshani, R. Fault control on Cu mineralization in the Kerman porphyry copper belt, SE Iran: A fractal analysis. Ore Geol. Rev. 2015, 71, 237–247. [Google Scholar] [CrossRef]
  25. Zuo, R.G.; Cheng, Q.M.; Xia, Q.L. Application of fractal models to characterization of vertical distribution of geochemical element concentration. J. Geochem. Explor. 2009, 102, 37–43. [Google Scholar] [CrossRef]
  26. Ford, A.; Blenkinsop, T.G. Combining fractal analysis of mineral deposit clustering with weights of evidence to evaluate patterns of mineralization: Application to copper deposits of the Mount Isa Inlier, NW Queensland, Australia. Ore Geol. Rev. 2008, 33, 435–450. [Google Scholar] [CrossRef]
  27. Cheng, Q.M.; Agterberg, F.P. Fuzzy Weights of Evidence Method and Its Application in Mineral Potential Mapping. Nat. Resour. Res. 1999, 8, 27–35. [Google Scholar] [CrossRef]
  28. Joly, A.; Porwal, A.; Mccuaig, T.C. Exploration targeting for orogenic gold deposits in the Granites-Tanami Orogen: Mineral system analysis, targeting model and prospectivity analysis. Ore Geol. Rev. 2012, 48, 349–383. [Google Scholar] [CrossRef]
  29. Yuan, F.; Li, X.H.; Zhang, M.M.; Jowitt, S.M.; Jia, C.; Zheng, T.K.; Zhou, T.F. Three-dimensional weights of evidence-based prospectivity modeling: A case study of the Baixiangshan mining area, Ningwu Basin, Middle and Lower Yangtze Metallogenic Belt, China. J. Geochem. Explor. 2014, 145, 82–97. [Google Scholar] [CrossRef]
  30. Sang, X.J.; Xue, L.F.; Liu, J.W.; Zhan, L. A Novel Workflow for Geothermal Prospectively Mapping Weights-of-Evidence in Liaoning Province, Northeast China. Energies 2017, 10, 1069. [Google Scholar] [CrossRef]
  31. Wang, C.B.; Rao, J.F.; Chen, J.G.; Ouyang, Y.P.; Qi, S.J.; Li, Q. Prospectivity Mapping for “Zhuxi-type” Copper-Tungsten Polymetallic Deposits in the Jingdezhen Region of Jiangxi Province, South China. Ore Geol. Rev. 2017, 89, 1–14. [Google Scholar] [CrossRef]
  32. Xu, J.X.; Zeng, Z.L.; Wang, D.H.; Chen, Z.H.; Liu, S.B.; Wang, C.H.; Ying, L.J. A new type of tungsten deposit in Southern Jiangxi and the new model of “five floors + basement” for prospecting. Acta Geol. Sin. 2007, 82, 880–887. [Google Scholar]
  33. Fang, G.C.; Chen, Z.H.; Chen, Y.H.; Li, J.G.; Zhao, B.; Zhou, X.P.; Zeng, Z.L.; Zhang, Y.Z. Geophysical investigation of the geology and structure of the Pangushan-Tieshanlong tungsten ore field, South Jiangxi, China-Evidence for site-selection of the 2000-m Nanling Scientific Drilling Project (SP-NLSD-2). J. Asian Earth Sci. 2015, 110, 10–18. [Google Scholar] [CrossRef]
  34. Mao, J.W.; Xie, G.Q.; Guo, C.L.; Chen, Y.C. Large-scale tungsten-tin mineralization in the Nanling region, South China: Metallogenic ages and corresponding geodynamic processes. Acta Petrol. Sin. 2007, 23, 2329–2338. [Google Scholar]
  35. Feng, C.Y.; Zeng, Z.L.; Zhang, D.Q.; Qu, W.J.; Du, A.D.; Li, D.X.; She, H.Q. SHRIMP zircon U–Pb and molybdenite Re–Os isotopic dating of the tungsten deposits in the Tianmenshan–Hongtaoling W–Sn orefield, southern Jiangxi Province, China, and geological implications. Ore Geol. Rev. 2011, 43, 8–25. [Google Scholar] [CrossRef]
  36. Mao, J.W.; Cheng, Y.B.; Chen, M.H.; Pirajno, F. Major types of time-space distribution of Mesozoic ore deposits in South China and their geodynamic settings. Miner. Depos. 2013, 48, 267–294. [Google Scholar]
  37. Wang, Y.J.; Fan, W.M.; Peng, T.P.; Guo, F. Elemental and Sr–Nd isotopic systematics of the early Mesozoic volcanic sequence in southern Jiangxi Province, South China: Petrogenesis and tectonic implications. Int. J. Earth Sci. 2005, 94, 53–65. [Google Scholar] [CrossRef]
  38. Yang, J.H.; Peng, J.T.; Zhao, J.H.; Fu, Y.Z.; Chen, Y.; Hong, Y.L. Petrogenesis of the Xihuashan Granite in Southern Jiangxi Province, South China:Constraints from Zircon U-Pb Geochronology, Geochemistry and Nd Isotopes. Acta Geol. Sin. 2012, 86, 131–152. [Google Scholar]
  39. Chen, G.X.; Cheng, Q.M.; Zuo, R.G.; Liu, T.Y.; Xi, Y.F. Identifying gravity anomalies caused by granitic intrusions in Nanling mineral district, China: A multifractal perspective. Geophys. Prospect. 2015, 63, 256–270. [Google Scholar] [CrossRef]
  40. Yang, J.H.; Peng, J.T.; Hu, R.Z.; Bi, X.W.; Zhao, J.H.; Fu, Y.Z.; Shen, N.P. Garnet geochemistry of tungsten-mineralized Xihuashan granites in South China. Lithos 2013, 177, 79–90. [Google Scholar] [CrossRef]
  41. National Geological Archives of China. Available online: http://en.ngac.org.cn (accessed on 26 October 2017).
  42. Bonham-Carter, G.F. Geographic Information System for Geoscientists, Modeling with GIS; Pergamon: New York, NY, USA, 1994; pp. 238–333. [Google Scholar]
  43. Agterberg, F.P.; Bonham-Carter, G.F.; Wrigh, D.F. Statistical pattern integration for mineral exploration. In Computer Application in Resource Estimation Prediction and Assessment for Metals and Petroleum; Gaal, G., Merriam, D.F., Eds.; Pergamon: New York, NY, USA, 1990; pp. 1–21. [Google Scholar]
  44. Allek, K.; Boubaya, D.; Bouguern, A.; Hamoudi, M. Spatial association analysis between hydrocarbon fields and sedimentary residual magnetic anomalies using Weights of Evidence: An example from the Triassic Province of Algeria. J. Appl. Geophys. 2016, 135, 100–110. [Google Scholar] [CrossRef]
  45. Zeng, H.L.; Zhang, Q.H.; Li, Y.S.; Liu, J. Crustal structure inferred from gravity anomalies in South China. Tectonophysics 1997, 283, 189–203. [Google Scholar] [CrossRef]
  46. China Ministry of Geology and Mineral Resources. Study on Regional Tectonic Characteristics and Ore-forming Structures in the Nanling Range; Geological Publishing House: Beijing, China, 1988; pp. 1–198. (In Chinese) [Google Scholar]
  47. Jiangxi Bureau of Geology and Mineral Resources. Mineral Prospecting and Targeting of W-Sn-Pb-Zn Deposits in Southern Jiangxi Province; Jiangxi Bureau of Geology and Mineral Resources: Nanchang, China, 2002; pp. 28–30. (In Chinese)
  48. Chen, X.Q.; Fu, J.M. Geochemical Maps of Nanling Range; China University of Geoscience Press: Wuhan, China, 2012; pp. 1–88. (In Chinese) [Google Scholar]
  49. Lecumberri-Sanchez, P.; Vieira, R.; Heinrich, C.A.; Pinto, F.; Wälle, M. Fluid-rock interaction is decisive for the formation of tungsten deposits. Geology 2017, 45, 579–582. [Google Scholar] [CrossRef]
Figure 1. Simplified geological map of the study area, modified from a 1:500,000 scale geological map and [33,35].
Minerals 07 00243 g001
Figure 2. Extracted geological features in 30 subregions under fractal analysis: (a) location and ID of each subregion; (b) regional faults, including NE–NNE-trending faults marked in red, EW-trending faults marked in blue, and NW–NNW faults marked in green; (c) fault intersections, of which the intersections of NE–NNE- and EW-trending faults are marked in red; and (d) Yashanian granites.
Minerals 07 00243 g002
Figure 3. Schematic diagram of box-counting method for measuring a fractal linear pattern: (a) 8 boxes containing parts of target lines with box size r = 4; (b) 21 boxes counted with box size r = 2; (c) 57 boxes counted with box size r = 1; and (d) log–log plot revealing the power law relationship of counted box number N(r) and box size r, obtaining box-counting fractal dimension DB = 1.2653.
Minerals 07 00243 g003
Figure 4. Graphs of cumulative frequency of distances from tungsten occurrence (DM) and non-occurrence locations (DN) to (a) NE–NNE-trending faults; (b) EW-trending faults; and (c) NW–NNW-trending faults. D is the difference between DM and DN.
Minerals 07 00243 g004
Figure 5. Contour map showing spatial distribution of fractal dimensions of regional faults.
Minerals 07 00243 g005
Figure 6. Contour map showing spatial distribution of fractal dimensions of fault intersections.
Minerals 07 00243 g006
Figure 7. Contour map showing spatial distribution of fractal dimensions of Yanshanian granite.
Minerals 07 00243 g007
Figure 8. Log–log plot of box number N(r) versus box size r for tungsten occurrences.
Minerals 07 00243 g008
Figure 9. Plots of buffer analysis and Student t-test for determining the optimum controlling range of (a) regional faults; (b) fault intersections; (c) Yanshanian granites; (d) magnetic anomalies; (e) tungsten anomalies; (f) iron anomalies; and (g) manganese anomalies. The contrast = 0.5 dotted line is regarded as the threshold above which the spatial association between two analyzed features can be considered as strong, while the Studentized contrast = 1.96 dotted line is regarded as the threshold above which the spatial correlation can be considered as statistically significant.
Minerals 07 00243 g009aMinerals 07 00243 g009b
Figure 10. Geophysical and geochemical anomalies used for weights-of-evidence (WofE) analysis: (a) magnetic anomalies; (b) tungsten anomalies; (c) iron anomalies; and (d) manganese anomalies.
Minerals 07 00243 g010
Figure 11. Predictive map based on the combination of both fractal analysis and WofE analysis.
Minerals 07 00243 g011
Table 1. Result of box-counting fractal analyses of geological features.
Region IDFaultFault IntersectionYanshanian GranitesTungsten Occurrences
DBR2DBR2DBR2
011.150 0.9991 Null Null 1.846 0.9993 0
021.074 0.9951 Null Null 1.476 0.9915 0
031.188 0.9939 Null Null 1.859 0.9999 2
041.341 0.9938 0.468 0.9164 1.799 0.9988 4
051.110 0.9940 Null Null 1.521 0.9971 0
061.230 0.9989 0.293 0.9852 1.712 0.9985 1
071.002 0.9943 Null Null 1.682 0.9967 0
081.338 0.9980 0.249 0.9683 1.545 0.9976 2
091.326 0.9998 0.190 0.9212 1.729 0.9976 1
101.292 0.9996 0.134 0.8369 NullNull0
111.259 0.9998 Null Null 1.769 0.9994 6
121.194 0.9997 0.149 0.8895 1.553 0.9984 6
131.148 0.9996 0.151 0.8435 1.737 0.9993 9
141.221 0.9997 0.245 0.9560 1.322 0.9930 7
151.233 0.9992 Null Null 1.159 0.9636 0
161.237 1.0000 Null Null NullNull0
171.373 0.9993 0.360 0.8976 1.602 0.9982 41
181.138 0.9995 Null Null 1.429 0.9950 5
191.209 0.9996 0.273 0.6807 1.639 0.9981 8
201.389 0.9991 0.268 0.8691 1.240 0.9848 8
211.164 0.9996 Null Null 1.364 0.9547 0
220.969 0.9915 Null Null 1.847 0.9996 0
231.274 0.9983 Null Null 1.786 0.9996 2
241.292 0.9987 0.216 0.8553 1.719 0.9984 0
250.938 0.9977 Null Null 1.633 0.9987 0
261.031 0.9964 Null Null 1.739 0.9977 0
271.319 0.9998 0.313 0.9063 1.601 0.9958 12
281.276 0.9998 0.225 0.8815 1.749 0.9994 2
291.106 0.9970 0.151 0.8435 1.814 0.9998 1
301.175 0.9990 Null Null 1.668 0.9981 1
DB: box-counting fractal dimension; R2: coefficient of determination of regression line; and Null: indicating the region containing no corresponding geological features or no variation with different scales.
Table 2. Resultant indices calculated from buffer analysis and Student’s t-test.
Geological FeatureOptimum Buffer/mW+WCCs
Faults35000.632−2.0752.7076.928
Fault intersections35001.135−0.4291.5648.127
Yanshanian granites35000.998−1.1202.1179.420
Magnetic anomalies30000.587−0.6551.2436.109
W anomalies10001.545−3.0934.6389.101
Fe anomalies15000.471−0.1850.6563.284
Manganese anomalies30000.919−1.2742.1949.030
W+: positive weight; W: negative weight; C: contrast; Cs: Studentized contrast.

