Rare Earth Element Behaviour in Apatite from the Olympic Dam Cu–U–Au–Ag Deposit, South Australia
by
 and
and
Sasha Krneta
1,*, 
Cristiana L. Ciobanu
2,
Nigel J. Cook
2,
Kathy Ehrig
3 and
Alkis Kontonikas-Charos
1 1
School of Physical Sciences, The University of Adelaide, Adelaide, SA 5000, Australia
2
School of Chemical Engineering, The University of Adelaide, Adelaide, SA 5000, Australia
3
BHP Billiton, Olympic Dam, Adelaide, SA 5000, Australia
*
Author to whom correspondence should be addressed.
Minerals 2017, 7(8), 135; https://doi.org/10.3390/min7080135
Submission received: 4 July 2017
/
Revised: 26 July 2017
/
Accepted: 29 July 2017
/
Published: 2 August 2017
(This article belongs to the Special Issue Fundamentals and Frontiers in Mineralogy)
Abstract
:Apatite is a common magmatic accessory in the intrusive rocks hosting the giant ~1590 Ma Olympic Dam (OD) iron-oxide copper gold (IOCG) ore system, South Australia. Moreover, hydrothermal apatite is a locally abundant mineral throughout the altered and mineralized rocks within and enclosing the deposit. Based on compositional data for zoned apatite, we evaluate whether changes in the morphology and the rare earth element and Y (REY) chemistry of apatite can be used to constrain the fluid evolution from early to late hydrothermal stages at OD. The ~1.6 Ga Roxby Downs granite (RDG), host to the OD deposit, contains apatite as a magmatic accessory, locally in the high concentrations associated with mafic enclaves. Magmatic apatite commonly contains REY-poor cores and REY-enriched margins. The cores display a light rare earth element (LREE)-enriched chondrite-normalized fractionation pattern with a strong negative Eu anomaly. In contrast, later hydrothermal apatite, confined to samples where magmatic apatite has been obliterated due to advanced hematite-sericite alteration, displays a conspicuous, convex, middle rare earth element (MREE)-enriched pattern with a weak negative Eu anomaly. Such grains contain abundant inclusions of florencite and sericite. Within high-grade bornite ores from the deposit, apatite displays an extremely highly MREE-enriched chondrite-normalized fractionation trend with a positive Eu anomaly. Concentrations of U and Th in apatite mimic the behaviour of ∑REY and are richest in magmatic apatite hosted by RDG and the hydrothermal rims surrounding them. The shift from characteristic LREE-enriched magmatic and early hydrothermal apatite to later hydrothermal apatite displaying marked MREE-enriched trends (with lower U, Th, Pb and ∑REY concentrations) reflects the magmatic to hydrothermal transition. Additionally, the strong positive Eu anomaly in the MREE-enriched trends of apatite in high-grade bornite ores are attributable to alkaline fluid conditions.
1. Introduction
The concentrations of trace elements within hydrothermal minerals and their variation can provide valuable information on fluid parameters and the conditions of ore deposition if the studied assemblages are well constrained with respect to their paragenetic position [1]. Rare earth elements and yttrium (REY) have proven particularly instructive, as they display a systematic decrease in atomic radius with an increased atomic number which causes a divergence in their geochemical behaviour [2]. REY behaviour has been demonstrated to be highly sensitive to changes in parameters such as pH, temperature, salinity, redox conditions and fluid composition [3,4,5,6], thus allowing for the use of chondrite-normalized REY fractionation patterns as geochemical tracers that can assist interpretation of hydrothermal systems.
Chondrite-normalized REY fractionation patterns of apatite-group minerals [Ca5(PO4)3(F,Cl,OH)] are recognized as valuable tools for the understanding of hydrothermal processes [7]. REY trends in apatite supergroup minerals are widely reported from a variety of rocks; however, these trends are, in general, remarkably consistent with one another, conspicuous by their consistent, downward-sloping chondrite-normalized REY fractionation trends featuring relative enrichment in LREE with negative Eu anomalies of variable strength [8,9,10]. Variation in the magnitude of Eu anomalies across rock suites spanning entire metallogenic provinces have been used to infer variability or change in redox conditions in magmatic apatite [8].
Apatite occurs in many magmatic-hydrothermal deposit types including iron-oxide copper gold (IOCG) systems. Apatite is particularly common in the early stage of evolution of IOCG deposits, in which the apatite-magnetite assemblages may resemble those in iron-oxide apatite (IOA)-type deposits such as Kiruna, Sweden [11], Pea Ridge, MO, USA [12], and the Bafq district of Iran [13,14].
Apatite may record hydrothermal events through changes in composition and thus provide information on the chemistry of the host intrusive rocks. Its refractory character in the burial or weathering environment allows those patterns to be preserved. For this reason, and its widespread presence within or associated with magmatic-hydrothermal deposits, apatite has accordingly received much attention as a potential pathfinder mineral in terranes obscured by residual glacial sediments [15,16].
The Olympic Cu–Au Province of South Australia [17] hosts several major deposits and many more prospects for IOCG and IOA-like mineralization [18]. Olympic Dam (OD) is by far the largest deposit in the province [19]. A recent study of fluorapatite from OD [20] has demonstrated significant compositional variation with respect to minor and trace elements among fluorapatite from rocks of igneous origin (variably altered granitoids and coeval mafic rocks). Apatite evolution is described in the context of the deposit-scale zoning, noting geochemically and morphologically distinct apatite types across the transition, from unaltered through altered to mineralized host rocks. The data also supports the incorporation of other substituting elements (notably Na) into apatite, hinting at a close relationship between apatite geochemistry and evolution of the mineralizing system from early-stage albitization involving the breakdown and replacement of feldspars [21] to magnetite alteration followed by hematite-sericite alteration. Crucially, each stage in this evolution is marked by distinct REY-signatures in apatite which are proportional to, and directly related to, hydrothermal conditions and, possibly, also to partitioning among other co-crystallising REY-bearing minerals.
In this work, we show chondrite-normalized REY fractionation patterns and trace element concentrations in fluorapatite from the same rocks described previously by Krneta et al. (2016) [20]. In addition, apatite from high-grade ore is also studied. We aim to show that REY signatures in apatite can trace the magmatic to hydrothermal transition in granite-hosted IOCGs. Secondly, the marked change in REY trends in apatite formed within the mineralizing environment responsible for high-grade Cu–Au ore.
The recognition of apatite trace element signatures associated with specific stages of mineralization may prove useful in the use of apatite as a mineral pathfinder in terranes like the Gawler Craton that are obscured by ubiquitous cover sequences [10].
2. Background
2.1. Deposit Geology
The Olympic Dam Cu–U–Au–Ag deposit, South Australia (10,400 Mt at 0.77% Cu, 0.25 kg/t, 0.32 g/t Au and 1 g/t Ag; [22]), is one of the world’s largest orebodies and is anomalously rich in REY relative to crustal values [19]. The deposit is hosted within the Olympic Dam Breccia Complex (ODBC; [23]), a collective term used to describe the breccias, intrusive phases and minor bedded sediments which host the deposit. This is hosted within the Roxby Downs granite (RDG), a medium- to coarse-grained, undeformed, pink, two-feldspar granite, locally displaying rapakivi textures [19] emplaced at ~1.6 Ga as part of the Hiltaba Suite (HS). Together with a second granitoid also sampled here, the Horn Ridge quartz monzonite (HRQM), HS rocks are part of the Burgoyne batholith, which makes up the basement of the northern Stuart Shelf [24]. Contemporaneous with the aforementioned granitoids, and also hosted within the ODBC, are a swarm of felsic to ultramafic dykes, including strongly altered olivine-phyric dolerites (dolerite dyke, DD) [20,25].
The OD deposit is an ideal subject for this study because it features a marked spatial zonation with respect to mineralogy. This is expressed by iron-oxides (magnetite is dominant laterally and at depth whereas inside the deposit, hematite and sericite assemblages prevail), and also with respect to Cu-Fe-sulphide speciation [18,26]. This transition in Fe-oxide species within OD, as well in other deposits and prospects regionally, is marked by a decrease in salinity (from 20–40 to 1–8 wt % NaCl equivalent) coincident with a decrease in temperature from ~400 °C to 150–300 °C [27,28].
Feldspar alteration processes, including albitization, have recently been characterized at OD [21,29]. Transformations in feldspar are preserved, especially in the least-altered RDG outside the deposit and at depth, but are largely obliterated within the deposit. This took place prior to the main stage of mineralization, which was marked by the precipitation of magnetite-pyrite assemblages. The albitization process is recognized as an in situ reaction controlled by a coupled dissolution-reprecipitation reaction. This requires no externally-sourced fluids but results in significant trace element redistribution [21].
Fluorapatite is present both as a primary magmatic accessory phase and as a product of early hydrothermal alteration. Fluorapatite is particularly abundant in locations marginal to, or outside, the ODBC [20,30]. Within the OD deposit, apatite is scarce, although it is present in, for example, high-grade ore samples such as those described in [31]. U–Pb and Pb–Pb hematite geochronology gives an age of ~1.6 Ga [31,32,33], concordant with the ages of magmatic and hydrothermal zircon within rocks hosting the deposit [34]. Apatite also occurs within the deposit where hydrothermal albite is preserved at depth. At OD, fluorapatite has been used to obtain U–Pb ages for deep, primary mineralization [35], coeval basalts and dykes [25], and for crosscutting mafic dykes [30,36].
2.2. Apatite Mineral Chemistry
The apatite supergroup [37] is defined by the formula A5(XO4)3Z, where the A position is largely occupied by Ca2+, along with lesser of Na+, Sr2+, Pb2+, Ba2+, Mn2+, Fe2+, Mg2+, Ni2+, Co2+, Cu2+, Zn2+, Sn2+, Cd2+, Eu2+, REE3+, Y3+, Ti4+, Th4+ and U4+. The X position is dominated by P5+, as (PO4), but can also host other highly-charged anions (SO42−, AsO43−, VO43− and SiO44−). The occupancy of the Z position (F−, Cl− and OH−) defines the three end-members; fluorapatite; chlorapatite; and hydroxyapatite, respectively. Although the majority of natural apatites are F-dominated, they nevertheless contain all three anions components in different proportions [38].
Crystal structures of apatite group minerals are described by Hughes and Rakovan [39]. In detail, the atomic arrangement is made up of 3 cation polyhedra: a tetrahedron, XO4, and two calcium positions; a tri-capped trigonal prism, A1O9, and an irregular polyhedron, A2O6Z, where Z is one of the anions F, Cl, OH.
The substitution of elements into apatite can either be direct, whereby the substituting element has a charge equal to that of the element it is replacing, or heterovalent, requiring either facilitation via coupled substitution or the presence of a vacancy [40,41]. Both types of mechanism are particularly relevant for the substitution of REY and other elements of interest in apatite (□ = vacancy):
REE3+ + Na+ = 2Ca2+
REE3+ + SiO44− = Ca2+ + PO43−
U4+ + □ = 2Ca2+
Th4+ + □ = 2Ca2+
Substitution in apatite adheres to Goldschmidt’s Rules, whereby elements with ionic radii closest to those of the substituted ion are most easily incorporated. REE and Y substitute for Ca and show distinct preferences for the two Ca positions; LREE preferring the Ca2 site and the HREE the Ca1 [39]. Although the selective incorporation of certain REY was considered to be crystallographically controlled [41], more recent work [42] has shown how external physiochemical parameters such as fluid composition or temperature can impact significantly on otherwise predictable patterns. Study of REY signatures in apatite has thus led to the recognition of individual signatures, or REY behaviours, attributable to specific fluid conditions within the evolution of a mineralized system [7,10]. The recent work of Migdisov et al. (2016) [6] has emphasized the variability of REY behaviour brought about by the dominance of certain REY complexes such as REY–Cl and –SO4 over others, notably REY–F. Such variability can be tested against changes in fluid characteristics, as suggested from fluid inclusion studies—i.e., from early, high-T and salinity fluids to late, lower-T and salinity fluids, corresponding to magnetite and hematite stages, respectively, at OD [43]—and in other IOCG prospects from the Cu–Au Olympic Province [28]. Of particular relevance to apatite is how, under different conditions, LREE may be partitioned relative to HREE due to the increased stability and solubility as LREE–Cl complexes, thus explaining the LREE-enriched nature of many hydrothermal deposits, including IOCG systems [6].
Mao et al. (2016) [9] recognized that hydrothermal, and particularly ore-related, apatite may contain concentrations of trace elements, which are significantly lower than those of magmatic origin. This may relate to the co-crystallization, in ores, of apatite with other minerals that can incorporate certain trace elements more effectively than apatite but which seldom occur as magmatic accessories. Given the capacity of apatite to incorporate a variety of different elements, this contribution, although focused on REY, also reports concentrations of other trace elements.
3. Sample Suite
The samples investigated are the same as those described in [20], with the addition of one sample (three polished blocks) from massive bornite ore from the underground mine previously used for the U–Pb dating of hematite and zircon [31]. Overall, the sample suite encompasses Hiltaba-aged intrusive rocks (both felsic and mafic) displaying variable degrees of alteration, early magnetite-dominant mineralization (DM and DS), and high-grade bornite ore (Table 1, Figure 1).
The sample suite also covers apatite within two mineralized locations outside the main orebody, DM and DS. In the former, abundant apatite is found at the contact between RDG and a felsic volcanic unit at depths >2 km and this apatite is studied here. Apatite from DS is studied from the best mineralized interval hosted by red-stained K-feldspar altered granite. In both locations, the main mineralization consists of chalcopyrite and pyrite and is associated with co-existing magnetite and hematite; martite is also abundant along with sericite and chlorite.
The high-grade massive bornite samples, along with other similar cm to dm-sized pockets of massive Cu ore, are atypical of sulphide mineralization within the deposit, which is dominantly disseminated. Such massive mineralization is present throughout the orebody and may be representative of latest pulses of hydrothermal fluids associated with the evolution of the IOCG system at OD. Clustered inclusions of hematite are present in the bornite along with minor chlorite, however, no sericite is present, indicating that such assemblages are also atypical with respect to the description of “hematite-sericite alteration” considered for IOCGs.
Following [20], the distinct types of apatite at OD are classified according to their origin and association with particular intrusive rocks and hydrothermal assemblages as follows: (i) magmatic apatite within the RDG, HQRM and the DD; (ii) early hydrothermal magnetite–pyrite–apatite assemblages at depth within the “deep mineralization” (DM), as well as laterally outside of the main resource within “distal satellite” mineralization (DS); (iii) domains within magmatic and early hydrothermal apatite that relate to hematite-sericite alteration; and (iv) apatite associated with high-grade bornite ore. These categories represent the various stages of the magmatic-to-hydrothermal evolution identified at OD. Although IOCG-style mineralization at several locations in the Olympic Cu–Au province lacks a clear spatial association with intrusive rocks likely to have been a source of hydrothermal fluids, thus prohibiting direct study of the magmatic-to-hydrothermal transition, the evolution in the REY signatures reported below may be nevertheless characteristic for the Cu–Au mineralization associated with similar intrusive rocks.
4. Analytical Methodology
Laser ablation inductively coupled plasma mass spectrometry (LA-ICP-MS) spot analysis and element mapping was performed using a Resonetics M-50-LR 193 nm Excimer laser attached to an Agilent 7700cx Quadrupole ICP mass spectrometer (Adelaide Microscopy, The University of Adelaide). Ablation took place in an Ultra High Purity He (0.7 L/min) atmosphere, mixed after leaving the ablation cell with Ar (0.93 L/min). The mix was passed through a pulse-homogenizing device after which it was introduced to the torch. ICP-MS calibration was performed regularly so as to increase sensitivity. LA-ICP-MS analysis was performed with a laser beam energy output of 80 mJ and a spot size varying from 8 to 18 μm. Total acquisition time was 60 s for each analysis comprising a 30 s background measurement, 30 s of ablation and a 40 s delay between analysis allowing for adequate wash-out, gas stabilization and processing time. The following isotopes were analysed 23Na, 24Mg, 27Al, 28Si, 31P, 34S, 39K, 43Ca, 45Sc, 47Ti, 51V, 55Mn, 56Fe, 57Fe, 59Co, 60Ni, 63Cu, 66Zn, 75As, 85Rb, 88Sr, 89Y, 90Zr, 93Nb, 95Mo, 118Sn, 133Cs, 137Ba, 139La, 140Ce, 141Pr, 146Nd, 147Sm, 153Eu, 157Gd, 159Tb, 163Dy, 165Ho, 166Er, 169Tm, 172Yb, 175Lu, 181Ta, 182W, 204Pb, 206Pb, 208Pb, 232Th and 238U.
The analyses of reference materials were performed after every ten sample analyses and comprised readings identical in every respect to that of the samples. Two analyses of NIST 612, followed by one of NIST 610 and a final two NIST 612 analyses comprised the standard run. Dwell times for each element were set to 0.01 s except for 75As, 89Y, 153Eu, 157Gd, 159Tb, 163Dy, 165Ho, 166Er, 169Tm, 172Yb, 175Lu, 181Ta, 182W, 204Pb, 206Pb, 208Pb, 232Th and 238U, which were set to 0.02 s to achieve better sensitivity. Data processing was performed using GLITTER data reduction software with P as an internal standard using values obtained via electron probe microanalysis (EPMA) and given in [20]. All analyses were examined in detail in time-resolved depth profiles to ensure negligible contamination from included or adjacent minerals during ablation. Typical minimum detection limits for the analyzed elements are given in Supplementary Material Table S1.
Quantitative compositional data for apatite were obtained using a CAMECA SX-Five instrument at Adelaide Microscopy (The University of Adelaide). It was operated at accelerating voltages of 15 kV, and beam currents of 20 nA. X-ray lines, standards, count times, and typical minimum limits of detection are given as Supplementary Material Table S2. A spot size of 1 µm was used.
5. Results
5.1. Apatite in Altered and Unaltered Igneous Rocks
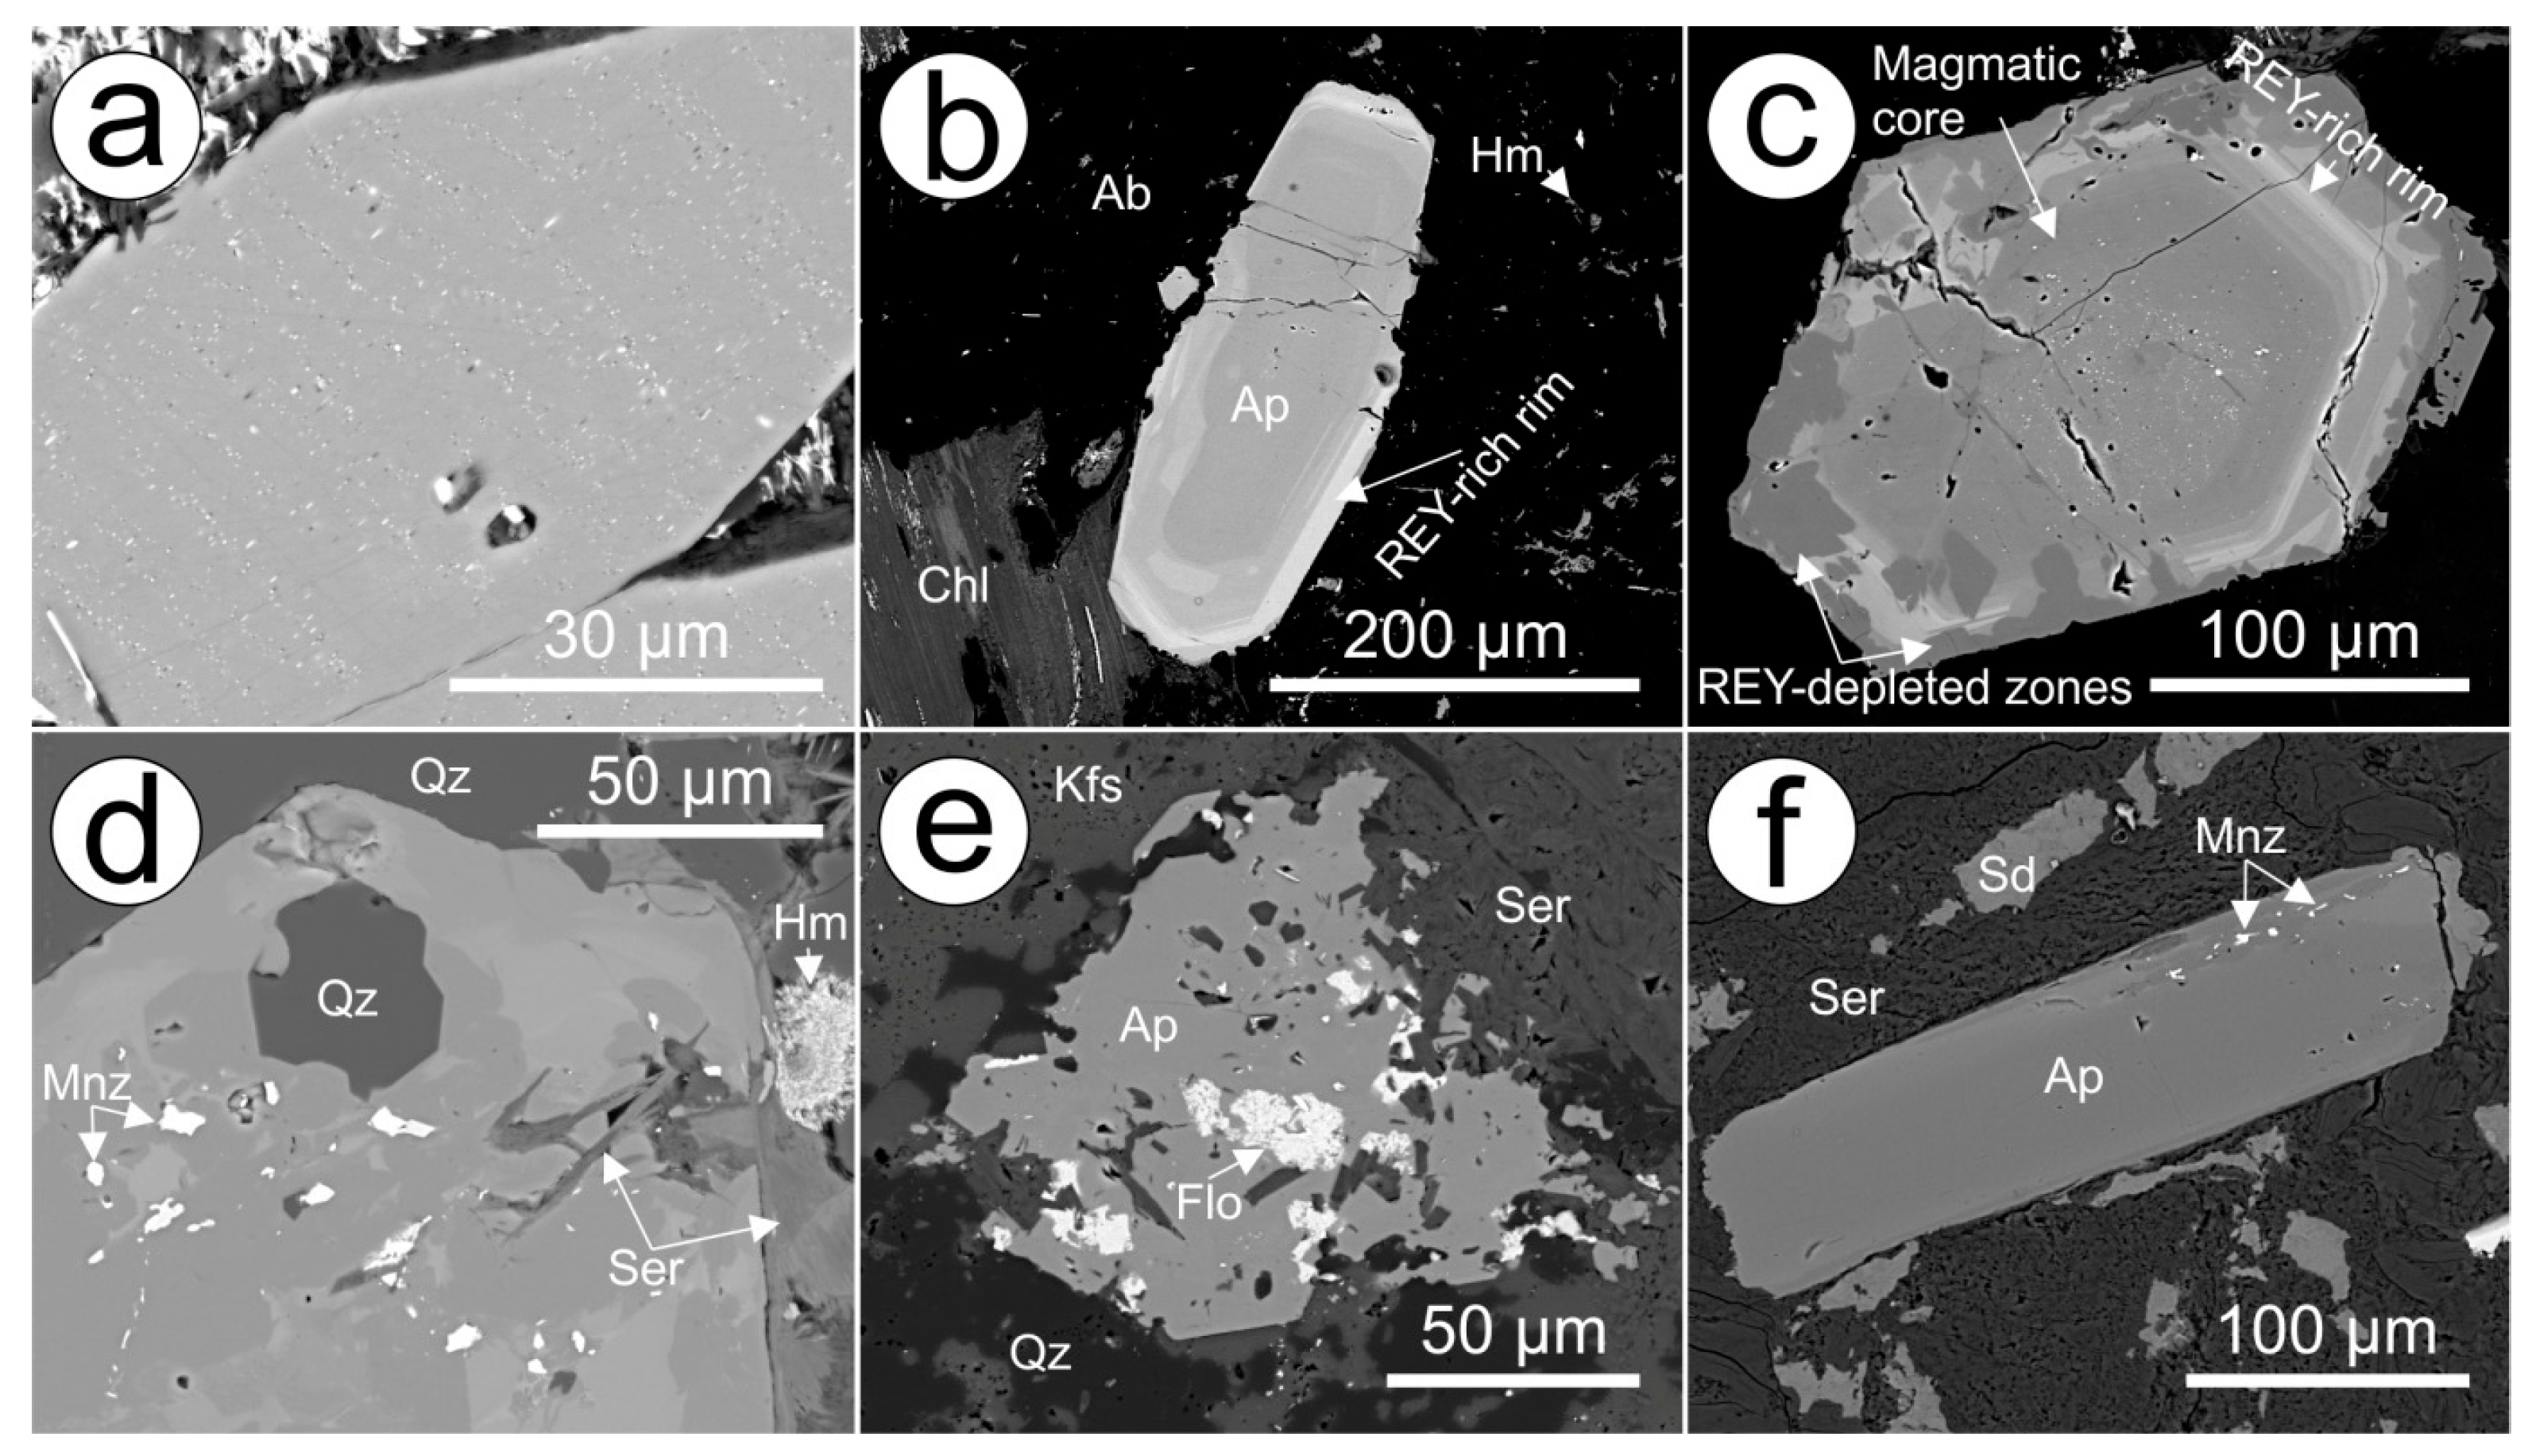
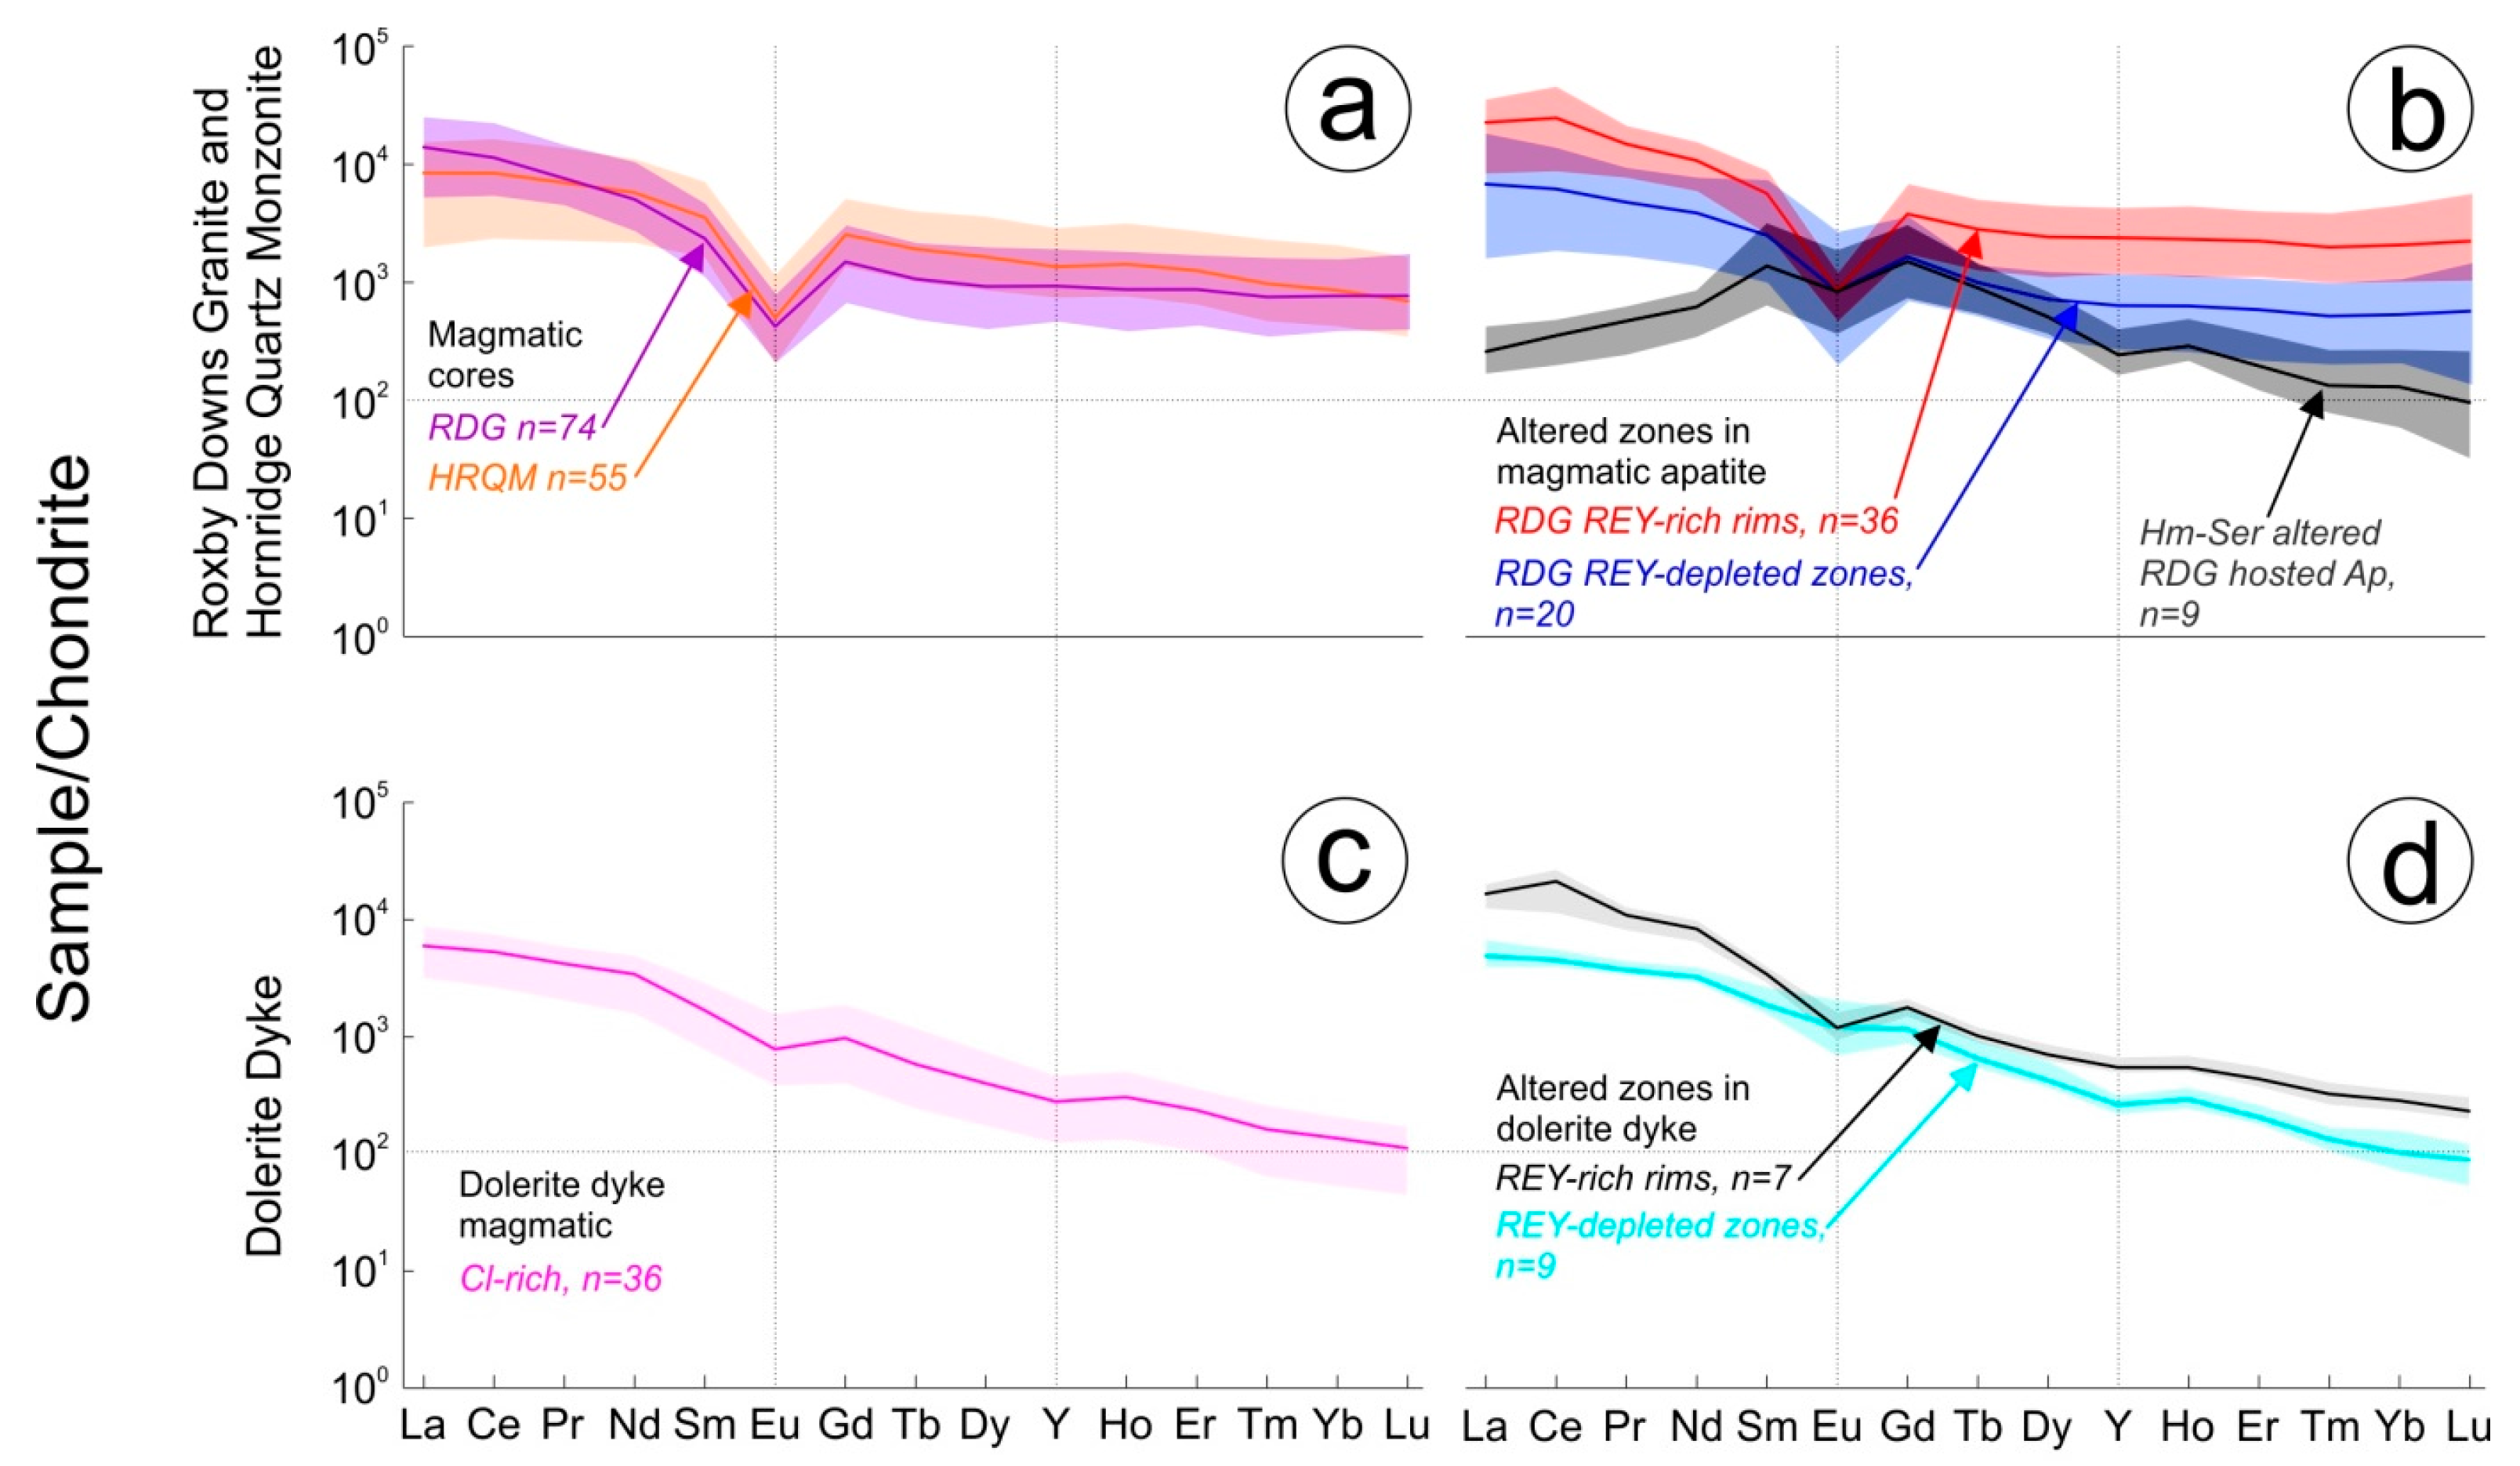
Magmatic apatite from RDG features core (low) to rim (high) zonation with respect to REY concentrations (Table 2; Figure 2a–c). In many cases, apatite displays a mottled texture (Figure 2a) due to the presence of sub-micron to nanometre-scale inclusions of pyrrhotite and fluorite, which were observed in abundance in parts of RDG with numerous mafic enclaves. The occurrence of pores and a broader range of sulphide inclusions attached to these pores (including pyrite, chalcopyrite, etc.), as well as monazite inclusions, particularly in areas of strong hydrothermal fluid overprint (Figure 2c,d) is interpreted as fluid percolation. Nonetheless, both core and rim zones display LREE-enriched chondrite-normalized fractionation patterns with strong negative Eu anomalies (Figure 3a,b). ΣREY concentrations in the REY-rich rims are approximately double those in the core, and have a positive Ce anomaly (Figure 3b). Hydrothermally altered zones in apatite hosted in weakly-altered RDG become depleted slightly in both LREE and HREE when compared to the inclusion-rich cores (Figure 2c,d and Figure 3b). They also display a marked decrease in the strength of the Eu anomaly (mean 0.4 vs. 0.24; Figure 3b). At shallow levels closer to the OD deposit, in pervasively hematite-sericite altered RDG, magmatic apatite has been obliterated.
Locally, in RDG with intervals of hematite-sericite alteration, unzoned apatite features abundant inclusions of florencite [REEAl3(PO4)2(OH)6] (Figure 2e). In this case, the trend changes markedly, displaying a MREE-enriched chondrite-normalized REY fractionation pattern with weak negative Eu anomalies (0.59) and slight negative Y-anomalies (0.6) (Figure 2e and Figure 3b).
The HRQM contains igneous apatite grains that resemble those within the RDG in many ways, including the presence of inclusion-rich cores, hydrothermal rims and domains of REY-depletion (Table 3). However, both the hydrothermal rims and REY-depletion are poorly developed. HRQM apatite is LREE-enriched and almost indistinguishable from that hosted in the RDG although the negative Eu-anomaly is slightly stronger (Figure 3a).
Unzoned, Cl-bearing fluorapatite from the DD (Figure 2f) displays a LREE-enriched chondrite-normalized pattern with weak negative Eu- and Y-anomalies (Table 4; Figure 3c) with average ΣREY-concentrations approximately half compared to apatite from RDG and HRQM. Distinct hydrothermally REY-enriched zones in apatite from the DD mirror aspects seen in the RDG whereby ΣREY concentrations correlate with development of a weak Ce-anomaly (Figure 3b,d). Moreover, the REY-depletion seen along fractures and grain rims shows a preferential depletion in LREE, and is associated with a weaker negative Eu anomaly and a stronger negative Y anomaly (Figure 3c,d).
5.2. Early Hydrothermal Apatite
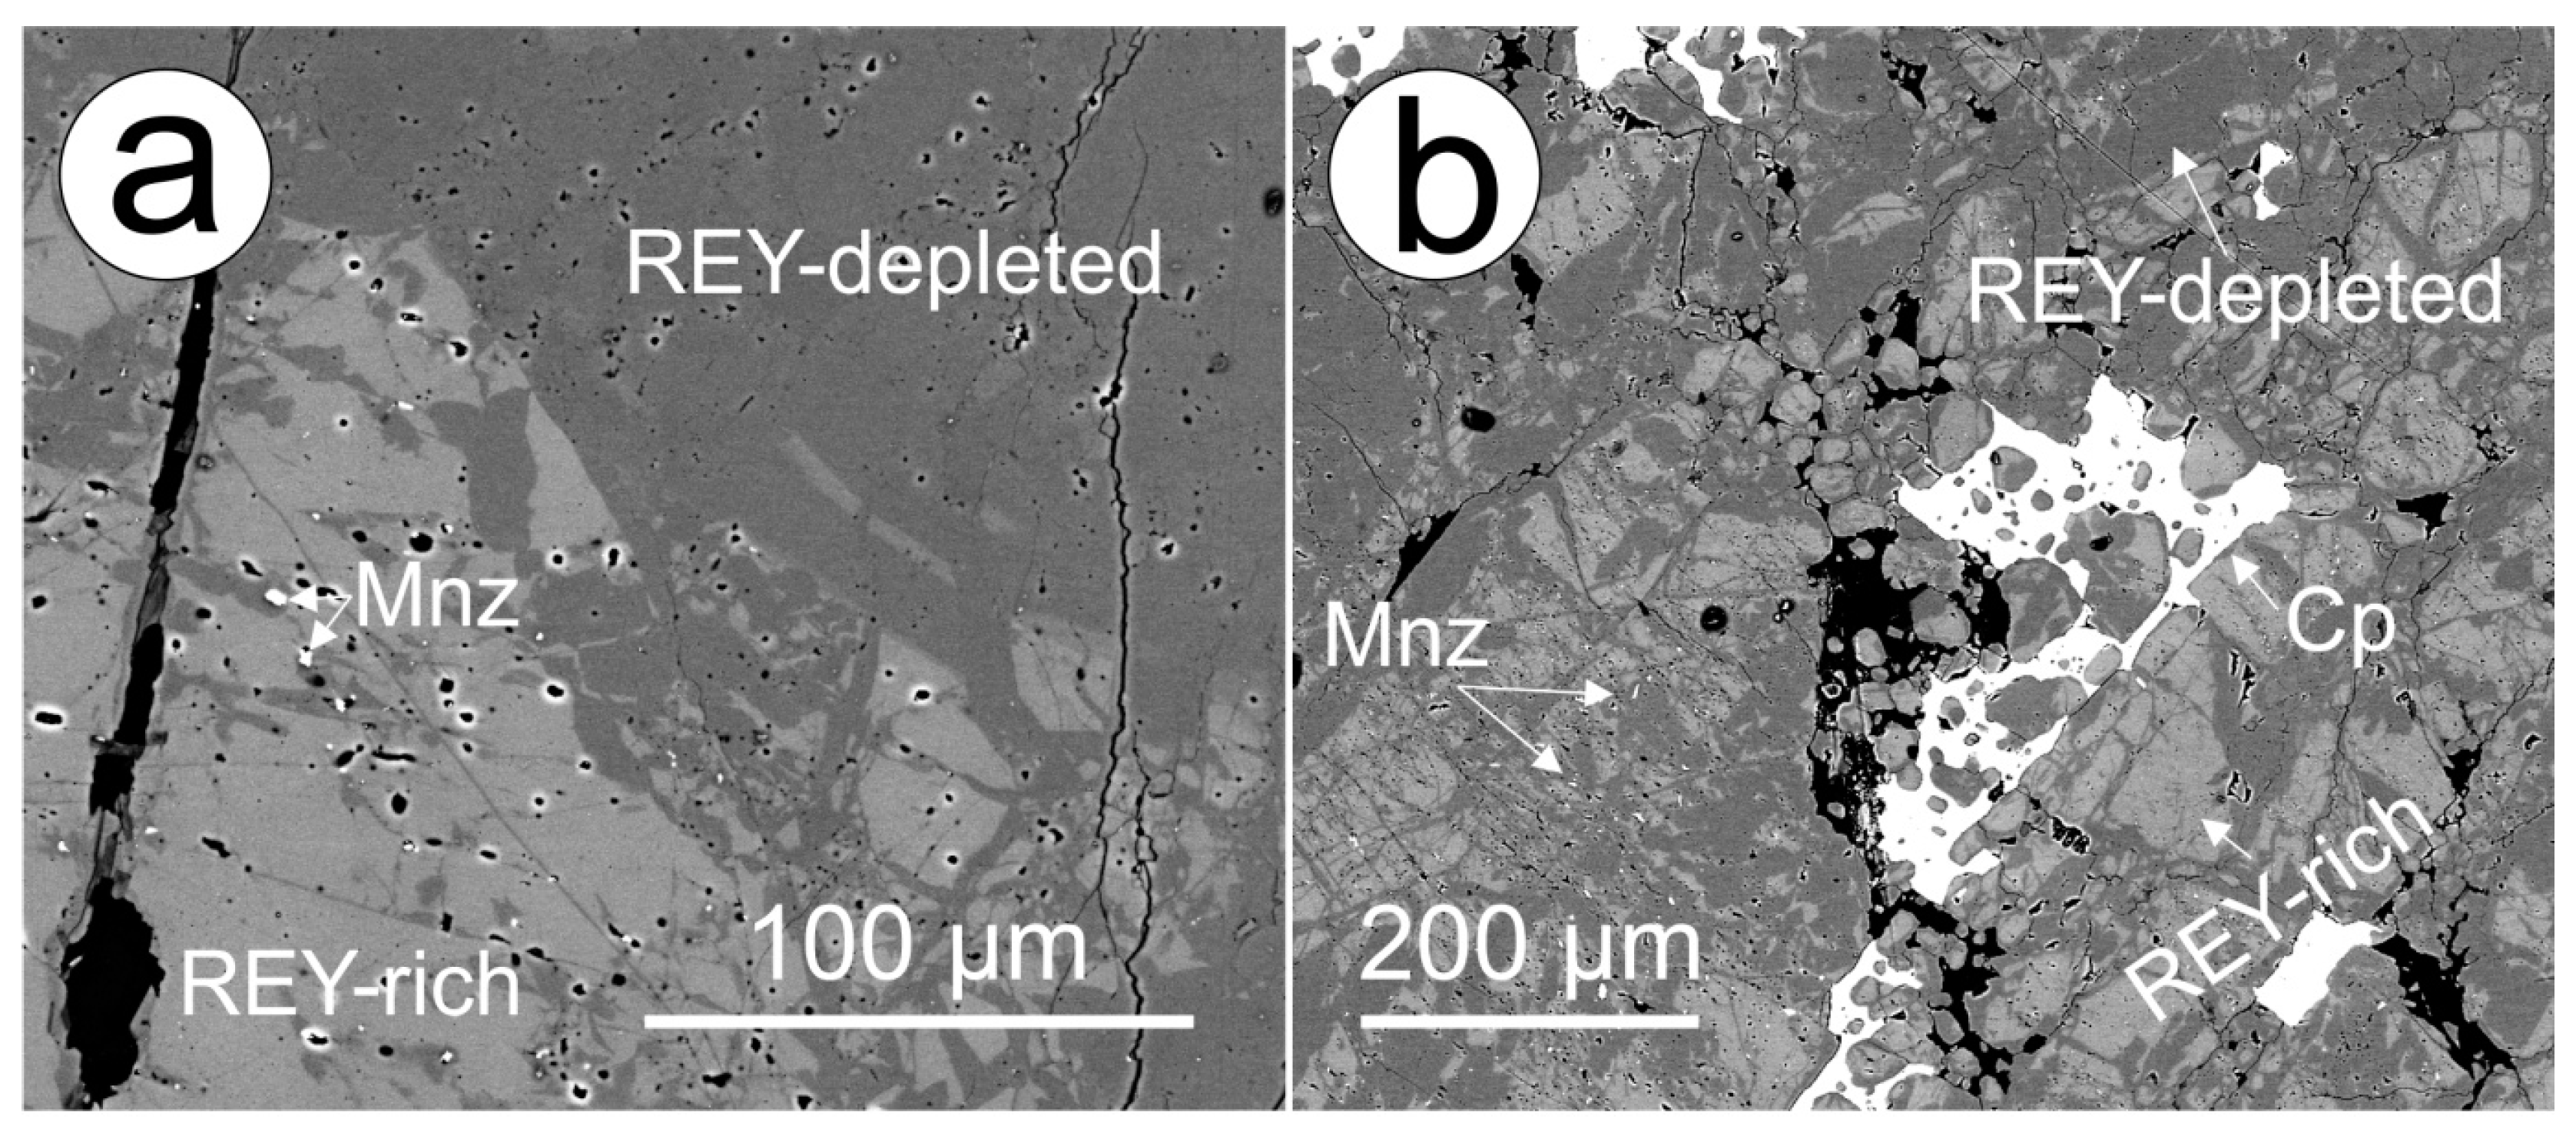
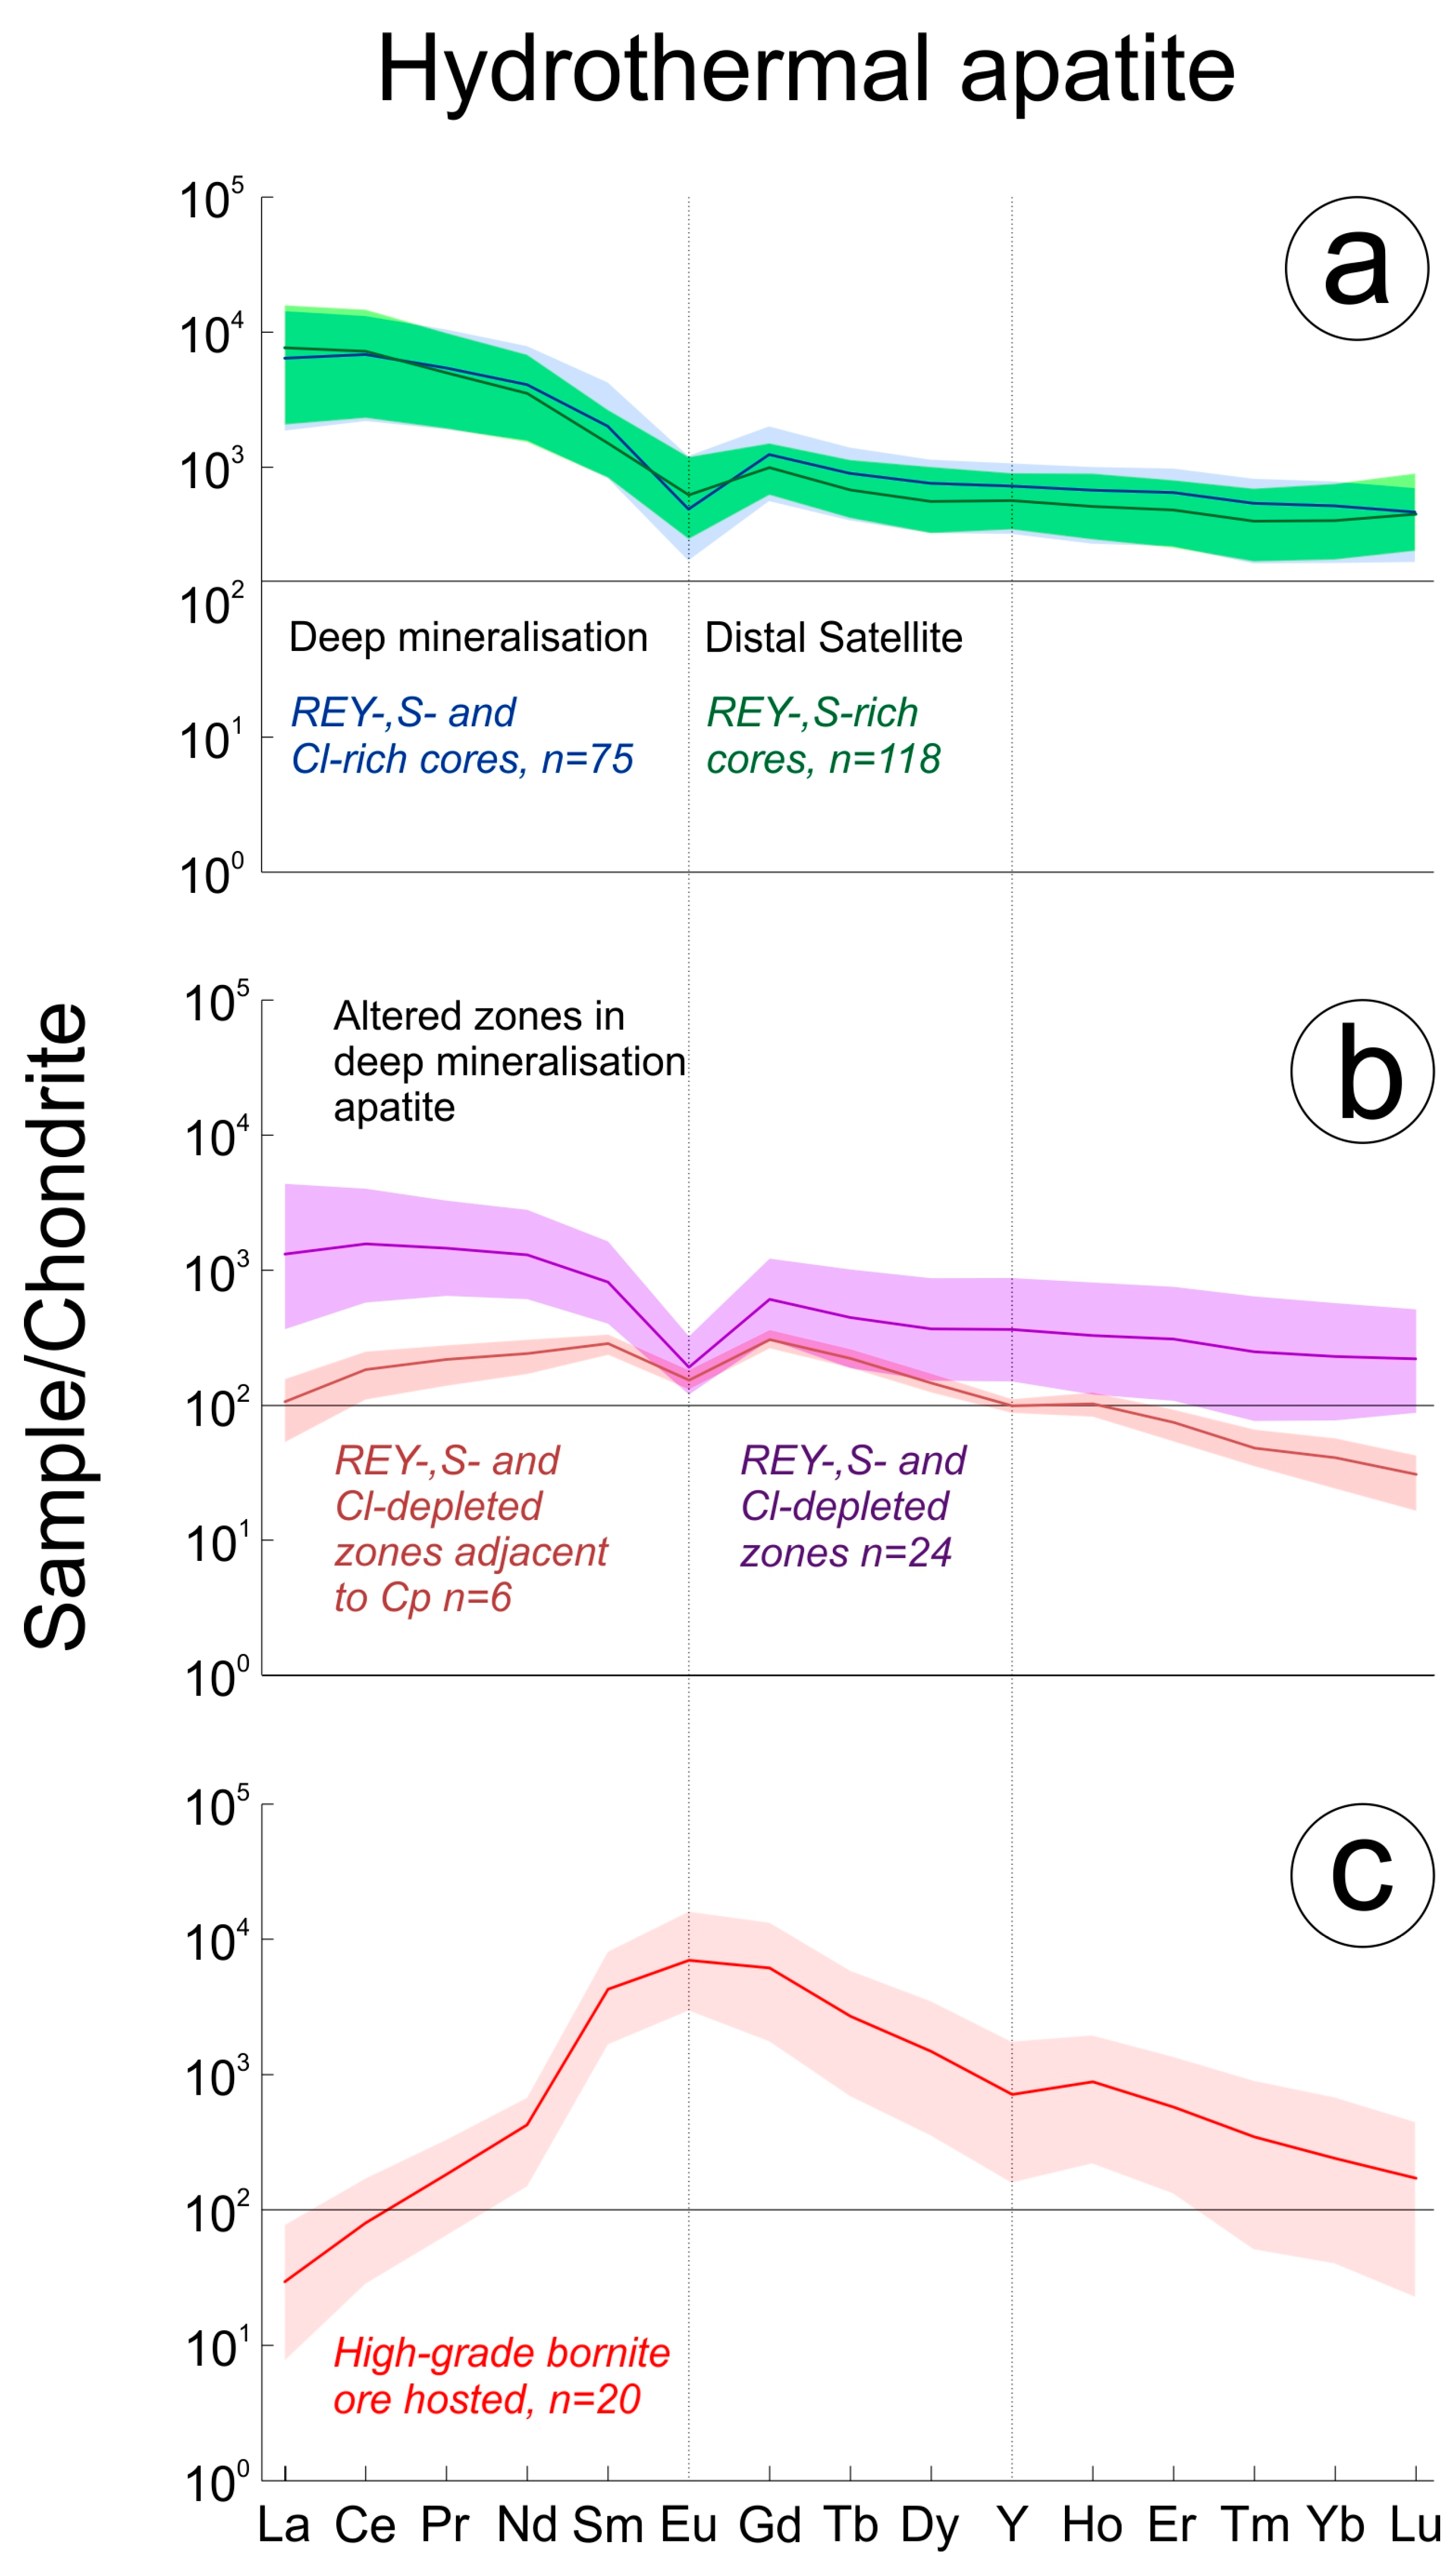
Early hydrothermal apatite is observed in both the DM (REY, S and Cl-rich cores; Figure 4a–c) and the DS mineralization (REY and S-rich grains; Figure 4d). It displays similar, almost indistinguishable LREE-enriched chondrite-normalized REY fractionation patterns featuring moderate negative Eu anomalies (Table 5 and Table 6; Figure 5a). Such patterns most resemble those of igneous apatite in the RDG and HRQM, although the negative Eu anomalies are weaker.
Although poorly developed and only rarely seen in DS apatite, zones of alteration in early hydrothermal apatite featuring depletion in REY are widespread throughout DM apatite. These are visible on BSE images as darker domains that are concentrated along fractures and grain rims and commonly contain inclusions of hematite, sericite and monazite (REY, S and Cl-depleted zones; Figure 4a,b). The depletion in such zones primarily affects the LREE, significantly flattening the REY-signature and weakening the negative Eu anomaly. In instances where such altered zones within apatite are adjacent to texturally late chalcopyrite (REY, S and Cl-depleted zones adjacent to chalcopyrite; Figure 4b), both LREE and HREE are affected. Such domains in apatite display MREE-enriched trends with weak negative Eu and Y anomalies (Figure 5b) similar in appearance to the MREE-enriched signatures of apatite with florencite inclusions (Figure 2e and Figure 3b).
5.3. High-Grade Bornite Ore
Fluorapatite is a relatively rare component of the ores themselves, making up just 0.103% of the orebody based on mineral liberation analysis of 10,000 samples [18]. However, in samples of high-grade massive bornite, apatite is present as a minor but pervasively distributed and intrinsic mineral component in the assemblage (Table 7, Figure 6a). Besides bornite, the second most abundant mineral is hematite, also in terms of its pervasive distribution. Hematite occurs as two generations defined by textures and trace element signatures [45]. These are: (i) coarser, brecciated, porous and rounded grains poor in U-W-Mo, hosting discrete inclusions of REY- and U-minerals; and (ii) acicular aggregates with U-W-Mo-oscillatory zonation patterns; the latter was dated at 1577 ± 5 Ma [31]. Based on textures and trace elements patterns, the acicular hematite is younger than type (i), and hematite type (ii) is co-genetic with the studied apatite because it is observed to grow within it (Figure 6b,c). In addition, fragments of milled hematite-(i) and bornite are found within apatite, which has undergone crystallization (developing crystal faces) as it seals brecciation within the bornite-hematite assemblage (Figure 6d).
The massive bornite samples show multiple stages of overprint, including metamictization of zircon with recrystallized domains that were dated at 1343 ± 47 Ma [31] and surrounded by haloes of xenotime (Figure 6a, inset). Furthermore, the overprint is illustrated by the presence of a variety of trace minerals tied to fractures within hematite and grain boundaries, such as common florencite, a few µm in size, or rare interstitial U-bearing minerals (fine-grained coffinite-brannerite intergrowths), dusty inclusions of U and REY-bearing phases within altered hematite, as well as tiny flakes of molybdenite in bornite. Lamellar chalcopyrite exsolutions occur in bornite adjacent to xenotime and rare, µm-sized chalcocite forms within fractured hematite of generation (i). Florencite contains nanometre-sized inclusions of hematite [31]. In addition, fractures containing milled, dusty fragments of all minerals in the assemblage are also present.
Compositionally, the apatite is unzoned and F-rich with low, only sporadically measurable Cl, or calculated OH−, concentrations (Table 8). The chondrite-normalized REY fractionation patterns for this fluorapatite are conspicuously enriched in MREE (Figure 5c). A positive Eu anomaly and strong negative Y anomaly contribute to making it completely distinct from both the igneous and early hydrothermal apatite types.
Most other trace elements are depleted in apatite from the massive bornite samples, except for Sr which is present at concentrations one to two orders of magnitude higher (mean ~1350 ppm) than those measured in early hydrothermal (DM REY-, S- and Cl-rich cores mean ~390 ppm) and RDG-hosted apatite (magmatic cores mean ~80 ppm), respectively.
5.4. Apatite as a Host for U, Th and Pb
The chemical-structural formula of apatite group minerals allows for the incorporation of a wide range of minor and trace elements. These include U, Th and Pb, making apatite a potential host for radionuclides from the 238U, 235U and 232Th decay chains. Hydrothermal apatite in the high-grade bornite ore contains no more than a few ppm U or Th (mean values in individual samples 3–4 ppm Th, 1–3 ppm U, Table 7), increasing to a few tens of ppm Th and U in deep mineralization, preferentially within the REY, S and Cl-rich cores of apatite grains. In contrast, igneous apatite in altered host RDG is appreciably richer in both elements (high tens to low hundreds of ppm Th, typically tens of ppm U but 360 ppm in apatite in one sample). Magmatic cores in both the RDG and HRQM contain high U and Th concentrations of tens to ~100 ppm for both elements. These concentrations increase further in the REY-rich rims of RDG apatite, approximately tripling in both cases and in agreement with REY-behaviour.
The U/Th ratio remains largely constant within the magmatic apatite and the altered zones contained within it (0.1 to 0.6), but these do show a far broader range in hydrothermal apatite, commonly spanning several orders of magnitude (0.1 to 10) within a single sample. Lead in all apatite types examined is dominated by 206Pb and 208Pb with 204Pb concentrations almost consistently below the minimum limits of detection. Concentrations of 206Pb and 208Pb show a very strong correlation with U, Th and REY across the sample suite.
These data show (Table 2, Table 3, Table 4, Table 5, Table 6 and Table 7) that, despite variability and local enrichment, apatite is not a significant carrier of U, Th or Pb on the deposit scale. In the magmatic environment, U and Th partition strongly into apatite whereas in hydrothermal apatite, U and Th are likely partitioned into other phases, notably discrete U-minerals and hematite. Measurable concentrations of U and Th are also found within REY-mineral inclusions (bastnäsite, monazite, etc.) within apatite.
5.5. Trace Element Patterns
Many fluorapatite grains, both magmatic and hydrothermal, display grain-scale compositional zoning on BSE images. Such zoning primarily relates to the concentration of REY, as well as other elements, notably U, Th and Pb, which correlate positively with REY. Zoning is also related to hydrothermal alteration of apatite along grain margins and fractures. This is particularly obvious in RDG and HQRM-hosted apatite (Figure 7) where REY-rich rims also show high concentrations of U, Th and Pb. Early hydrothermal apatite within the DM also displays compositional zoning related to variation in concentration of the same elements. However, in this case and in marked contrast with magmatic apatite, the high concentrations of REY, U, Th and Pb are confined to grain cores, which represent the earliest hydrothermal fluid. These same elements are depleted along fractures and grain rims (Figure 8). Interestingly, concentrations of As show an inverse trend. Zoned apatite is for the most part lacking in the DS and particularly so in the high-grade bornite ore whereas zoning within apatite hosted by the DD is confined to discrete fracture related zones. Petrographic work by Krneta et al. (2016) [20] provides a framework to consider the evolution of trace element-signatures in apatite. Clear associations between compositionally-distinct apatite, or constituent zones thereof, with certain hydrothermal assemblages, and comparisons of those compositions with magmatic apatite, allow for variation in trace element concentrations to be viewed in the context of the physiochemical conditions at the time of formation of the mineral assemblage.
6. Discussion
6.1. REY-Signatures in Apatite and the Transition from Magmatic to Hydrothermal Stages
REY-signatures measured in magmatic apatite of the RDG, HRQM and DD closely resemble those for apatite from analogous intrusive elsewhere [8,9,46]. Similarly, the LREE-enriched signatures characteristic for DM and DS apatite (REY-, S- and Cl-rich cores and REY-, S-rich cores, respectively) are almost identical to apatite REY-signatures measured in apatite from similar magnetite-apatite ± pyrite assemblages elsewhere within the Olympic Cu–Au Province [1,10,47], as well as globally [11,14]. Such an observation reinforces the interpretation of Krneta et al. (2017) [10] that although not unique to early high-temperature apatite associated with magnetite ± pyrite assemblages in IOCG systems, LREE-enriched apatite signatures are certainly characteristic for such apatite. In contrast, the characteristics that define the signatures of later generations of apatite associated with hematite-sericite alteration and high-grade ore (MREE-enrichment, positive Eu- and negative Y-anomalies) are less commonly reported. MREE-enriched REY-signatures with weak positive Eu anomalies are particularly scarce in the literature and their description has thus far been limited to orogenic-Au deposits [9,48] and IOCG mineralization within the Olympic Cu–Au belt [10].
A preferential depletion of LREE from apatite has been noted elsewhere in IOCG and IOA deposits [10,11] and corresponds to a shift in fluid conditions as determined by a significant overprinting of the magmatic or early hydrothermal minerals in the host rock. Where it is LREE-depleted, the apatite commonly contains inclusions of minerals belonging to the overprinting assemblage (hematite, sericite). This preferential LREE-depletion, either where pre-existing apatite is present or where new grains of MREE-enriched apatite are formed, can be attributed to an increased proportion of LREE in the fluid occurring as highly mobile REY–Cl complexes at hydrothermal conditions characteristic of the hematite-sericite dominant assemblage. This causes LREE to be effectively partitioned away from apatite [6]. Therefore, an evolution in the speciation of REY-complexes in the fluid brought about by changing physicochemical conditions could explain the switch in REY-signatures. However, this does not address the weakening of the negative Eu anomaly in the hematite-sericite altered zones, or the presence of a positive Eu anomaly in the high-grade bornite ore.
The weakening of the negative Eu anomaly in apatite associated with hematite-sericite alteration may be the result of crystallization from fluids enriched in Eu relative to other REE by the sericitization of feldspars, which are characterized by Eu-enrichment [9]. Similarly, the marked negative Y-anomaly in these apatites may be inherited from the feldspars, as they display a negative Y-anomaly within the RDG [21]. However, development of the negative Y-anomaly may be attributed to the behaviour of Y as a pseudo-lanthanide heavier than Lu effectively partitioning away from adjacent REE in F-rich fluids [49]. Such conditions may be justifiable given the marked F-rich character of the deposit.
Although evolution from LREE to MREE-enriched apatite (with positive Eu anomalies and negative Y anomalies) most probably stems from changes in fluid parameters, it also correlates with changes in the dominant hydrothermal assemblage hosting the apatite. This demonstrates that REY-signatures in apatite can fingerprint individual assemblages and are reflective of significant changes in REY-behaviour during the formation of OD (Figure 9a,b).
6.2. REY Signatures in Apatite Associated with High-Grade Ores
Apatite preferentially incorporates Eu3+ over Eu2+, and although the greatest control on the proportion of the two species is exerted by fO2 in the magmatic environment [8], their speciation in hydrothermal fluids is primarily controlled by H+ activity whereby Eu3+ complexes dominate at high pH conditions (>7 at 300 °C; [50]). Such alkaline conditions are unrealistic for the fluids responsible for the broad hematite-sericite alteration due to the low pH required for sericite stability at this temperature.
The positive Eu anomaly in the high-grade bornite ore hosted apatite may, however, be the result of crystallization from an alkaline, CO2–HCO3− buffered fluid analogous to that invoked by [50] to explain comparable trends, observed and thermodynamically assessed, in scheelite from orogenic Au deposits (Mt. Charlotte and Drysdale, Western Australia). Evidence for the existence of such volatile-rich fluids (CO2) accounting for high-grade ore deposition can be inferred from the presence of inclusions of milled hematite-(i) and bornite in apatite undergoing crystallization (Figure 6d). Moreover, the scenario of fluid pulses with unusual chemistry relative to those accounting for the bulk of ores associated with hematite-sericite alteration but still affiliated with the IOCG event at ~1.6 Ga is feasible based on ongoing U–Pb hematite geochronology at OD.
Growth of U-rich, zoned hematite within apatite with such a distinct trend (Figure 5c and Figure 6b,c) ties the formation of apatite at ~1.6 Ga, rather than during the later overprinting event recorded by zircon (1577 ± 5 Ma and 1343 ± 47 Ma, respectively, [31]. The hematite age is clearly younger by ~20–10 Ma than the earliest hematite, for which high-precision ID-TIMS dating of samples from the deepest, chalcopyrite + pyrite zone in the SE lobe give ages concordant with those of magmatic zircon in RDG [33]. Although similar U–W–Sn–Mo-rich and zoned hematite are observed across the ~6 km strike and ~2 km depth of the deposit [51], preliminary dating of such hematite throughout the deposit shows variation in ages, including younger dates, obtained from hematite in high-grade bornite ore from another location (NW arm) than the sample discussed here [33].
6.3. The Role of Apatite as a Host for U, Th and Pb
The affinity for U, Th and Pb shown by apatite is well known, and the mineral is increasingly finding application as a valuable geochronometer and in thermochronology [52]. The ease with which apatite incorporates U and Th has been exploited as a medium for radionuclide removal and long-term storage [53].
All three elements replace Ca in apatite. The incorporation of U and Th is as 4+ species requiring a vacancy to maintain charge balance [41], whereas Pb2+ substitutes directly for Ca2+. Uranium and Th show a very strong affinity for the Ca2 position in fluorapatite [54], analogous to the LREE, although such a relationship might normally put them in direct competition for this position and lead to a negative correlation between the two elements, as is commonly the case between As and Si in the P site [10]. The evidence here, however, shows that their behaviour mirrors that of the REY in both magmatic and hydrothermal fluorapatite (Figure 9c,d).
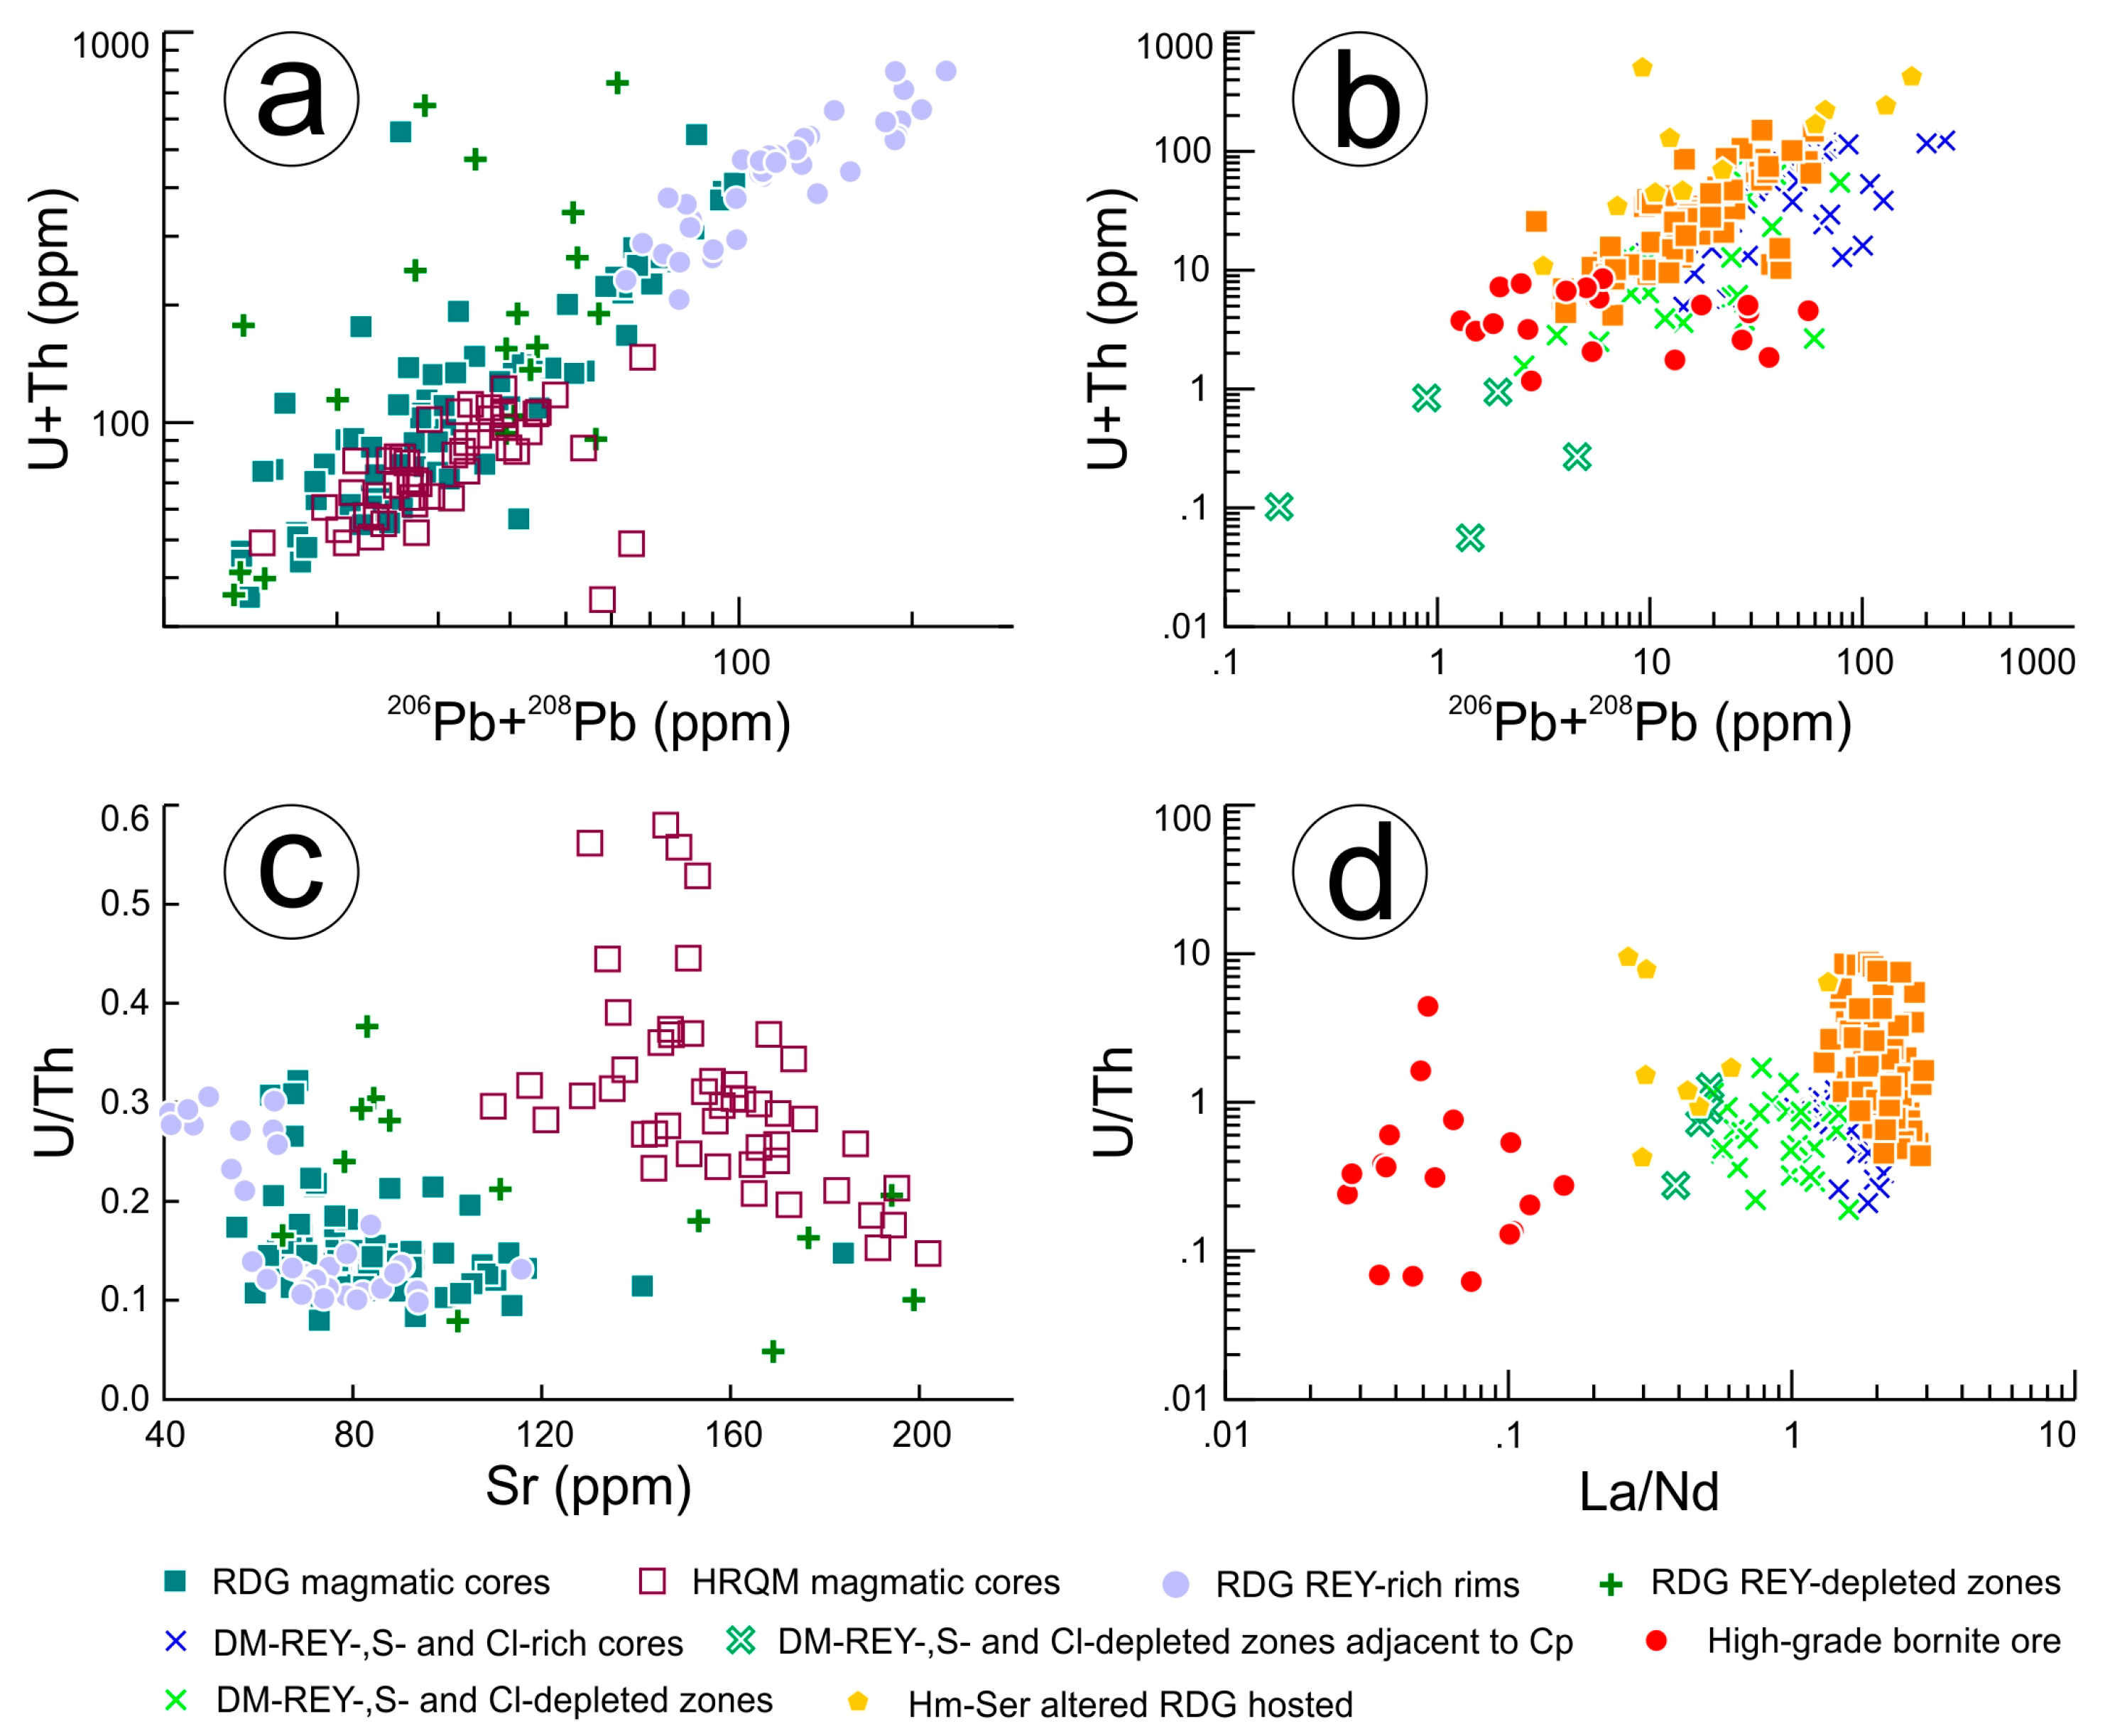
Uranium and Th show very strong correlations with their respective daughter lead isotopes, 206Pb and 208Pb (Figure 10a), although hydrothermal apatite displays significantly greater scatter (Figure 10b). The U/Th ratios appear to track differentiation in RDG and HQRM magmatic apatite (Figure 10c), akin to Sr concentrations [20] whereas this ratio varies considerably in hydrothermal apatite, both within individual apatite types and between them (Figure 10d).
The decrease in the concentration of several trace elements in fluorapatite from magmatic through to early hydrothermal and finally ore-hosted apatite suggests that apatite strongly partitions trace elements in the magmatic environment. including the REY, U and Th. Apatite may thus be one of the major REY hosts in unaltered RDG and HQRM, and could also, alongside zircon and rare uranothorite [18], be a significant host for U and Th in those rocks. The lower concentration of these elements in hydrothermal apatite can be attributed to the increased abundance of uraninite, brannerite, coffinite and hematite in the case of U [55,56], and (probably) monazite in the case of Th, which are able to partition them more efficiently than apatite. Citing the comparable behaviour of decreasing trace element concentrations in feldspars from magmatic to hydrothermal within the deposit, Kontonikas-Charos et al. (2017) [21] reached similar conclusions, suggesting that a significant metal contribution was made to the deposit via the hydrothermal alteration of feldspars. Although apatite is a far smaller component of the RDG than feldspar, replacement of magmatic apatite associated with hematite-sericite alteration, may have also contributed REY, U and Th to the overall metal budget at Olympic Dam.
7. Conclusions
Magmatic and early hydrothermal apatite within the OD deposit carry chemical signatures, particularly with respect to the REY, which are characteristic of the host’s intrusive or early hydrothermal assemblage. The LREE-enriched signatures measured in these apatites are concordant with REY-signatures in apatite hosted in analogous intrusive rocks globally, as well as from magnetite-apatite ± pyrite assemblages in some IOCG and IOA deposits.
The transition from LREE to MREE-enriched apatite coincident with a weakening of negative Eu anomalies and the formation of negative Y anomalies appears to track an evolution from the magmatic, through early magnetite-associated hydrothermal to hematite-sericite-associated and finally high-grade bornite ore-hosted apatite. Such a transition has been noted at the Wirrda Well and Acropolis prospects and may be characteristic of IOCG systems with alteration patterns similar to OD.
In the magmatic environment, and to a lesser extent under hydrothermal conditions characteristic of early magnetite-associated mineralization, apatite appears to heavily partition several trace elements including U and Th. Concentrations of these and other trace elements weaken significantly in later apatite generations most likely due to the increased abundance of other phases competing for the same trace elements. This is best seen by comparing U concentrations in primary magmatic apatite with those in hydrothermal apatite hosted by massive bornite ore. The least-altered RDG contains whole rock U concentrations of approximately 13 ppm, whereas samples akin to the massive bornite mineralization commonly contain U in the range of 125–495 ppm U [19]. Apatite hosted within these rocks shows, however, the opposite trend. The replacement of magmatic apatite by other minerals, e.g., monazite, florencite, may have contributed to the overall U, Th and REY budget at OD.
Remarkably, the MREE-enriched fractionation trend displayed by apatite, with its strong positive Eu anomaly, is indicative of alkaline, CO2-HC buffered fluids accounting for high-grade ore formation across a spectrum of hydrothermal deposits spanning IOCG and orogenic Au systems.
Supplementary Materials
The following are available online at www.mdpi.com/2075-163X/7/8/135/s1, Table S1: Typical minimum detection limits (mdl) for LA-ICP-MS analysis, Table S2: Standards, X-ray lines, count times and typical minimum detection limits (mdl) for electron probe microanalysis.
Acknowledgments
This work is supported by BHP Billiton Olympic Dam. We gratefully acknowledge microanalytical assistance from the staff at Adelaide Microscopy, notably Ben Wade. Nigel J. Cook. and Kathy Ehrig acknowledge support from the ARC Research Hub for Australian Copper–Uranium. Cristiana L. Ciobanu acknowledges support from the “FOX” project (Trace Elements in Iron Oxides), supported by BHP Billiton Olympic Dam and the South Australian Mining and Petroleum Services Centre of Excellence. The authors extend thanks to the three anonymous reviewers whose pertinent comments assisted us to present our results, and to the Minerals editorial team for assistance and handling of the manuscript.
Author Contributions
Sasha Krneta performed all analytical work and data processing under the guidance of Cristiana L. Ciobanu and Nigel J. Cook; Kathy Ehrig contributed samples and deposit information; Alkis Kontonikas-Charos contributed data and knowledge on the samples. Sasha Krneta, Nigel J. Cook and Cristiana L. Ciobanu wrote the paper, assisted by all other authors. The work is part of the PhD project of Sasha Krneta.
Conflicts of Interest
The authors declare no conflict of interest. The project sponsors approve publication of the manuscript.
References
- Ismail, R.; Ciobanu, C.L.; Cook, N.J.; Teale, G.S.; Giles, D.; Schmidt Mumm, A.; Wade, B. Rare earths and other trace elements in minerals from skarn assemblages, Hillside iron oxide–copper–gold deposit, Yorke Peninsula, South Australia. Lithos 2014, 184–187, 456–477. [Google Scholar] [CrossRef]
- Goldschmidt, V.M. The principles of distribution of chemical elements in minerals and rocks. The seventh Hugo Müller Lecture, delivered before the Chemical Society on March 17th, 1937. J. Chem. Soc. (Resumed) 1937, 655–673. [Google Scholar] [CrossRef]
- Bau, M. Rare-earth element mobility during hydrothermal and metamorphic fluid-rock interaction and the significance of the oxidation state of europium. Chem. Geol. 1991, 93, 219–230. [Google Scholar] [CrossRef]
- Haas, J.R.; Shock, E.L.; Sassani, D.C. Rare earth elements in hydrothermal systems: Estimates of standard partial molal thermodynamic properties of aqueous complexes of the rare earth elements at high pressures and temperatures. Geochim. Cosmochim. Acta 1995, 59, 4329–4350. [Google Scholar] [CrossRef]
- Migdisov, A.A.; Williams-Jones, A. Hydrothermal transport and deposition of the rare earth elements by fluorine-bearing aqueous liquids. Miner. Deposita 2014, 49, 987–997. [Google Scholar] [CrossRef]
- Migdisov, A.A.; Williams-Jones, A.E.; Brugger, J.; Caporuscio, F.A. Hydrothermal transport, deposition, and fractionation of the REE: Experimental data and thermodynamic calculations. Chem. Geol. 2016, 439, 13–42. [Google Scholar] [CrossRef]
- Harlov, D.E. Apatite: A fingerprint for metasomatic processes. Elements 2015, 11, 171–176. [Google Scholar] [CrossRef]
- Cao, M.; Li, G.; Qin, K.; Seitmuratova, E.Y.; Liu, Y. Major and Trace element characteristics of apatites in granitoids from Central Kazakhstan: Implications for petrogenesis and mineralization. Resour. Geol. 2012, 62, 63–83. [Google Scholar] [CrossRef]
- Mao, M.; Rukhlov, A.S.; Rowins, S.M.; Spence, J.; Coogan, L.A. Apatite trace element compositions: A robust new tool for mineral exploration. Econ. Geol. 2016, 111, 1187–1222. [Google Scholar] [CrossRef]
- Krneta, S.; Ciobanu, C.L.; Cook, N.J.; Ehrig, K.; Kontonikas-Charos, A. The Wirrda Well and Acropolis prospects Gawler Craton, South Australia: Insights into evolving fluid conditions through apatite chemistry. J. Geochem. Explor. 2017. under review. [Google Scholar]
- Harlov, D.E.; Andersson, U.B.; Förster, H.-J.; Nyström, J.O.; Dulski, P.; Broman, C. Apatite–monazite relations in the Kiirunavaara magnetite–apatite ore, northern Sweden. Chem. Geol. 2002, 191, 47–72. [Google Scholar] [CrossRef]
- Day, W.C.; Slack, J.F.; Auyso, R.; Seeger, C.M. Regional Geologic and Petrologic Framework for Iron Oxide ± Apatite ± Rare Earth Element and Iron Oxide Copper-Gold Deposits of the Mesoproterozoic St. Francois Mountains Terrane, Southeast Missouri, USA. Econ. Geol. 2016, 11, 1825–1858. [Google Scholar] [CrossRef]
- Daliran, F.; Stosch, H.-G.; Williams, P.J.; Jamali, H.; Dorri, M.B. Early Cambrian iron oxide-apatite-REE (U) deposits of the Bafq district, east-central Iran. Geol. Assoc. Can. Short Course Notes 2010, 20, 147–159. [Google Scholar]
- Bonyadi, Z.; Davidson, G.J.; Mehrabi, B.; Meffre, S.; Ghazban, F. Significance of apatite REE depletion and monazite inclusions in the brecciated Se–Chahun iron oxide–apatite deposit, Bafq district, Iran: Insights from paragenesis and geochemistry. Chem. Geol. 2011, 281, 253–269. [Google Scholar] [CrossRef]
- Kelley, K.D.; Eppinger, R.G.; Lang, J.; Smith, S.M.; Fey, D.L. Porphyry Cu indicator minerals in till as an exploration tool: Example from the giant Pebble porphyry Cu-Au-Mo deposit, Alaska, USA. Geochem. Explor. Environ. Anal. 2011, 11, 321–334. [Google Scholar] [CrossRef]
- Bouzari, F.; Hart, J.R.H.; Bissig, T.; Barker, S. Hydrothermal Alteration Revealed by Apatite Luminescence and Chemistry: A Potential Indicator Mineral for Exploring Covered Porphyry Copper Deposits. Econ. Geol. 2016, 111, 1397–1410. [Google Scholar] [CrossRef]
- Skirrow, R.G.; Bastrakov, E.N.; Barovich, K.; Fraser, G.L.; Creaser, R.; Fanning, M.C.; Raymond, O.L.; Davidson, G.J. Timing of iron oxide Cu–Au–(U) hydrothermal activity and Nd isotope constraints on metal sources in the Gawler craton, South Australia. Econ. Geol. 2007, 102, 1441–1470. [Google Scholar] [CrossRef]
- Ehrig, K.; Kamenetsky, V.S.; McPhie, J.; Apukhtina, O.; Ciobanu, C.L.; Cook, N.J.; Kontonikas-Charos, A.; Krneta, S. The IOCG-IOA Olympic Dam Cu-U-Au-Ag deposit and nearby prospects, South Australia. In Proceedings of the 14th Biennial SGA Conference, Quebec City, QC, Canada, 20–23 August 2017. [Google Scholar]
- Ehrig, K.; McPhie, J.; Kamenetsky, V.S. Geology and mineralogical zonation of the Olympic Dam iron oxide Cu-U-Au-Ag deposit, South Australia. In Geology and Genesis of Major Copper Deposits and Districts of the World, a Tribute to Richard Sillitoe; Hedenquist, J.W., Harris, M., Camus, F., Eds.; Society of Economic Geologists: Littleton, CO, USA, 2012; Volume 16, pp. 237–268. [Google Scholar]
- Krneta, S.; Ciobanu, C.L.; Cook, N.J.; Ehrig, K.; Kontonikas-Charos, A. Apatite at Olympic Dam, South Australia: A petrogenetic tool. Lithos 2016, 262, 470–485. [Google Scholar] [CrossRef]
- Kontonikas-Charos, A.; Ciobanu, C.L.; Cook, N.J.; Ehrig, K.; Krneta, S.; Kamenetsky, V.S. Feldspar evolution in the Roxby Downs Granite, host to Fe-oxide Cu-Au-(U) mineralisation at Olympic Dam, South Australia. Ore Geol. Rev. 2017, 80, 838–859. [Google Scholar] [CrossRef]
- BHP Billiton. Annual Report. 2016. Available online: http://www.bhpbilliton.com/-/media/bhp/documents/investors/annual-reports/2016/bhpbillitonannualreport2016.pdf?la=en (accessed on 21 September 2016).
- Reeve, J.S.; Cross, K.C.; Smith, R.N.; Oreskes, N. Olympic Dam copper–uranium–gold–silver deposit. In Geology of the Mineral Deposits of Australia and Papua New Guinea; Hughes, F.E., Ed.; Australasian Institute of Mining and Metallurgy: Melbourne, Australia, 1990; Volume 14, pp. 1009–1035. [Google Scholar]
- Creaser, R.A. The Geology and Petrology of Middle Proterozoic Felsic Magmatism of the Stuart Shelf. Ph.D. Thesis, La Trobe University, Melbourn, South Australia, 1989. Unpublished work. [Google Scholar]
- Huang, Q.; Kamenetsky, V.S.; Ehrig, K.; McPhie, J.; Kamenetsky, M.; Cross, K.; Meffre, S.; Agangi, A.; Chambefort, I.; Direen, N.G.; et al. Olivine-phyric basalt in the Mesoproterozoic Gawler silicic large igneous province, South Australia: Examples at the Olympic Dam Iron Oxide Cu–U–Au–Ag deposit and other localities. Precambr. Res. 2016, 281, 185–199. [Google Scholar] [CrossRef]
- Ciobanu, C.L.; Cook, N.J.; Ehrig, K. Ore minerals down to the nanoscale: Cu-(Fe)-sulphides from the Iron Oxide Copper Gold deposit at Olympic Dam, South Australia. Ore Geol. Rev. 2017, 81, 1218–1235. [Google Scholar] [CrossRef]
- Oreskes, M.; Einaudi, M.T. Origin of Hydrothermal Fluids at Olympic Dam: Preliminary Results from Fluid Inclusions and Stable Isotopes. Econ. Geol. 1992, 87, 64–90. [Google Scholar] [CrossRef]
- Bastrakov, E.N.; Skirrow, R.G.; Davidson, G.J. Fluid evolution and origins of iron oxide Cu–Au prospects in the Olympic Dam District, Gawler Craton, South Australia. Econ. Geol. 2007, 102, 1415–1440. [Google Scholar] [CrossRef]
- Mauger, A.J.; Ehrig, K.; Kontonikas-Charos, A.; Ciobanu, C.L.; Cook, N.J.; Kamenetsky, V.S. Alteration at the Olympic Dam IOCG-U deposit: Insights into distal to proximal feldspar and phyllosilicate chemistry from infrared reflectance spectroscopy. Aust. J. Earth Sci. 2016, 63, 959–972. [Google Scholar]
- Apukhtina, O.B.; Kamenetsky, V.S.; Ehrig, K.; Kamenetsky, M.B.; McPhie, J.; Maas, R.; Meffre, S.; Goermann, K.; Rodermann, T.; Cook, N.J.; et al. Postmagmatic magnetite–apatite assemblage in mafic intrusions: A case study of dolerite at Olympic Dam, South Australia. Contrib. Mineral. Petrol. 2016, 171. [Google Scholar] [CrossRef]
- Ciobanu, C.L.; Wade, B.; Cook, N.J.; Schmidt Mumm, A.; Giles, D. Uranium-bearing hematite from the Olympic Dam Cu-U-Au deposit, South Australia; a geochemical tracer and reconnaissance Pb-Pb geochronometer. Precambr. Res. 2013, 238, 129–147. [Google Scholar] [CrossRef]
- Courtney-Davies, L.; Zhu, Z.; Ciobanu, C.L.; Wade, B.P.; Cook, N.J.; Ehrig, K.; Cabral, A.R.; Kennedy, A. Matrix-matched iron-oxide laser ablation ICP-MS U-Pb geochronology using mixed solutions standards. Minerals 2016, 6, 85. [Google Scholar] [CrossRef]
- Courtney-Davies, L.; Ciobanu, C.L.; Tapster, S.; Condon, D.; Kennedy, A.; Cook, N.; Ehrig, K.; Wade, B.; Richardson, M. Steps to developing iron-oxide U-Pb geochronology for robust temporal insights into IOCG and BIF mineralisation. Appl. Earth Sci. 2017, 126, 51–52. [Google Scholar] [CrossRef]
- Jagodzinski, E.A. The Age of Magmatic and Hydrothermal Zircon at Olympic Dam. In In Proceedings of the 2014 Australian Earth Sciences Convention (AESC), Sustainable Australia, Newcastle, NSW, Australia, 7–10 July 2014; Volume 110, p. 260. [Google Scholar]
- Apukhtina, O.B.; Kamenetsky, V.S.; Ehrig, K.; Kamenetsky, M.B.; Maas, R.; Thompson, J.; McPhie, J.; Ciobanu, C.L.; Cook, N.J. Early, deep magnetite-fluorapatite mineralization at the Olympic Dam Cu–U–Au–Ag deposit, South Australia. Econ. Geol. 2017, in press. [Google Scholar]
- Huang, Q.; Kamenetsky, V.S.; McPhie, J.; Ehrig, K.; Meffre, S.; Maas, R.; Thompson, J.; Kamenetsky, M.; Chambefort, I.; Apukhtina, O.; et al. Neoproterozoic (ca. 820–830 Ma) mafic dykes at Olympic Dam, South Australia: Links with the Gairdner Large Igneous Province. Precambr. Res. 2015, 271, 160–172. [Google Scholar] [CrossRef]
- Pasero, M.; Kampf, A.; Ferraris, C.; Pekov, I.V.; Rakovan, J.; White, T. Nomenclature of the apatite supergroup minerals. Eur. J. Mineral. 2010, 22, 163–179. [Google Scholar] [CrossRef]
- Hughes, J.M.; Rakovan, J.F. Structurally robust, chemically diverse: Apatite and apatite supergroup minerals. Elements 2015, 11, 165–170. [Google Scholar] [CrossRef]
- Hughes, J.M.; Rakovan, J.F. The crystal structure of apatite, Ca5(PO4)3(F,OH,Cl). Rev. Mineral. Geochem. 2002, 48, 1–12. [Google Scholar] [CrossRef]
- Rønsbo, J.G. Coupled substitutions involving REE’s and Na and Si in apatites in alkaline rocks from Ilimaussaq, South Greenland, and the petrological implications. Am. Mineral. 1989, 74, 896–901. [Google Scholar]
- Pan, Y.; Fleet, M.E. Compositions of the apatite-group minerals: Substitution mechanisms and controlling factors. Rev. Mineral. Geochem. 2002, 48, 13–49. [Google Scholar] [CrossRef]
- Van Hinsberg, V.J.; Migdisov, A.A.; Williams-Jones, A.E. Reading the mineral record of fluid composition from element partitioning. Geology 2010, 38, 847–850. [Google Scholar] [CrossRef]
- Oreskes, M.; Einaudi, M.T. Origin of Rare Earth Element-Enriched Hematite Breccias at the Olympic Dam Cu-U-Au-Ag Deposit, Roxby Downs, South Australia. Econ. Geol. 1990, 85, 1–28. [Google Scholar] [CrossRef]
- McDonough, W.F.; Sun, S.-S. Composition of the Earth. Chem. Geol. 1995, 120, 223–253. [Google Scholar] [CrossRef]
- Cook, N.J.; Ciobanu, C.L.; George, L.; Ehrig, K. Trace Element Analysis of Minerals in Magmatic-Hydrothermal Ores by Laser Ablation Inductively-Coupled Plasma Mass Spectrometry: Approaches and Opportunities. Minerals 2016, 6, 111. [Google Scholar] [CrossRef]
- Belousova, E.A.; Griffin, W.L.; O’Reilly, S.Y.; Fisher, N.I. Apatite as an indicator mineral for mineral exploration: Trace-element compositions and their relationship to host rock type. J. Geochem. Explor. 2002, 76, 45–69. [Google Scholar] [CrossRef]
- Kontonikas-Charos, A.; Ciobanu, C.L.; Cook, N.J. Albitization and redistribution of REE and Y in IOCG systems: Insights from Moonta-Wallaroo, Yorke Peninsula, South Australia. Lithos 2014, 208, 178–201. [Google Scholar] [CrossRef]
- Brugger, J.; Lahaye, Y.; Costa, S.; Lambert, D.; Bateman, R. Inhomogenous distribution of REE in scheelite and dynamics of Archean hydrothermal systems (Mt. Charlotte and Drysdale gold deposits, Western Australia). Contrib. Mineral. Petrol. 2000, 139, 251–264. [Google Scholar] [CrossRef]
- Bau, M.; Dulski, P. Comparative study of yttrium and rare-earth element behaviours in flourine-rich hydrothermal fluids. Contrib. Mineral. Petrol. 1995, 119, 213–223. [Google Scholar] [CrossRef]
- Brugger, J.; Etschmann, B.; Pownceby, M.; Liu, W.; Grundler, P.; Brewe, D. Oxidation state of europium in scheelite: Tracking fluid-rock interaction in gold deposits. Chem. Geol. 2008, 257, 26–33. [Google Scholar] [CrossRef]
- Verdugo-Ihl, M.R.; Ciobanu, C.L.; Cook, N.J.; Courtney-Davies, L.; Ehrig, K.; Gilbert, S. Trace element signatures in U-W-Sn-Mo zoned hematite from the IOCG deposit at Olympic Dam, South Australia. In Proceedings of the 14th Biennial SGA Conference, Quebec City, QC, Canada, 20–23 August 2017. [Google Scholar]
- Chew, D.M.; Spikings, R.A. Geochronology and Thermochronology using apatite: Time and temperature, lower crust to surface. Elements 2015, 11, 189–194. [Google Scholar] [CrossRef]
- Chen, B.; Wang, J.; Kong, L.; Mai, X.; Zheng, N.; Zhong, Q.; Liang, J.; Chen, D. Adsorption of uranium from uranium mine contaminated water using phosphate rock apatite using (PRA): Isotherm, kinetic and characterization studies. Colloids Surf. A Physiochem. Eng. Asp. 2017, 520, 612–621. [Google Scholar] [CrossRef]
- Luo, Y.; Hughes, J.M.; Rakovan, J.; Pan, Y. Site preference of U and Th in Cl, F, and Sr apatites. Am. Mineral. 2009, 94, 345–351. [Google Scholar] [CrossRef]
- Macmillan, E.; Cook, N.J.; Ehrig, K.; Ciobanu, C.L.; Pring, A. Uraninite from the Olympic Dam IOCG-U-Ag deposit: Linking textural and compositional variation to temporal evolution. Am. Mineral. 2016, 101, 1295–1320. [Google Scholar] [CrossRef]
- Macmillan, E.; Cook, N.J.; Ehrig, K.; Pring, A. Chemical and textural interpretation of late stage coffinite and brannerite from the Olympic Dam IOCG-Ag-U deposit. Mineral. Mag. 2017, in press. [Google Scholar] [CrossRef]
Figure 1.
Geological sketch map of the Olympic Dam deposit at Relative level −350 m showing the location of the sampled drillholes/studied samples (modified from [19]). The insert map shows the location of Olympic Dam with respect to the Gawler Craton and South Australia.
Figure 1.
Geological sketch map of the Olympic Dam deposit at Relative level −350 m showing the location of the sampled drillholes/studied samples (modified from [19]). The insert map shows the location of Olympic Dam with respect to the Gawler Craton and South Australia.
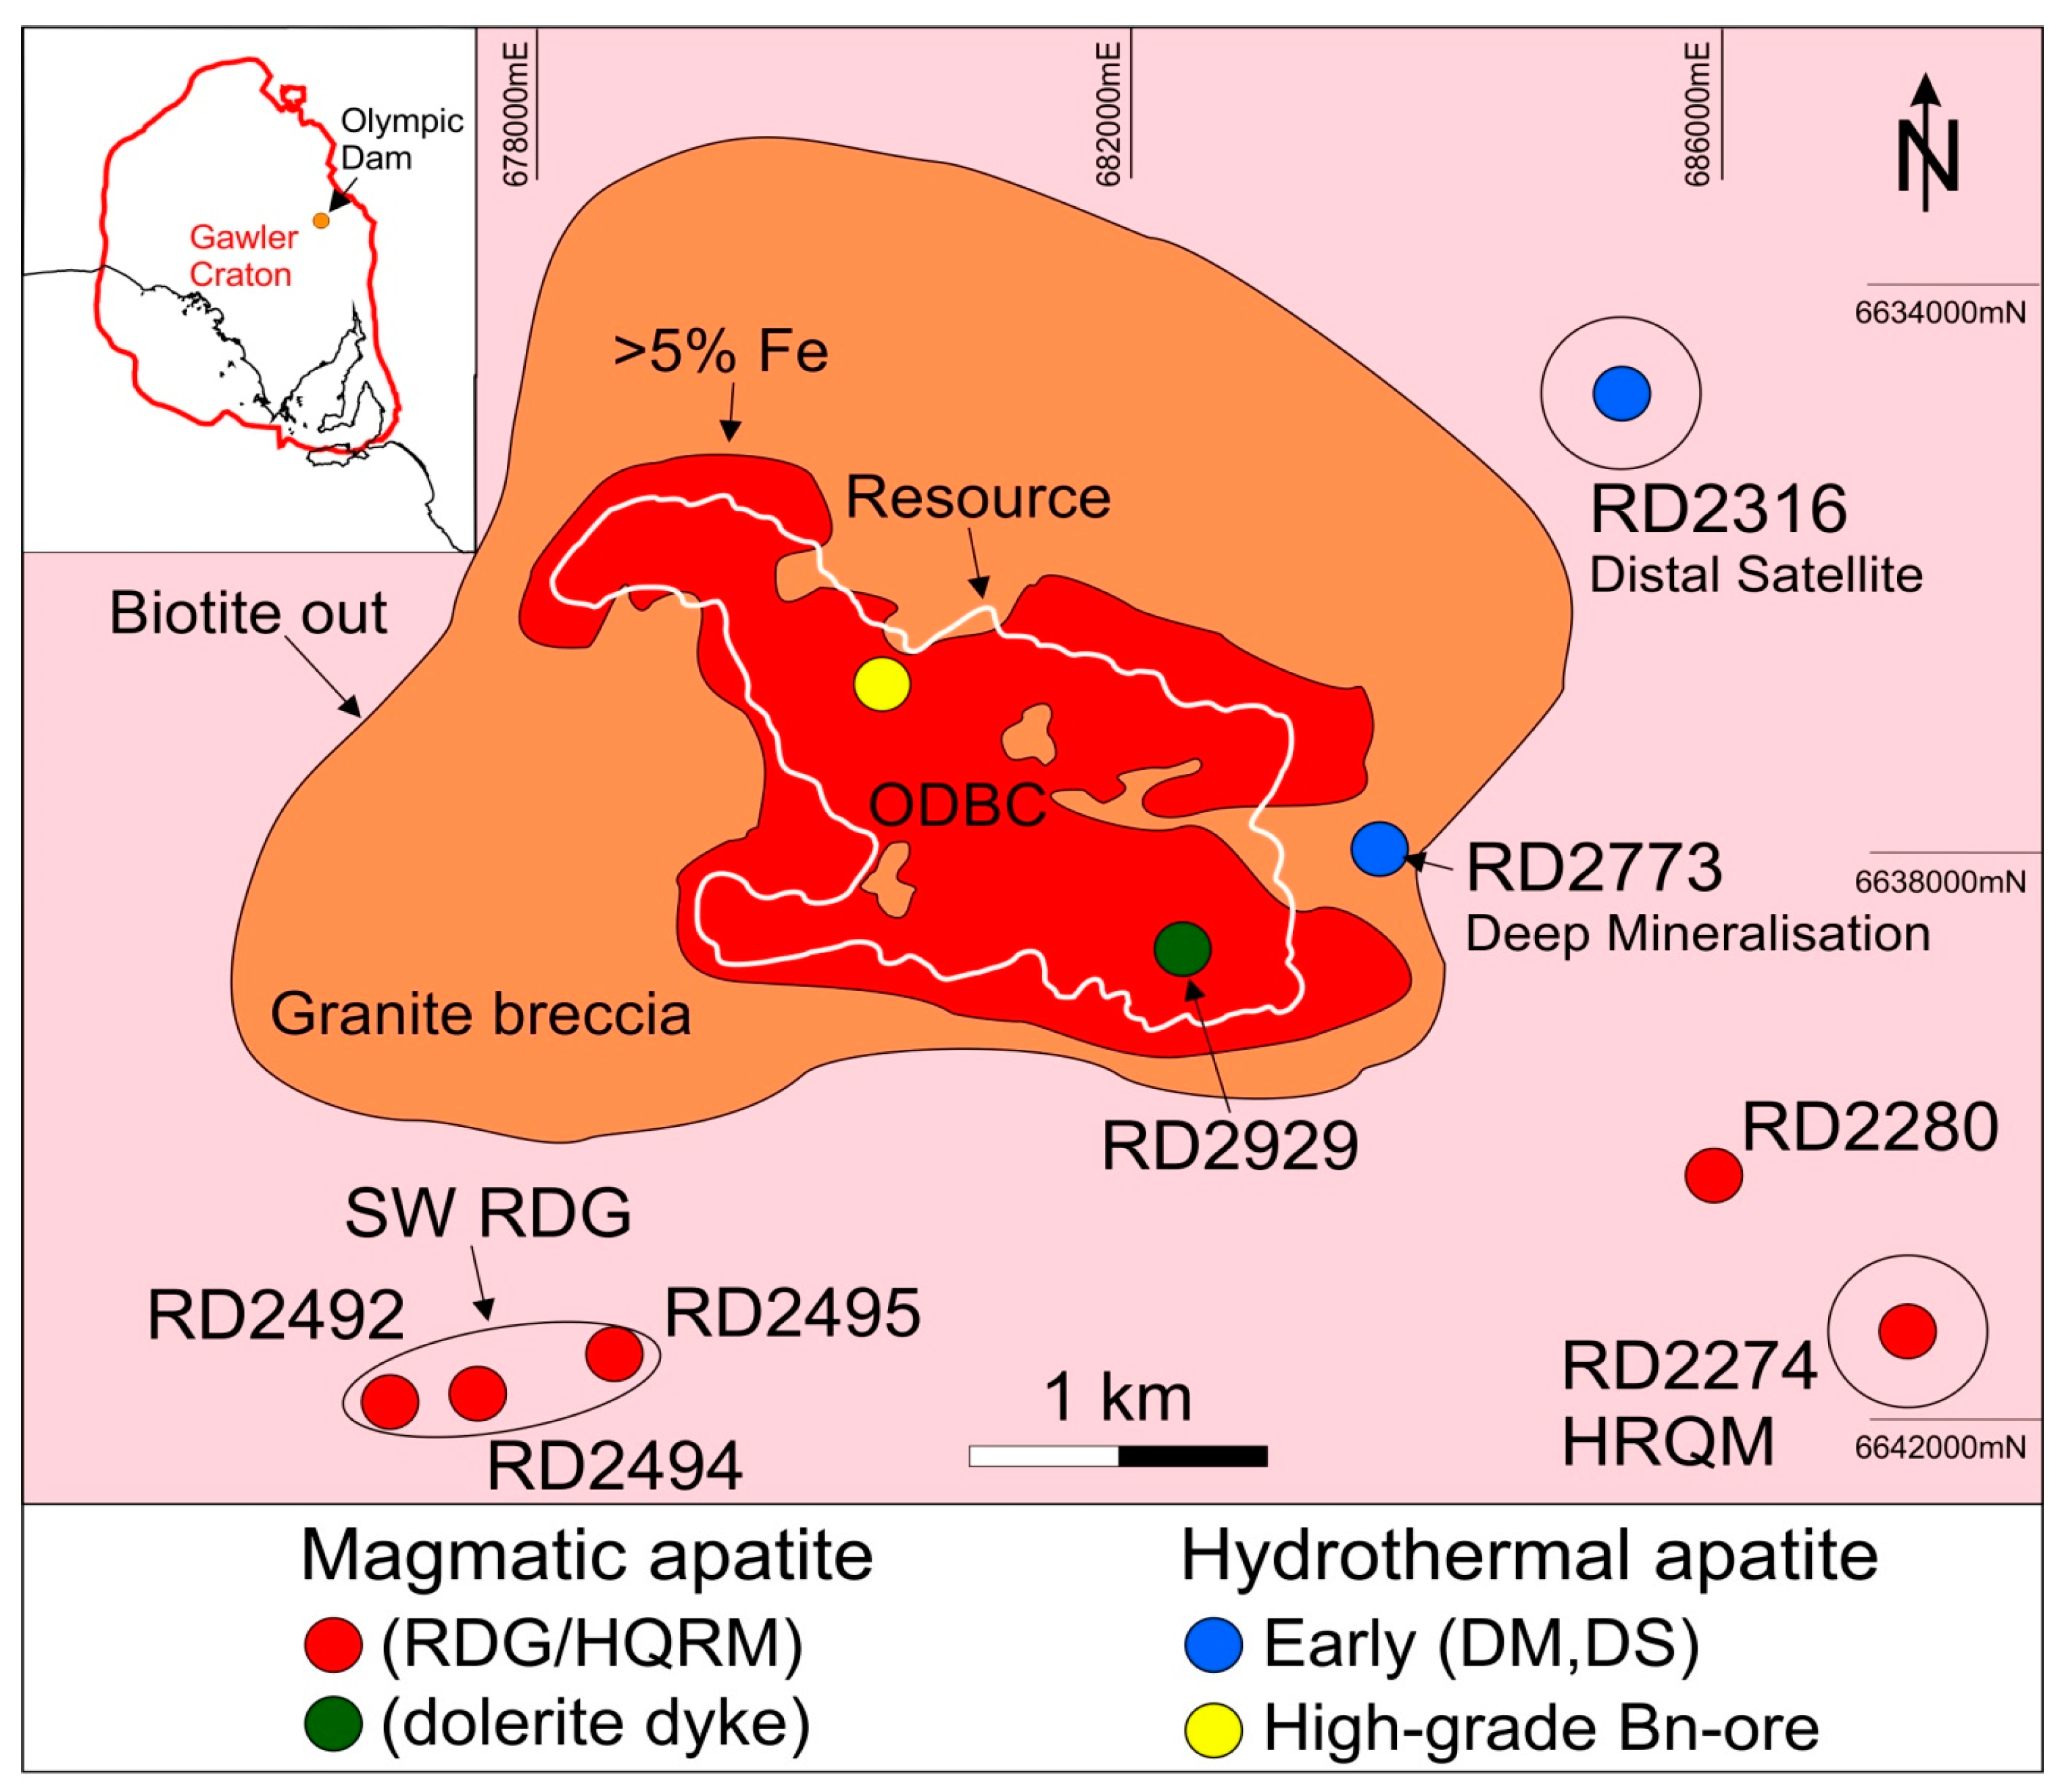
Figure 2.
Back-scatter electron (BSE) images showing the textural and morphological character of apatite hosted in igneous rocks. (a) Magmatic apatite with numerous minute inclusions of a Fe-sulphide mineral; (b) Apatite grain displaying a rare earth element and Y (REY)-enriched rim and a magmatic core hosted within albite adjacent to biotite now replaced by chlorite; (c) Apatite grain showing a inclusion-rich magmatic core, REY-rich rim and zones of REY-depletion on the margin of the grain affecting both the magmatic core and REY-rich rim; (d) Magmatic apatite within pervasively altered Roxby Downs granite (RDG) displaying broad zones of REY-depletion that contain numerous inclusions of sericite and monazite; (e) Apatite associated with the hematite-sericite alteration of the RDG with numerous inclusions of sericite and florencite; (f) Unzoned apatite with a REY-depleted zone containing small grains of monazite (hematite-sericite altered dolerite dyke (DD)). Abbreviations: Ab-albite, Ap-apatite, Chl-chlorite, Flo-florencite, Hm-hematite, Kfs-K-feldspar, Mnz-monazite, Qz-quartz, Sd-siderite, Ser-sericite.

Figure 3.
Chondrite-normalized [44] laser ablation inductively coupled plasma mass spectrometry (LA-ICP-MS) plots of apatite hosted in the igneous rock studied. Analyses were performed on multiple grains hosted within samples listed in captions for the respective tables. (a) Magmatic cores in RDG and HQRM apatite. (b) Hydrothermally altered zones in magmatic RDG hosted apatite. (c) Dolerite dyke magmatic apatite. (d) Hydrothermally altered zones in dolerite dyke magmatic apatite.

Figure 4.
Back-scatter electron (BSE) images showing the textural and morphological character of early hydrothermal apatite from the magnetite-dominant mineralization (DM). (a) REY, Cl and S-rich zone (bright) adjacent to zones depleted in these elements (dark) related to fractures and associated with crystallization of monazite; (b) Extensive REY, Cl and S depletion in apatite associated with fracturing and the formation of monazite with late chalcopyrite infill. Abbreviations: Ap: apatite; Cp: chalcopyrite; Mnz: monazite.

Figure 5.
Chondrite-normalized [44] LA-ICP-MS plots of hydrothermal apatite. Analyses were performed on multiple grains hosted within samples listed in the captions to the respective tables. (a) Hydrothermal apatite hosted in the Deep and Distal Satellite Mineralization. (b) Altered zones in Deep Mineralization hosted apatite related. (c) Apatite hosted within the high-grade bornite ore.

Figure 6.
Reflected light microscopy map (a) and BSE images (b,c) showing aspects of apatite and associated minerals in the high-grade bornite ore. Inset in (a) shows zircon surrounded by xenotime. (b) Apatite at the boundary between bornite and a hematite-richer domain; most of the coarse hematite is early. Note inclusions of acicular grains/aggregates of oscillatory-zoned hematite (ii) within the apatite and brecciated zircon surrounded by xenotime. (c) Detail of zoned hematite within apatite from (a). (d) Apatite with milled fragments of hematite and bornite. Abbreviations: Ap: apatite; Bn: bornite; Hm: hematite; Xen: xenotime; Zrc: zircon.
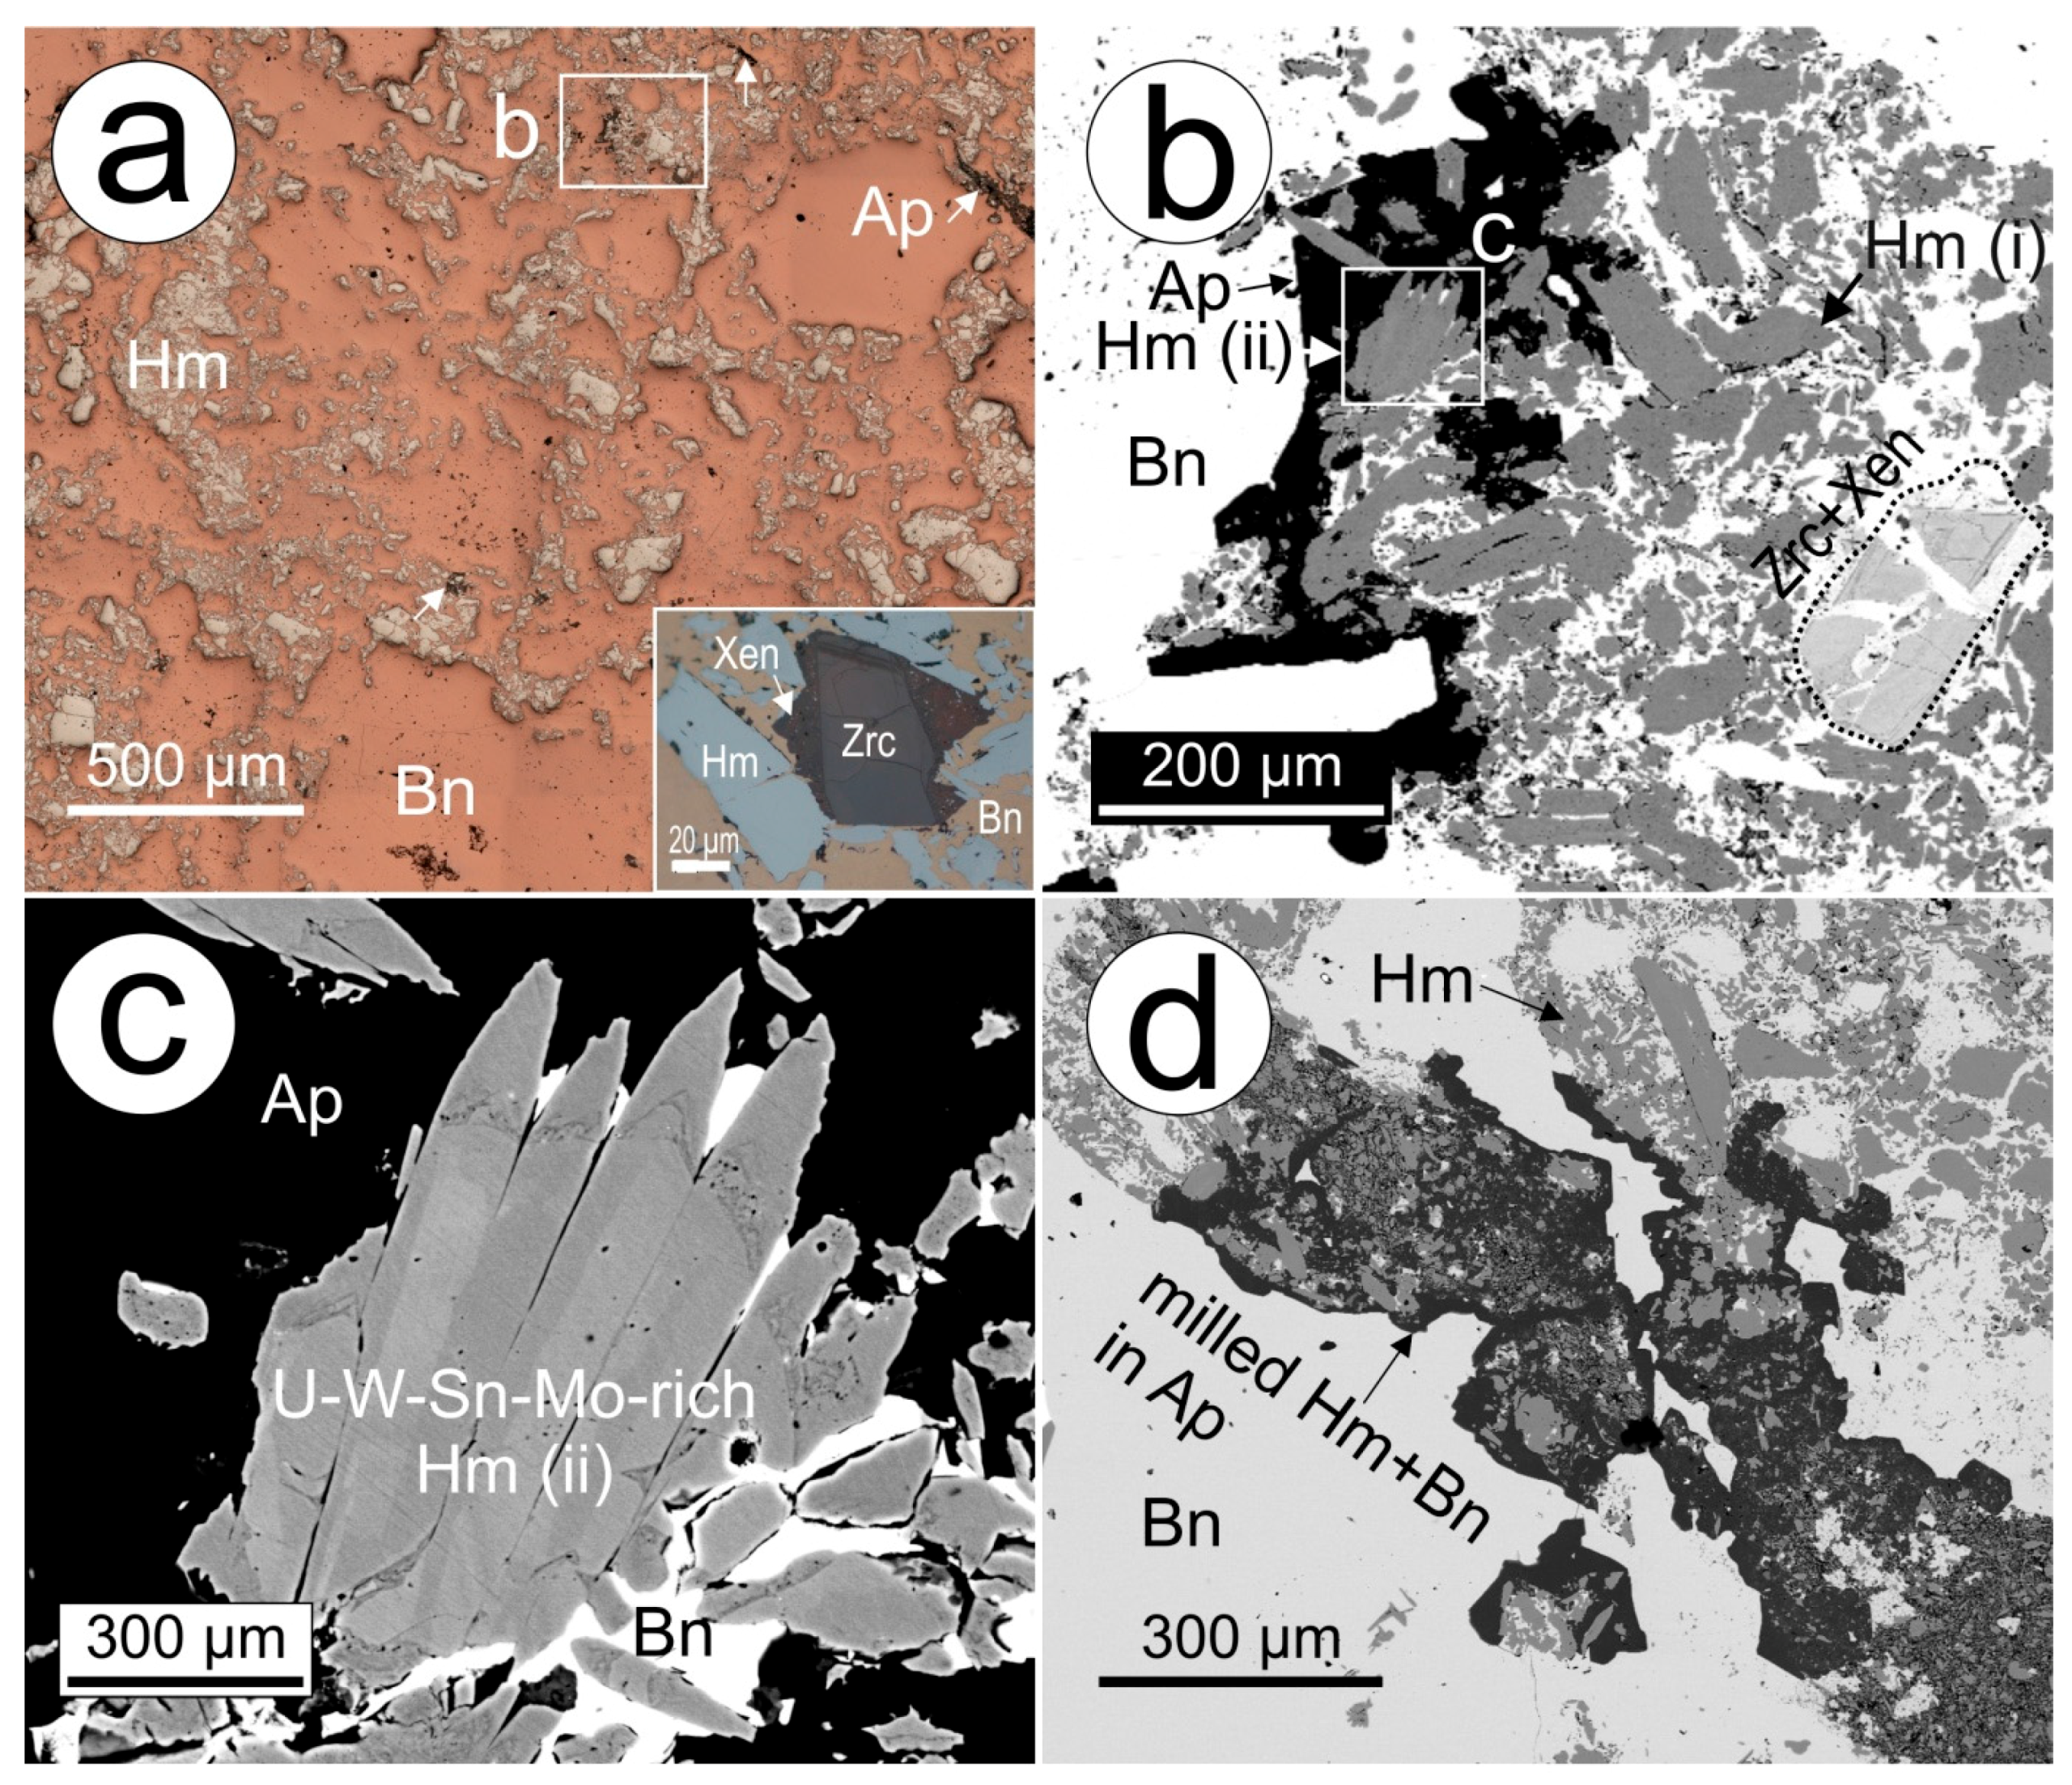
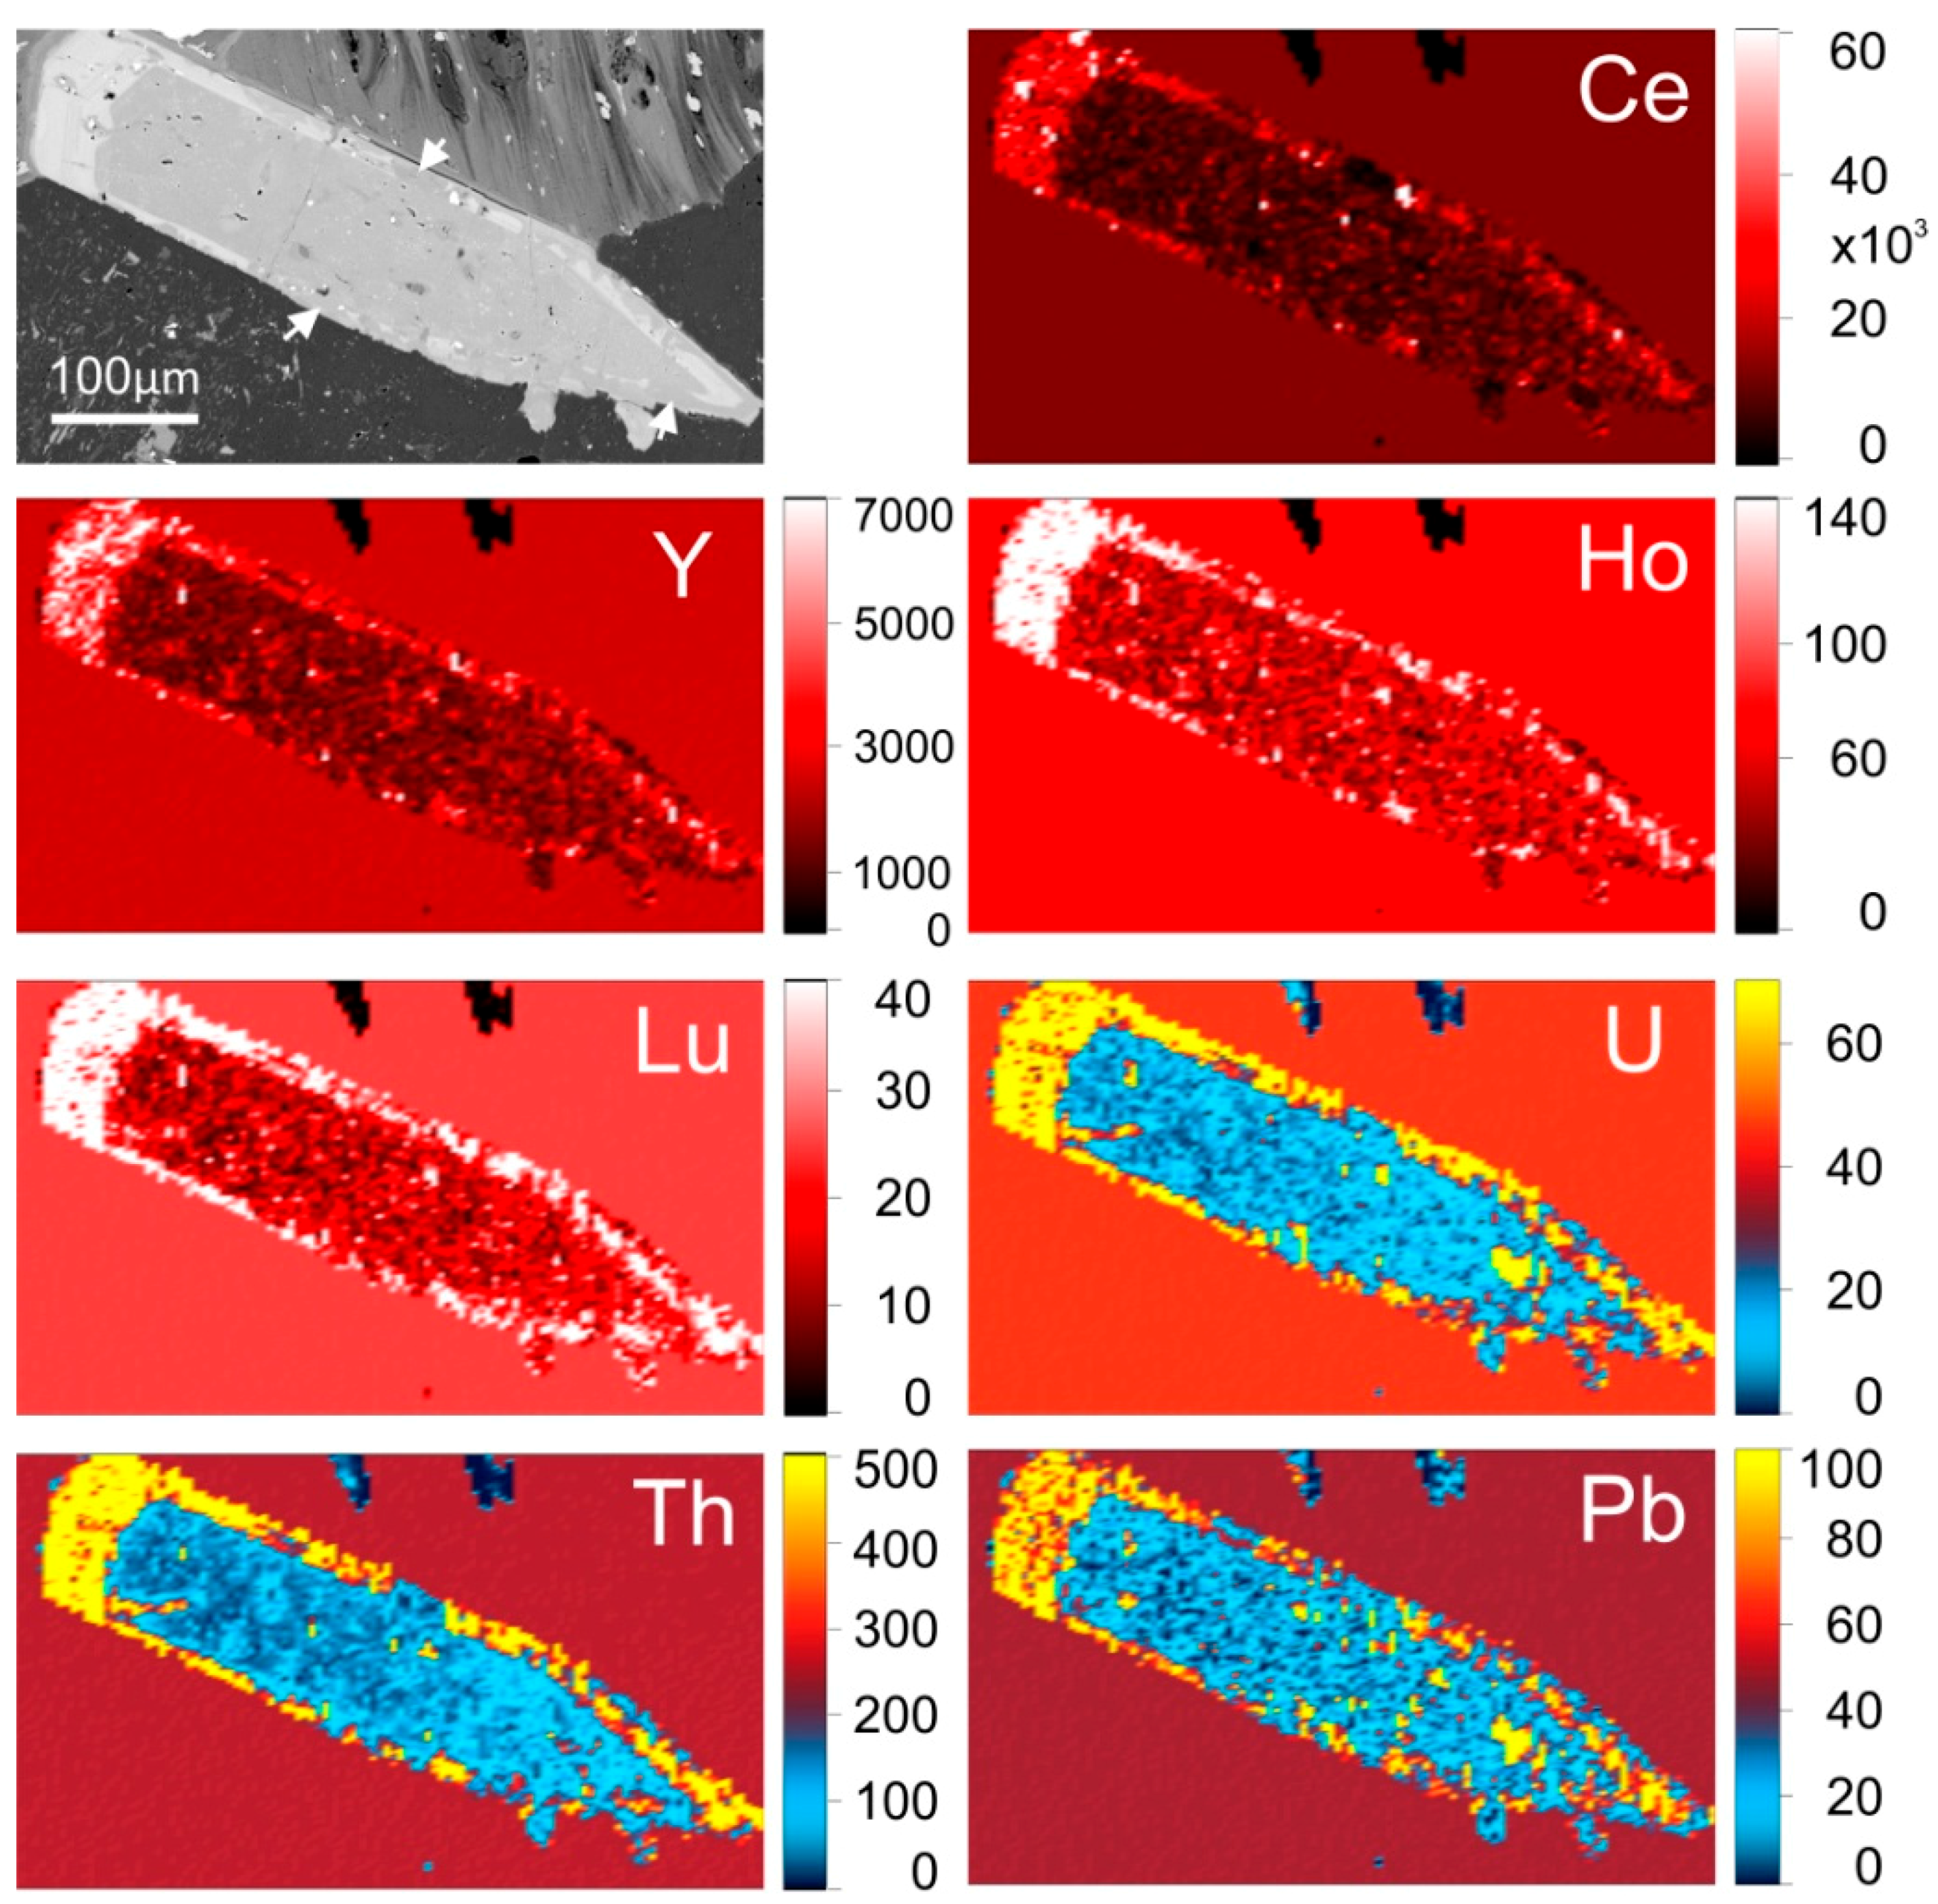
Figure 7.
LA-ICP-MS map of a partially altered magmatic apatite grain hosted in hematite-sericite altered RDG (sample 2280-3, Figure 1, Table 1) showing a magmatic, inclusion-rich core and a REY- and U–Th–Pb-enriched rim, both of which have been affected by REY-depletion along fractures and the grain rim marked by the white arrows on the SEM image. All scales are in ppm.

Figure 8.
LA-ICP-MS map of a large aggregate of apatite grains (sample 2773-3, Figure 1, Table 1) displaying core-to-rim- and fracture-related zoning consisting of cores rich in REY and REY-depleted rims and fractures. Note relative enrichment of As along grain rims and attributed to crystallization from more oxidized fluids that the core. All scales are in ppm.
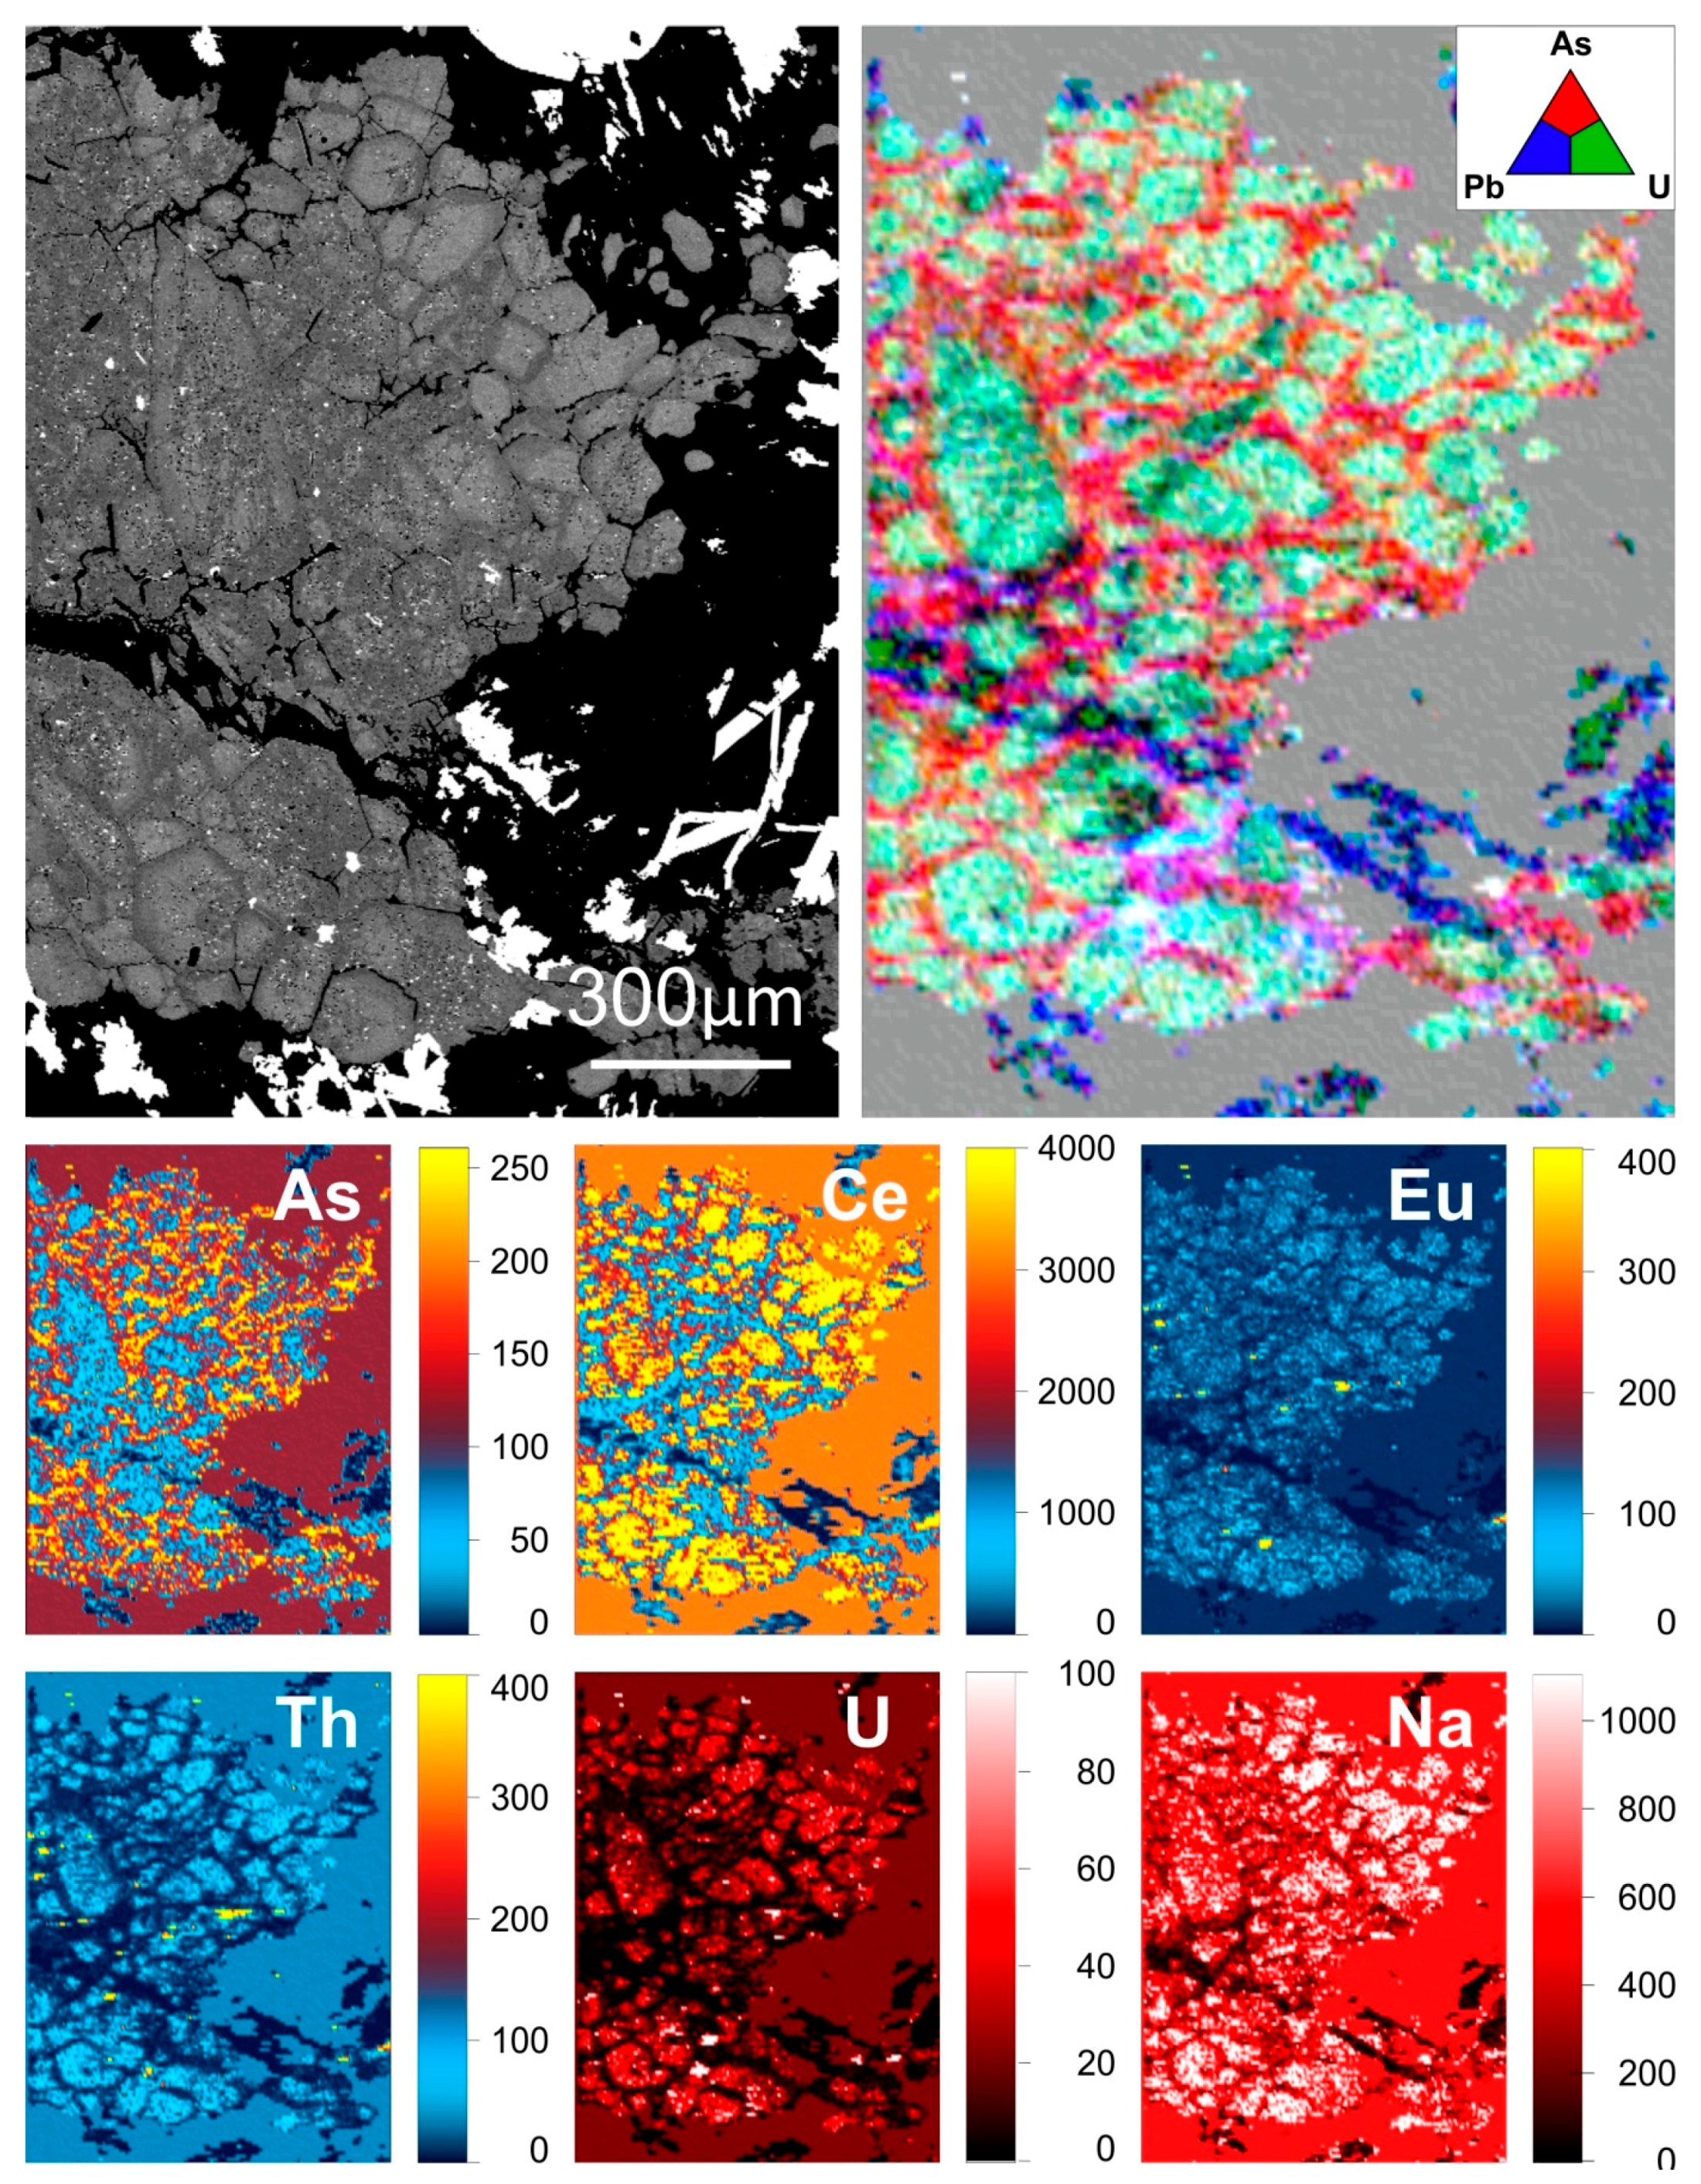
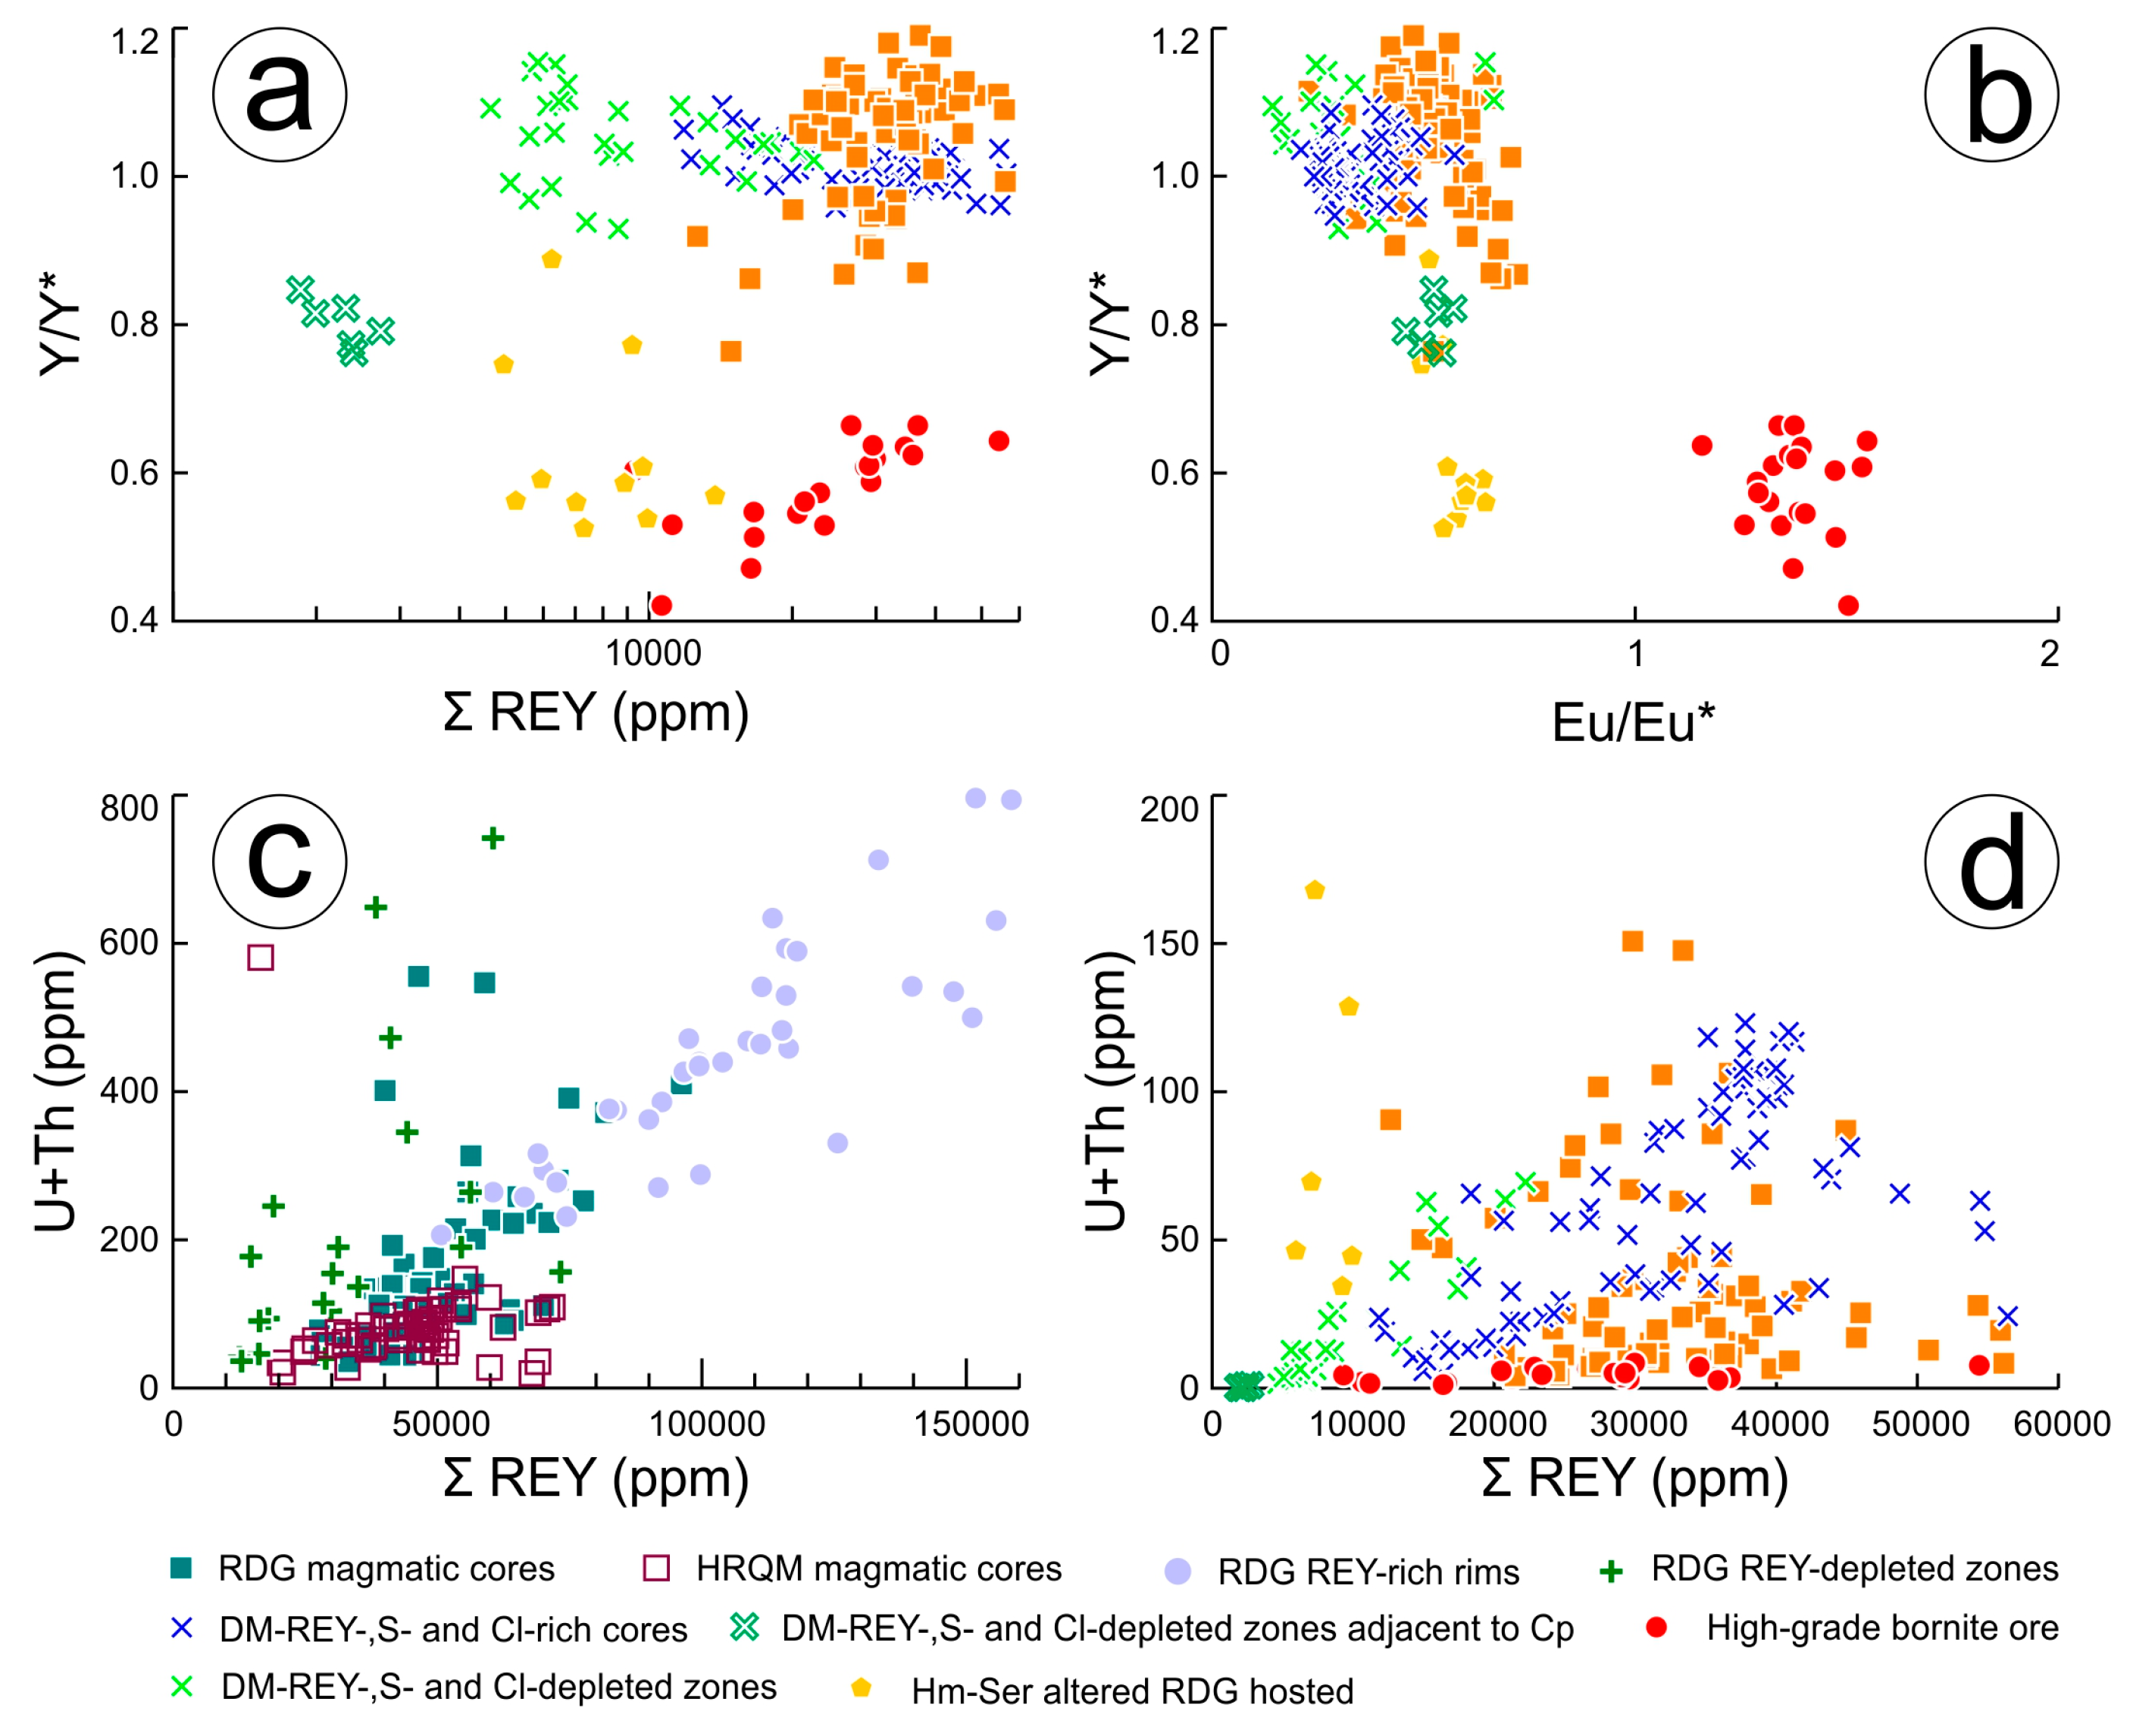
Figure 9.
LA-ICP-MS plots of magmatic and hydrothermal apatite: (a) ΣREY (ppm) vs. (Y/Y* = YCN/[(DyCN + HoCN)/2]); (b) (Eu/Eu* = EuCN/[(SmCN + GdCN)/2]) vs. (Y/Y* = YCN/[(DyCN + HoCN)/2]); (a,b) The evolution from early magnetite associated to later hematite-sericite and ore-related apatite is emphasized by changes is ΣREY as well as Eu and Y anomalies; (c) ΣREY (ppm) vs. (U + Th) (ppm); (d) ΣREY (ppm) vs. (U + Th) (ppm). (c,d) U and Th concentrations are strongly tied to that of ΣREY, particularly in magmatic apatite and hydrothermal zones therein.

Figure 10.
LA-ICP-MS plots of magmatic and hydrothermal apatite: (a) log(206Pb + 208Pb ppm) vs. (U + Th) (ppm); (b) log(206Pb + 208Pb ppm) vs. log(U + Th ppm); (a,b) U and Th concentrations exhibit a strong linear relationship with their lead daughter isotopes; (c) Sr (ppm) vs. (U + Th) (ppm); (d) La/Nd (ppm) vs. log(U + Th) (ppm).

Table 1.
Overview of lithologies and samples discussed in this study.
| Drill Hole No. | Depth (m) | Sample ID | Sample Category/Rock Type | Hydrothermal REY, Th and U Bearing Minerals | ||||||||
|---|---|---|---|---|---|---|---|---|---|---|---|---|
| Apatite | Monazite | Thorite | Florencite | Xenotime | Bastnäsite | Uraninite | Coffinite | Brannerite | ||||
| Underground grab sample | - | OD10.1 | High grade Cu–Au ore—The samples consist of massive bornite with abundant hematite inclusions. Apatite occurs as grains and/or aggregates within bornite and also as milled fragments along veinlets in bornite. No sericite is present but minor chlorite and occasional barite. Other accessories are zircon (metamict) with halos of xenotime, abundant, fine-grained (few µm) florencite as rims along other mineral boundaries, coffinite and brannerite. Trace minerals include U-, REY-bearing phases as dusty inclusions within altered hematite and molybdenite in bornite. | x | x | x | x | x | x | |||
| - | OD10.2 | x | x | x | x | x | x | |||||
| - | OD10.3 | x | x | x | x | x | x | |||||
| RD2274 | 372.5 | 2274-1 | Horn Ridge quartz monzonite—Equigranular, medium-grained, K-feldspar-quartz-plagioclase Quartz Monzonite. Slightly altered by hematite-sericite-chlorite altered. Abundant biotite and hornblende has been altered to chlorite. Some primary ilmenite remains. Abundant apatite in association with accessory magnetite, ilmenite, and zircon. | x | x | |||||||
| RD2929 | 401.3 | RX7913 | Dolerite dyke—intensely hematite-sericite-chlorite-carbonate altered dolerite. The majority of primary silicates are replaced by secondary minerals but accessory apatite and Fe-Ti-oxides (hemoilmenite) are largely preserved. | x | x | |||||||
| 411.1 | RX7914 | x | x | |||||||||
| RD2494 | 588.2 | RX7860 | Roxby Downs granite—Equigranular, medium to coarse grained K-feldspar-quartz-plagioclase granite. Fresh to pervasively hematite-sericite-chlorite altered. Some samples contain spherical mafic enclaves. Fresh samples are characterized by the presence of biotite, edenite and ilmenite. Locally abundant primary igneous apatite in association with other accessories such as magnetite, ilmenite and zircon. | x | x | |||||||
| RD2492 | 756 | RX7864 | x | x | ||||||||
| RD2495 | 584 | RX7866 | x | x | ||||||||
| RD2280 | 413 | 2280-1 | x | x | ||||||||
| 416.5 | -2 | x | x | |||||||||
| 416.9 | -3 | x | x | |||||||||
| 440 | -4 | x | x | |||||||||
| 466 | -5 | x | x | |||||||||
| 467.5 | -6 | x | x | x | x | |||||||
| 475.7 | -7 | x | x | |||||||||
| RD2773 | 2208 | 2773-1 | Deep Mineralization—magnetite-chlorite-carbonate to hematite- sericite altered Roxby Downs Granite and Felsic Unit. Apatite occurs in a number of morphologies ranging from small, unzoned to large, zoned and fractured grains, in isolation as well as large aggregates. | x | x | |||||||
| 2261 | -2 | x | x | x | ||||||||
| 2289 | -3 | x | x | x | x | |||||||
| 2309 | -4 | x | x | |||||||||
| 1998 | -5 | x | x | x | ||||||||
| RD2316 | 580.2 | RX6685 | Distal Satellite Mineralization—magnetite-chlorite-sericite (minor) altered Roxby Downs Granite. Red-stained K-feldspar present, no plagioclase is present. Apatite occurs in a wide range of sizes. Larger grains are commonly zoned and occur in aggregates in close association to magnetite. Feldspars replaced by chlorite and by an unusual assemblage of molybdenite-bastnäsite. | x | x | x | ||||||
| 588.2 | RX6687 | x | x | x | x | |||||||
| 645.3 | RX6691 | x | x | x | ||||||||
Table 2.
Rare earth element (REE) and trace element concentrations in apatite from the Roxby Downs granite (ppm). Apatite analyses were performed on multiple grains in the following samples: RDG magmatic cores—2280-2, -3, -4, -5, -6, RX7860, RX7864, RX7866; REY-rich rims—2280-2, -3, -5; REY-depleted zones—2280-2, -3, -4, -5; Hm-Ser altered RDG hosted—2280-6. <mdl—below minimum detection limit.
| RDG Magmatic Cores | Na | Mg | Al | Si | S | K | Sc | Ti | V | Mn | Fe | Co | Ni | Cu | Zn | As | Rb | Sr | Zr | Nb | Mo | Sn | Cs |
| Mean n = (74) | 729 | 242 | 997 | 4865 | 252 | 454 | 1.86 | 63.6 | 20.3 | 400 | 3150 | 2.56 | <mdl | <mdl | 11.3 | 21.0 | 2.41 | 82.1 | 18.9 | 0.29 | <mdl | <mdl | <mdl |
| S.D. | 284 | 335 | 1813 | 3631 | 34.4 | 679 | 2.15 | 57.5 | 15.4 | 127 | 2981 | 3.15 | <mdl | <mdl | 16.5 | 11.0 | 1.94 | 20.7 | 35.4 | 0.39 | <mdl | <mdl | <mdl |
| Min | 176 | 15.6 | 0.97 | 1659 | 186 | 7.78 | 0.30 | 24.3 | 1.13 | 75.3 | 144 | 0.09 | <mdl | <mdl | 0.53 | 4.13 | 0.56 | 55.4 | 0.22 | 0.03 | <mdl | <mdl | <mdl |
| Max | 1356 | 1804 | 9474 | 14,497 | 361 | 2982 | 10.3 | 457 | 74.3 | 872 | 10,810 | 10.8 | <mdl | <mdl | 75.7 | 52.8 | 8.83 | 184 | 181 | 1.82 | <mdl | <mdl | <mdl |
| Ba | Ta | W | 204Pb | 206Pb | 208Pb | Th | U | La | Ce | Pr | Nd | Sm | Eu | Gd | Tb | Dy | Y | Ho | Er | Tm | Yb | Lu | ΣREY |
| 7.30 | <mdl | <mdl | <mdl | 9.21 | 37.5 | 120 | 23.8 | 3311 | 6968 | 707 | 2304 | 347 | 23.7 | 297 | 38.5 | 227 | 1463 | 47.9 | 139 | 18.8 | 123 | 18.9 | 16,035 |
| 14.1 | <mdl | <mdl | <mdl | 5.38 | 24.4 | 90.0 | 48.4 | 1020 | 2064 | 194 | 694 | 143 | 9.49 | 125 | 16.7 | 95.9 | 523 | 18.6 | 49.6 | 6.55 | 43.6 | 6.89 | 4409 |
| 0.24 | <mdl | <mdl | <mdl | 2.86 | 12.6 | 29.3 | 5.21 | 1256 | 3362 | 410 | 1254 | 164 | 11.8 | 134 | 17.6 | 99.7 | 738 | 21.4 | 69.5 | 8.74 | 62.9 | 9.85 | 8728 |
| 71.7 | <mdl | <mdl | <mdl | 21.6 | 116 | 528 | 385 | 6028 | 13,912 | 1374 | 4832 | 820 | 68.0 | 700 | 88.5 | 492 | 3033 | 101 | 276 | 40.8 | 256 | 43.2 | 31,774 |
| REY-Rich Rims | Na | Mg | Al | Si | S | K | Sc | Ti | V | Mn | Fe | Co | Ni | Cu | Zn | As | Rb | Sr | Zr | Nb | Mo | Sn | Cs |
| Mean n = (36) | 562 | 239 | 891 | 6558 | 240 | 137 | 2.32 | 55.0 | 4.90 | 483 | 2419 | 2.03 | 1.70 | <mdl | 7.07 | 38.2 | 1.69 | 71.0 | 11.6 | 0.35 | <mdl | <mdl | <mdl |
| S.D. | 164 | 438 | 1717 | 2187 | 25.7 | 171 | 3.84 | 33.8 | 4.98 | 96.1 | 2681 | 2.49 | 1.70 | <mdl | 11.4 | 10.4 | 1.39 | 16.5 | 30.0 | 0.57 | <mdl | <mdl | <mdl |
| Min | 215 | 24.4 | 2.36 | 3419 | 205 | 5.58 | 0.48 | 23.1 | 1.16 | 336 | 268 | 0.08 | 0.37 | <mdl | 0.49 | 15.9 | 0.65 | 41.2 | 0.61 | 0.04 | <mdl | <mdl | <mdl |
| Max | 974 | 1766 | 7000 | 14,134 | 296 | 566 | 18.7 | 188 | 25.0 | 760 | 9704 | 9.18 | 7.40 | <mdl | 47.9 | 57.5 | 6.76 | 116 | 174 | 2.19 | <mdl | <mdl | <mdl |
| Ba | Ta | W | 204Pb | 206Pb | 208Pb | Th | U | La | Ce | Pr | Nd | Sm | Eu | Gd | Tb | Dy | Y | Ho | Er | Tm | Yb | Lu | ΣREY |
| <mdl | <mdl | 0.24 | <mdl | 32.1 | 118 | 388 | 62.2 | 5567 | 15,739 | 1438 | 5106 | 873 | 49.5 | 783 | 106 | 621 | 3887 | 133 | 372 | 51.7 | 347 | 57.0 | 35,129 |
| <mdl | <mdl | 0.18 | <mdl | 15.3 | 42.3 | 134 | 30.4 | 1873 | 6535 | 372 | 1339 | 303 | 11.8 | 321 | 44.1 | 264 | 1508 | 55.8 | 142 | 21.8 | 166 | 36.4 | 10,309 |
| <mdl | <mdl | 0.04 | <mdl | 14.5 | 49.7 | 159 | 27.1 | 2132 | 5749 | 770 | 2904 | 399 | 27.6 | 364 | 47.8 | 288 | 1965 | 64.7 | 187 | 26.2 | 174 | 26.9 | 15,877 |
| <mdl | <mdl | 0.65 | <mdl | 66.7 | 235 | 713 | 136 | 9122 | 30,376 | 2145 | 7603 | 1395 | 70.8 | 1449 | 192 | 1187 | 7130 | 258 | 681 | 102 | 775 | 148 | 56,494 |
| REY Depleted Zones | Na | Mg | Al | Si | S | K | Sc | Ti | V | Mn | Fe | Co | Ni | Cu | Zn | As | Rb | Sr | Zr | Nb | Mo | Sn | Cs |
| Mean n = (20) | 572 | 541 | 2872 | 8011 | 305 | 665 | 6.15 | 111 | 20.9 | 241 | 4820 | 2.17 | <mdl | <mdl | 17.8 | 29.7 | 2.36 | 122 | 30.7 | 0.58 | <mdl | <mdl | <mdl |
| S.D. | 344 | 741 | 3288 | 5169 | 150 | 1076 | 5.69 | 100.0 | 22.4 | 156 | 3426 | 2.43 | <mdl | <mdl | 18.9 | 16.0 | 1.49 | 48.9 | 41.9 | 0.42 | <mdl | <mdl | <mdl |
| Min | 199 | 18.9 | 2.37 | 1897 | 204 | 37.5 | 0.66 | 36.1 | 0.61 | 65.5 | 495 | 0.10 | <mdl | <mdl | 0.96 | 6.18 | 0.57 | 65.1 | 1.53 | 0.08 | <mdl | <mdl | <mdl |
| Max | 1591 | 1611 | 9915 | 14,085 | 895 | 4085 | 19.5 | 446 | 70.5 | 525 | 10,805 | 7.90 | <mdl | <mdl | 56.0 | 58.4 | 4.70 | 199 | 123 | 1.25 | <mdl | <mdl | <mdl |
| Ba | Ta | W | 204Pb | 206Pb | 208Pb | Th | U | La | Ce | Pr | Nd | Sm | Eu | Gd | Tb | Dy | Y | Ho | Er | Tm | Yb | Lu | ΣREY |
| 13.0 | <mdl | <mdl | <mdl | 8.96 | 34.5 | 194 | 20.4 | 1679 | 3942 | 462 | 1841 | 386 | 49.2 | 341 | 37.3 | 184 | 1037 | 36.0 | 97.5 | 13.5 | 89.5 | 14.6 | 10,210 |
| 16.5 | <mdl | <mdl | <mdl | 5.09 | 20.1 | 195 | 14.6 | 1149 | 2447 | 257 | 986 | 247 | 33.7 | 175 | 19.0 | 112 | 677 | 24.1 | 70.1 | 9.96 | 64.6 | 10.6 | 5509 |
| 1.03 | <mdl | <mdl | <mdl | 2.18 | 7.90 | 30.0 | 5.56 | 394 | 1181 | 161 | 657 | 153 | 11.7 | 144 | 19.3 | 84.9 | 337 | 11.6 | 29.9 | 3.25 | 20.2 | 1.62 | 3738 |
| 57.7 | <mdl | <mdl | <mdl | 19.2 | 89.9 | 727 | 57.7 | 4452 | 8782 | 963 | 3749 | 1130 | 156 | 779 | 103 | 578 | 3341 | 119 | 343 | 47.4 | 305 | 41.9 | 22,275 |
| Hm-Ser Altered RDG Hosted | Na | Mg | Al | Si | S | K | Sc | Ti | V | Mn | Fe | Co | Ni | Cu | Zn | As | Rb | Sr | Zr | Nb | Mo | Sn | Cs |
| Mean n = (9) | 777 | 291 | 2082 | 6261 | 291 | 1442 | 3.17 | 118 | 9.55 | 78.9 | 5796 | 0.43 | <mdl | <mdl | 10.3 | 11.1 | 6.73 | 136 | 24.9 | 0.43 | <mdl | 0.85 | <mdl |
| S.D. | 550 | 477 | 1372 | 2340 | 77.4 | 706 | 2.50 | 104 | 10.1 | 54.7 | 5242 | 0.42 | <mdl | <mdl | 9.15 | 6.57 | 2.00 | 34.6 | 29.6 | 0.40 | <mdl | 0.47 | <mdl |
| Min | 151 | 12.2 | 536 | 3827 | 230 | 627 | 0.77 | 44.0 | 0.64 | 38.0 | 1023 | 0.11 | <mdl | <mdl | 2.47 | 4.78 | 5.39 | 79.6 | 0.72 | 0.06 | <mdl | 0.45 | <mdl |
| Max | 1511 | 1529 | 4491 | 9454 | 494 | 2600 | 8.31 | 401 | 31.5 | 199 | 13,372 | 1.09 | <mdl | <mdl | 28.6 | 25.0 | 9.03 | 189 | 92.7 | 1.39 | <mdl | 1.93 | <mdl |
| Ba | Ta | W | 204Pb | 206Pb | 208Pb | Th | U | La | Ce | Pr | Nd | Sm | Eu | Gd | Tb | Dy | Y | Ho | Er | Tm | Yb | Lu | ΣREY |
| 29.7 | <mdl | <mdl | <mdl | 29.7 | 7.84 | 50.0 | 168 | 84.5 | 258 | 47.0 | 280 | 195 | 44.6 | 290 | 32.0 | 125 | 399 | 16.3 | 32.8 | 3.62 | 24.1 | 2.70 | 1835 |
| 30.2 | <mdl | <mdl | <mdl | 27.6 | 4.81 | 34.2 | 164 | 50.9 | 89.0 | 11.4 | 82.6 | 122 | 26.9 | 160 | 12.6 | 42.0 | 162 | 6.02 | 15.4 | 2.08 | 15.8 | 2.24 | 431 |
| 2.76 | <mdl | <mdl | <mdl | 3.34 | 3.23 | 10.8 | 13.2 | 41.7 | 127 | 23.6 | 164 | 98.1 | 17.1 | 110 | 13.1 | 49.7 | 187 | 6.50 | 14.6 | 1.37 | 9.91 | 0.83 | 1261 |
| 95.6 | <mdl | <mdl | <mdl | 75.3 | 17.7 | 129 | 446 | 204 | 403 | 60.4 | 412 | 489 | 109 | 632 | 54.6 | 213 | 655 | 28.0 | 60.9 | 7.18 | 54.0 | 6.66 | 2698 |
Table 3.
REE and trace element concentrations in apatite from the Horn Ridge quartz monzonite (ppm). Apatite analyses were performed on multiple apatite grains in sample 2274-1. <mdl—below minimum detection limit.
Table 3.
REE and trace element concentrations in apatite from the Horn Ridge quartz monzonite (ppm). Apatite analyses were performed on multiple apatite grains in sample 2274-1. <mdl—below minimum detection limit.
| HRQM Magmatic Cores | Na | Mg | Al | Si | S | K | Sc | Ti | V | Mn | Fe | Co | Ni | Cu | Zn | As | Rb | Sr | Zr | Nb | Mo | Sn | Cs |
|---|---|---|---|---|---|---|---|---|---|---|---|---|---|---|---|---|---|---|---|---|---|---|---|
| Mean n = (55) | 1122 | 174 | 348 | 2636 | 253 | 172 | <mdl | 205 | 16.0 | 530 | 1527 | 1.20 | <mdl | <mdl | <mdl | 26.0 | 1.79 | 157 | 0.94 | <mdl | <mdl | <mdl | <mdl |
| S.D. | 372 | 140 | 401 | 794 | 19.0 | 235 | <mdl | 608 | 6.58 | 161 | 1307 | 1.35 | <mdl | <mdl | <mdl | 9.10 | 1.84 | 23.6 | 0.58 | <mdl | <mdl | <mdl | <mdl |
| Min | 343 | 33.3 | 3.44 | 1313 | 211 | 4.97 | <mdl | 17.6 | 2.12 | 283 | 256 | 0.12 | <mdl | <mdl | <mdl | 15.4 | 0.19 | 110 | 0.24 | <mdl | <mdl | <mdl | <mdl |
| Max | 1753 | 649 | 1454 | 4731 | 299 | 874 | <mdl | 2830 | 29.0 | 955 | 4956 | 5.30 | <mdl | <mdl | <mdl | 52.0 | 8.29 | 237 | 2.62 | <mdl | <mdl | <mdl | <mdl |
| Ba | Ta | W | 204Pb | 206Pb | 208Pb | Th | U | La | Ce | Pr | Nd | Sm | Eu | Gd | Tb | Dy | Y | Ho | Er | Tm | Yb | Lu | ΣREY |
| 1.69 | <mdl | 0.33 | <mdl | 10.2 | 22.4 | 60.0 | 19.4 | 2009 | 5160 | 653 | 2631 | 523 | 28.1 | 505 | 69.1 | 404 | 2131 | 78.7 | 202 | 24.4 | 138 | 17.2 | 14,573 |
| 1.70 | <mdl | 0.22 | <mdl | 3.88 | 8.96 | 20.5 | 8.52 | 685 | 1689 | 202 | 786 | 148 | 9.04 | 132 | 18.2 | 109 | 557 | 21.4 | 56.0 | 7.15 | 42.0 | 4.83 | 4355 |
| 0.27 | <mdl | 0.05 | <mdl | 3.95 | 4.05 | 11.7 | 7.17 | 468 | 1436 | 206 | 990 | 240 | 11.5 | 269 | 36.2 | 211 | 1161 | 41.5 | 104 | 11.7 | 68.1 | 8.52 | 6217 |
| 7.61 | <mdl | 0.93 | <mdl | 24.3 | 48.1 | 97.1 | 50.8 | 3652 | 10,018 | 1272 | 5061 | 1051 | 63.8 | 1010 | 143 | 886 | 4507 | 173 | 433 | 57.3 | 331 | 40.5 | 28,692 |
Table 4.
REE and trace element concentrations in apatite from the dolerite dyke (ppm). Apatite analyses were performed on multiple grains in the following samples: Cl-rich magmatic—RX7913, RX7914; REY-rich rims—RX7913; Depleted zones—RX7913, RX7914.
Table 4.
REE and trace element concentrations in apatite from the dolerite dyke (ppm). Apatite analyses were performed on multiple grains in the following samples: Cl-rich magmatic—RX7913, RX7914; REY-rich rims—RX7913; Depleted zones—RX7913, RX7914.
| Cl-Rich Magmatic | Na | Mg | Al | Si | S | K | Sc | Ti | V | Mn | Fe | Co | Ni | Cu | Zn | As | Rb | Sr | Zr | Nb | Mo | Sn | Cs |
| Mean n = (36) | 666 | 1904 | 530 | 2428 | 244 | 118 | 1.68 | 51.7 | 30.2 | 553 | 3583 | 1.19 | <mdl | <mdl | 9.49 | 11.2 | <mdl | 1182 | 9.42 | <mdl | <mdl | <mdl | <mdl |
| S.D. | 199 | 359 | 855 | 1720 | 25.6 | 248 | 0.52 | 11.9 | 12.1 | 43.7 | 1335 | 1.14 | <mdl | <mdl | 11.8 | 4.31 | <mdl | 75.0 | 13.9 | <mdl | <mdl | <mdl | <mdl |
| Min | 434 | 1250 | 0.54 | 1095 | 212 | 4.40 | 0.97 | 36.6 | 14.3 | 426 | 2517 | 0.21 | <mdl | <mdl | 0.76 | 3.79 | <mdl | 1021 | 2.38 | <mdl | <mdl | <mdl | <mdl |
| Max | 1154 | 2486 | 2563 | 8646 | 299 | 928 | 3.21 | 90.2 | 53.5 | 646 | 9012 | 5.00 | <mdl | <mdl | 56.6 | 21.2 | <mdl | 1283 | 65.9 | <mdl | <mdl | <mdl | <mdl |
| Ba | Ta | W | 204Pb | 206Pb | 208Pb | Th | U | La | Ce | Pr | Nd | Sm | Eu | Gd | Tb | Dy | Y | Ho | Er | Tm | Yb | Lu | ΣREY |
| 28.5 | <mdl | 0.14 | <mdl | 3.21 | 17.5 | 44.0 | 5.83 | 1328 | 3050 | 369 | 1475 | 236 | 41.7 | 184 | 20.1 | 94.3 | 423 | 16.1 | 36.4 | 3.91 | 21.2 | 2.66 | 7301 |
| 6.35 | <mdl | 0.13 | <mdl | 1.60 | 10.5 | 32.8 | 6.29 | 339 | 845 | 107 | 441 | 82.9 | 16.0 | 71.1 | 7.83 | 34.5 | 145 | 5.61 | 12.2 | 1.32 | 7.13 | 0.91 | 2090 |
| 19.0 | <mdl | 0.02 | <mdl | 1.23 | 6.75 | 13.0 | 1.82 | 711 | 1537 | 179 | 688 | 108 | 20.6 | 76.3 | 8.49 | 40.3 | 189 | 7.04 | 16.5 | 1.56 | 8.43 | 1.07 | 3601 |
| 47.3 | <mdl | 0.56 | <mdl | 7.70 | 51.8 | 141 | 24.4 | 1922 | 4287 | 514 | 2112 | 400 | 83.1 | 354 | 39.4 | 172 | 698 | 26.4 | 54.8 | 6.21 | 32.0 | 4.05 | 10,218 |
| REY-Rich Rims | Na | Mg | Al | Si | S | K | Sc | Ti | V | Mn | Fe | Co | Ni | Cu | Zn | As | Rb | Sr | Zr | Nb | Mo | Sn | Cs |
| Mean n = (7) | 1101 | 1010 | 150 | 2793 | 238 | 43.1 | 1.33 | 43.2 | 15.6 | 475 | 2521 | 0.28 | <mdl | <mdl | 2.32 | 33.6 | <mdl | 835 | 16.9 | <mdl | <mdl | <mdl | <mdl |
| S.D. | 370 | 322 | 328 | 1056 | 26.1 | 74.1 | 1.27 | 13.3 | 5.07 | 87.6 | 699 | 0.10 | <mdl | <mdl | 1.39 | 9.38 | <mdl | 198 | 28.3 | <mdl | <mdl | <mdl | <mdl |
| Min | 459 | 612 | 0.47 | 2024 | 218 | 7.07 | 0.46 | 27.5 | 9.07 | 342 | 1874 | 0.12 | <mdl | <mdl | 0.52 | 16.6 | <mdl | 595 | 4.73 | <mdl | <mdl | <mdl | <mdl |
| Max | 1411 | 1483 | 737 | 5110 | 293 | 194 | 4.06 | 67.8 | 22.6 | 581 | 3890 | 0.39 | <mdl | <mdl | 3.80 | 42.0 | <mdl | 1114 | 81.1 | <mdl | <mdl | <mdl | <mdl |
| Ba | Ta | W | 204Pb | 206Pb | 208Pb | Th | U | La | Ce | Pr | Nd | Sm | Eu | Gd | Tb | Dy | Y | Ho | Er | Tm | Yb | Lu | ΣREY |
| 16.3 | <mdl | 0.15 | <mdl | 7.59 | 52.1 | 164 | 13.8 | 3672 | 12,067 | 947 | 3561 | 477 | 63.6 | 335 | 34.9 | 165 | 821 | 28.8 | 66.9 | 7.81 | 44.0 | 5.50 | 22,297 |
| 5.02 | <mdl | 0.12 | <mdl | 2.29 | 31.7 | 94.2 | 4.77 | 622 | 2967 | 128 | 475 | 63.0 | 13.9 | 46.4 | 3.63 | 16.9 | 79.4 | 3.23 | 8.59 | 1.18 | 5.78 | 0.90 | 4258 |
| 9.39 | <mdl | 0.04 | <mdl | 3.76 | 18.5 | 57.2 | 6.10 | 2757 | 6547 | 710 | 2776 | 402 | 49.7 | 281 | 30.5 | 147 | 738 | 26.4 | 57.1 | 6.33 | 36.3 | 4.68 | 14,581 |
| 22.9 | <mdl | 0.32 | <mdl | 9.68 | 110 | 353 | 19.5 | 4412 | 15,150 | 1102 | 4199 | 549 | 85.6 | 394 | 41.2 | 200 | 990 | 35.7 | 84.4 | 9.69 | 53.7 | 7.17 | 27,302 |
| REY-Depleted Zones | Na | Mg | Al | Si | S | K | Sc | Ti | V | Mn | Fe | Co | Ni | Cu | Zn | As | Rb | Sr | Zr | Nb | Mo | Sn | Cs |
| Mean n = (9) | 860 | 1509 | 365 | 2963 | 264 | 44.5 | 1.72 | 56.1 | 27.6 | 426 | 3642 | 2.17 | 1.82 | 3.97 | 9.86 | 17.7 | 0.36 | 1074 | 22.4 | <mdl | 0.27 | <mdl | <mdl |
| S.D. | 178 | 249 | 460 | 1995 | 17.2 | 32.0 | 0.88 | 10.7 | 6.17 | 71.0 | 1620 | 2.14 | 1.60 | 1.11 | 5.72 | 8.34 | 0.27 | 71.2 | 22.5 | <mdl | 0.05 | <mdl | <mdl |
| Min | 581 | 1141 | 22.0 | 1373 | 235 | 16.0 | 0.92 | 40.4 | 20.9 | 300 | 1978 | 0.33 | 0.52 | 2.34 | 2.57 | 7.34 | 0.06 | 971 | 2.77 | <mdl | 0.22 | <mdl | <mdl |
| Max | 1208 | 1792 | 1234 | 6655 | 282 | 87.1 | 3.16 | 70.4 | 38.7 | 511 | 5949 | 5.75 | 5.16 | 5.95 | 17.4 | 28.5 | 0.78 | 1202 | 54.9 | <mdl | 0.35 | <mdl | <mdl |
| Ba | Ta | W | 204Pb | 206Pb | 208Pb | Th | U | La | Ce | Pr | Nd | Sm | Eu | Gd | Tb | Dy | Y | Ho | Er | Tm | Yb | Lu | ΣREY |
| 29.5 | <mdl | 0.24 | <mdl | 5.07 | 39.2 | 102 | 5.99 | 1089 | 2602 | 324 | 1397 | 261 | 63.6 | 220 | 22.4 | 99.6 | 396 | 15.4 | 31.6 | 3.23 | 16.0 | 2.11 | 6545 |
| 6.69 | <mdl | 0.28 | <mdl | 3.16 | 19.8 | 60.9 | 3.84 | 197 | 322 | 36.8 | 156 | 44.0 | 21.4 | 50.4 | 4.08 | 17.7 | 48.2 | 2.21 | 4.22 | 0.52 | 4.07 | 0.52 | 712 |
| 21.5 | <mdl | 0.06 | <mdl | 2.32 | 21.3 | 30.9 | 2.37 | 884 | 2217 | 290 | 1223 | 219 | 37.0 | 162 | 18.6 | 87.2 | 329 | 12.6 | 27.0 | 2.56 | 11.2 | 1.28 | 5756 |
| 37.5 | <mdl | 0.85 | <mdl | 10.7 | 83.0 | 228 | 11.4 | 1483 | 3202 | 386 | 1686 | 360 | 108 | 332 | 31.7 | 141 | 469 | 19.4 | 40.2 | 4.07 | 24.5 | 2.89 | 7724 |
Table 5.
REE and trace element concentrations in apatite from the Deep Mineralization (ppm). Apatite analyses were performed on multiple grains in the following samples: REY, S and Cl-rich cores—2773-1, -2, -3, -4, -5; REY, S and Cl-depleted zones—2773-1, -2, -5; REY, S and Cl-depleted zones adjacent to Cp—2773-4. <mdl—below minimum detection limit.
| REY, S and Cl-Rich Cores | Na | Mg | Al | Si | S | K | Sc | Ti | V | Mn | Fe | Co | Ni | Cu | Zn | As | Rb | Sr | Zr | Nb | Mo | Sn | Cs |
| Mean n = (75) | 1272 | 79.9 | 192 | 2676 | 257 | 79.6 | 0.57 | 44.6 | 1.25 | 91.7 | 597 | 0.23 | <mdl | <mdl | 7.28 | 112 | 4.46 | 387 | 0.24 | 0.19 | <mdl | <mdl | <mdl |
| S.D. | 670 | 23.2 | 364 | 1111 | 24.2 | 166 | 0.37 | 15.4 | 1.60 | 26.8 | 305 | 0.12 | <mdl | <mdl | 6.44 | 24.5 | 7.51 | 57.9 | 0.19 | 0.27 | <mdl | <mdl | <mdl |
| Min | 409 | 28.2 | 0.45 | 1001 | 211 | 3.98 | 0.25 | 22.8 | 0.11 | 50.5 | 232 | 0.06 | <mdl | <mdl | 0.79 | 50.8 | 0.06 | 240 | 0.04 | 0.01 | <mdl | <mdl | <mdl |
| Max | 3557 | 149 | 1461 | 5517 | 334 | 826 | 2.41 | 95.1 | 9.17 | 188 | 1891 | 0.57 | <mdl | <mdl | 30.2 | 171 | 35.0 | 624 | 1.07 | 1.92 | <mdl | <mdl | <mdl |
| Ba | Ta | W | 204Pb | 206Pb | 208Pb | Th | U | La | Ce | Pr | Nd | Sm | Eu | Gd | Tb | Dy | Y | Ho | Er | Tm | Yb | Lu | ΣREY |
| 7.58 | <mdl | 0.50 | <mdl | 17.5 | 26.0 | 35.5 | 27.6 | 1520 | 4192 | 504 | 1868 | 298 | 27.4 | 247 | 32.5 | 187 | 1138 | 37.2 | 104 | 13.5 | 83.3 | 11.4 | 10,263 |
| 9.80 | <mdl | 0.87 | <mdl | 11.3 | 34.6 | 20.2 | 16.3 | 602 | 1486 | 178 | 626 | 97.0 | 6.95 | 68.7 | 9.24 | 56.3 | 339 | 11.5 | 33.0 | 4.46 | 26.7 | 3.32 | 3408 |
| 0.44 | <mdl | 0.03 | <mdl | 2.35 | 2.99 | 2.37 | 2.38 | 441 | 1344 | 177 | 720 | 123 | 11.4 | 111 | 14.5 | 79.6 | 495 | 14.9 | 41.3 | 4.83 | 31.3 | 4.87 | 3790 |
| 52.6 | <mdl | 4.16 | <mdl | 70.5 | 201 | 70.4 | 54.4 | 3386 | 8066 | 970 | 3596 | 627 | 67.5 | 398 | 46.9 | 279 | 1674 | 54.9 | 156 | 20.5 | 126 | 17.2 | 18,312 |
| REY, S and Cl-Depleted Zones | Na | Mg | Al | Si | S | K | Sc | Ti | V | Mn | Fe | Co | Ni | Cu | Zn | As | Rb | Sr | Zr | Nb | Mo | Sn | Cs |
| Mean n = (24) | 355 | 40.2 | 217 | 1565 | 264 | 101 | 0.52 | 43.2 | 0.62 | 125 | 268 | 0.29 | 0.46 | 9.35 | 6.34 | 103 | <mdl | 388 | 0.32 | 0.06 | <mdl | <mdl | <mdl |
| S.D. | 169 | 27.7 | 463 | 1500 | 29.2 | 173 | 0.54 | 12.7 | 0.80 | 35.9 | 178 | 0.18 | 0.19 | 9.83 | 4.53 | 48.4 | <mdl | 85.5 | 0.62 | 0.04 | <mdl | <mdl | <mdl |
| Min | 122 | 18.4 | 0.47 | 662 | 218 | 3.26 | 0.15 | 28.0 | 0.07 | 47.6 | 109 | 0.09 | 0.10 | 1.63 | 0.93 | 32.9 | <mdl | 195 | 0.02 | 0.01 | <mdl | <mdl | <mdl |
| Max | 774 | 128 | 1854 | 5993 | 332 | 570 | 2.60 | 86.6 | 2.99 | 200 | 924 | 0.81 | 0.75 | 35.8 | 19.6 | 213 | <mdl | 581 | 2.59 | 0.14 | <mdl | <mdl | <mdl |
| Ba | Ta | W | 204Pb | 206Pb | 208Pb | Th | U | La | Ce | Pr | Nd | Sm | Eu | Gd | Tb | Dy | Y | Ho | Er | Tm | Yb | Lu | ΣREY |
| 8.78 | <mdl | 1.00 | 6.93 | 6.45 | 15.8 | 13.9 | 6.25 | 314 | 966 | 136 | 598 | 122 | 10.8 | 122 | 16.2 | 91.1 | 576 | 18.2 | 49.8 | 6.28 | 37.3 | 5.47 | 3069 |
| 11.1 | <mdl | 1.64 | 6.31 | 5.07 | 14.9 | 16.1 | 5.69 | 242 | 586 | 72.2 | 288 | 54.5 | 3.36 | 52.3 | 8.34 | 49.7 | 320 | 10.4 | 29.0 | 3.84 | 22.4 | 3.00 | 1629 |
| 0.85 | <mdl | 0.05 | 2.01 | 0.785 | 1.86 | 0.73 | 0.84 | 87.4 | 355 | 60.4 | 280 | 60.0 | 6.75 | 61.2 | 6.83 | 37.0 | 237 | 6.64 | 17.3 | 1.92 | 12.5 | 2.18 | 1425 |
| 46.9 | <mdl | 4.93 | 19.8 | 23.1 | 62.2 | 58.5 | 21.4 | 1041 | 2474 | 306 | 1289 | 244 | 18.3 | 244 | 36.0 | 216 | 1385 | 44.8 | 121 | 16.1 | 92.5 | 12.7 | 7013 |
| REY, S and Cl- Depleted Zones Adjacent to Cp | Na | Mg | Al | Si | S | K | Sc | Ti | V | Mn | Fe | Co | Ni | Cu | Zn | As | Rb | Sr | Zr | Nb | Mo | Sn | Cs |
| Mean n = (6) | 138 | 16.5 | <mdl | 573 | 241 | <mdl | <mdl | 73.2 | <mdl | 189 | 115 | <mdl | <mdl | <mdl | 3.22 | <mdl | <mdl | 326 | <mdl | <mdl | <mdl | <mdl | <mdl |
| S.D. | 62.1 | 0.97 | <mdl | 60.1 | 24.4 | <mdl | <mdl | 16.2 | <mdl | 31.7 | 39.2 | <mdl | <mdl | <mdl | 1.31 | <mdl | <mdl | 102 | <mdl | <mdl | <mdl | <mdl | <mdl |
| Min | 72.1 | 14.8 | <mdl | 518 | 214 | <mdl | <mdl | 52.7 | <mdl | 151 | 75.1 | <mdl | <mdl | <mdl | 2.19 | <mdl | <mdl | 214 | <mdl | <mdl | <mdl | <mdl | <mdl |
| Max | 230 | 17.6 | <mdl | 653 | 277 | <mdl | <mdl | 98.2 | <mdl | 237 | 178 | <mdl | <mdl | <mdl | 5.09 | <mdl | <mdl | 466 | <mdl | <mdl | <mdl | <mdl | <mdl |
| Ba | Ta | W | 204Pb | 206Pb | 208Pb | Th | U | La | Ce | Pr | Nd | Sm | Eu | Gd | Tb | Dy | Y | Ho | Er | Tm | Yb | Lu | ΣREY |
| 1.68 | <mdl | <mdl | <mdl | 0.566 | 1.97 | 0.24 | 0.25 | 25.4 | 113 | 20.5 | 111 | 42.7 | 8.66 | 61.3 | 8.05 | 36.1 | 156 | 5.66 | 12.0 | 1.21 | 6.63 | 0.76 | 610 |
| 1.03 | <mdl | <mdl | <mdl | 0.326 | 1.58 | 0.19 | 0.23 | 10.4 | 37.7 | 5.47 | 25.8 | 5.45 | 0.97 | 8.25 | 1.12 | 4.93 | 16.0 | 0.78 | 2.43 | 0.32 | 2.12 | 0.28 | 93 |
| 0.42 | <mdl | <mdl | <mdl | 0.314 | 0.455 | 0.06 | 0.04 | 12.7 | 68.2 | 13.1 | 78.5 | 35.3 | 7.41 | 53.0 | 6.87 | 30.8 | 139 | 4.56 | 8.69 | 0.89 | 3.92 | 0.41 | 498 |
| 2.85 | <mdl | <mdl | <mdl | 1.13 | 4.57 | 0.50 | 0.47 | 37.3 | 154 | 26.0 | 141 | 49.8 | 10.2 | 72.2 | 9.43 | 42.4 | 175 | 6.87 | 14.9 | 1.66 | 9.21 | 1.05 | 741 |
Table 6.
REE and trace element concentrations in apatite from the Distal Satellite (ppm). Apatite analyses were performed on multiple grains in the following samples: RX6685, RX6687, RX6691. <mdl—below minimum detection limit.
Table 6.
REE and trace element concentrations in apatite from the Distal Satellite (ppm). Apatite analyses were performed on multiple grains in the following samples: RX6685, RX6687, RX6691. <mdl—below minimum detection limit.
| REY-,S-Rich Cores | Na | Mg | Al | Si | S | K | Sc | Ti | V | Mn | Fe | Co | Ni | Cu | Zn | As | Rb | Sr | Zr | Nb | Mo | Sn | Cs |
|---|---|---|---|---|---|---|---|---|---|---|---|---|---|---|---|---|---|---|---|---|---|---|---|
| Mean n = (118) | 1476 | 338 | 968 | 6140 | 250 | 911 | 1.45 | 66.3 | 4.40 | 86.0 | 1355 | <mdl | <mdl | <mdl | 8.22 | 91.0 | 4.47 | 208 | 32.0 | <mdl | <mdl | <mdl | <mdl |
| S.D. | 711 | 506 | 1731 | 6806 | 21.7 | 2028 | 1.43 | 79.8 | 4.03 | 81.6 | 2342 | <mdl | <mdl | <mdl | 12.6 | 32.4 | 9.08 | 29.0 | 49.8 | <mdl | <mdl | <mdl | <mdl |
| Min | 287 | 18.9 | 1.10 | 1477 | 194 | 5.55 | 0.29 | 2.04 | 1.09 | 35.5 | 93.9 | <mdl | <mdl | <mdl | 0.35 | 21.5 | 0.05 | 62.9 | 0.05 | <mdl | <mdl | <mdl | <mdl |
| Max | 3361 | 2294 | 7173 | 31,824 | 303 | 9425 | 7.30 | 534 | 20.4 | 460 | 16,780 | <mdl | <mdl | <mdl | 70.3 | 209 | 49.8 | 279 | 201 | <mdl | <mdl | <mdl | <mdl |
| Ba | Ta | W | 204Pb | 206Pb | 208Pb | Th | U | La | Ce | Pr | Nd | Sm | Eu | Gd | Tb | Dy | Y | Ho | Er | Tm | Yb | Lu | ΣREY |
| 9.62 | <mdl | <mdl | <mdl | 7.88 | 4.74 | 14.9 | 23.6 | 1816 | 4426 | 466 | 1610 | 223 | 35.0 | 198 | 24.5 | 137 | 887 | 28.2 | 77.2 | 9.96 | 64.6 | 11.0 | 10,013 |
| 13.2 | <mdl | <mdl | <mdl | 5.92 | 3.34 | 11.9 | 27.9 | 663 | 1499 | 138 | 438 | 48.2 | 8.01 | 38.4 | 4.92 | 31.1 | 176 | 6.28 | 17.3 | 2.43 | 16.1 | 3.06 | 2868 |
| 0.33 | <mdl | <mdl | <mdl | 1.42 | 0.299 | 0.69 | 2.79 | 490 | 1418 | 180 | 705 | 124 | 16.4 | 124 | 15.2 | 80.0 | 543 | 16.0 | 40.7 | 5.01 | 33.2 | 5.92 | 3922 |
| 72.1 | <mdl | <mdl | <mdl | 25.0 | 17.2 | 63.1 | 145 | 3747 | 8980 | 920 | 3117 | 395 | 66.6 | 298 | 40.7 | 248 | 1416 | 49.4 | 128 | 17.3 | 121 | 22.1 | 18,700 |
Table 7.
REE and trace element concentrations in apatite from high-grade bornite ore (ppm). Apatite analyses were performed on multiple grains in samples: OD10.1, 10.2, 10.3.
Table 7.
REE and trace element concentrations in apatite from high-grade bornite ore (ppm). Apatite analyses were performed on multiple grains in samples: OD10.1, 10.2, 10.3.
| High-Grade Bornite Ore Hosted | Na | Mg | Al | Si | S | K | Sc | Ti | V | Mn | Fe | Co | Ni | Cu | Zn | As | Rb | Sr | Zr | Nb | Mo | Sn | Cs |
|---|---|---|---|---|---|---|---|---|---|---|---|---|---|---|---|---|---|---|---|---|---|---|---|
| Mean n = (20) | 521 | 20.1 | 104 | 528 | 221 | 50.6 | 0.53 | 86.3 | 1.12 | 56.2 | 2474 | <mdl | <mdl | 19.2 | <mdl | <mdl | 0.45 | 1351 | <mdl | 2.00 | <mdl | <mdl | <mdl |
| S.D. | 227 | 15.0 | 149 | 151 | 37.4 | 52.8 | 0.21 | 38.1 | 1.06 | 12.1 | 4510 | <mdl | <mdl | 20.6 | <mdl | <mdl | 0.31 | 676 | <mdl | 3.26 | <mdl | <mdl | <mdl |
| Min | 117 | 10.7 | 1.08 | 367 | 160 | 3.75 | 0.32 | 24.6 | 0.05 | 38.3 | 6.67 | <mdl | <mdl | 1.89 | <mdl | <mdl | 0.18 | 738 | <mdl | 0.11 | <mdl | <mdl | <mdl |
| Max | 953 | 65.3 | 491 | 874 | 298 | 189 | 1.01 | 198 | 3.16 | 89.9 | 13,448 | <mdl | <mdl | 55.4 | <mdl | <mdl | 1.08 | 3138 | <mdl | 10.1 | <mdl | <mdl | <mdl |
| Ba | Ta | W | 204Pb | 206Pb | 208Pb | Th | U | La | Ce | Pr | Nd | Sm | Eu | Gd | Tb | Dy | Y | Ho | Er | Tm | Yb | Lu | ΣREY |
| 4.28 | <mdl | <mdl | <mdl | 5.41 | 3.04 | 3.42 | 1.06 | 6.98 | 48.9 | 17.0 | 194 | 631 | 391 | 1217 | 96.6 | 365 | 1118 | 48.6 | 91.6 | 8.65 | 38.6 | 4.21 | 4277 |
| 5.79 | <mdl | <mdl | <mdl | 6.78 | 3.02 | 2.06 | 0.87 | 4.74 | 20.9 | 6.23 | 70.0 | 232 | 164 | 537 | 47.2 | 195 | 669 | 25.6 | 52.4 | 5.50 | 26.1 | 2.76 | 1939 |
| 0.47 | <mdl | <mdl | <mdl | 0.416 | 0.238 | 0.38 | 0.21 | 1.84 | 17.5 | 6.05 | 68.3 | 246 | 166 | 348 | 24.9 | 87.1 | 250 | 12.1 | 21.2 | 1.28 | 6.51 | 0.56 | 1490 |
| 19.8 | <mdl | <mdl | <mdl | 25.1 | 10.1 | 7.47 | 3.32 | 18.3 | 104 | 30.6 | 308 | 1191 | 893 | 2622 | 210 | 855 | 2730 | 106 | 216 | 22.5 | 109 | 10.9 | 9282 |
Table 8.
EPMA data for the high-grade bornite-ore hosted apatite, <mdl—below minimum detection limit.
Table 8.
EPMA data for the high-grade bornite-ore hosted apatite, <mdl—below minimum detection limit.
| Analysis | F | Cl | Na2O | SiO2 | Al2O3 | MgO | P2O5 | SO3 | K2O | CaO | TiO2 | Cr2O3 | MnO | FeO | As2O3 | SrO | Y2O3 | La2O3 | Ce2O3 | Nd2O3 | Total | |||
| 1 | 3.63 | 0.173 | 0.144 | 0.188 | <mdl | <mdl | 42.25 | 0.445 | <mdl | 55.22 | <mdl | <mdl | 0.015 | 1.088 | <mdl | 0.118 | 0.019 | <mdl | 0.184 | 0.255 | 103.73 | |||
| 2 | 3.59 | <mdl | 0.049 | 0.025 | <mdl | <mdl | 42.27 | 0.010 | <mdl | 55.71 | 0.002 | <mdl | <mdl | 0.156 | <mdl | 0.112 | 0.272 | <mdl | <mdl | 0.158 | 102.35 | |||
| 3 | 3.65 | <mdl | 0.063 | 0.012 | <mdl | <mdl | 42.15 | <mdl | <mdl | 55.94 | <mdl | <mdl | <mdl | 0.145 | <mdl | 0.107 | 0.214 | <mdl | <mdl | 0.160 | 102.44 | |||
| Calculated Formula (9 apfu) | ||||||||||||||||||||||||
| Ca | Mg | Mn | Sr | Y | La | Ce | Nd | Na | K | Fe | Ti | Al | Cr | Total | SREY | P | S | As | Si | Total | F | Cl | OH | Total |
| 4.886 | - | 0.001 | 0.006 | 0.001 | - | 0.006 | 0.008 | 0.023 | - | 0.075 | - | - | - | 5.005 | 0.014 | 2.954 | 0.028 | - | 0.016 | 2.997 | 0.947 | 0.024 | 0.029 | 1.000 |
| 4.977 | - | 0.000 | 0.005 | 0.020 | - | - | 0.005 | 0.008 | - | 0.011 | 0.000 | - | - | 5.026 | 0.025 | 2.984 | 0.001 | - | 0.002 | 2.986 | 0.946 | - | 0.054 | 1.000 |
| 5.002 | - | - | 0.005 | 0.016 | - | - | 0.005 | 0.010 | - | 0.010 | - | - | - | 5.048 | 0.020 | 2.978 | - | - | 0.001 | 2.979 | 0.963 | - | 0.037 | 1.000 |
© 2017 by the authors. Licensee MDPI, Basel, Switzerland. This article is an open access article distributed under the terms and conditions of the Creative Commons Attribution (CC BY) license (http://creativecommons.org/licenses/by/4.0/).
Share and Cite
MDPI and ACS Style
Krneta, S.; Ciobanu, C.L.; Cook, N.J.; Ehrig, K.; Kontonikas-Charos, A. Rare Earth Element Behaviour in Apatite from the Olympic Dam Cu–U–Au–Ag Deposit, South Australia. Minerals 2017, 7, 135. https://doi.org/10.3390/min7080135
AMA Style
Krneta S, Ciobanu CL, Cook NJ, Ehrig K, Kontonikas-Charos A. Rare Earth Element Behaviour in Apatite from the Olympic Dam Cu–U–Au–Ag Deposit, South Australia. Minerals. 2017; 7(8):135. https://doi.org/10.3390/min7080135
Chicago/Turabian StyleKrneta, Sasha, Cristiana L. Ciobanu, Nigel J. Cook, Kathy Ehrig, and Alkis Kontonikas-Charos. 2017. "Rare Earth Element Behaviour in Apatite from the Olympic Dam Cu–U–Au–Ag Deposit, South Australia" Minerals 7, no. 8: 135. https://doi.org/10.3390/min7080135
Note that from the first issue of 2016, this journal uses article numbers instead of page numbers. See further details here.