Growth Oscillatory Zoning in Erythrite, Ideally Co3(AsO4)2·8H2O: Structural Variations in Vivianite-Group Minerals


Department of Geoscience, University of Calgary, Calgary, AB T2N 1N4, Canada
*
Author to whom correspondence should be addressed.
Minerals 2017, 7(8), 136; https://doi.org/10.3390/min7080136
Submission received: 11 July 2017
/
Revised: 28 July 2017
/
Accepted: 30 July 2017
/
Published: 2 August 2017
(This article belongs to the Special Issue Fundamentals and Frontiers in Mineralogy)
Abstract
:The crystal structure of an oscillatory zoned erythrite sample from Aghbar mine, Bou Azzer, Morocco, was refined using synchrotron high-resolution powder X-ray diffraction (HRPXRD) data, Rietveld refinement, space group C2/m, and Z = 2. The crystal contains two sets of oscillatory zones that appear to have developed during epitaxial growth. The unit-cell parameters obtained are a = 10.24799(3) Å, b = 13.42490(7) Å, c = 4.755885(8) Å, β = 105.1116(3)°, and V = 631.680(4) Å3. The empirical formula for erythrite, obtained with electron-probe micro-analysis (EPMA), is [Co2.78Zn0.11Ni0.07Fe0.04]∑3.00(AsO4)2·8H2O. Erythrite belongs to the vivianite-type structure that contains M1O2(H2O)4 octahedra and M22O6(H2O)4 octahedral dimers that are linked by TO4 (T5+ = As or P) tetrahedra to form complex layers parallel to the (010) plane. These layers are connected by hydrogen bonds. The average <M1–O>[6] = 2.122(1) Å and average <M2–O>[6] = 2.088(1) Å. With space group C2/m, there are two solid solutions: M3(AsO4)2·8H2O and M3(PO4)2·8H2O where M2+ = Mg, Fe, Co, Ni, or Zn. In these As- and P-series, using data from this study and from the literature, we find that their structural parameters evolve linearly with V and in a nearly parallel manner despite of the large difference in size between P5+ (0.170 Å) and As5+ (0.355 Å) cations. Average <T–O>[4], <M1–O>[6], and <M2–O>[6] distances increase linearly with V. The average <As–O> distance is affected by M atoms, whereas the average <P–O> distance is unaffected because it contains shorter and stronger P–O bonds. Although As- and P-series occur naturally, there is no structural reason why similar V-series vivianite-group minerals do not occur naturally or cannot be synthesized.
1. Introduction
Erythrite, ideally Co3(AsO4)2·8H2O, is a member of the vivianite-group minerals with general formula M3(TO4)2·8H2O where M2+ = Mg, Fe, Co, Ni, or Zn and T5+ = P or As. Because of the difference in size of P (0.170 Å) and As (0.355 Å) atoms, two solid solutions occur with different chemical evolution and structural characteristics. Solid solutions do not occur between the two separate P- and As- series. Both series have monoclinic space group C2/m with Z = 2. In addition to the above two solid solutions, there is no structural reason for the existence of a third series with V5+ (0.335 Å) cation, as in the lead-apatite series [1,2,3]. V-series vivianite-group minerals have not been found in nature because another phase may be more stable. However, it would be of interest to synthesize V-series vivianite materials. Because the P–O bond is short and strong, the interstitial M atoms are unlikely to have any significantly effect on the average <P–O> distance, whereas the average <As–O> distance is longer, so the As–O bond is weaker and is affected by the M atoms. This observation is confirmed using data from this study and the literature (Table 1).
The structure of vivianite, ideally Fe3(PO4)2·8H2O, was determined by Mori and Ito [19] and subsequently refined by others [17,20,21]. Other vivianite-type materials were structurally investigated: parasymplesite, Fe3(AsO4)2·8H2O [19]; köttigite, ideally Zn3(AsO4)2·8H2O [6]; cabrerite, (Ni,Mg)3(AsO4)2·8H2O, a Mg-rich variety of annabergite [5]; synthetic Mg3(PO4)2·8H2O [15]; synthetic Co3(PO4)2·8H2O [13]. The structural parameters of these minerals are summarized in Table 1. Arsenate minerals from the vivianite group usually occur as secondary minerals in the oxidation zones of some arsenic-rich hydrothermal base-metal mineral deposits. It is important to study the chemistry of the vivianite-group minerals because of their significance in mineralogy and proton super-ionic conduction, especially the hydrogen-bonding geometry [11].
The study examines the crystal chemistry of an oscillatory zoned erythrite crystal using Rietveld structure refinement, synchrotron high-resolution powder X-ray diffraction (HRPXRD) data, and electron-probe micro-analyzer (EPMA) data. Solid solutions for the As- and P-series are also examined using data from this study and the literature. Similar experimental techniques were used to examine other minerals [22,23,24,25,26].
2. Experimental Methods
2.1. Sample Description and Electron-Probe Micro-Analyzer (EPMA)
Experiments were performed on a sample of erythrite from Aghbar mine, Bou Azzer, Morocco. The sample contains euhedral crystals that are well-developed with excellent faces. The prismatic crystals are elongated along the [001] direction and flattened on the (010) plane.
Quantitative chemical compositions, back-scattered electron (BSE) image, and elemental maps were collected with a JEOL JXA-8200 WD-ED electron-probe micro-analyzer (EPMA). The JEOL operating program on a Solaris platform was used for ZAF correction and data reduction. The wavelength-dispersive (WD) operating conditions were 15 kV accelerating voltage, 20 nA beam current, and 5 μm beam diameter. The standards used were cobalt (CoKα), hornblende (FeKα), nickel oxide (NiKα), zinc oxide (ZnKα), almandine-pyrope (MgKα), gallium arsenide (AsKα), apatite (PKα), and barite (SKα). The results of the average EPMA analyses (from 11 points) are listed in Table 2 and results in the empirical formula [Co2.78Zn0.11Ni0.07Fe0.04]∑3.00(AsO4)2·8H2O. The BSE image and elemental maps show two sets of crystal growth zones that occur as oscillatory features (Figure 1). This chemical heterogeneity is also evident from the variations of the atoms from one spot to another (Figure 2).
2.2. Synchrotron High-Resolution Powder X-ray Diffraction (HRPXRD)
The erythrite sample was studied with HRPXRD that was performed at beamline 11-BM, Advanced Photon Source (APS), Argonne National Laboratory (ANL). A small fragment (about 2 mm in diameter) of the crystal was crushed to a fine powder using an agate mortar and pestle. The crushed sample was loaded into a Kapton capillary (0.8 mm internal diameter) and rotated during the experiment at a rate of 90 rotations per second. The data were collected at 23 °C to a maximum 2θ of about 40° with a step size of 0.001° and a step time of 0.1 s per step. The HRPXRD trace was collected with a unique multi-analyzer detection assembly consisting of twelve independent silicon (111) crystal analyzers and LaCl3 scintillation detectors that reduce the angular range to be scanned and result in rapid acquisition of data. A silicon (NIST 640c) and alumina (NIST 676a) standard (ratio of ⅓ Si: ⅔ Al2O3 by weight) was used to calibrate the instrument and refine the monochromatic wavelength used in the experiment (see Table 3). Additional details of the experimental set-up are given elsewhere [27,28,29].
3. Rietveld Structure Refinements
The HRPXRD trace of erythrite was modelled using the Rietveld method [30], as implemented in the GSAS program [31], and using the EXPGUI interface [32]. Scattering curves for neutral atoms were used in the refinement. The starting atom coordinates, unit-cell parameters, and space group C2/m were taken from Wildner et al. [4].
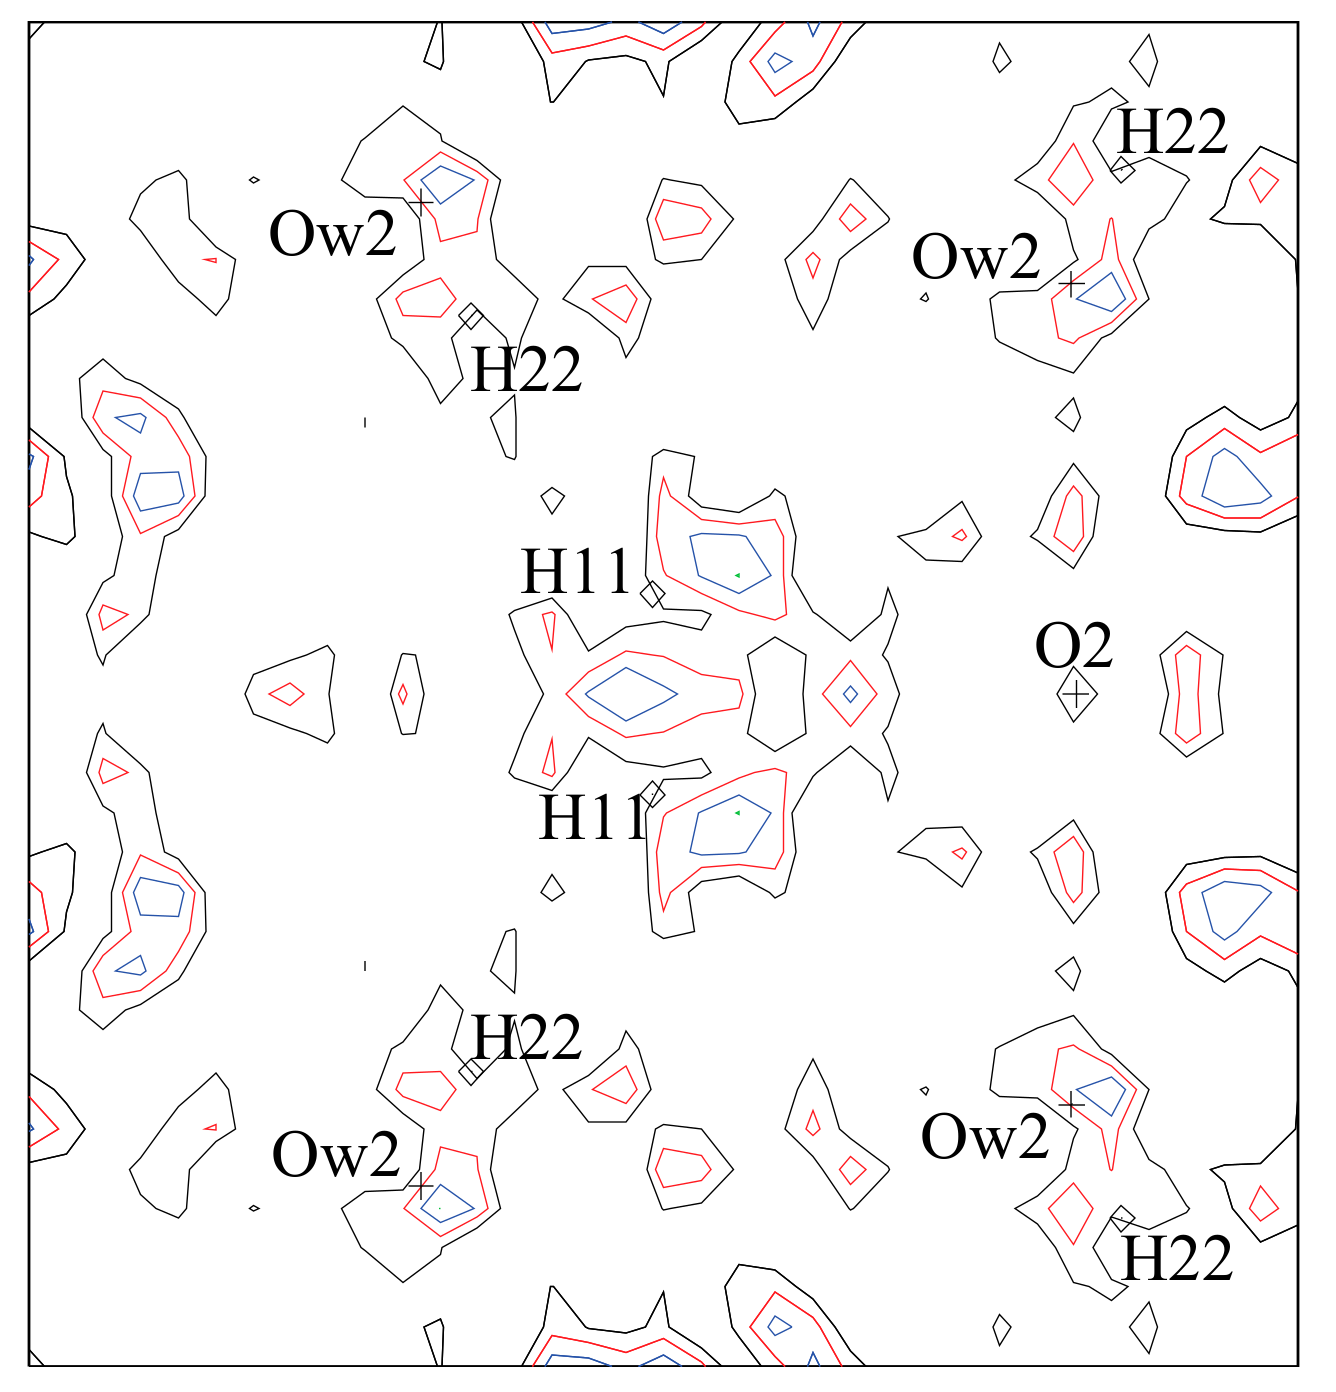
In the GSAS program, the reflection-peak profiles were fitted using type-3 (profile pseudo-Voigt; [33,34]). The background was modelled with a Chebyschev polynomial (8 terms). A full-matrix least-squares refinement varying a scale factor, unit-cell parameters, zero shift, atom coordinates, and isotropic displacement parameters converged rapidly. The synchrotron HRPXRD pattern is shown (Figure 3). The H atoms were located in difference Fourier maps and were incorporated in the refinement (Figure 4). The site occupancy factors (sofs) for the M1 and M2 sites, in terms of the dominant Co atom, were refined. The number of data points and the number of observed reflections in the HRPXRD trace together with the Rietveld refinement statistical indicators and unit-cell parameters are given (Table 3). The atom coordinates are listed in Table 4. Some site occupancy factors (sofs) were refined and those for the O, As, and H atoms were fixed (Table 4). Selected bond distances and angles are given in Table 5. The bond-valence sums (BVS) are given in Table 6.
4. Discussion
4.1. Oscillatory Zoning in Erythrite
Erythrite shows excellent oscillatory zoning that is easily observed in BSE images and X-ray elemental maps (Figure 1). There are two separate sets of oscillatory zones that were formed at different times and are well preserved. The later set of zones overgrows the initial zones. Both sets of zones appear to have developed during epitaxial crystal growth because of cyclic variations in chemical conditions. In erythrite, the M2+ (Co, Zn, Ni, Fe) cations occur on both the M1 and M2 sites. These M cations show a heterogeneous distribution in the crystal (Figure 2). It appears that both the M1 and M2 sites contain a heterogeneous distribution of the M atoms.
Zoning in minerals contain a wealth of information concerning their evolutionary history and conditions of formation, which in turn is used to elucidate the thermal history of rocks. At least 75 minerals are characterized by oscillatory zoning that contains quasi-cyclic alternation in the chemical composition of discrete growth shells from tens of nanometres to tens of micrometers [36]. Oscillatory zoning is well known in feldspars. Some garnet-group minerals show excellent oscillatory zoning that arises from distinct phases that are slightly different from each other in both structure and chemistry [37,38,39,40,41,42,43,44,45,46,47]. Although erythrite shows similar oscillatory zones as in garnets, the separate zones do not give rise to distinct phases as indicated by split diffraction peaks (Figure 3) probably because of the similarity in radii of the M cations and its low symmetry compared to cubic garnet and genthelvite [48] that contain split diffraction peaks.
4.2. Structure of Erythrite
Vivianite-type structure contains M1O2(H2O)4 octahedra and M22O6(H2O)4 octahedral dimers that are linked by TO4 tetrahedra and hydrogen bonds to form complex layers parallel to the (010) plane. These layers are connected by hydrogen bonds (Figure 5). The structure of erythrite (Figure 5a) contains isolated M1 octahedron (Figure 5b) and edge sharing double M2 octahedral dimers (Figure 5c). The AsO4 tetrahedra, M1, and M2 octahedra form complex sheets parallel to the (010) plane and are interconnected by hydrogen bonds. The M1 octahedron is coordinated by four water molecules (Ow1) and two O atoms, i.e., M1O4(H2O)2 units, whereas the M2 octahedron is coordinated by four O atoms and two water molecules (Ow2). This edge sharing double octahedral dimer consists of M22O6(H2O)4 unit.
The bond-valence sums (BVS) for the cations (As, Co, and H) are close to their ideal valences (v.u.) whereas those of the O atoms are close to 2, as expected (Table 6). The M1 and M2 sites contain Co as the dominant atom with minor amounts of Zn, Ni, and Fe atoms. A possible distribution of the minor atoms between the M1 and M2 sites is given below.
4.3. Variations among Unit-Cell Parameters in As- and P-Series Vivianite-Group Minerals
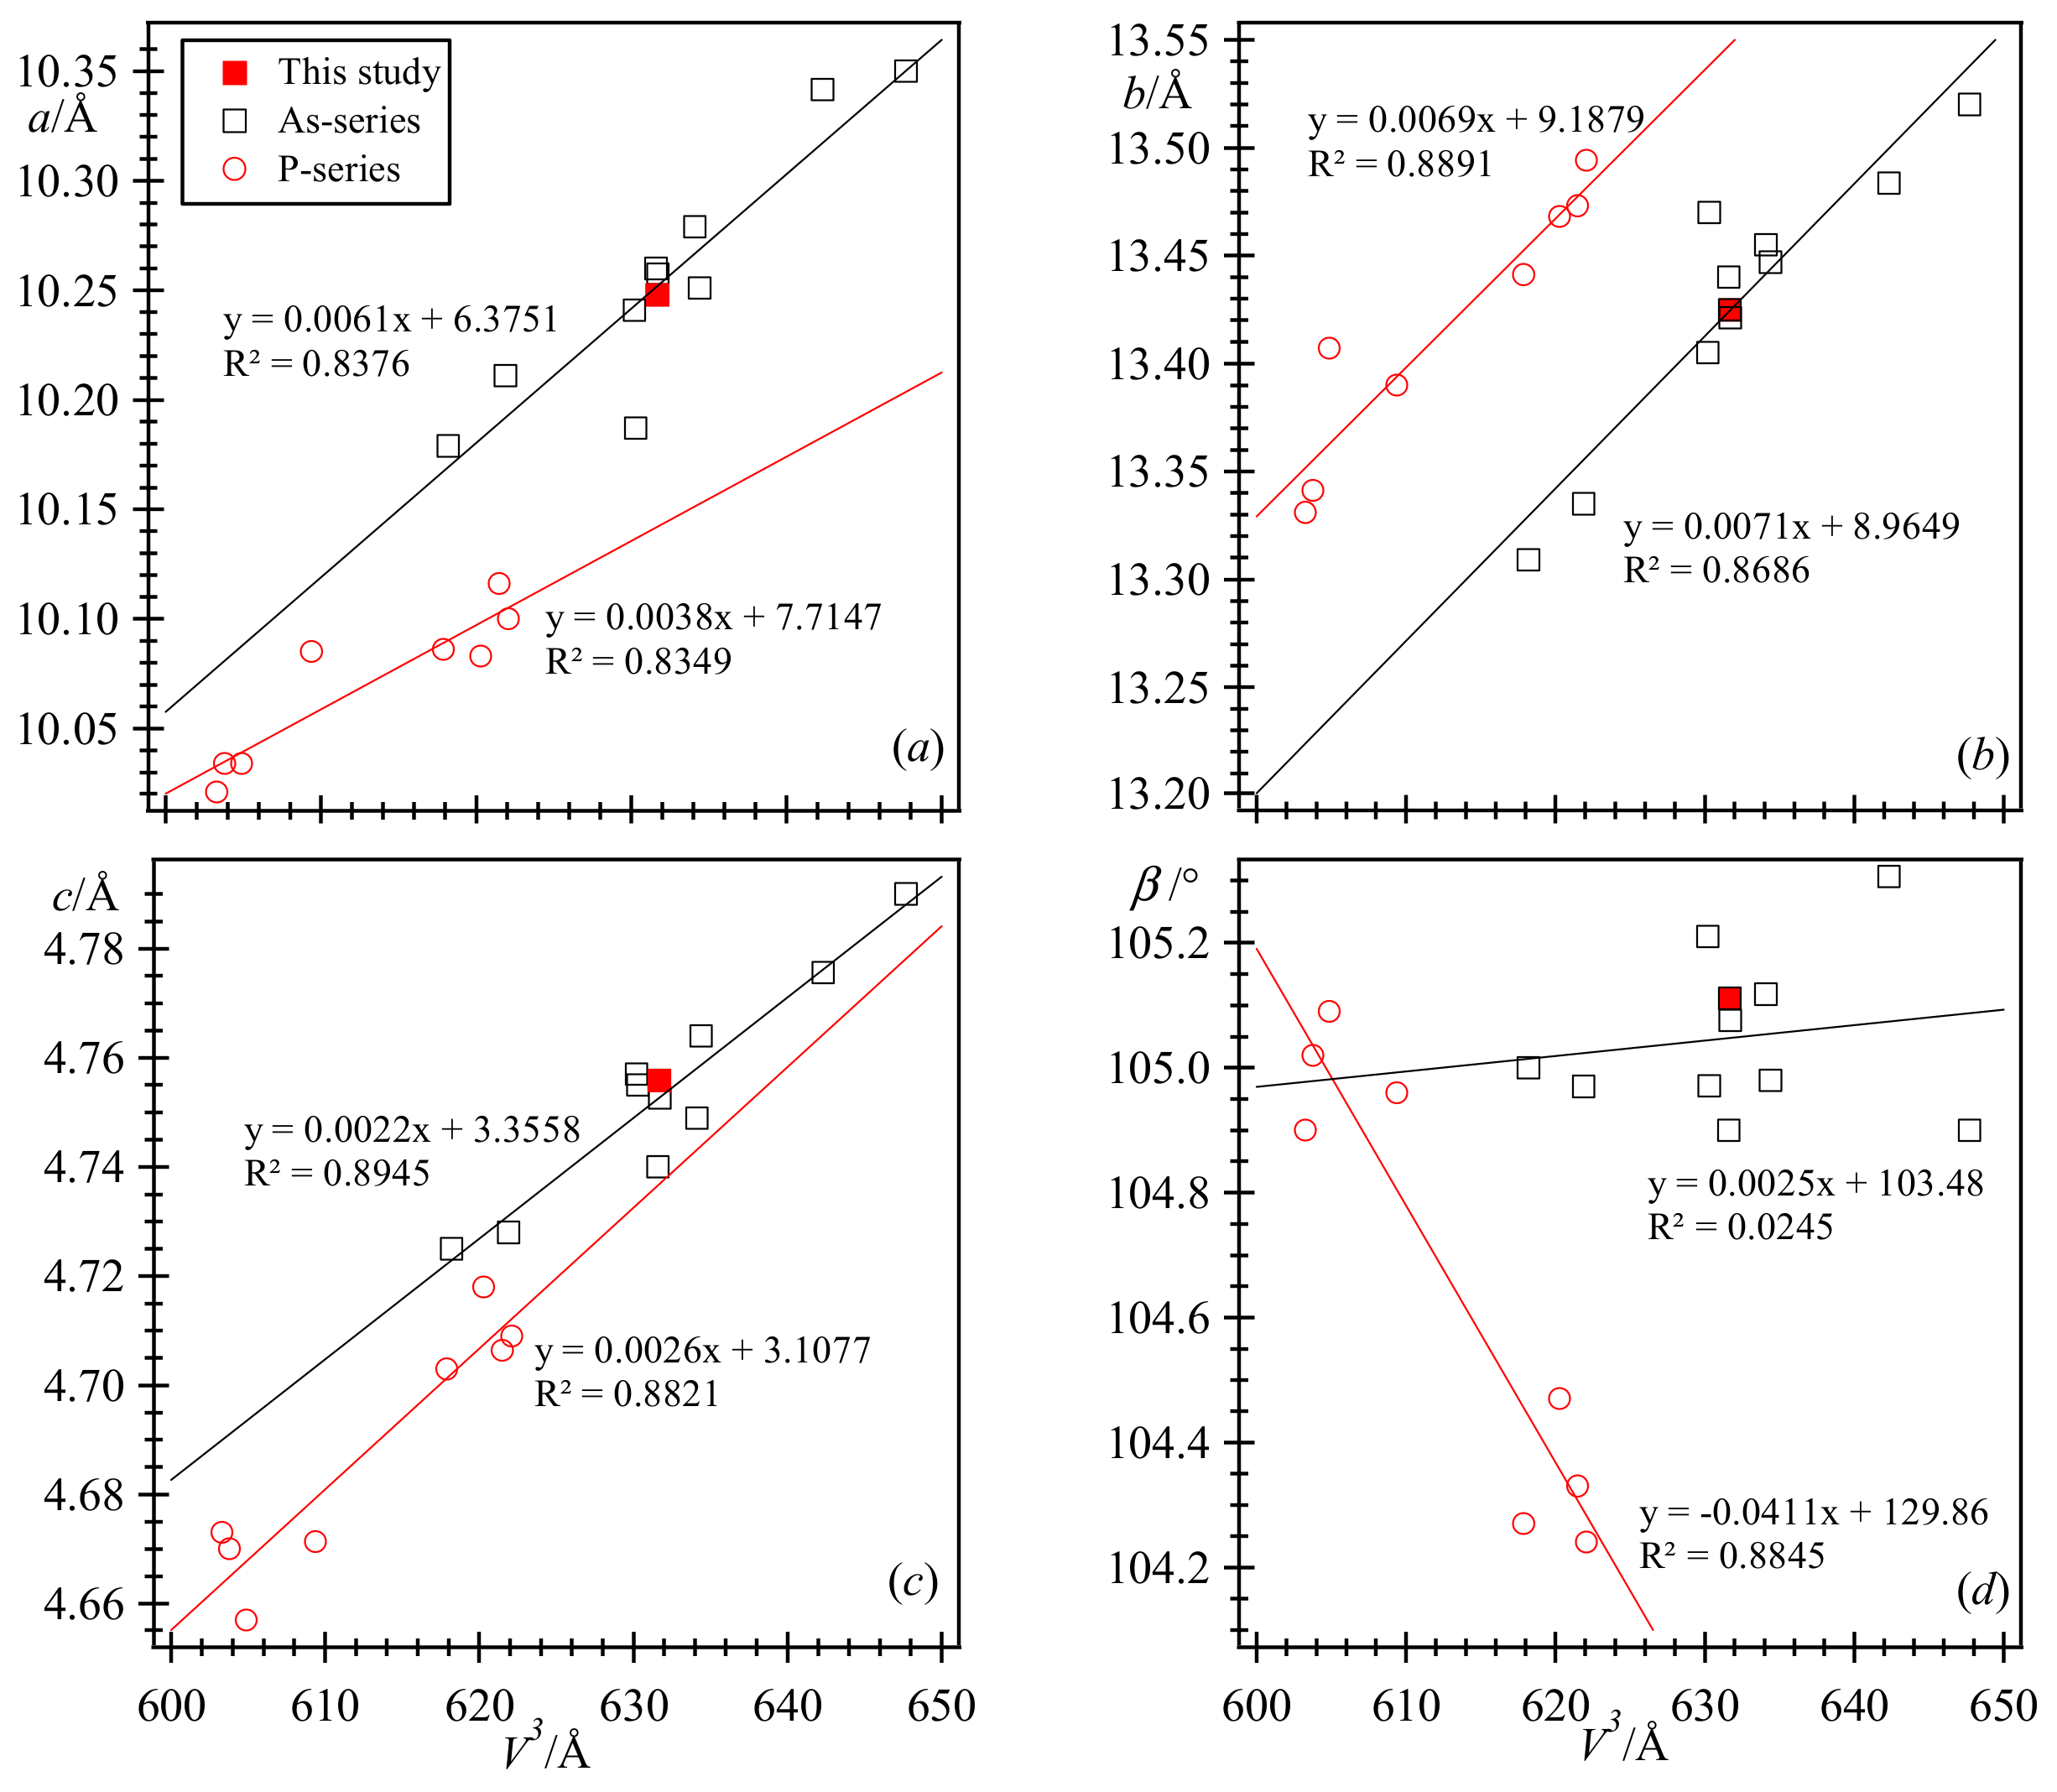
The relations among the unit-cell parameters are shown (Figure 6). The unit-cell parameters fall along two straight lines representing the separate As- and P-series. The unit-cell parameters occur in two groups, and there appears to be complete solid solutions within each separate series. Although complete solid solutions may be possible within both series, data are needed for more (synthetic?) samples along both joins. The effective ionic radii difference between P (0.170 Å) and As (0.335 Å) is quite large (0.165 Å). Although there are a variety of M cations (Table 1), except for the b parameter, the larger unit-cell data for the As series arise from the larger size of the As atom. Based on the two different groups of unit-cell parameters, there does not seem to be a solid solution between the two distinct groups. Although a V-series is not known, one would expect such a series because the effective ionic radii difference between As (0.335 Å) and V (0.355 Å) is quite small (0.020 Å).
4.4. Structural Variations in As- and P-Series Vivianite-Group Minerals
Linear variations of selected distances occur with the unit-cell volume, V (Figure 7). In both the As- and P-series, the average <M1–O> distance is larger than the average <M2–O> distance. This is a characteristic structural feature of all vivianite-type arsenates and phosphates. Therefore, the larger M atoms are expected in the M1 site and the smaller M atoms in the M2 site. The M atoms with number of electrons and effective ionic radii are M2+ = Mg (12, 0.720 Å), Fe (26, 0.780 Å), Co (27, 0.745 Å), Ni (28, 0.690 Å), and Zn (30, 0.740 Å) (radii are from [49]). Our sample contains [Co2.78Zn0.11Ni0.07Fe0.04] as M atoms. In terms of Co, the site occupancy factor (sof) for the M1 site is 1.028(2) and M2 site is 0.912(2) (Table 4). Our sofs agree well with our EPMA results. It seems that the minor amounts of heavier Ni and Zn compared to Co atoms may be present in the M1 site and the lighter and larger Fe atom may occur in the M2 site, which is an anomaly that was confirmed by Mössbauer studies in other samples [4]. Based on EPMA data, the composition of the sample is variable and therefore it is not realistic to constrain the composition based on the major and minor atoms, so the M1 and M2 sites were refined in terms of Co atoms.
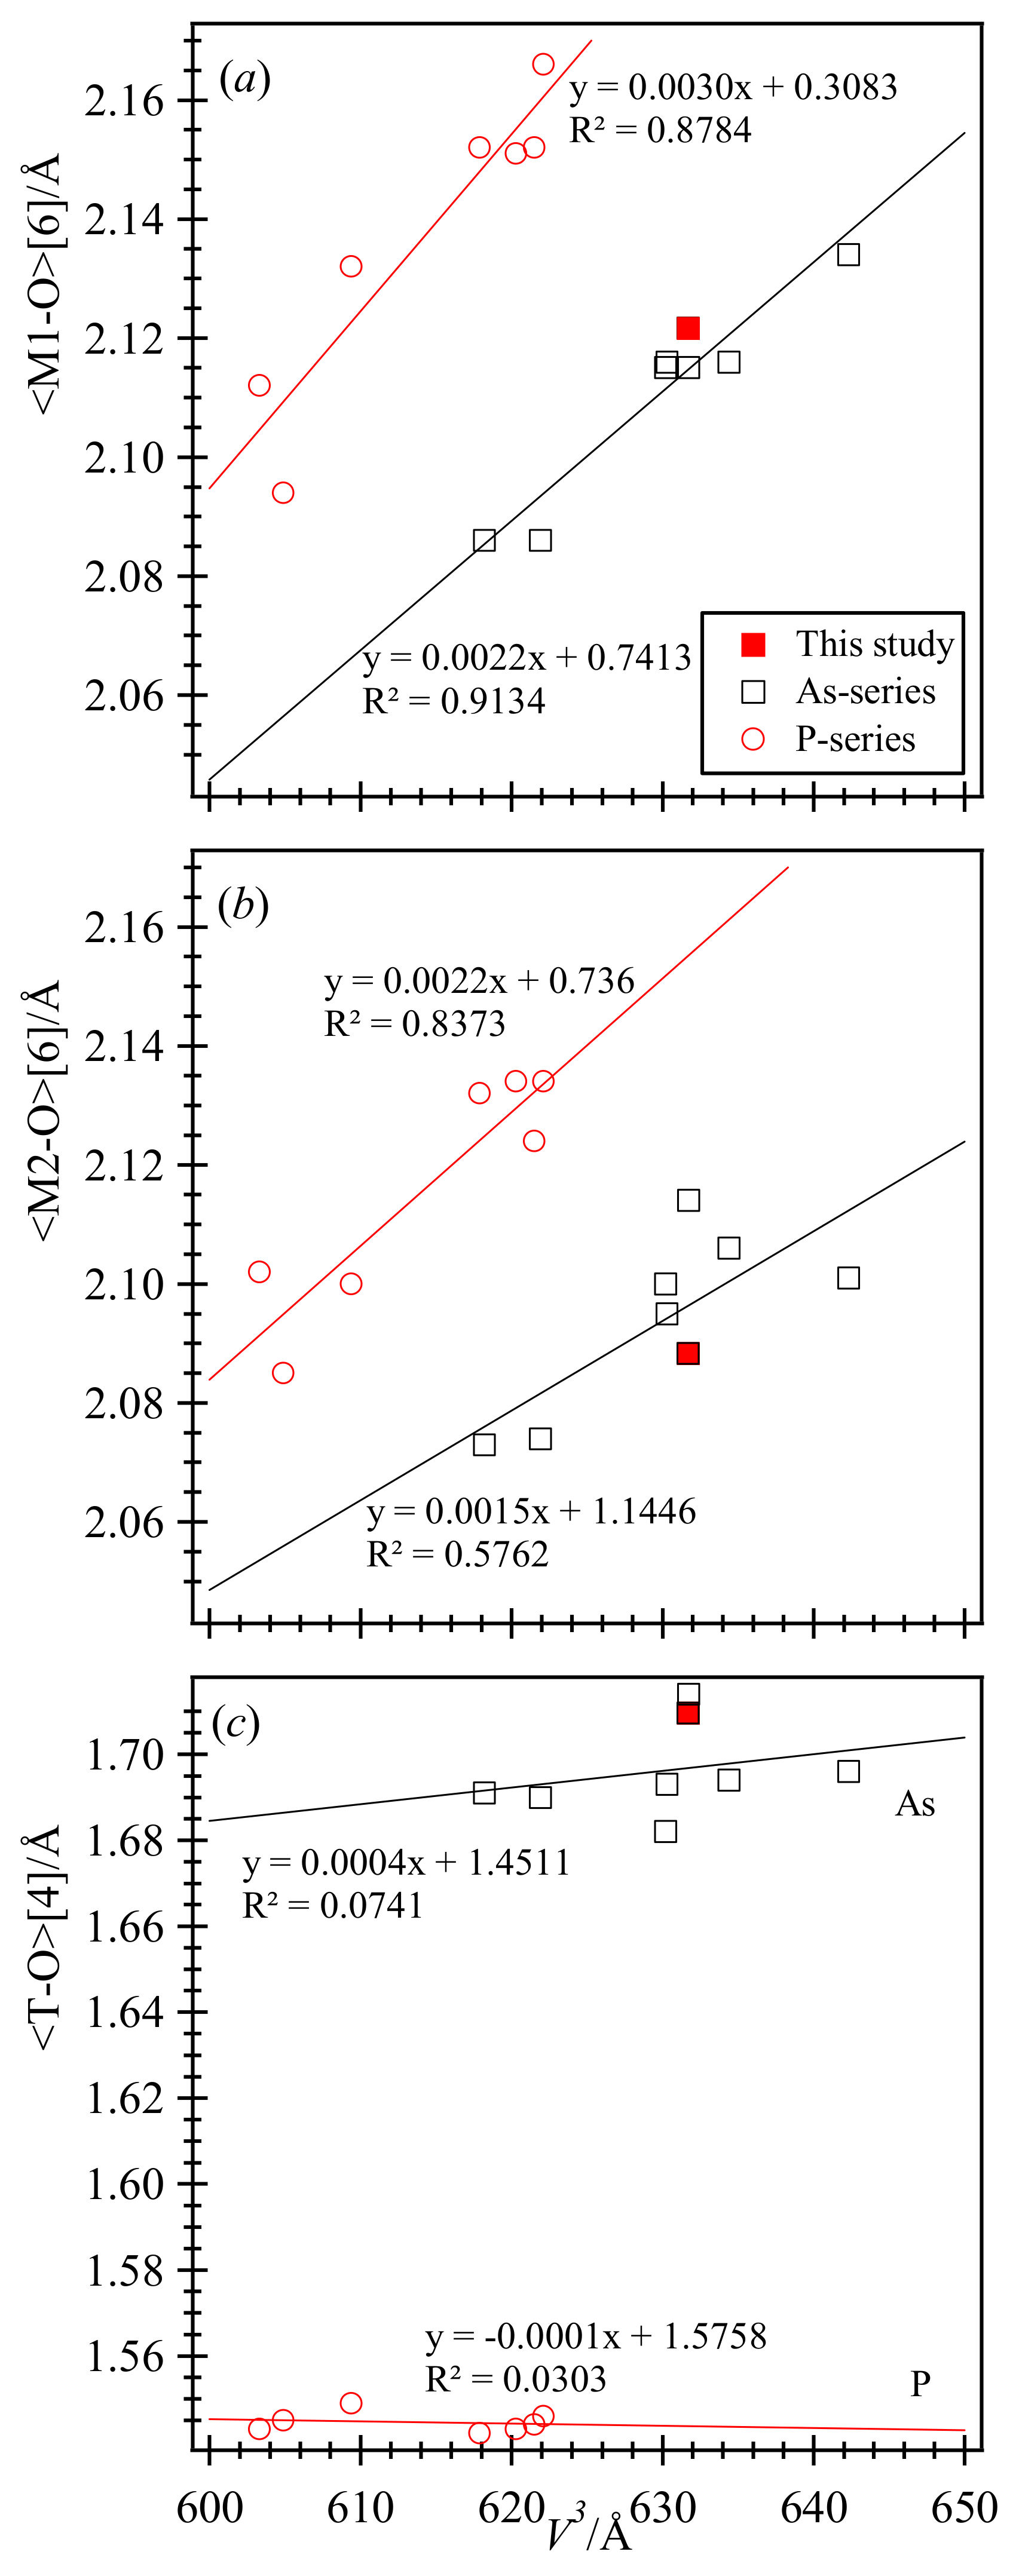
In these As- and P- solid solution series, their structural parameters evolve linearly with V and in a nearly parallel manner despite of the large difference in size between P5+ (0.170 Å) and As5+ (0.355 Å) cations. Average <T–O>[4], <M1–O>[6], and <M2–O>[6] distances increase linearly with V (Figure 7). However, the average <As–O> distance is affected by M atoms, whereas the average <P–O> distance is unaffected because it contains shorter and stronger P–O bonds (Figure 7c). Again, because the structural parameters occur in the two distinct groups, it is unlikely that solid solutions occur between the two distinct groups. From a structural point of view, solid solutions occur for the P- and As-series, but there is no reason why a similar V-series is not possible. However, synthetic samples for various joins are needed to fully characterize solid solutions in vivianite-group minerals.
Acknowledgments
We thank the three anonymous reviewers for useful comments that helped improve this manuscript. R. Marr is thanked for his help with the electron probe. The HRPXRD data were collected at the X-ray Operations and Research beamline 11-BM, Advanced Photon Source (APS), Argonne National Laboratory (ANL). Use of the APS was supported by the U.S. Department of Energy, Office of Science, Office of Basic Energy Sciences, under Contract No. DE-AC02-06CH11357. This work was supported with a NSERC Discovery Grant to Sytle M. Antao.
Author Contributions
I.D. performed the EPMA experiment and analyzed the chemical composition data. S.M.A. conceived the project, analyzed the HRPXRD data, and wrote the manuscript.
Conflicts of Interest
The authors declare no conflict of interest.
References
- Dai, Y.; Hughes, J.M. Crystal-structure refinements of vanadinite and pyromorphite. Can. Mineral. 1989, 27, 189–192. [Google Scholar]
- Laufek, F.; Skála, R.; Haloda, J.; Cisařová, I. Crystal structure of vanadinite: Refinement of anisotropic displacement parameters. J. Czech Geol. Soc. 2006, 51, 271–275. [Google Scholar]
- Okudera, H. Relationships among channel topology and atomic displacements in the structures of Pb5(BO4)3Cl with B = P (pyromorphite), V (vanadinite), and As (mimetite). Am. Mineral. 2013, 98, 1573–1579. [Google Scholar] [CrossRef]
- Wildner, M.; Giester, G.; Lengauer, C.L.; McCammon, C.A. Structure and crystal chemistry of vivianite-type compounds: Crystal structures of erythrite and annabergite with a Mössbauer study of erythrite. Eur. J. Mineral. 1996, 8, 187–192. [Google Scholar] [CrossRef]
- Giuseppetti, G.; Tadini, C. The crystal structure of cabrerite, (Ni,Mg)3(AsO4)2·8H2O, a variety of annabergite. Bull. Minéral. 1982, 105, 333–337. [Google Scholar]
- Hill, R.J. The crystal structure of köttigite. Am. Mineral 1979, 64, 376–382. [Google Scholar]
- Capitelli, F.; Elaatmani, M.; Lalaoui, M.D.; Piniella, J.F. Crystal structure of a vivianite-type mineral: Mg-rich erythrite, (Co2.16Ni0.24Mg0.60)(AsO4)2·8H2O. Z. Krist. 2007, 222, 676–679. [Google Scholar]
- Koritnig, S.; Süsse, P. Gitterkonstanten und Raumgrupp des Hörnesit, Mg3(AsO4)2·8H2O. Neues Jahrb. Mineral. Monatshefte 1966, 349–351. (In German) [Google Scholar]
- Rojo, J.M.; Mesa, J.L.; Pizarro, J.L.; Lezama, L.; Arriortua, M.I.; Rojo, T. Spectroscopic and magnetic study of the (Mg,M)3(AsO4)2·8H2O (M = Ni2+, Co2+) arsenates. Mater. Res. Bull. 1996, 31, 925–934. [Google Scholar] [CrossRef]
- Makreski, P.; Stefov, S.; Pejov, L.; Jovanovski, G. Theoretical and experimental study of the vibrational spectra of (para)symplesite and hörnesite. Spectrochim. Acta Part A Mol. Biomol. Spectrosc. 2015, 144, 155–162. [Google Scholar] [CrossRef] [PubMed]
- Yoshiasa, A.; Miyano, Y.; Isobe, H.; Sugiyama, K.; Arima, H.; Nakatsuka, A.; Momma, K.; Miyawaki, R. Structural refinement of köttigite-parasymplesite solid solution: Unique cation site occupancy and chemical bonding with water molecules. J. Mineral. Petrol. Sci. 2016, 111, 363–369. [Google Scholar] [CrossRef]
- Schmetzer, K.; Tremmel, G.; Bartelke, W. Paragenese seltener Minerale aus Bou-Azzer, Marokko; Parasymplesit, Symplesit, Schneiderhöhnit, Karibibit. Neues Jahrb. Mineral. Abh. 1980, 138, 94–108. [Google Scholar]
- Riou, A.; Cudennec, Y.; Gerault, Y. Cobalt(II) orthophosphate octahydrate. Acta Crystallogr. 1989, 45, 1412–1413. [Google Scholar] [CrossRef]
- Yakovenchuk, V.N.; Ivanyuk, G.Y.; Mikhailova, Y.A.; Selivanova, E.A. Pakhomovskyite, Co3(PO4)2·8H2O, a new mineral species from Kovdor, Kola Peninsula, Russia. Can. Mineral. 2006, 44, 117–123. [Google Scholar] [CrossRef]
- Takagi, S.; Mathew, M.; Brown, W.E. Crystal structures of bobierrite and synthetic Mg3(PO4)2·8H2O. Am. Mineral. 1986, 71, 1229–1233. [Google Scholar]
- Yakubovich, O.V.; Massa, W.; Liferovich, R.P.; McCammon, C.A. The crystal structure of baricite, (Mg1.70Fe1.30)(PO4)2·8H2O, the magnesium-dominant member of the vivianite group. Can. Mineral. 2001, 39, 1317–1324. [Google Scholar] [CrossRef]
- Fejdi, P.; Poullen, J.-F.; Gaspérin, M. Affmement de la structure de la vivianite Fe3(PO4)2·8H2O. Bull. Minéral. 1980, 103, 135–138. [Google Scholar]
- Capitelli, F.; Chita, G.; Ghiara, M.R.; Rossi, M. Crystal-chemical investigation of Fe3(PO4)2·8H2O vivianite minerals. Z. Krist. 2012, 227, 92–101. [Google Scholar] [CrossRef]
- Mori, H.; Ito, T. The structure of vivianite and symplesite. Acta Crystallogr. 1950, 3, 1–6. [Google Scholar] [CrossRef]
- Bartl, H. Water of crystallization and its hydrogen-bonded crosslinking in vivianite Fe3(PO4)2–8H2O; a neutron diffraction investigation. Fresenius Z. Anal. Chem. 1989, 333, 401–403. [Google Scholar] [CrossRef]
- Dormann, J.-L.; Gaspérin, M.; Poullen, J.-F. Étude structurale de la séquence d'oxydation de la vivianite Fe3(PO4)2·8H2O. Bull. Minéral. 1982, 105, 147–160. (In French) [Google Scholar]
- Antao, S.M.; Duane, M.J.; Hassan, I. DTA, TG, and XRD studies of sturmanite and ettringite. Can. Mineral. 2002, 40, 1403–1409. [Google Scholar] [CrossRef]
- Antao, S.M.; Hassan, I. Thermal analyses of sodalite, tugtupite, danalite, and helvite. Can. Mineral. 2002, 40, 163–172. [Google Scholar] [CrossRef]
- Ehm, L.; Antao, S.M.; Chen, J.H.; Locke, D.R.; Michel, F.M.; Martin, C.D.; Yu, T.; Parise, J.B.; Lee, P.L.; Chupas, P.J.; et al. Studies of local and intermediate range structure in crystalline and amorphous materials at high pressure using high-energy X-rays. Powder Diffr. 2007, 22, 108–112. [Google Scholar] [CrossRef]
- Parise, J.B.; Antao, S.M.; Martin, C.D.; Crichton, W.A. Diffraction studies of order–disorder at high pressures and temperatures. Powder Diffr. 2005, 20, 80–86. [Google Scholar] [CrossRef]
- Skinner, L.B.; Benmore, C.J.; Antao, S.M.; Soignard, E.; Amin, S.A.; Bychkov, E.; Rissi, E.; Parise, J.B.; Yarger, J.L. Structural changes in vitreous GeSe4 under pressure. J. Phys. Chem. C 2011, 116, 2212–2217. [Google Scholar] [CrossRef]
- Antao, S.M.; Hassan, I.; Wang, J.; Lee, P.L.; Toby, B.H. State-of-the-art high-resolution powder X-ray diffraction (HRPXRD) illustrated with Rietveld structure refinement of quartz, sodalite, tremolite, and meionite. Can. Mineral. 2008, 46, 1501–1509. [Google Scholar] [CrossRef]
- Lee, P.L.; Shu, D.; Ramanathan, M.; Preissner, C.; Wang, J.; Beno, M.A.; Von Dreele, R.B.; Ribaud, L.; Kurtz, C.; Antao, S.M.; et al. A twelve-analyzer detector system for high-resolution powder diffraction. J. Synchrotron Radiat. 2008, 15, 427–432. [Google Scholar] [CrossRef] [PubMed]
- Wang, J.; Toby, B.H.; Lee, P.L.; Ribaud, L.; Antao, S.M.; Kurtz, C.; Ramanathan, M.; Von Dreele, R.B.; Beno, M.A. A dedicated powder diffraction beamline at the advanced photon source: Commissioning and early operational results. Rev. Sci. Instrum. 2008, 79, 085105. [Google Scholar] [CrossRef] [PubMed]
- Rietveld, H.M. A profile refinement method for nuclear and magnetic structures. J. Appl. Crystallogr. 1969, 2, 65–71. [Google Scholar] [CrossRef]
- Larson, A.C.; Von Dreele, R.B. General Structure Analysis System (GSAS); Los Alamos National Laboratory Report, LAUR 86-748; Los Alamos National Laboratory: Los Alamos, NM, USA, 2000.
- Toby, B.H. EXPGUI, a graphical user interface for GSAS. J. Appl. Crystallogr. 2001, 34, 210–221. [Google Scholar] [CrossRef]
- Cagliotti, G.; Paoletti, A.; Ricci, F.P. Choice of collimators for a crystal spectrometer for neutron diffraction. Nucl. Instrum. 1958, 3, 223–228. [Google Scholar] [CrossRef]
- Thompson, P.; Cox, D.E.; Hastings, J.B. Rietveld refinement of Debye-Scherrer synchrotron X-ray data from alumina. J. Appl. Crystallogr. 1987, 20, 79–83. [Google Scholar] [CrossRef]
- Wills, A.S.; Brown, I.D. VaList. CEA, France. This Is a Freely Available Computer Program. 1999. Available online: http://www.ccp14.ac.uk/solution/bond_valence/ (accessed on 2 August 2017).
- Shore, M.; Fowler, A.D. Oscillatory zoning in minerals: A common phenomenon. Can. Mineral. 1996, 34, 1111–1126. [Google Scholar]
- Antao, S.M. Three cubic phases intergrown in a birefringent andradite-grossular garnet and their implications. Phys. Chem. Miner. 2013, 40, 705–716. [Google Scholar] [CrossRef]
- Antao, S.M. Can birefringent near-endmember grossular be non-cubic? New evidence from synchrotron diffraction. Can. Mineral. 2013, 51, 771–784. [Google Scholar] [CrossRef]
- Antao, S.M. Crystal structure of morimotoite from Ice River, Canada. Powder Diffr. 2014, 29, 325–330. [Google Scholar] [CrossRef]
- Antao, S.M. Crystal chemistry of birefringent hydrogrossular. Phys. Chem. Miner. 2015, 42, 455–474. [Google Scholar] [CrossRef]
- Antao, S.M.; Klincker, A.M. Origin of birefringence in andradite from Arizona, Madagascar, and Iran. Phys. Chem. Miner. 2013, 40, 575–586. [Google Scholar] [CrossRef]
- Antao, S.M.; Klincker, A.M. Crystal structure of a birefringent andradite-grossular from Crowsnest Pass, Alberta, Canada. Powder Diffr. 2014, 29, 20–27. [Google Scholar] [CrossRef]
- Antao, S.M.; Round, S.A. Crystal chemistry of birefringent spessartine. Powder Diffr. 2014, 29, 233–240. [Google Scholar] [CrossRef]
- Antao, S.M. The mystery of birefringent garnet: Is the symmetry lower than cubic? Powder Diffr. 2013, 28, 281–288. [Google Scholar] [CrossRef]
- Antao, S.M.; Cruickshank, L.A. Two cubic phases in kimzeyite garnet from the type locality Magnet Cove, Arkansas. Acta Crystallogr. 2016, 72, 846–854. [Google Scholar] [CrossRef] [PubMed]
- Antao, S.M.; Mohib, S.; Zaman, M.; Marr, R.A. Ti-rich andradites: Chemistry, structure, multi-phases, optical anisotropy, and oscillatory zoning. Can. Mineral. 2015, 53, 133–158. [Google Scholar] [CrossRef]
- Antao, S.M.; Zaman, M.; Gontijo, V.L.; Camargo, E.S.; Marr, R.A. Optical anisotropy, zoning, and coexistence of two cubic phases in andradites from Quebec and New York. Contrib. Mineral. Petrol. 2015, 169. [Google Scholar] [CrossRef]
- Antao, S.M.; Hassan, I. A two-phase intergrowth of genthelvite from Mont Saint-Hilaire, Quebec. Can. Mineral. 2010, 48, 1217–1223. [Google Scholar] [CrossRef]
- Shannon, R.D. Revised effective ionic radii and systematic studies of interatomic distances in halides and chalcogenides. Acta Crystallogr. 1976, 32, 751–767. [Google Scholar] [CrossRef]
Figure 1.
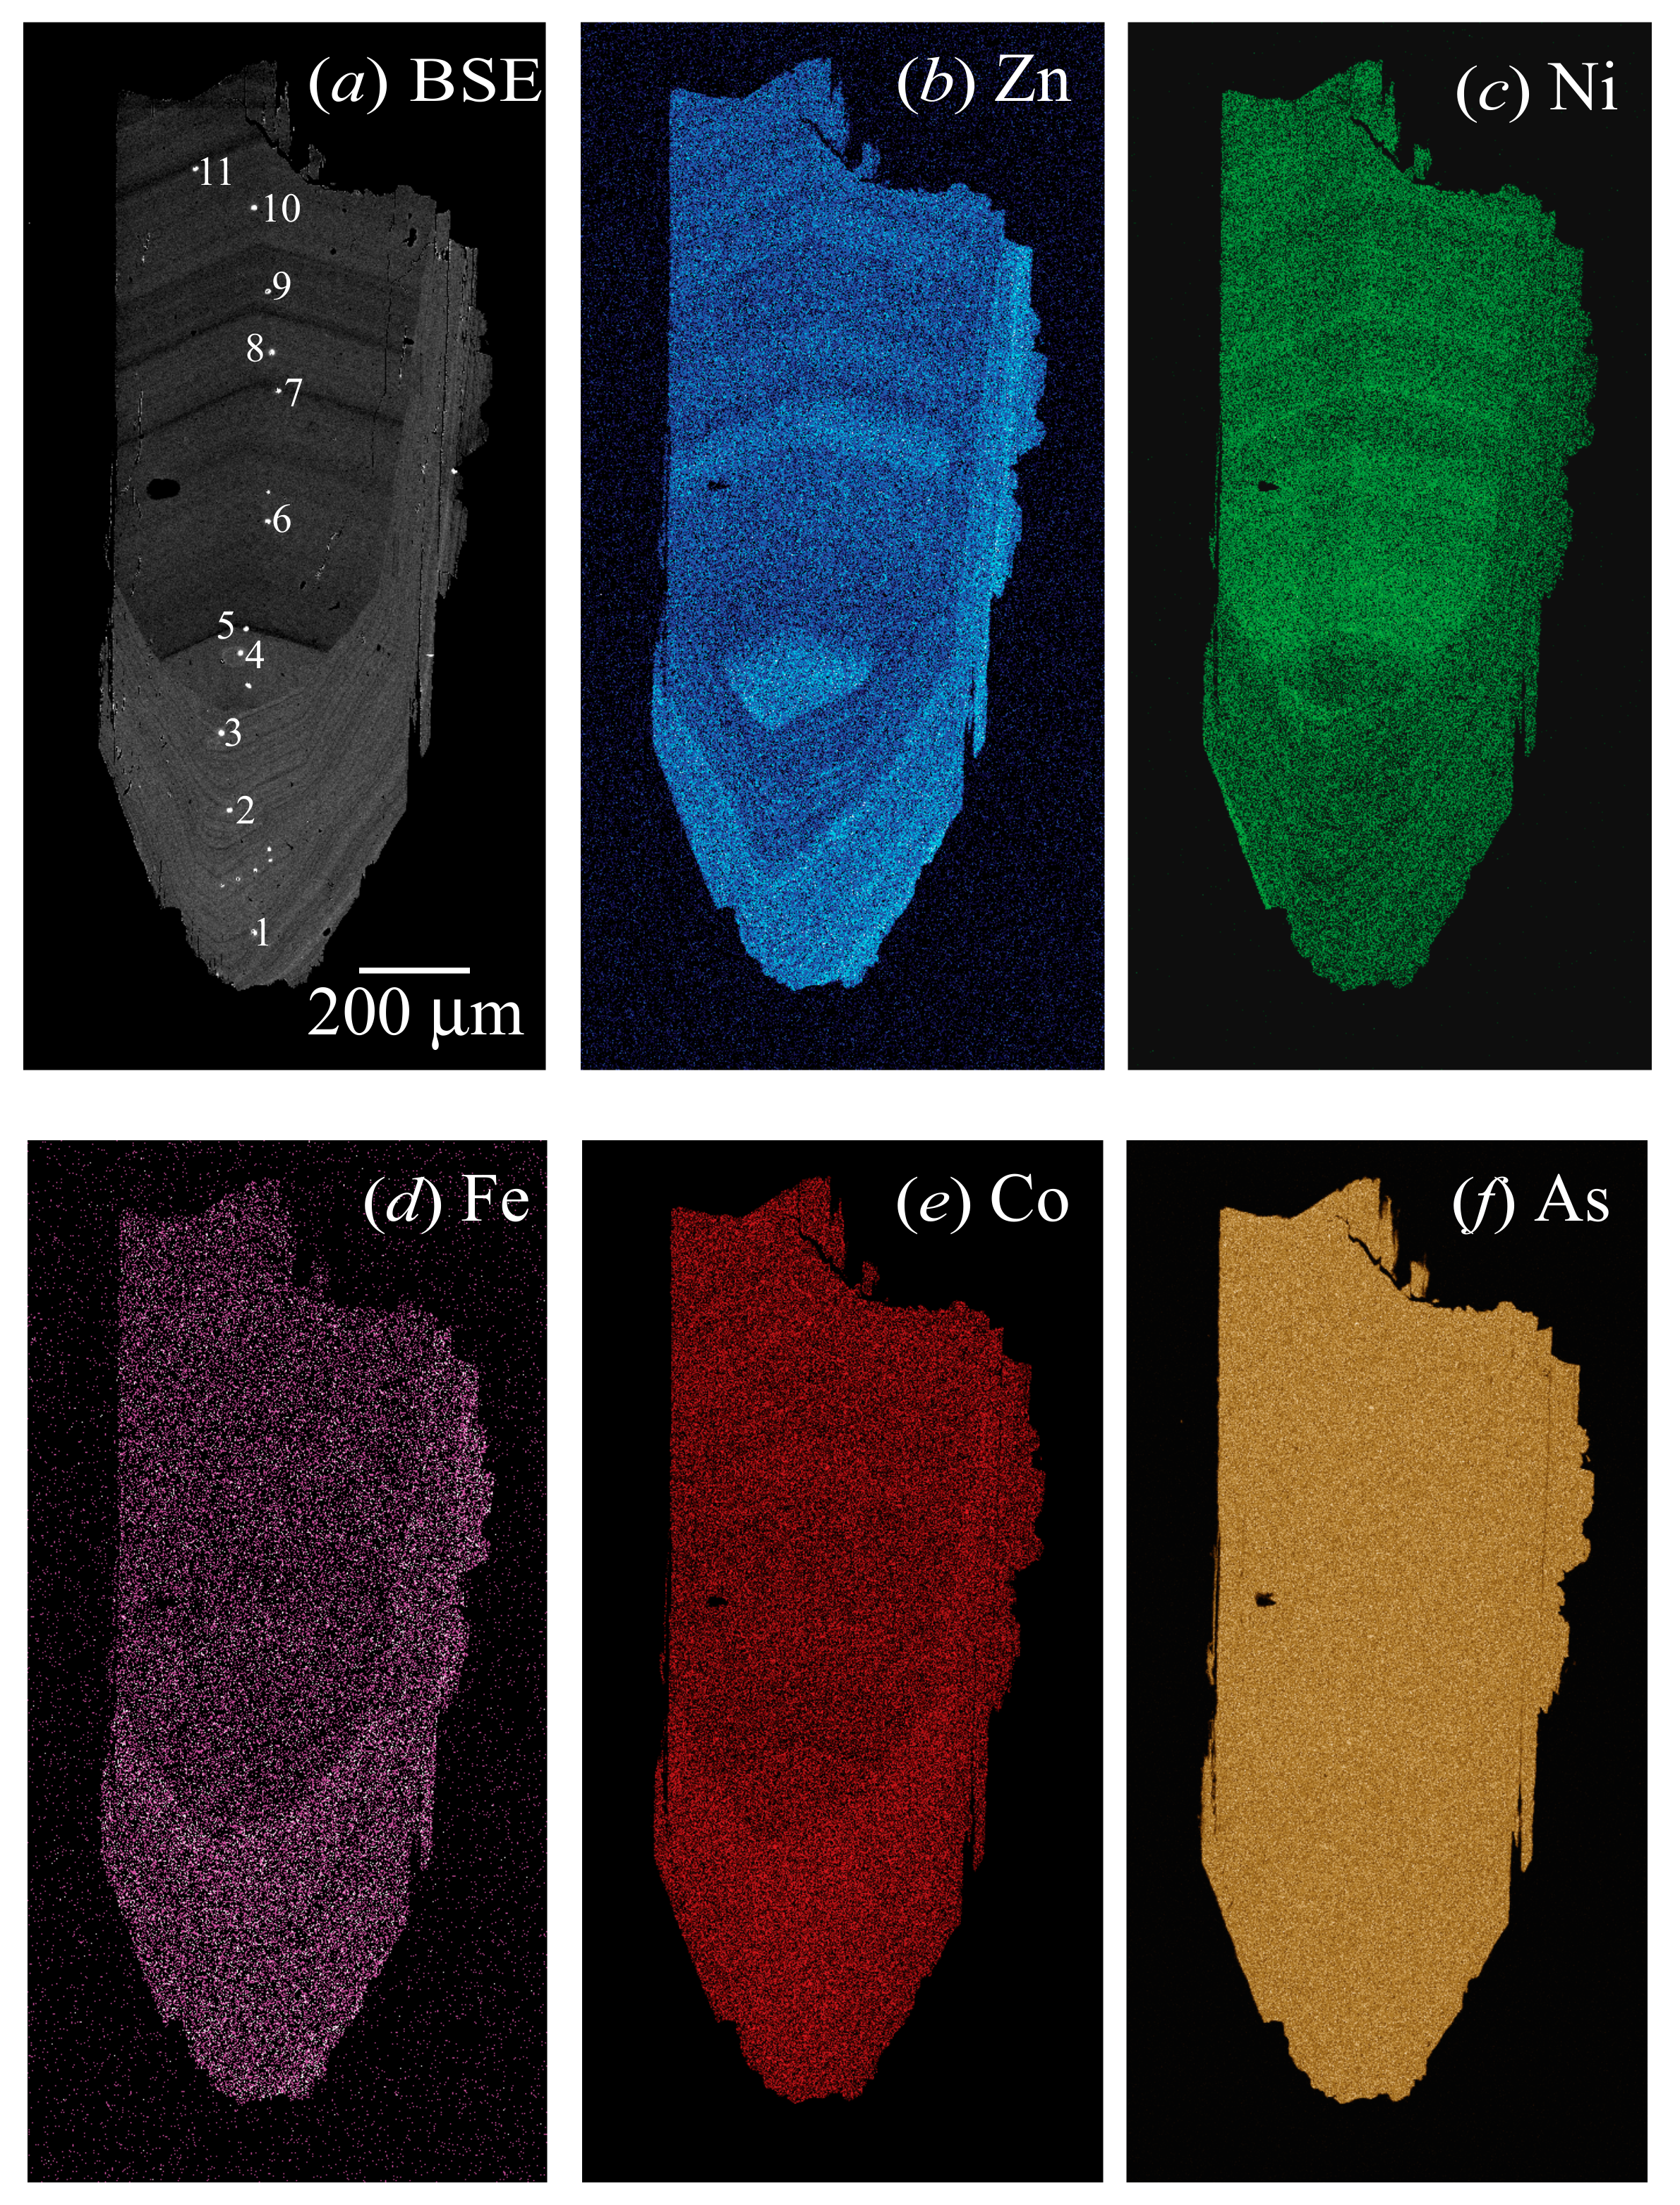
Back-scattered electron (BSE) image and elemental maps of erythrite showing two sets of chemically zoned features that arise from crystal growth over two separate periods of time. (a) One set of dark and light oscillatory zoning occurs across the crystal and they point towards the top of the image. The second set of oscillatory zoning occurs around the pointed tip of the crystal and goes around the edges. These point to the bottom of the image and were formed after the first set. The eleven points (1 to 11) from where quantitative analyses were obtained are indicated by the number next to the burnt spots. The elemental maps of (b) Zn, (c) Ni, (d) Fe, and (e) Co atoms show their inhomogeneous distributions, whereas a homogeneous distribution occurs for (f) As atom.
Figure 1.
Back-scattered electron (BSE) image and elemental maps of erythrite showing two sets of chemically zoned features that arise from crystal growth over two separate periods of time. (a) One set of dark and light oscillatory zoning occurs across the crystal and they point towards the top of the image. The second set of oscillatory zoning occurs around the pointed tip of the crystal and goes around the edges. These point to the bottom of the image and were formed after the first set. The eleven points (1 to 11) from where quantitative analyses were obtained are indicated by the number next to the burnt spots. The elemental maps of (b) Zn, (c) Ni, (d) Fe, and (e) Co atoms show their inhomogeneous distributions, whereas a homogeneous distribution occurs for (f) As atom.

Figure 2.
Distribution of the atoms from the eleven points from where quantitative analyses were obtained (see Figure 1a). The dominant Co atom varies the most and is correlated with the minor atoms so that their sum is 3. The amount of As atom is constant throughout the crystal (not shown; see Figure 1f).
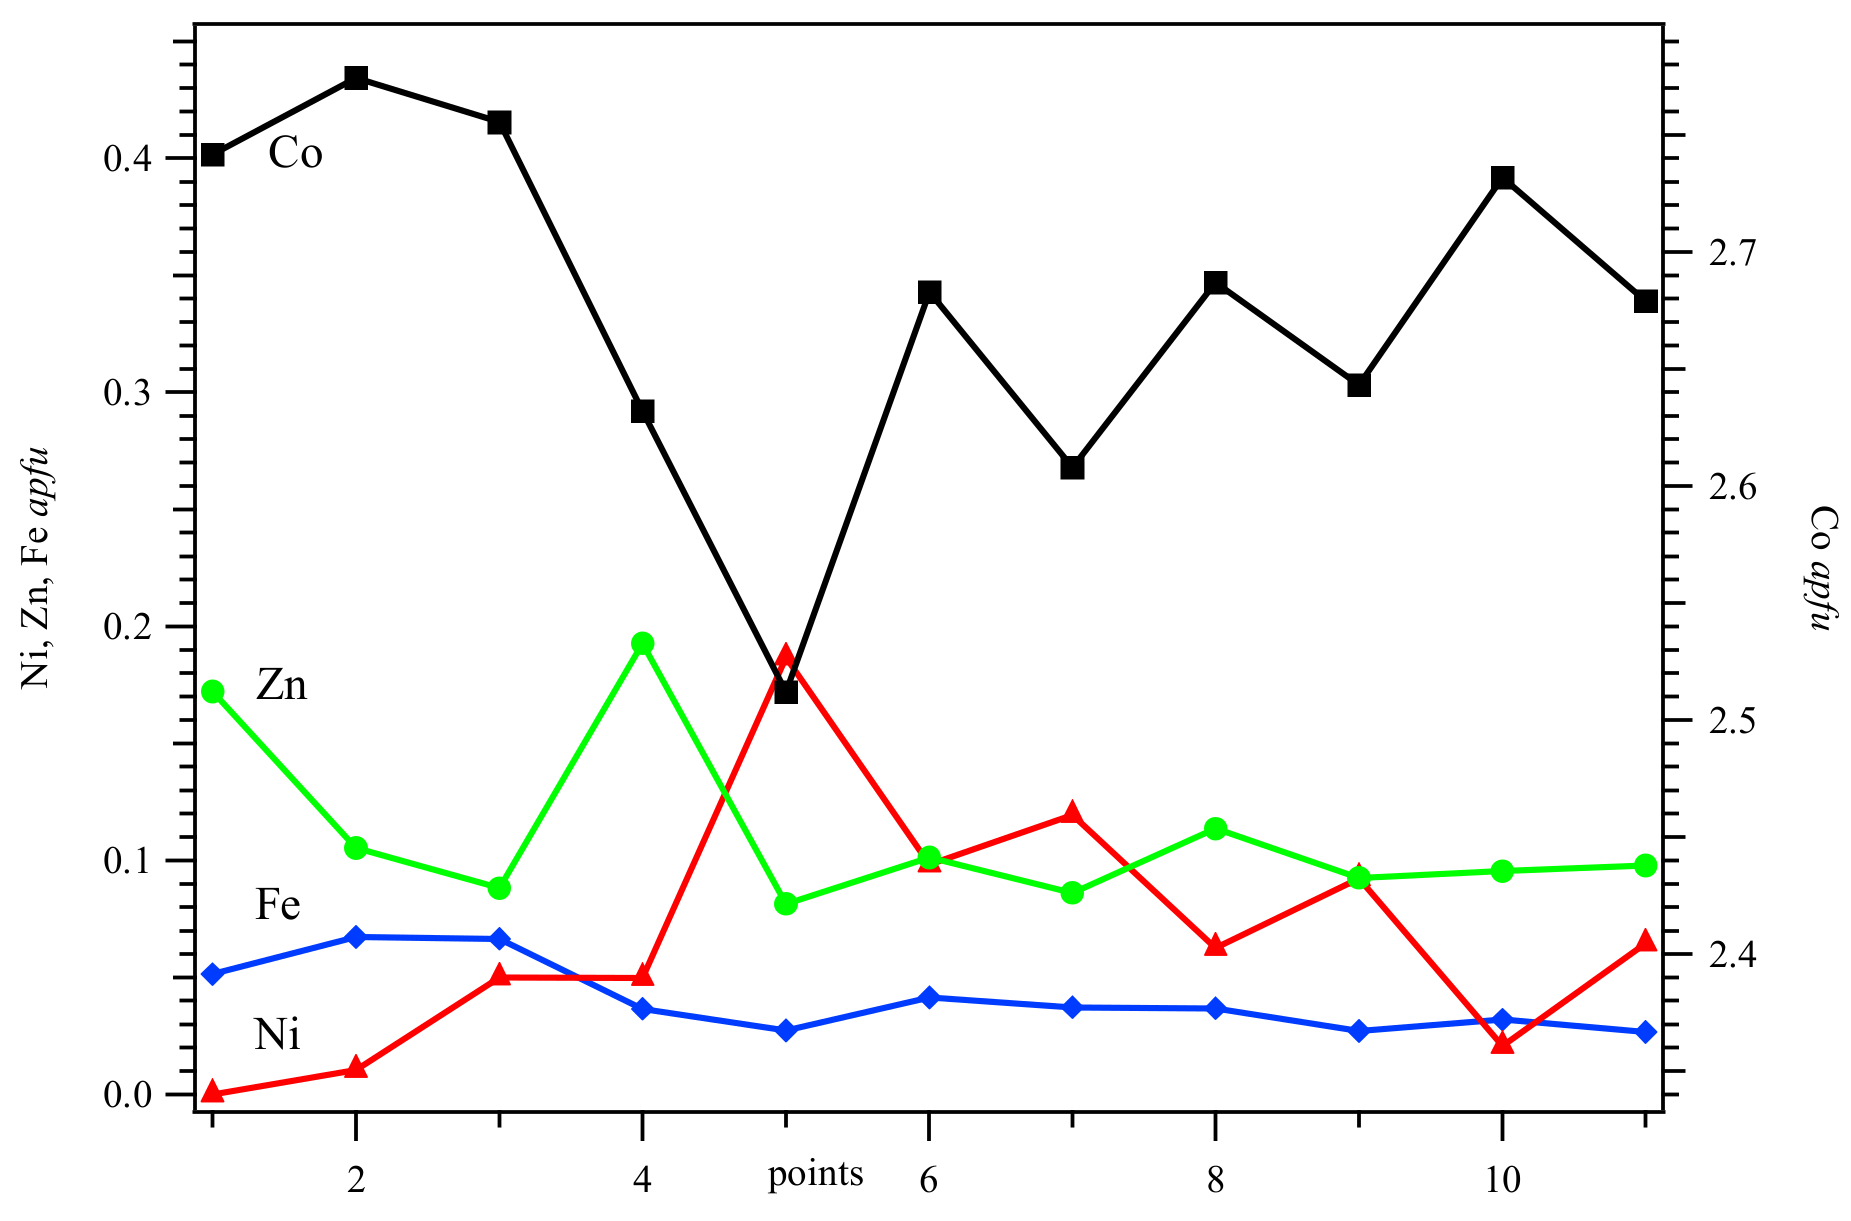
Figure 3.
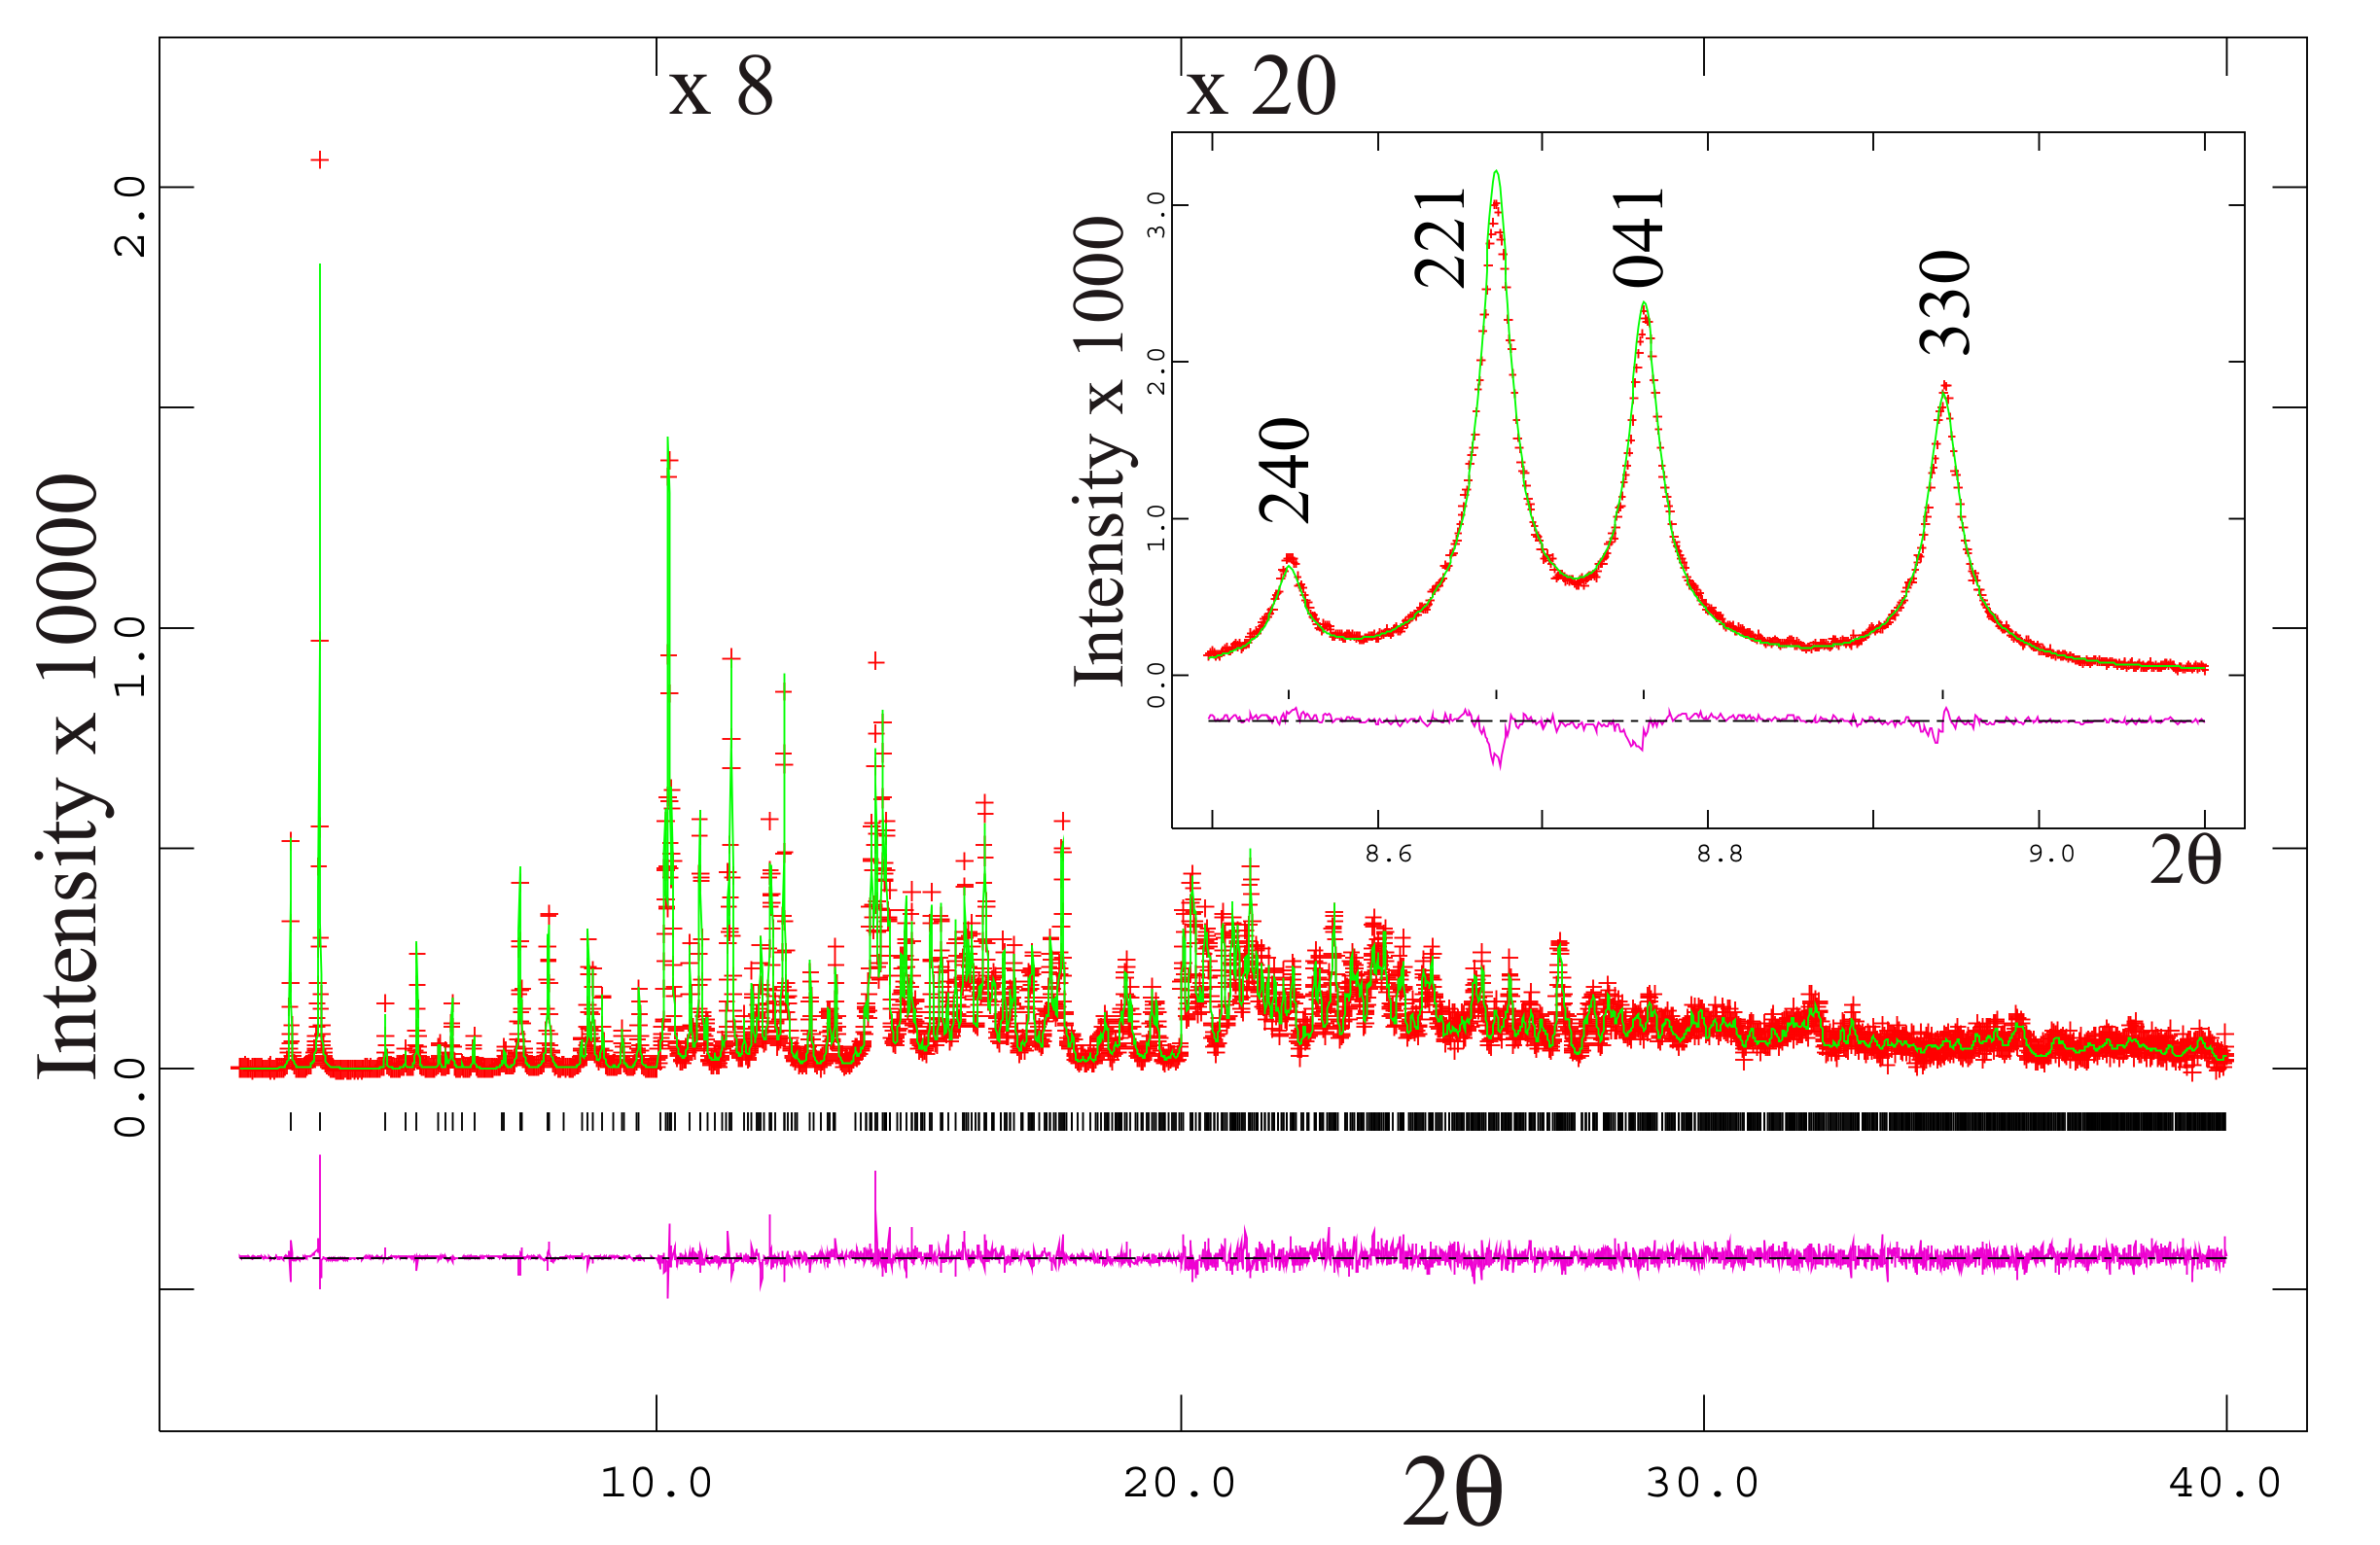
The HRPXRD trace at 23 °C for erythrite together with the calculated (continuous line) and observed (crosses) profiles. The difference curve (Iobs–Icalc) with the same intensity scale is shown at the bottom of the trace. Short vertical lines indicate allowed reflection positions. The intensities for the trace and difference curve that are above 10° and 20° 2θ are multiplied by 8 and 20, respectively. An expanded scale of the low-angle region is shown as an insert. The peaks are sharp and contain no splitting. Beyond 40° 2θ, the diffraction peaks are very weak.
Figure 3.
The HRPXRD trace at 23 °C for erythrite together with the calculated (continuous line) and observed (crosses) profiles. The difference curve (Iobs–Icalc) with the same intensity scale is shown at the bottom of the trace. Short vertical lines indicate allowed reflection positions. The intensities for the trace and difference curve that are above 10° and 20° 2θ are multiplied by 8 and 20, respectively. An expanded scale of the low-angle region is shown as an insert. The peaks are sharp and contain no splitting. Beyond 40° 2θ, the diffraction peaks are very weak.

Figure 4.
Difference Fourier maps for erythrite showing the residual density after the H atoms were removed from the structural model. The contour interval is 0.09 eÅ−3 (black = 0.09, red = 0.18, blue = 0.27, and green = 0.36 electrons). The refined positions of some H and O atoms are labelled. After the H atoms were included in the refinement, the residual electron density was greatly reduced (not shown).

Figure 5.
(a) Crystal structure of erythrite. (b) Isolated M1 octahedron (green). (c) One edge-sharing double M2 octahedra (yellow). The AsO4 tetrahedra (grey), M1 and M2 octahedra form complex sheets parallel to the (010) plane and interconnected by hydrogen bonds. All H atoms are indicated by red spheres.
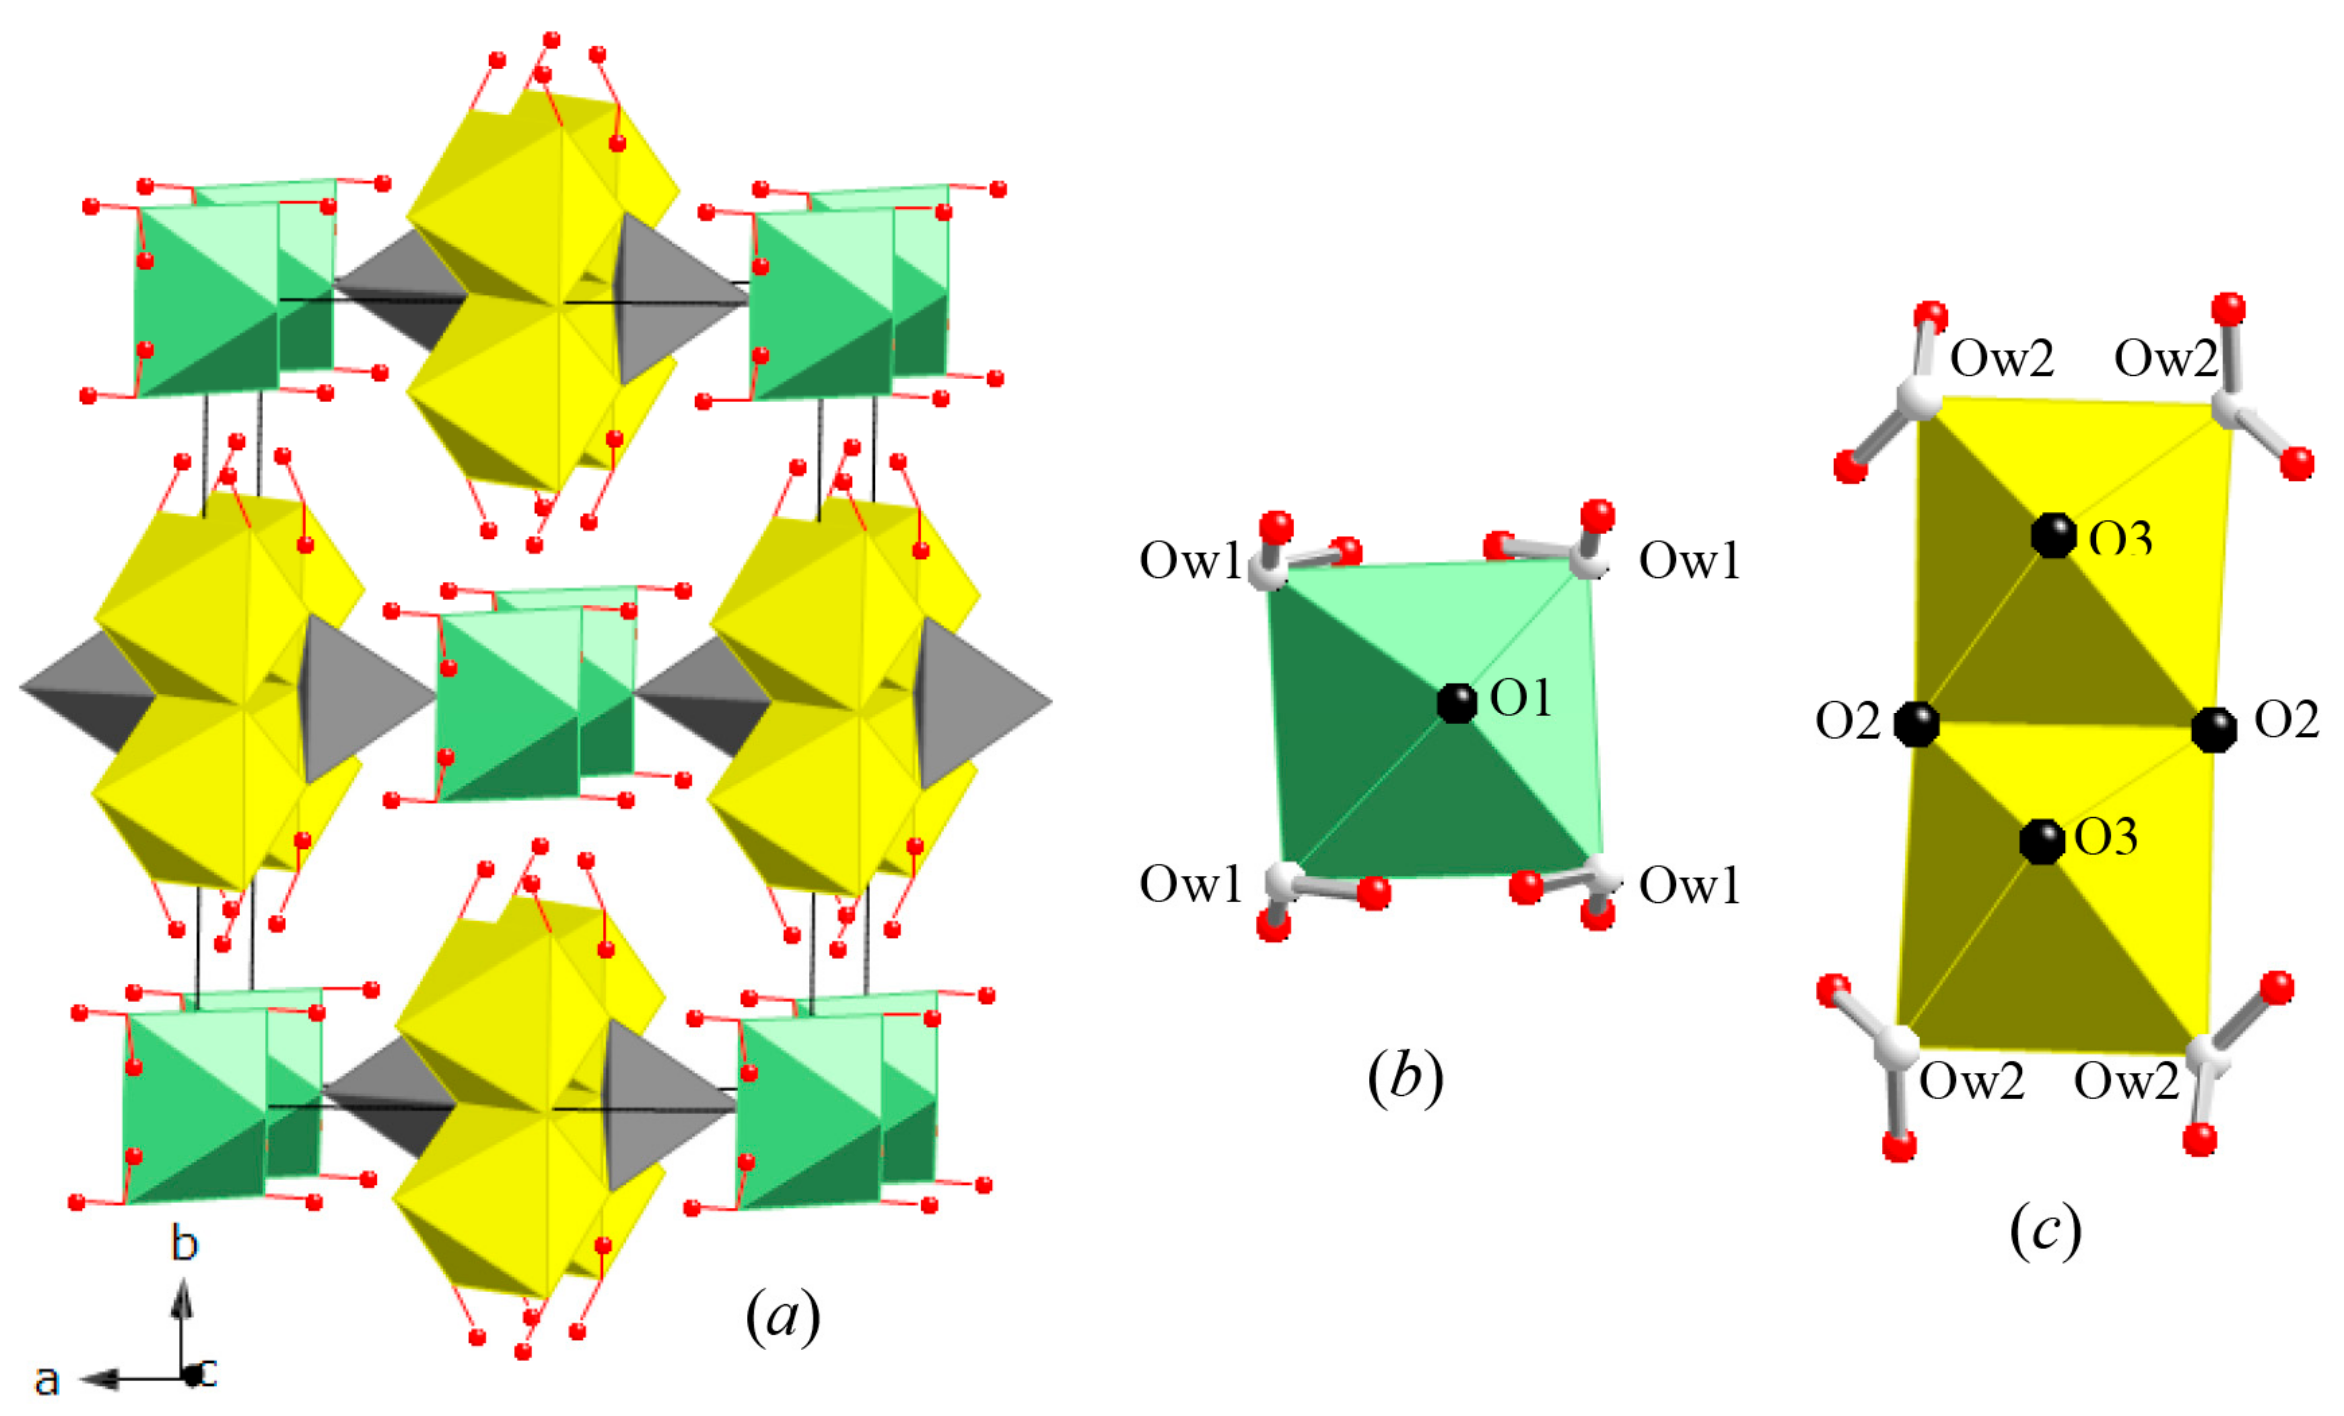
Figure 6.
Linear relations among unit-cell parameters in the As- and P-series vivianite-group minerals. (a) Sub-parallel relation between a and V. (b) Parallel relation between b and V. (c) Nearly parallel relations between c and V. (d) The β angle increases only slightly with V in the As-series, whereas it decreases in the P-series. Unit-cell data from the literature are given in Table 1.

Figure 7.
Linear variations of structural parameters in the As- and P-series vivianite-group minerals. Both the average (a) <M1–O>[6] and (b) <M2–O>[6] distances increases linearly with V and they are sub-parallel in the As- and P-series. (c) The short average <P–O>[4] distance is constant with V, whereas the larger <As–O> increases linearly with V because it is affected by the interstitial M cations. Structural data from the literature are given in Table 1.


Table 1.
Structural data for vivianite-group minerals with space group C2/m (listed with increasing V in each series).
Table 1.
Structural data for vivianite-group minerals with space group C2/m (listed with increasing V in each series).
| Mineral | Composition | a/Å | b/Å | c/Å | β/° | V/Å3 | <M1–O> | <M2–O> | <T–O> | Reference |
|---|---|---|---|---|---|---|---|---|---|---|
| As-series | M3(AsO4)2·8H2O: M = | |||||||||
| annabergite | [Ni2.48Mg0.50Fe0.02] | 10.179 | 13.309 | 4.725 | 105.00 | 618.2 | 2.086 | 2.073 | 1.691 | [4] |
| cabrerite | [Ni2.2Mg0.7Fe0.1]3 | 10.211 | 13.335 | 4.728 | 104.97 | 621.9 | 2.086 | 2.074 | 1.690 | [5] |
| köttigite | [Zn2.44Co0.42Ni0.14] | 10.241 | 13.405 | 4.757 | 105.21 | 630.2 | 2.115 | 2.100 | 1.682 | [6] |
| Mg-erythrite | [Co2.16Mg0.60Ni0.24] | 10.187 | 13.470 | 4.755 | 104.97 | 630.3 | 2.116 | 2.095 | 1.693 | [7] |
| hörnesite | Mg3 | 10.26 | 13.44 | 4.74 | 104.90 | 631.6 | - | - | - | [8] |
| erythrite | [Co2.78Zn0.11Ni0.07Fe0.04] | 10.248 | 13.425 | 4.756 | 105.11 | 631.7 | 2.122 | 2.088 | 1.710 | This study |
| syn. hörnesite-annabergite ss | [Mg2.5Ni0.5] | 10.257 | 13.421 | 4.753 | 105.08 | 631.7 | 2.115 | 2.114 | 1.714 | [9] |
| hörnesite | Mg3 | 10.279 | 13.455 | 4.749 | 105.12 | 634.1 | - | - | - | [10] |
| erythrite | [Co2.01Fe0.74Ni0.25] | 10.251 | 13.447 | 4.764 | 104.98 | 634.4 | 2.116 | 2.106 | 1.694 | [4] |
| köttigite-parasymplesite ss | [Fe1.62Zn1.38] | 10.342 | 13.484 | 4.776 | 105.31 | 642.3 | 2.134 | 2.101 | 1.696 | [11] |
| parasymplesite | Fe3 | 10.35 | 13.52 | 4.79 | 104.90 | 647.7 | - | - | - | [12] |
| P-series | M3(PO4)2·8H2O: M = | |||||||||
| syn. pakhomovskyite | Co3 | 10.021 | 13.331 | 4.673 | 104.90 | 603.3 | 2.112 | 2.102 | 1.543 | [13] |
| pakhomovskyite | Co2.38Mg0.38Mn0.17Ni0.04Fe0.03 | 10.034 | 13.341 | 4.670 | 105.02 | 603.8 | - | - | - | [14] |
| syn. Mg-vivianite | Mg3 | 10.034 | 13.407 | 4.657 | 105.09 | 604.9 | 2.094 | 2.085 | 1.545 | [15] |
| barićite | [Mg1.70Fe2+1.19Fe3+0.11] | 10.085 | 13.39 | 4.671 | 104.96 | 609.4 | 2.132 | 2.100 | 1.549 | [16] |
| vivianite | Fe3 | 10.086 | 13.441 | 4.703 | 104.27 | 617.9 | 2.152 | 2.132 | 1.542 | [17] |
| vivianite | [Fe2.75Zn0.25] | 10.083 | 13.468 | 4.718 | 104.47 | 620.3 | 2.151 | 2.134 | 1.543 | [18] |
| vivianite | Fe3 | 10.116 | 13.473 | 4.706 | 104.33 | 621.5 | 2.152 | 2.124 | 1.544 | [18] |
| vivianite | [Fe2.88Mg0.12] | 10.1 | 13.494 | 4.709 | 104.24 | 622.1 | 2.166 | 2.134 | 1.546 | [18] |
syn. = synthetic, ss = solid solution.
Table 2.
Chemical analyses for erythrite.
| As2O5 wt % | 38.39 |
| SO3 | 0.06 |
| P2O5 | 0.00 |
| CoO | 34.89 |
| ZnO | 1.50 |
| NiO | 0.84 |
| FeO | 0.49 |
| MgO | 0.00 |
| H2O | 22.10 |
| ∑ | 98.25 |
| As apfu | 1.996 |
| S | 0.004 |
| P | 0.000 |
| ∑(As,S,P) | 2.000 |
| Co | 2.782 |
| Zn | 0.110 |
| Ni | 0.067 |
| Fe | 0.040 |
| Mg | 0.000 |
| ∑(Co,Zn,Ni,Fe,Mg) | 3.000 |
| H2O | 8.000 |
The atom per formula unit (apfu) were calculated on basis of 5 metal atoms. H2O was fixed to 8. The chemical formula is [Co2.78Zn0.11Ni0.07Fe0.04]∑3.00(AsO4)2·8H2O.
Table 3.
HRPXRD data and Rietveld refinement statistical indicators for erythrite.
| a/Å | 10.24799(3) |
| b/Å | 13.42490(7) |
| c/Å | 4.755885(8) |
| β/° | 105.1116(3) |
| V/Å3 | 631.680(4) |
| Reduced χ2 | 1.227 |
| * R (F2) | 0.0313 |
| Data points | 38000 |
| Nobs | 3654 |
| λ/Å | 0.41397(2) |
* R (F2) = Overall R-structure factor based on observed and calculated structure amplitudes = [∑(Fo2 − Fc2)/∑(Fo2)]1/2. 2θ range = 2.5–40.0°.
Table 4.
Atom coordinates, isotropic displacement parameters (U × 102 Å2), and sofs.
| Site | sof | x | y | z | U |
|---|---|---|---|---|---|
| Co1 | 1.028(2) | 0 | 0 | 0 | 0.82(2) |
| Co2 | 0.912(2) | 0 | 0.38554(5) | 0 | 0.55(2) |
| As | 1 | 0.31639(5) | 0 | 0.3739(1) | 0.41(2) |
| O1 | 1 | 0.1489(3) | 0 | 0.3759(6) | 0.55(8) |
| O2 | 1 | 0.4055(3) | 0 | 0.7336(6) | 1.02(9) |
| O3 | 1 | 0.3437(2) | 0.1076(2) | 0.2091(4) | 0.70(5) |
| Ow1 | 1 | 0.0987(2) | 0.1151(2) | 0.8094(5) | 1.38(7) |
| Ow2 | 1 | 0.4000(2) | 0.2269(2) | 0.7163(5) | 1.51(7) |
| H11 | 1 | 0.088(2) | 0.076(2) | 0.686(5) | 0.3 |
| H12 | 1 | 0.187(2) | 0.121(2) | 0.946(5) | 0.3 |
| H21 | 1 | 0.377(2) | 0.185(2) | 0.528(5) | 0.3 |
| H22 | 1 | 0.437(3) | 0.277(2) | 0.701(5) | 0.3 |
Table 5.
Selected distances (Å) and angles (°) for erythrite.
| Co1–O1 | ×2 | 2.025(3) |
| Co1–Ow1 | ×4 | 2.170(2) |
| <Co1–O>[6] | 2.122(1) | |
| Co2–O2 | ×2 | 2.065(2) |
| Co2–O3 | ×2 | 2.096(2) |
| Co2–Ow2 | ×2 | 2.104(2) |
| <Co2–O>[6] | 2.088(1) | |
| As–O1 | ×1 | 1.719(3) |
| As–O2 | ×1 | 1.716(3) |
| As–O3 | ×2 | 1.702(2) |
| <As–O>[4] | 1.710(1) | |
| O1–As–O2 | ×1 | 105.5(1) |
| O1–As–O3 | ×2 | 106.69(8) |
| O2–As–O3 | ×2 | 110.50(7) |
| O3–As–O3 | ×1 | 116.3(1) |
| <O–As–O>[6] | 109.36(3) | |
| Ow1–H11 | 0.77(2) | |
| Ow1–H12 | 0.97(2) | |
| H11–Ow1–H12 | 119.3(2) | |
| H11–H12 | 1.51(3) | |
| H11....O1 | 2.02(2) | |
| H12....O3 | 1.77(2) | |
| Ow2–H21 | 1.03(2) | |
| Ow2–H22 | 0.78(2) | |
| H21–Ow2–H22 | 113.1(2) | |
| H21–H22 | 1.52(3) | |
| H21....O3 | 1.80(2) | |
| H22....Ow1 | 2.16(2) |
Table 6.
Bond-valence sum (BVS; v.u.) for erythrite.
| Site | As | Co1 | Co2 | H11 | H12 | H21 | H22 | ∑(As,Co,H) |
|---|---|---|---|---|---|---|---|---|
| O1 | 1.139 | 0.414 | 0.213 | 1.979 | ||||
| O1 | 0.414 | |||||||
| O2 | 1.148 | 0.377 | 1.902 | |||||
| O2 | 0.377 | |||||||
| O3 | 1.192 | 0.350 | 0.279 | 0.271 | 2.092 | |||
| O3 | 1.192 | 0.350 | ||||||
| Ow1 | 0.293 | 0.806 | 0.653 | 0.184 | 1.936 | |||
| Ow1 | 0.293 | |||||||
| Ow1 | 0.293 | |||||||
| Ow1 | 0.293 | |||||||
| Ow2 | 0.343 | 0.612 | 0.797 | 1.752 | ||||
| Ow2 | 0.343 | |||||||
| ∑ | 4.671 | 2.000 | 2.140 | 1.019 | 0.932 | 0.883 | 0.981 |
BVS was calculated with the program “VaList” [35].
© 2017 by the authors. Licensee MDPI, Basel, Switzerland. This article is an open access article distributed under the terms and conditions of the Creative Commons Attribution (CC BY) license (http://creativecommons.org/licenses/by/4.0/).
Share and Cite
MDPI and ACS Style
Antao, S.M.; Dhaliwal, I. Growth Oscillatory Zoning in Erythrite, Ideally Co3(AsO4)2·8H2O: Structural Variations in Vivianite-Group Minerals. Minerals 2017, 7, 136. https://doi.org/10.3390/min7080136
AMA Style
Antao SM, Dhaliwal I. Growth Oscillatory Zoning in Erythrite, Ideally Co3(AsO4)2·8H2O: Structural Variations in Vivianite-Group Minerals. Minerals. 2017; 7(8):136. https://doi.org/10.3390/min7080136
Chicago/Turabian StyleAntao, Sytle M., and Inayat Dhaliwal. 2017. "Growth Oscillatory Zoning in Erythrite, Ideally Co3(AsO4)2·8H2O: Structural Variations in Vivianite-Group Minerals" Minerals 7, no. 8: 136. https://doi.org/10.3390/min7080136
Note that from the first issue of 2016, this journal uses article numbers instead of page numbers. See further details here.