Article

Separation of Molybdenite from Chalcopyrite in the Presence of Novel Depressant 4-Amino-3-thioxo-3,4-dihydro-1,2,4-triazin-5(2H)-one

School of Minerals Processing and Bioengineering, Central South University, Changsha 410083, China
*
Authors to whom correspondence should be addressed.
Minerals 2017, 7(8), 146; https://doi.org/10.3390/min7080146
Submission received: 13 July 2017 / Revised: 1 August 2017 / Accepted: 10 August 2017 / Published: 15 August 2017

Abstract

:
In this paper, 4-amino-3-thioxo-3,4-dihydro-1,2,4-triazin-5(2H)-one (ATDT) was synthesized and introduced as a depressant for selective flotation separation of molybdenite from chalcopyrite. Its flotation performance and adsorption mechanism on minerals were first investigated by flotation, UV spectra, zeta potential, Fourier Transform Infrared Spectroscopy (FT-IR), and X-ray Photoelectron Spectroscopy Measurements (XPS). The bench scale tests indicated that ATDT exhibited stronger depressing power than chalcopyrite, and the selective index of Mo/Cu improved significantly in the presence of ATDT. The results of the UV spectra, zeta potential and FT-IR demonstrated that ATDT chemisorbed on the chalcopyrite surface. The XPS results further confirmed that ATDT might chemisorb onto the chalcopyrite surface through S and N atoms to form five-membered chelate rings and a postulated adsorption mode was presented. For molybdenite, the different measurements agreed well with each other and implied that ATDT might weakly physisorb onto a molybdenite surface.

1. Introduction

As well known, the recovery of polymetallic sulfide minerals could be realized by adopting a powerful collector, such as xanthate, thiophosphate, or a combination. For example, when molybdenite presents as a primary economical resource, a proper recovery of molybdenite and the associated chalcopyrite could be achieved by the applications of kerosene and pine oil as a collector and frother, respectively [1]. However, the separation of molybdenite from other unwanted sulfide ore is a challenging task, wherein a proper reagent is needed to depress sulfide minerals during the flotation of molybdenite. At a commercial scale, the widely used inorganic depressants usually include sodium sulfide, sodium hydrosulfide, cyanide and Nokes reagents [2,3]. However, the application of these compounds at mining sites unavoidably associates with some unpredictable problems and difficulties, such as the seriously corrosion of pipeline, and the toxic nature of the depressant [4]. Therefore, whist keeping an eye on the industrial and environmental protection scenarios, attention should be paid to the development of novel, nontoxic and good selectivity compounds to replace these high dosage, low selectivity, and toxic reagents.
The derivatives of thiocarbohydrazide have received considerable attention in the past decades because of their versatility in the synthesis of N, O, and S containing hyterocyclic compounds. These compounds or their transition metal complexes have shown a wide variety of biological activity [5,6,7,8], nonlinear optical properties (NLO) [9,10], optoelectronic properties [11], corrosion inhibition properties [12,13,14], organic co-precipitant [15], applications in analytical [16] and the precursors for nanoparticles [17], etc. Schiff bases act as effective coordination compounds because of certain molecular configurations which contain nitrogen, oxygen and sulfur atoms that can form coordinate covalent bonds with metal ions [5,18]. Meanwhile, the formation of organic compound metal complexes could be realized by functional electronegative groups and π-bonds of Schiff bases, which includes triple and conjuagated double bonds [14]. Schiff bases derived from thiocarbohydrazide have both features, which act as powerful coordination reagents and thereby enable the formation of air-stable complexes with metal ions [18,19]. It is reported that the amine- and thione-substituted triazoles, derived by the condensation of the derivatives of 1,2,4-triazine and the aldehyde or ketone, exhibited a strong affinity to some metal ions, such as Cu(II), Zn(II), Pb(II), Cr(III), Co(II), Ni(II), Mn(II) and Fe(II) [11,15,20]. When the ligands reacted with metal ions in aqueous solutions, its thione functional group rearranged to form thiol, thus allowing the bidentate coordination to metal ions through S and N atom to form a stable five-membered ring while releasing H ions into aqueous solutions [20,21,22,23]. The powerful affinity of S and N atoms to transition metal ions rendered a potential application of these compounds in modulating the surface of sulfide minerals. Therefore, the derivatives of thiocarbohydrazide can be used as either a collector or depressant in the flotation separation of sulfide minerals which depending on its specific structure. Recently, the application of 3-hexyl-4-amino-1,2,4-triazole-5-thione (HATT) as a collector in the flotation of malachite has been reported, and the results indicated that HATT chemisorbed onto the malachite surface by forming Cu—S and Cu—N bonds with the release of H+ ions [24].
Evaluation of compounds derived from thiocarbohydrazide for the flotation separation of minerals is important for mineral processing. With the abovementioned context in mind, it is worthwhile to design and synthesize novel organic compounds which could be applied as selective depressants in the mineral processing industry. In this investigation, 4-amino-3-thioxo-3,4-dihydro-1,2,4-triazin-5(2H)-one (ATDT), was synthesized and characterized by nuclear magnetic resonance (1H-NMR and 13C-NMR), mass spectrometry (MS) spectra and element analysis. Meanwhile, its application as a selective chalcopyrite depressant in the flotation separation of molybdenite was investigated. Furthermore, the Zeta potential, UV-Vis spectra, Fourier Transform Infrared Spectroscopy (FT-IR), and X-ray Photoelectron Spectroscopy Measurements (XPS) were conducted to illustrate the adsorption mechanisms between ATDT and minerals.

2. Materials and Methods

2.1. Materials

Molybdenite and chalcopyrite were obtained from China Molybdenum Co., Ltd., (Luoyang, China), and Dexing copper Mine (Shangrao, China), respectively. The samples were crushed in a porcelain mortar and sieved (GMJ, Xianyang Jinhong General Machinery Co., Ltd., Xianyang, China). The fraction containing particles between 38 μm and 74 μm fraction were used for flotation. The results of X-ray diffraction (XRD) spectra of chalcopyrite indicated that the purity was over 90%, which meet the requirement of this study [25]. The chemicals used were of analytical grade and purchased from the local supplier. The structure of ATDT was confirmed by infrared spectrometer (IRAffinity-1, Shimadzu, Kyoto, Japan), 1H-NMR (Bruker VANCE III 600 M, Saarbrücken, Germany), 13C-NMR (Bruker VANCE III 600 M, Saarbrücken, Germany) and MS (Agilent 1260 + 6120 ESI-MS, Palo Alto, CA, USA) spectra.

2.2. FT-IR Spectra Measurement

The sample in the size range of 38–74 μm was reground to 100% passing 5 μm (Occhio Flowcell FC200S, Angleu, Belgium) and used for FT-IR measurements (IRAffinity-1 Shimadzu, Kyoto, Japan). The samples were prepared by adding 100 mg of minerals to a 50 mL solution with a surface hydrophilic modifier (ATDT) concentration of 10−2 mol/L at pH 8. After stirring for half an hour, the samples were filtered, dried, and collected for measurement. The infrared spectra of the samples were recorded by FT-IR spectrometer at room temperature (25 ± 1 °C) in a range from 400 cm−1 to 4000 cm−1 as KBr pellets.
The ATDT-Cu complex precipitations were prepared by mixing 1 × 10⁻² mol/L ATDT solutions with 1 × 10⁻² mol/L Cu2+ at a mol ratio of 1:1 at an evaluated temperature (60 °C). The brown precipitates were filtered and washed with distilled water twice, and dried under vacuum at room temperature for 24 h, and the FT-IR spectra of ATDT-Cu complexes was recorded.

2.3. Zeta Potential Measurement

The zeta potential experiments of chalcopyrite before and after treatment were conducted by using Zetasizer (Zatersizer Nano ZS90, Malvern city, UK) with an electrolyte solution of 0.01M KNO3 in the presence and absence of ATDT. A suspension containing 0.01 wt % of freshly-ground mineral particles (100% passing 5 μm) was prepared in the electrolyte solution. After stirring for 5 min, the pH values were adjusted with either HCl or NaOH dilute solutions. After another 5 min for sedimentation, the supernatant was sampled for the zeta-potential measurement. The results presented were the average of three independent measurements with a typical variation of e sup.

2.4. Evaluation of Reaction between ATDT and Cu2+ Ions

Ultraviolet absorption spectra were recorded on a Spectrum-752s UV-Vis spectrophotometer (Lengguang Tech., Shanghai, China). Cu2+ aqueous solutions and depressant solutions were prepared by adding a certain amount of copper dichloride or ATDT (10−2 mol/L) to a flask with volume of one liter. After the preparation of solutions, 20 mL of each solution was separated and mixed together in a beaker, the absorbance of the supernatant against the blank (Millipore syringe filter with size of 13 mm × 0.45 μm was adopted for filtration) was measured after 20 min oscillation followed by 24 h of standing.

2.5. X-ray Photoelectron Spectroscopy Measurements

The XPS spectra of mineral particles before and after treatment with ATDT were recorded with a K-Alpha 1063 (Thermo Fisher Scientific., Waltham, MA, USA) spectrometer with Al Kα as sputtering source at 12 kV and 6 mA, with pressure in the analytical chamber was 1.0 × 10⁻¹² Pa. All binding energies were referenced to the neutral C1s peak at 284.8 eV to compensate for the surface-charging effects. XPS Peak 4.1 software (RCSMS lab, The Chinese University of Hong Kong) was used to fit the XPS peaks. The preparation of samples for XPS measurements was conducted by adding a certain amount of minerals (100% passing 5 μm) into 50 mL of the aqueous solution with or without 10−2 mol/L ATDT at pH 8. The samples were collected after an hour for adsorption at room temperature, rinsed with distilled water, then dried under vacuum at room temperature for 24 h. The XPS were immediately recorded to calculate the surface compositions.

2.6. Flotation Tests

2.6.1. Single Mineral Flotation

A flotation machine of XFG type (Jilin Prospecting Machinery Factory, Changchun, China) with a volume of 40 mL was used in the micro-flotation tests. In each case, 2.0 g of pure minerals were added to the cell. The floated and un-floated particles were collected, filtered, and dried for calculation.

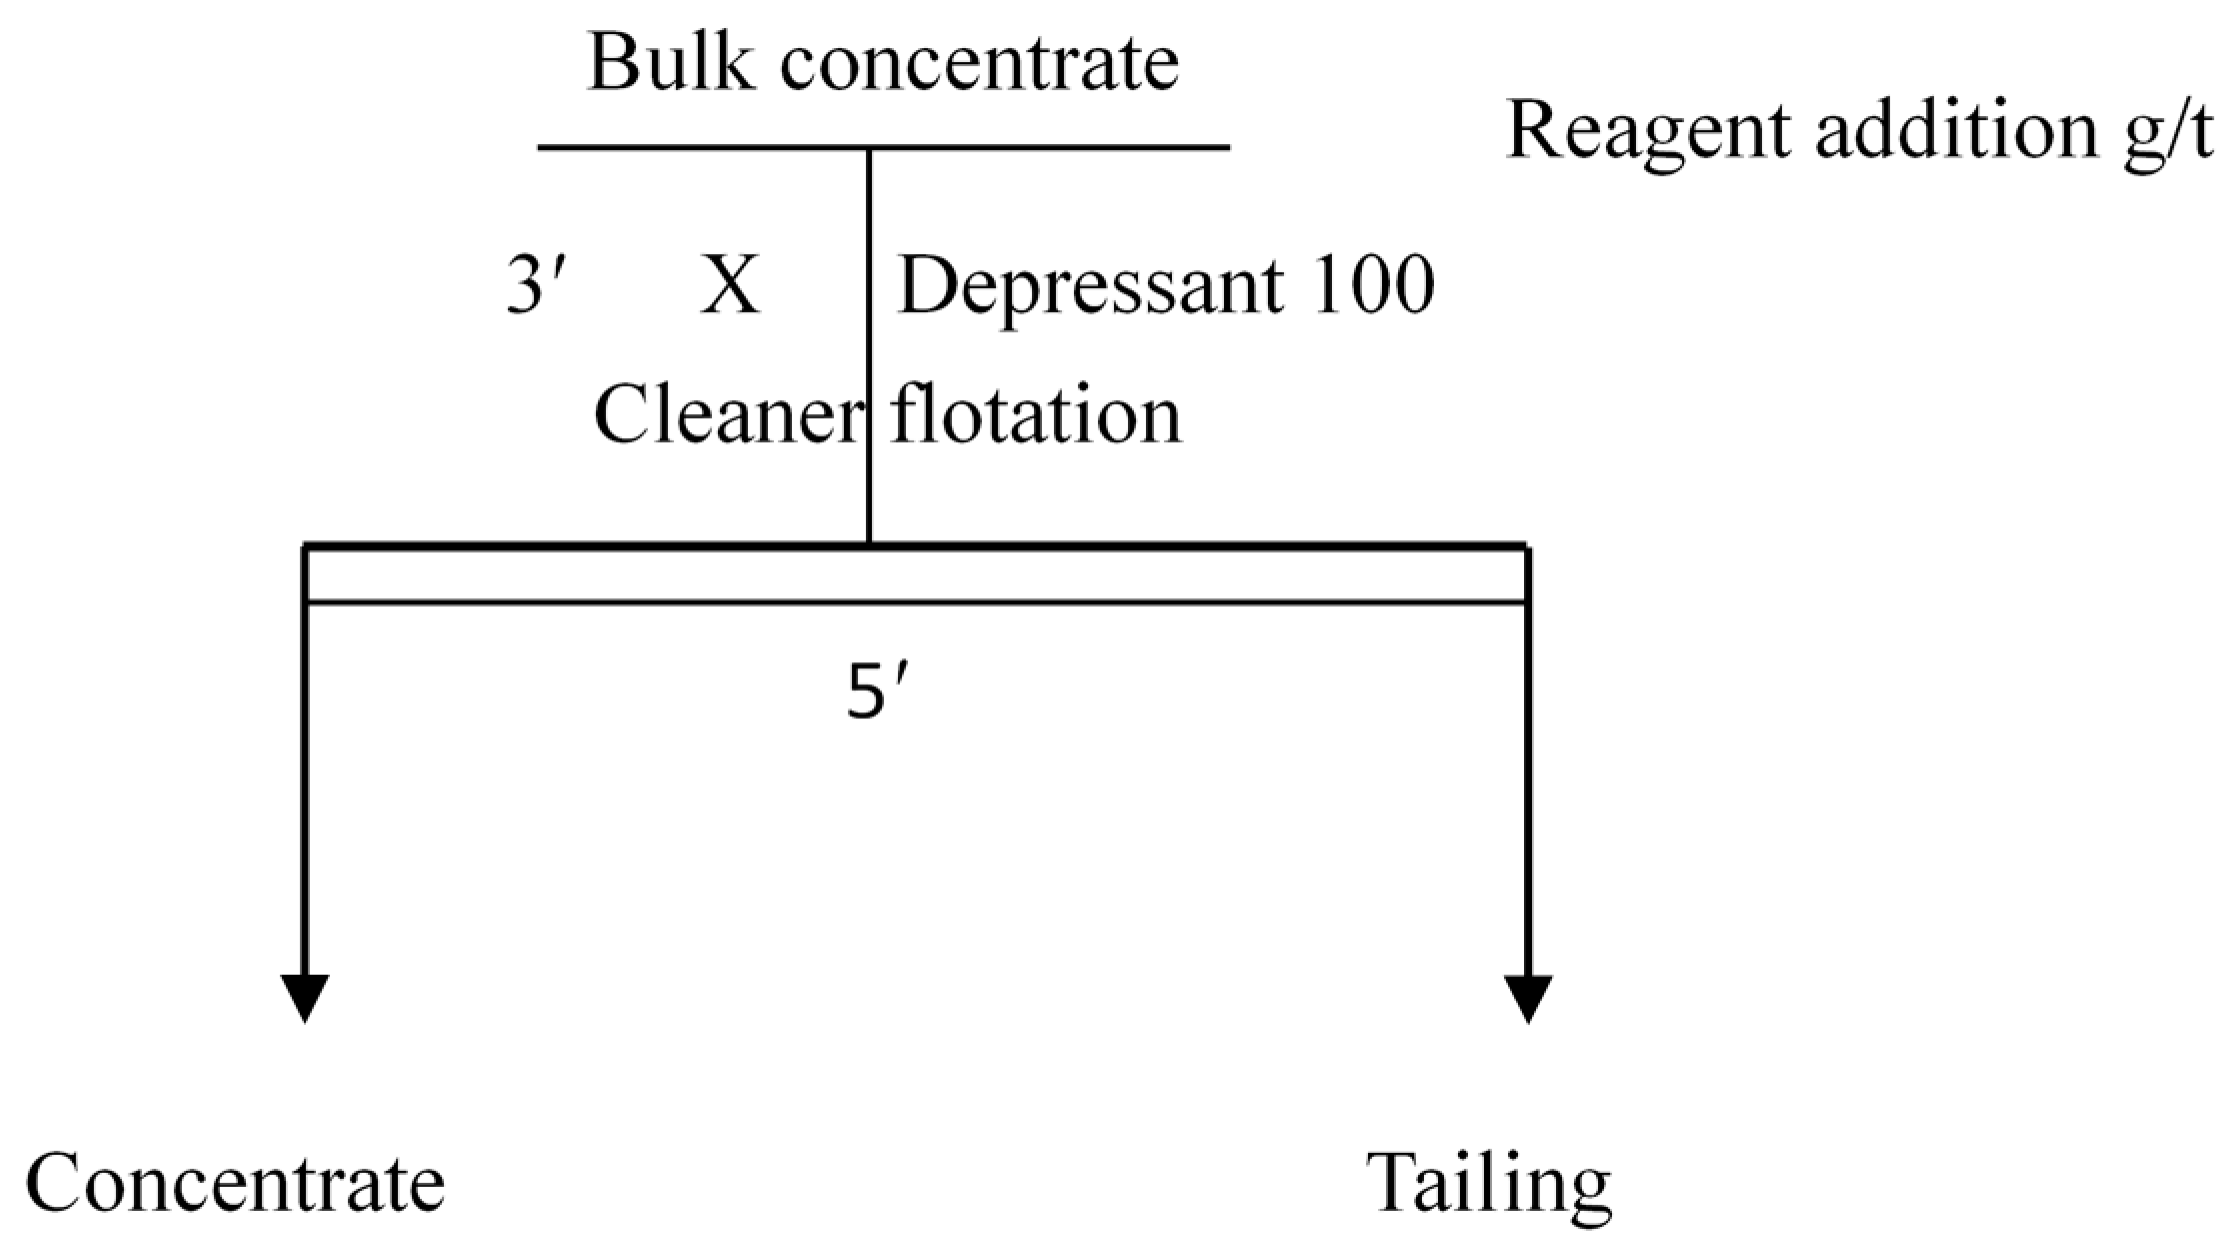
2.6.2. Bench-Scale Flotation Tests

The bulk concentrate (pulp slurry) was obtained from Luming Mining Co., Ltd., Yichun, China (with about 5.0% Cu and 6.0% Mo collected from a day shift) and used in the bench scale tests. The experiments were conducted in a series of flotation cells with a volume capacity of 1.5 L (XFG, Jilin Prospecting Machinery Factory, Changchun, China). The feed was added to the flotation cell with recycled water to obtain the required pulp density. The beneficiation flowsheet of the bench scale tests are presented in Figure 1. The concentrate and tailing were filtered, dried, weighted, sampled, and assayed for copper and molybdenum.

3. Results and Discussion

3.1. Synthesis and Characterization of ATDT

The synthesis of ATDT was similar to the preparation of carbo-and thio-carbohydrazone ligands [26,27,28], but with some modifications. Briefly, a solution of 3.7 g (0.05 mol) of glyoxylic acid in 10 mL methanol was slowly added to a hot stirred solution of 5.3 g (0.05 mol) of thiocarbohydrazide in 10 g hot water. The reaction mixture was refluxed for two hours until no further yellow product formed. The cooled mixture was filtered and recrystallized from distilled water, and the product was characterized by elemental analysis, H-NMR, C-NMR and MS spectra. ATDT: yellow brown solid, yield 87.5%, m.p.: 204–206 °C. Elemental analysis calc. (%) for C3H4N4OS (144.16 g/mol ): C 24.99, H 2.80, N 38.87, O 11.10, S 22.24; found. (%): C 24.91, H 2.76, N 38.81, O 11.23, S 22.19; 600 MHz 1H-NMR (D2O) δH: 7.67 (1H, CH=N); 13C-NMR (D2O) δC: 137.4 (CH=N), 150.6 (C=O), 170.8 (C=S); HRMS (ESI+): calculated for C3H4N4OS 144.16; found 145 [M + H].

3.2. Flotation Tests

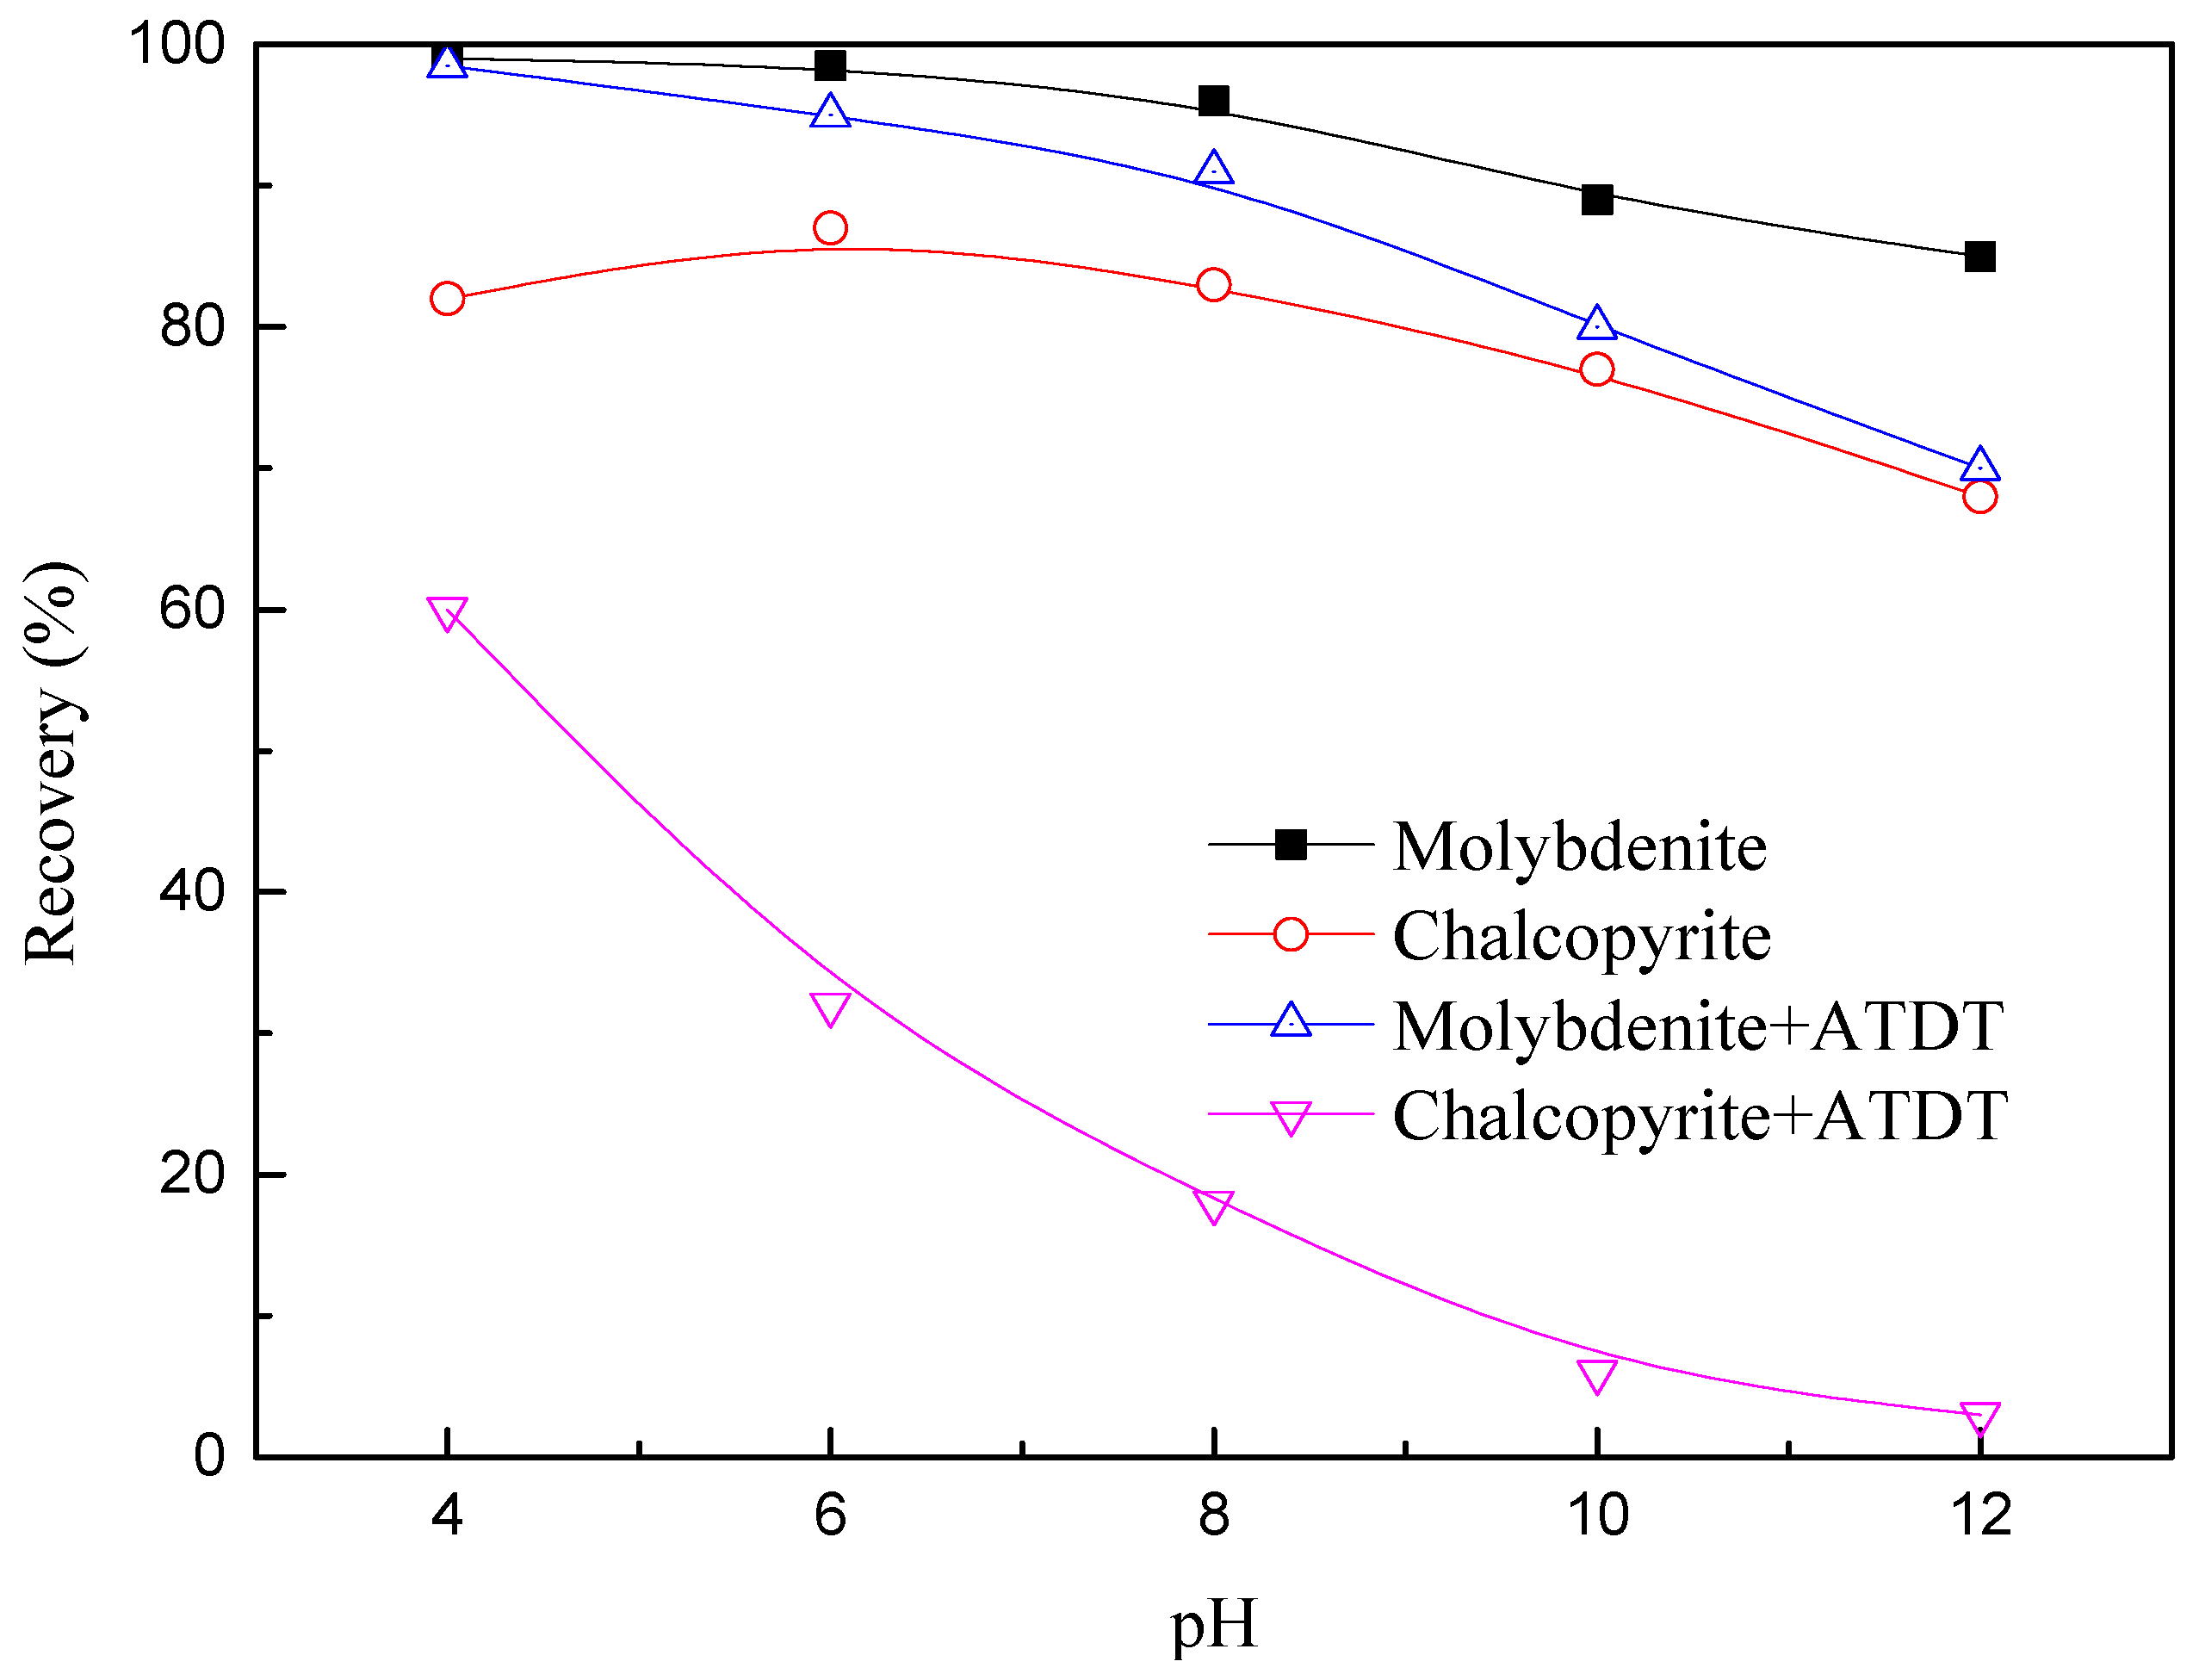
3.2.1. Effect of pH Value

The recoveries of molybdenite and chalcopyrite in the presence and absence of depressants as a function of pH have been performed. It can be seen from Figure 2 that the recovery of molybdenite without depressants decreased with increasing pH, which might be due to the transformation of the molybdate ionic species (HMoO4 and MoO42−) in solution and responsible for the reduction in its floatability [29]. On the other hand, the recovery of chalcopyrite increased with increasing pH up to about 6.0–8.0 and thereafter decreased, which may have been be due to the formation of hydrophilic iron oxy-hydroxy species on the chalcopyrite surface. The flotation test results of pure mineral indicated that it was impossible to separate molybdenite from chalcopyrite without the addition of a depressant. However, the floatability of chalcopyrite dropped significantly when 4 × 10⁻⁴ mol /L ATDT was added, while the recovery of molybdenite decreased slightly. In general, there was a considerable separation window in the pH range of 8–12, indicating that the potential of using ATDT as a selective depressant for chalcopyrite. Taking both separation efficiency and economical cost into consideration, the optimal pH value for the flotation separation of molybdenite from chalcopyrite should be about 8.0.

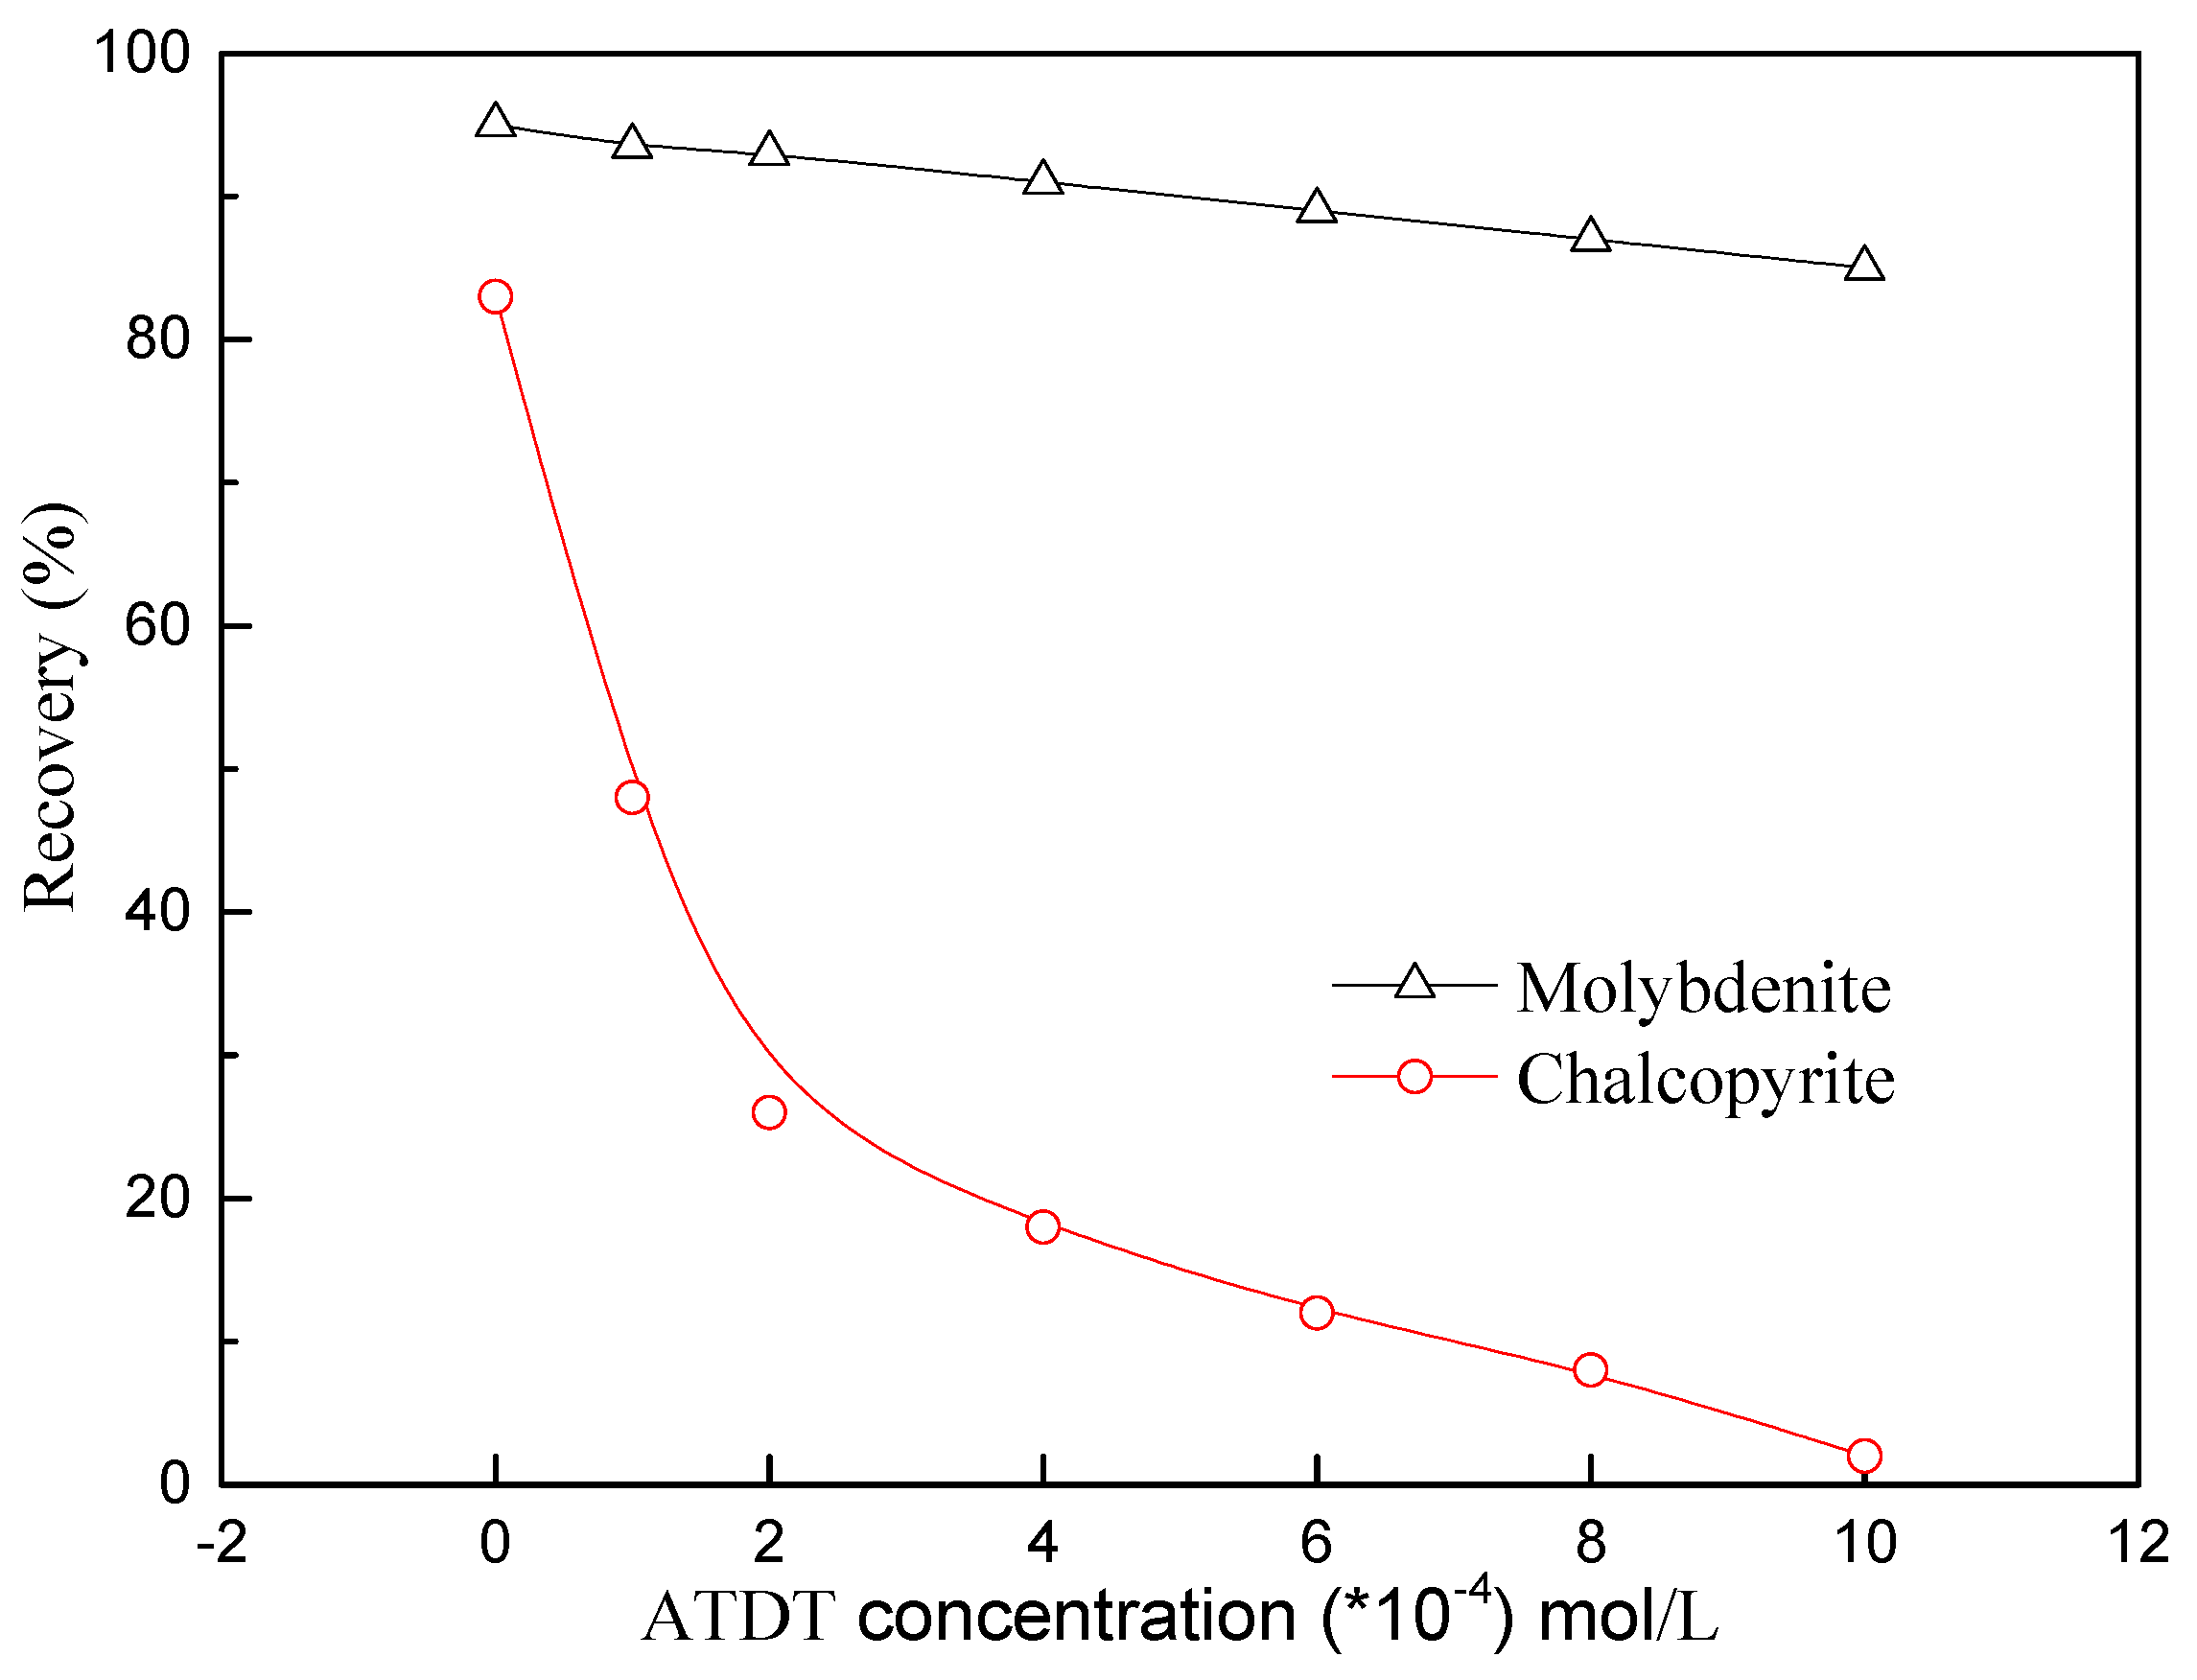
3.2.2. Effect of Depressant Concentration

The plots of the floatability of molybdenite and chalcopyrite as a function of depressant concentration at pH 8.0 are shown in Figure 3. It was apparent that the recoveries of chalcopyrite and molybdenite decreased simultaneously with the increase of depressant concentration. However, the recovery of chalcopyrite dropped sharply with the increase of ATDT concentration, whereas the recovery of molybdenite decreased insignificantly. In other words, as the depressant concentration increased, the hydrophilicity of chalcopyrite was enhanced while the hydrophobicity of molybdenite was independent of the depressant. Furthermore, the observation also indicated that the separation window between chalcopyrite and molybdenite enlarged gradually with the increase of depressant concentration. Therefore, satisfactory separation results could be achieved by adopting ATDT as a potential selective depressant in copper-molybdenum flotation separation.

3.2.3. Bench-Scale Flotation Tests

Pure mineral flotation tests only showed a marginal effect of ATDT as a potential selective depressant in Cu-Mo flotation separation [3]; however, the single mineral flotation tests could not demonstrate the competitive adsorption of ATDT on the two minerals. Therefore, further test works were conducted on the flotation separation of Cu-Mo bulk concentrate in the presence and absence of ATDT as depressants through an open circuit. A kinetic flotation test with and without ATDT was performed to evaluate the difference of the parameter fitted by kinetic models. The kinetic flotation tests were conducted according to the flowsheet in Section 2.6.2. In this section, the classical first-order flotation model was adopted to calculate the flotation rate constant and the selectivity index [30].
R = R∞ [1 − exp(−kt)]
KM = R∞ k
S.I. (I/II) = (KM of mineral I)/KM of mineral II)
where R∞ is the maximum recovery that could be calculated according to the recovery (R) of minerals at time t. k and KM is the rate constant and modified rate constant, respectively. S.I. (I/II) is the selectivity index of mineral I over mineral II.
Figure 4 presents the recovery of molybdenite and chalcopyrite as a function of flotation time in the presence and absence of ATDT. Under the optimum depressant concentration of 100 g/t, ATDT achieved a similar Mo recovery and lower Cu recovery, while the blank test had a lower Mo recovery and higher Cu recovery. The parameters obtained from the model are summarized in Table 1, including rate constant, R∞, modified rate constant and selectivity index of Mo/Cu. For blank test, the modified rate constant for molybdenite and galena was 0.76 and 0.52, respectively. However, while use ATDT as depressant, the corresponding data were 0.50 and 0.17, respectively. Meanwhile, the calculated selectivity index for control test and ATDT was 1.45 and 2.98, respectively. These results indicate that, on the bench scale, the selective index improved significantly while using ATDT as a potential chalcopyrite depressant in the Cu-Mo flotation separation.

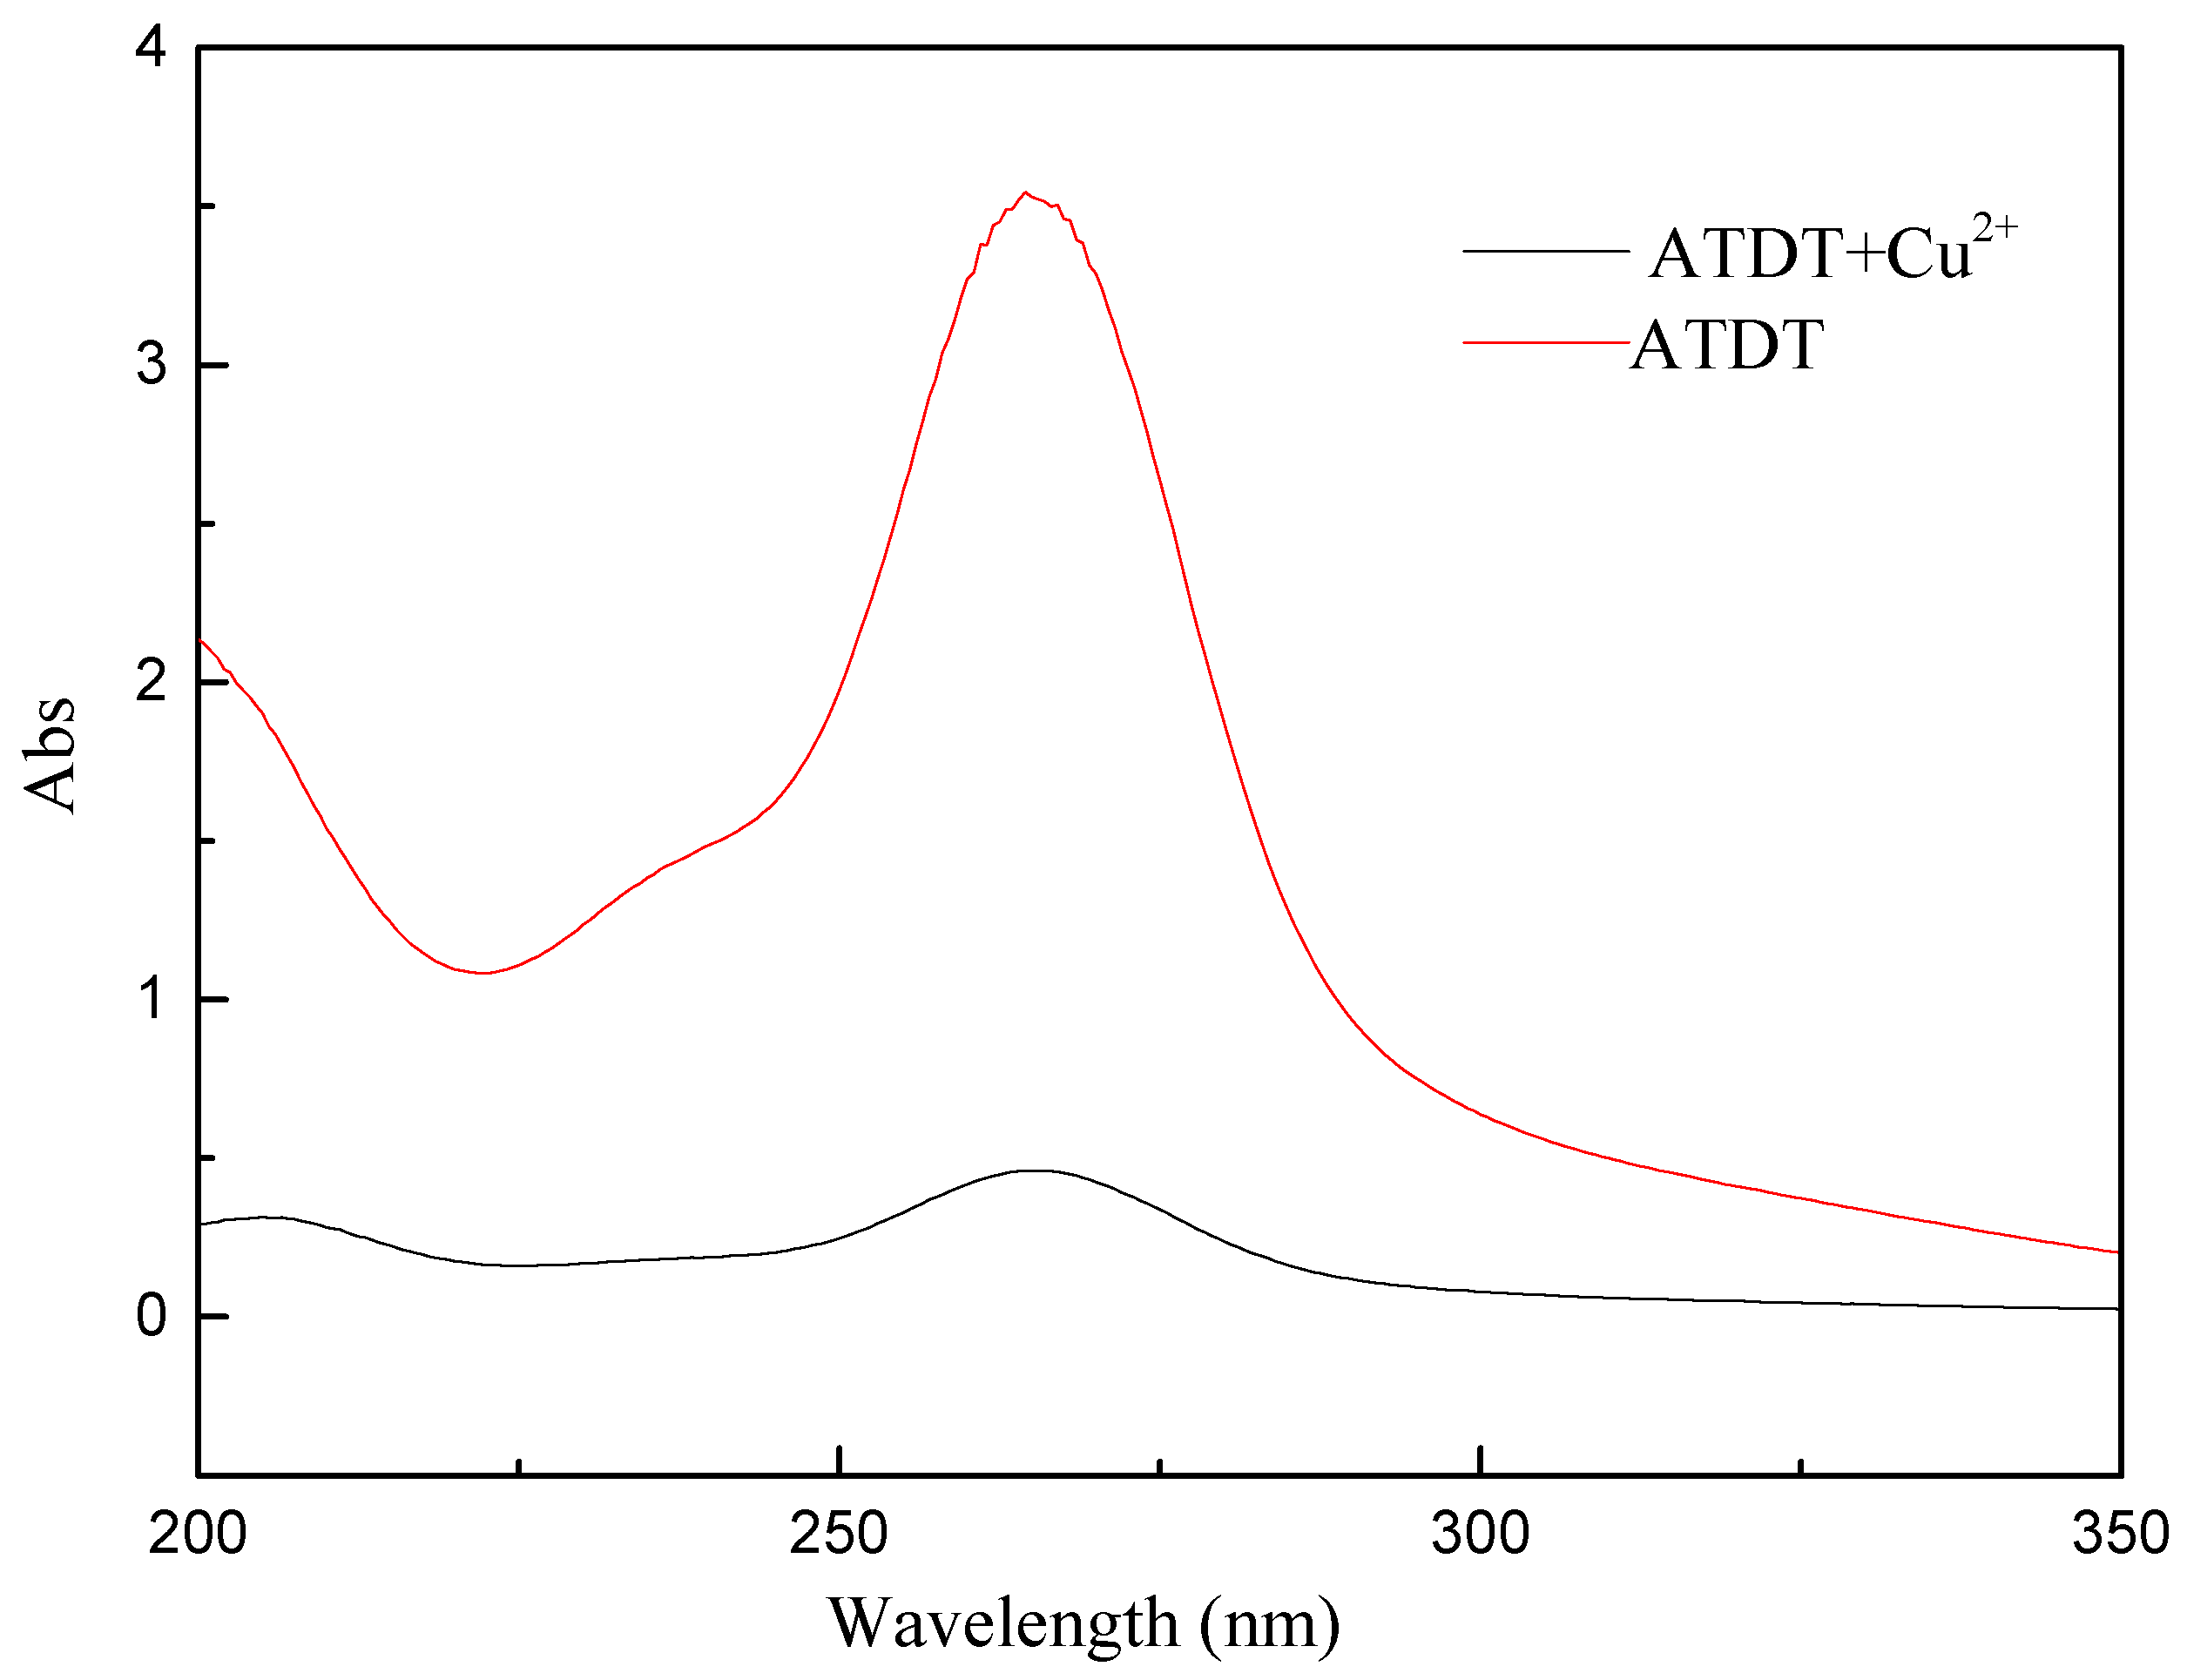
3.3. UV Spectroscopic Analysis

The UV-Vis spectra of 1 × 10⁻⁴ mol/L ATDT before and after reaction with 1 × 10⁻⁴ mol/L Cu2+ ions are shown in Figure 5 where it was concluded that, based on the change of absorbance curves, the residual concentration of ATDT was much lower than that of the original solutions. These changes indicated that Cu2+ ions had a significant effect on the absorbance of the depressant in wavelengths from 250 nm to 280 nm. An obvious change of pH was observed by mixing 1 × 10⁻² mol/L ATDT and 1 × 10⁻² mol/L Cu2+ ions, where the precipitation appeared immediately and the pH of the solution reduced from 4.51 to 2.83. The decreased pH value of the mixed solution suggested that the S—H bonds were broken with the release of H+ into aqueous solutions, and the ATDT-Cu complexes were formed [31].

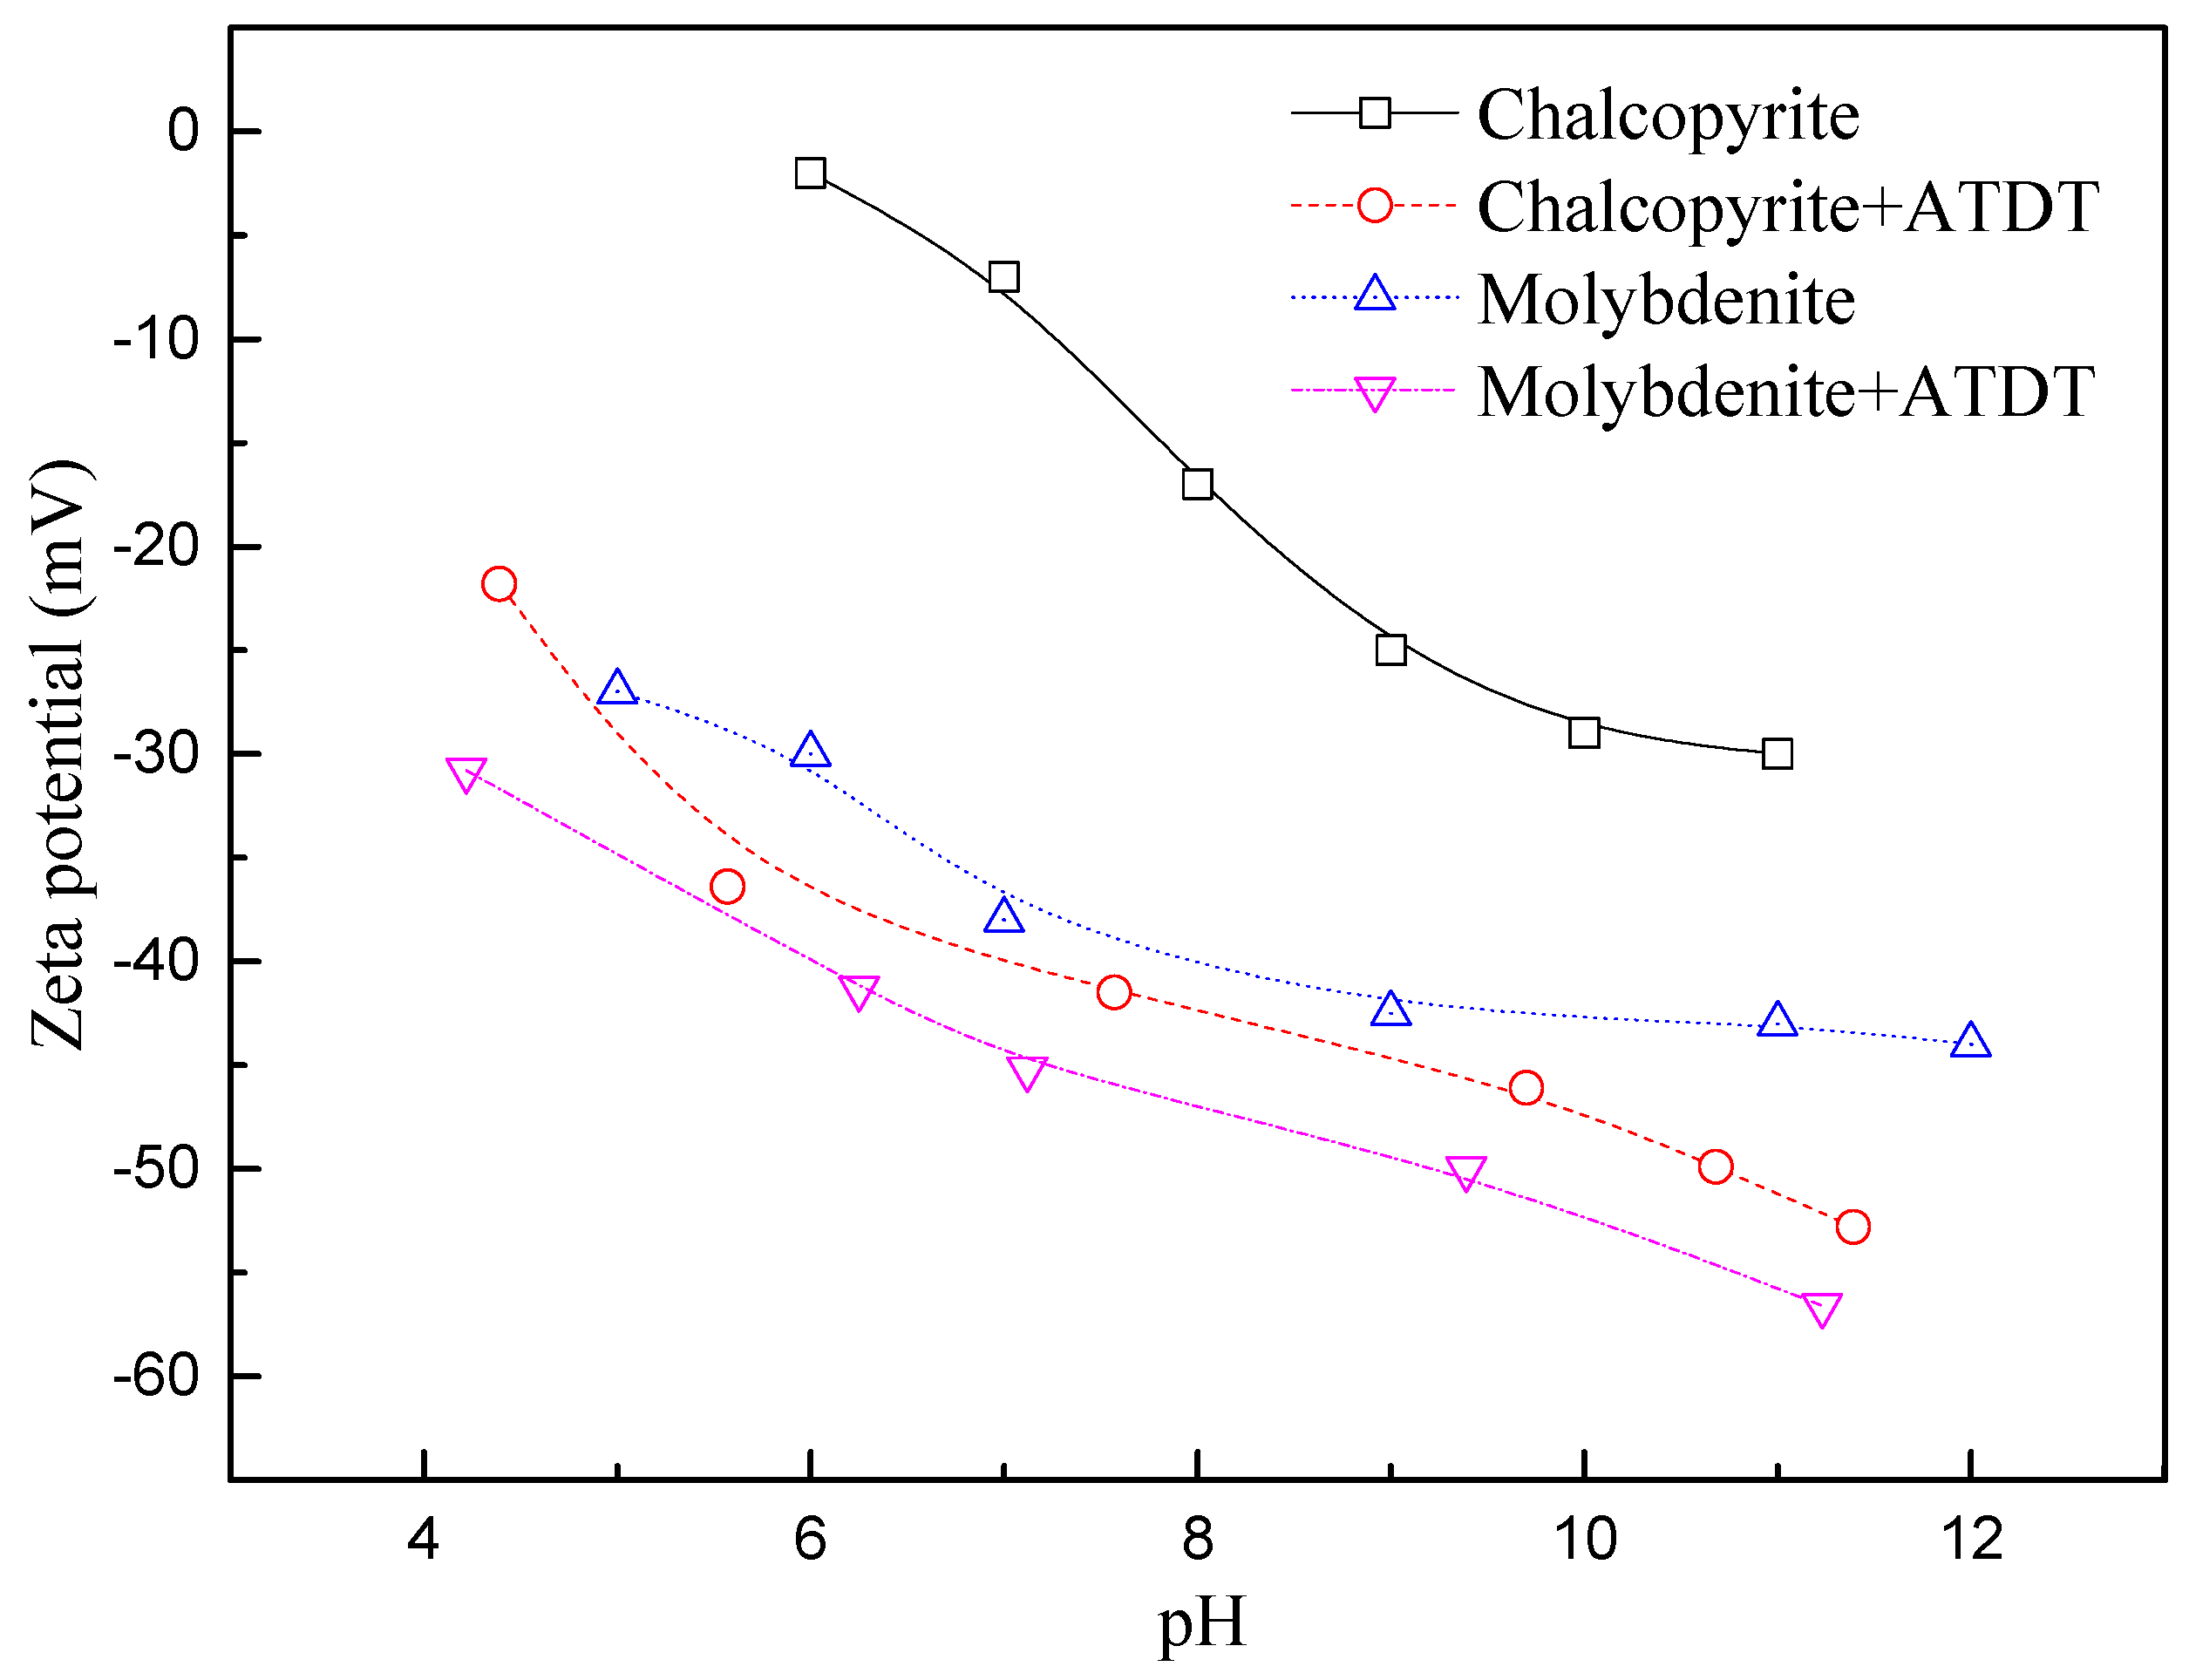
3.4. Zeta Potential Measurement
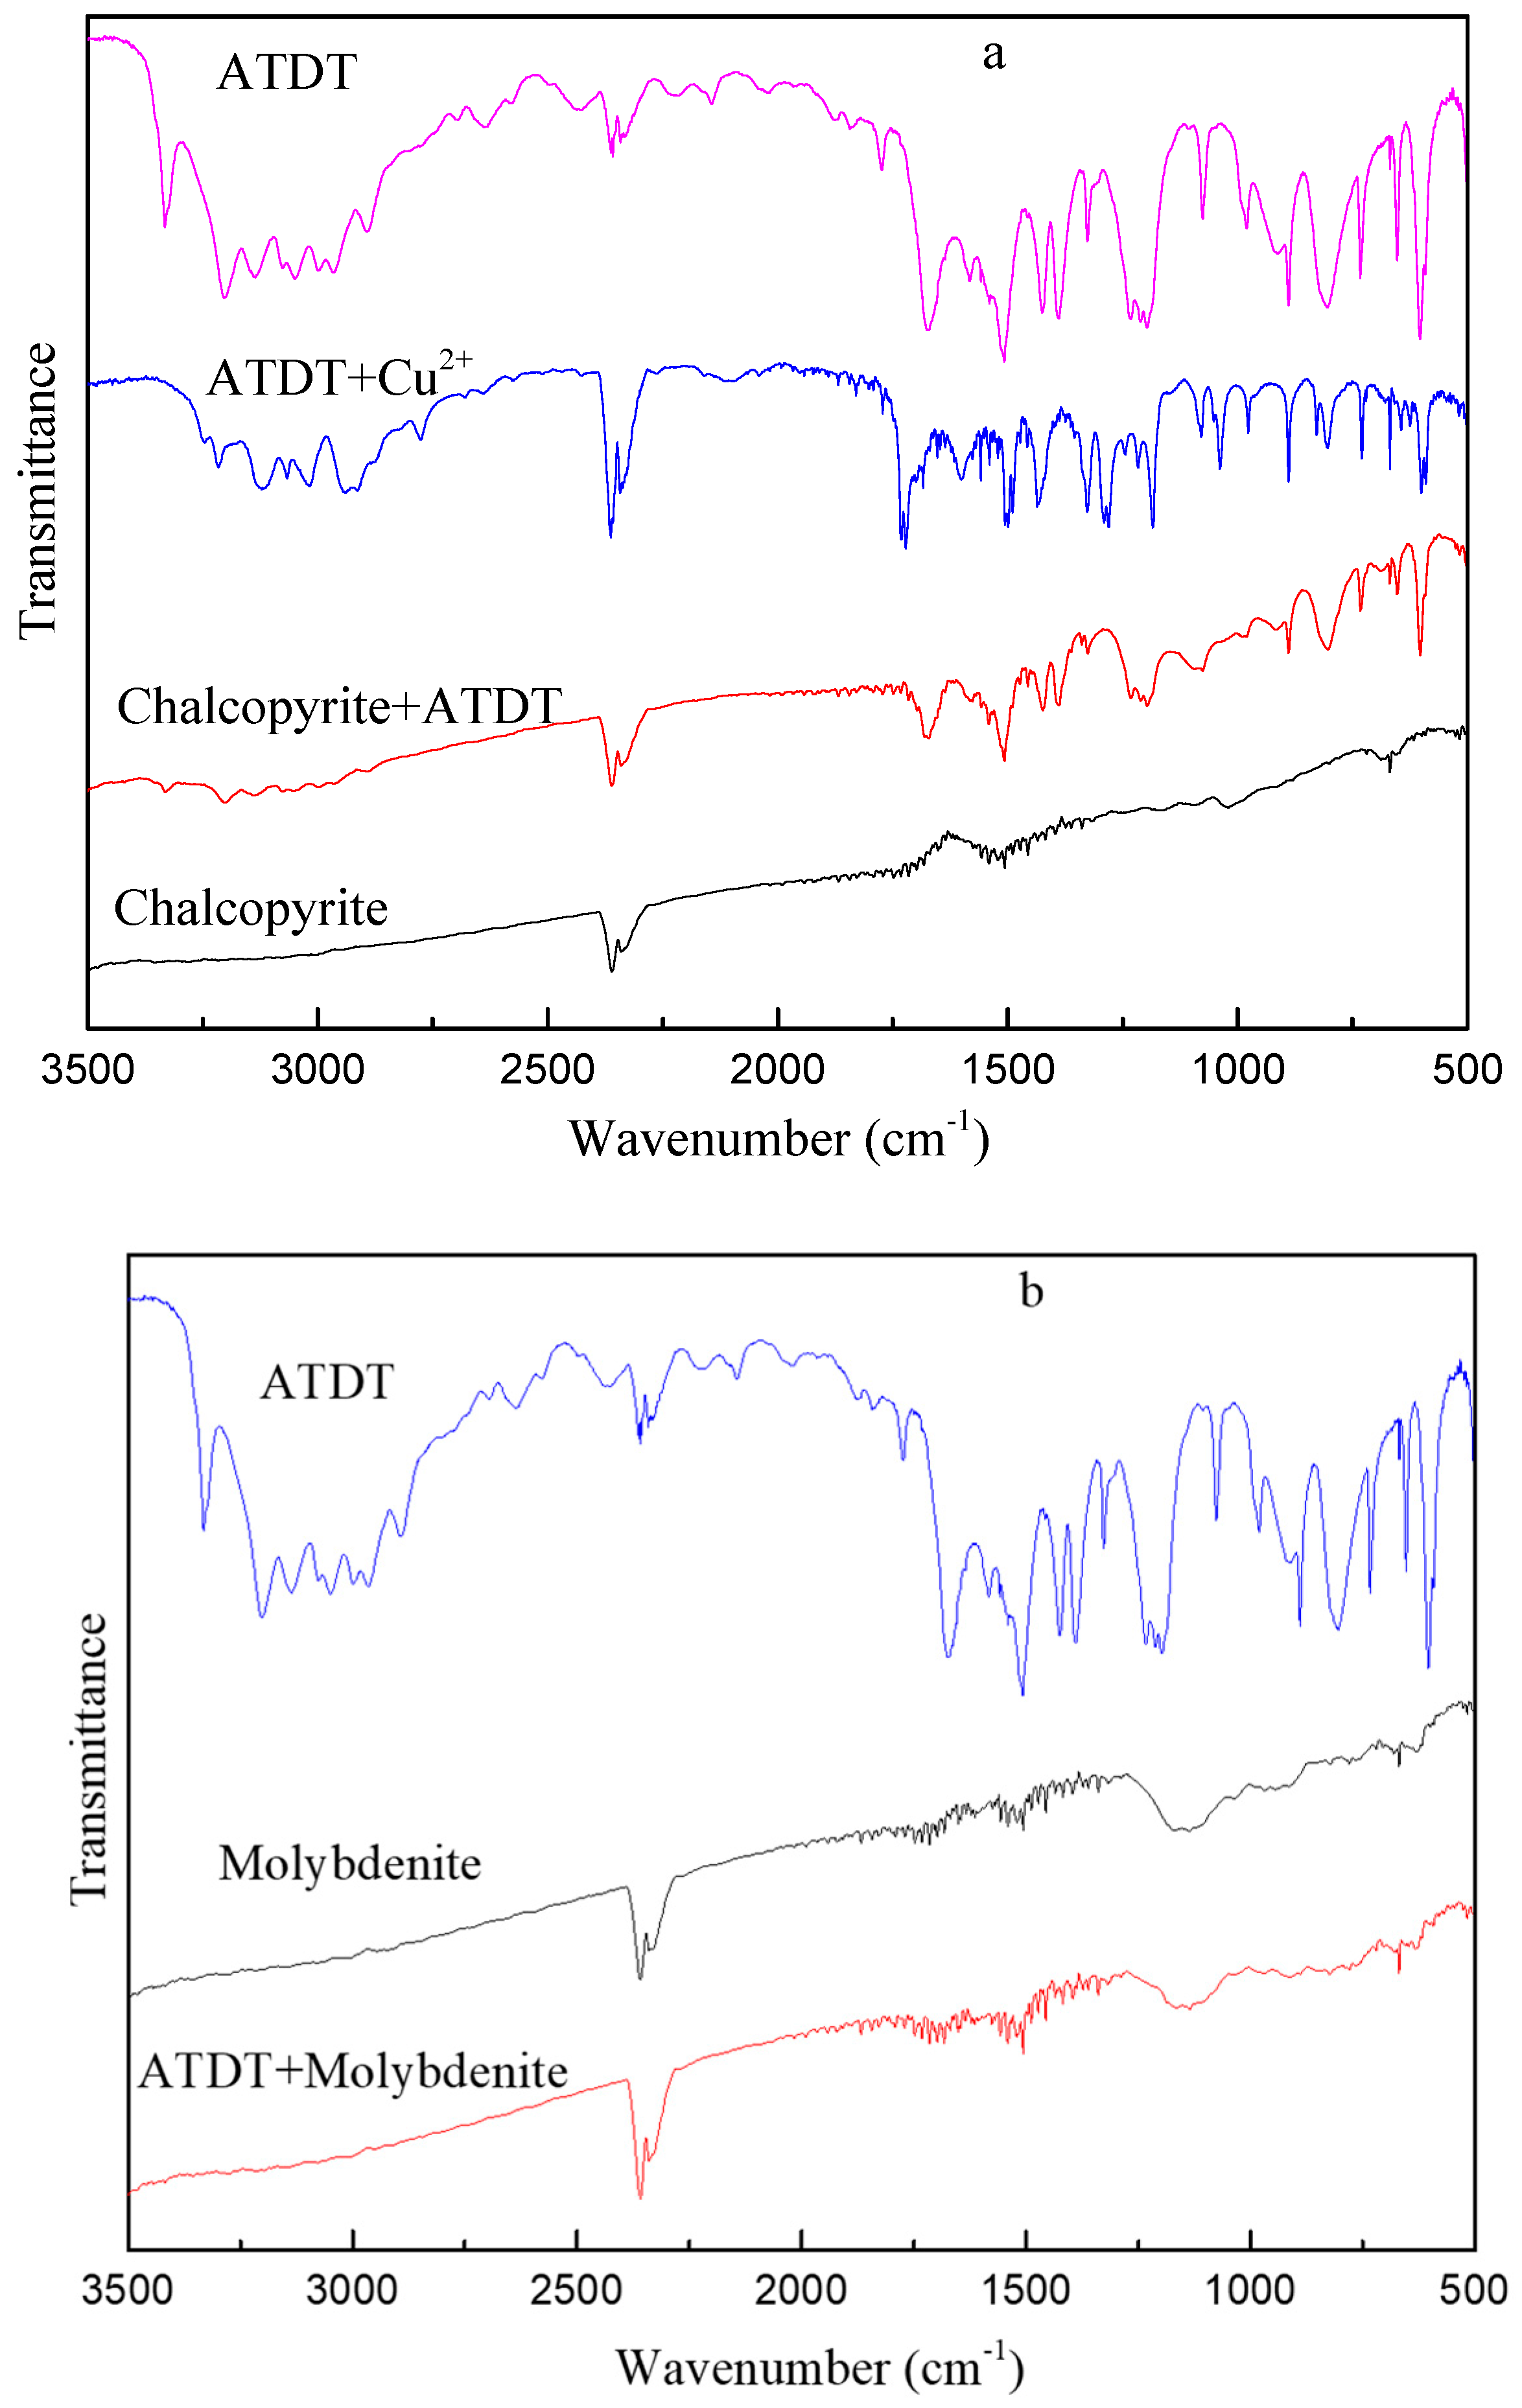
The zeta potential curves for chalcopyrite in the presence and absence of a depressant showed that the chalcopyrite surfaces were negatively charged throughout the tested pH range. The isoelectric point of chalcopyrite was set at about pH 5, which was consistent with the reported value [32,33]. As seen in Figure 6, the addition of a depressant made the chalcopyrite surfaces more negatively charged in the entire pH range, which indicated the adsorption of the reagent on the chalcopyrite surface [34]. The zeta potential of the negatively charged pure molybdenite in the tested pH range was attributed to the transformation of the molybdate ionic species (HMoO4− and MoO42−) [29]. It is clear from Figure 6 that ATDT might adsorb onto the molybdenite, therefore making the zeta potential more negative. Compared to the Δzeta potential value of chalcopyrite and molybdenite, a conclusion could be drawn that the presence of the depressant had a little influence on the zeta potential of molybdenite rather than that of chalcopyrite, indicating the higher adsorbed amount of depressant on chalcopyrite rather than molybdenite. The molecular structure of ATDT contains primary amine (-NH2) and thione (C=S) groups, which like most dithiocarbazones can undergo thione-thiol tautomerization [14]. The more negative of the chalcopyrite treated by depressant may be associated with the chemisorption of ATDT through nitrogen (-NH2) and sulfur (-SH) atoms to form Cu complexes on chalcopyrite surface. However, for molybdenite, the possible physisorption mechanism might dominate through hydrogen bonds or electrostatic forces.

3.5. FT-IR Analysis

The FT-IR spectra of ATDT, ATDT-Cu complexes, chalcopyrite, and ATDT treated chalcopyrite are presented in Figure 7 and Table 2. The reported values for stretching vibrations of C—N and C=N appeared at 1234/1420 cm−1 and 1572/1576 cm−1 in the molecular of bis(4-amino-5-mercapto-1,2,4-triazole-3-yl) propane [10]. In this study, the bands observed at 1232(w)/1424(s) cm−1 were assigned to C—N stretching of ATDT, while the stretching vibration of C=N appeared at 1582 cm−1. The band at 1075 cm−1 was attributed to C=S stretching and the bands at 3201 cm−1 and 1389 cm−1 were assigned to the amino group (-NH2) stretching vibration and vibration of υ(CN) + (NH) [35,36], respectively. Most of the peaks in the ATDT-Cu complexes shifted as the functional group (primary amine and thiol group) coordinated with the metal ions. The stretching vibration of C=S at about 1079 cm−1 almost disappeared in the Cu-ATDT complexes, which indicated the participation of the C=S group to form metal complexes that was consistent with the observation of the UV-Vis spectra. Meanwhile, the peak at around 3201 cm−1 for the amino group (-NH2) in the ATDT molecule shifted to a higher frequency at about 3215 cm−1. Furthermore, the mixed vibration of ((CN) + (NH)) at 1389 cm−1 in ATDT shifted to a higher frequency of 1427 cm−1, indicating that the electron density of these bonds changed, which may be due to the rearrangement of the molecules. These observations indicated the involvement of the -NH2 group and thione-thiol tautomerization (-SH) in coordination with the metal ions.
The FT-IR spectra of chalcopyrite in the presence and absence of ATDT are presented in Figure 7a. The results indicated that, after ATDT treatment, new peaks were appeared on the surface of chalcopyrite at around 3206, 1558, 1447, 1423, and 1077 cm−1, which were assigned to the vibrations of υNH2, υC=N, υC-N, υ((CN) + (NH)) and υC=S, respectively; whereas the new bands were very similar to the bands that appeared on the ATDT-Cu complexes. Therefore, ATDT might chemisorb on chalcopyrite through the formation of ATDT-Cu complexes through sulfur (-SH) and nitrogen atoms (-NH2), which was the same manner in which 3-substituted-4-amino-5-mercapto-1,2,4-triazole Schiff bases coordinated with copper ions (II) [17]. The FT-IR spectra of ATDT, and molybdenite were recorded before and after treatment in Figure 7b. The results exhibited that after ATDT treatment, there were no obvious peaks appeared on the surface of molybdenite, which indicated that the adsorbed ATDT might have been removed before the FT-IR measurements. In other words, the adsorption between molybdenite and the depressant might be weak physisorption rather than chemisorption that coincided with the observation of zeta potential.

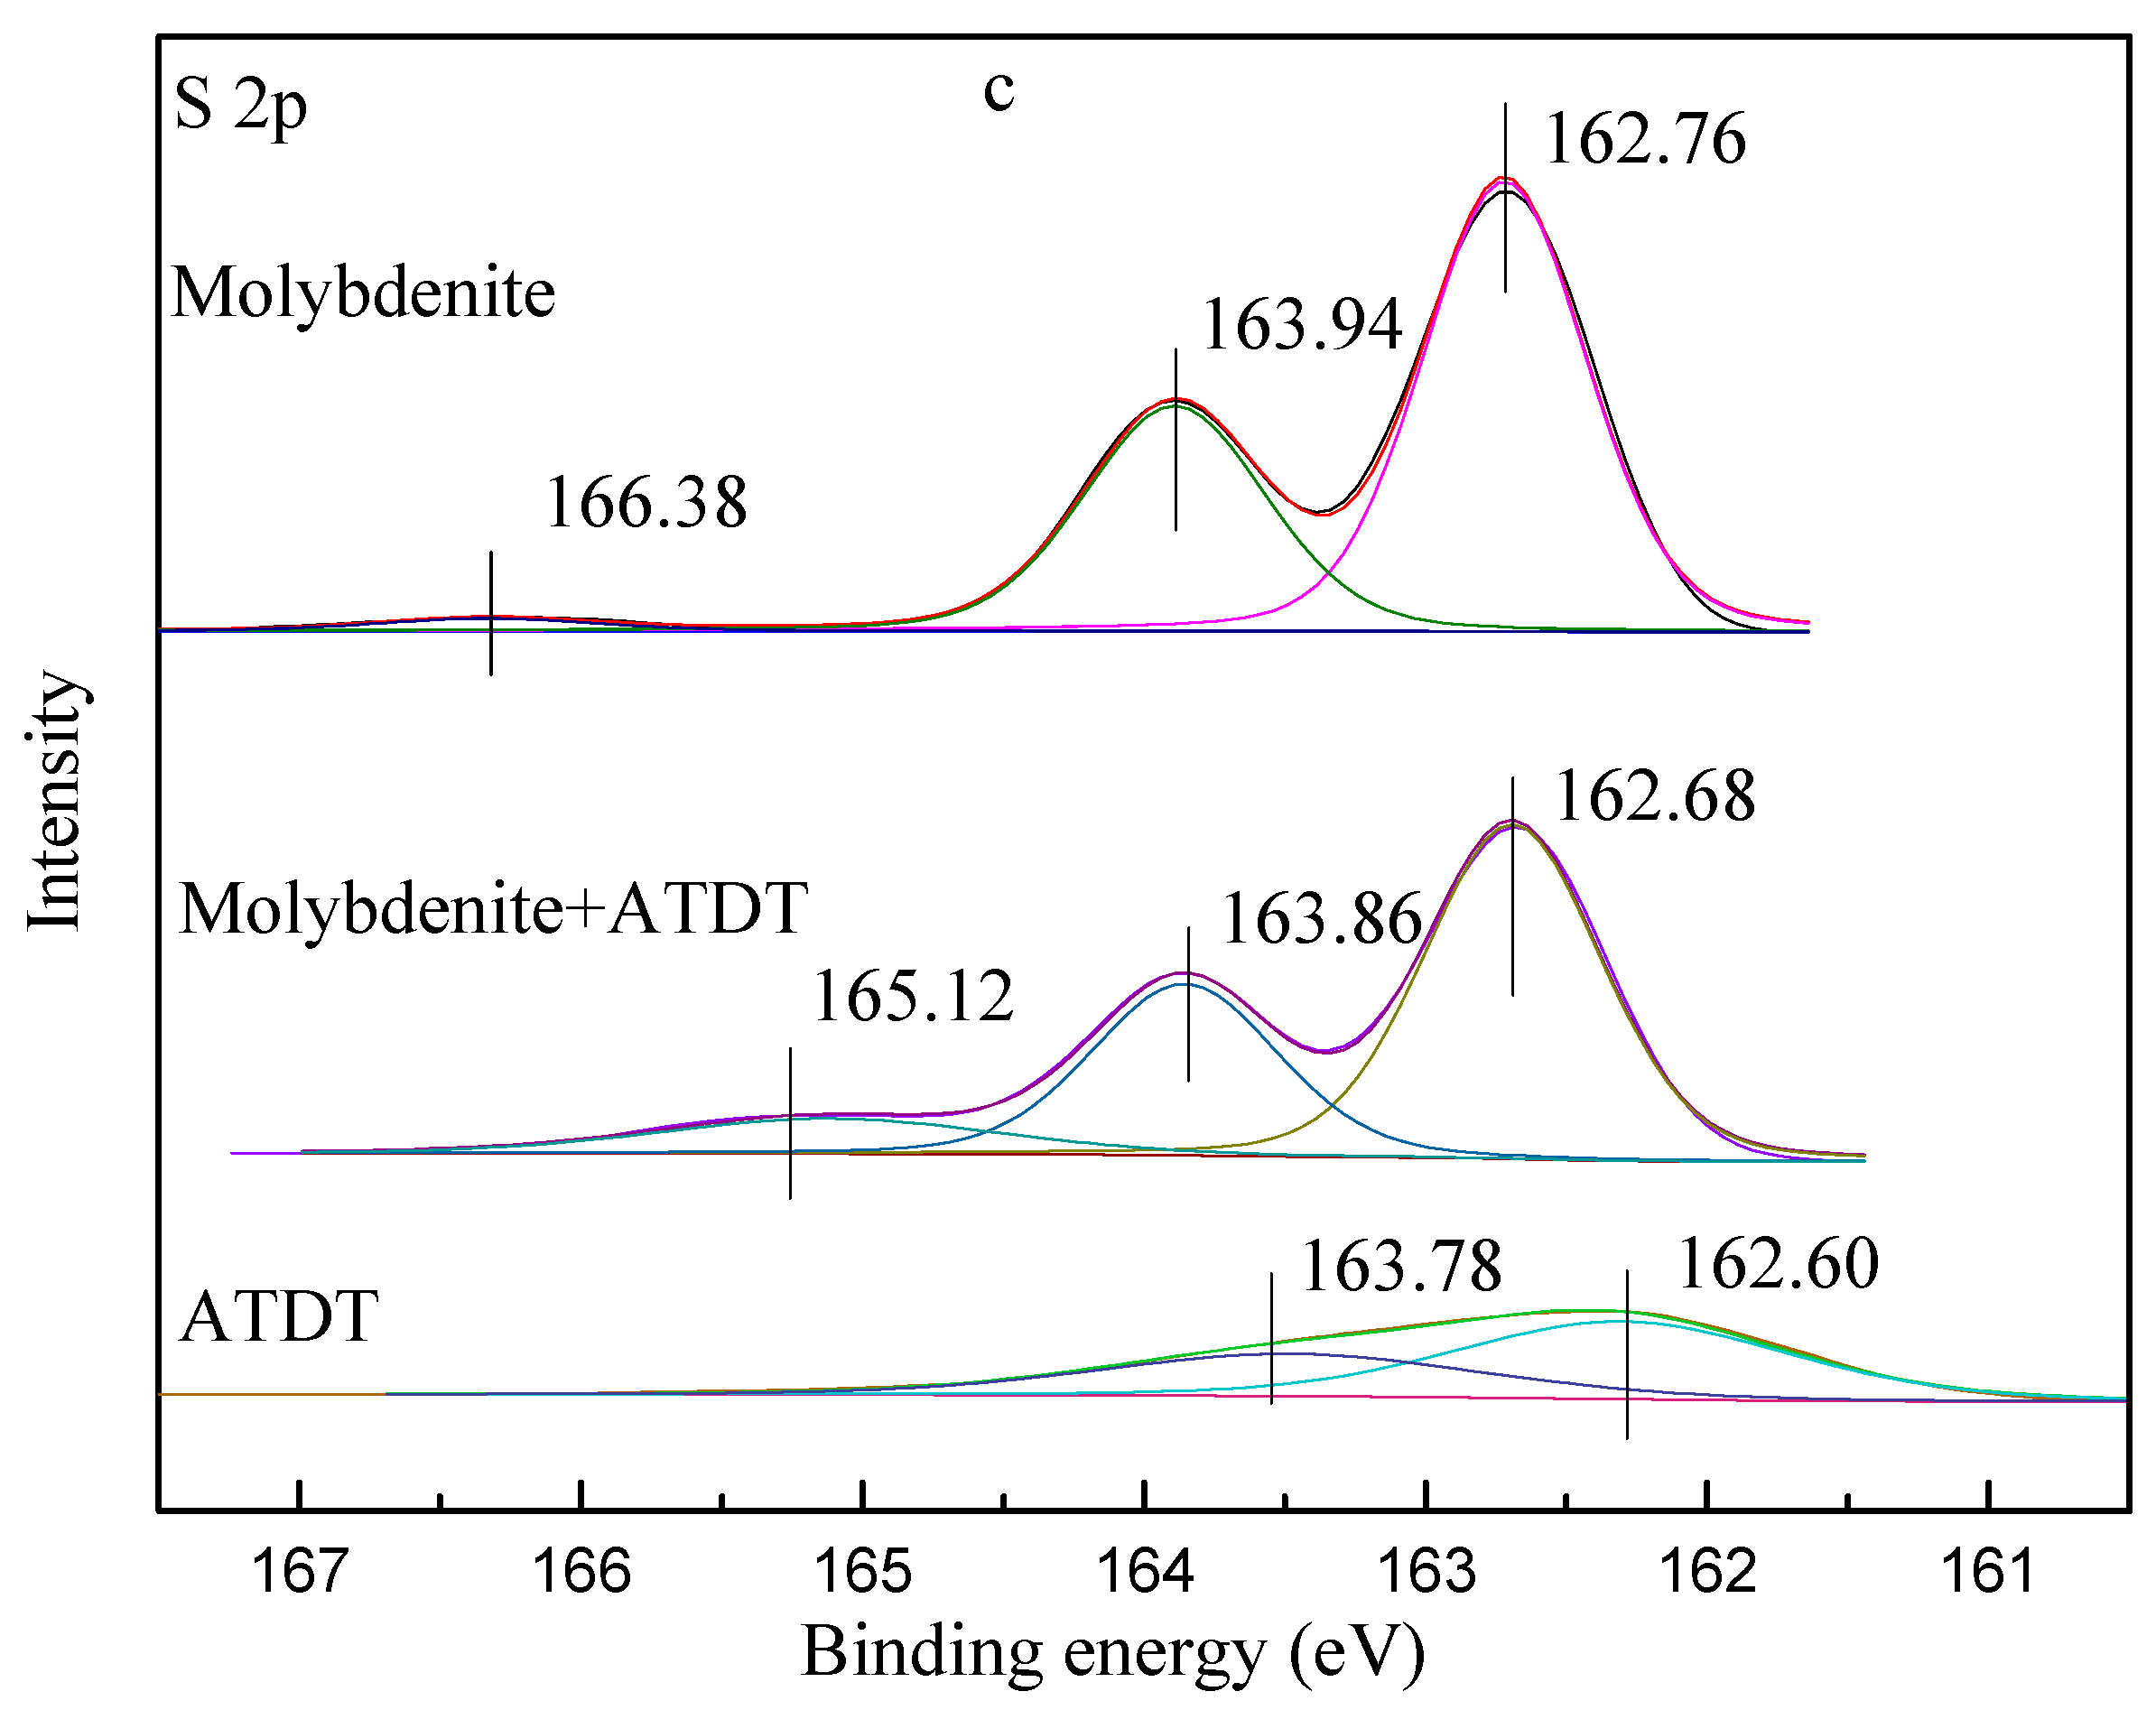
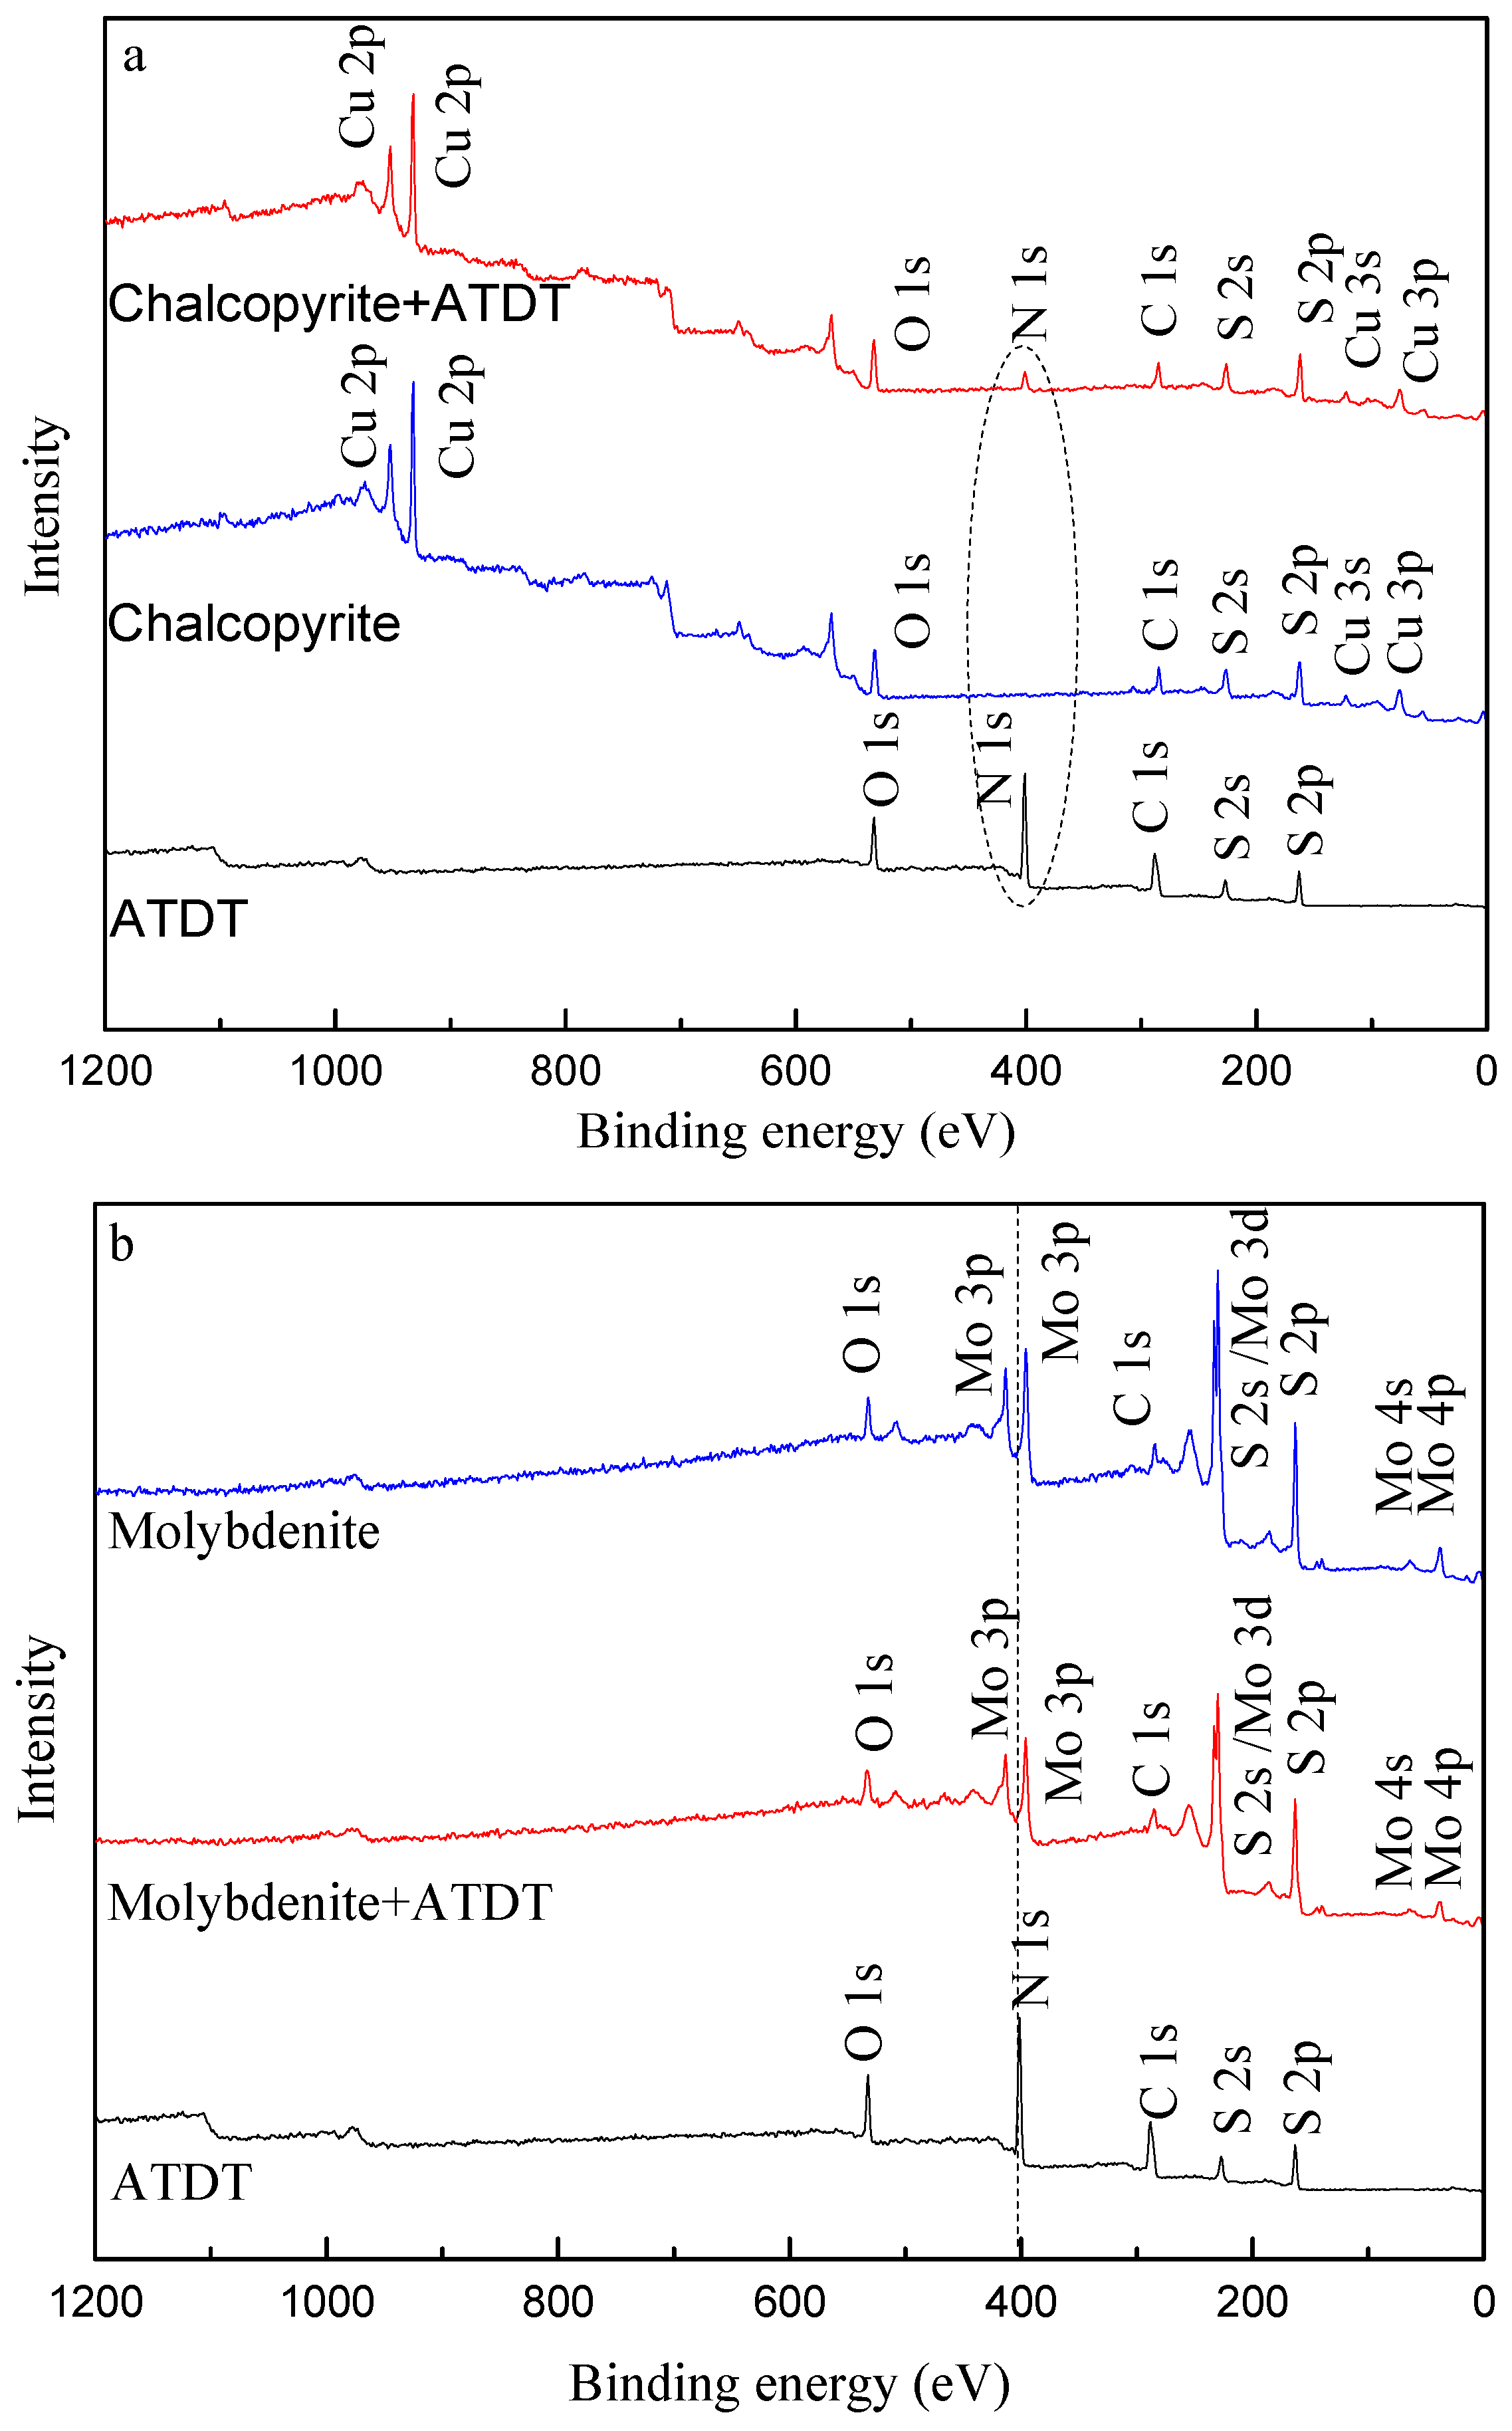
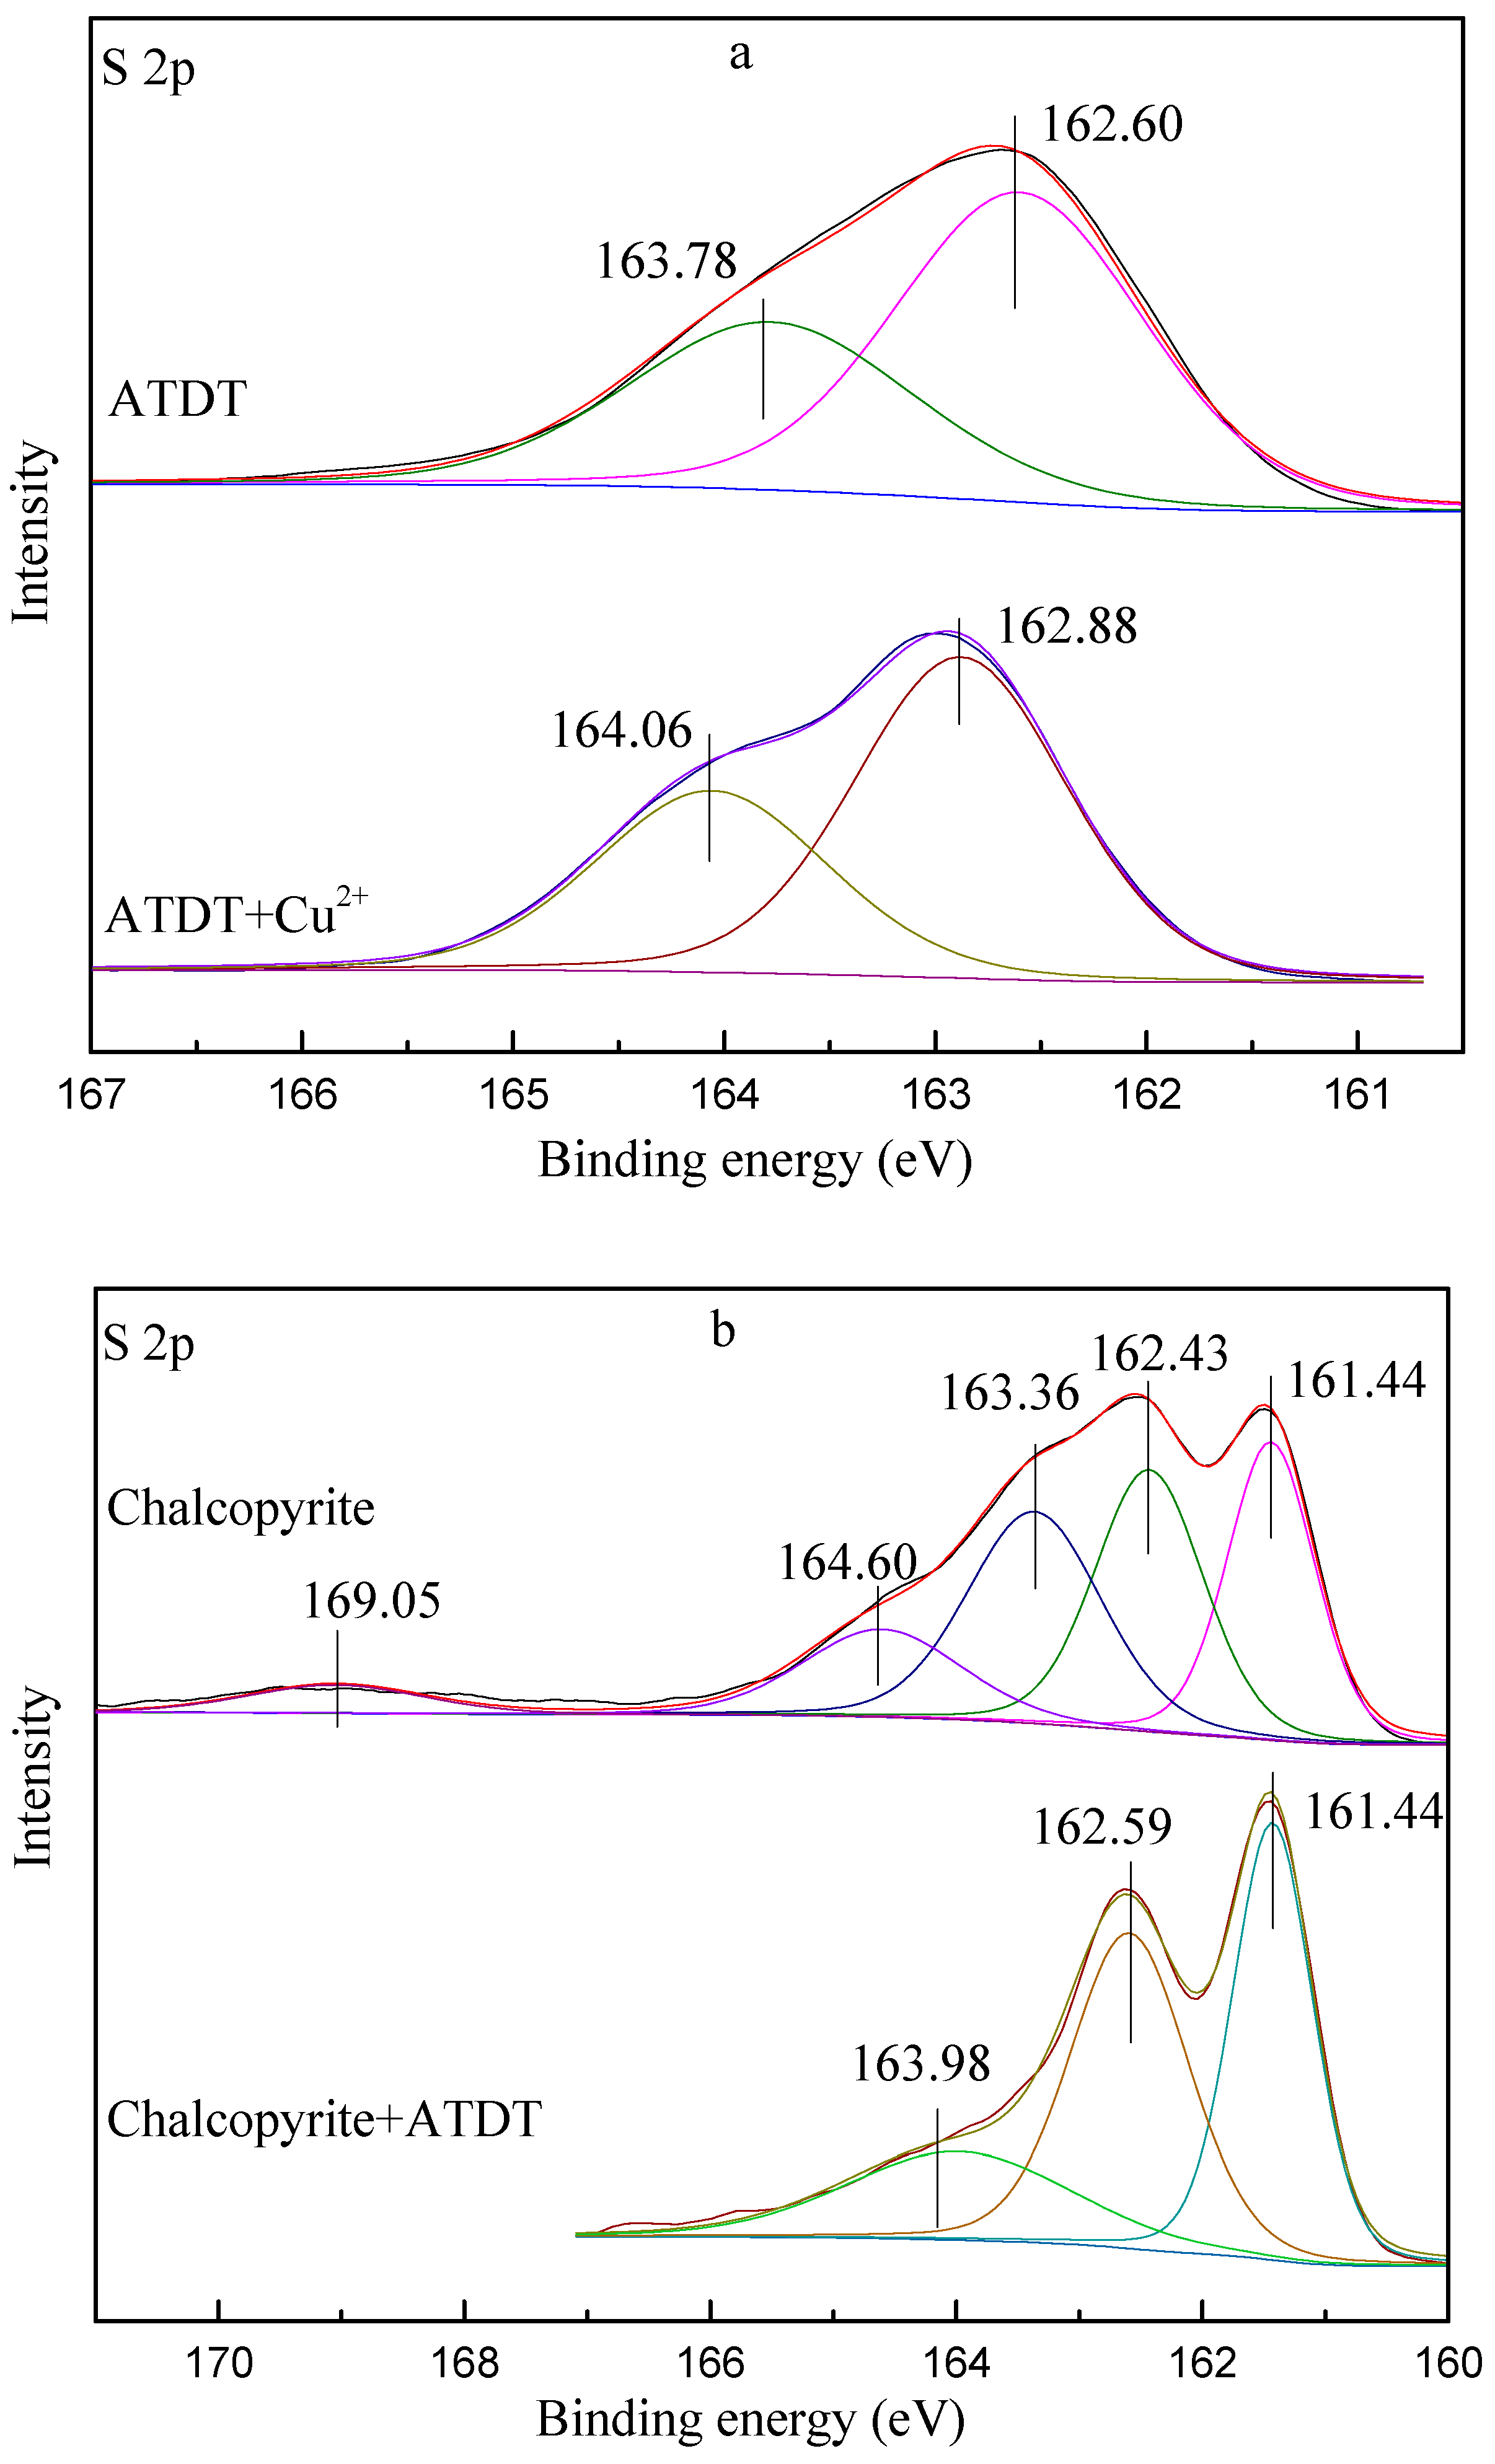
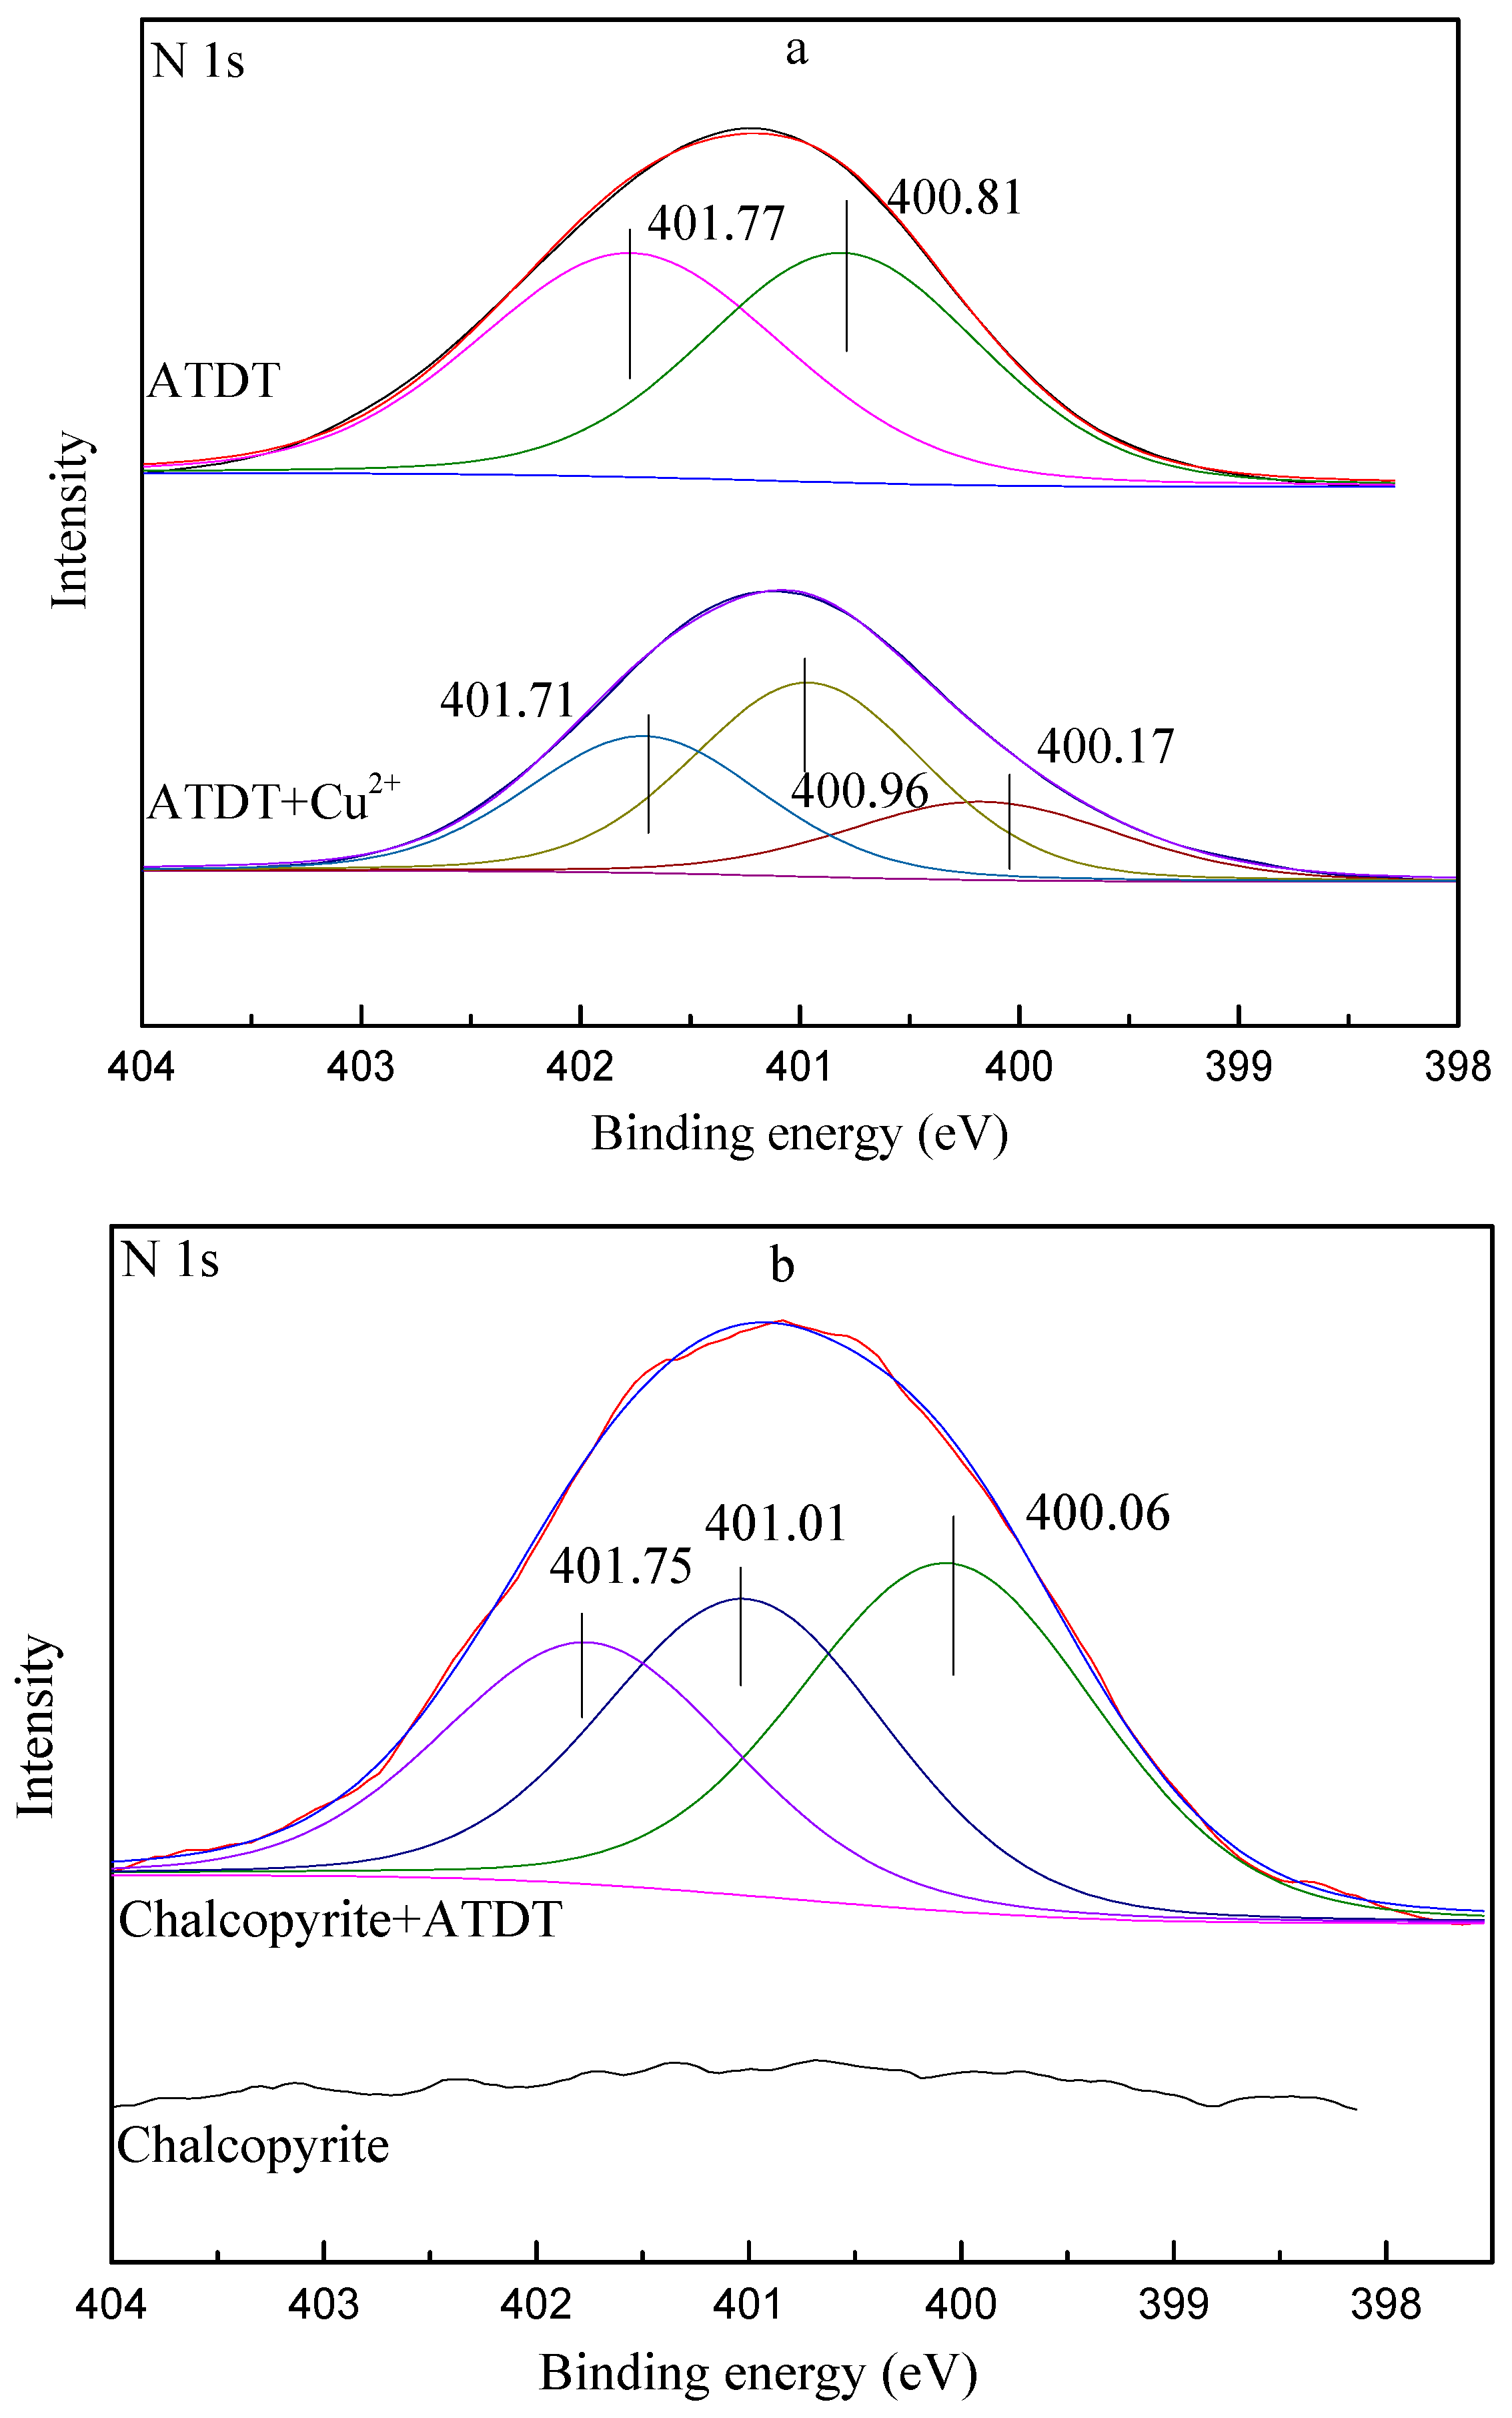
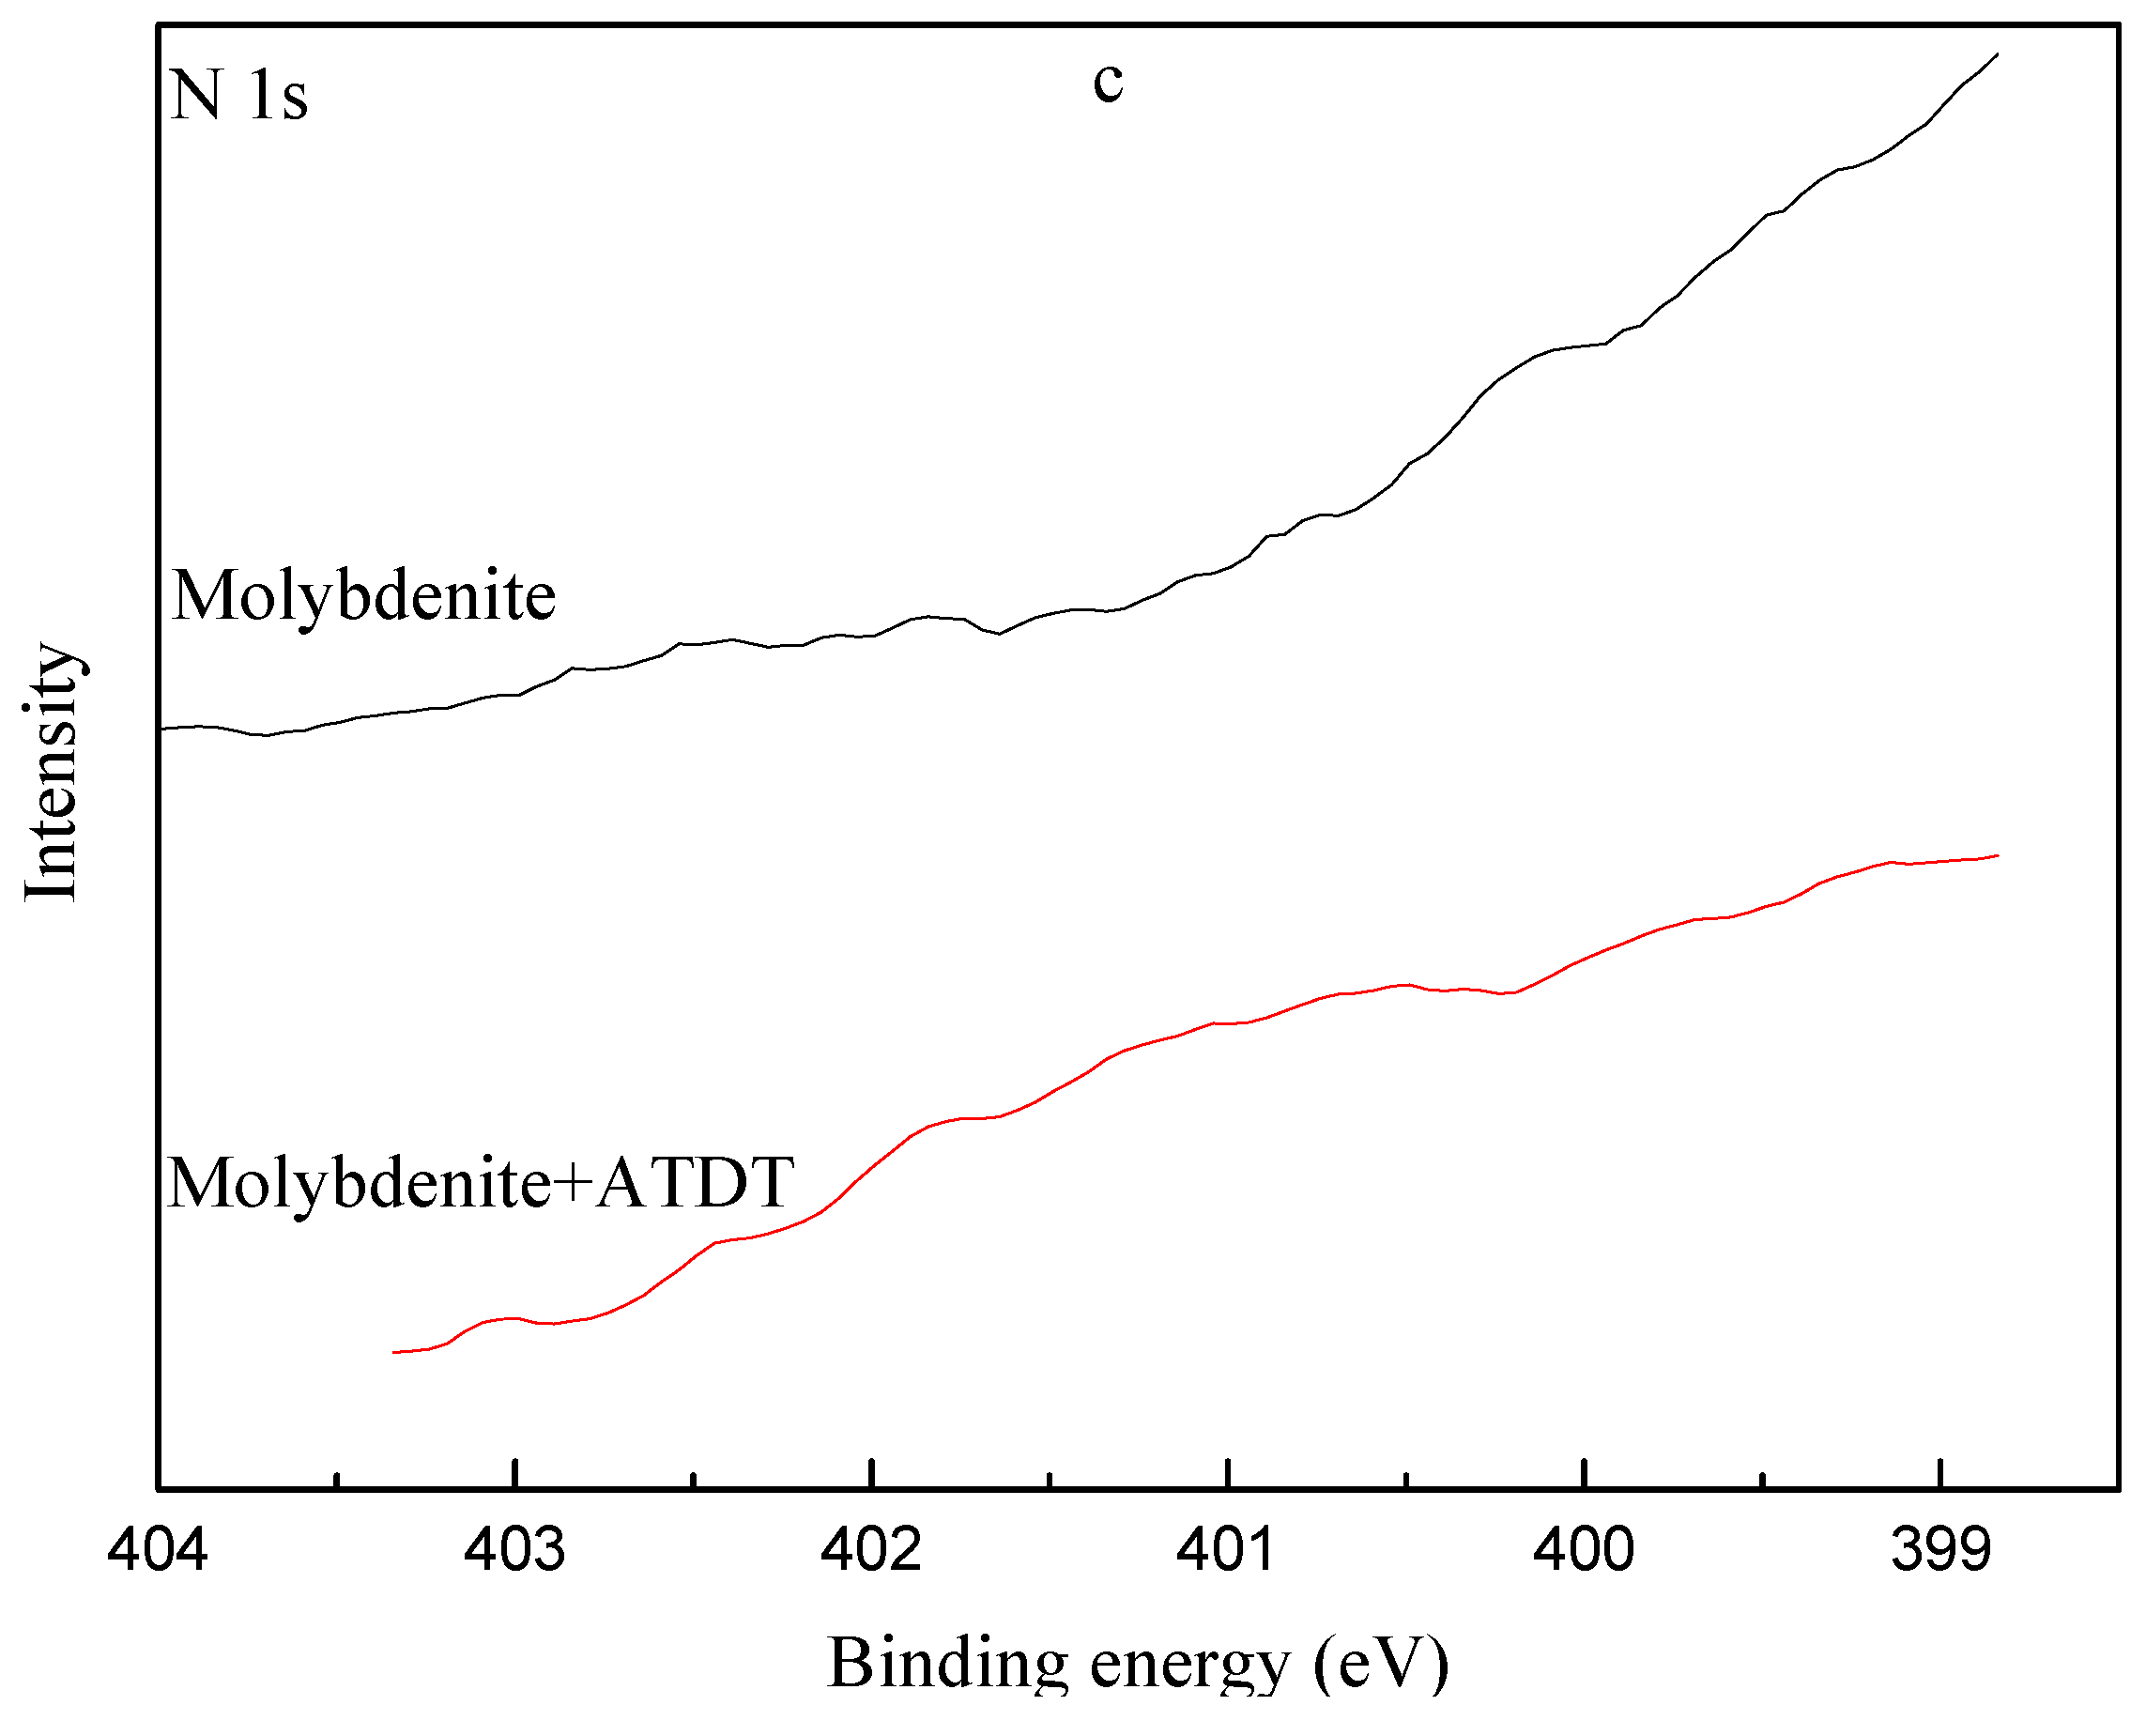
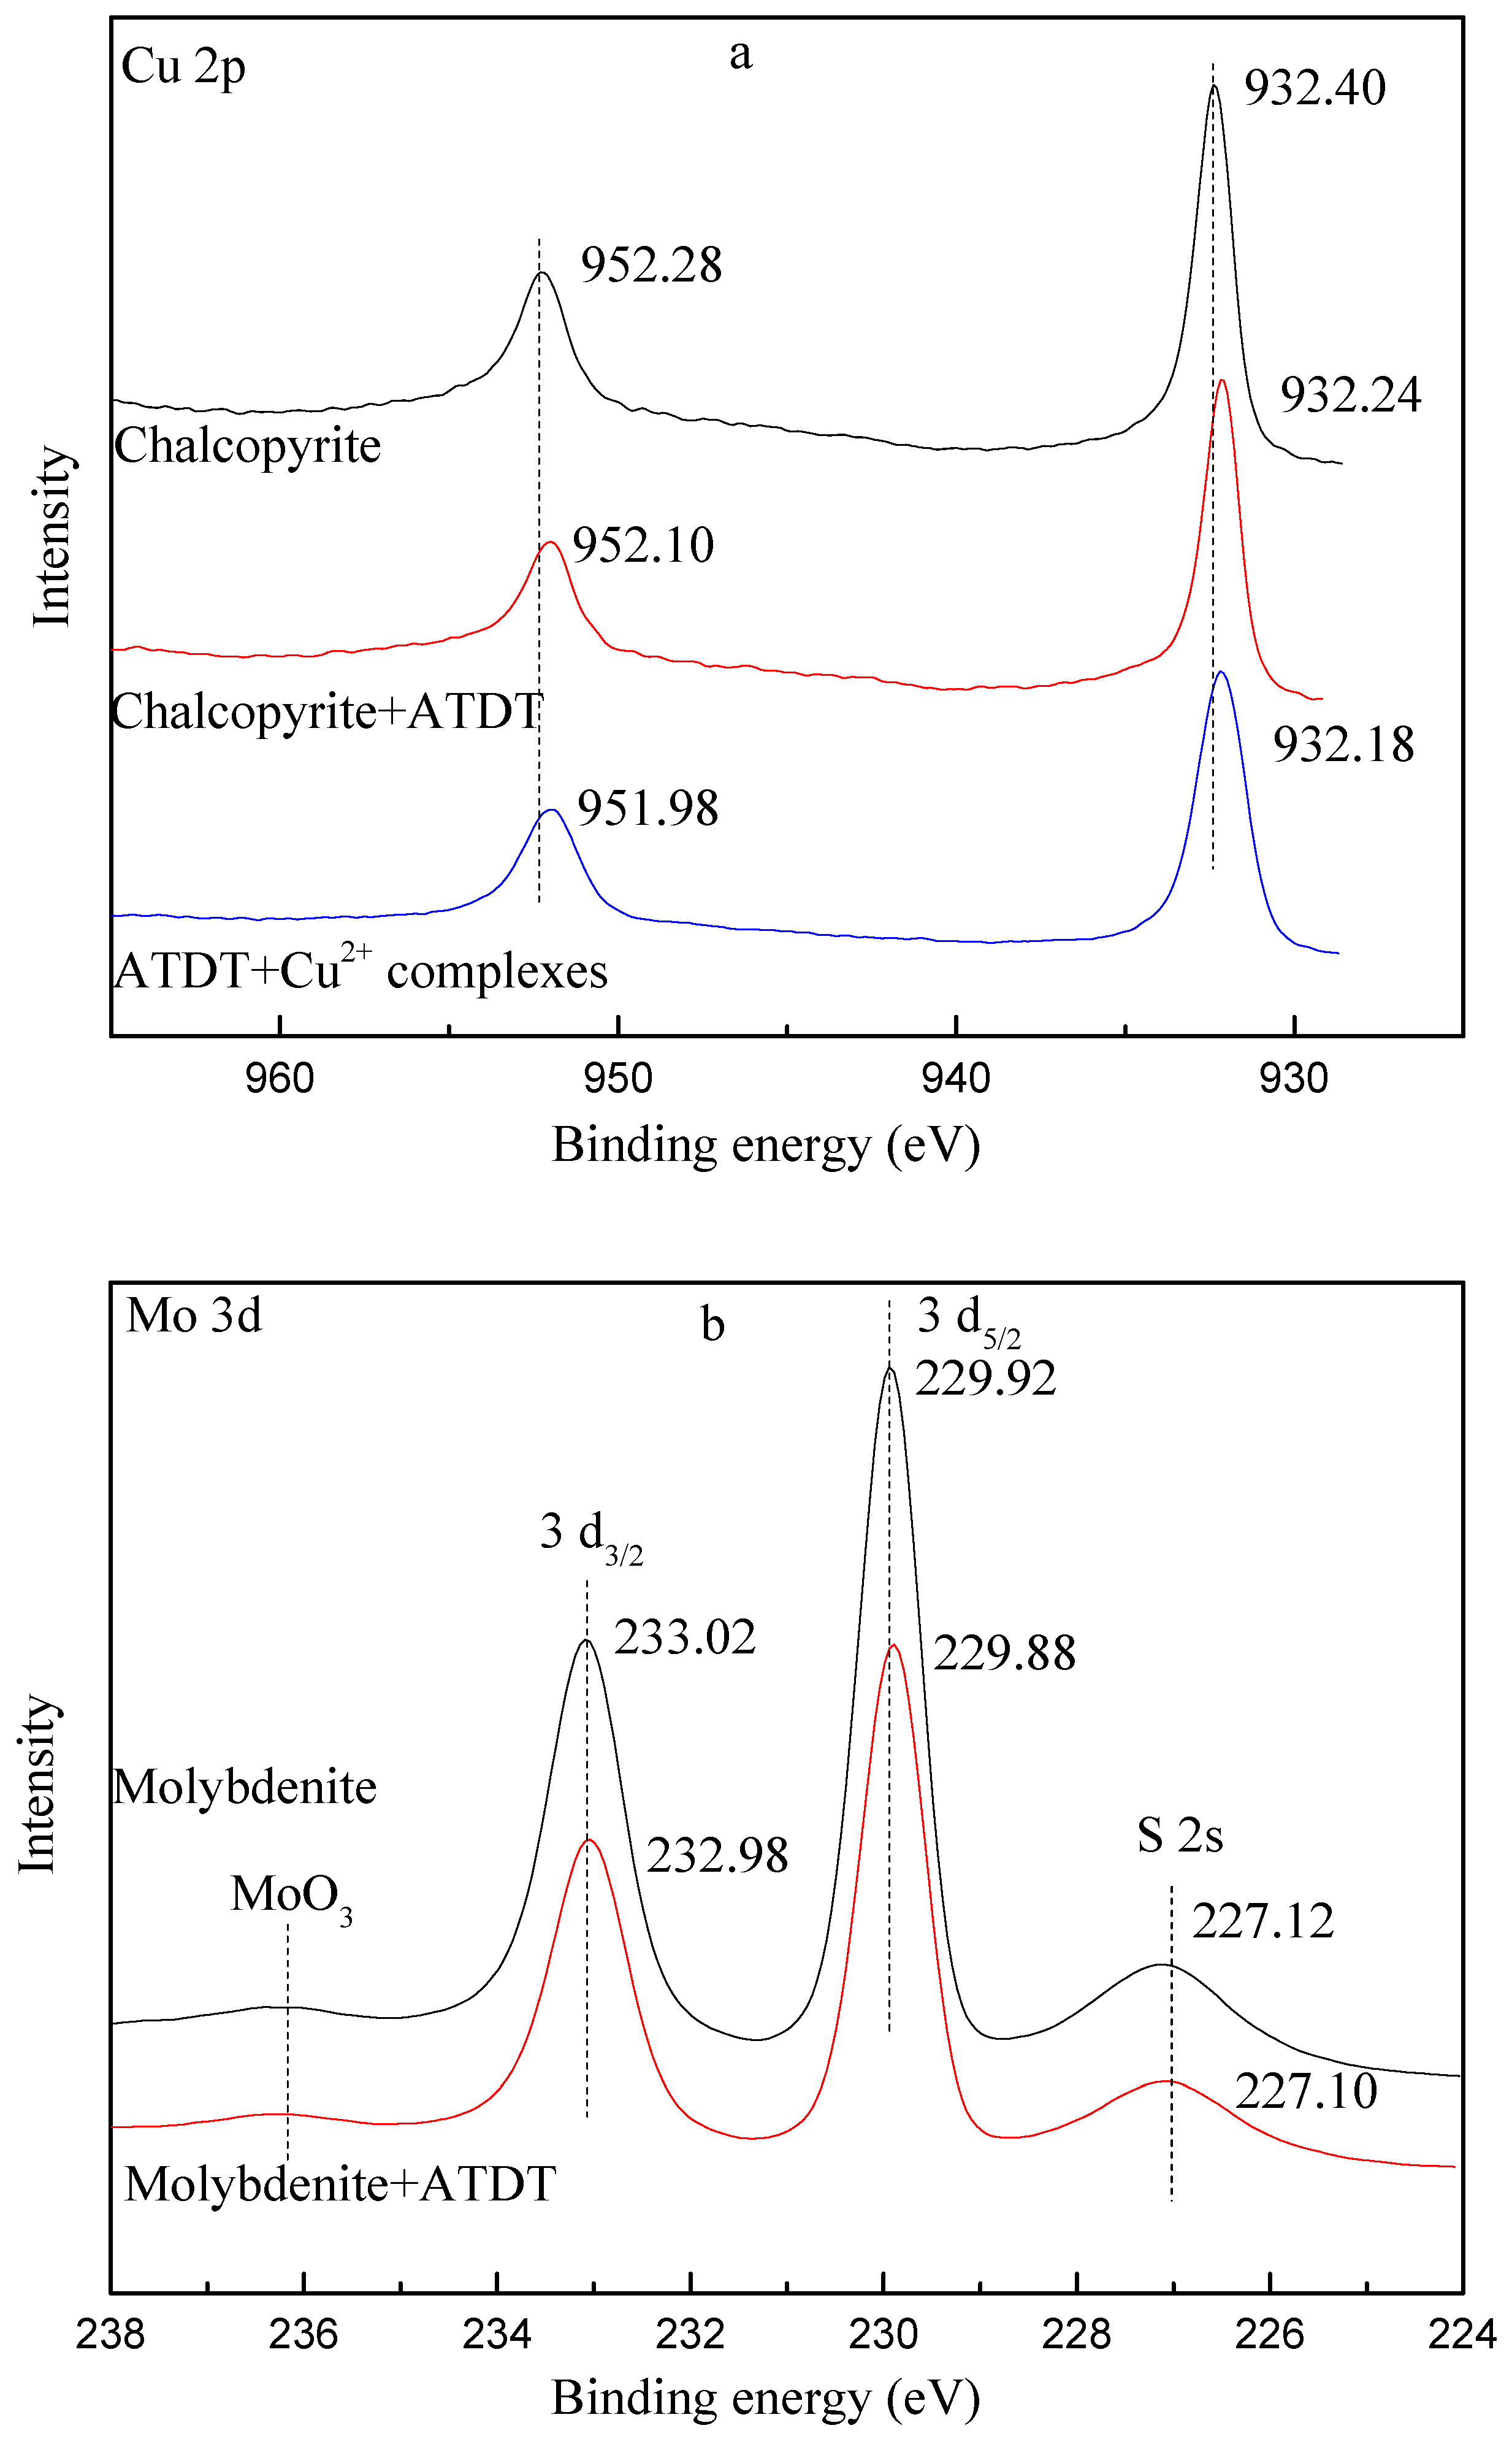
3.6. XPS Measurement

The XPS spectra of ATDT, molybdenite and chalcopyrite (before and after treatment) over a binding energy of 1200–0 eV are presented in Figure 8a,b. The atomic content of molybdenite and chalcopyrite, before and after treatment, are listed in Table 3. For chalcopyrite, the atomic concentration of C and N atoms on chalcopyrite surface increased after ATDT treatment, while that of O, S, Cu, and Fe atoms decreased, confirming the adsorption of ATDT on the chalcopyrite surface. While, Table 3 demonstrates that the atomic concentration of C, N, and O on the molybdenite surface increased after ATDT treatment, demonstrating the adsorption of ATDT onto the molybdenite surface. However, the Δ values of atomic concentration for N on chalcopyrite surfaces was far greater than that of the molybdenite surface, which indicated that the adsorption of ATDT on the chalcopyrite surface was higher than that of molybdenite surface, which was consistent with the results of FT-IR and zeta potential measurements.
The S 2p XPS spectra of ATDT, ATDT-Cu complexes, and chalcopyrite before and after treatment are displayed in Figure 9a–c. In Figure 9a, the S 2p XPS spectra of ATDT at around 162.60 and 163.78 eV were attributed to the thione sulfur of C=S and thiol sulfur of C—SH [24]. The S 2p spectrum of the ATDT-Cu complexes were composed of two components located at around 162.88 and 164.06 eV, respectively, demonstrating that the electron density of S atoms in ATDT-Cu complexes changed. In Figure 9b, the S 2p line of chalcopyrite can be fitted by five doublets with binding energies of 161.44 (S2−), 162.43 (S22−), 163.36 (Sn2−/S0), 164.60 (Loss), and 169.05 eV (SO42−), respectively. These results agreed well with those reported values for S2− and S22− centered at 161.5 eV and 162.48 eV [37,38,39] , respectively. On the other hand, the positions of the S 2p for Sn2−/S0; and SO42− species were reported to be 163.4 and 168.5/169.3 eV [40,41,42], which were very close to our experimental data, indicating the oxidation of chalcopyrite. After ATDT treatment, the S 2p spectrum of chalcopyrite could be divided into three components with the binding energy centered at 161.44, 162.59 and 163.98 eV, respectively. It should be noted that the former two doublets might be attributed to the sulfur atoms of the original chalcopyrite, which shifted by 0 and 0.16 eV, respectively. However, the binding energy at 163.98 eV was very close to the values of the ATDT-Cu complexes and with a slightly shift of 0.08 eV, which was consistent with the IR results of copper complexes indicating that sulfur atoms of ATDT might act as the reaction site.
In the high-resolution S 2p spectra of molybdenite, the peaks of two doublets were centered at 162.76 and 163.94 eV, which corresponded to the sulfur species of S22− and Sn2−/S0, respectively. In addition to the two S 2p doublets, Figure 9c presented another peak positioned at 166.38 eV, which was attributed to the SO32− species [40] indicating the oxidation of molybdenite. After the adsorption of ATDT, another peak was found centered at 165.12 eV, which is a typical characteristics of the S species [43], demonstrating that proper oxidation of the molybdenite surface benefitted the hydrophobicity of molybdenite. In other words, ATDT might benefit the oxidation of the sulfur species (S22−/Sn2−) to form S rather than SO32− or SO42− products. Furthermore, the S 2p spectra of ATDT could not be observed on the treated molybdenite surface, indicating that the adsorption of ATDT on molybdenite could not be detected. Although it seems that these findings might contradict the observation of the zeta potential of molybdenite in the presence and absence of ATDT, this contradiction could be explained by the potential factor that weakly adsorbed ATDT molecules were removed before the XPS measurement during the sample preparation process of washing and/or in the high vacuum of the XPS chamber [44].
The N 1s XPS spectra of the ATDT, ATDT-Cu complexes, and chalcopyrite before and after treatment are shown in Figure 10a,b. The N 1s XPS spectra of ATDT showed two peaks at around 400.81 and 401.77 eV, which were assigned to the nitrogen atoms of C=N—NH—C and C—N—NH2, respectively [24]. For the ATDT-Cu complexes, the N 1s XPS spectra was divided into three components centered at 400.17, 400.96, and 401.71 eV, respectively. The former peak located at around 400.17 was likely associated with the Cu—N group, which was consistent with the reported data [45], while the N 1s peaks at 400.96 and 401.71 eV were assigned to C=N—NH—C and C—N—NH2, respectively. The difference of N binding energy between the ATDT and ATDT-Cu complexes confirmed the involvement of nitrogen atoms as reaction sites. After the adsorption of ATDT (Figure 10b), the N 1s peaks could be fitted by three components centered at around 400.06, 401.01, and 401.75 eV, which were very close to the values of ATDT-Cu complexes (400.17, 400.96, and 401.71 eV). The observation of lower binding energy at 400.06 eV was likely derived from the Cu—N group, which was very close to the value presented by the ATDT complexes (400.17 eV), confirming the involvement of nitrogen for the formation of metal complexes on the chalcopyrite surface.
The high resolution of the N 1s spectra of molybdenite before and after treatment with ATDT are shown in Figure 10c. It was clear that the XPS spectra of N 1s from treated molybdenite and original molybdenite were almost identical in peak shape. In other words, after the pretreatment of molybdenite with ATDT, no obvious N 1s peaks were observed, confirming that the nitrogen atomic concentration on the surface of molybdenite could be attributed to the contamination of unknown nitrogen resources.
In Figure 11a, the two peaks at around 932.40 and 952.28 eV represent the Cu 2p3/2 and Cu 2p1/2, respectively. The Cu 2p3/2 peaks of the original chalcopyrite was centered at 932.40 eV, which was attributed to the cuprous species bonded to oxygen and sulfur [46,47]. After adsorption of ATDT, the Cu 2p bands shifted by 0.16–0.18 eV to lower binding energy, indicating that the electron density of copper ions improved. The Cu 2p XPS of the ATDT-Cu complex is displayed in Figure 11a. It was evident that there were two peaks centered at 932.18 and 951.98 eV, respectively. Compared to the original chalcopyrite, the Cu 2p bands shifted by 0.22–0.30 and 0.06–0.12 eV to lower binding energy, respectively. These differences of binding energy of ATDT-Cu, chalcopyrite before and after treatment indicated that the electron density of copper atoms was in the order of ATDT-Cu complex > treated chalcopyrite > original chalcopyrite. Based on the above mentioned findings, the possible model for ATDT adsorption on chalcopyrite might be through sulfur and nitrogen atoms to form five membered chelate rings, which was in accordance with the coordination mechanism of N,N-diethyl-N’-cyclohexylthiourea (DECTHU) [48] and S-methyldithiocarbazate (SMDTC), S-benzyldithiocarbazate (SBDTC) metal complexes [49].
The XPS Mo 3d spectra before and after treatment are displayed in Figure 11b. The peaks centered at 229.92 and 233.02 eV corresponded to the Mo4+ 3d5/2 and Mo4+ 3d3/2 components of original molybdenite [50], respectively. The separation energies of 3d3/2 and 3d5/2 was 3.10 eV, which was in good agreement with previous reports [51]. The peak at the lower binding energy of 227.12 eV corresponded to the S 2s components of molybdenite [52]. A weak peak centered at around 236.2 eV was assigned to Mo6+ 3d5/2, demonstrating that the oxidation of Mo was minimal [43], which was consistent with the S 2s spectra of the molybdenite above. After ATDT treatment, the Mo 3d XPS bands of the molybdenite surface could be divided into three components with the binding energies of 229.88 (3d5/2), 232.98 (3d3/2), and 236.15 eV (oxide of the molybdenum species), respectively. Compared to the binding energy of the original molybdenite, there was no obvious shift of binding energy, indicating that the weakly adsorbed ATDT molecules may have been removed before XPS measurement, which was consistent with the analysis results of the S 2p spectrum and N 1s spectrum. Therefore, based on the findings of zeta potential, FT-IR, and XPS measurements, a conclusion was drawn that ATDT might weakly physisorb onto the molybdenite surface.

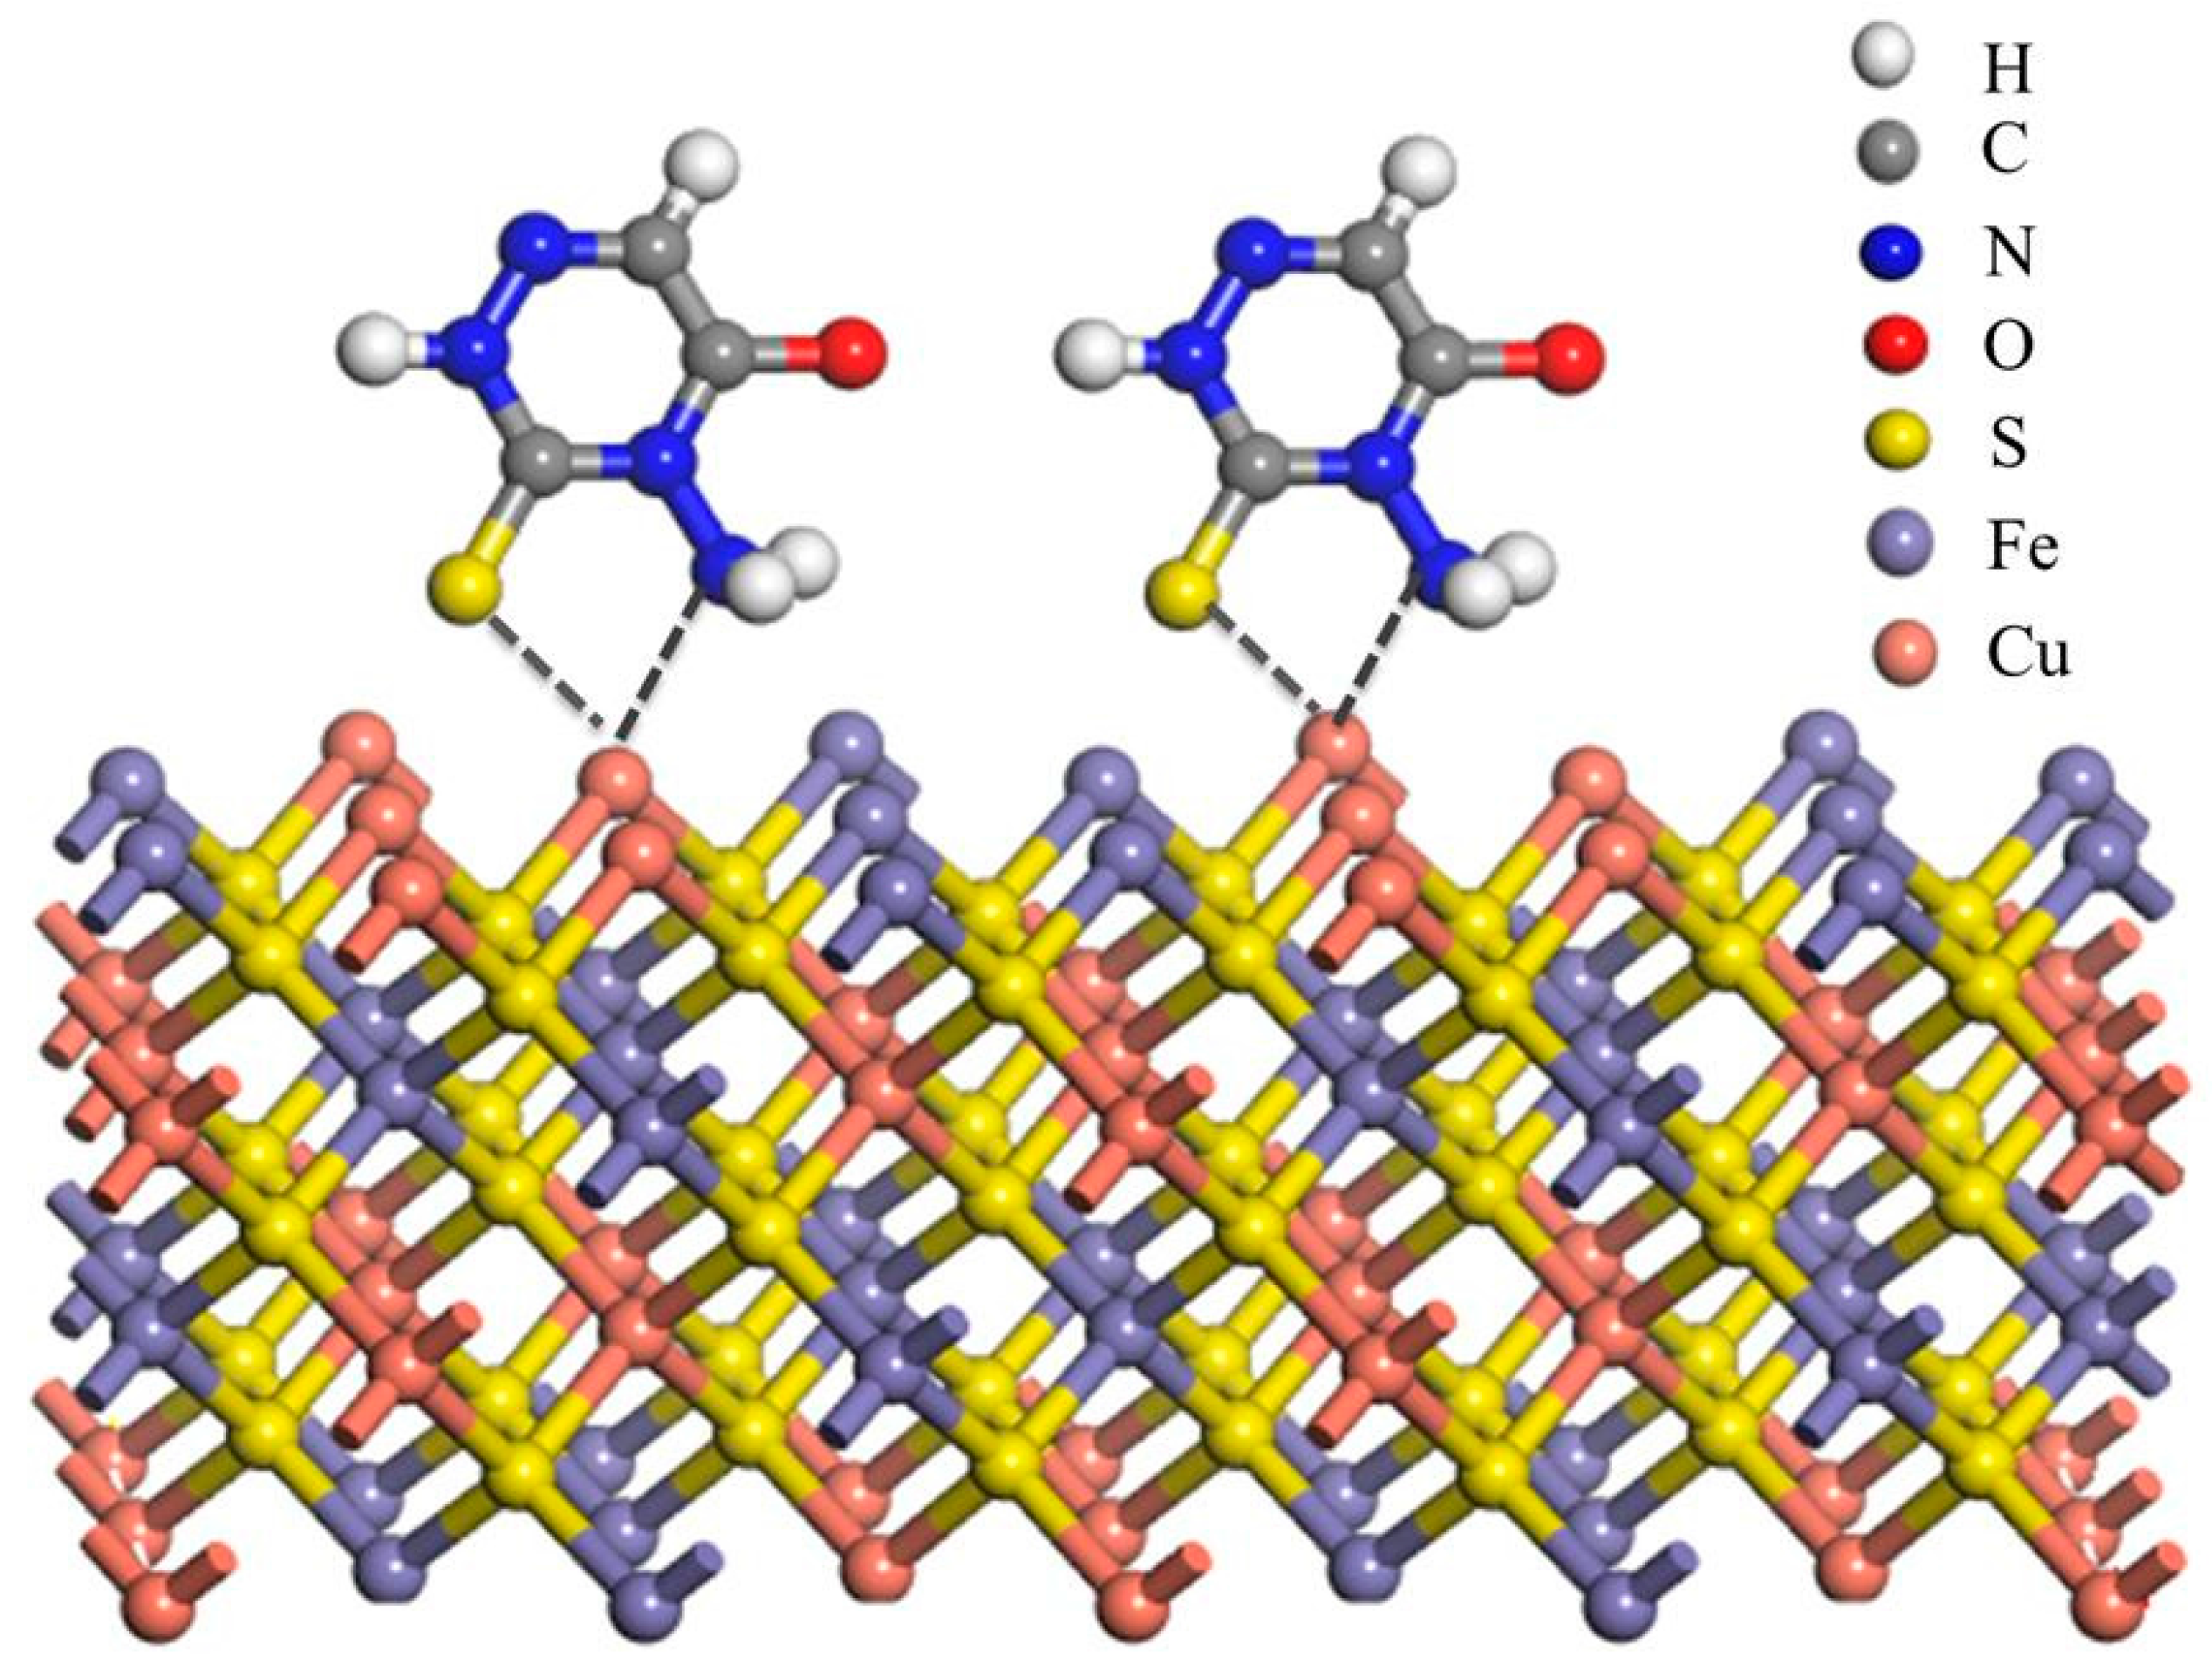
3.7. The Adsorption Model

The results of the zeta potential measurements suggested that ATDT might chemisorb onto the chalcopyrite surface, thus decreasing its zeta potential significantly, which was identified by FT-IR. The XPS analysis results further demonstrated that ATDT might adsorb on the chalcopyrite surface through N and S atoms to form five member rings. Based on the above findings, the predicted adsorption modes were postulated for the surface interaction between ATDT and chalcopyrite (Figure 12).

4. Conclusions

In the present investigation, 4-amino-3-thioxo-3,4-dihydro-1,2,4-triazin-5(2H)-one was synthesized and characterized by 1H-NMR, 13C-NMR, MS spectra and element analysis. The novel compound was subjected to selective flotation separation of molybdenite from chalcopyrite. The adsorption mechanisms of ATDT to molybdenite and chalcopyrite were evaluated by UV, zeta potential, FT-IR, and XPS measurements. Based on the observations of our experiments, the following conclusions were drawn:
(1)
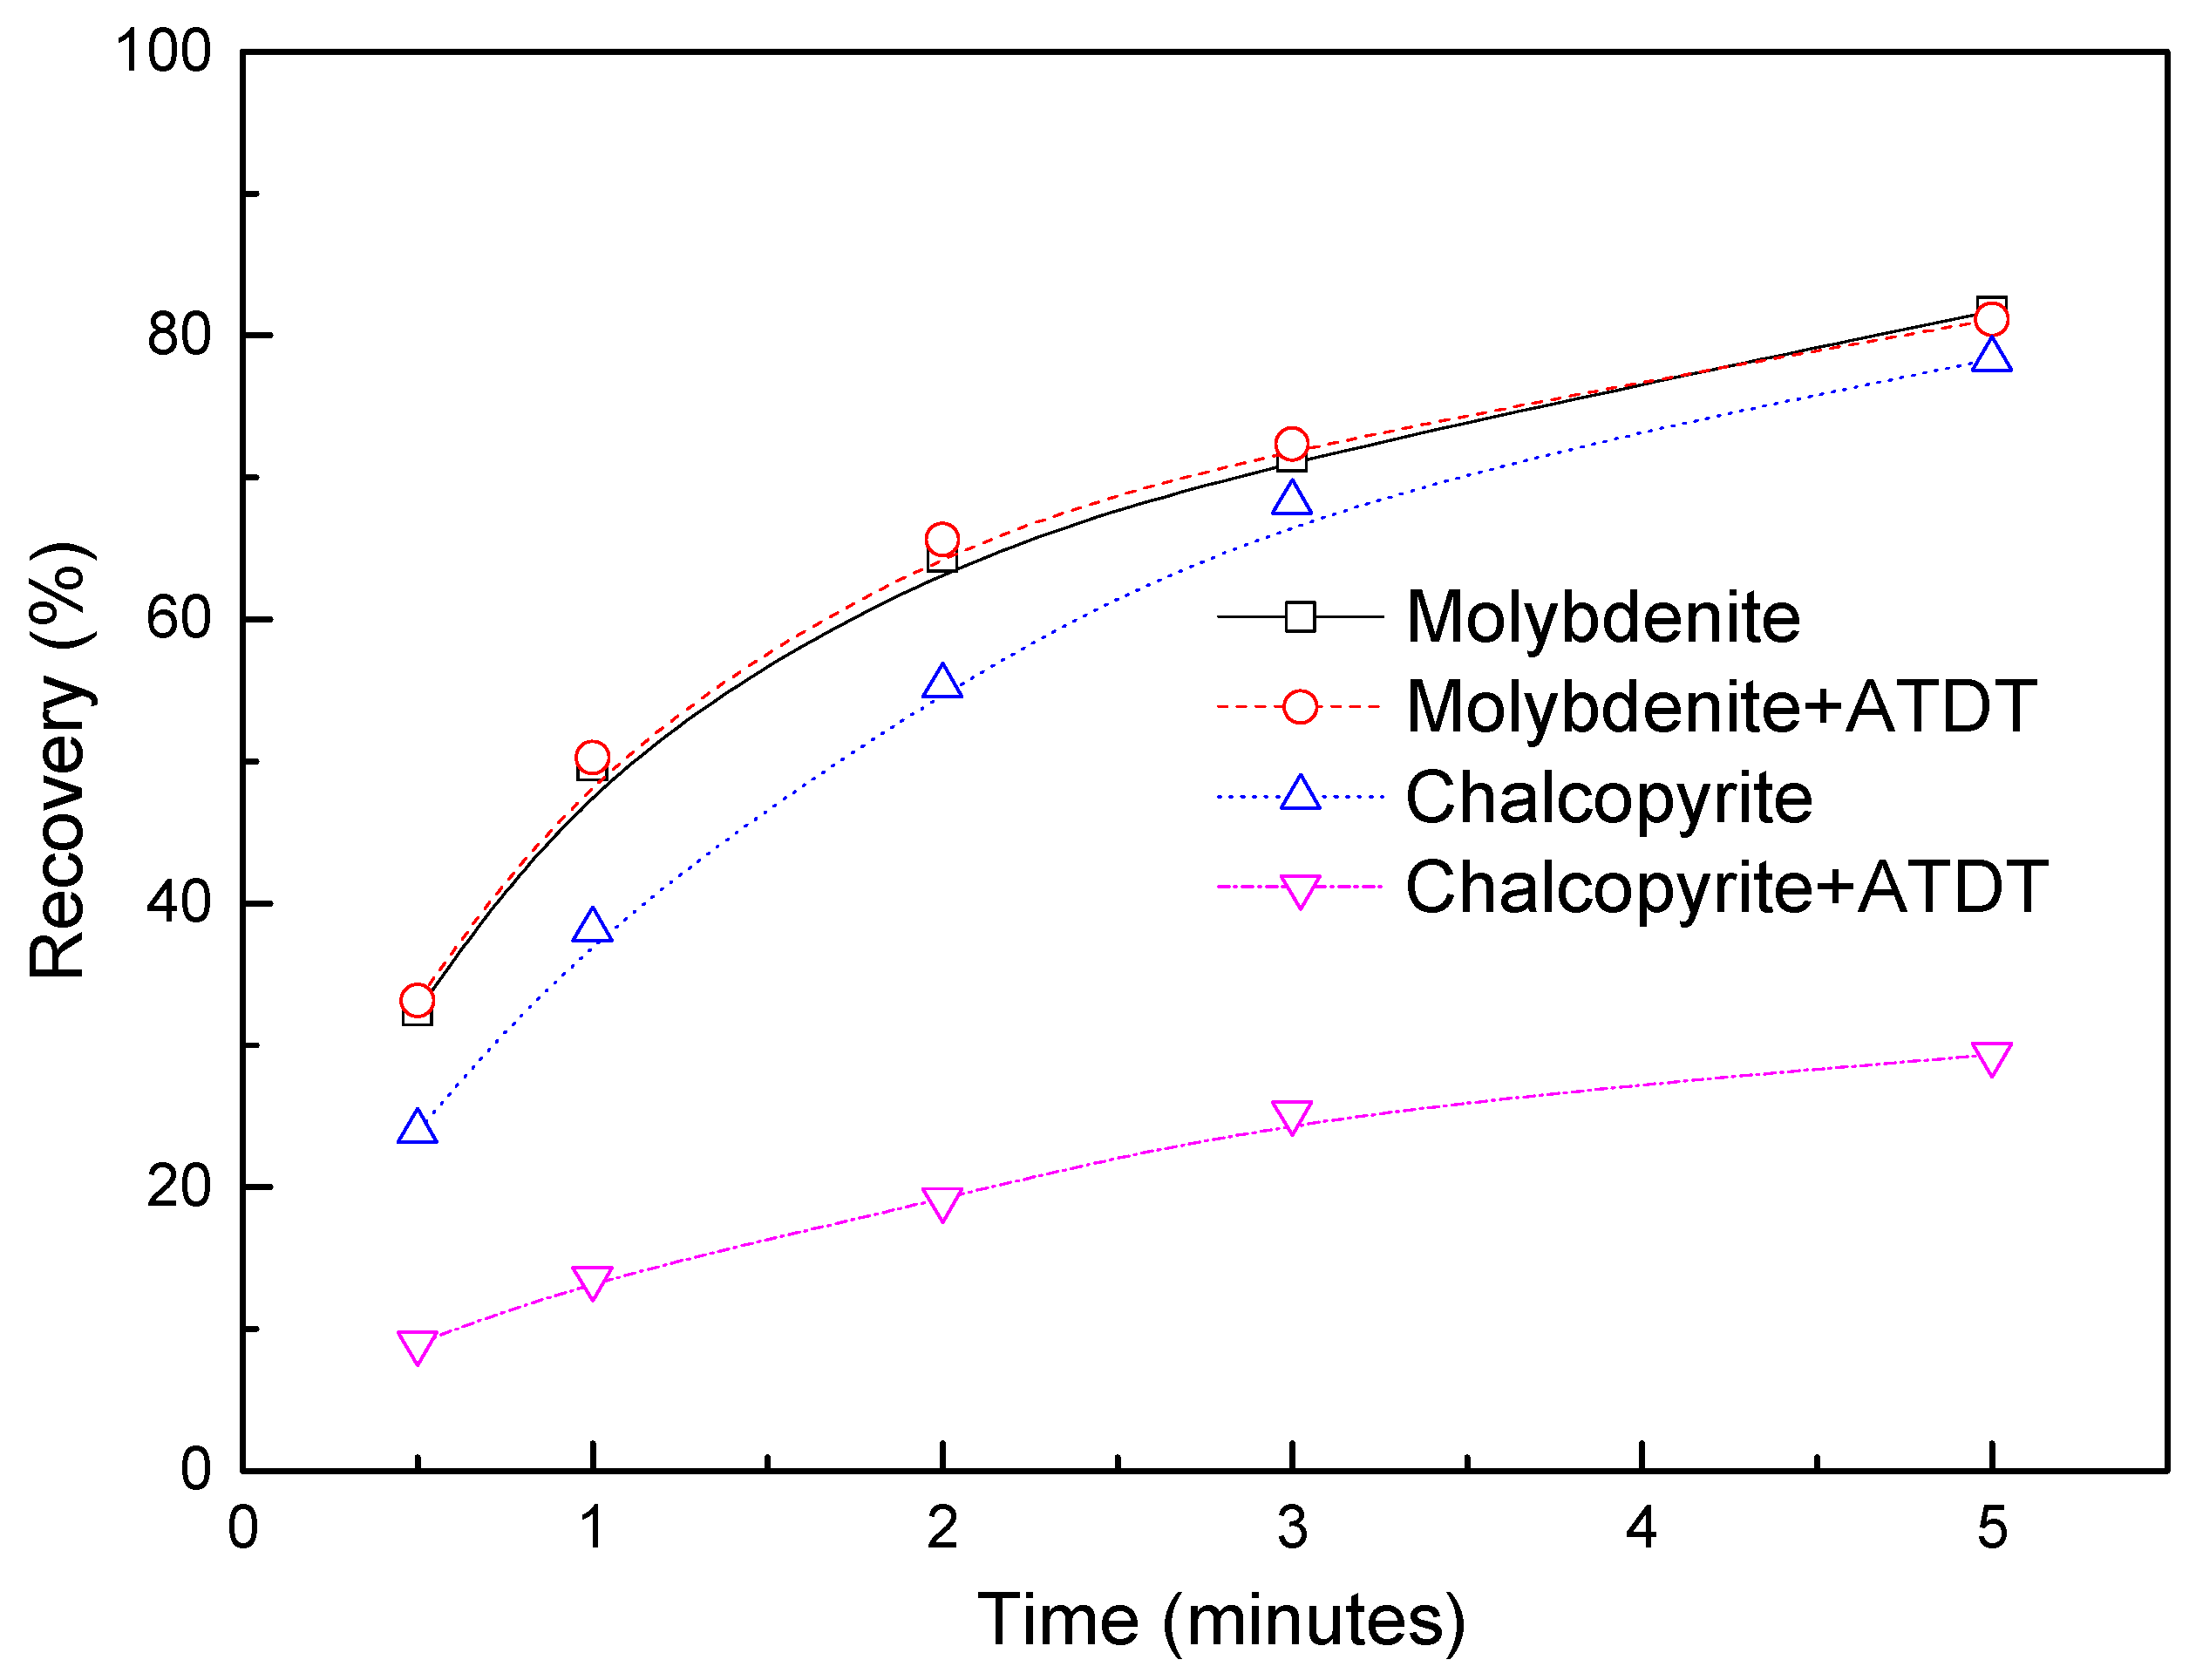
The micro flotation results demonstrated that ATDT exhibited superior depressing power to chalcopyrite, thus the flotation separation of molybdenite from chalcopyrite could be realized under weak alkaline conditions.
(2)
The results of bench flotation indicated that the selective index of Mo/Cu improved significantly while ATDT was used as a potential chalcopyrite depressant in bench scale Cu-Mo flotation separation tests.
(3)
The results of the Zeta potential, UV spectra, FT-IR, and XPS analysis demonstrated that ATDT might react with Cu ions through N and thiol S atoms through the formation of copper complexes with the breakage of S-H bonds. However, for molybdenite, the possible physisorption mechanism of ATDT on molybdenite might be dominated by hydrogen bonds or Van der Waals' force electrostatic forces.

Acknowledgments

This work was supported by the National 111 Project (No. B14034); Collaborative Innovation Center for Clean and Efficient utilization of Strategic Metal Mineral Resources; Innovation Driven Plan of Central South University (No. 2015CX005); the National Science and Technology Support Project of China and Natural Science Foundation of China(No. 51374247). The authors also gratefully acknowledge the Yichun Luming Mining Co., Ltd. for sample collecting and assay.

Author Contributions

Wei Sun and Yuehua Hu conceived and designed the experiments; Zhigang Yin, Chenhu Zhang, performed the experiments and analyzed the data; Wei Sun and Yuehua Hu contributed reagents and materials; Zhigang Yin, Chenhu Zhang, Qingjun Guan, Chenyang Zhang wrote the paper.

Conflicts of Interest

The authors declare no conflict of interest.

References

  1. Wie, J.M.; Fuerstenau, D.W. The effect of dextrin on surface properties and the flotation of molybdenite. Int. J. Miner. Process. 1974, 1, 17–32. [Google Scholar] [CrossRef]
  2. Hadi, A.; Zahra, M.; Ziaedin, S.S.; Mohammad, N.; Navid, M.M. Removal of copper from molybdenite concentrate by mesophilic and extreme thermophilic microorganisms. Int. J. Min. Sci. Technol. 2013, 23, 827–834. [Google Scholar]
  3. Yin, Z.; Sun, W.; Hu, Y.; Zhai, J.; Guan, Q. Evaluation of the replacement of NaCN with depressant mixtures in the separation of copper–molybdenum sulphide ore by flotation. Sep. Purif. Technol. 2017, 173, 9–16. [Google Scholar] [CrossRef]
  4. Peterson, J.A.; Saran, M.S.; Wisnouskas, J.S. Differential flotation reagent for molybdenum separation. U.S. Patent 4,575,419 A, 11 March 1986. [Google Scholar]
  5. Srivastava, A.K.; Kumar, A.; Misra, N.; Manjula, P.S.; Sarojini, B.K.; Narayana, B. Synthesis, spectral (FT-IR, UV-Visible, NMR) features, biological activity prediction and theoretical studies of 4-Amino-3-(4-hydroxybenzyl)-1H-1,2,4-triazole-5(4H)-thione and its tautomer. J. Mol. Struct. 2016, 1107, 137–144. [Google Scholar] [CrossRef]
  6. Ghosh, S.; Verma, A.; Mukerjee, A.; Mandal, M.K. Synthesis, characterization and antimicrobial evaluation of some novel 1,2,4-triazolo[3,4-b][1,3,4]thiadiazine bearing substituted phenylquinolin-2-one moiety. Arab. J. Chem. 2015, in press. [Google Scholar] [CrossRef]
  7. Singh, K.; Raparia, S.; Surain, P. Co(II), Ni(II), Cu(II) and Zn(II) Complexes of 4-(4-cyanobenzylideneamino)-3-mercapto-5-oxo-1,2,4-triazine: Synthesis, characterization and biological studies. Med. Chem. Res. 2014, 24, 2336–2346. [Google Scholar] [CrossRef]
  8. Rathi, P.; Singh, D.P. Template engineered biopotent macrocyclic complexes involving furan moiety: Molecular modeling and molecular docking. J. Mol. Struct. 2015, 1093, 201–207. [Google Scholar] [CrossRef]
  9. Singh, R.N.; Rawat, P.; Sahu, S. Vibrational spectra, electronic absorption, nonlinear optical properties, evaluation of bonding, chemical reactivity and thermodynamic properties of ethyl 4-(1-(2-(hydrazinecarbonothioyl)hydrazono)ethyl)-3,5-dimethyl-1H-pyrrole-2-carboxylate molecule by ab initio HF and density functional methods. Spectrochim. Acta Part A Mol. Biomol. Spectrosc. 2015, 135, 1162. [Google Scholar]
  10. Subashchandrabose, S.; Thanikachalam, V.; Manikandan, G.; Saleem, H.; Erdogdu, Y. Synthesis and spectral characterization of bis(4-amino-5-mercapto-1,2,4-triazol-3-yl)propane. Spectrochim. Acta Part A Mol. Biomol. Spectrosc. 2016, 157, 96. [Google Scholar] [CrossRef] [PubMed]
  11. Ahmad, M.; Manzoor, K.; Ahmed, S.; Ikram, S. Synthesis and characterization of terepthalaldehyde–thiocarbohydrazide polymer doped with Cu(II) and Zn(II) Metal ions for solar cell applications. Opt. Int. J. Light Electron Opt. 2016, 127, 4329–4332. [Google Scholar] [CrossRef]
  12. Esmaeili, N.; Neshati, J.; Yavari, I. Corrosion inhibition of new thiocarbohydrazides on the carbon steel in hydrochloric acid solution. J. Ind. Eng. Chem. 2015, 22, 159–163. [Google Scholar] [CrossRef]
  13. Ansari, K.R.; Quraishi, M.A.; Singh, A. Isatin derivatives as a non-toxic corrosion inhibitor for mild steel in 20% H2SO4. Corros. Sci. 2015, 95, 62–70. [Google Scholar] [CrossRef]
  14. John, S.; Joseph, A.; Sajini, T.; Jose, A. Corrosion inhibition properties of 1,2,4-Hetrocyclic Systems: Electrochemical, theoretical and Monte Carlo simulation studies. J. Egypt. J. Pet. 2016, in press. [Google Scholar] [CrossRef]
  15. Bahadır, Z.; Bulut, V.N.; Ozdes, D.; Duran, C.; Bektas, H.; Soylak, M. Separation and preconcentration of lead, chromium and copper by using with the combination coprecipitation-flame atomic absorption spectrometric determination. J. Ind. Eng. Chem. 2014, 20, 1030–1034. [Google Scholar] [CrossRef]
  16. Nalawade, R.A.; Nalawade, A.M.; Kamble, G.S.; Anuse, M.A. Rapid, synergistic extractive spectrophotometric determination of copper(II) by using sensitive chromogenic reagent N″,N″′-bis[(E)-(4-fluorophenyl) methylidene]thiocarbonohydrazide. Spectrochim. Acta A Mol. Biomol. Spectrosc. 2015, 146, 297–306. [Google Scholar] [CrossRef] [PubMed]
  17. Aly, H.M.; Moustafa, M.E.; Nassar, M.Y.; Abdelrahman, E.A. Synthesis and characterization of novel Cu (II) complexes with 3-substituted-4-amino-5-mercapto-1,2,4-triazole Schiff bases: A new route to CuO nanoparticles. J. Mol. Struct. 2015, 1086, 223–231. [Google Scholar] [CrossRef]
  18. Yurt, A.; Balaban, A.; Kandemir, S.U.; Bereket, G.; Erk, B. Investigation on some Schiff bases as HCl corrosion inhibitors for carbon steel. Mater. Chem. Phys. 2004, 85, 420–426. [Google Scholar] [CrossRef]
  19. Gürten, A.A.; Keleş, H.; Bayol, E.; Kandemirli, F. The effect of temperature and concentration on the inhibition of acid corrosion of carbon steel by newly synthesized Schiff base. J. Ind. Eng. Chem. 2014, 27, 68–78. [Google Scholar] [CrossRef]
  20. Mccarrick, R.M.; Eltzroth, M.J.; Squattrito, P.J. Coordination geometries of bis(4-amino-3-alkyl-1,2,4-triazole-5-thione) complexes of first-row transition metals: Crystal structures of complexes with propyl and hydrogen in the 3-position. Relationship to the 3-methyl and 3-ethyl analogs. Inorg. Chim. Acta 2000, 311, 95–105. [Google Scholar] [CrossRef]
  21. Clark, R.W.; Squattrito, P.J.; Sen, A.K.; Dubey, S.N. Structural trends in a series of divalent transition metal triazole complexes. Inorg. Chim. Acta 1999, 293, 61–69. [Google Scholar] [CrossRef]
  22. Kajdan, T.W.; Squattrito, P.J.; Dubey, S.N. Coordination geometries of bis (4-amino-3-ethyl-1,2,4-triazole-5-thione) complexes of Mn, Fe, Co, Ni, Cu and Zn: Relationship to the 3-methyl analogs. Inorg. Chim. Acta 2000, 300, 1082–1089. [Google Scholar] [CrossRef]
  23. Zangrando, E.; Islam, M.T.; Islam, A.A.A.A.; Sheikh, M.C.; Tarafder, M.T.H.; Miyatake, R.; Zahan, R.; Hossain, M.A. Synthesis, characterization and bio-activity of nickel(II) and copper(II) complexes of a bidentate NS Schiff base of S-benzyl dithiocarbazate. Inorg. Chim. Acta 2015, 427, 278–284. [Google Scholar] [CrossRef]
  24. Liu, G.; Huang, Y.; Qu, X.; Xiao, J.; Yang, X.; Xu, Z. Understanding the hydrophobic mechanism of 3-hexyl-4-amino-1, 2,4-triazole-5-thione to malachite by ToF-SIMS, XPS, FT-IR, contact angle, zeta potential and micro-flotation. Colloids Surf. A Physicochem. Eng. Asp. 2016, 503, 34–42. [Google Scholar] [CrossRef]
  25. Yin, Z.; Sun, W.; Hu, Y.; Zhang, C.; Guan, Q.; Liu, R.; Chen, P.; Tian, M.J. Utilization of acetic acid-[(hydrazinylthioxomethyl)thio]-sodium as a novel selective depressant for chalcopyrite in the flotation separation of molybdenite. Sep. Purif. Technol. 2017, 179, 248–256. [Google Scholar] [CrossRef]
  26. Dixit, P.P.; Dixit, P.P.; Thore, S.N. Hybrid triazoles: Design and synthesis as potential dual inhibitor of growth and efflux inhibition in tuberculosis. Eur. J. Med. Chem. 2016, 107, 38–47. [Google Scholar] [CrossRef] [PubMed]
  27. Fawzi, M.M. 1,2,4-Triazin-5-ones. U.S. Patent 4,346,220 A, 24 August 1982. [Google Scholar]
  28. Tandon, S.S.; Dul, M.C.; Lee, J.L.; Dawe, L.N.; Anwar, M.U.; Thompson, L.K. Complexes of ditopic carbo- and thio-carbohydrazone ligands – mononuclear, 1D chain, dinuclear and tetranuclear examples. Dalton Trans. 2011, 40, 3466–3475. [Google Scholar] [CrossRef] [PubMed]
  29. Braga, P.F.A.; Chaves, A.P.; Luz, A.B.; França, S.C.A. The use of dextrin in purification by flotation of molybdenite concentrates. Int. J. Miner. Process. 2014, 127, 23–27. [Google Scholar] [CrossRef]
  30. Xu, M. Modified flotation rate constant and selectivity index. Miner. Eng. 1998, 11, 271–278. [Google Scholar] [CrossRef]
  31. Wise, C.F.; Liu, D.; Mayer, K.J.; Crossland, P.M.; Hartley, C.L.; Mcnamara, W.R. A nickel complex of a conjugated bis-dithiocarbazate Schiff base for the photocatalytic production of hydrogen. Dalton Trans. 2015, 44, 14265–14271. [Google Scholar] [CrossRef] [PubMed]
  32. Liu, Y.; Liu, Q. Flotation separation of carbonate from sulfide minerals, II: Mechanisms of flotation depression of sulfide minerals by thioglycollic acid and citric acid. Miner. Eng. 2004, 17, 865–878. [Google Scholar] [CrossRef]
  33. Mitchell, T.K.; Nguyen, A.V.; Evans, G.M. Heterocoagulation of chalcopyrite and pyrite minerals in flotation separation. Adv. Colloid Interface Sci. 2005, 114–115, 227–237. [Google Scholar] [CrossRef] [PubMed]
  34. Yu, J.; Ge, Y.; Guo, X.; Guo, W. The depression effect and mechanism of NSFC on dolomite in the flotation of phosphate ore. Sep. Purif. Technol. 2016, 161, 88–95. [Google Scholar] [CrossRef]
  35. Subashchandrabose, S.; Babu, N.R.; Saleem, H.; Padusha, M.S.A. Vibrational studies on (E)-1-((pyridine-2-yl)methylene)semicarbazide using experimental and theoretical method. J. Mol. Struct. 2015, 1094, 254–263. [Google Scholar] [CrossRef]
  36. Centore, R.; Takjoo, R.; Capobianco, A.; Peluso, A. Ring to open-chain transformation induced by selective metal coordination in a new dithiocarbazate ligand. Inorg. Chim. Acta 2013, 404, 29–33. [Google Scholar] [CrossRef]
  37. Zhao, S.; Peng, Y. The oxidation of copper sulfide minerals during grinding and their interactions with clay particles. Powder Technol. 2012, 230, 112–117. [Google Scholar] [CrossRef]
  38. Ghahremaninezhad, A.; Dixon, D.G.; Asselin, E. Electrochemical and XPS analysis of chalcopyrite (CuFeS 2) dissolution in sulfuric acid solution. Electrochim. Acta 2013, 87, 97–112. [Google Scholar] [CrossRef]
  39. Liu, G.; Qiu, Z.; Wang, J.; Liu, Q.; Xiao, J.; Zeng, H.; Zhong, H.; Xu, Z. Study of N-isopropoxypropyl-N′-ethoxycarbonyl thiourea adsorption on chalcopyrite using in situ SECM, ToF-SIMS and XPS. J. Coll. Interface Sci. 2015, 437, 42. [Google Scholar] [CrossRef] [PubMed]
  40. Sandström, Å.; Shchukarev, A.; Paul, J. XPS characterisation of chalcopyrite chemically and bio-leached at high and low redox potential. Miner. Eng. 2005, 18, 505–515. [Google Scholar] [CrossRef]
  41. Yang, Y.; Harmer, S.; Chen, M. Synchrotron X-ray photoelectron spectroscopic study of the chalcopyrite leached by moderate thermophiles and mesophiles. Miner. Eng. 2014, 69, 185–195. [Google Scholar] [CrossRef]
  42. Yang, Y.; Harmer, S.; Chen, M. Synchrotron-based XPS and NEXAFS study of surface chemical species during electrochemical oxidation of chalcopyrite. Hydrometallurgy 2015, 156, 89–98. [Google Scholar] [CrossRef]
  43. Yu, H.; Zhu, C.; Zhang, K.; Chen, Y.; Li, C.; Gao, P.; Yang, P.; Ouyang, Q. Three-dimensional hierarchical MoS2 nanoflake array/carbon cloth as high-performance flexible lithium-ion battery anodes. J. Mater. Chem. A 2014, 2, 4551–4557. [Google Scholar] [CrossRef]
  44. Fairthorne, G.; Brinen, J.S.; Fornasiero, D.; Nagaraj, D.R.; Ralston, J. Spectroscopic and electrokinetic study of the adsorption of butyl ethoxycarbonyl thiourea on chalcopyrite. Int. J. Miner. Process. 1998, 54, 147–163. [Google Scholar] [CrossRef]
  45. Yoshida, T. An X-ray photoelectron spectroscopic study of several metal complexes of 2-mercaptobenzimidazole and 2-mercaptobenzoxazole. Bull. Chem. Soc. Jpn. 2006, 53, 1449–1450. [Google Scholar] [CrossRef]
  46. Owusu, C.; Fornasiero, D.; Addai-Mensah, J.; Zanin, M. Effect of regrinding and pulp aeration on the flotation of chalcopyrite in chalcopyrite/pyrite mixtures. Powder Technol. 2014, 267, 61–67. [Google Scholar] [CrossRef]
  47. Kalegowda, Y.; Chan, Y.L.; Wei, D.H.; Harmer, S.L. X-PEEM, XPS and ToF-SIMS characterisation of xanthate induced chalcopyrite flotation: Effect of pulp potential. Surf. Sci. 2015, 635, 70–77. [Google Scholar] [CrossRef]
  48. He, Z.; Liu, G.; Yang, X.; Liu, W. A novel surfactant, N, N-diethyl-N′-cyclohexylthiourea: Synthesis, flotation and adsorption on chalcopyrite. J. Ind. Eng. Chem. 2016, 37, 107–114. [Google Scholar] [CrossRef]
  49. Bera, P.; Kim, C.H.; Seok, S.I. Synthesis, spectroscopic characterization and thermal behavior of cadmium(II) complexes of S-methyldithiocarbazate (SMDTC) and S-benzyldithiocarbazate (SBDTC): X-ray crystal structure of [Cd(SMDTC)3]·2NO3. Polyhedron 2008, 27, 3433–3438. [Google Scholar] [CrossRef]
  50. Iranmahboob, J.; Gardner, S.D.; Toghiani, H.; Hill, D.O. XPS study of molybdenum sulfide catalyst exposed to CO and H2. J. Colloid Interface Sci. 2004, 270, 123–126. [Google Scholar] [CrossRef]
  51. Hirajima, T.; Miki, H.; Suyantara, G.P.W.; Matsuoka, H.; Elmahdy, A.M.; Sasaki, K.; Imaizumi, Y.; Kuroiwa, S. Selective flotation of chalcopyrite and molybdenite with H2O2 oxidation. Miner. Eng. 2017, 100, 83–92. [Google Scholar] [CrossRef]
  52. Baker, M.A.; Gilmore, R.; Lenardi, C.; Gissler, W. XPS investigation of preferential sputtering of S from MoS2 and determination of MoSx stoichiometry from Mo and S peak positions. Appl. Surf. Sci. 1999, 150, 255–262. [Google Scholar] [CrossRef]
Figure 1. The beneficiation flowsheet of bench scale tests.
Minerals 07 00146 g001
Figure 2. The recovery of chalcopyrite and molybdenite as a function of pH by Kerosene (200 mg/L) and MIBC (80 mg/L) with or without ATDT (4 × 10⁻⁴ mol/L).
Minerals 07 00146 g002
Figure 3. The flotation recovery of molybdenite and chalcopyrite as a function of ATDT concentration by Kerosene (200 mg/L) and MIBC (80 mg/L) at pH 8.0.
Minerals 07 00146 g003
Figure 4. Recovery vs. flotation time with and without ATDT.
Minerals 07 00146 g004
Figure 5. UV spectra of ATDT in the presence and absence of Cu2+ ions.
Minerals 07 00146 g005
Figure 6. Zeta potential of chalcopyrite and molybdenite as a function of pH in the presence and absence of depressant (C = 2 × 10⁻⁴ mol/L).
Minerals 07 00146 g006
Figure 7. The Fourier Transform Infrared Spectroscopy (FT-IR) spectra of the (a) ATDT, ATDT-Cu complexes, chalcopyrite before and after treatment; and (b) ATDT, molybdenite before and after treatment.
Minerals 07 00146 g007
Figure 8. The survey (full range) XPS spectrums of (a) ATDT and Chalcopyrite before and after treatment; and (b) molybdenite before and after treatment.
Minerals 07 00146 g008
Figure 9. S 2p spectrum of (a) the ATDT, ATDT-Cu2+ complexes; (b) the chalcopyrite before and after treatment; and (c) the ATDT, molybdenite before and after treatment.
Minerals 07 00146 g009aMinerals 07 00146 g009b
Figure 10. N 1s spectrum of (a) the ATDT, ATDT-Cu2+ complexes; (b) the chalcopyrite before and after treatment; (c) the molybdenite before and after treatment.
Minerals 07 00146 g010aMinerals 07 00146 g010b
Figure 11. Cu 2p spectrum of (a) ATDT-Cu2+ complexes, chalcopyrite before and after treatment; (b) Mo 3d spectrum of molybdenite before and after treatment.
Minerals 07 00146 g011
Figure 12. The proposed adsorption models of ATDT on chalcopyrite surface.
Minerals 07 00146 g012
Table 1. Model parameters of the model fits.
ParametersControl TestATDT
MolybdeniteChalcopyriteMolybdeniteChalcopyrite
R∞78.8077.8481.1030.67
K0.960.670.620.55
KM0.760.520.500.17
S.I. (Mo/Cu)1.452.98
Table 2. Important IR spectra bands of depressant, Cu (II) complexes and depressant treated chalcopyrite (cm−1).
CompoundυC-NυC=NυC=SυNH2υC=Oυ((CN) + (NH))
ATDT1232(w)/1424(s)15821075320117731389
ATDT-Cu(II)1244(w)/1436(s)15581079321517711427
ATDT + Cp1447155810773206 1423
Table 3. Elements atomic contents of samples before and after treatment.
SamplesAtomic Concentration of Elements (Atomic %)
CONSCuFeMo
chalcopyrite25.4520.730.0027.4818.987.36
Chalcopyrite + ATDT26.2619.5310.8222.4415.075.88
Δc0.81−1.2010.82−5.04−3.91−1.48
Molybdenite17.4312.310.0047.94 22.30
Molybdenite + ATDT24.2115.290.8442.37 17.30
Δm6.782.980.84−5.570.000.00−5.03
Δ is defined as the value of after ATDT treatment minus than that of original.

