Classification of Flotation Frothers


1
Faculty of Geoengineering, Mining and Geology, Wroclaw University of Science and Technology, Wybrzeze Wyspianskiego 27, 50-370 Wroclaw, Poland
2
Department of Geoscience and Petroleum, Norwegian University of Science and Technology, Sem Sælands vei 1, N-7491 Trondheim, Norway
*
Author to whom correspondence should be addressed.
Minerals 2018, 8(2), 53; https://doi.org/10.3390/min8020053
Submission received: 23 November 2017
/
Revised: 9 January 2018
/
Accepted: 30 January 2018
/
Published: 7 February 2018
(This article belongs to the Special Issue Flotation Chemistry)
Abstract
:In this paper, a scheme of flotation frothers classification is presented. The scheme first indicates the physical system in which a frother is present and four of them i.e., pure state, aqueous solution, aqueous solution/gas system and aqueous solution/gas/solid system are distinguished. As a result, there are numerous classifications of flotation frothers. The classifications can be organized into a scheme described in detail in this paper. The frother can be present in one of four physical systems, that is pure state, aqueous solution, aqueous solution/gas and aqueous solution/gas/solid system. It results from the paper that a meaningful classification of frothers relies on choosing the physical system and next feature, trend, parameter or parameters according to which the classification is performed. The proposed classification can play a useful role in characterizing and evaluation of flotation frothers.
1. Introduction
Frothers are very important reagents playing a multiple role in flotation of particulate matter. The frothers facilitate formation of either foam or froth and favourably modify the structure of films between bubbles as well as solid particles and bubbles [1,2,3,4,5,6,7]. Frothers also interact with collectors resulting in a stronger and faster particle-bubble attachment [8].
Although flotation of naturally hydrophobic materials, with a water contact angle greater than zero [9,10], is possible without any reagent [11], some hydrophobic and slightly hydrophobic materials do not float in pure water. A good example is molybdenite and different carbonaceous materials, including metals- and carbon-bearing shales [12]. Their flotation can be induced by application of frothers in the form of either organic compounds or inorganic electrolytes [13,14].
Properties of frothers depend on many parameters, including structure, concentration and ability to interact with water, solids, collectors and modifiers. As a result, there are numerous classifications of frothers. For instance, Khoshdast and Sam [15] classified frothers taking into account their (i) pH-sensitivity; (ii) solubility; (iii) frothing/collecting properties; and (iv) selectivity/frothing power. The classifications considering pH-sensitivity and solubility are obvious. In the third category frothers can also play the role of a collector. The fourth classification takes into account ability of frothers to float particles according to their size, e.g., selective frothers effectively recover the fine particles, while powerful frothers float well the coarser ones [16].
Literature survey on frothers, their properties and grouping shows that the issue of frothers classification is much more complex than that offered in the literature. Therefore, in this work a scheme for frothers classification is proposed. The scheme first indicates the physical system in which the frother is present and four groups: (i) pure state; (ii) aqueous solution; (iii) aqueous solution/gas system; and (iv) aqueous solution/gas/solid system are distinguished (Table 1). Next, within each physical system, the frothers are classified into five categories, mostly based on the number of numerical values need for the classification.
To emphasize that the classification deals with reagents, which are used for separation by flotation of solid particles from water with gas bubbles, in this work these reagents will be referred to as frothers, regardless the fact that sometimes the properties used for the classification involves foam, which is a two-phase system without solid particles.
2. Frothers in Pure State
2.1. Feature-Type (no-Numerical Value) Classification
The simplest classification of frothers in the pure state is based on their elemental composition and divides frothers into organic and inorganic [17] (Table 2). Another classification takes into account the chemical structure and divides frothers into alcohols and non-alcohols (Table 3). The alcoholic frothers can be further divided into classes depending on the alcohol structure [18] (Table 3). The non-alcoholic frothers can also be divided into organic and inorganic. The non-alcoholic organic frothers, instead of –OH, contain bonded oxygen in their structure. The frother, in its native state, can be solid, as α-terpineol with melting point of 40 °C [19] and inorganic salts, liquid (most organic frothers including polyglycol ethers) and gas (ammonia).
All these feature-type classifications are descriptive and no numerical value is assigned to the frother.
2.2. One-Numerical Value Classification
There is also a group of classifications of frothers based on one numerical value of a selected property of frother in the pure state. One of them takes into account the so-called hydrophilic-lipophilic balance (HLB) proposed by Davies [20]. The formula for calculation of HLB is: HLB = 7 + 1.3·(O) + 1.9·(OH) − 0.475·(CxHy), where O and OH stand for numbers of hydrophilic oxygen and hydroxyl functional groups, respectively and CxHy for number of lipophilic (or hydrophobic) –CH, –CH2–, CH3–, =CH– groups. The HLB for frothers is between 4 and 10 [21]. The scale of HLB is given in Table 4. The HLB values for organic frothers can be found in many papers (e.g., [22]).
The frothers can also be classified according to their number of carbon in the alkyl chain (n) as well as molecular mass, historically called molecular weight (MW). The values of MW can be found for instance in [19].
2.3. Two-Numerical Value Classification
The third type of classification of frothers in the pure state system is based on two numerical values characterizing the frother. A good example is HLB and MW. These values can be either tabulated or presented graphically as is shown in Figure 1. The frothers can be grouped into classes, for instance low MW/high HLB or high MW/low HLB etc.
3. Frother in Aqueous Solutions
3.1. Feature-Type (no Numerical Value) Classification
Frothers are used together with water, unless flotation is performed in non-aqueous solutions. Therefore, there is a classification of frothers based on their ability to dissociate in aqueous solutions. Their dissociation depends on pH and therefore the frothers are classified into acidic, neutral and basic, that is cationic, anionic and non-ionic [15,23] (Table 5). This is a no-numerical value classification type. Assigning numerical values to the frothers, for instance of the dissociation constants, would turn it into a one-numerical value classification.
Solubility of frothers influences the flotation performance [24]. Crozier [25] divided frothers into completely miscible and slightly soluble. Such reagents as aliphatic alcohols, cresylic acids, alkoxy paraffins and non-ionic polypropylene glycol ethers belong to the slightly soluble group of frothers, while completely soluble are polyglycols and polyglycol ethers [15].
3.2. One-Numerical Value Classification
Different properties of frothers present in aqueous solutions can be used for their one-numerical value classification. One of them is solubility. The solubility of selected organic frothers is given in Table 6. Another is the cloud point below which the frother molecules can be dissolved in water. At higher temperature molecules start to associate and solution becomes cloudy as a result of phase separation and surface activity loses. The cloud point is observed for frothers containing polyoxyethylene groups in their structure. Table 7 presents the cloud point for selected polyoxyethylene-type non-ionic frothers in 0.1 weight fraction aqueous solutions.
The cloud point can be assigned only to the polyoxyethylenic non-ionic frothers in the aqueous solution sub-system and therefore for other frothers it is equal to zero.
4. Frother in Aqueous Solutions/Gas System
4.1. Feature and Trend-Type (no Numerical Value) Classification
Lekki and Laskowski [31] classified frothers according to their ability to modify the surface tension of water at concentrations applied in flotation. In their classification frothers can be either surface active, that is changing the static surface tension of water, or surface inactive (Table 8).
The classification offered in Table 8 is not precise because establishing the limit of surface tension change for frothers to be called surface inactive is difficult. A better approach is to divide frothers into surface active and surfactant (Figure 2) based on the trend of surface tension change with increasing frother concentration. The surface active frothers are those which cause either low or moderate, positive or negative, surface tension change (Δσ = σsolution − σwater) with increasing concentration of frother in water, while for surfactants the Δσ parameter is significant and negative (Figure 2).
4.2. One-Numerical Value Classification
4.2.1. Surface Tension versus Frother Concentration, σ∠ or cσ50
The surface tension change of surface active reagents and surfactants (Figure 2) can be utilized for the classification of frothers based on numerical values. Since the surface active reagents change their static surface tension with the concentration almost linearly, their classification can be based on the approximated slope of Δσ (or σ) versus frother concentration c plot (Figure 3). Theoretically, there should exist surface inactive reagents but so far, no reagent with Δσ = 0 in a wide range of concentrations was reported. In such considerations, the change of surface tension due to mixing of frother and water, having different pure state surface tension, is neglected. The slopes of Δσ, denoted as σ∠, can be either negative or positive for both inorganic frothers (salts, Figure 3a; acids, Figure 3b; bases, Figure 3c) and organic reagents (Figure 3d). The slopes σ∠ of the plots of Δσ versus the frother concentration for selected frothers are given in Table 9.
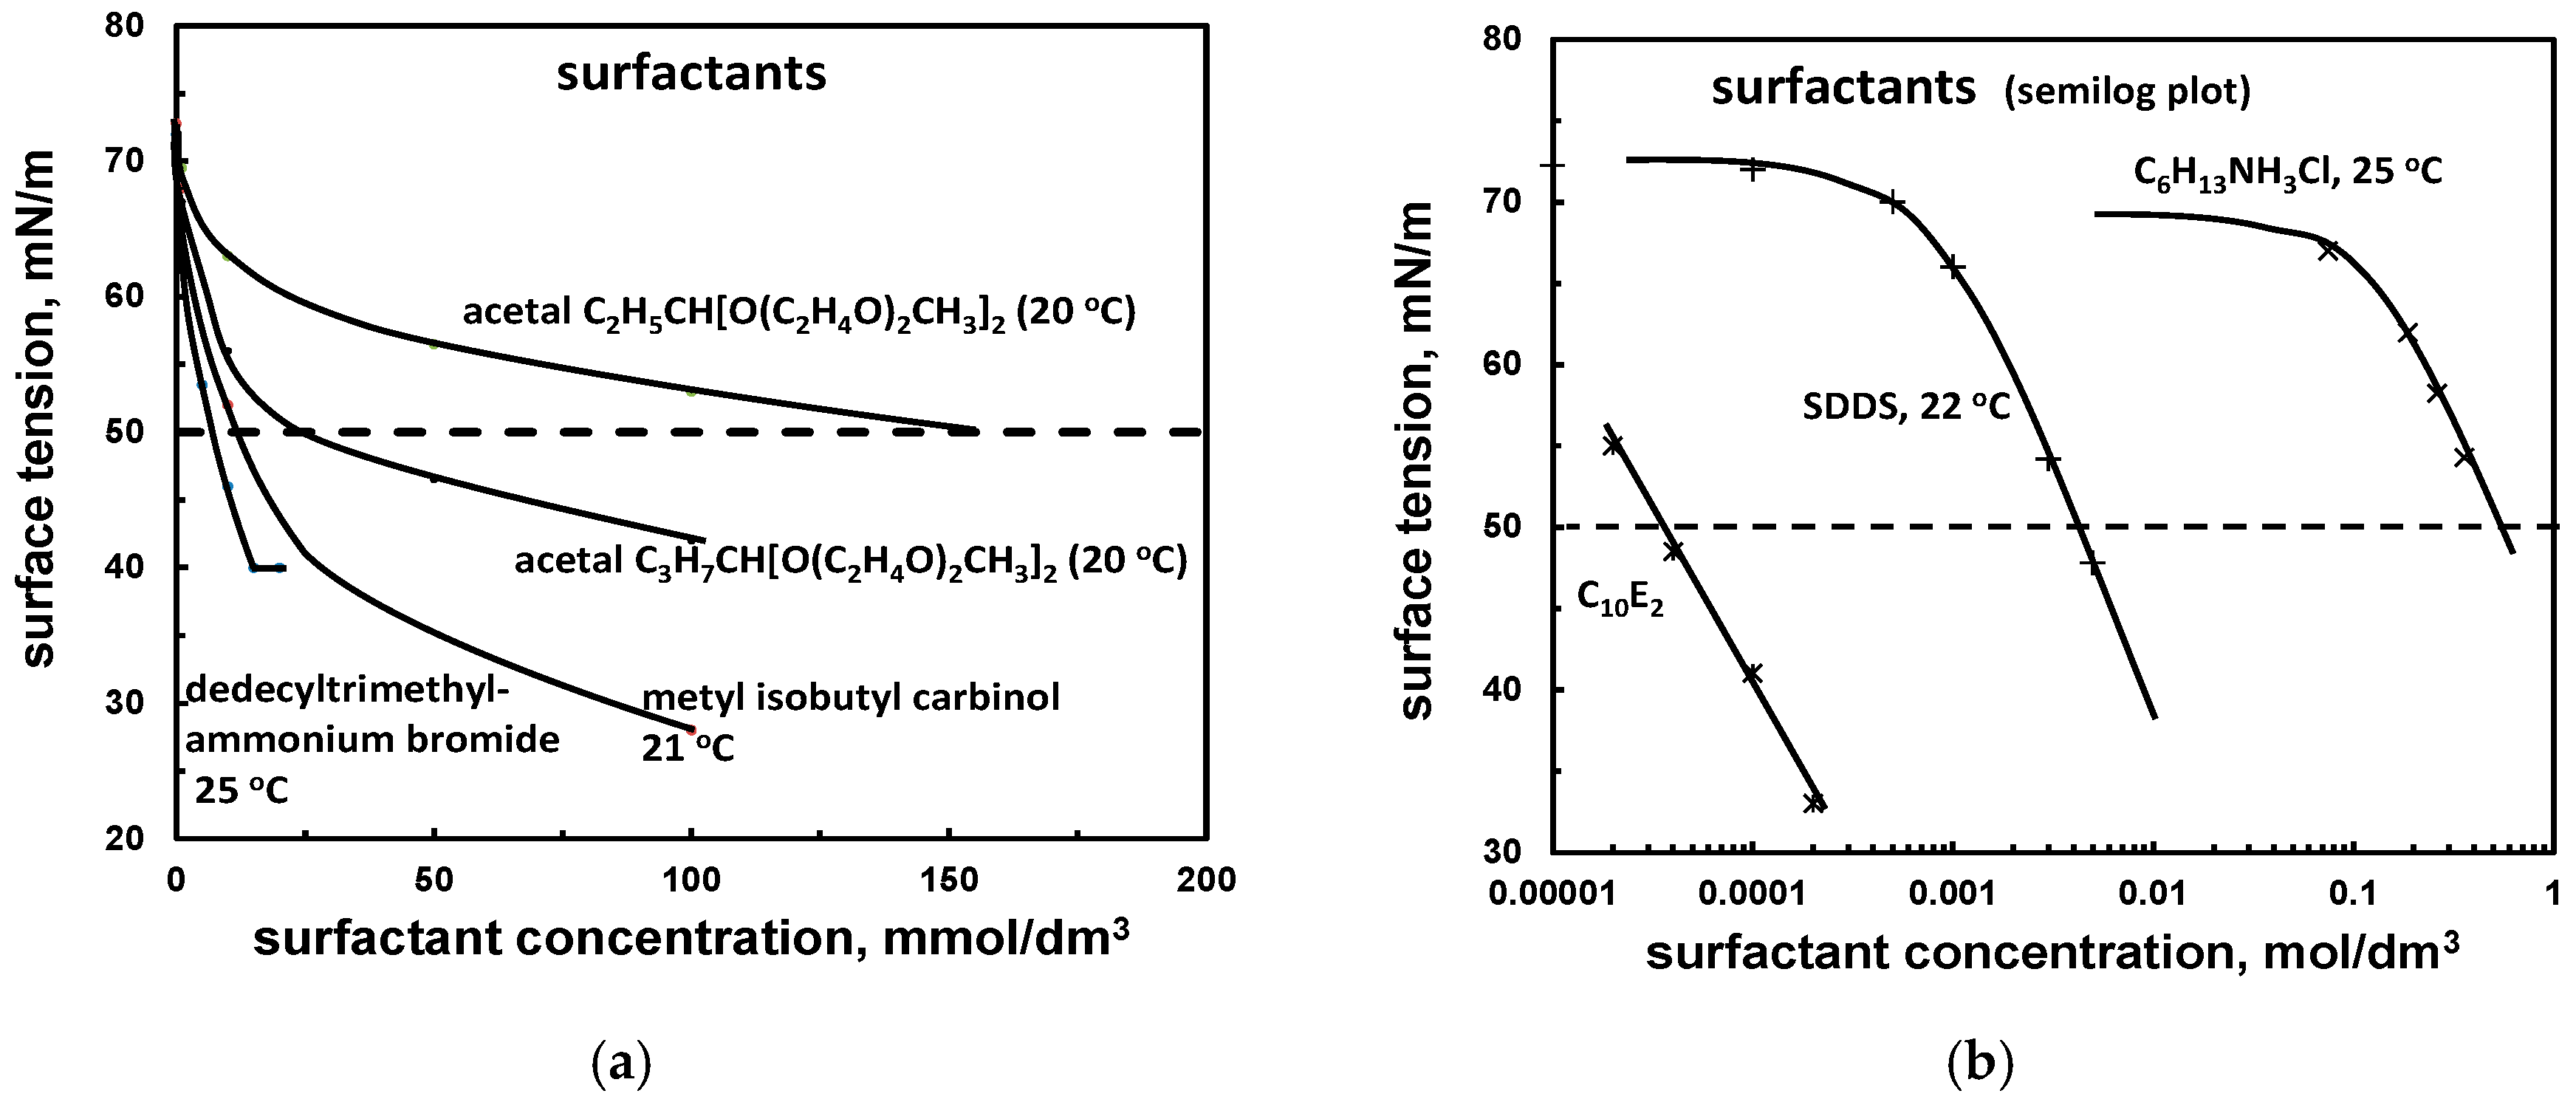
In the case of surfactants, the plot of the surface tension versus concentration is not linear (Figure 4a), although plotting using a logarithmic scale for concentration (Figure 4b) usually provides a linear part, before it levels off for values characteristic for micellar or pure reagent surface tension.
The classification of surfactants according to their surface tension can be based on the characteristic concentration at which the surface tension of aqueous solution drops to an arbitrarily chosen value, for instance 50 mN/m. This property will be denoted as cσ50. Any other value can be used. Table 10 presents the cσ50 values for selected surfactant frothers.
4.2.2. Bubble Size versus Frother Concentration, CCC
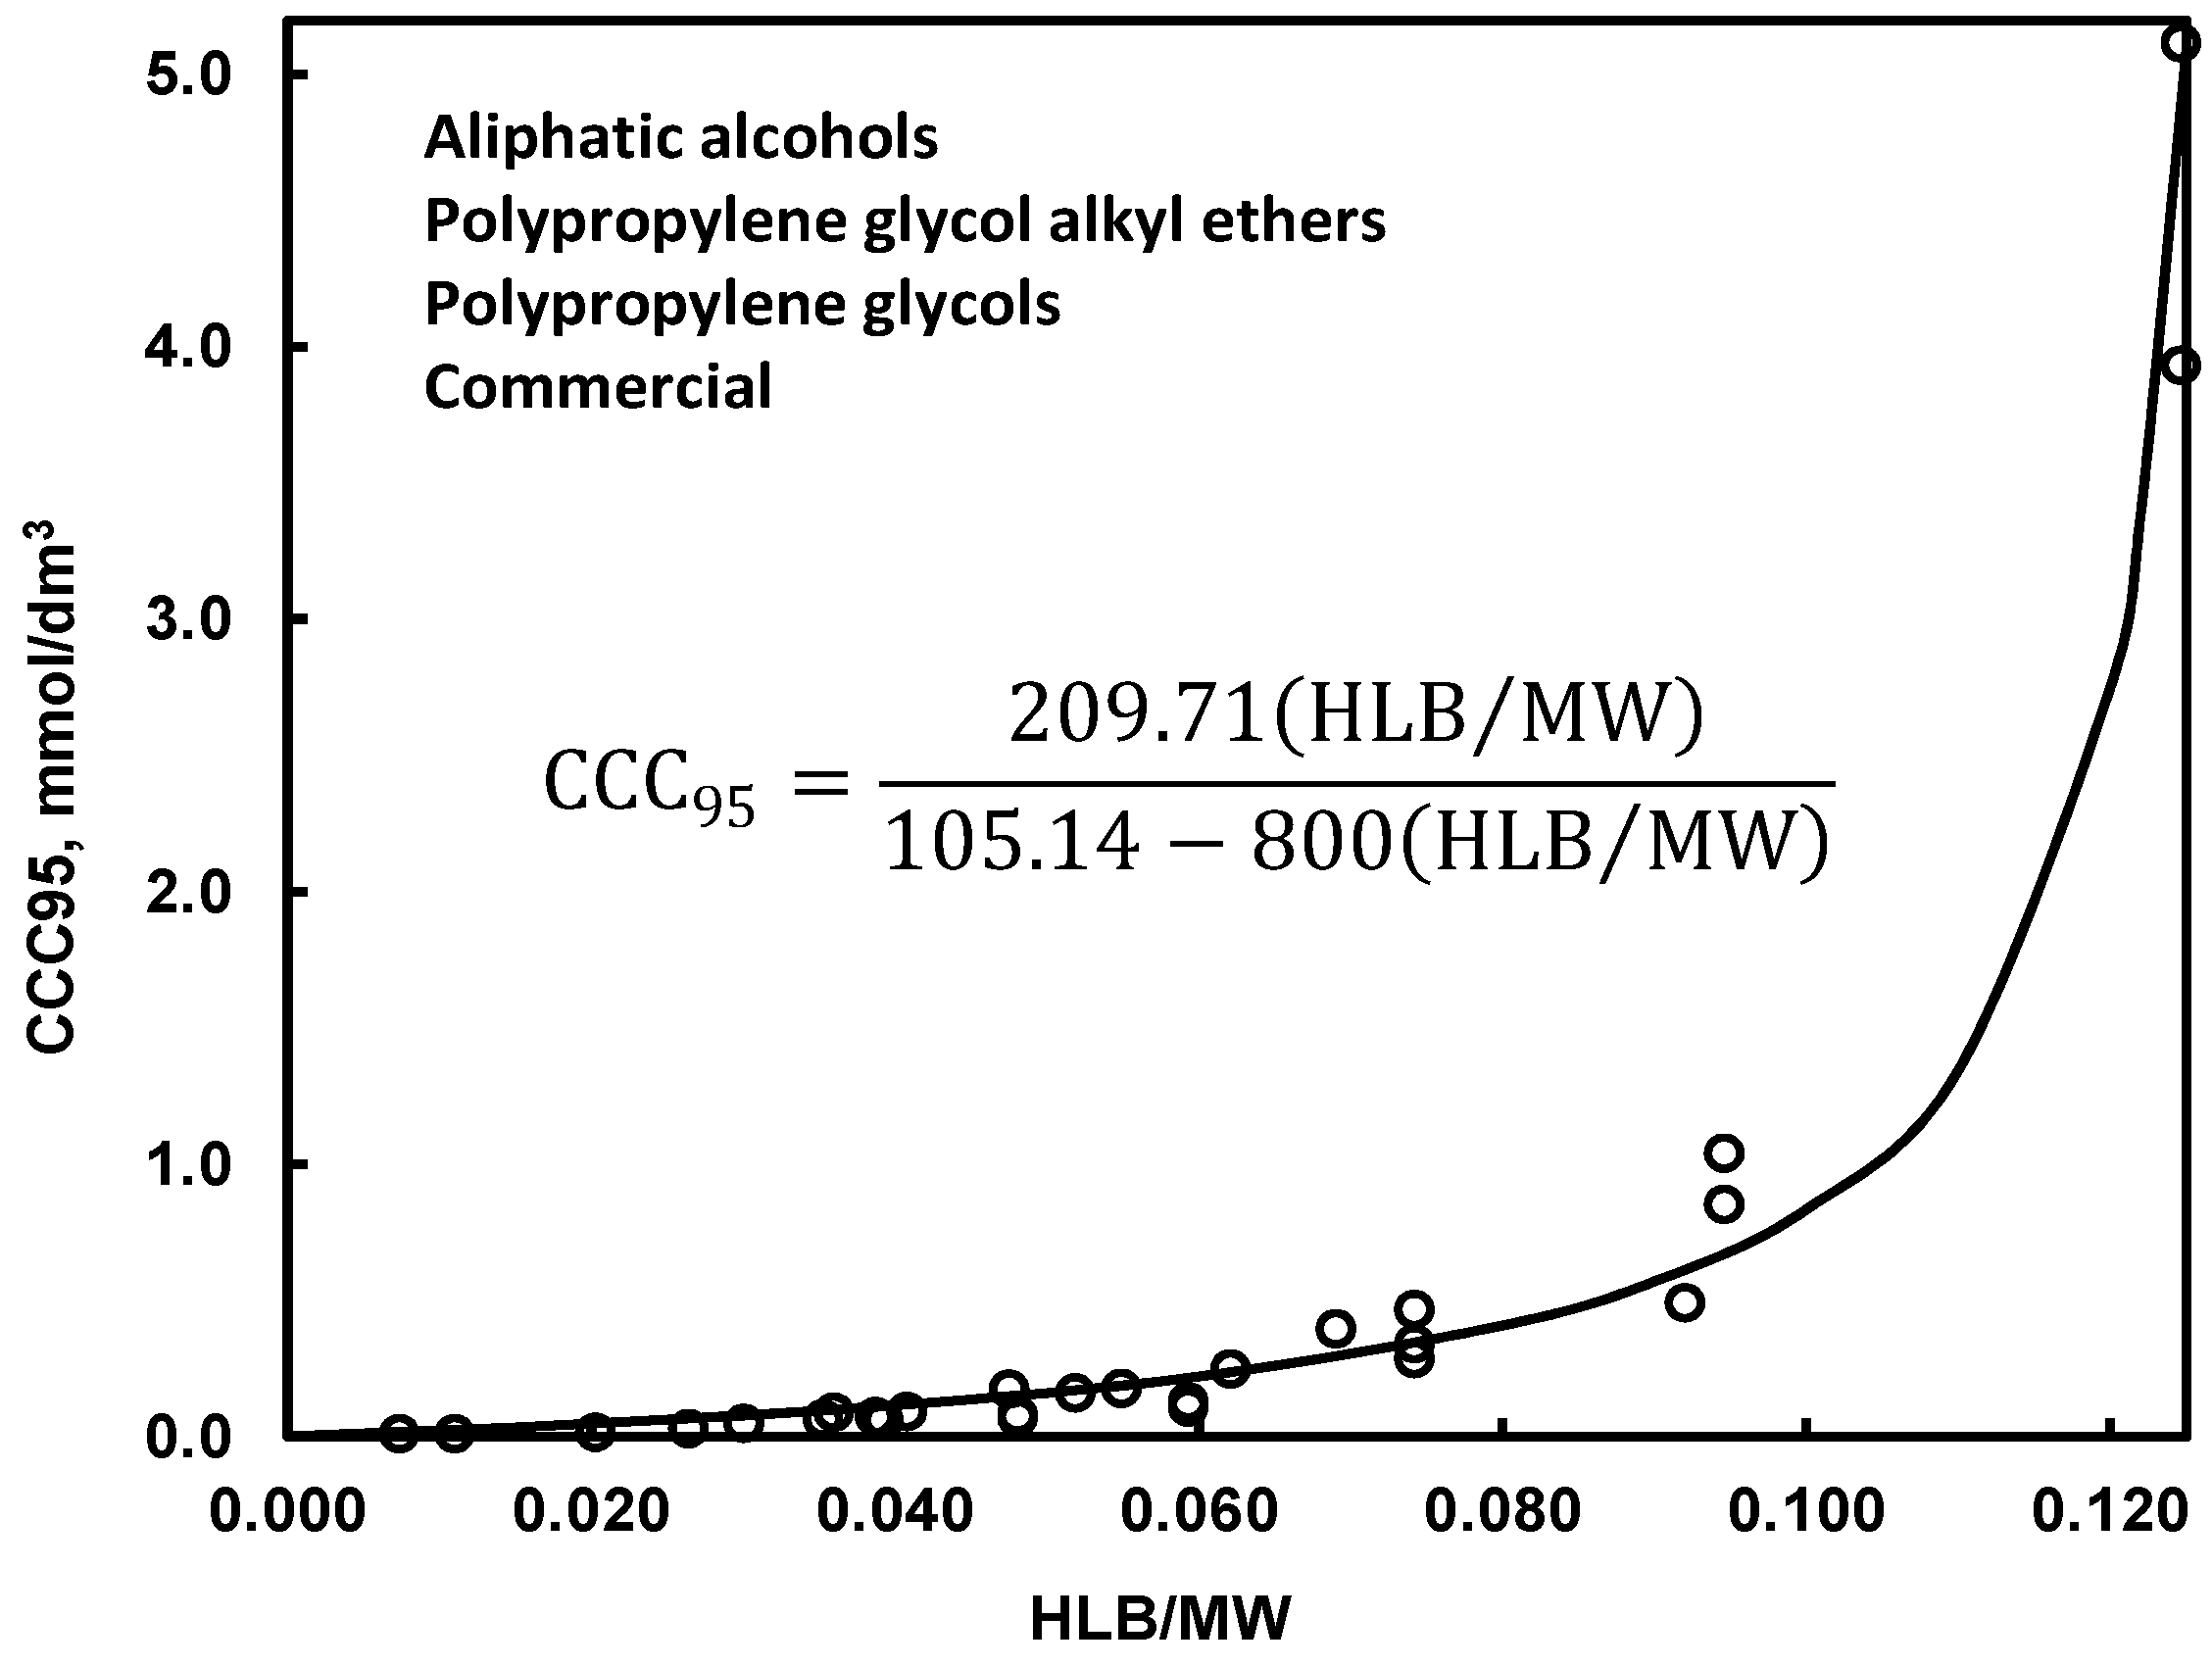
Many other properties of frothers in aqueous solutions in the presence of the gas phase can be used for their classification. One of them, resulting from the bubble size versus concentration plot (Figure 5), is the critical coalescence concentration (CCC) [2]. CCC is a parameter which indicates the frother concentration needed to prevent bubbles coalescence in an aqueous solution. The value of CCC can be either read-off from the bubble size-concentration curve or evaluated using HLB and MW [2,22,42]. Since the change of the bubble size in the vicinity of CCC is not sharp, usually CCC95, that is the frother concentration at which the average bubble size drops 95% is used. The third method of CCC determination is based on normalization of the bubble size vs. concentration plot using a mathematical equation approximating the whole curve (CCCt) [43]. The selected values of CCC are presented in Table 11. The Sauter mean diameter of bubble size is usually used on the y axis. However, other mean values can also be used.
CCC95 is related to the ratio of HLB and MW by a simple equation shown in Figure 6 [42]. It means that the two-numerical value classification of frothers based on HLB and MW (Figure 1) can be replaced by a one-numerical value classification using either HLB/MW or CCC95. The values of CCC can be also predicted basing on the number of carbon in the alkyl group of the reagent [49].
4.2.3. Gas Hold-up versus Frother Concentration, GH0.2
The classification of frothers can be also based on the gas hold-up influenced by the frother concentration [48] (Figure 7). It can be done by vertical cross-section of the plot and determination, for instance the gas hold-up at 0.2 mmol/dm3 of frother or shortly GH0.2. The selected numerical values of GH0.2 are given in Table 11.
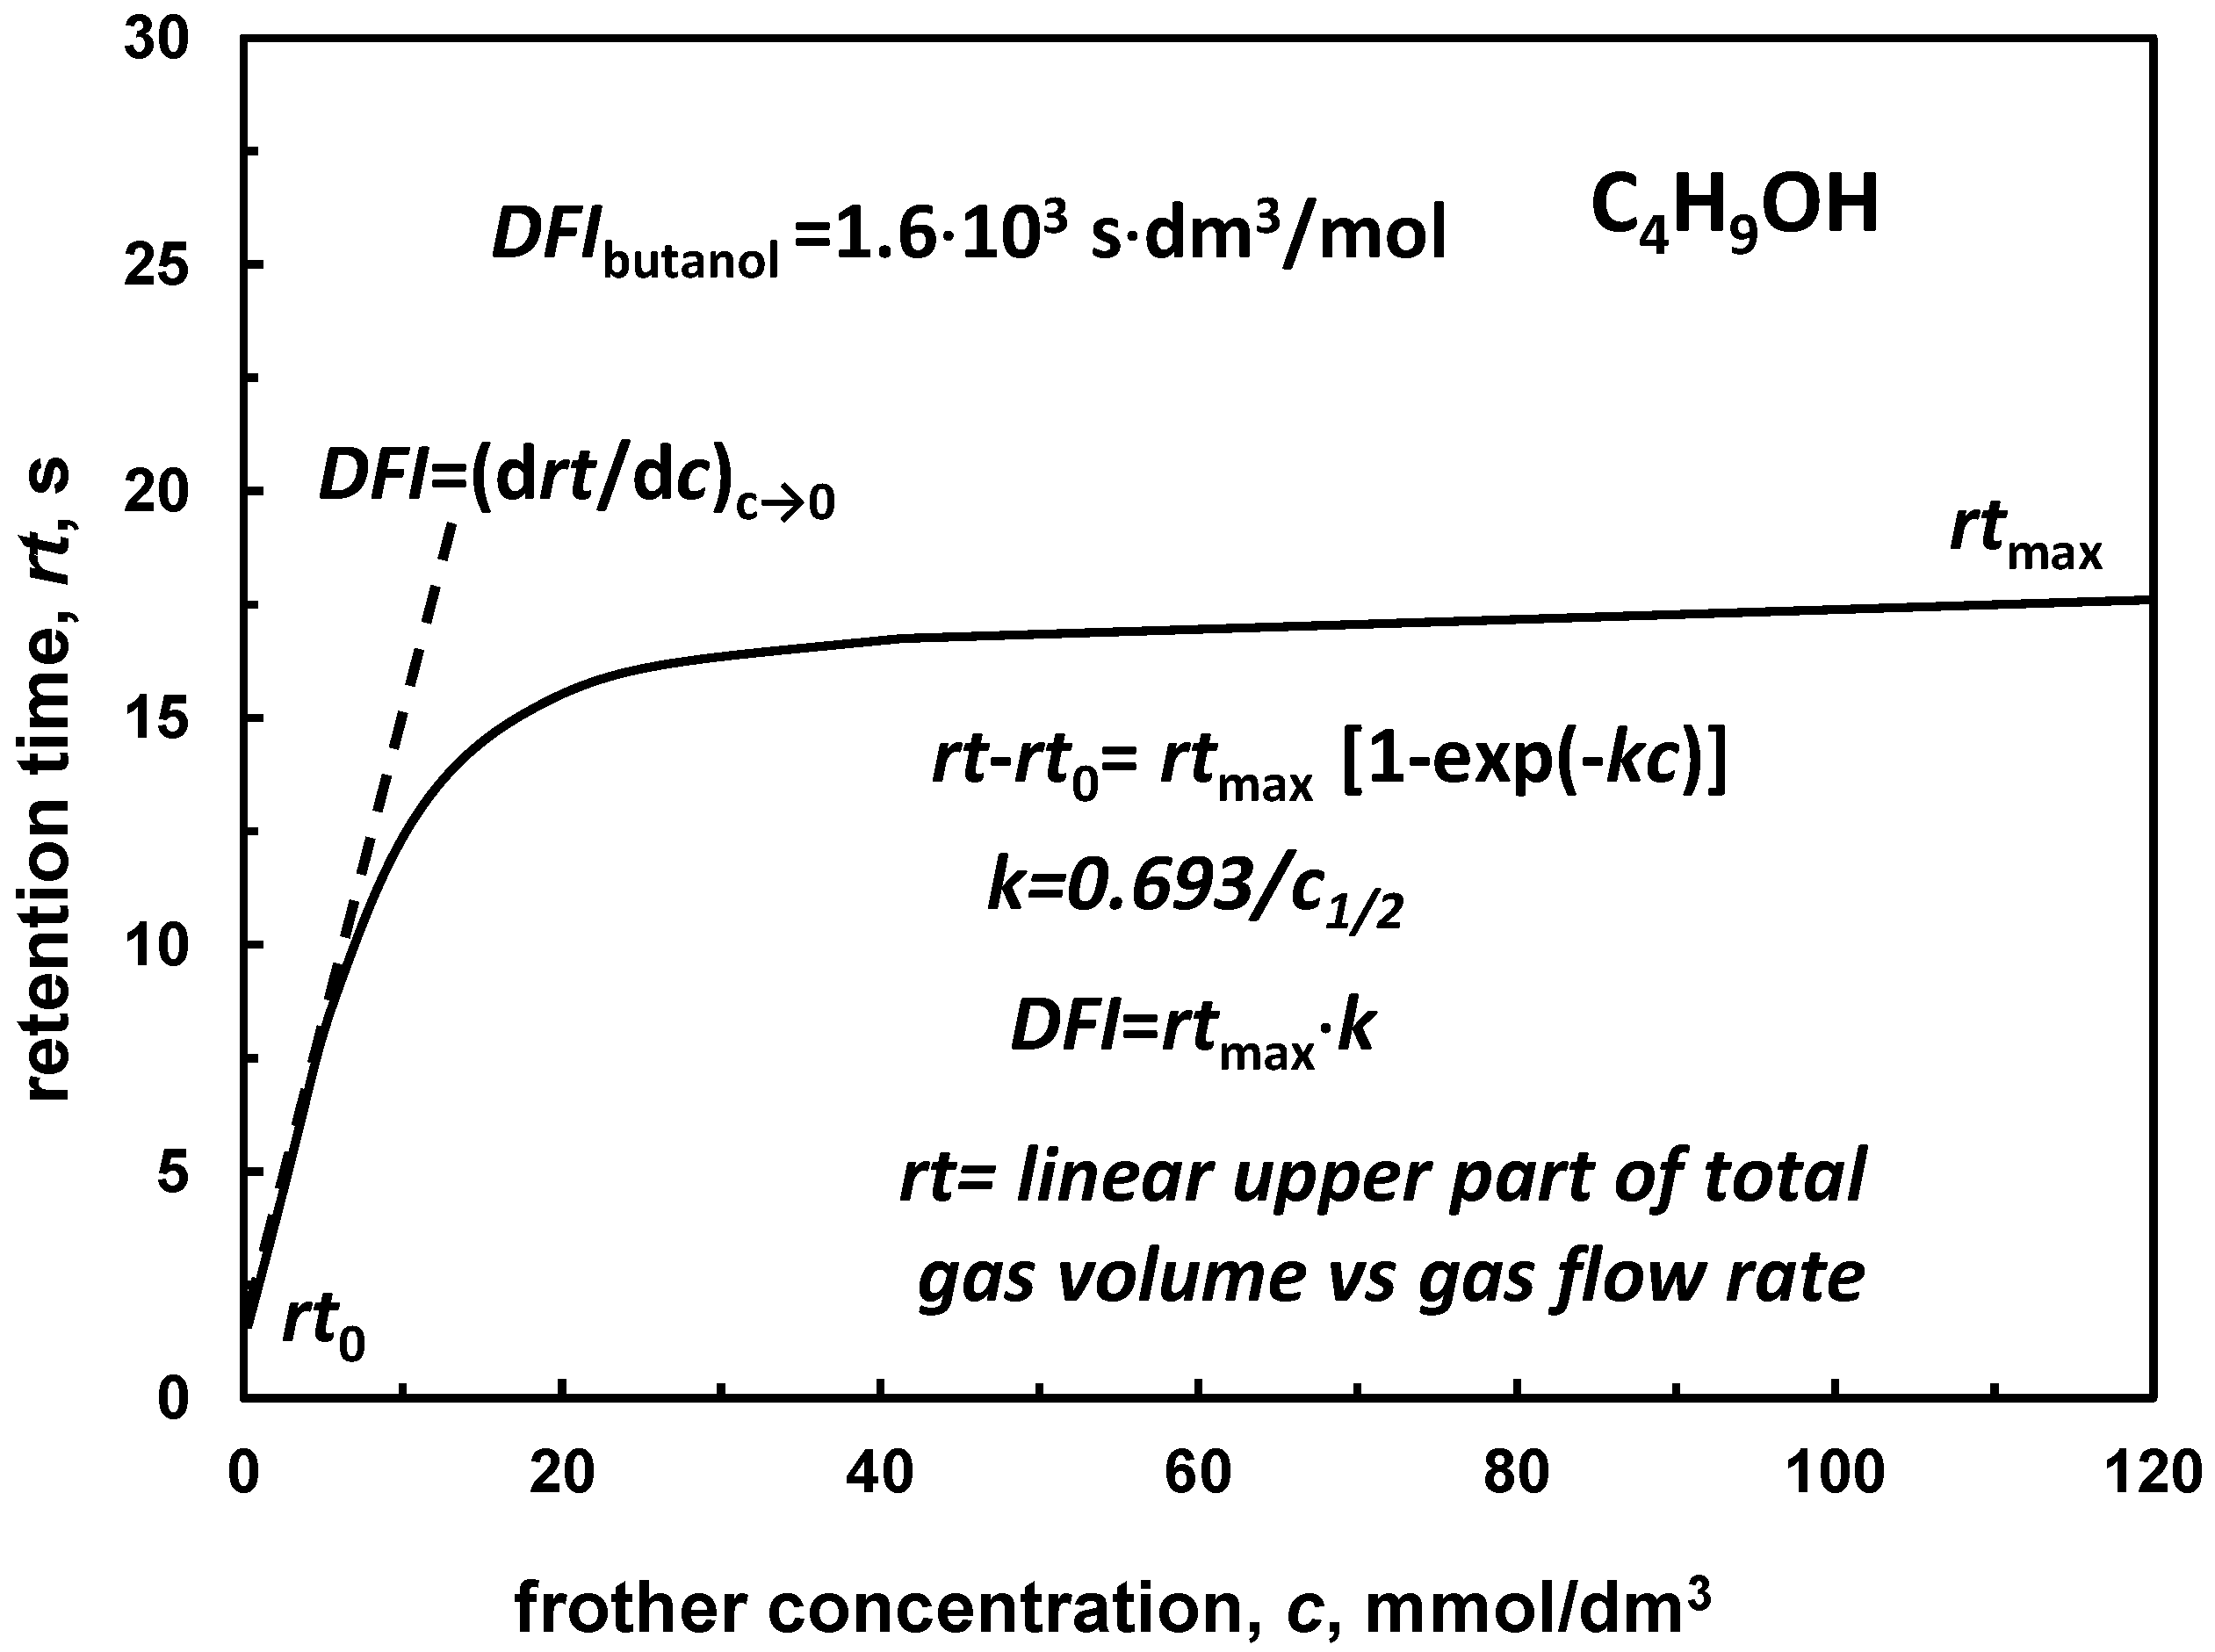
4.2.4. Retention Time versus Frother Concentration, DFI
Another parameter which can be used for classification of frothers is the dynamic foamability index (DFI) [1,50,51]. DFI represents the limiting slope of the gas retention time versus frother concentration for concentration approaching zero, where the retention time is the slope of the linear part of the dependence of the total gas volume contained in the system (solution + foam) on the gas flow rate (Figure 8). The values of DFI for selected frothers were given in Table 11.
4.2.5. Other Parameters Used for Frother Classification
There are many other parameters which could be used for frothers classification resulting from properties of the frother-in-water/gas system. They are concentration at half of the maximum foam height (CMH) [52] determined from the foam height—concentration curve; foam time of life [17]; concentration at minimum bubble velocity (CMV) [43,53] based on the bubble velocity-concentration curve, dynamic stability factor (DSF) [54], Bikerman’s foaminess unit Σ(reference) and Sun’s frothability index [50].
4.3. Two-Numerical Value Classification
5. Three-Phase (Liquid/Gas/Solid) System
The already mentioned classifications of frothers are based on either the structure or ability to form bubbles and foams in the two-phase (gas/water) systems. However, flotation is a phenomenon involving also solids. The main parameters (Figure 10), which are monitored in solids flotation, are yield γ and recovery ε when two or more solids are evaluated, flotation time and frother dose. Since the frother concentration influences other parameters such as surface tension of solution and the maximum yield (or recovery) after a certain or long time of flotation, these properties can also be used for classification.
5.1. Trend-Type Classification
5.1.1. Flotation Yield (Recovery) vs. Frother Concentration. Effective, Neutral, Harmful and Overdosed Frothers
The effectiveness of frothers, that is their ability to provide either a desired or the maximum yield (recovery) in the solid/water/gas flotation system, depends on the particle hydrophobicity, frother type (inorganic or organic), surface tension change and many other parameters. Therefore, it is useful to divide the solid/water/gas flotation systems into sub-systems, because of similar properties observed within these groups. Such classification is based on (i) particle hydrophobicity θ, which can be high, medium and low; (ii) frother type, which can be inorganic or organic; and (iii) surface tension change, which can be increasing (Δσ+), decreasing (Δσ-), constant (Δσ0), or significantly decreasing in the case of surfactant (Δσs). Basing on the yield or recovery change with the frother concentration, the frothers can be divided into effective, neutral, harmful and overdosed (Figure 11). This type of classification is presented in Table 12.
Figure 11a illustrates the classification of frothers into effective (Δγ+), neutral (Δγ0), harmful (Δγ-) and overdosed (Δγ-) due to the maximum yield change with the frother concentration for different systems. In the medium hydrophobic solid/surfactants/water/gas system (Figure 11b) the yield increases with the frother concentration, indicating that frothers are always effective. However, it should be kept in mind that too much surfactant eventually reduces the flotation yield due to a significant surface tension drop leading to a hydrophilization of the solid known as the Zisman plot [58]. In some systems, especial with inorganic frothers, low concentration diminishes flotation due to the Jones-Ray effect, caused by electrical double layer changes [59,60]. The most desire range of flotation system response due to application of the frother is called in this work the Lyster effect because he introduced first frothers to flotation [61].
In the case of medium hydrophobic solid/inorganic salts/water/gas sub-systems (Figure 11c) the maximum yield increases also when the surface tension increases, no change of yield occurs when the salt does not change the surface tension and the yield increases when the surface tension increases. For medium hydrophobic solids yield increases and the frothers are effective and no yield change is observed for very weakly hydrophobic and hydrophilic solids (neutral frothers). In other systems, for instance differently hydrophobic solid/surfactant/water/gas (Figure 11d), for highly hydrophobic materials surfactants can be easily overdosed and too high concentration diminished the flotation performance. Flotation of highly hydrophobic solids in the presence of inorganic salts requires more investigations to establish the yield response to different frothers.
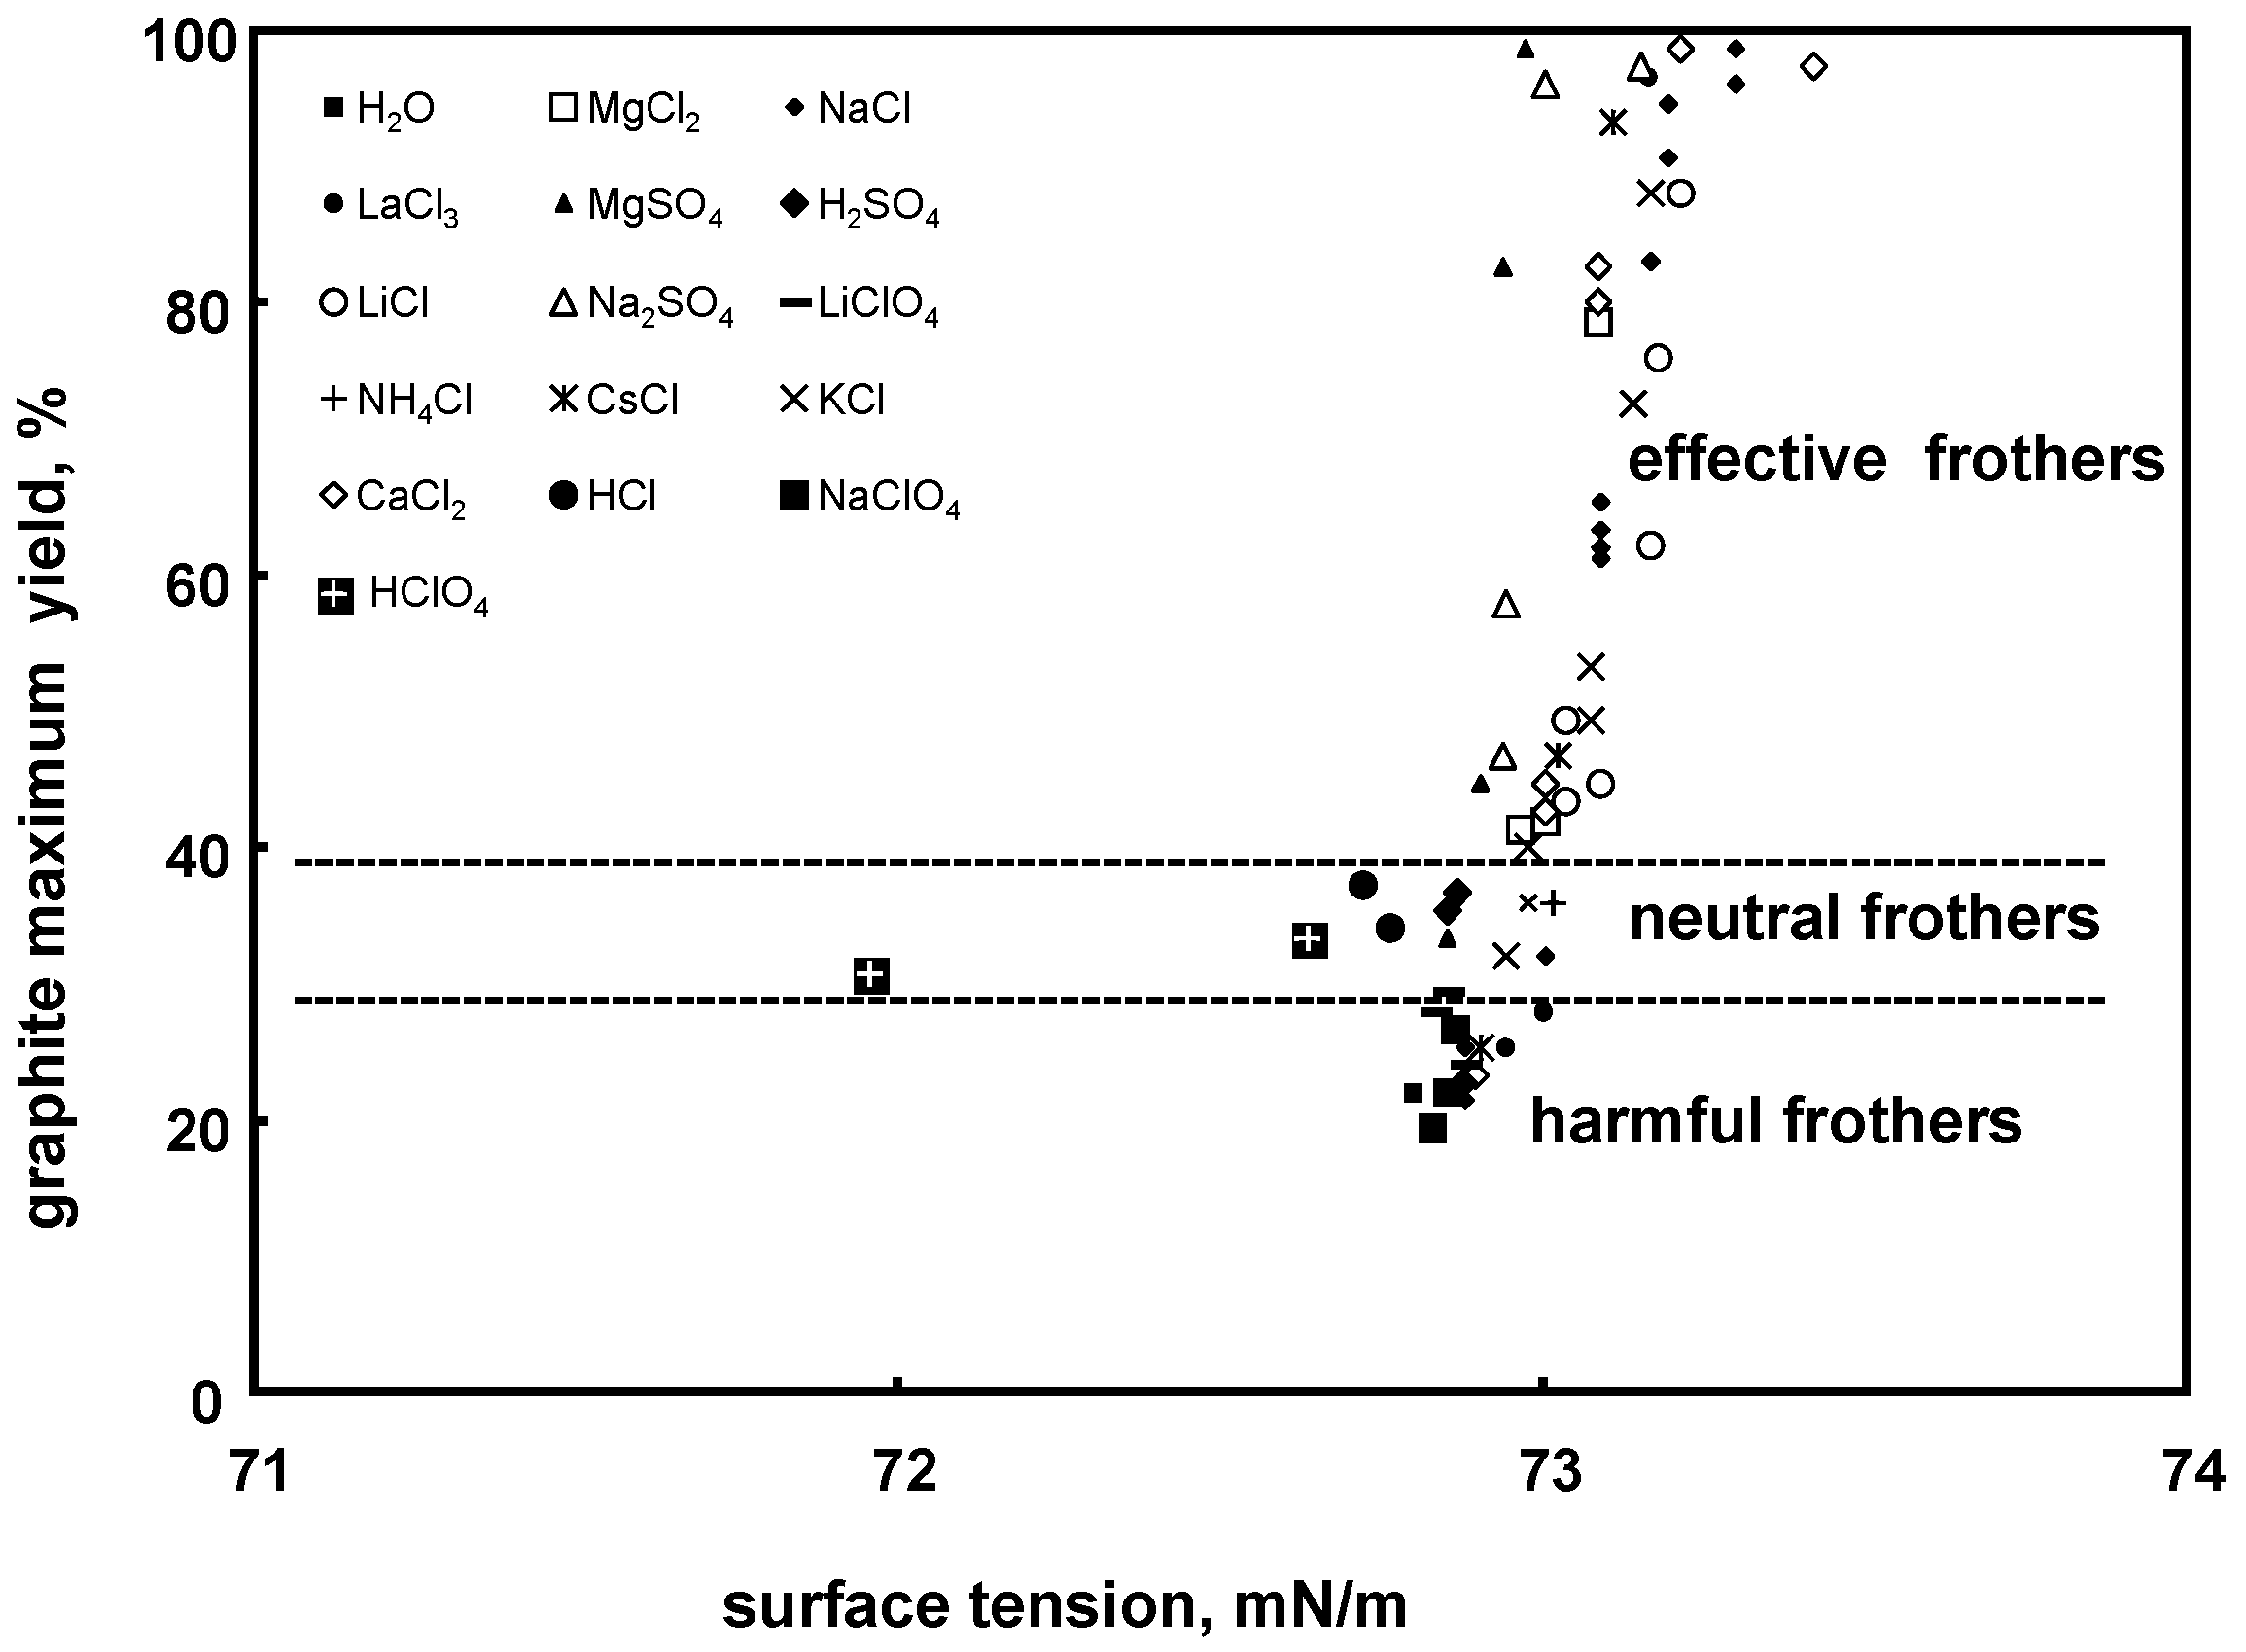
5.1.2. Flotation Performance Versus Surface Tension. Surface Tension Effective, Neutral and Harmful Inorganic Frothers
Pugh et al. [32] investigated flotation of graphite, which is a medium hydrophobic material, in the presence of different inorganic salts. Their data, replotted by Ratajczak and Drzymala [62] (Figure 12) as the yield after a certain flotation time and the surface tension of aqueous solution caused by the frother evidently shows, that there are groups of inorganic frother: effective, neutral, and harmful, resulting from positive (Δσ = +), negative (Δσ = −) and none (Δσ ≅ 0) change of the surface tension with the inorganic frother concentration, respectively. This type of flotation was confirmed in other papers [63,64].
5.2. One Numerical Value Classification
5.2.1. Maximum Flotation Yield versus Frother Concentration. Frother Strength cγ75 and Molar Effectiveness γ1M
The yield versus concentration plots are able to provide not only general classification of frothers into effective, neutral, harmful and overdosed but also various numerical values which can be used for further classifications of frothers. This can be accomplished by performing different cross-sections of the yield-frother concentration plots. Two of them, which are the most obvious, are presented in Figure 13. The horizontal cross-section provides a specific parameter which can be called the frother strength, while vertical cross-section gives molar effectiveness of the frother (Table 13). Since the yield (and also recovery) depends on the type of solid and flotation device, these parameters are not universal but rather specific, depending on the solid properties and the type of flotation device. In addition, the position of the crossing line must be carefully selected. We propose for the horizontal cross-section the yield of 75% as the most practical and therefore the symbol of frother strength is cγ75. In the case of inorganic frothers the practical vertical cross-section is at 1 mol/dm3 and the proposed symbol is γ1M.
5.2.2. Maximum Yield (Recovery) versus Kinetic Constant, k50
More precise characterization and classification of flotation systems and hence frothers, can be achieved taking into account the maximum yield (or recovery) and kinetics of process already shown in Figure 10. The horizontal cross-section of the maximum yield versus kinetic constant plot, called the limits kinetic curves [67] (Figure 14), provides a parameter which is called kinesis of the process [68]. When the cross section is performed at the maximum yield equal to 50%, kinesis is denoted as k50. The selected values of k50 are given in Table 14. The horizontal cross-sections can be performed at other values of k, for instance 75%, providing k75. The data show that flotation of shale in the presence of hexylamine is much less efficient than that of coal with di(propylene glycol) methyl ether, because the value of 1st order kinetic constant of the first process is much smaller. Figure 14b shows that when the data are replotted as the maximum yield vs. k/k50, all the experimental points form one universal line indicating the generic properties of the investigated flotation frothers. This procedure is called normalization. The generic trend means that frothers exhibit similar foaming/frothing behaviour but at different concentrations expressed as either DFI, CCC, CMH, CMV etc. or any other frother characterization parameters e.g., k50.
5.2.3. Power P and Selectivity F of Frothers Based on Upgrading Curves
In the case when more than one solid is present in the flotation system and their recoveries are available, additional one-parameter classification of frothers can be performed [76]. It is based on the Fuerstenau upgrading curve [77,78] used for evaluation of the process efficiency. From the Fuerstenau upgrading curve, which relates recovery of the useful component in the concentrate versus the recovery of the remaining solid components in the tailing, selectivity F and independently power P, are read-off from the graph as shown in Figure 15. The power of frother P is defined as the dose (expressed either in mmol/dm3, mg/dm3 or g/Mg) of frother needed to reach a certain degree of separation. The most convenient is the point when the recovery of the useful component in the concentrate is equal to the recovery of the remaining components in the tailing. Selectivity F, is determined by the point at which the upgrading curve crosses the ascending diagonal. Selectivity F can also be determined mathematically by approximation of the experimental data with suitable equations [79].
5.3. Two-Numerical Value Classification
5.3.1. Maximum Yield versus Specific Rate Constant. Slow/Powerful, Fast/Powerful, Slow/Powerless, Fast/Powerless Frothers
The maximum yield versus specific rate constant relation for many materials provides a two-numerical values map-type relation which can be used for the classification into slow/powerful, fast /powerful, slow/powerless and fast/powerless [67] (Figure 16). This type of classification can also be used for systems involving two or more solids. In such cases the maximum yield is replaced with the maximum recovery.
5.3.2. Special Trend–Type Classifications Based on Relationship between Selectivity and Other Parameters
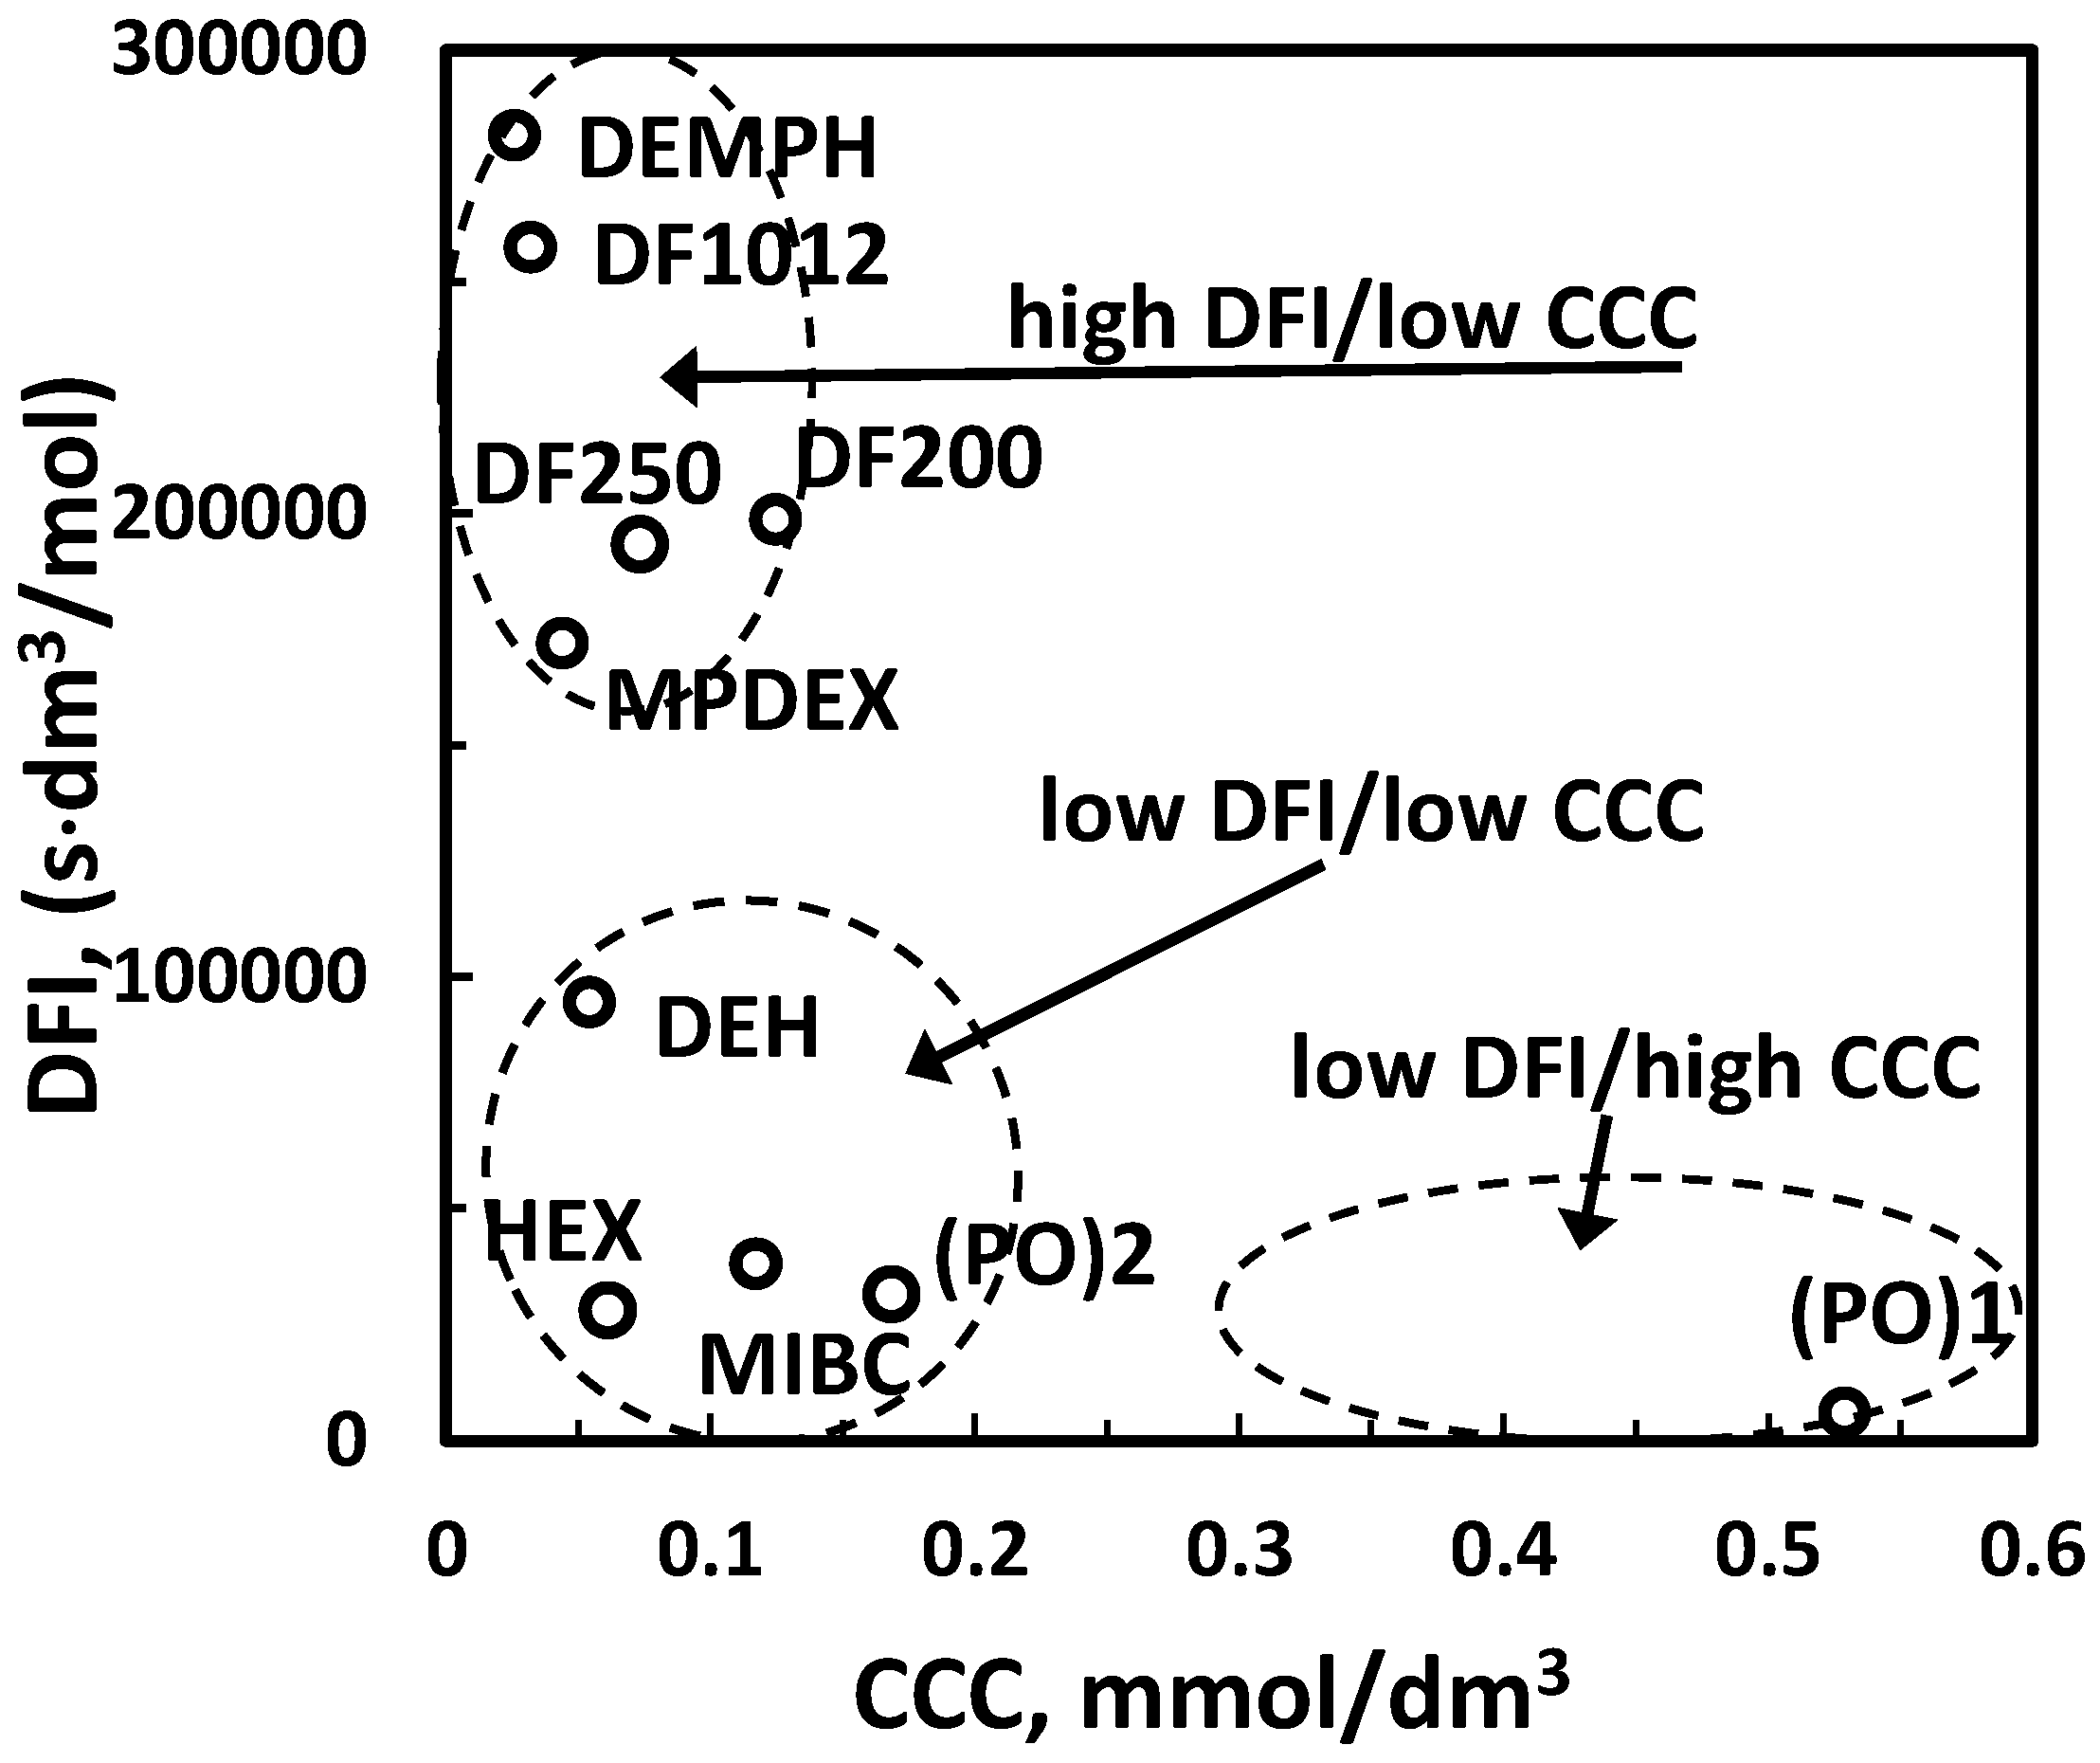
Special trend–type classifications based on relationship between selectivity and additional parameters for frothers present in the solids/gas/liquid systems was proposed by Laskowski [16,45]. They are based on the relation between trends in solids flotation and either pure state (MW and HLB) or liquid/gas system parameters such as DFI and CCC. First, the plot relating MW and HLB (Figure 1) as well as DFI and CCC (Figure 9) are created and next their numerical values are somehow related to the selectivity of flotation of either fine or coarse particles. According to Laskowski [16], frothers with low values of CCC and high DFI produce stable foams and can be used in flotation of coarse particles. They were named powerful. On the other hand, the frothers with high values of CCC and low DFI float well fine particles. They were named selective (Figure 17a). The same procedure can be applied for HLB versus MW plot and fine and coarse particles flotation selectivity data (Figure 17b).
The trend-type correlative classification of frothers in the liquid/gas/fine, medium and coarse particles system is presently not precise because the selectivity and power of frothers are not directly visible from plots and no numerical values are given. Therefore, the classification of frothers into powerful and selective based DFI versus CCC and HLB versus MW requires further development.
5.4. Three-Numerical Value Classification
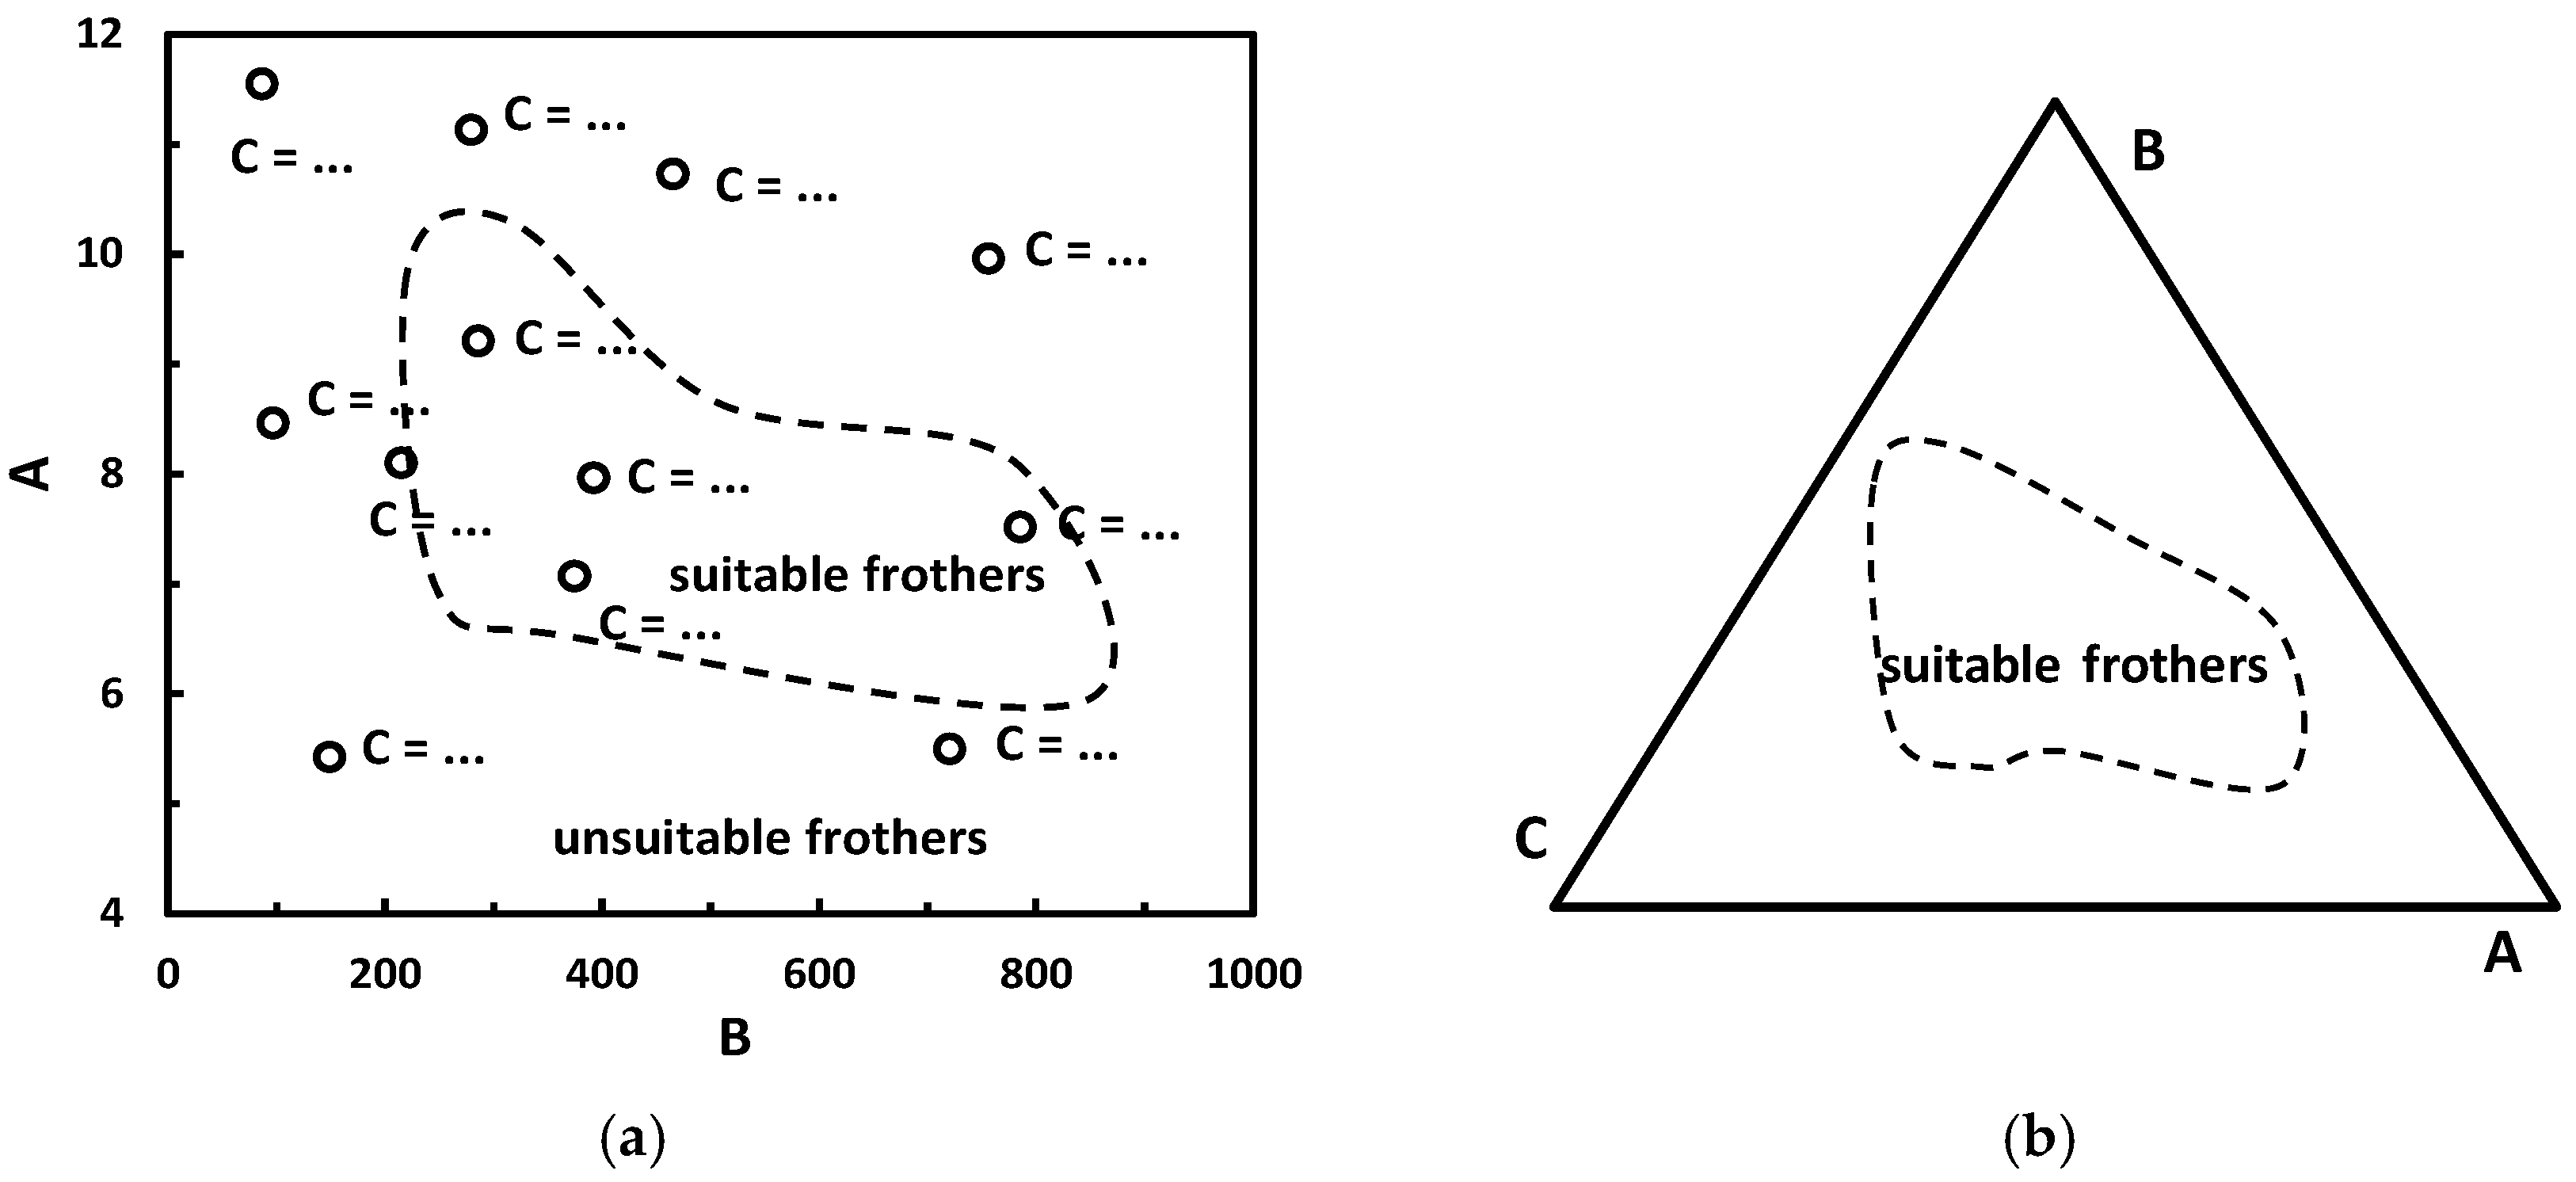
Many parameters of the liquid/solids/gas systems allow to use more than two parameters simultaneously for the classification of frothers. It could be for instance flotation selectivity, froth height and kinetic constant. When three numerical values are considered for the classification, the graphical representation of such approach can be made in the form of a Cartesian x-y plot with data points in the graph amended with numerical values of the third parameter. Another option is the Gibbs triangle [80]. Both are shown schematically in Figure 18.
6. Conclusions
The flotation frothers can be considered as either pure or part of different physical systems resulting from a combination of solid, liquid and gas phases i.e., pure state, aqueous solution, aqueous solution/gas system and aqueous solution/gas/solid system. Once the physical system is defined, the frothers can be classified according to the number of numerical values used for this purpose and five of them are discussed in the paper. The first classification category does not use any numerical value and is based on a feature expressed in words or as it changes, which can be either increasing, constant or decreasing. The second category is based on one numerical value and uses such parameters as solubility, dissociation constant, critical coalescence concentration (CCC), dynamic foaming index (DFI) and many others. The third category uses two parameters leading to double terms of frother class such as low DFI/high CCC or slow (small kinetic constant)/powerful (high maximum yield). In a graphical form the category is a map type of classification. The fourth type is based on three numerical values and leads to a 2D map with isolines. The last category is based on two numerical values, which by means of a relation with another parameter such as flotation of coarse or fine particles, are turned into a single descriptive term. Each proposed classification can play a useful role in characterizing and evaluation of flotation frothers.
Acknowledgments
The work was financed by the Polish Statutory Research Grant No. 0401/0129/17.
Author Contributions
Both authors created the classification system and wrote the paper.
Conflicts of Interest
The authors declare no conflict of interest.
References
- Czarnecki, J.; Malysa, K.; Pomianowski, A. Dynamic frothability index. J. Colloid Interface Sci. 1982, 86, 570–572. [Google Scholar] [CrossRef]
- Cho, Y.S.; Laskowski, J.S. Effect of flotation frothers on bubble size and foam stability. Int. J. Miner. Process. 2002, 64, 69–80. [Google Scholar] [CrossRef]
- Mobius, D.; Miller, R. Studies in Interface Science. Novel Methods to Study Interfacial Layers; Elsevier Science: Amsterdam, The Netherlands, 2001; Volume 11, pp. 1–521. [Google Scholar]
- Fuerstenau, M.C.; Jameson, G.J.; Yoon, R-H. Froth Flotation: A Century of Innovation; SME Inc.: Littleton, CO, USA, 2007. [Google Scholar]
- Drzymala, J. Mineral Processing. Foundations of Theory and Practice of Minerallurgy, 1st ed.; Oficyna Wydawnicza Politechniki Wroclawskiej: Wroclaw, Poland, 2007. [Google Scholar]
- Kosior, D.; Zawala, J.; Krasowska, M.; Malysa, K. Influence of n-octanol and α-terpineol on thin film stability and bubble attachment to hydrophobic surface. Phys. Chem. Chem. Phys. 2013, 15, 2586–2595. [Google Scholar] [CrossRef] [PubMed]
- Wills, B.A.; Finch, J.A. Wills’ Mineral Processing Technology: An Introduction to the Practical Aspects of Ore Treatment and Mineral Recovery, 8th ed.; Elsevier Ltd.: Amsterdam, The Netherlands, 2016. [Google Scholar]
- Leja, J.; Schulman, J.H. Flotation Theory: Molecular interactions between frothers and collectors at solid-liquid-air interfaces. Trans. AIME 1954, 199, 221–228. [Google Scholar]
- Nguyen, A.; Schulze, H.J. Colloidal Science of Flotation; Surfactant Science Series; Marcel Dekker: New York, NY, USA, 2004; Volume 118. [Google Scholar]
- Kowalczuk, P.B.; Drzymala, J. Some remarks on attachment of a gas bubble to another phase both immersed in a water. Physicochem. Probl. Miner. Process. 2016, 52, 147–154. [Google Scholar] [CrossRef]
- Drzymala, J. Hydrophobicity and collectorless flotation of inorganic materials. Adv. Colloid Interface Sci. 1994, 50, 143–186. [Google Scholar] [CrossRef]
- Kowalczuk, P.B.; Drzymala, J. Contact angle of bubble with an immersed-in-water particle of different materials. Ind. Eng. Chem. Res. 2011, 50, 4207–4211. [Google Scholar] [CrossRef]
- Ozdemir, O. Specific ion effect of chloride salts on collectorless flotation of coal. Physicochem. Probl. Miner. Process. 2013, 49, 511–524. [Google Scholar] [CrossRef]
- Kowalczuk, P.B.; Buluc, B.; Sahbaz, O.; Drzymala, J. In search of an efficient frother for pre-flotation of carbonaceous shale from the Kupferschiefer stratiform copper ore. Physicochem. Probl. Miner. Process. 2014, 50, 835–840. [Google Scholar] [CrossRef]
- Khoshdast, H.; Sam, A. Flotation frothers: Review of their classifications, properties and preparation. Open Miner. Process. J. 2011, 4, 25–44. [Google Scholar] [CrossRef]
- Laskowski, J.S. Testing flotation frothers. Physicochem. Probl. Miner. Process. 2004, 38, 13–22. [Google Scholar]
- Gaudin, A.M. Flotation, 2nd ed.; McGraw-Hill Book Company, Inc.: New York, NY, USA, 1957. [Google Scholar]
- Laskowski, J. Frothers and frothing. In Frothing in Flotation II; Laskowski, J.S., Woodburn, E.T., Eds.; Gordon and Breach: Amsterdam, The Netherlands, 1998; pp. 1–49. [Google Scholar]
- Chain Reaction Cycles (CRC). Handbook of Chemistry AND Physics, 67th ed.; CRC Press: Boca Raton, FL, USA, 1986–1987. [Google Scholar]
- Davies, J.T. A quantitative kinetic theory of emulsion type, I. Physical chemistry of the emulsifying agent, Gas/Liquid and Liquid/Liquid Interface. In Proceedings of the International Congress of Surface Activity, London, UK, 20–31 July 1957; pp. 426–438. [Google Scholar]
- Tanaka, K.; Igarashi, A. Determination of nonionic surfactants. In Handbook of Detergents Part C: Analysis; Waldhoff, H., Spilker, R., Eds.; CRC Press: Boca Raton, FL, USA, 2005; pp. 149–214. [Google Scholar]
- Zhang, W.; Nesset, J.E.; Rao, R.; Finch, J.A. Characterizing frothers through critical coalescence concentration (CCC)95-hydrophile-lipophile balance (HLB) relationship. Minerals 2012, 2, 208–227. [Google Scholar] [CrossRef]
- Dudenkov, S.V.; Galikov, A.A. Theory and Practice of Application of Flotation Reagents; Nedra: Moscow, Russia, 1969. [Google Scholar]
- Bulatovic, S.M. Handbook of Flotation Reagents: Chemistry, Theory and Practice; Elsevier Science: Amsterdam, The Netherlands, 2007. [Google Scholar]
- Crozier, R.D. Properties of Flotation Froths: Flotation—Theory, Reagent and Ore Testing; Pergamon: New York, NY, USA, 1992. [Google Scholar]
- Yaws, C.L.; Hopper, J.R.; Sheth, S.D.; Han, M.; Pike, R.W. Solubility and Henry’s law constant for alcohols in water. Waste Manag. 1997, 17, 541–547. [Google Scholar] [CrossRef]
- Li, J.; Perdue, E.M. Physicochemical properties of selected monterpenes. Environ. Int. 1998, 24, 353–358. [Google Scholar] [CrossRef]
- Wang, S. Flotation Reagents: Applied Surface Chemistry on Minerals Flotation and Energy Resources Beneficiation; Springer: Singapore, 2016. [Google Scholar]
- Technical Data & Safety Bulletin. 2017. Available online: http://www.monumentchemical.com/documents/MIBC-Data_and_Safety_Sheet.pdf (accessed on 1 November 2017).
- Inoue, T.; Ohmura, H.; Murata, D. Cloud point temperature of polyoxyethylene–type nonionic surfactants and their mixtures. J. Colloid Interface Sci. 2003, 258, 374–382. [Google Scholar] [CrossRef]
- Lekki, J.; Laskowski, J. A new concept of frothing in flotation systems and general classification of flotation frothers. In Proceedings of the XIth International Mineral Processing Congress, Cagliari, Italy, 20–26 April 1975; pp. 429–448. [Google Scholar]
- Pugh, R.J.; Weissenborn, P.; Paulson, O. Flotation in inorganic electrolytes: The relationship between recovery of hydrophobic particles, surface tension, bubble coalescence and gas solubility. Int. J. Miner. Process. 1997, 51, 125–138. [Google Scholar] [CrossRef]
- DeWitt, C.C.; Roper, E.E. The surface relations of potassium ethyl xanthate and pine oil. J. Am. Chem. Soc. 1932, 54, 444–455. [Google Scholar] [CrossRef]
- Tuckermann, R. Surface tension of aqueous solutions of water-soluble organic and inorganic compounds. Atmos. Environ. 2007, 41, 6265–6275. [Google Scholar] [CrossRef]
- Tamaki, K. The surface activity of the lower homologues of n-alkylammonium chlorides in aqueous solutions. Effect of hydrophobic hydration. Colloid Polyme. Sci. 1974, 252, 547–550. [Google Scholar]
- Lyklema, J. Fundamentals of Interface and Colloid Science; Academic Press: London, UK, 1993; Volume 1. [Google Scholar]
- Burczyk, B.; Sokolowski, A. Relations between chemical structure and surface activity—1. Synthesis and properties of aqueous solutions of acetals formed from aliphatic aldehydes and monoalkyl ethers of ethylene glycols. Tenside Deterg. 1978, 15, 68–71. [Google Scholar]
- Aston, J.R.; Drummond, C.J.; Scales, F.J.; Healy, T.W. Frother chemistry in fine coal processing. In Proceedings of the 2nd Australian Coal Preparation Congress, Brisbane, Australia, 10–14 October 1983; Whitmore, R.I., Ed.; Westminster Press: Brisbane, Australia, 1983; pp. 148–160. [Google Scholar]
- Takata, Y.; Tagashira, H.; Hyono, A.; Ohshima, H. Effect of counterion and configurational entropy on the surface tension of aqueous solution of ionic surfactants and electrolyte mixtures. Entropy 2010, 12, 983–995. [Google Scholar] [CrossRef]
- Warszynski, P.W.; Barzyk, W.; Lunkenheimer, K.; Fruhner, H. Surface tension and surface potential of Na n-dodecyl sulfate at the air−solution interface: Model and experiment. J. Phys. Chem. B 1998, 102, 10948–10957. [Google Scholar] [CrossRef]
- Karraker, K.A.; Radke, C.J. Disjoining pressure, zeta potential and surface tension of aqueous non-ionic surfactant/electrolyte solution: Theory and comparison to experiment. Adv. Colloid Interface Sci. 2002, 96, 231–264. [Google Scholar] [CrossRef]
- Kowalczuk, P.B. Determination of critical coalescence concentration and bubble size for surfactants used as flotation frothers. Ind. Eng. Chem. Res. 2013, 52, 11752–11757. [Google Scholar] [CrossRef]
- Kowalczuk, P.B.; Zawala, J.; Drzymala, J. Concentration at the minimum bubble velocity (CMV) for various types of flotation frothers. Minerals 2017, 7, 118. [Google Scholar] [CrossRef]
- Sweet, C.; van Hoogstraten, J.; Harris, M.; Laskowski, J.S. The effect of frothers on bubble size and frothability of aqueous solutions. In Processing of the Complex Ores, Proceedings of the 2nd UBC-McGill International Symposium, Montreal, QC, Canada, 17–19 August 1997; Finch, J.A., Rao, S.R., Holubec, I., Eds.; Metallurgical Society of CIM: Montreal, QC, Canada, 1997; pp. 235–245. [Google Scholar]
- Laskowski, J.S.; Tlhone, T.; Williams, P.; Ding, K. Fundamental properties of the polyoxypropylene alkyl ether flotation frothers. Int. J. Miner. Process. 2003, 72, 289–299. [Google Scholar] [CrossRef]
- Gupta, A.K.; Banerjee, P.K.; Mishra, A.; Satish, P.; Pradip. Effect of alcohol and polyglycol ether frothers on foam stability, bubble size and coal flotation. Int. J. Miner. Process. 2007, 82, 126–137. [Google Scholar] [CrossRef]
- Finch, J.; Zhang, W. Frother function-structure relationship: Dependence of CCC95 on HLB and H-ratio. Miner. Eng. 2014, 61, 1–8. [Google Scholar] [CrossRef]
- Azgomi, F.; Gomez, C.O.; Finch, J.A. Characterizing frothers using gas hold-up. Can. Metall. Q. 2007, 46, 237–242. [Google Scholar] [CrossRef]
- Tan, Y.H.; Finch, J.A. Frother structure–property relationship: Effect of alkyl chain length in alcohols and polyglycol ethers on bubble rise velocity. Miner. Eng. 2016, 95, 14–20. [Google Scholar] [CrossRef]
- Malysa, E.; Malysa, K.; Czarnecki, J. A method of comparison of the frothing and collecting properties of frothers. Colloids Surfaces 1987, 23, 29–39. [Google Scholar] [CrossRef]
- Khoshdast, H.; Mirshekari, S.; Zahab-Nazouri, A. A model for predicting dynamic frothability index value for dual-frother blends. J. Min. Environ. 2015, 6, 119–124. [Google Scholar] [CrossRef]
- Kowalczuk, P.B.; Siedlarz, M.; Szczerkowska, S.; Wojcik, M. Facile determination of foamability index of non-ionic and cationic frothers and its effect on flotation of quartz. Sep. Sci. Technol. 2017, 38, 1–9. [Google Scholar] [CrossRef]
- Tan, Y.H.; Rafiei, A.A.; Elmahdy, A.; Finch, J.A. Bubble size, gas holdup and bubble velocity profile of some alcohols and commercial frothers. Int. J. Miner. Process. 2013, 119, 1–5. [Google Scholar] [CrossRef]
- Barbian, N.; Ventura-Medina, E.; Cilliers, J.J. Dynamic froth stability in froth flotation. Miner. Eng. 2003, 16, 1111–1116. [Google Scholar] [CrossRef]
- Smolska, M.; Ratajczak, T. Flotacja mechaniczna łupka miedzionośnego we flotowniku Hallimonda w roztworach soli podwyzszających i obnizajacych napiecie powierzchniowe wody. In Lupek Miedzionosny III; Kowalczuk, P.B., Drzymala, J., Eds.; WGGG PWr: Wroclaw, Poland, 2017; pp. 97–102. (In Polish) [Google Scholar]
- Kowalczuk, P.B.; Mroczko, D.; Drzymala, J. Influence of frother type and dose on collectorless flotation of copper-bearing shale in a flotation column. Physicochem. Probl. Miner. Process. 2015, 51, 547–558. [Google Scholar] [CrossRef]
- Kowalczuk, P.B.; Zawala, J.; Kosior, D.; Drzymala, J.; Malysa, K. Three-phase contact formation and flotation of highly hydrophobic polytetrafluoroethylene in the presence of increased dose of frothers. Ind. Eng. Chem. Res. 2016, 55, 839–843. [Google Scholar] [CrossRef]
- Lyklema, J. Fundamentals of Interface and Colloid Science: Liquid-Liquid Interfaces; Academic Press: London, UK, 2000; Volume III. [Google Scholar]
- Deschenes, L.; Lyklema, J.; St-Germain, F. Entropy of aqueous surfaces. Application to polymeric Langmuir films. Adv. Colloid Interface Sci. 2017, 247, 149–162. [Google Scholar] [CrossRef] [PubMed]
- Okur, H.I.; Chen, Y.; Wilkins, D.M.; Roke, S. The Jones-Ray effect reinterpreted: Surface tension minima of low ionic strength electrolyte solutions are caused by electric field induced water-water correlations. Chem. Phys. Lett. 2017, 684, 433–442. [Google Scholar] [CrossRef]
- Lynch, A.J.; Watt, J.S.; Finch, J.A.; Harbort, G.E. History of flotation technology. In Froth Flotation: A Century of Innovation; Fuerstenau, M.C., Jameson, G.J., Yoon, R.-H., Eds.; SMME Inc.: Littleton, CO, USA, 2007. [Google Scholar]
- Ratajczak, T.; Drzymala, J. Flotacja Solna; Oficyna Wydawnicza Politechniki Wrocławskiej: Wroclaw, Poland, 2003. (In Polish) [Google Scholar]
- Grabowski, B.; Drzymala, J. Graphite flotation in the presence of sodium acetate. Ann. UMCS Chem. 2008, 6, 58–72. [Google Scholar] [CrossRef]
- Lipniarski, M.; Ratajczak, T.; Drzymała, J. Weryfikacja hipotez o roli soli we flotacji na przykładzie węgla kamiennego w wodnych roztworach NaCl I KPF6. In Proceedings of the III Polski Kongres Gorniczy, Mineralurgia I Wykorzystanie Surowcow Mineralnych, Wroclaw, Poland, 14–16 September 2015; Drzymała, J., Kowalczuk, P.B., Eds.; WGGG PWr: Wroclaw, Poland, 2015; pp. 35–39. (In Polish). [Google Scholar]
- Weissenborn, P.K.; Pugh, R.J. Surface tension of aqueous solutions of electrolytes: Relationship with ion hydration, oxygen solubility, and bubble coalescence. J. Colloid Interface Sci. 1996, 184, 550–563. [Google Scholar] [CrossRef] [PubMed]
- Paulson, O.; Pugh, R.J. Flotation of inherently hydrophobic particles in aqueous solutions of inorganic electrolytes. Langmuir 1996, 12, 4808–4813. [Google Scholar] [CrossRef]
- Drzymala, J.; Ratajczak, T.; Kowalczuk, P.B. Kinetic separation curves based on process rate considerations. Physicochem. Probl. Miner. Process. 2017, 53, 983–995. [Google Scholar] [CrossRef]
- Drzymala, J.; Stodulski, M. Moc i kineza heksyloaminy we flotacji lupka miedzionosnego. In Lupek Miedzionosny III; Kowalczuk, P.B., Drzymala, J., Eds.; WGGG PWr: Wroclaw, Poland, 2017; pp. 167–171. (In Polish) [Google Scholar]
- Szajowska, J.; Wejman, K.; Kowalczuk, P.B. Froth flotation of shale and quartz the in Hallimonda tube. In Kupferschiefer; Kowalczuk, P.B., Drzymala, J., Eds.; WGGG: Wroclaw, Poland, 2014; pp. 91–97. (In Polish) [Google Scholar]
- Kudlaty, T. Maximum Size of Floating Particles of Copper-Bearing Shale in the Presence of Frothers. Bachelor’s Thesis, Wroclaw University of Science and Technology, Wroclaw, Poland, January 2016. (In Polish). [Google Scholar]
- Merta, P.; Drzymala, J. Influence of sodium chloride and sodium acetate on flotation of anthracite coal as a model substance rich in kerogen. In Kupferschiefer II; Kowalczuk, P.B., Drzymala, J., Eds.; WGGG PWR: Wroclaw, Poland, 2016; pp. 195–200. (In Polish) [Google Scholar]
- Kowalczuk, P.B.; Zawala, J. A relation between time of the three-phase contact formation and flotation kinetics of naturally hydrophobic solids. Colloids Surfaces A Phys. Eng. Asp. 2016, 506, 371–377. [Google Scholar] [CrossRef]
- Kalinowski, K.; Kaula, R. Verification of flotation kinetics model for triangular distribution of density function of floatabilities of coal particles. Arch. Min. Sci. 2013, 58, 1279–1287. [Google Scholar] [CrossRef]
- Chipfunhu, D.; Zanina, M.; Grano, S. Flotation behaviour of fine particles with respect to contact angle. Chem. Eng. Res. Des. 2012, 90, 26–32. [Google Scholar] [CrossRef]
- Janicki, M.; Bartkowicz, L.; Zakrecki, B.; Kowalczuk, P.B. Collectorless coal flotation in the presence of foaming agents. In Proceedings of the III Polish Mining Congress, Minerallurgy and Utilization of Mineral Resources, Wroclaw, Poland, 14–16 September 2015; Drzymala, J., Kowalczuk, P.B., Eds.; WGGG PWR: Wroclaw, Poland, 2015; pp. 52–60. (In Polish). [Google Scholar]
- Kowalczuk, P.B.; Drzymala, J. Selectivity and power of frothers in copper ore flotation. Physicochem. Probl. Miner. Process. 2017, 53, 515–523. [Google Scholar] [CrossRef]
- Fuerstenau, D.W. Coal Surface Control for Advanced Fine Coal Flotation; Final Report DOE/PC/88878-T12; University of California: Berkeley, CA, USA, July 1991. [Google Scholar]
- Drzymala, J. Atlas of upgrading curves used in separation and mineral science and technology. Part I. Physicochem. Probl. Miner. Process. 2006, 40, 19–29. [Google Scholar]
- Drzymala, J.; Ahmed, H.A.M. Mathematical equations for approximation of separation results using the Fuerstenau upgrading curves. Int. J. Miner. Process. 2005, 76, 55–65. [Google Scholar] [CrossRef]
- Raghavan, V. On the Gibbs Triangle. J. Phase. Equilib. Diff. 2008, 29, 213–215. [Google Scholar] [CrossRef]
Figure 1.
Two-numerical value classification of frothers in pure state according to hydrophobic-lipophilic balance (HLB) and molecular weight (MW) (based on [16]).
Figure 1.
Two-numerical value classification of frothers in pure state according to hydrophobic-lipophilic balance (HLB) and molecular weight (MW) (based on [16]).
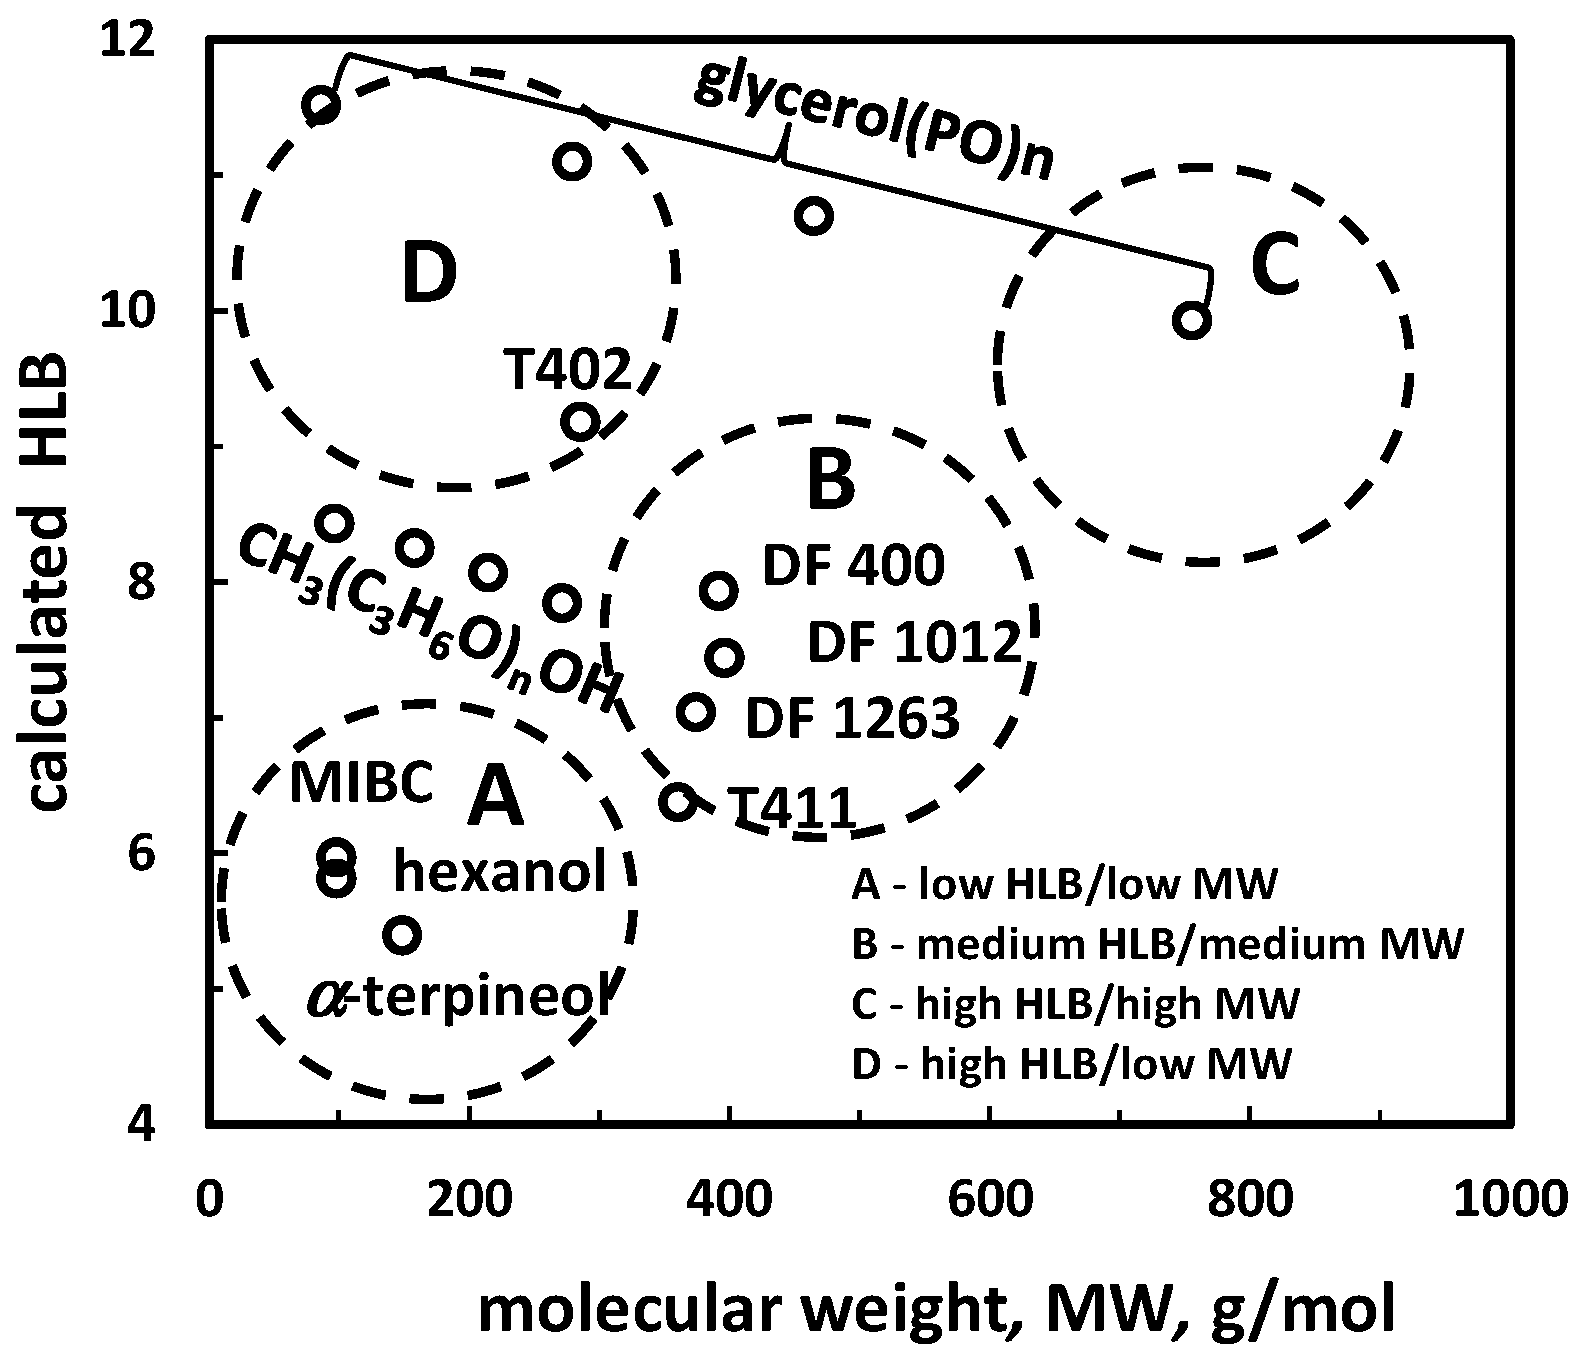
Figure 2.
Classification of frothers, based on their ability to change surface tension of water, into surface active with characteristic slope (σ∠) and surfactants which significantly lower surface tension of aqueous solutions.
Figure 2.
Classification of frothers, based on their ability to change surface tension of water, into surface active with characteristic slope (σ∠) and surfactants which significantly lower surface tension of aqueous solutions.
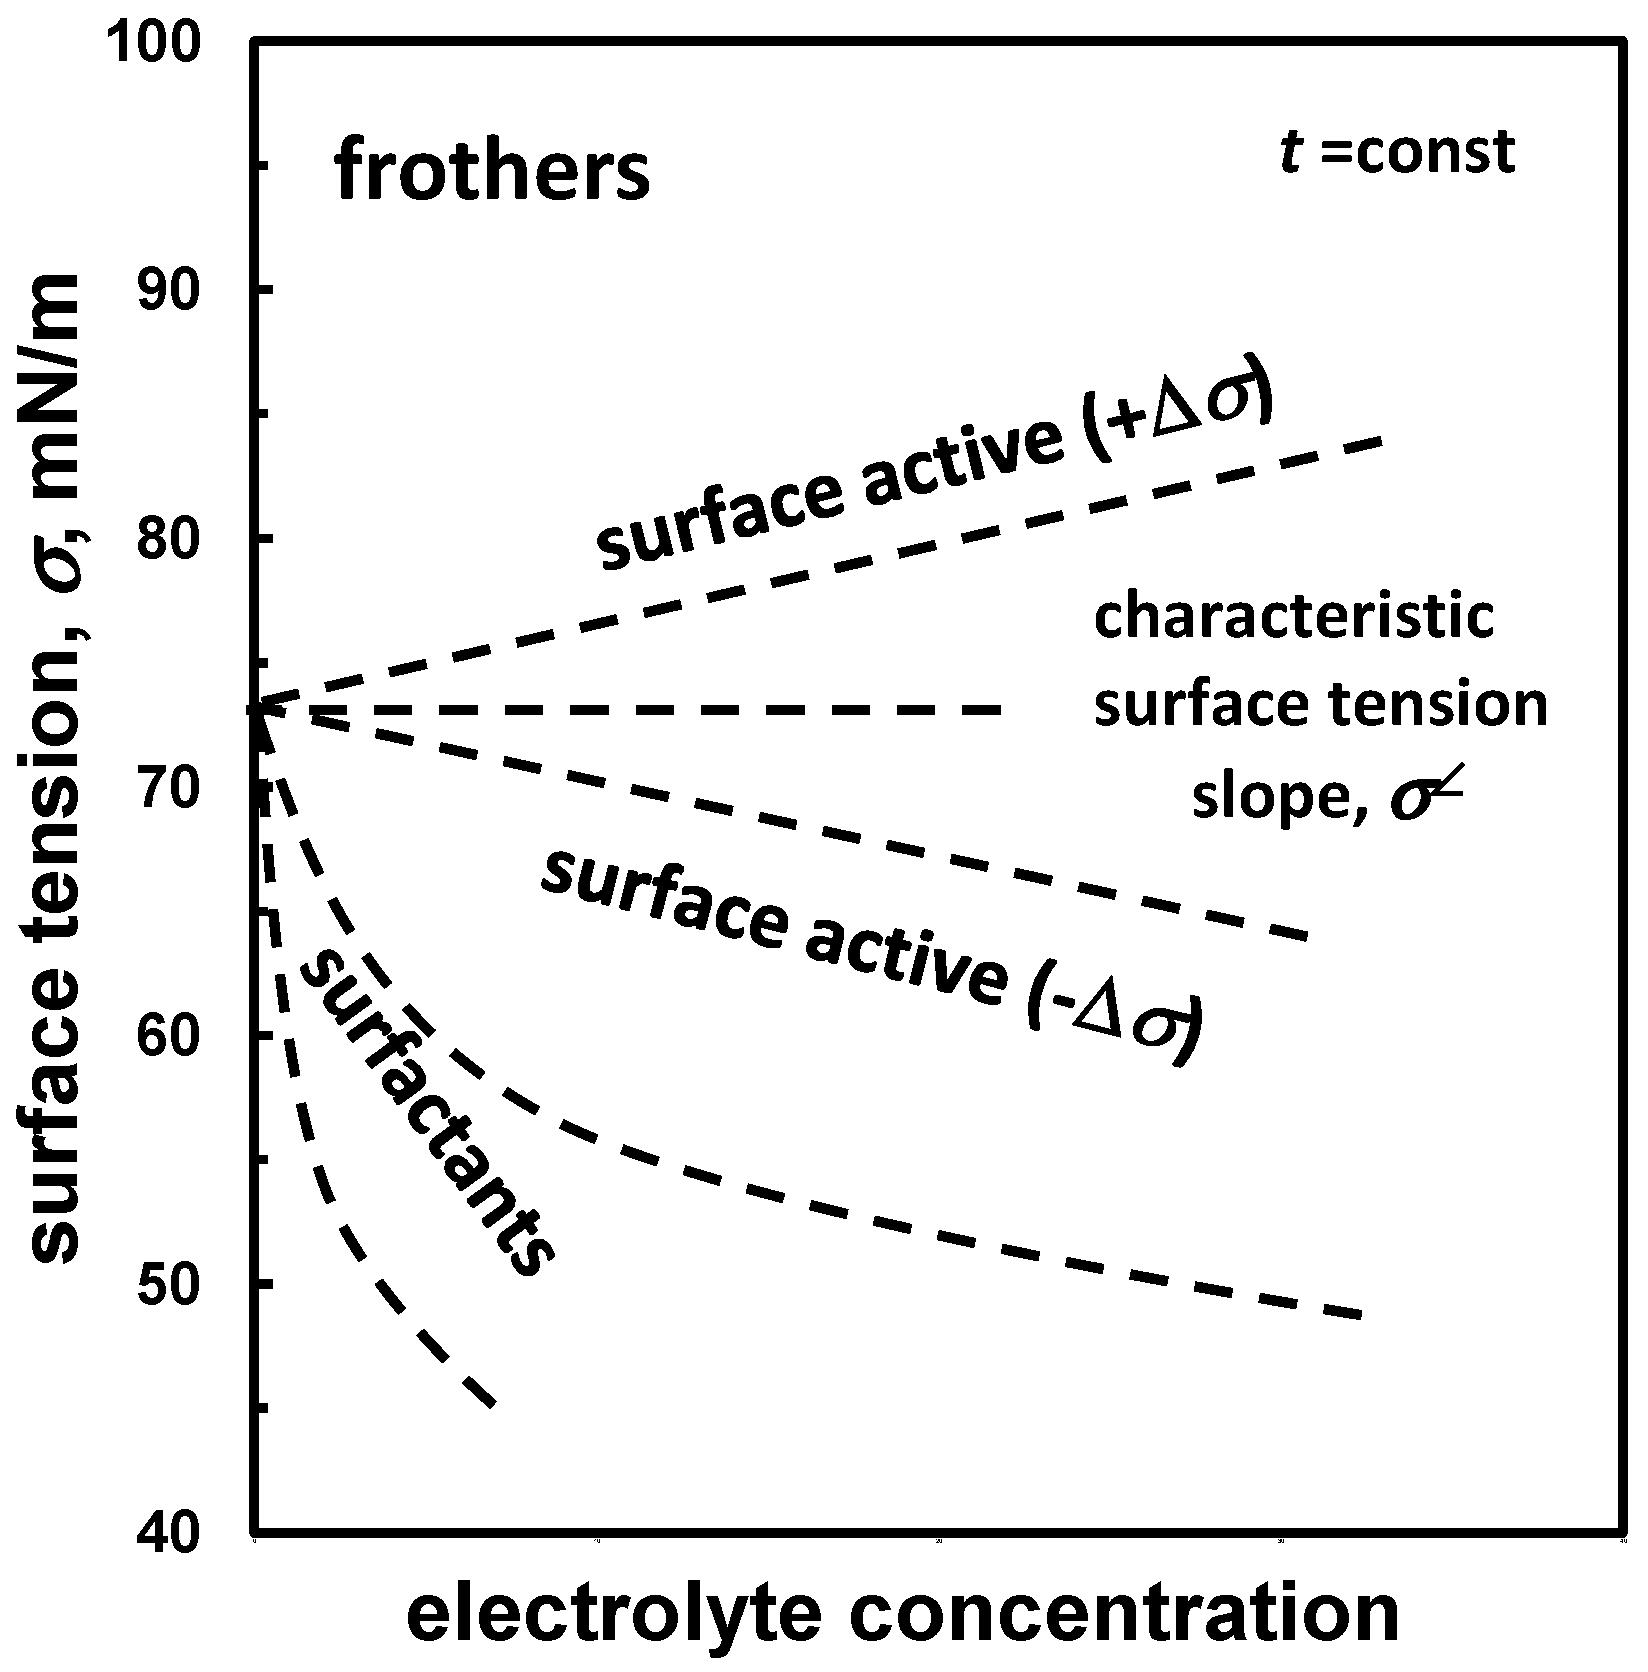
Figure 3.
Slope of surface tension of aqueous solution of selected organic and inorganic reagents, (a) inorganic salts [32]; (b) inorganic acids [19]; (c) inorganic bases [19]; (d) organic reagents ([19,33], assumed solution density 1 g/cm3).
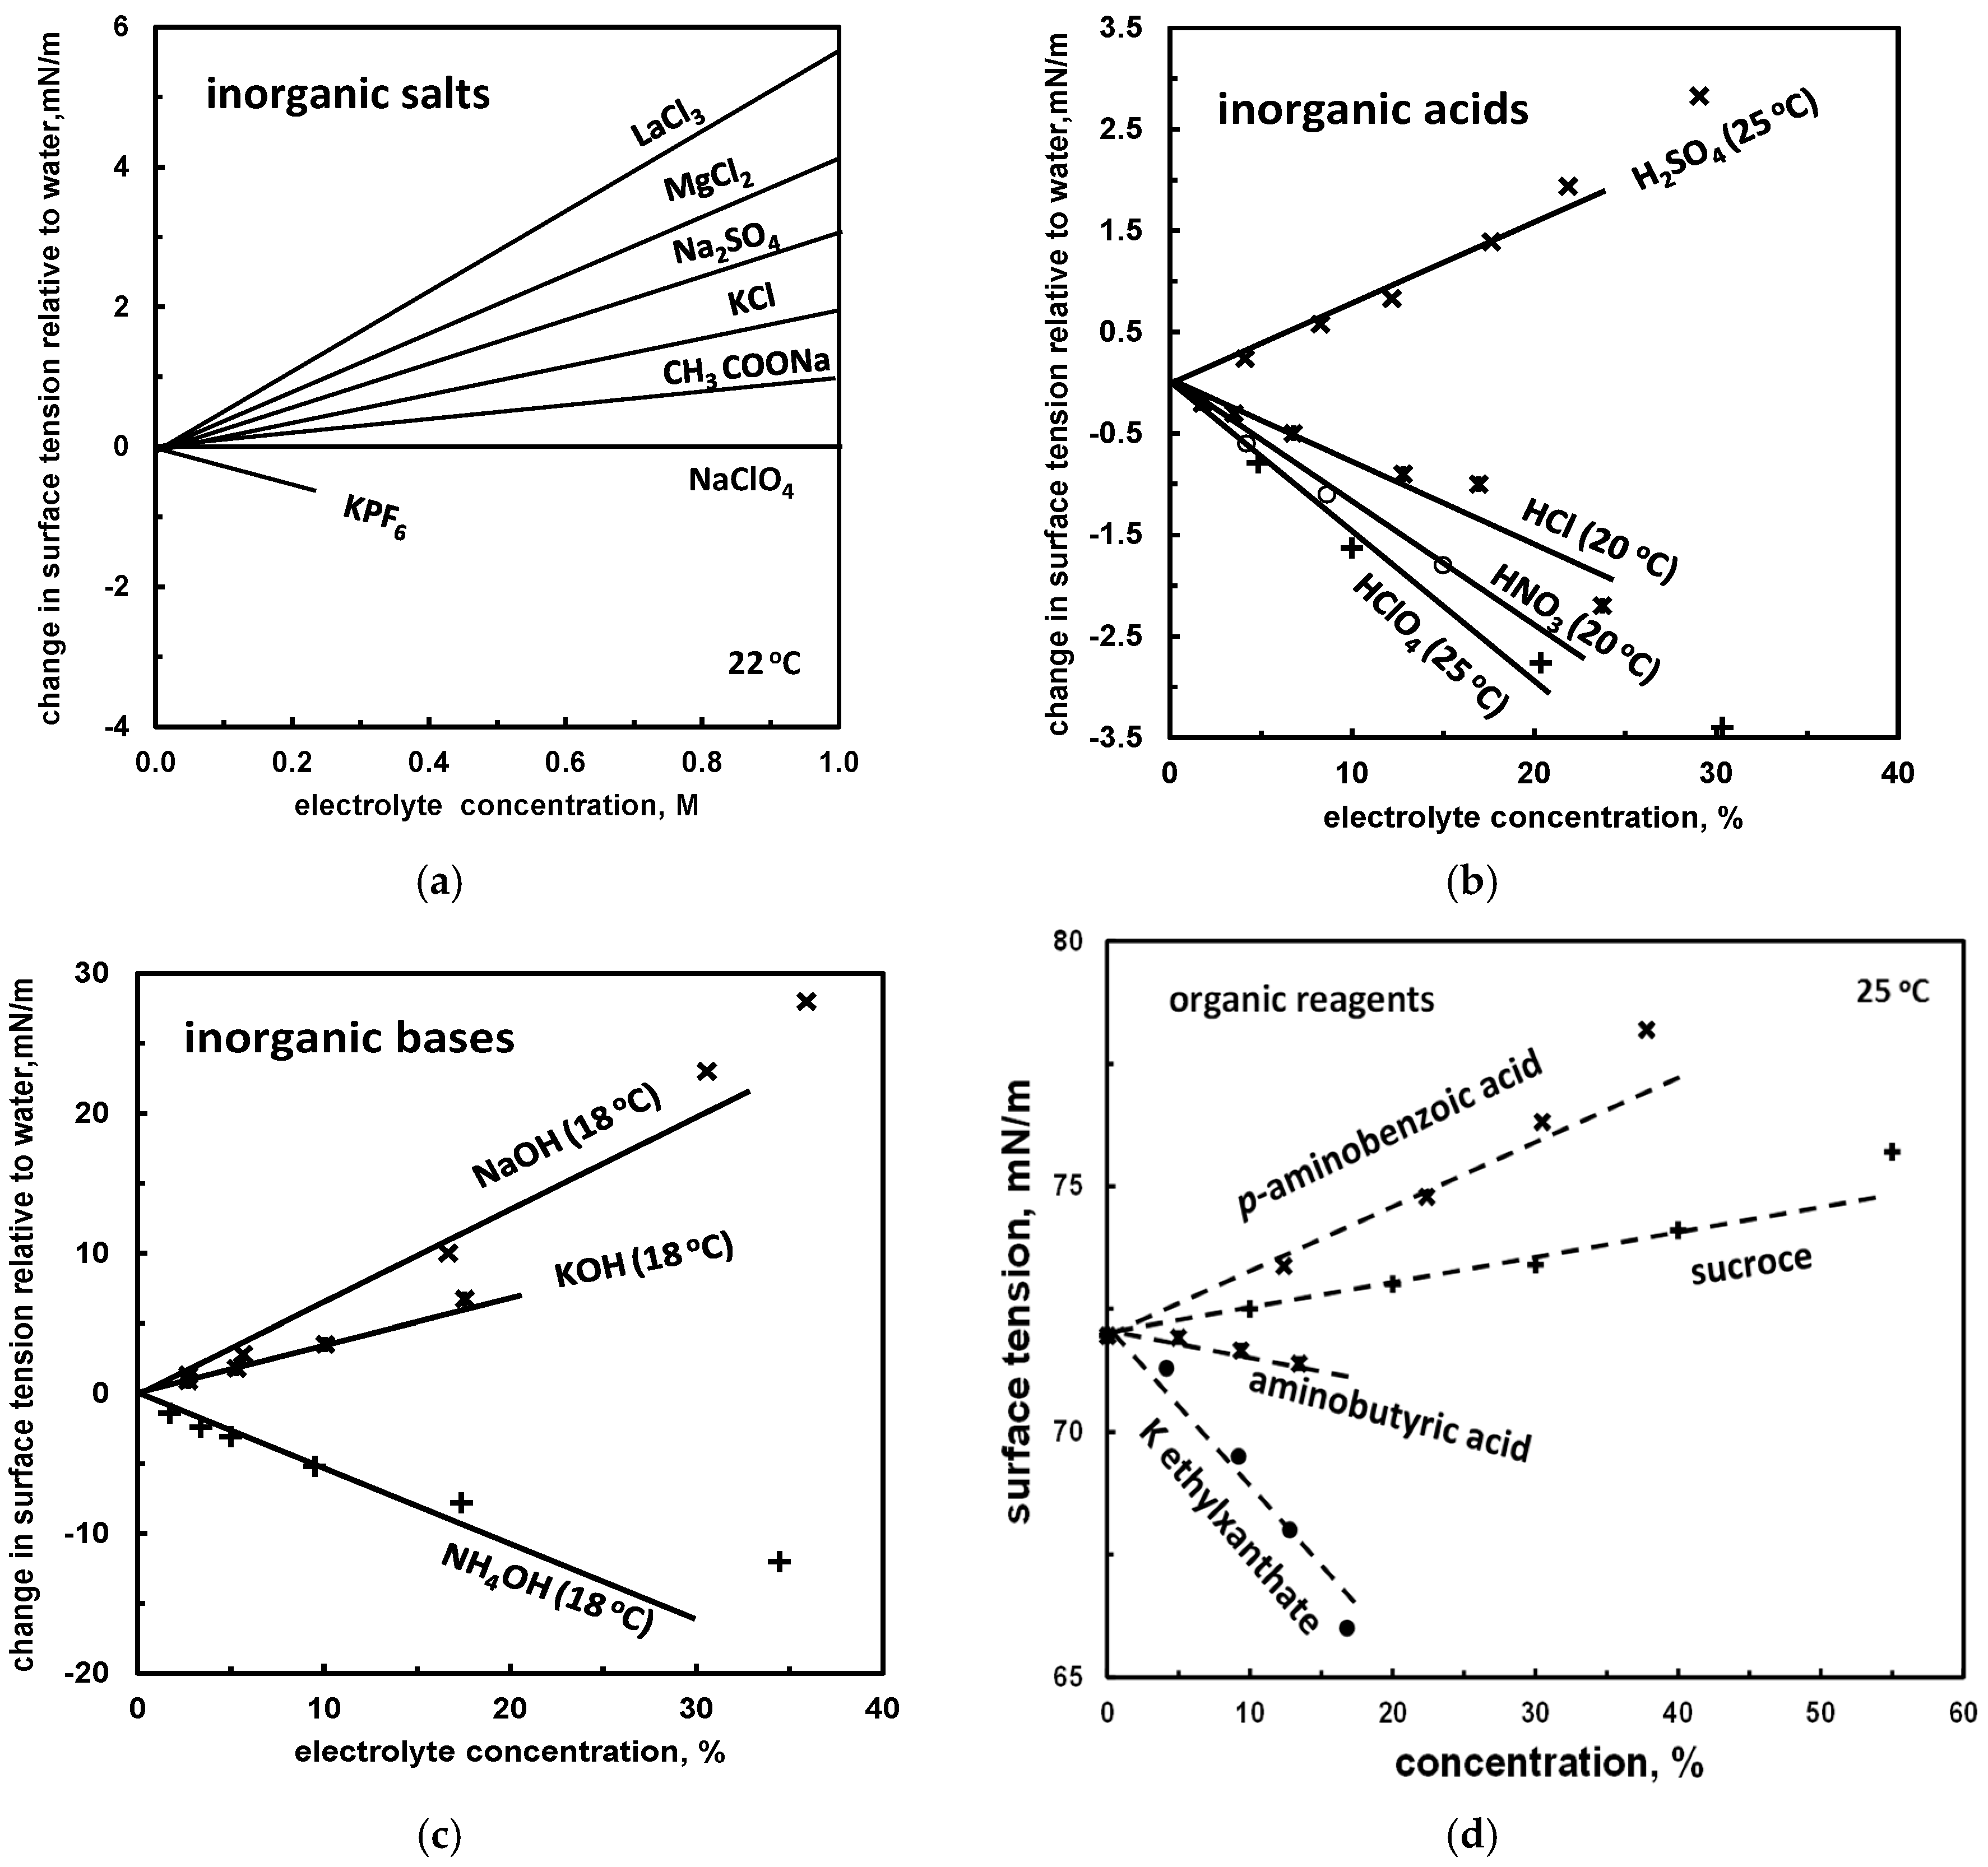
Figure 4.
Surface tension of aqueous solution of selected surfactants and cσ50 determination. (a) surfactants (acetals [37]; methyl isobutyl carbinol (MIBC) [38]; dodecyl trimethylammonium bromide (DTAB): [39]; (b) surfactants (semilog scale) (hexyl ammonium chloride: [35]; Na n-dodecyl sulphate: [40]; diethylene oxide n-decyl ether: [41]).
Figure 5.
Determination of CCC, CCC95 and CCCt from the relation between average bubble size and frother concentration.
Figure 5.
Determination of CCC, CCC95 and CCCt from the relation between average bubble size and frother concentration.
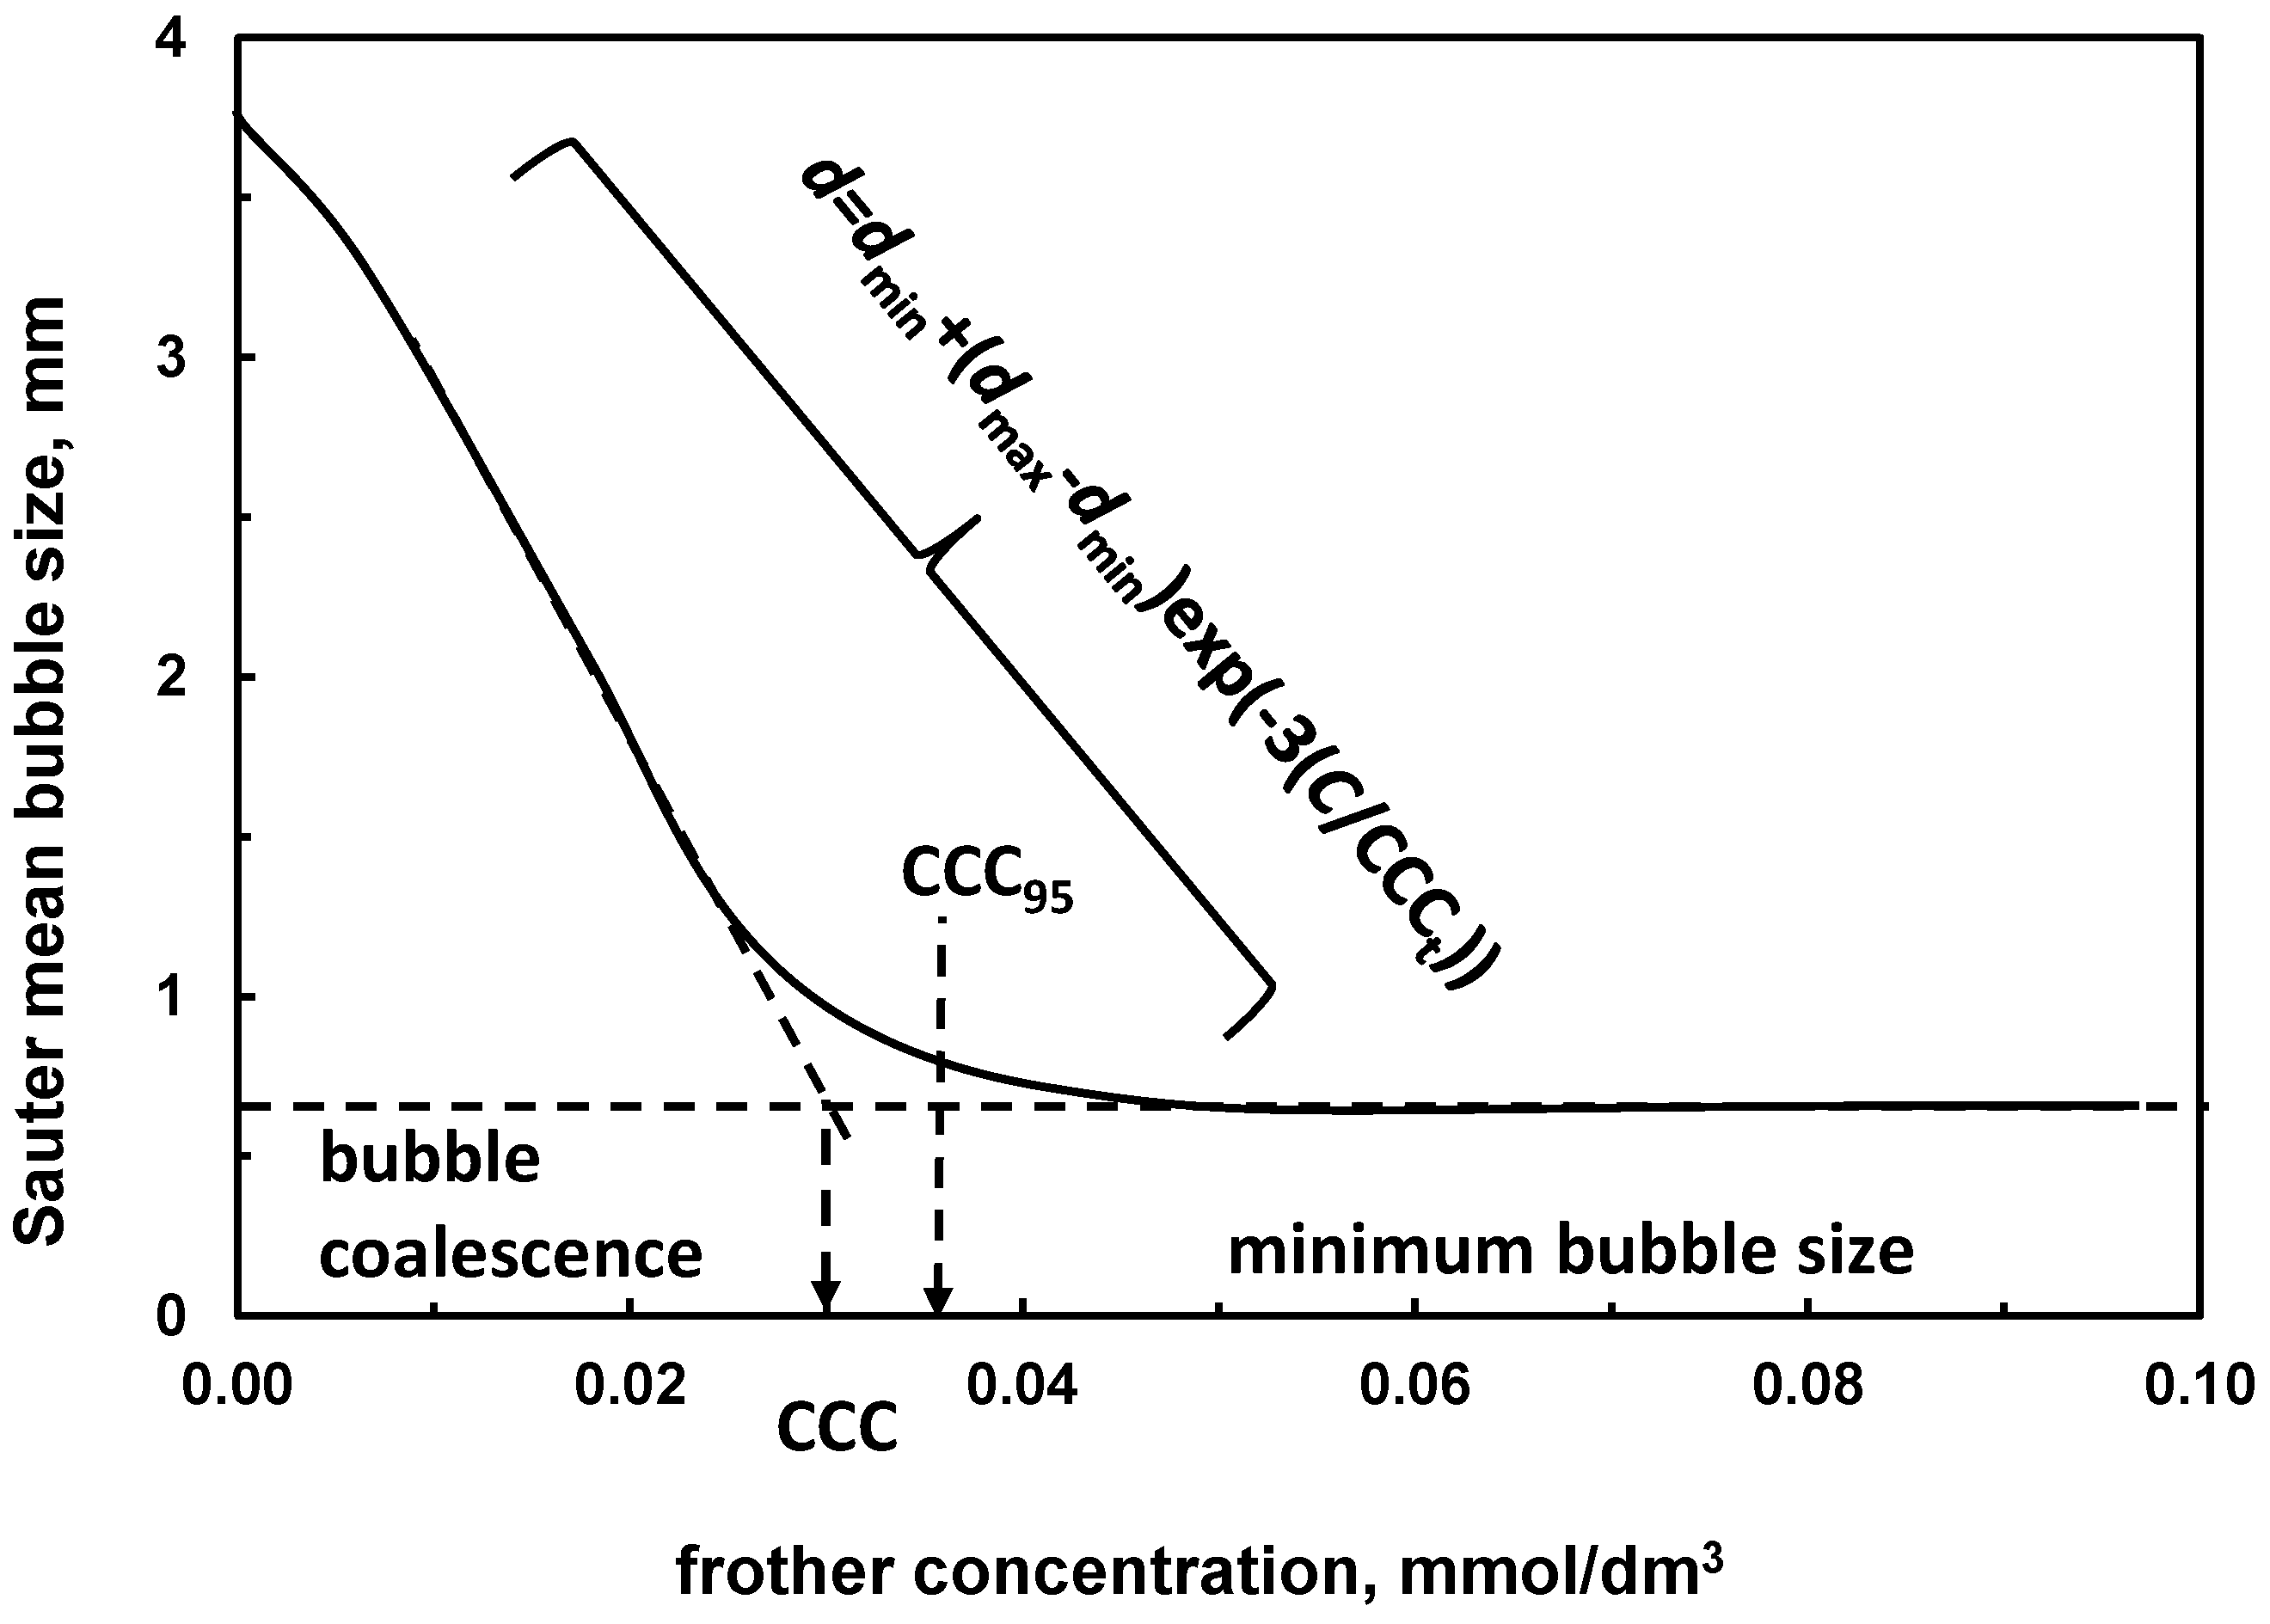
Figure 6.
Relation between CCC and HLB/MW [42].
Figure 6.
Relation between CCC and HLB/MW [42].

Figure 7.
Gas hold-up as a function frother concentration (based on [48]).
Figure 7.
Gas hold-up as a function frother concentration (based on [48]).
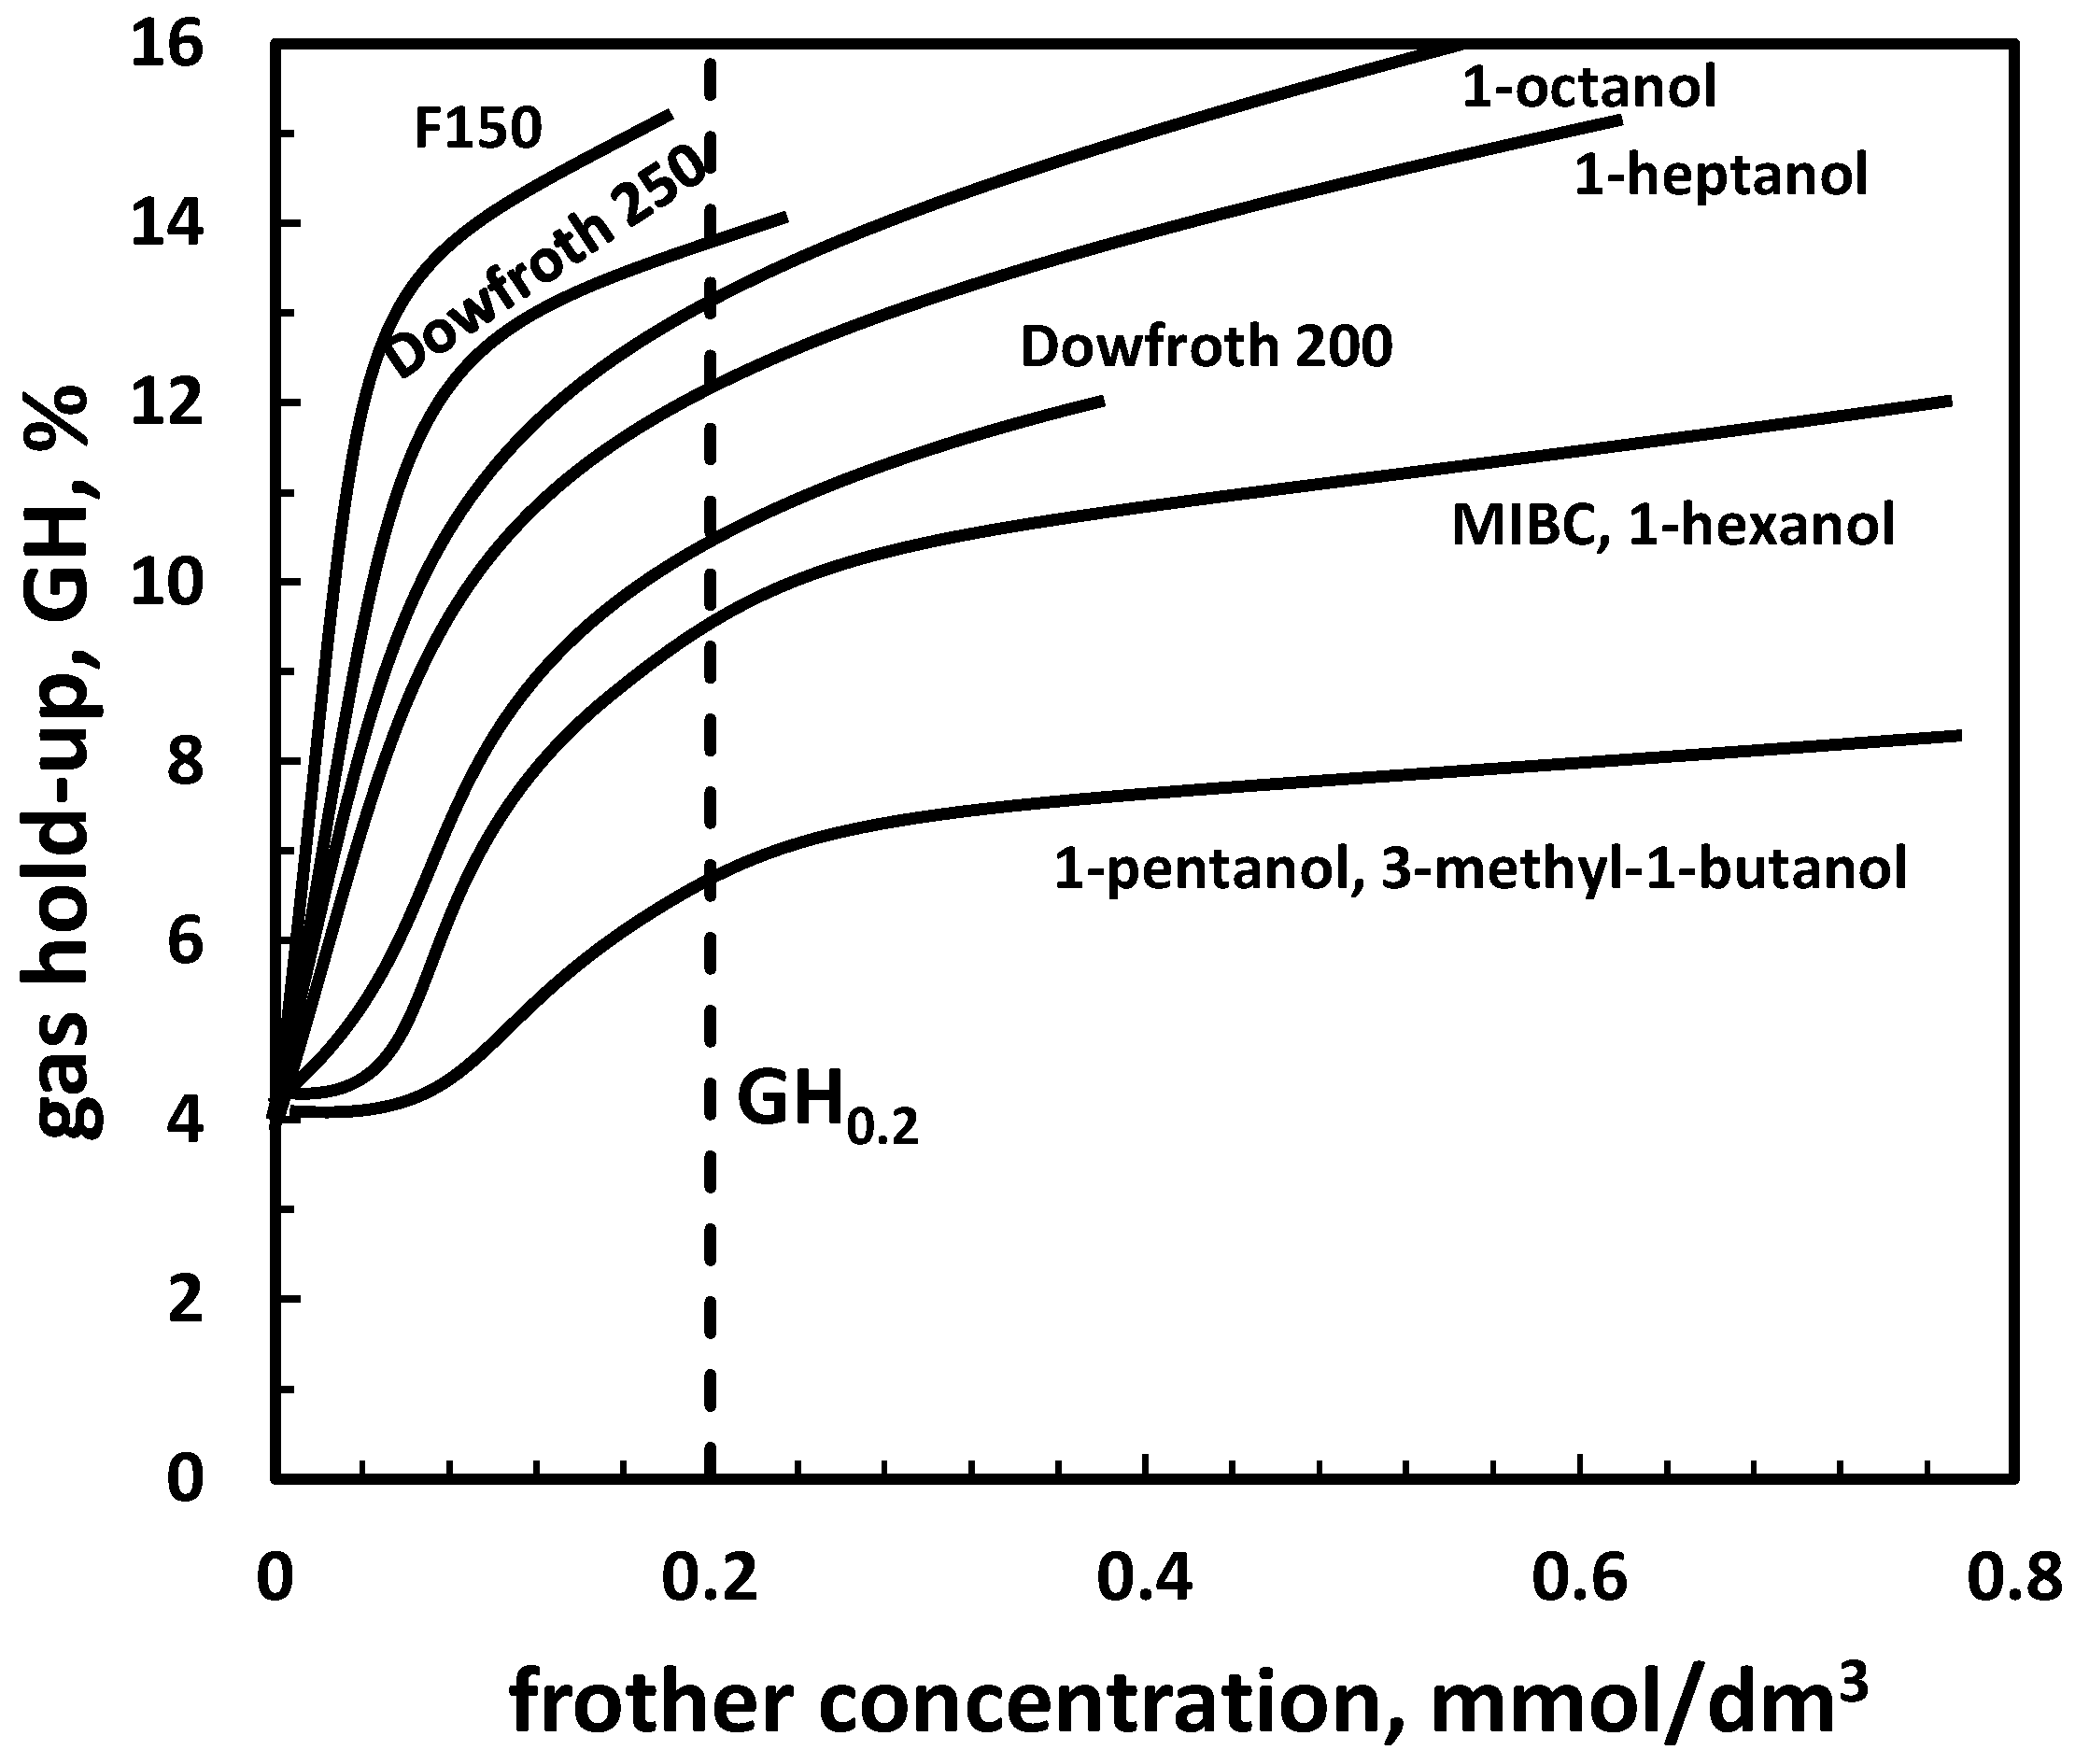
Figure 8.
Determination of DFI (based on [50]).
Figure 8.
Determination of DFI (based on [50]).

Figure 9.
Map-type relation between DFI and CCC and two-numerical value classification of frothers in the frother/aqueous solutions/gas system (data of [16]).
Figure 9.
Map-type relation between DFI and CCC and two-numerical value classification of frothers in the frother/aqueous solutions/gas system (data of [16]).

Figure 10.
Yield (or recovery) of flotation as a function of time at a given frother concentration provides various data including yield (or recovery) trend, maximum flotation yield (or recovery) (ymax), flotation kinetics (v, k), which can be used for frothers classification in the water/gas/solid system. The case of first order process rate.
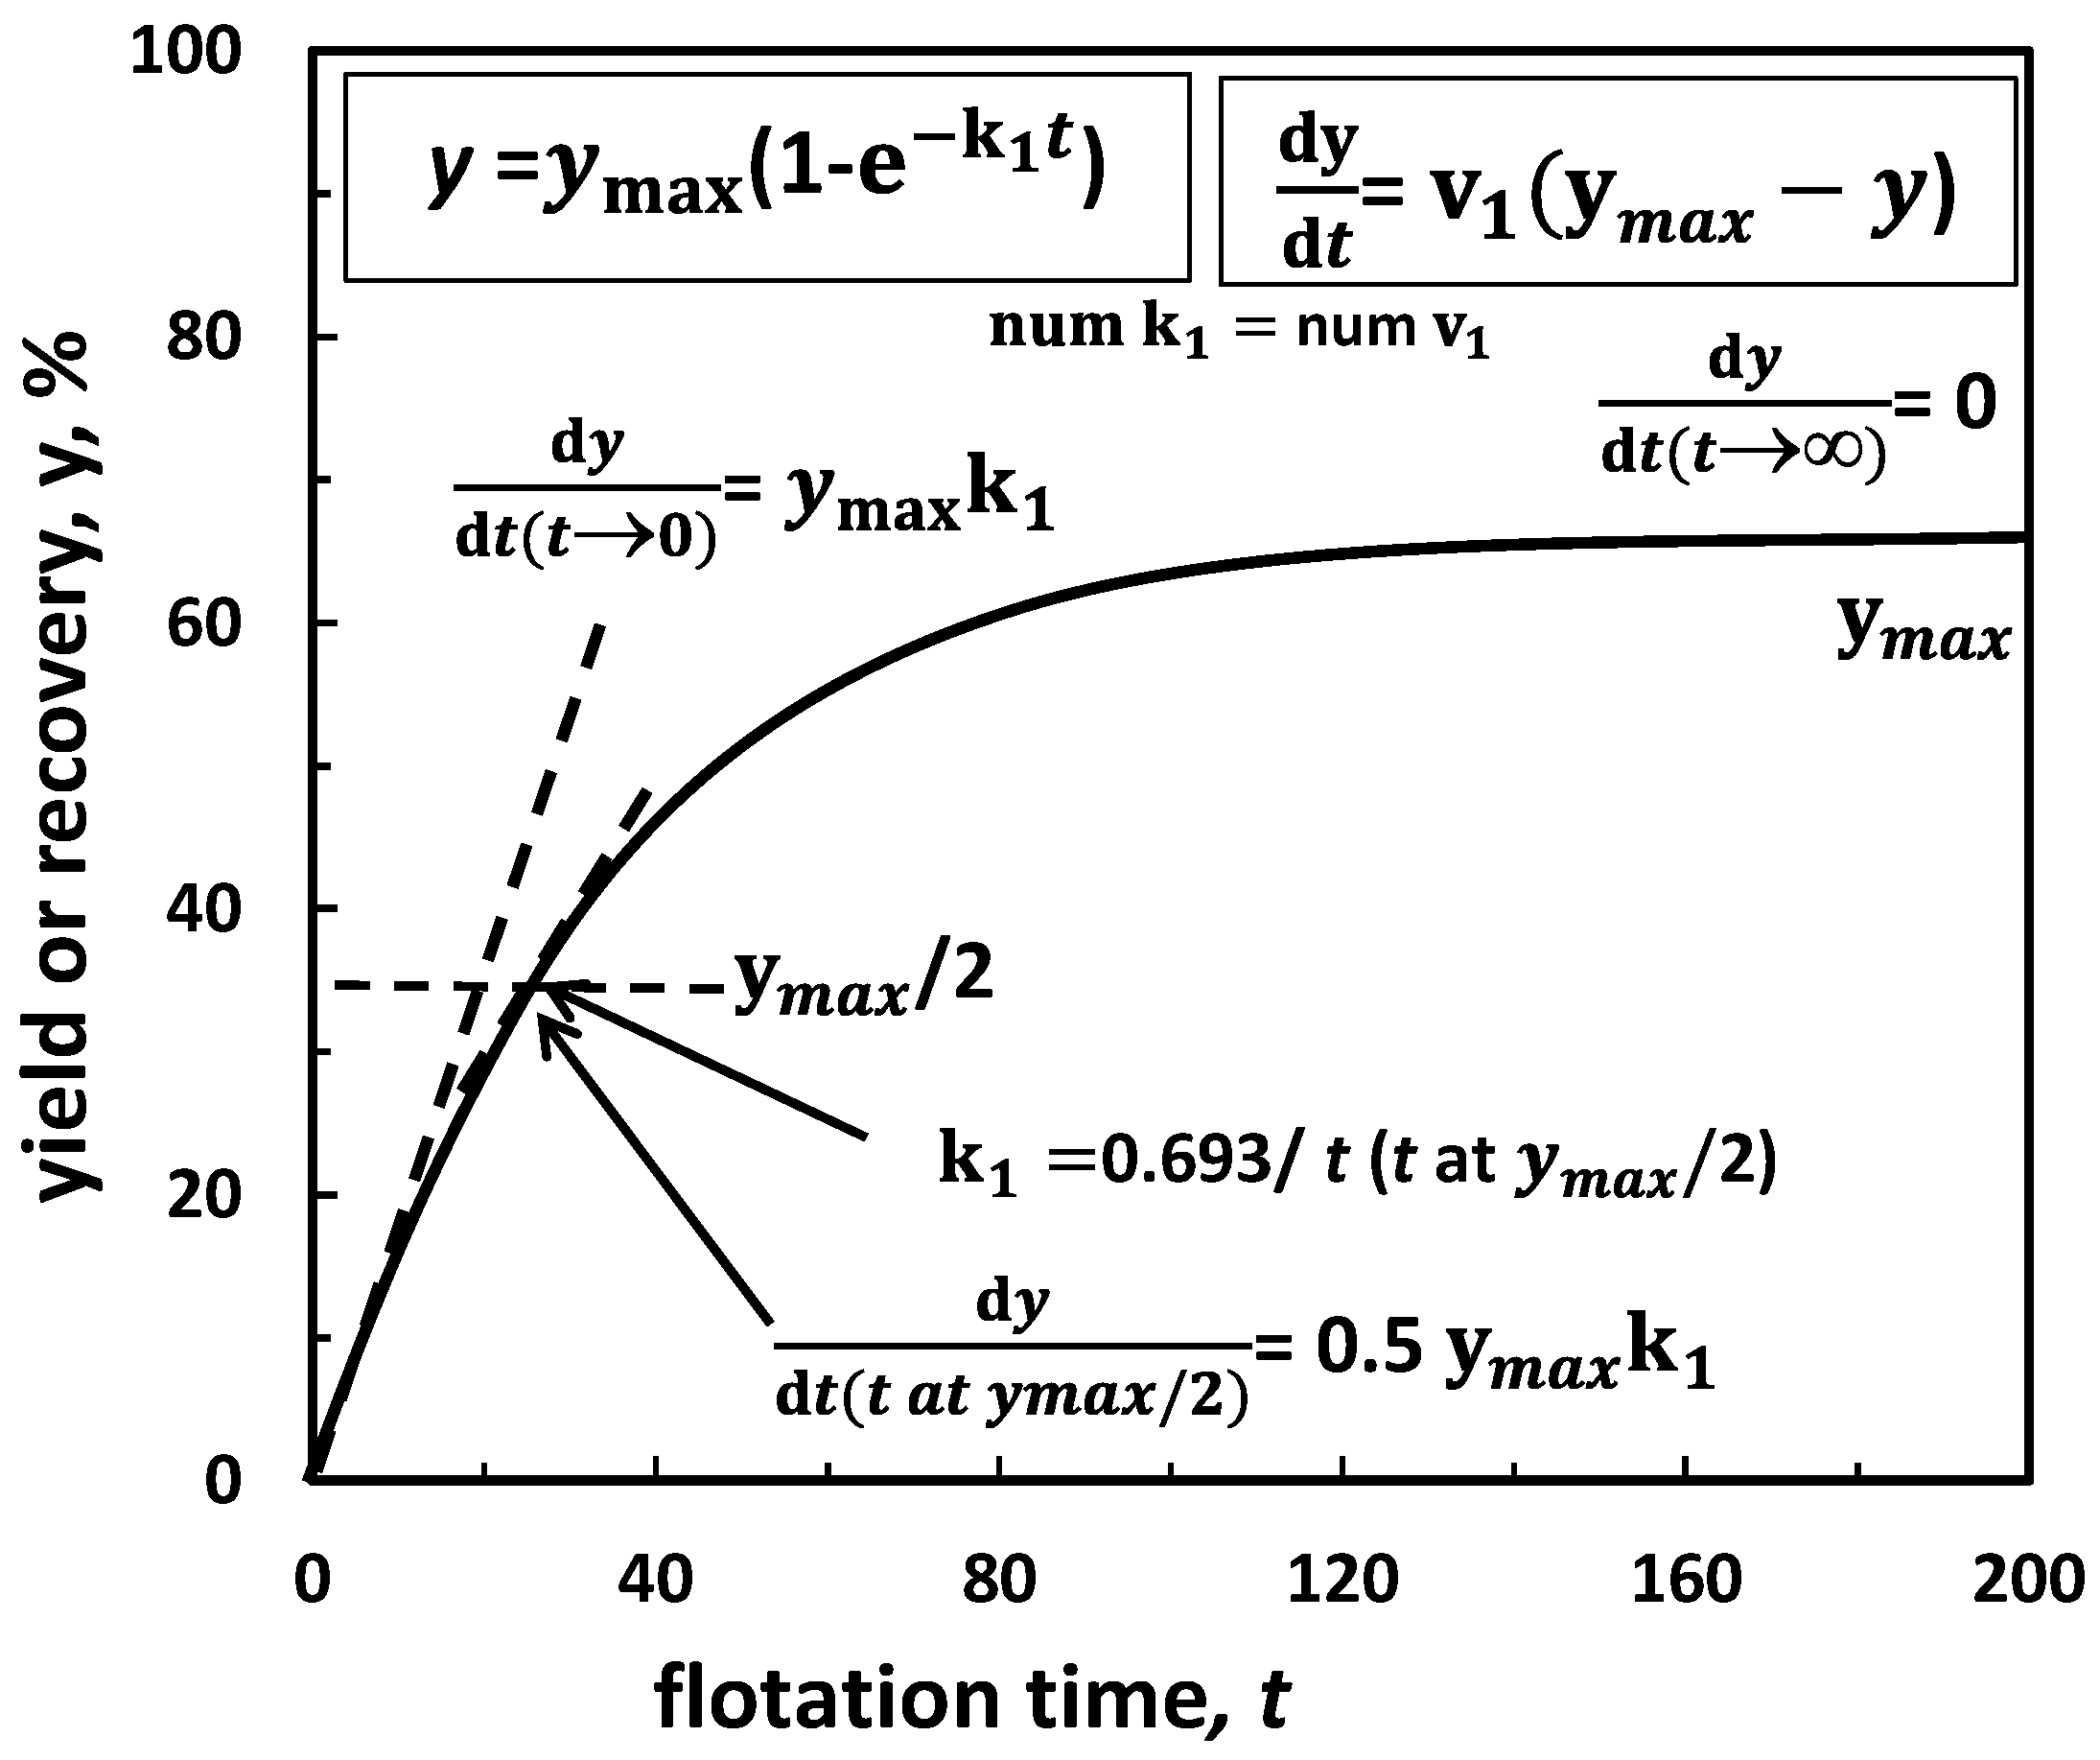
Figure 11.
Classification of frothers into effective, neutral, harmful and overdosed (a). Examples: (b) medium hydrophobicity material (coal)/different surfactants (yield and effectiveness increase with frother concentration) (data after [50], flotation time 2.5 min); (c) medium hydrophobicity material (carbonaceous shale)/different inorganic salts (based on data of [55]); (d) differently hydrophobic materials/surfactant (based on data of [56,57]).
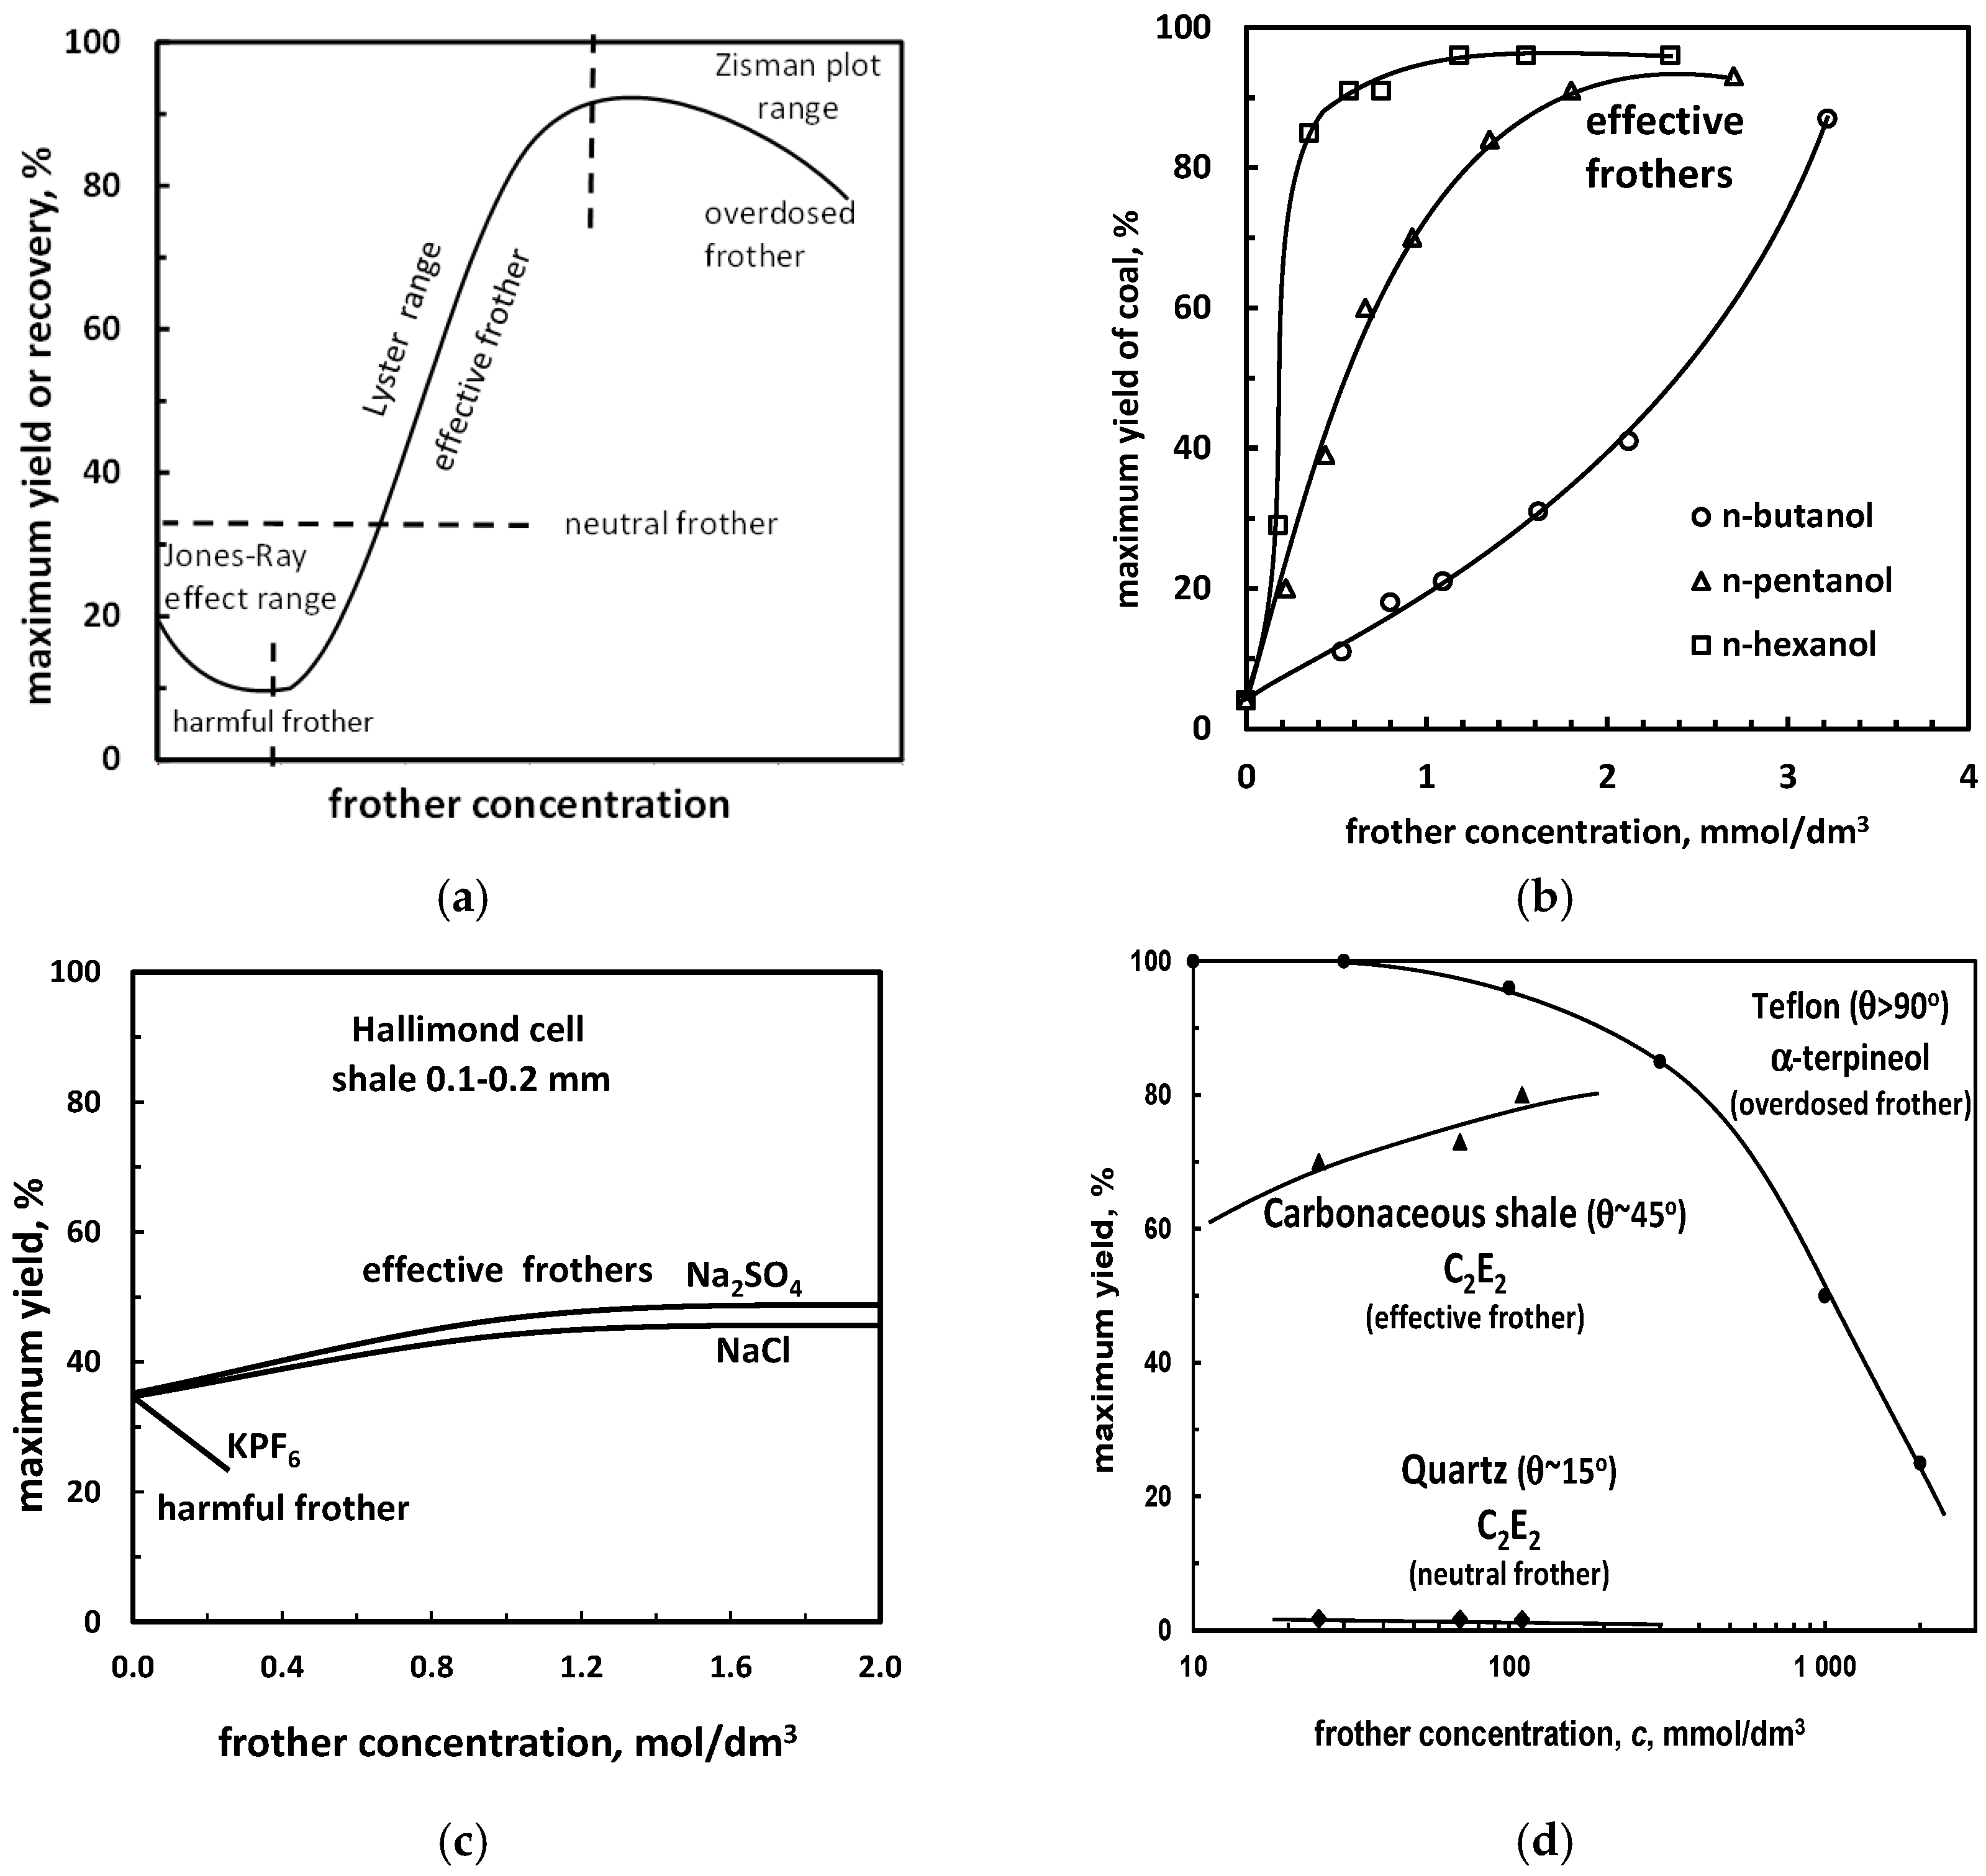
Figure 12.
Influence of aqueous solution surface tension of inorganic salts and electrolytes on yield of graphite flotation (based on [62,65,66]).

Figure 13.
Cross sections of the yield versus frother concentration plot for creation of parameters useful for specific classification of frothers. (a) horizontal cross-section of Figure 13a providing frother strength; (b) vertical cross-section of Figure 13b providing molar effectiveness of the frother.
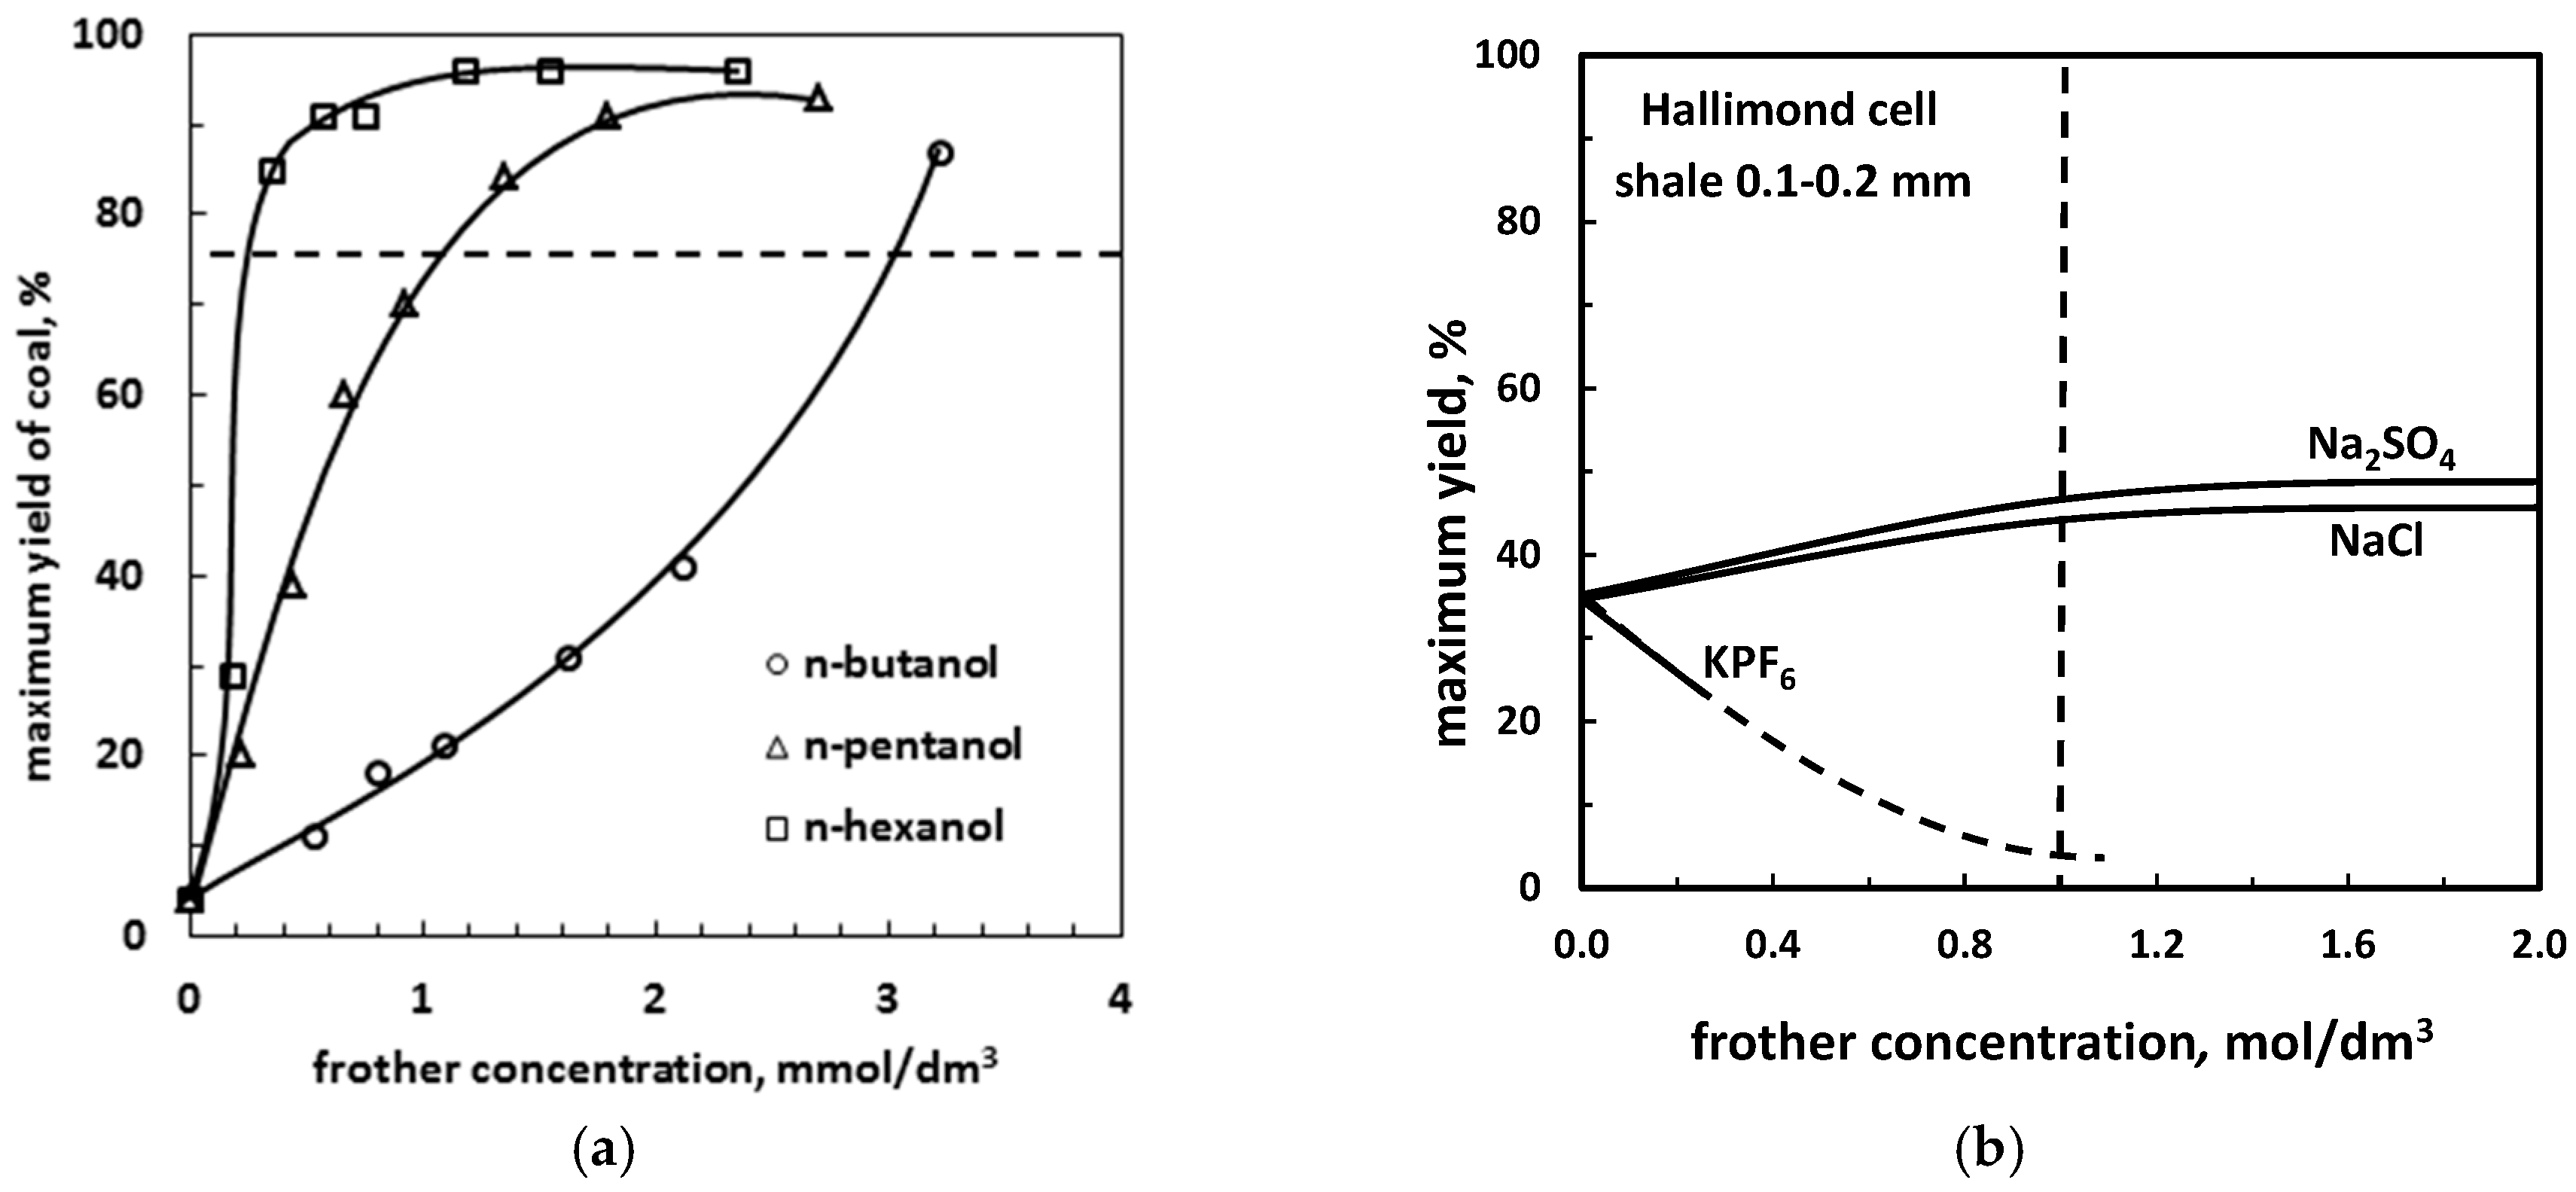
Figure 14.
(a) Limits kinetic curves; and (b) universal limits kinetic curves after normalization against kinetic constant for maximum yield of 50% [67].
Figure 14.
(a) Limits kinetic curves; and (b) universal limits kinetic curves after normalization against kinetic constant for maximum yield of 50% [67].
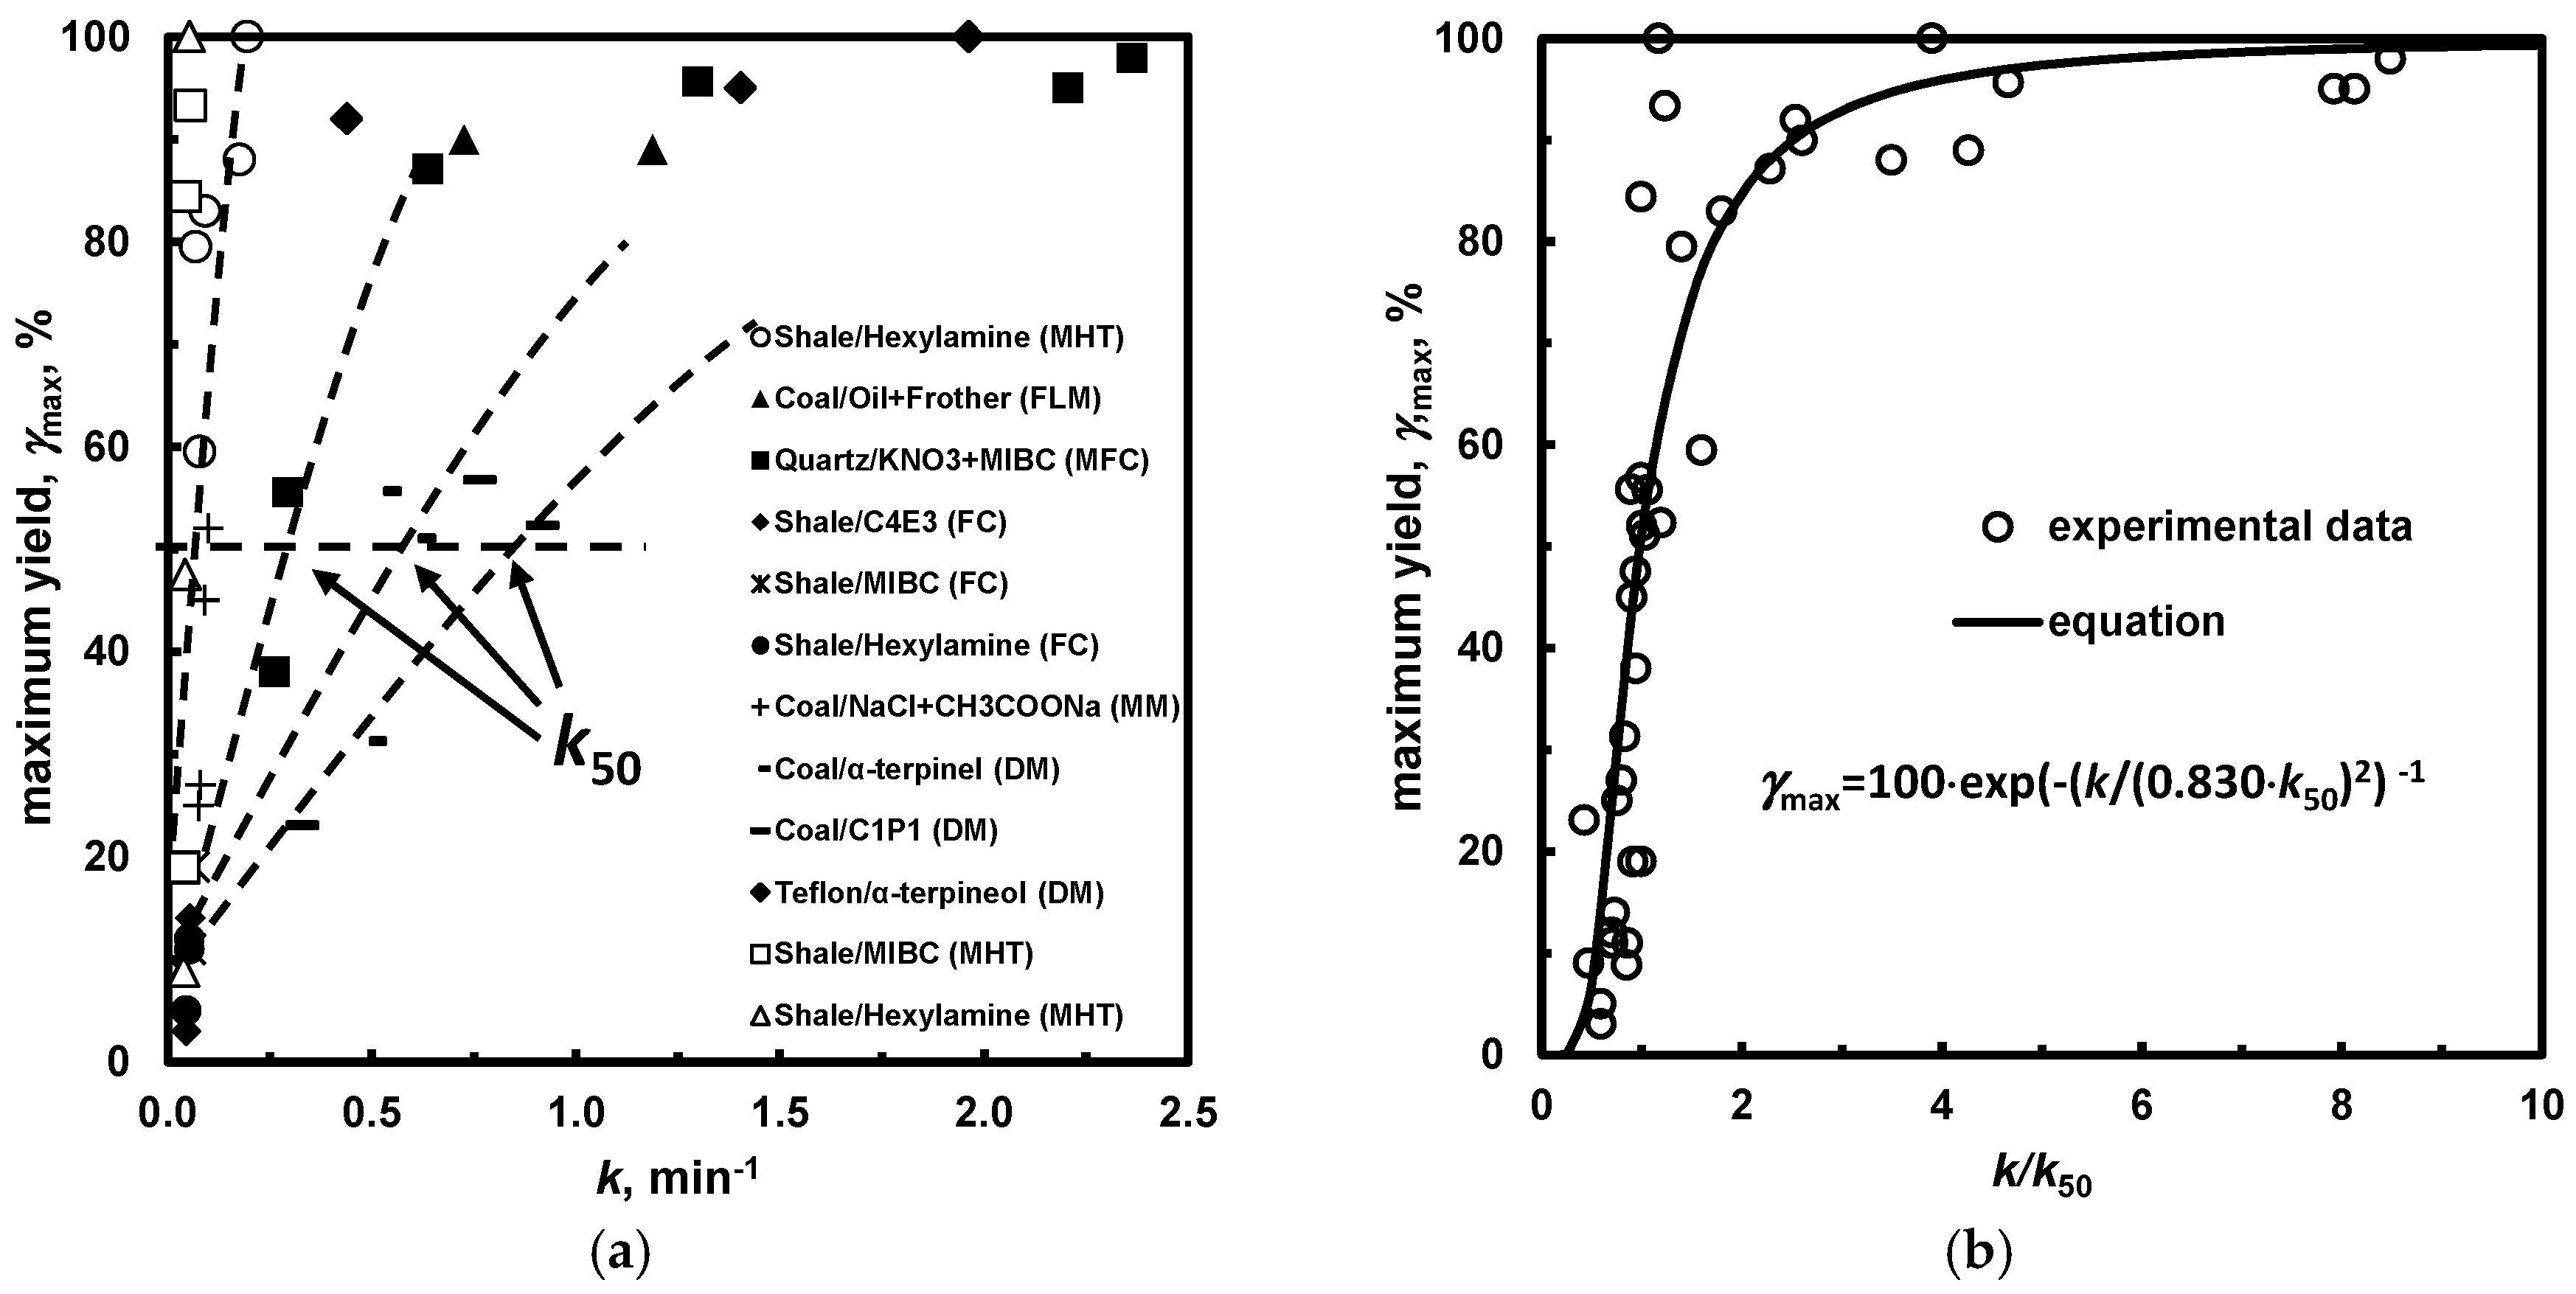
Figure 15.
Procedure of determination of selectivity F (%) and separately power P (expressed in frother dose) of flotation frothers using the Fuerstenau upgrading curve [76]. Collector, if used, regulates hydrophobicity and its concentration is constant.
Figure 15.
Procedure of determination of selectivity F (%) and separately power P (expressed in frother dose) of flotation frothers using the Fuerstenau upgrading curve [76]. Collector, if used, regulates hydrophobicity and its concentration is constant.
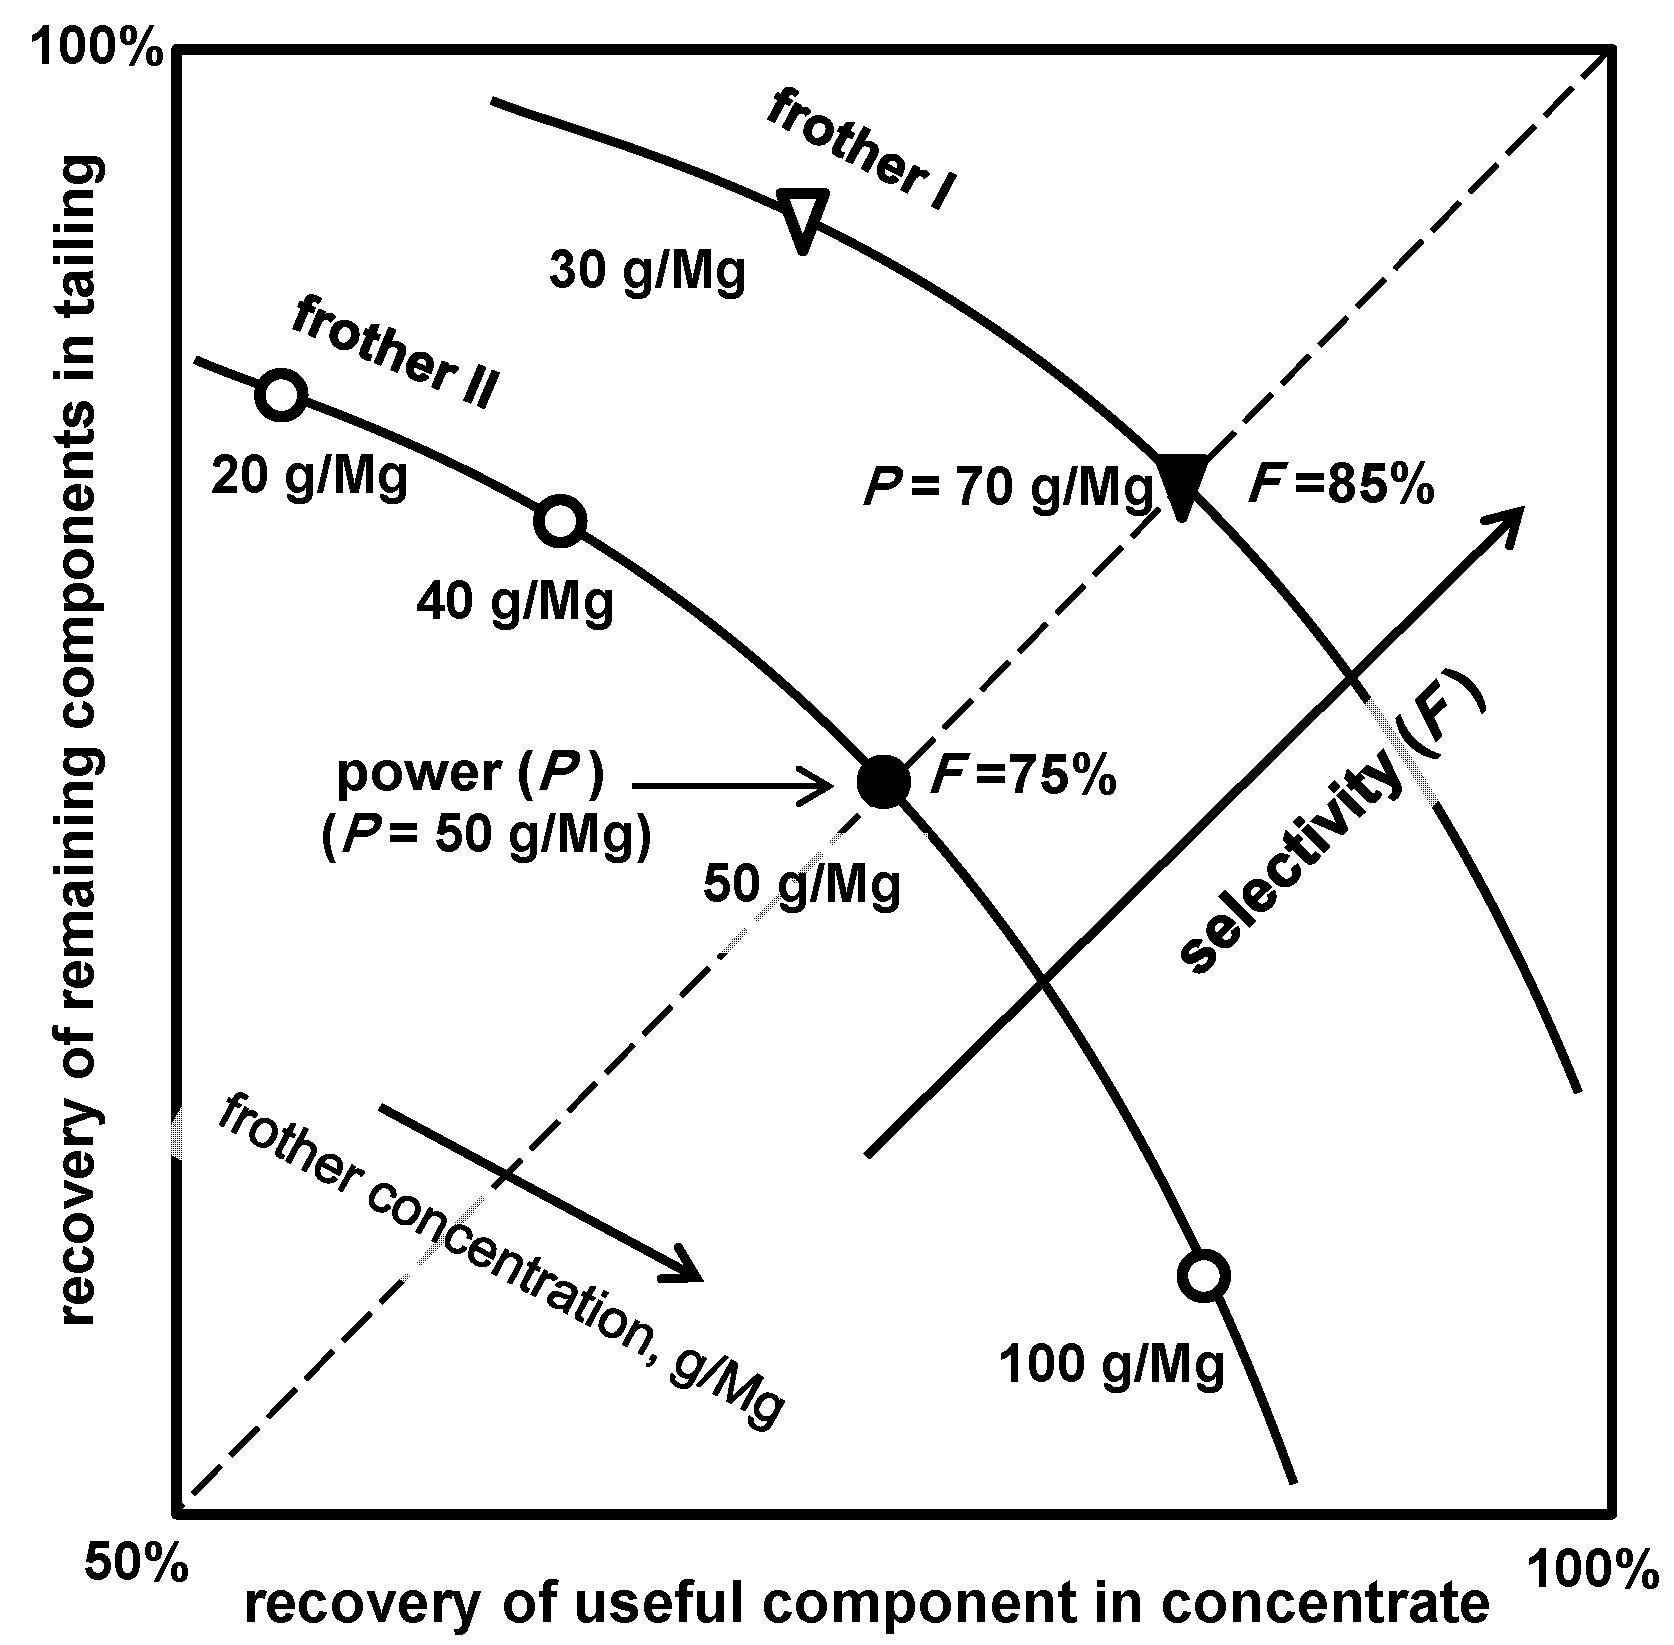
Figure 16.
A map-type classification for the three-phase (liquid/gas/solid) system according to achieved maximum yield and n-order kinetic constant k values (based on [67]).
Figure 16.
A map-type classification for the three-phase (liquid/gas/solid) system according to achieved maximum yield and n-order kinetic constant k values (based on [67]).
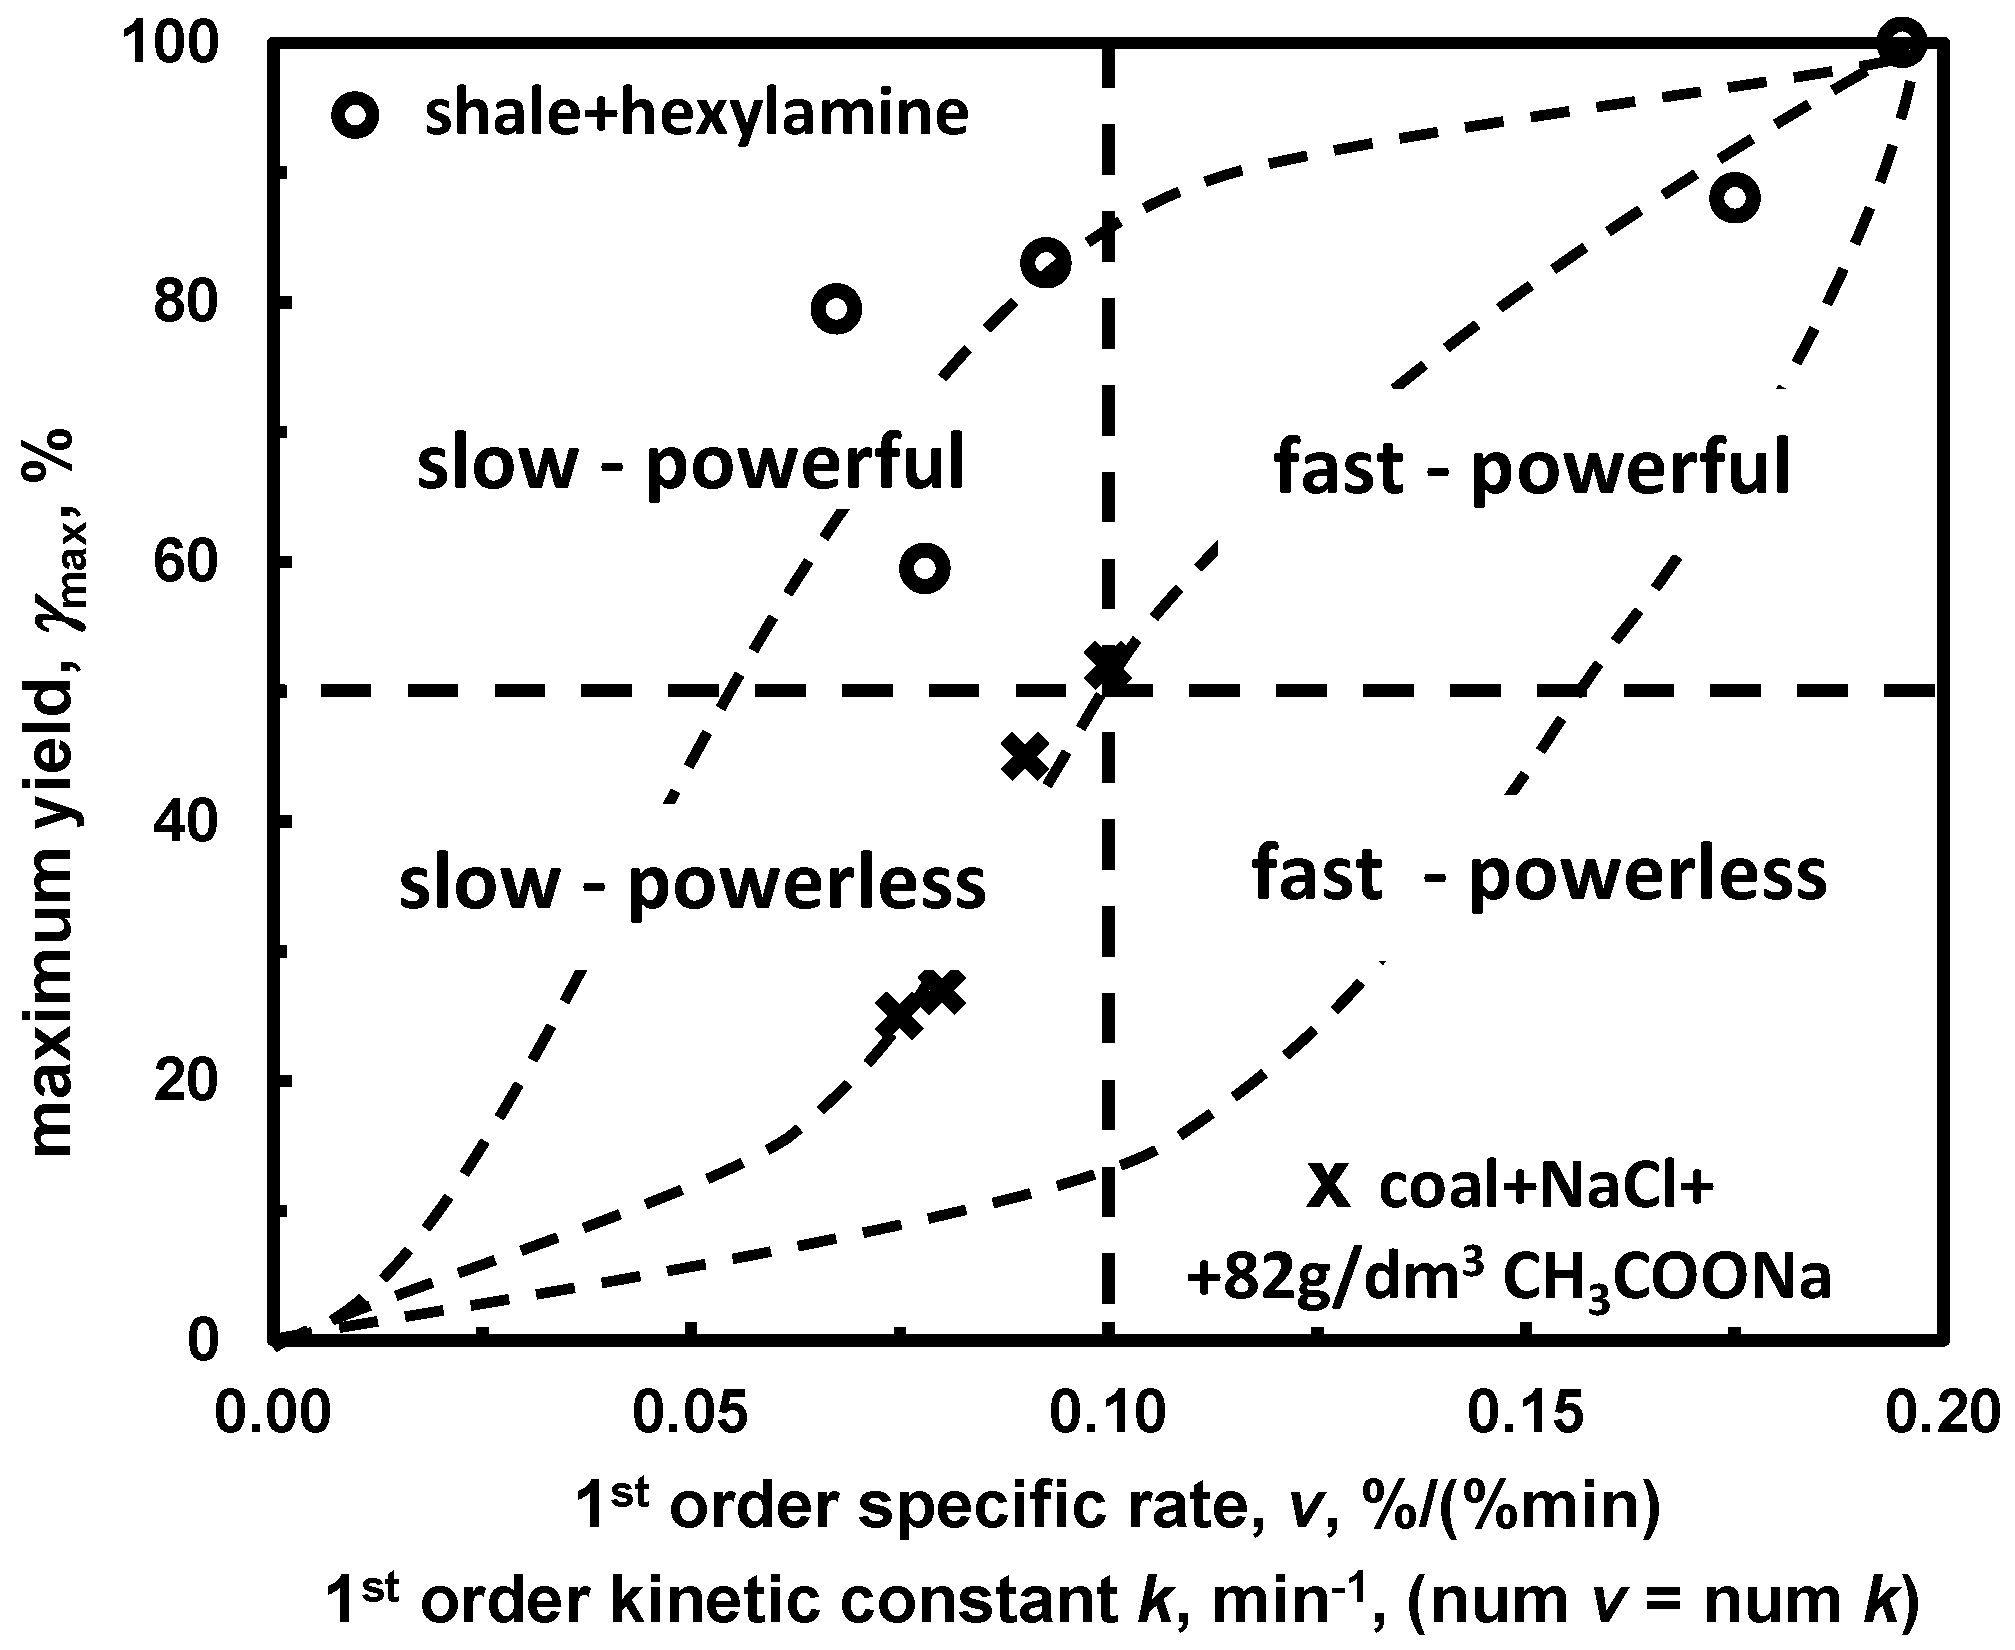
Figure 17.
Classification of a frother into selective and powerful category resulting from a relation between either (a) DFI/CCC or (b) HLB/MW and a trend in selectivity of fine and coarse particles flotation, respectively ([45] with modification).
Figure 17.
Classification of a frother into selective and powerful category resulting from a relation between either (a) DFI/CCC or (b) HLB/MW and a trend in selectivity of fine and coarse particles flotation, respectively ([45] with modification).
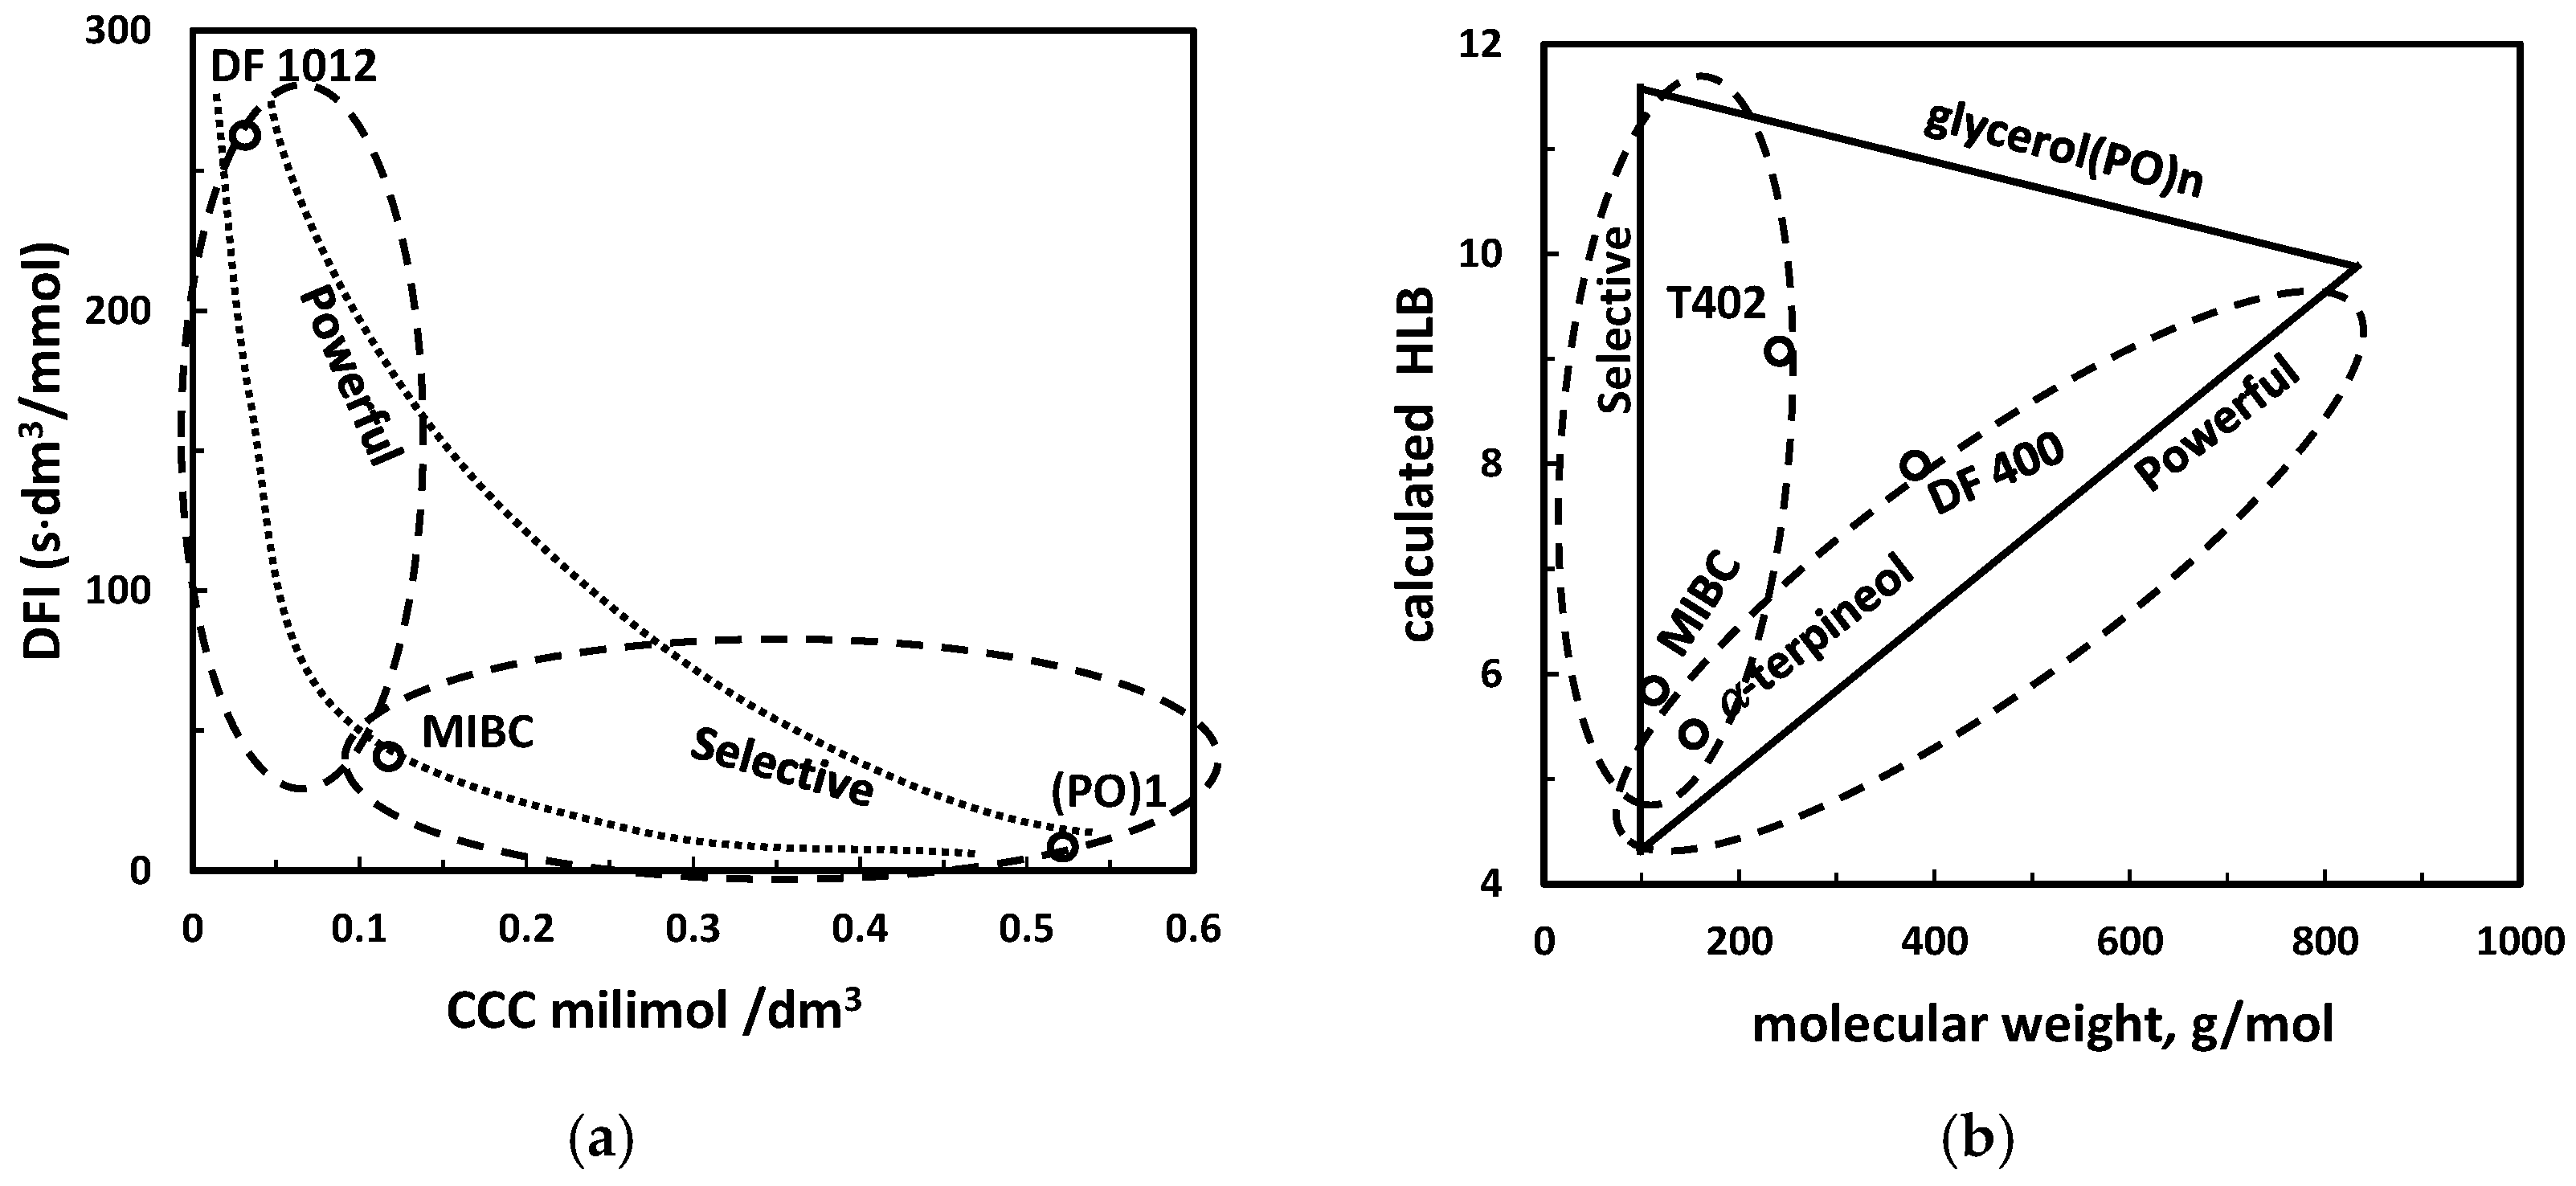
Figure 18.
Possible three-numerical value classification of frothers. (a) Cartesian x-y plot; (b) the Gibbs triangle plot.
Figure 18.
Possible three-numerical value classification of frothers. (a) Cartesian x-y plot; (b) the Gibbs triangle plot.

Table 1.
Frothers classification system based on four physical systems and number of numerical values used for classification.
Table 1.
Frothers classification system based on four physical systems and number of numerical values used for classification.
| System | Classification | Details |
|---|---|---|
| Pure state | (a) organic, inorganic (elemental composition) | Table 2 |
| (b) alcohol, non-alcohol (chemical structure) | Table 3 | |
| (c) solid, liquid, gas (state of pure frother) | ||
| (d) hydrophilic-lipophilic balance (HLB) *1 | Table 4 | |
| (e) HLB vs. molecular weight (MW) *2 | Figure 1 | |
| Aqueous solutions | (a) acidic, neutral, alkaline (pH sensitivity) | Table 5 |
| (b) solubility *1 | Table 6 | |
| (c) cloud point *1 | Table 7 | |
| Aqueous solution/gas system | (a) surface active, surfactant (surface tension vs. concentration) | Table 8, Figure 2 |
| (b) surface tension slope *1 | Tables 9 and 10, Figures 3 and 4 | |
| (c) critical coalescence concentration CCC *1 | Table 11, Figure 5 | |
| (d) gas hold-up GH *1 | Table 11, Figure 7 | |
| (e) dynamic frothability index DFI *1 | Table 11, Figure 8 | |
| (f) DFI vs. CCC *2 | Figure 9 | |
| Aqueous solution/gas/solid system | (a) effective, neutral, harmful, overdosed (yield or recovery vs. frother concentration) | Figure 11, Table 12 |
| (b) effective, neutral, harmful, overdosed (recovery or yield vs. surface tension) | Figure 12 (for inorganic electrolytes) | |
| (c) strength or effectiveness (recovery or yield vs. concentration) *1 | Table 13, Figure 13 | |
| (d) k50 (kinesis) *1 | Table 14, Figure 14 | |
| (e) power (based on recovery-recovery plot) *1 | Table 15, Figure 15 | |
| (f) selectivity (based on recovery-recovery plot) *1 | Table 15, Figure 15 | |
| (g) yield or recovery vs. kinetic const. *2 | Figure 16 | |
| (h) powerful and selective (DFI vs. CCC, HLB vs. MW *3) | Figure 17 | |
| (i) Cartesian x-y or Gibbs triangle plots *4 | Figure 18 |
*1 One-, *2 two-, *3 trend-correlative type of classification; *4 three-numerical value type of classification.
Table 2.
Classification of frothers into organic and inorganic.
| Frother Class | Example | Example |
|---|---|---|
| Organic | organic compounds (alcohols, acetals, acids, bases etc.) | pentanol, oleic acid, amines, polyglycols, polyglycol ethers |
| Inorganic | inorganic compounds (electrolytes: salts, acids and bases) | NaCl, HCl, NaOH |
Table 3.
Classification of organic frothers into alcohols and non-alcohols ([18], with modifications).
Table 3.
Classification of organic frothers into alcohols and non-alcohols ([18], with modifications).
| Group | Example |
|---|---|
| Alcohol | |
| 1. Aliphatic Alcohols | |
| (a) linear | from amyl to decanol |
| (b) branched | iso-amyl 2-ethyl hexanol 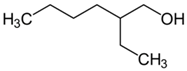 methyl isobutyl carbinol (MIBC)  |
| (c) with additional group | diacetone |
| 2. Cyclic Alcohols | |
| (a) linear | Cyclohexanol |
| (b) branched | α-terpineol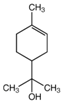 |
| 3. Aromatic | cresols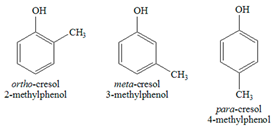 xylenols 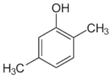 (2,5-xylenol) |
| 4. Polyglycols and hydrocarbon polyglycol ethers | R(X)nOH R = H or CnH2n+1 or any hydrocarbon X = EO (ethylene oxide), PO (propylene oxide), BO (butylene oxide) |
| Organic Non-Alcohols | |
| 1. Alkoxy-hydrocarbons | 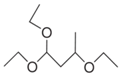 (1,1,3-triethoxybutane) |
| 2. Acetals |  R1 = H, alkyl, aryl R2, R3 = alkyl (usually R2 = R3) |
| 3. Frother/collectors (long chain carboxylic acids, amines, sulfonates, sulphates etc.) | |
Table 4.
Classification of organic reagents, including frothers, based on numerical value of HLB (after [21], with modifications).
Table 4.
Classification of organic reagents, including frothers, based on numerical value of HLB (after [21], with modifications).
| HLB | Properties |
|---|---|
| 1.5–3 | Antifoaming reagents |
| 3.5–6 | Emulsification reagents |
| 3.5–6 | Frothers with emulsification properties |
| 7–10 | Frothers with wetting properties |
| 7–9 | Wetting reagents |
| 8–18 | Emulsification reagents (oil in water) |
| 13–15 | Detergents |
| 15–18 | Solubilisation reagents |
| Frother Type | Example |
|---|---|
| Acidic | Phenols Alkylsulfonates 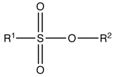 |
| Neutral | Primary and cyclic alcohols R-OH (α-terpineol) Natural oils  (eucalyptol) Alkoxy paraffins 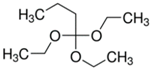 (1,1,3-triethoxybutane) Polyglycol ethers 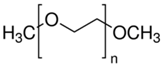 (poly(ethylene glycol) dimethyl ether) |
| Basic | Pyridine base |
| Alkyl Alcohol | Solubility mg/dm3 at 25 °C | Monoterpene Alcohol | Solubility mg/dm3 at 23.5 °C | Carboxylic Acids | Solubility * mg/dm3 |
|---|---|---|---|---|---|
| n-butanol | 7.400 × 10⁴ | α-pinene | 2.45 | C6H5NH2 | 383 |
| n-pentanol | 2.200 × 10⁴ | plinol | 1482 | C4H9COOH | 333 |
| n-hexanol | 5.875 × 10³ | linalool | 853 | C6H5COOH | 24 |
| n-heptanol | 1.740 × 10³ | α-terpineol | 709 | o-CH3C6H5COOH | 9 |
| MIBC | 1.6 × 10⁴ (20 °C) | arbanol | 577 | m-CH3C6H5COOH | 7 |
* Presumably at room temperate.
Table 7.
Cloud point of selected frothers in 0.1 weight fraction aqueous solutions present in the polyoxyethylene-type non-ionic frother/water sub-system of frother aqueous solutions system (based on [30]).
Table 7.
Cloud point of selected frothers in 0.1 weight fraction aqueous solutions present in the polyoxyethylene-type non-ionic frother/water sub-system of frother aqueous solutions system (based on [30]).
| Frother | Cloud Point, °C | Frother | Cloud Point, °C | Frother | Cloud Point, °C |
|---|---|---|---|---|---|
| C10E4 | 22 | C12E5 | 36 | C14E5 | 28 |
| C10E5 | 46 | C12E6 | 55 | C14E6 | 49 |
| C10E6 | 63 | C12E7 | 69 | C14E7 | 63 |
Table 8.
Classification of frothers according to their surface activity in water at concentrations applied in flotation (after [31]).
Table 8.
Classification of frothers according to their surface activity in water at concentrations applied in flotation (after [31]).
| Frother Class | Property of Aqueous Solution | Liquid-Gas Interactions | Froth/Foam |
|---|---|---|---|
| Surface active | Form colloidal solutions (fatty acids, amines, sulfonates, sulphates) | Strongly reduce aqueous solution surface tension | Form two (foam) and three (froth) phase systems |
| Form true solutions (alcohols) | Change aqueous surface tension | ||
| Surface inactive | Organic compounds forming true solutions (ethyl acetal, ethyl diacetone) Inorganic electrolytes | Do not change aqueous surface tension Increase surface tension of water * | Form only three phase systems (froth) Form weak foam and strong froth with hydrophobic particles |
* Some electrolytes decrease surface tension of water (see Figure 3).
Table 9.
σ∠ values for selected surface active (non-surfactant) frothers.
| Example | Surface Tension Slope σ∠ (mN/m)/(mol/dm3) |
|---|---|
| AlCl3 | 6.0 [34] |
| MgCl2 | 4.0 [32] |
| Na2SO4 | 2.9 [32] |
| KCl | 1.8 [32] |
| sucrose | 1.7 [19] |
| NH4Cl | 1.6 [32] |
| H2SO4 | 0.4 [32] |
| methylammonium chloride | 0.4 [35] |
| NaClO4 | 0.2 [32] |
| ethylammonium chloride | −1.3 [35] |
| HClO4 | −2.2 [32] |
| KPF6 | −2.5 [36] |
| propylamonnium chloride | −4.3 [35] |
Table 10.
cσ50 values of selected surfactant frothers.
| Example | cσ50 (mmol/dm3) |
|---|---|
| diethylene oxide n-decyl ether (C10E2) | 0.35 |
| sodium n-dodecyl sulphate (SDDS) | 4.5 |
| dodecyl trimethyl ammonium bromide (DTAB) | 7 |
| methyl isobutyl carbinol (MIBC) | 10 |
| acetal C3H7CH[O(C2H4O)2CH3]2 | 22 |
| acetal C2H5CH[O(C2H4O)2CH3]2 | 155 |
| hexyl ammonium chloride (C6H15NH3Cl) | 500 |
Table 11.
Classification of frothers according to their values of CCC, DFI and GH0.2. Source of data: a—[44]; b—[45]; c—[22]; d—[2]; e—[46]; f—[47]; g—[48]; (* denotes CCC95).
| Example | CCC mmol/dm3 | GH0.2 Gas-Holdup, % at 0.2 mmol/dm3 of Frother | DFI s·dm3/mmol |
|---|---|---|---|
| 2-butanol | 1.041 c,* | - | 1 a |
| 1-pentanol | 0.284 c,* | 6.8 g | 6 a |
| 1-hexanol | 0.108 c,* | 9.5 g | 34 a |
| 1-heptanol | 0.069 c,* | 12.2 g | 41 a |
| 1-octanol | 0.062 c,* | 13.0 g | 79 a |
| MIBC | 0.11 d | 9.5 g | 37 a |
| a-terpineol | 0.054 e | - | 138 a |
| DF250 | 0.038 f | 13.8 g | 208 b |
| DF200 | 0.084 f | 10.4 g | 196 b |
| DF1024 | 0.015 f | - | 267 b |
Table 12.
Classification of frothers into effective, neutral, harmful and overdosed, based on flotation yield (or maximum yield) change caused by increasing concentration of frother and taking into account particle hydrophobicity θ, frother type (inorganic or organic) and surface tension change (increase Δσ+, decrease Δσ-, constant Δσ0, significant decrease by surfactant Δσs) (s: solid; w: water; g: gas).
| Solid Hydrophobicity θ | Surface Tension Change with Concentration | Inorganic (I)/Organic (O) Frother | Frother Type | Sub-System Symbol | Example |
|---|---|---|---|---|---|
| High s(Hθ) | Δσ+ | I | * | s(Hθ, Δσ+,I)/w/g | |
| O | * | s(Hθ, Δσ+,O)/w/g | |||
| Δσ0 | I | * | s(Hθ, Δσ0,I)/w/g | ||
| O | * | s(Hθ, Δσ0,O)/w/g | |||
| Δσ- | I | * | s(Hθ, Δσ-,I)/w/g | ||
| O | * | s(Hθ, Δσ-,O)/w/g | |||
| Δσs | O | overdosed | s(Hθ, Δσs,O)/w/g | Figure 12 | |
| Medium s(Mθ) | Δσ+ | I | effective | s(Mθ, Δσ+,I)/w/g | Figure 12 |
| O | * | s(Mθ, Δσ+,O)/w/g | |||
| Δσ0 | I | neutral | s(Mθ, Δσ0,I)/w/g | Figure 13 | |
| O | * | s(Mθ, Δσ0,O)/w/g | |||
| Δσ- | I | harmful | s(Mθ, Δσ-,I)/w/g | Figure 12 | |
| O | * | s(Mθ, Δσ-,O)/w/g | |||
| Δσs | O | effective | s(Lθ, Δσs,O)/w/g | Figure 12 | |
| Low or hydrophilic s(Lθ) | Δσ+ | I | neutral | s(Lθ, Δσ+,I)/w/g | |
| O | neutral | s(Lθ, Δσ+,O)/w/g | |||
| Δσ0 | I | neutral | s(Lθ, Δσ0,I)/w/g | ||
| O | neutral | s(Lθ, Δσ0,O)/w/g | |||
| Δσ- | I | neutral | s(Lθ, Δσ-,I)/w/g | ||
| O | neutral | s(Lθ, Δσ-,O)/w/g | |||
| Δσs | O | neutral | s(Lθ, Δσs,O)/w/g | Figure 12 |
* To be established.
Table 13.
Strength and molar effectiveness for selected frothers, given solid and flotation device.
| Example | Strength cγ75, mmol/dm3 (Coal, Lab. Flotation Machine, [50]) | Example | Molar Effectiveness, γ1M (Carbonaceous Shale, Hallimond Cell, [55]) |
|---|---|---|---|
| n-butanol | 0.2 | KPF6 | 4% |
| n-propanol | 1 | NaCl | 44% |
| n-hexanol | 3 | Na2SO4 | 46% |
Table 14.
Values k50 for different separation systems. Symbols in the parenthesis denote the type of flotation device: MHT—monobubble Hallimond tube; MM—Mechanobr type laboratory machine; FC—flotation column; DM—Denver type laboratory machine; LFM—laboratory flotation machine; MFC—mechanical flotation cell; MIBC—methyl isobutyl carbinol; C4E3—tri(ethylene glycol) butyl ether, C1P2—di(propylene glycol) methyl ether.
| Separation System | k50, min−1 |
|---|---|
| Shale/MIBC (MHT) | 0.045 [69] |
| Shale/Hexylamine (MHT) | 0.046 [69] |
| Shale/Hexylamine (MHT) | 0.050 [70] |
| Shale/MIBC (FC) | 0.064 [56] |
| Shale/C4E3 (FC) | 0.076 [56] |
| Shale/Hexylamine (FC) | 0.076 [56] |
| Coal/NaCl + CH3COONa (MM) | 0.100 [71] |
| PTFE/α-terpineol (DM) | 0.173 [72] |
| Coal/oil + frother (FLM) | 0.278 [73] |
| Quartz/KNO3 + MIBC (MFC) | 0.278 [74] |
| Coal/α-terpineol (DM) | 0.597 [75] |
| Coal/C1P2 (DM) | 0.770 [75] |
Table 15.
Selectivity F and power P of alkyl polypropoxy CnPm and polyetoxy CnEm frothers used for flotation of copper ore [76].
Table 15.
Selectivity F and power P of alkyl polypropoxy CnPm and polyetoxy CnEm frothers used for flotation of copper ore [76].
| Frother | Formula | Selectivity F, % | Power P, mg/dm3 | Power P, mmol/dm3 |
|---|---|---|---|---|
| C4E1 | C4H9O(C2H4O)1H | 78 ± 1 | 38 | 0.32 |
| C4E3 | C4H9O(C2H4O)3H | 78 ± 1 | 65 | 0.32 |
| C1P3 | C1H3O(C3H6O)3H | 77 ± 1 | 65 | 0.32 |
| C4E2 | C4H9O(C2H4O)2H | 77 ± 2 | 102 | 0.63 |
| C6E2 | C6H13O(C2H4O)2H | 76 ± 2 | 120 | 0.63 |
| C0P3 | (C3H6O)3H | 77 ± 3 | 121 | 0.63 |
| C3P3 | C3H7O(C3H6O)3H | 75 ± 2 | 145 | 0.63 |
| C4P3 | C4H9O(C3H6O)3H | 74 ± 2 | 155 | 0.63 |
© 2018 by the authors. Licensee MDPI, Basel, Switzerland. This article is an open access article distributed under the terms and conditions of the Creative Commons Attribution (CC BY) license (http://creativecommons.org/licenses/by/4.0/).
Share and Cite
MDPI and ACS Style
Drzymala, J.; Kowalczuk, P.B. Classification of Flotation Frothers. Minerals 2018, 8, 53. https://doi.org/10.3390/min8020053
AMA Style
Drzymala J, Kowalczuk PB. Classification of Flotation Frothers. Minerals. 2018; 8(2):53. https://doi.org/10.3390/min8020053
Chicago/Turabian StyleDrzymala, Jan, and Przemyslaw B. Kowalczuk. 2018. "Classification of Flotation Frothers" Minerals 8, no. 2: 53. https://doi.org/10.3390/min8020053
Note that from the first issue of 2016, this journal uses article numbers instead of page numbers. See further details here.