A Fluid Inclusion Study of the Brookbank Deposit, Northwestern Ontario: A Transition from Mesothermal to Epithermal Gold Deposition

Department of Geology, Lakehead University, Thunder Bay, ON P7B 5E1, Canada
*
Author to whom correspondence should be addressed.
Minerals 2018, 8(3), 92; https://doi.org/10.3390/min8030092
Submission received: 9 October 2017
/
Revised: 16 February 2018
/
Accepted: 21 February 2018
/
Published: 1 March 2018
(This article belongs to the Special Issue Geochemistry and Mineralogy of Hydrothermal Metallic Mineral Deposits)
Abstract
:The Brookbank and Cherbourg Zone gold deposits are located in the Beardmore–Geraldton greenstone belt of the Wabigoon Subprovince of the Archean Superior Province of the Canadian Shield. Brookbank is a shear zone deposit, whereas the Cherbourg Zone, joined by a shear zone to the Brookbank, is a fissure vein deposit, presumably formed by the same ore-depositing fluid. A total of 375 fluid inclusions, all with low salinity (generally <1 °C freezing point depression) and presence of CO2, from the two deposits were studied. Cross-cutting relationships delineated three stages of vein formation: (1) pre-ore, (2) ore stage and (3) post-ore. Stage 1 inclusions homogenized at ca. 230 °C with low salinity, although at Brookbank a high temperature episode at ca. 360 °C was noted. Stage 2 homogenized at ca. 266 °C at the Cherbourg Zone and over a range 258–269 °C with somewhat higher salinity. Eutectic temperatures indicate that the fluid composition was within the MgCl2-NaCl-H2O system. Fluid immiscibility was prominent in that inclusions homogenized to liquid and vapor at the same temperature were observed. The majority of inclusions from Brookbank homogenized to vapor, whereas those from the Cherbourg Zone homogenized to liquid, marking the transition from mesothermal to epithermal lode gold deposition. Stage 3 fluid inclusions from the Cherbourg Zone homogenized at slightly elevated temperatures and contained fluid possibly representing metastable hydrates of KCl. These post-ore fluids may have been the source of potassium feldspar alteration that overprinted earlier alteration assemblages.
1. Introduction
The Brookbank deposit, currently under development by the Greenstone Goldmines Ltd. And Premier Goldmines Ltd. joint venture [1], is located in the Geraldton greenstone terrain of the Archean Superior Province of the Canadian Shield [2]. The deposit is located approximately 20 km northeast of the town of Beardmore, Ontario, at the western end of the Beardmore–Geraldton greenstone belt. This region, 100 km long and 40 km wide, has been the site of 18 gold mines operated at various times from 1934 to 1968, with a total recorded production of 128,000,811 gm of gold and 9,906,157 gm of silver [3]. The modern era of gold prices has brought about increased interest in the belt in terms of exploration and potential development.
The Brookbank deposit has a history of exploration for more than 70 years [4]. This study was undertaken while the deposit was held by the former Metalore Resources Ltd. and was considered to consist of two deposits, the Metalore deposit, a shear zone-hosted deposit, and the Golden Highway deposit, a fissure zone deposit located immediately to the west of the Metalore deposit. The two deposits are currently known as the Brookbank deposit and its Cherbourg zone, respectively. The Brookbank deposit has recently been assessed for its resource potential, yielding an indicated resource of 2.638 Mt at 2.02 g/t in open pit mining and 1.851 Mt at 7.21 g/t in underground mining [4]. The Cherbourg zone was previously assessed as a potential resource of 441,000 t at 6.3 g/t [5].
The deposit is typical of lode gold deposits in an Archean setting, although other terms have been used; i.e., mesothermal gold or orogenic gold [6]. Both of the latter designations may be criticized as too general. Mesothermal, in this context, may be inaccurate in that the deposit may have formed under a number of temperature and pressure conditions. Although orogenic processes may be involved in genesis of the deposit, other gold deposits may also have formed in relation to orogenesis.
However, epithermal and mesothermal ore deposits as defined by the Lindgren classification [7] have utility if considered more generally with respect to the style of deposition regardless of the type of ore. Thus, epithermal thermal deposits can be formed at relatively shallow depths and low temperature, whereas mesothermal deposits can be formed at greater depths and higher temperatures without stipulation of specific temperatures and depths. The formation of shear zone-hosted deposits has been related to high-angle reverse faults formed in response to seismic activity [8]. The fault develops into a shear zone when the pressure of a fluid in the fault attains a pressure approaching lithostatic pressure. Seismic activity releases the fluid and causes brecciation, creating open space for ore deposition. This mechanism is proposed to be typical in mesothermal lode gold deposits [9].
Epithermal deposits may form in extensional stress regimes where dilational jogs between en echelon fault segments creates open space allowing for fluid flow. The space created results in the formation of fissure veins [9,10], which in a more detailed discussion have been called extension veins [11]. Thus, according to the foregoing, mesothermal gold deposits characteristically formed in shear zones, whereas epithermal gold deposits formed in fissure veins.
The Brookbank shear zone deposit and the Cherbourg Zone fissure vein can be seen to represent mesothermal and epithermal deposits, respectively. This study was undertaken in order to determine the characteristics of the ore-depositing solution and the conditions under which ore deposition occurred. To this end 375 fluid inclusions were examined and interpretation of the data obtained was carried out [12].
2. Regional and Local Geology
2.1. Regional Geology of the Beardmore–Geraldton Greenstone Belt
The Beardmore–Geraldton greenstone belt forms the southern margin of the Wabigoon Subprovince. It is bounded on the south by the Quetico Subprovince and to the north by batholithic bodies within the Wabigoon (Figure 1). The geology of the belt has been extensively studied and comprehensively reviewed [13]. Based on the foregoing and more recent work [14], the geology will be summarized here.
As illustrated in Figure 1, the Beardmore–Geraldton greenstone belt is comprised of three successions of mafic metavolcanic rocks overlain by metasedimentary rocks. Both rock types have been metamorphosed to greenschist facies. They have been designated as the southern volcanic belt (SVB), southern metasedimentary belt (SMB), central volcanic belt (CVB), central metasedimentary belt (CMB), northern volcanic belt (NVB) and northern metasedimentary belt (NMB) [15]. The belts are continuous from Beardmore to Geraldton, striking east-west, except for the NVB, which is disrupted west of Geraldton. The metasedimentary rocks have been interpreted as representing a cratonic margin sequence shoaling northward [16,17,18,19], but together with the underlying volcanic rocks has been stacked in a series of three thrust slices [20,21].
The NMB and the northern portions of the CMB and SMB are dominantly composed of conglomerate with minor amounts of sandstone. The SMB contains turbiditic units with oxide facies iron formation interbedded with sandstone and siltstone [13]. The metavolcanics have been variously interpreted as slices of sea-floor [20], as back arc volcanics [15] or as island arc tholeites [14], who provided detailed geochemistry of the rocks.
The structural history of the Beardmore–Geraldton greenstone belt is complex and has been studied in detail [23]. Based on a detailed structural analysis, three periods of deformation were recognized. The first phase produced the thrust faulting resulting in the three metavolcanic-metasedimentary slices. The second phase steepened dips of the rocks to near vertical, and the third phase is interpreted as synchronous with peak metamorphic conditions accompanied by dextral shearing and formation of Z-folds, especially in the Geraldton area [14].
Gold deposits in the Beardmore–Geraldton greenstone belt were principally in the Beardmore and Geraldton areas [3]. In the Geraldton area gold deposits are hosted in banded iron formation, which is generally believed to have formed an impermeable trap for migrating gold-carrying solutions, as well as a chemically reactive material in the form of magnetite. In the Beardmore area, the deposits are hosted in turbiditic sandstones, which were cross-cut by quartz-carbonate veins. Summarizing, the Geraldton are deposits are iron-formation deposits, whereas the Beardmore area deposits are veins hosted in sandstone [14]. In both cases the regional Paint Lake deformation zone is believed to have been the path for gold-bearing solutions to enter splay faults where the deposits are located [13].
2.2. Geology of the Brookbank Deposit
The availability of drill core for this study provided a means of examination of the ores and alteration at depth, with particular emphasis on the nature of the ore-depositing solution by means of fluid inclusion analysis. A comprehensive study of surface samples treated the petrology of the host rocks, alteration, structure, geochemistry and ore mineralogy [14]. The Brookbank deposit occurs within a shear zone, the Brookbank shear zone, a splay of the Paint Lake deformation zone (Figure 2). The shear zone strikes N70W and dips steeply to the south, roughly parallel to bedding (Figure 3). The Cherbourg Zone lies 900 m to the west of the Brookbank along a splay from the shear zone. The shear hosting the Cherbourg Zone strikes N30E, also dipping steeply. Younging directions in the host rocks at Brookbank face north, indicating that bedding is overturned [20,21].
The Brookbank deposit occurs within a shear zone contained mostly within pillowed and brecciated mafic volcanics. This unit overlies more massive, polymictic conglomerates containing variable amounts of sericite schist. The metavolcanics are intruded by a sill-like diorite body (Figure 3).
The Cherbourg zone is in a quartz-carbonate fissure vein, as opposed to a shear, along the contact between pillowed, mafic metavolcanics and a dioritic intrusion. The diorite body in both locations intrudes the metavolcanics and locally, the conglomerate. The diorite displays chilled contacts with the intruded rocks and is clearly a younger feature.
Veins within the Brookbank shear zone and the fissure vein in the Cherbourg zone were seen on the basis of cross-cutting relationships and characteristic alteration to have formed in three progressive stages: stage 1—pre-ore stage; stage 2—ore deposition stage; and stage 3—post-ore stage. The vein stages are enclosed within an alteration envelope that overprinted greenschist facies metamorphism of the host rocks. Stage 1 quartz-carbonate veins occur within hematite-ankerite-alkali feldspar-chamosite alteration aggregates and veinlets. They do not contain gold, so are considered to be pre-ore, as they are cross-cut by auriferous veins from stage 2. Stage 2 veins contain grey quartz with gold frequently associated with pyrite. They are considered to represent ore deposition. Stage 3 veinlets cross-cut the auriferous stage 2 veins. The veins contain white to pink quartz-calcite crystals. The deposits are presumed to have formed from the same ore-depositing system.
The Brookbank shear zone is composed of brecciated, mafic metavolcanic rocks, which were first flooded by quartz, then extensively replaced by ankerite with quartz and seams of hematite and minor pyrite and gold. The alteration then progresses to calcite-quartz-clinochlore/chamosite. These assemblages are partially overprinted by potassium feldspar-quartz-hematite alteration. At depth a late sericite-rich alteration with leucoxene and hematite occurs in patches. Finally, replacement by fine-grained ankerite with quartz, pyrite and hematite affected the earlier alteration. Gold is associated with pyrite at this stage. Alteration together with vein formation is present to only a minor extent in the footwall conglomerate.
The alteration associated with the fissure vein in the Cherbourg zone differs from that present at Brookbank, although the host rocks are the same; i.e., altered, mafic metavolcanics. The altered wallrock contains zones of ankerite, sericite-magnetite and potassium feldspar-quartz-calcite. The fissure vein pinches and swells from 10 to 150 cm width cross-cutting altered and deformed metavolcanics of the NVB. It is mineralized with pyrite, sphene, ilmentite, chalcopyrite, molybdentie, argentite and magnetite with traces of native gold, silver and copper. Gold with lessor silver is associated with pyrite within vein quartz. Quartz occurs in bands with ankerite and minor pyrite. Sericite is present in veinlets parallel to the quartz-ankerite bands.
3. Methods
3.1. Sampling and Preparation
Polished sections were made from 224 samples from Brookbank and from 143 samples from the Cherbourg Zone. Brookbank samples were taken from sections of nine drill cores that that penetrated the alteration zone enclosing the gold-bearing areas at various depths to a maximum 766 m (Table 1). The Cherbourg Zone samples were taken from surface exposures of the vein system along a set of lines transecting the alteration zone and enclosed vein system.
Doubly polished sections 150 μm thick were prepared utilizing a cold setting adhesive resin to mount the material during polishing. A coolant was used during polishing in order to minimize frictional heating. At no stage during the preparation of the sections were they heated above 100 °C.
3.2. Analysis
Fluid inclusions were examined using a United States Geological Survey type heating/freezing stage [24] mounted on a Leitz Orthoplan petrographic microscope. Heating was accomplished by flowing nitrogen gas through a glass tube containing a heating coil connected to the sample chamber. Freezing was accomplished by flowing nitrogen gas cooled by liquid nitrogen. Heating was carried out at a rate of 1 °C/min and cooling at 1–2 °C/min. This method eliminated thermal gradients in the sample chamber, and, in any case, the thermocouple rests directly on the sample. Temperatures were measured by a Doric Series 400A Trendindicator digital thermometer. The thermocouple used in this study was calibrated over the temperature range −95.0 to +302.0 °C against 13 melting point standards. The maximum deviation from a standard temperature was −2.2 °C, but the remaining measurements were mostly within ±0.5 °C of the calibration points, yielding a standard error of estimate ±0.7 °C. These errors are of the same magnitude as random errors of measurement.
The host minerals of fluid inclusions were quartz, calcite and, in stage 2 clinochlore, as well. Details are provided in the Supplementary Tables S1–S10. Measurements were made on primary and pseudosecondary inclusions. Secondary inclusions were aligned along fractures and were filled with liquid H2O; they were not further studied. Fluid inclusions from the Cherbourg Zone, selected on the basis of their relatively large size, were analyzed for their content of molecular species by means of laser Raman spectrography by J.D. Pasteris at Washington University, St. Louis, MO, USA.
4. Results
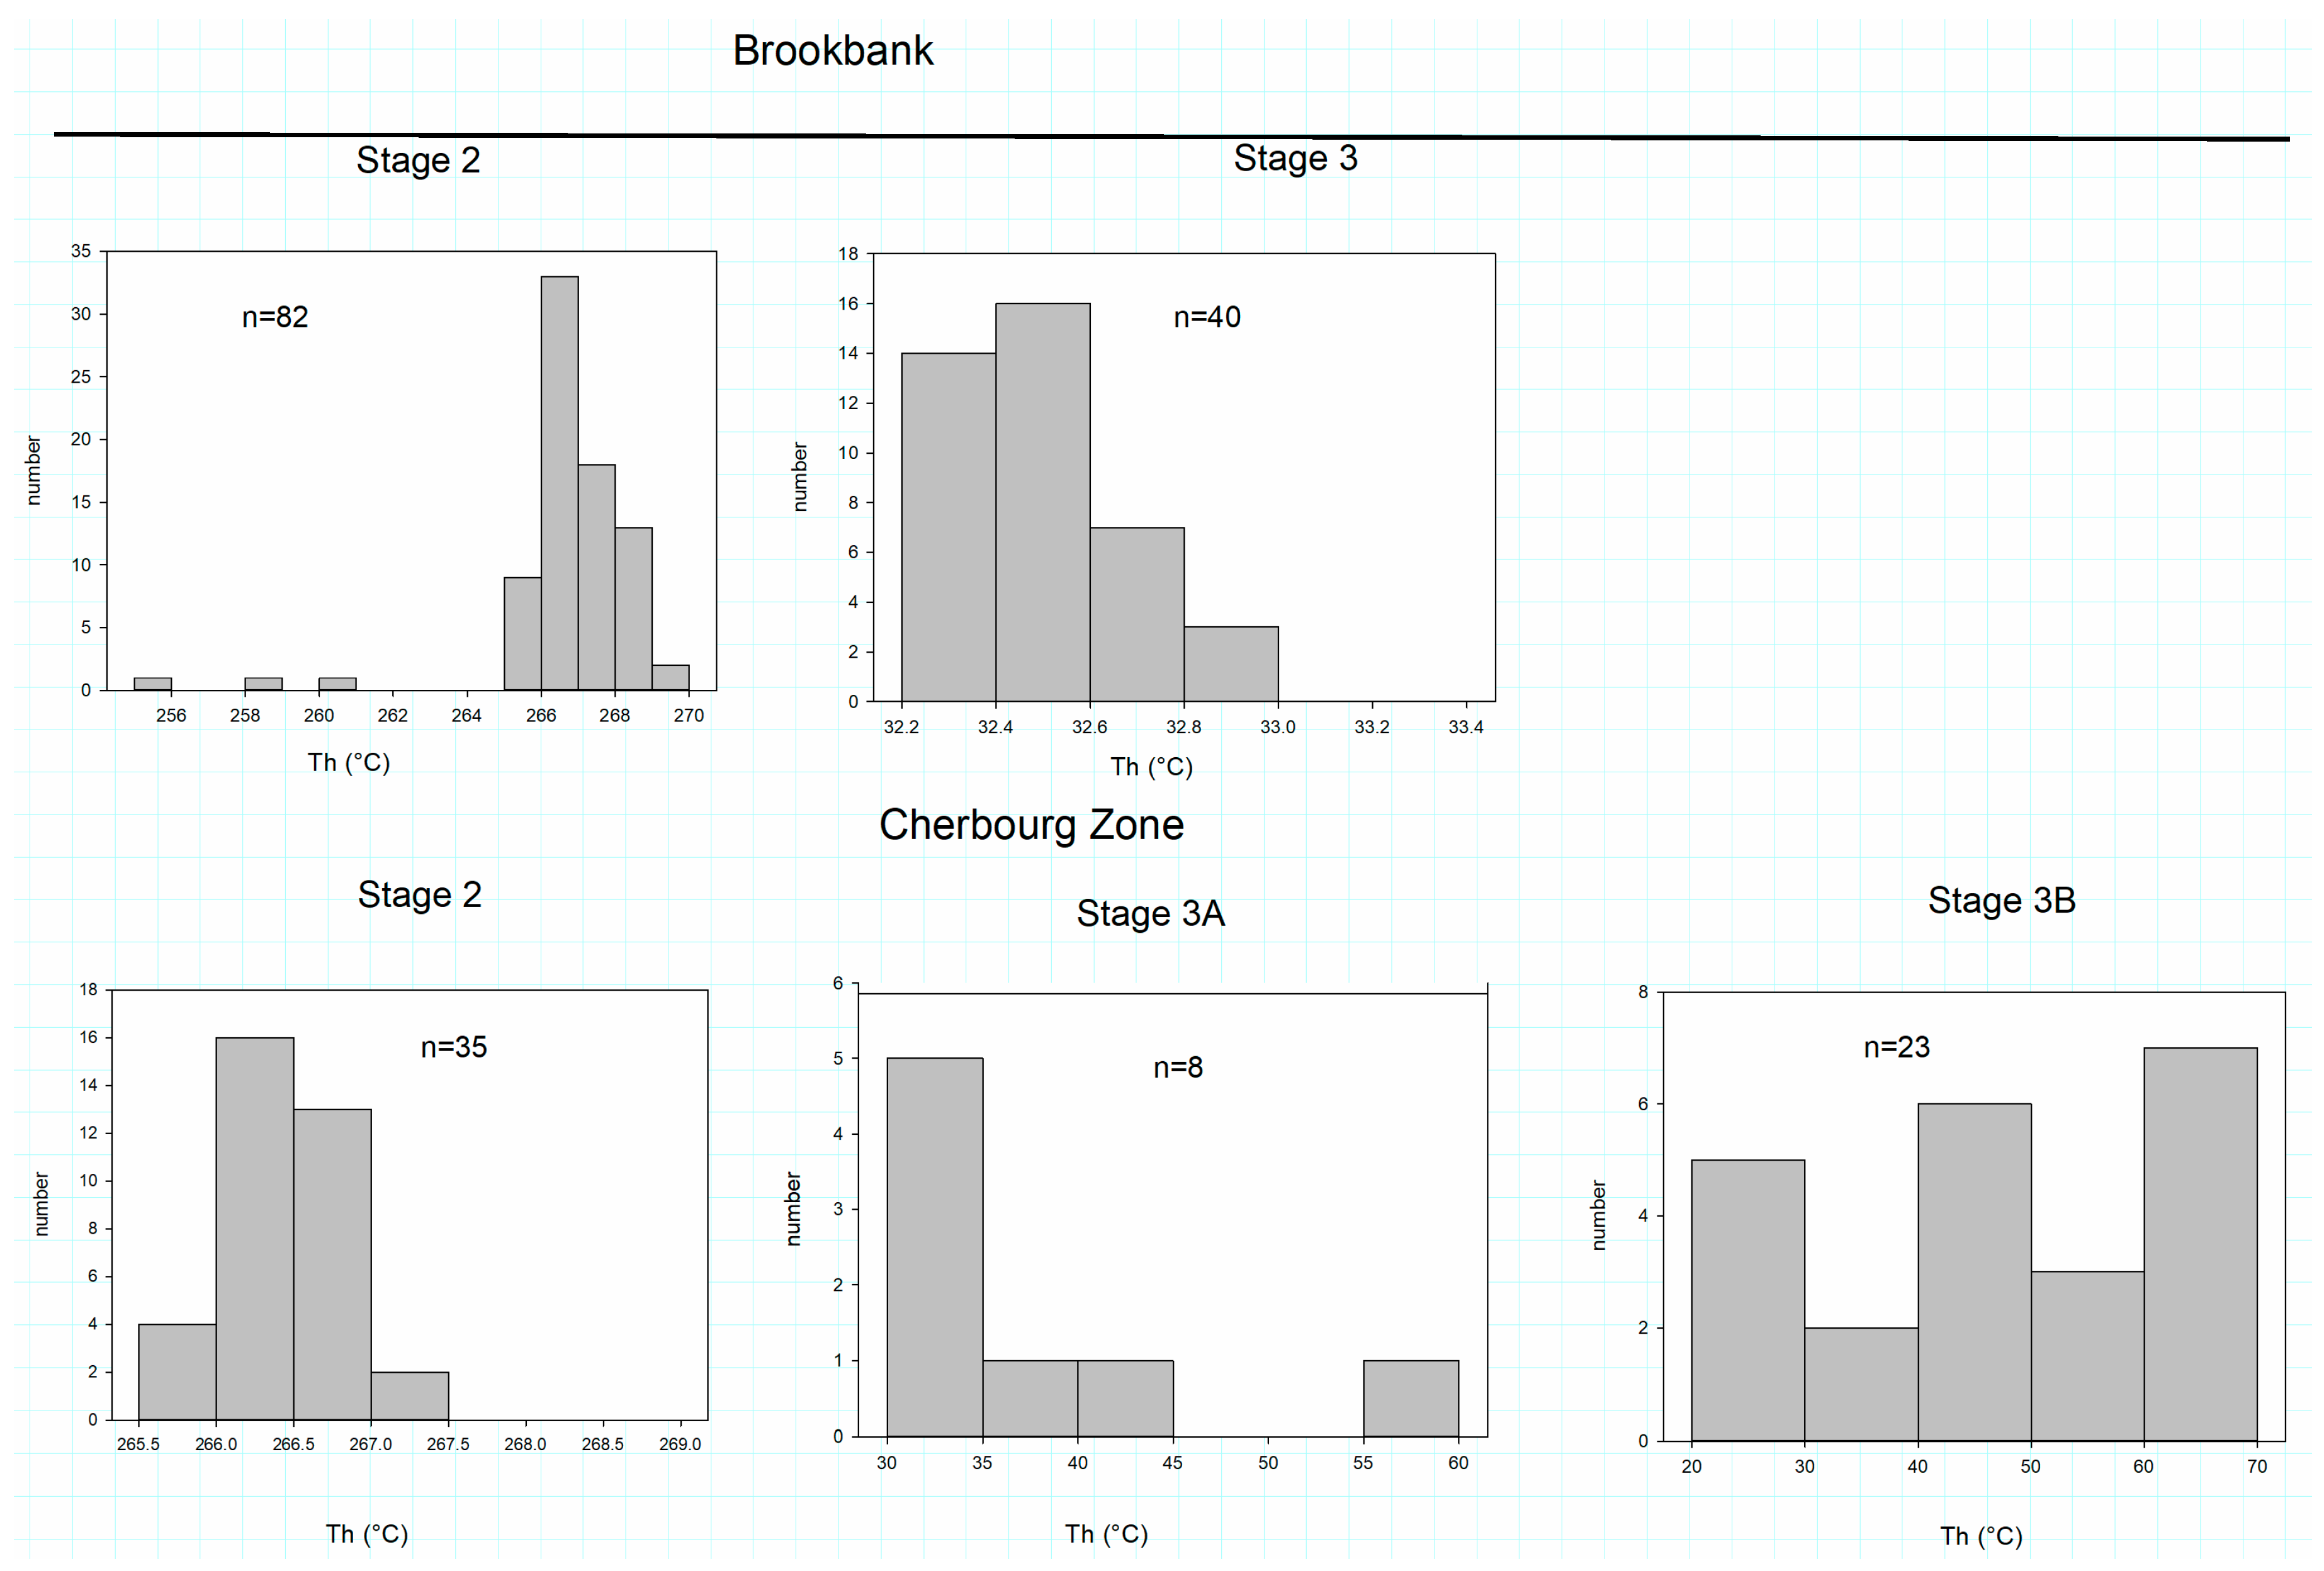
The complete results of analyses of 375 fluid inclusions from the Brookbank and Cherbourg Zone deposits are given in Supplementary Tables S1–S10. The results of the fluid inclusion analysis showed that the pre-ore and post-ore stages 1 and 3, respectively, yielded differing properties among groups of fluid inclusions. Hence, stage 1 has A, B and C subdivisions, and stage 3 has A and B subdivisions. The fluid inclusion data are summarized in Table 2, and Table 3 defines the inclusion types and abbreviations used in Table 2. A comparison of the homogenization temperatures in fluid inclusions from the two deposits is shown in Figure 4. Fluid inclusions were generally quite small (2 to 5 μm diameter), making some observations difficult.
4.1. Stage 1A
The data from Brookbank and the Cherbourg Zone fluid inclusions are quite similar in many respects with some significant differences. The eutectic temperatures (Te) reflecting first melting from both data sets span the range of Te for the NaCl-H2O system at −21.2 °C to that of the NaCl-KCl-H2O system at −22.9 °C. In fact, the mean Te for the Cherbourg Zone is −22.04 °C ± 0.43 (S.E., n = 42), at the midpoint between the two eutectic temperatures, whereas the mean Te for Brookbank is −22.40 ± 0.29 (S.E., n = 29). The latter is closer to the NaCl-KCl-H2O eutectic; however, it has been noted that at the accuracy of most measurements, the two eutectics cannot be reliably distinguished [25]. The freezing point depression, as determined by the final melting of ice (Tm ice), is a function of salinity, but at the small depression measured here, the difference between the effect of NaCl-H2O and NaCl-KCl-H2O is negligible, so the well-established relation between Tm ice and salinity in wt % NaCl is employed [25].
The salinity for Cherbourg Zone fluid inclusions is therefore 0.7–0.9 wt % NaCl equivalent, whereas the salinity of Brookbank fluid inclusions is variable and ranges as low as 0.2 wt % NaCl equivalent to as high as 10.0 wt % NaCl equivalent. This range to higher salinities results in different behavior on heating to homogenization from that observed in Cherbourg Zone fluid inclusions.
Homogenization temperature (Th) for both deposits are similar, but Brookbank exhibited a range of 15 °C with no discernable relationship to depth of the drill core sample. (A single Th = 266.8 °C was determined, but possibly is an erroneous measurement). The difference between the two data sets is present in the homogenization phase; i.e., whether the liquid + vapor homogenized to liquid (L) or vapor (V). The Cherbourg Zone fluid inclusions mostly homogenized to L (36 to L, 6 to V), whereas the opposite occurred in the Brookbank fluid inclusions (6 to L, 24 to V). The difference can be ascribed to the effects of the CO2 content and the salinity of the fluid inclusions. In the case of the Cherbourg Zone fluid inclusions, the effect of the low, consistent salinity would produce a path through a field of immiscibility ending with homogenization to L in most cases. Some inclusions would homogenize to V if on heating they followed other isochors in P–T space. The Brookbank fluid inclusions with some significantly higher salinities would strongly affect isochors in the H2O-CO2 system, leading to homogenization to V [26].
The presence of CO2 in the Cherbourg Zone inclusions was obvious from the presence of in clathrates in most cases and its inferred presence in the remainder. Clathrates were not seen in the Brookbank inclusions, but the effect of salinity may have made them difficult to observe. However, the behavior of the fluid inclusions strongly suggests their presence. The invariant point for clathrate melting in the H2O-CO2 system is +9.8 °C [26], so the observed measurements of +10.4 and 10.5 °C are within the standard error of estimate.
The source of the fluids forming the quartz-calcite veins at this stage may be from dehydration reactions during the greenschist facies metamorphism of the host rocks. However, particularly with the variable salinity of the Brookbank inclusions, there may have been a contribution from ancient saline waters in the host rocks, as has been documented elsewhere [27].
4.2. Stage 1B
Fluid inclusions from both deposits yielded eutectic temperatures within 1 °C of the eutectic for the system NaCl-CaCl2-H2O at −52 °C. This system is characteristic of a number of geological environments, here most likely moderate grade metamorphic fluids [25]. As noted above, ancient saline waters may have been incorporated into the vein-forming fluid. Salinities as determined by melting point depression were low, −0.3 to −0.8 °C at Brookbank and −0.4 to −0.5 °C at the Cherbourg Zone.
At Brookbank, homogenization temperatures were mostly in the range of ca. 230–238 °C, but temperatures rose 30 °C from the shallowest to the deepest drill core samples. All inclusions homogenized to V reflecting the effect of CO2 in the inclusions. Homogenization temperatures in the Cherbourg Zone samples were all close to 230 °C, but here was some variation in the homogenization phase, apparently related to the position of isochors in the CO2-containing system.
4.3. Stage 1C
Veins formed at this stage were identified only in Brookbank samples. The eutectic temperatures were all found to be within 1 °C of the eutectic for CO2-H2O, although all were above that temperature of −56 °C [26]. Melting point depressions were low but variable, and an electrolyte component in the L did not appear as a separate eutectic. It is possible that the closeness of the CO2-H2O eutectic at −56 °C and the NaCl-CaCl2-H2O eutectic at −52 °C obscured the individual eutectics.
The fluid inclusions in this stage nearly all homogenized to V at much higher temperatures than in stage 1A and 1B veins. The source of the fluid trapped in these inclusions is unknown, but it has been noted that a similar high temperature episode occurred in the Geraldton area deposits [13]. That this stage of veins was not found at the Cherbourg Zone may be a function of the depth at which sampling was carried out at Brookbank as opposed to the surface samples from the Cherbourg Zone, or simply that the fault at the Cherbourg Zone was not joined to the Brookbank fault during this episode.
4.4. Stage 2
Ore stage fluid inclusions form Brookbank yielded eutectic temperatures within 1 °C of the MgCl2-NaCl-H2O eutectic at −35 °C [25]. Whereas the temperatures measured are consistent with this eutectic, additional possibilities are the FeCl2-H2O at −35.0 °C [28] and the FeCl3-H2O eutectic at −37.0 °C with the hydrate FeCl3·10H2O [28,29]. The Mg component of the ore-depositing fluid may be related to formation of clinochlore alteration associated with ore deposition. On the other hand, the iron-containing systems are consistent with the abundant pyrite in the deposit. Without information on the composition of the liquid phase in the inclusions, it is not possible to distinguish among these alternatives or even a combination of them yielding a multicomponent system. All fluid inclusions but two homogenized in the temperature range of 266–269 °C; the exceptions were 256 and 258 °C. However, there was no relationship between homogenization temperature and depth of the drill core sample. The homogenization phase was predominantly to V (55) with 27 to L. Freezing point depressions were all less than 1 °C with the exception of eight inclusions whose freezing point depressions were in the range of 7–9 °C.
Although the presence of fluid inclusions that homogenized to L or V was accepted as evidence of immiscibility, definitive proof was seen in two sets of inclusions from the same section (Table 4). In both cases the inclusions homogenized at the same temperature within the error of measurement. Table 4 also shows two sets of inclusions from cross-cutting veins in the same section, demonstrating that there was no difference in the fluid trapped in veins formed at different times.
Fluid inclusions from the Cherbourg Zone except for one inclusion yielded eutectic temperatures within 1 °C of at −35 °C. Homogenization temperatures were all in the range 266 to 267 °C. While these properties are nearly identical to those in Brookbank inclusions, there was a marked difference in the homogenization phases. Here, 31 homogenized to L and 4 to V, the opposite of what was seen at Brookbank. All the freezing point depressions but four were 0.1 °C, the four exceptions only slightly greater. Although liquid CO2 was seen in half the inclusions and inferred to be present in the remainder, clathrate melting was observed in only two inclusions. The melting temperature of +9.8 °C, is that of the H2O-CO2 system, consistent with the low salinity indicated by the freezing point depression.
4.5. Stage 3A
At Brookbank, all fluid inclusions yielded a eutectic temperature within 1 °C of the CO2-H2O eutectic at −56 °C. As well, all were type 3 inclusions with CO2 liquid present at room temperature. Of 40 fluid inclusions, all but six homogenized to V. Three of the six that homogenized to L had the largest freezing point depressions, from 6.8 to 8.3 °C. Freezing point depression in the remaining inclusions ranged widely from 4.3 to 0.7 °C, reflecting some variation in concentration of a salt in the vein-forming solution. However, a eutectic for the salt system was not detected in these fluid inclusions, perhaps owing to the high CO2-content. Homogenization temperatures were all within 1 °C of 32 °C, reflecting the low temperature origin of the host veins.
Fluid inclusions from the Cherbourg Zone similarly yielded eutectic temperatures within 1 °C of the CO2-H2O eutectic at −56 °C. All inclusions were of type 3; however, clathrate melting at +10.4 °C was detected in only one inclusion. Two of eight inclusions homogenized to V, the opposite of the effect seen at Brookbank. Final melting of ice was at −0.9 °C, indicating some saline content, but a pertinent eutectic was not observed.
4.6. Stage 3B
This stage was not observed at Brookbank and apparently represents introduction of a fluid at slightly higher temperature and saline content than in stage 3A.The fluid inclusions homogenized mostly to L over a range of temperatures from 21 to 70 °C; however, the freezing point depressions measured were all 1.1 to 1.2 °C. All inclusion are of type 3, but clathrate formation was not detected. Most interesting are the measured eutectic temperatures of −14.1 to −18.6 °C, too high for NaCl-H2O, and too low for KCl-H2O at −10.7 °C [25]. A possible explanation, as has been suggested in NaCl- and CaCl2-bearing inclusions is the formation of metastable hydrates of KCl [18]. Metastable behavior in the KCl-H2O system has been observed, possibly due to the presence of hydrates [30]. The existence of hydrates of the form KCl·H2O and KCl·nH2O have been reported in Russian literature [31].
4.7. Raman Spectroscopy Results
The results from seven fluid inclusions from the three stages of vein formation in sample BSK-C-0+95E-2 from the Cherbourg Zone are presented in Table 5. Fluid inclusions 1 and 2 from stage 1A contain CO2, as anticipated from the presence of clathrates in these inclusions. Fluid inclusions 3–5 from stage 2 contain only H2O, and in the case of inclusion 5, N2 as well was present. The failure to find CO2 in inclusions 5–7 may be due to a relatively low CO2-content in the inclusions of type 4A. Finally, inclusions 6 and 7 from stage 3B contained both CO2 and N2. The source of N2 in the inclusions is uncertain, but at least in the case of inclusions 6 and 7 meteoric water is a possibility.
5. Discussion
The salinity and presence of CO2 in all stages of vein formation at Brookbank and the Cherbourg Zone is typical of lode gold deposits, especially in Archean terrains, e.g., [32]. The low salinity leads to a general low content of base metals carried as chloride complexes, whereas gold is soluble as bisulfide complexes, as demonstrated by many experimental studies [33,34,35,36], which are less effective as mobilizers of base metals [37]. The low abundance of base metal sulfides at these two deposits is thus consistent with transport of gold as a bisulfide complex.
The precipitation of gold from bisulfide complexes by various means has been proposed. Cooling will produce precipitation if the solution passes into the SO42− stability field from the H2S stability field [38]. However, the temperature in stage 2 inclusions is nearly constant with depth in the drill core from Brookbank. This observation is consistent with the telescoped zoning of alteration, as has been observed in other deposits [39,40]. Mixing solutions, particularly low temperature, oxidized meteoric water, will lead to precipitation of gold by dilution of the complexing ligand as well as the factors mentioned above [39]. However, other than minor mixing of saline fluids, as seen by increases in freezing point depressions in a few cases, no evidence of fluid mixing was observed.
The eutectic temperature in stage 2 inclusions, as noted previously, corresponds to that of the MgCl2-NaCl-H2O system. Although consistent with chlorite alteration, it does not provide an explanation for late potassium alteration producing potassium feldspar. The presence of potassium feldspar-quartz-pyrite alteration has been attributed introduction of a high temperature (500–700 °C) fluid possibly of magmatic origin [14]. However, there is no evidence of such high temperature potassium-bearing inclusions.
The possible introduction of potassium may be seen in stage 3B inclusions, which may have trapped KCl-bearing fluids at low temperatures. The patchy presence of potassium feldspar alteration is suggestive of regional potassium alteration, which is widespread in the Canadian Shield [41,42]. Replacement of plagioclase by potassium feldspar is the typical result of this process [43].
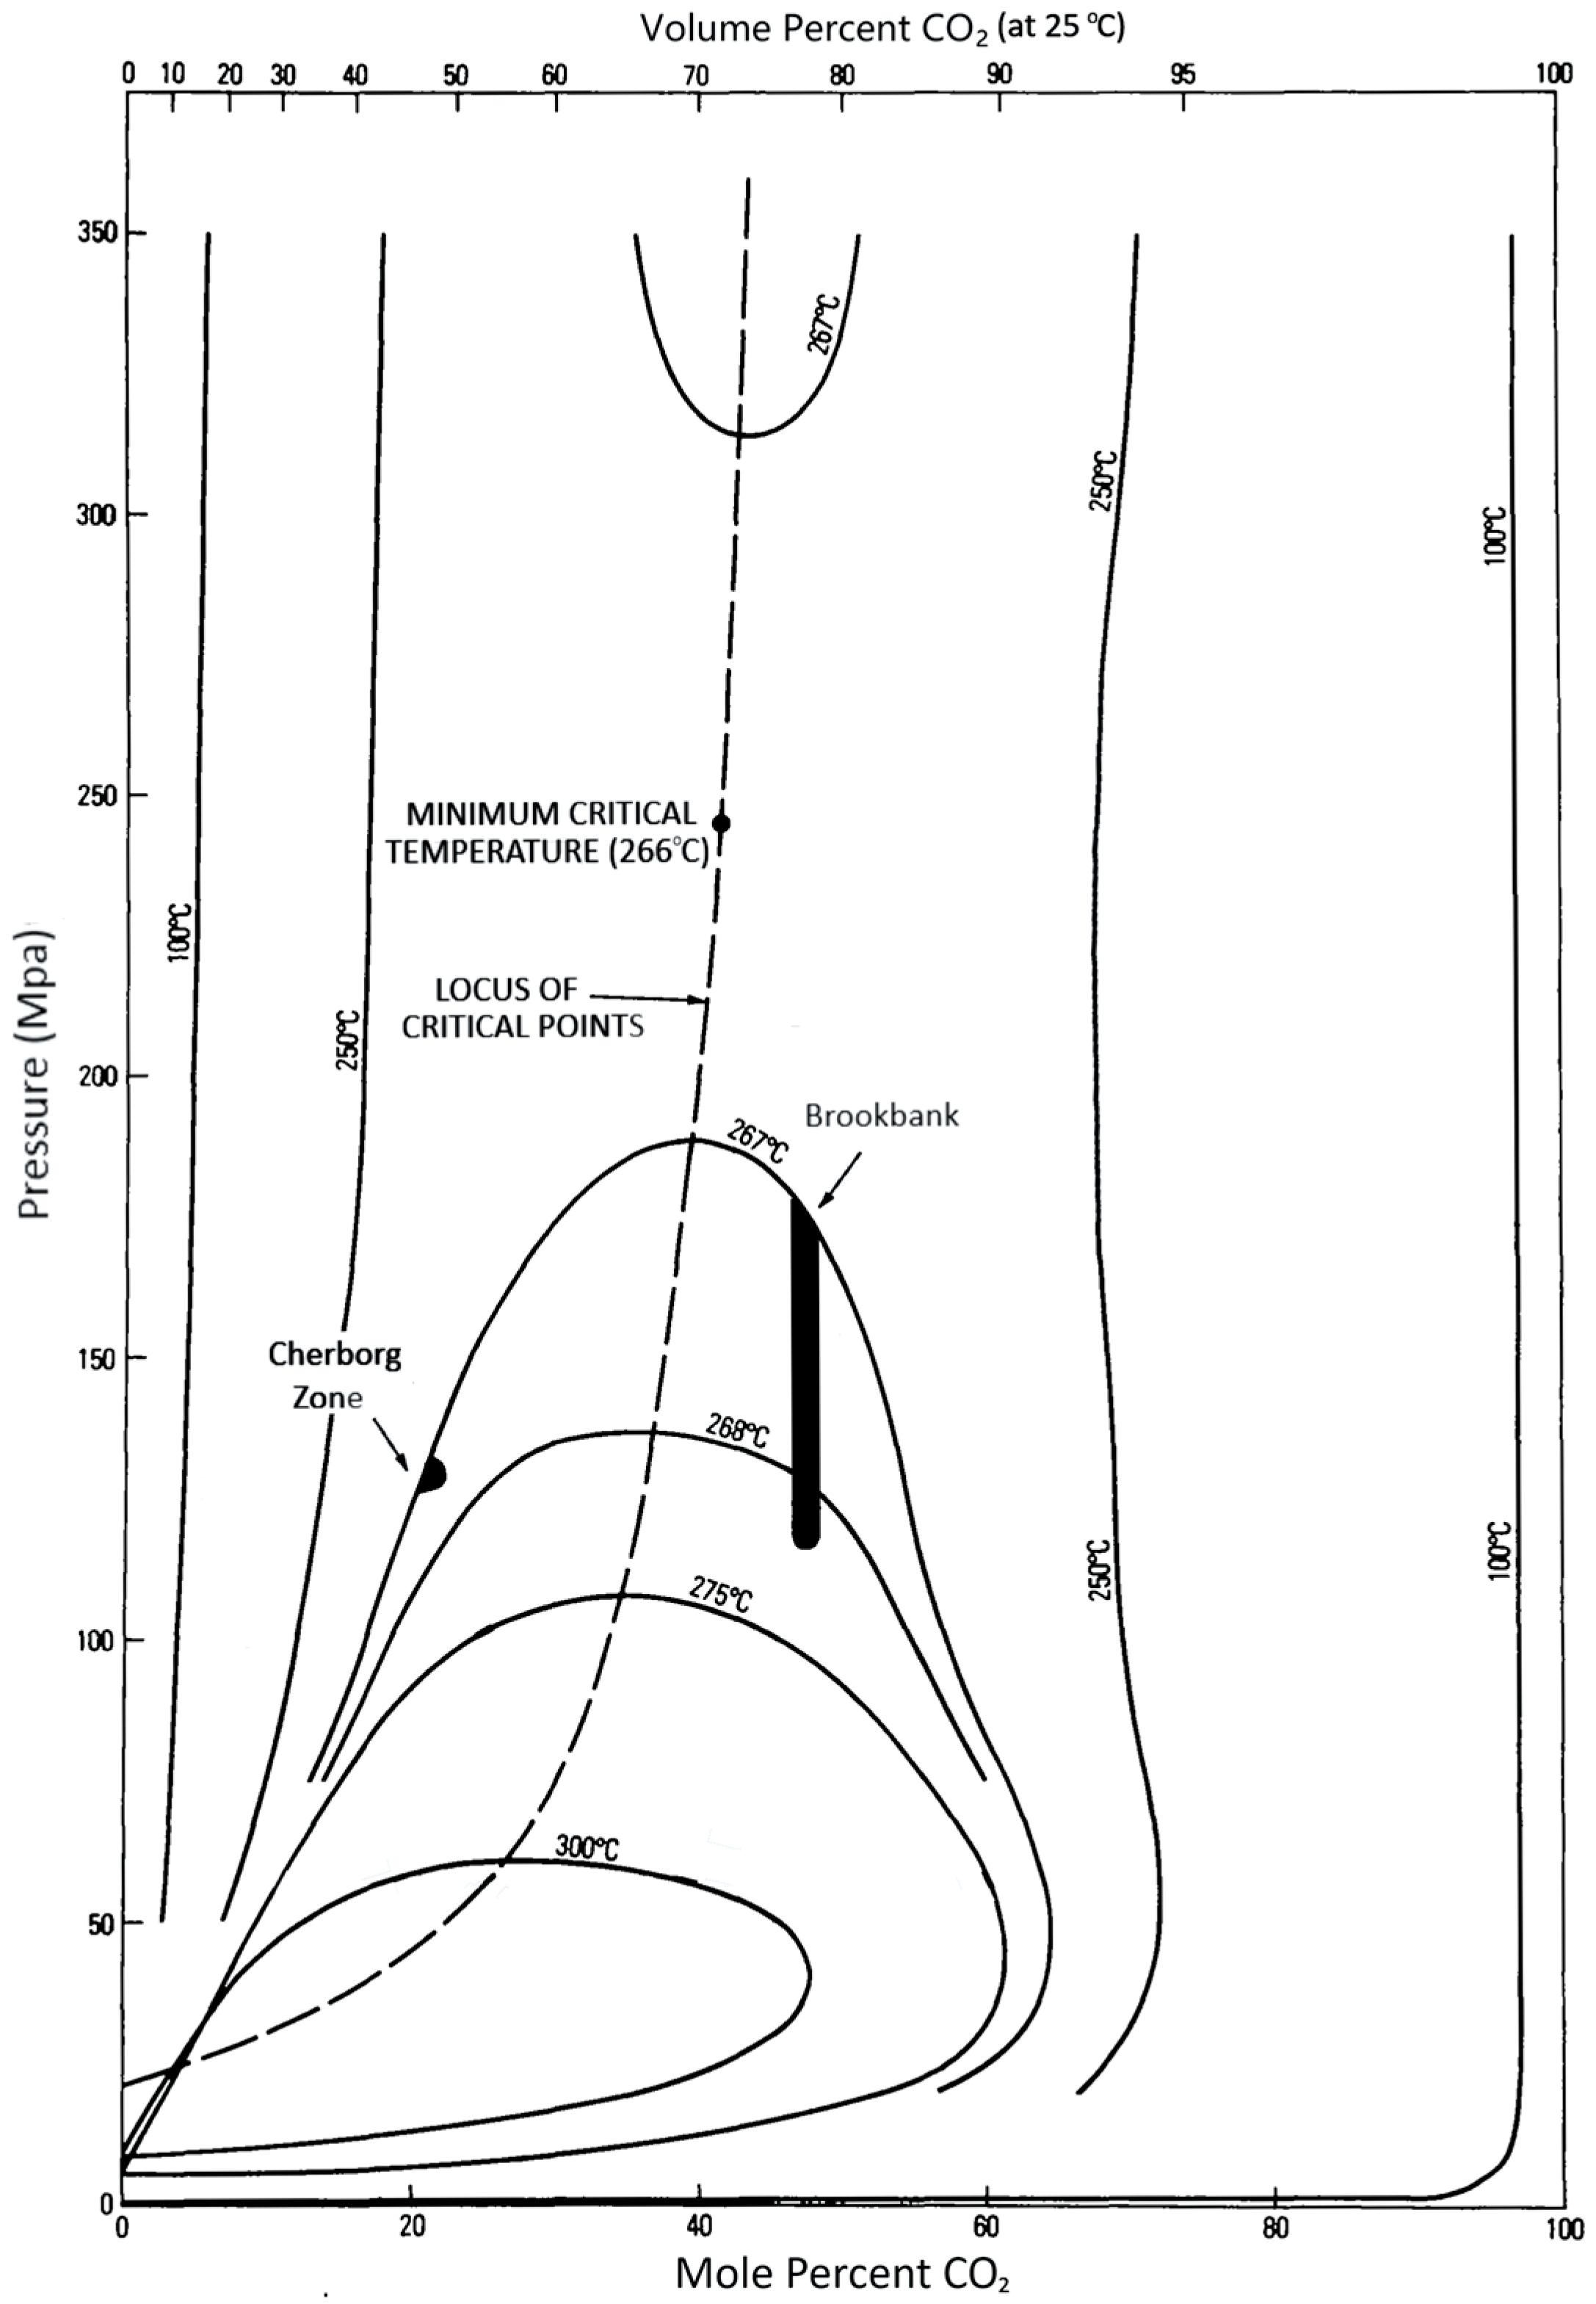
The phenomenon observed in stage 2, immiscibility producing phase separation such that coexisting fluid inclusions homogenized to L and V. Volatile species such as CO2 and H2S would preferentially partition to the V phase. Figure 5 illustrates the CO2-H2O system as a function of pressure vs. mole fraction CO2 (lower abscissa) and volume percent CO2 (upper abscissa) with isotherms of coexisting phases for selected temperatures. The homogenization temperatures for Brookbank and Cherbourg Zone fluid inclusions are plotted based on the homogenization phases to V and L, respectively. It is recognized that salinity has the effect of raising the critical temperature and solvus of the CO2-H2O system. However, decreasing pressure in the CO2-H2O-NaCl system operates so as to lower the critical point and solvus. Salinity in equivalent wt % NaCl for the Cherbourg Zone is 0.2 wt % based on freezing point depression 0.1 °C [25]. This not likely to raise the critical point more than 10 °C, based on comparison with the effect of higher salinities [44]. The mean freezing point depression for Brookbank inclusions, excluding some aberrantly high values, is 0.36 °C, corresponding to 0.6 wt % NaCl equivalent [25]. At 100 Mpa, the peak of the solvus is raised by approximately 55 °C in a 2.6wt % NaCl fluid [45].Thus, 0.36 wt % NaCl can be anticipated to have a smaller effect, perhaps 10 to 15 °C. Note that this comparison of salinities does not account for the effect of the contribution of CO2 to freezing point depression; however, the effect is small and comparable at these low calculated salinities [46].
The L-rich phase at the Cherbourg Zone would have precipitated gold owing to instability of the complex Au(HS)2− with the loss of H2S to the V-phase. As well, accompanying the influx of quartz as temperature declined, pyrite and calcite would form by reaction with alteration ankerite with the remaining H2S in solution:
CaFe(CO3)2 + 2H2S + ½O2 = CaCO3 + FeS2 + CO2 + 2H2O
Gold would have tended to be associated with pyrite by a reaction (unbalanced) such as [48]:
CaFe(CO3)2 + Au(HS)2− = CaCO3 + FeS2 + Au + CO2 + H2O
Thus, the association of ankeritic alteration with the ore-depositing stage, as well as with pyrite and calcite in the veins is explained.
Experimental work has established that gold can be transported in a H2S-H2O gas phase as AuS(H2S)n complexes [49,50]. This would permit concentrations of gold to be deposited at Brookbank by means of the same mechanisms as those in effect at the Cherbourg Zone. Calculation of the phase diagram for the system is possible in principle by the use of equations of state, e.g., [51]. However, the lack of data for the mole fraction of CO2 in this study, owing to the small size of inclusions, does not allow for this possibility.
Based on the approximations made in Figure 5, the pressure at trapping of inclusions at the Cherbourg Zone would be on the order of 130 Mpa. For Brookbank, the range of homogenization pressures at trapping of inclusion would range from 120 to 170 Mpa. The change in pressure may correspond to the change in style of mineralization, shear zone at Brookbank and fissure vein at the Cherbourg Zone. Most noteworthy is that this change occurred at the onset of immiscibility in the system. As has been noted [14], Brookbank is the only deposit in the NVB. Moreover, it contrasts with fissure deposits typical of the Beardmore area. These fluid inclusion studies provide an explanation for the development of shear zone vs. fissure vein deposits. These contrasting styles of mineralization can also be considered to represent a transition from mesothermal to epithermal conditions in lode gold deposits.
Supplementary Materials
The following are available online at https://www.mdpi.com/2075-163X/8/3/92/s1, Table S1: Fluid inclusion data—Brookbank Stage 1A, Table S2: Fluid inclusion data—Cherbourg Zone Stage 1A, Table S3: Fluid inclusion data—Brookbank Stage 1B, Table S4: Fluid inclusion data—Cherbourg Zone Stage 1B, Table S5. Fluid inclusion data—Brookbank Stage 1C, Table S6: Fluid inclusion data—Brookbank Stage 2, Table S7: Fluid inclusion data—Cherbourg Zone Stage 2, Table S8: Fluid inclusion data—Brookbank Stage 3A, Table S9: Fluid inclusion data: Cherbourg Zone Stage 3A, Table S10: Fluid inclusion data: Cherbourg Zone Stage 3B.
Acknowledgments
The former Metalore Resources Ltd. is thanked for support of B.S.K. and for access to the property and drill core. We are grateful to Jill Pasteris for the Raman spectrographic analyses of selected fluid inclusions. Anne Hammond prepared the many polished sections for the fluid inclusion work.
Author Contributions
The late Barbara Kowalski selected the study area and collected and sampled the study material. The analytical method was assigned and supervised by Stephen Kissin. Data were collected and organized by Barbara Kowalski. Data analysis was done by Barbara Kowalski and Stephen Kissin. The paper was written by Stephen Kissin.
Conflicts of Interest
The authors declare no conflict of interest. The founding sponsors had no role in the design of the study; in the collection, analyses, or interpretation of data.
References
- Greenstone Gold Mines. Development of the Trans-Canada Property. Available online: http://www.greenstonegoldmines.com/ (accessed on 16 August 2017).
- Blackburn, C.W.; Johns, G.W.; Ayer, J.A.; Davis, D.W. Wabigoon Subprovince. In Geology of Ontario; Thurston, P.C., Williams, H.R., Sutcliffe, R.H., Stott, G.M., Eds.; Ontario Geological Survey: Sudbury, ON, Canada, 1991; Special Volume 4, Part 1; pp. 303–381. ISBN 13: 9780772989761. [Google Scholar]
- Mason, J.K.; McConnell, C.D. Gold mineralization in the Beardmore-Geraldton area. In The Geology of Gold in Ontario; Colvine, A.C., Ed.; Ontario Geological Survey Miscellaneous Paper; Ontario Geological Survey: Sudbury, ON, Canada, 1983; pp. 84–97. [Google Scholar]
- Lewis, W.J.; Murahwi, C.Z.; San Martin, A.J. Technical Report on the Mineral Resource Estimates for the Hardrock, Brookbank and Keylake Projects Trans-Canada Property, Beardmore-Geraldton Area Northern Ontario. 2013. Available online: www.premiergoldmines.com/assets/docs/Trans-Canada-Version-Final-Jan-2013-(LQ).pdf (accessed on 4 July 2017).
- Ontex Resources Drilling Campaign Aimed to Enhance Open Pit Potential of 629,900 Oz Brookbank Gold Deposit. 2009. Available online: http://www.marketwired.com/press-release/ontex-resources-drilling-campaign-aimed-enhance-open-pit-potential-629900-oz-brookbank-tsx-ont-793645.htm (accessed on 11 November 2017).
- McCuaig, T.C.; Kerrich, R. P-T-t-deformation-fluid characteristics of lode gold deposits: Evidence from alteration systematics. Ore Geol. Rev. 1998, 12, 381–453. [Google Scholar] [CrossRef]
- Lindgren, W. Mineral Deposits, 4th ed.; McGraw-Hill: New York, NY, USA, 1933. [Google Scholar]
- Sibson, R.H.; Robert, F.; Poulsen, K.H. High-angle reverse faults, fluid-pressure cycling, and mesothermal gold-quartz deposits. Geology 1988, 16, 551–555. [Google Scholar] [CrossRef]
- Robb, L. Introduction to Ore-Forming Processes; Blackwell Publishing: Malden, MA, USA, 2005; ISBN 0-632-06378-5. [Google Scholar]
- Sibson, R.H. Earthquake rupturing as a mineralizing agent in hydrothermal systems. Geology 1987, 15, 701–704. [Google Scholar] [CrossRef]
- Robert, F.; Poulsen, K.H. Vein formation and deformation in greenstone gold deposits. In Structural Controls on Ore Genesis; Richards, J.P., Tosdal, R.M., Eds.; Reviews in Economic Geology; Society of Economic Geologists: Littleton, CO, USA, 2001; Volume 14, pp. 111–115. ISBN 1-887483-58-6. [Google Scholar]
- Kowalski, B.S. Petrographic and Fluid Inclusion Studies on the Metalore-Golden Highway Deposit, Thunder Bay District, Ontario. M.Sc. Thesis, Lakehead University, Thunder Bay, ON, Canada, 1994. [Google Scholar]
- Smyk, M.C.; Fralick, P.; Hart, T.R. Geology and gold mineralization of the Beardmore-Geraldton greenstone belt. In 51st Annual Meeting, Proceedings of Institute on Lake Superior Geology, Nipigon, ON, Canada, 24–28 May 2005; Hollings, P., Ed.; 51st Institute on Lake Superior Geology: Nipigon, ON, Canada, 2005; Volume 51, part 2; pp. 3–40. [Google Scholar]
- DeWolfe, J.C.; Lafrance, B.; Stott, G.M. Geology of the shear-hosted Brookbank gold prospect in the Beardmore-Geraldton belt, Wabigoon subprovince, Ontario. Can. J. Earth Sci. 2007, 44, 925–946. [Google Scholar] [CrossRef]
- Tomlinson, K.Y.; Hall, R.P.; Hughes, D.J.; Thurston, P.C. Geochemistry and assemblage accretion of metavolcanic rocks in the Beardmore-Geralton greenstone belt, Superior Province. Can. J. Earth Sci. 1996, 33, 1520–1533. [Google Scholar] [CrossRef]
- Devaney, J.R.; Fralick, P.W. Regional sedimentology of the Namewaminikan Group, northern Ontario: Archean fluvial fans, braided rivers, deltas and an aquabasin. Current. Research. Geol. Sur. Can., Pap. 85-1B 1985, 125–132. [Google Scholar] [CrossRef]
- Barrett, T.J.; Fralick, P.W. Sediment redeposition in Archean iron formation: Examples from the Beardmore-Geraldton greenstone belt, Ontario. J. Sediment. Petrol. 1985, 55, 205–212. [Google Scholar]
- Devaney, J.R. Sedimentology and Stratigraphy of the Northern and Central Metasedimentary Belts in the Beardmore-Geraldton Area of Northern Ontario. M.Sc. Thesis, Lakehead University, Thunder Bay, ON, Canada, 1987. [Google Scholar]
- Barrett, T.J.; Fralick, P.W. Turbidites and iron formation, Beardmore-Geraldton, Ontario: Application of a combined ramp/fan model to Archean clastic and chemical sedimentation. Sedimentology 1989, 36, 221–234. [Google Scholar] [CrossRef]
- Devaney, J.R.; Williams, H.R. Evolution of an Archean subprovince boundary: A sedimentological and structural study of part of the Wabigoon-Quetico boundary in northern Ontario. Can. J. Earth Sci. 1989, 26, 1013–1026. [Google Scholar] [CrossRef]
- Williams, H.R. Subprovince accretion tectonics in the south-central Superior Province. Can. J. Earth Sci. 1990, 26, 570–581. [Google Scholar] [CrossRef]
- Hart, T.R.; terMeer, M.; Jolette, C. Precambrian Geology of Kitto, Eva, Summers, Dorothea and Sandra Townships, Northwestern Ontario: Phoenix Bedrock Mapping Project; Open File Report 6095; Ontario Geological Survey: Sudbury, ON, Canada, 2002. [Google Scholar]
- Lafrance, B.; DeWolfe, J.C.; Stott, G.M. A sructural reappraisal of the Beardmore-Geraldton Belt at the southern boundary of the Wabigoon subprovince, Ontario, and implications for gold mineralization. Can. J. Earth Sci. 2004, 41, 217–235. [Google Scholar] [CrossRef]
- Roedder, E. Fluid Inclusions. In Reviews in Mineralogy; Mineralogical Society of America: Washington, DC, USA, 1984; Volume 12, ISBN 0-939950-16-2. [Google Scholar]
- Bodnar, R.J. Interpretation of data from aqueous-electrolyte fluid inclusions. In Fluid Inclusions: Analysis and Interpretation; Samson, I., Anderson, A., Marshall, D., Eds.; Short Course Series; Mineralogical Association of Canada: Ottawa, ON, Canada, 2003; Volume 32, pp. 81–100. [Google Scholar]
- Diamond, L.W. Introduction to gas-bearing fluid inclusions. In Fluid Inclusions: Analysis and Interpretation; Samson, I., Anderson, A., Marshall, D., Eds.; Short Course Series; Mineralogical Association of Canada: Ottawa, ON, Canada, 2003; Volume 32, pp. 101–158. ISBN 0-921294-32-8. [Google Scholar]
- Frape, S.K.; Fritz, P. Geochemical trends for groundwaters from the Canadian Shield. In Saline Water and Gases in Crystalline Rocks; Fritz, P., Frape, S.K., Eds.; Special Paper; Geological Association of Canada: St. John’s, NL, Canada, 1987; pp. 19–38. [Google Scholar]
- Borisenko, A. Study of the salt composition of solutions of gas-liquid inclusions in minerals by the cryometric method. Geol. Geofiz. 1977, 18, 16–27. [Google Scholar]
- Linke, W.F. Ferric chloride decahydrate: the systems FeCl3-H2O and FeCl3-HCl-H2O below 0. J. Phys. Chem. 1956, 60, 91–96. [Google Scholar] [CrossRef]
- Wilkinson, J. MgCl-H2O System. [email protected]. 1998. Available online: www.geology.wisc.edu/flincs/fi/disc/loweutec2.html (accessed on 25 January 2018).
- Cohen-Adad, R.; Lorimer, J.W. Alkali Metal and Ammonium Chlorides in Water and Heavy Water (Binary Systems); IUPAC Solubility Data Series; Pergamon Press: Oxford, UK, 1991; Volume 47. [Google Scholar]
- Dubé, B.; Gosselin, P. Greenstone-hosted quartz-carbonate veins. In Mineral Deposits of Canada; Goodfellow, W.D., Ed.; Mineral Deposits Division Special Publication; Geological Association of Canada: St. John’s, NL, Canada, 2007; ISBN 13: 978-1-897095-24-9. [Google Scholar]
- Seward, T.M. Thio complexes of gold in hydrothermal ore solutions. Geochim. Cosmochim. Acta 1973, 37, 379–399. [Google Scholar] [CrossRef]
- Renders, P.J.; Seward, T.M. The stability of hydrosulphido- and sulphido complexes of Au(I) and Ag(I) at 25°C. Geochim. Cosmochim. Acta 1989, 53, 244–253. [Google Scholar] [CrossRef]
- Shenberger, D.M.; Barnes, H.L. Solubility of gold in aqueous sulfide solutions from 150 to 350 °C. Geochim. Cosmochim. Acta 1989, 53, 269–278. [Google Scholar] [CrossRef]
- Benning, L.G.; Seward, T.M. Hydrosulphide complexing of Au(I) in hydrothermal solutions from 150–400 °C and 500–1500 bars. Geochim. Cosmochim. Acta 1996, 60, 1849–1871. [Google Scholar] [CrossRef]
- Wood, S.A. Application of a multiphase ore mineral solubility experiment to the separation of base metal and gold mineralization in Archean greenstone terrains. Econ. Geol. 1987, 82, 1044–1048. [Google Scholar] [CrossRef]
- Romberger, S.B. Transport and deposition of gold in hydrothermal systems. In Greenstone Gold and Crustal Evolution; Robert, F., Sheahan, P.A., Green, S.B., Eds.; NUNA Conference Volume; Geological Association of Canada, Mineral Deposits Division: St. John’s, NL, Canada, 1991; pp. 61–66. ISBN 0-919216-43-9. [Google Scholar]
- Phillips, G.N. Pressure-temperature environments and the causes of gold deposition. In Greenstone Gold and Crustal Evolution; Robert, F., Sheahan, P.A., Green, S.B., Eds.; NUNA Conference Volume; Geological Association of Canada, Mineral Deposits Division: St. John’s, NL, Canada, 1991; p. 193. ISBN 0-919216-43-9. [Google Scholar]
- Hu, F.F.; Fan, H.R.; Jiang, X.H.; Li, X.C.; Yang, K.F.; Mernagh, T. Fluid inclusions at different depths in the Shandandao gold deposit, Jiaodong Peninsula, China. Geofluids 2013, 13, 528–541. [Google Scholar] [CrossRef]
- Bethke, C.M.; Marshak, S. Brine migrations across North America-the plate tectonics of groundwater. Annu. Rev. Earth Planet. Sci. 1990, 18, 287–315. [Google Scholar] [CrossRef]
- Harper, D.A.; Longstaffe, F.J.; Wadleigh, M.A.; McNutt, R.H. Secondary K-feldspar at the Precambrian–Paleozoic unconformity, southwestern Ontario. Can. J. Earth Sci. 1995, 32, 1432–1450. [Google Scholar] [CrossRef]
- Hassler, S.W.; Simonson, B.M. Deposition and alteration of volcaniclastic strata in two large, early Proterozoic iron-formations in Canada. Can. J. Earth Sci. 1989, 26, 1574–1585. [Google Scholar] [CrossRef]
- Brown, P.E. Fluid inclusion modeling for hydrothermal systems. In Techniques in Hydrothermal Ore Deposits Geology; Richards, J.P., Larson, P.B., Eds.; Reviews in Economic Geology; Society of Economic Geologists: Littleton, CO, USA, 1998; Volume 10, pp. 151–171. [Google Scholar]
- Hendel, E.M.; Hollister, L.S. An empirical solvus for CO2-H2O-2.6 wt% salt. Geochim. Cosmochim. Acta 1981, 45, 225–228. [Google Scholar] [CrossRef]
- Hedenquist, J.W.; Henley, R.W. The importance of CO2 on freezing point measurements of fluid inclusions: Evidence from active geothermal systems and implications for epithermal ore deposition. Econ. Geol. 1985, 80, 1379–1406. [Google Scholar] [CrossRef]
- Roedder, E.; Bodnar, R.J. Geologic pressure determinations from fluid inclusion studies. Annu. Rev. Earth Planet. Sci. 1980, 8, 263–301. [Google Scholar] [CrossRef]
- Phillips, G.N. Gold and alteration in the Golden Mile, Kalgoorlie. Econ. Geol. 1986, 81, 779–808. [Google Scholar] [CrossRef]
- Zezin, D.Y.; Migdisov, A.A.; Williams-Jones, A.E. The solubility of gold in hydrogen sulfide gas: An experimental study. Geochim. Cosmochim. Acta 2007, 71, 3070–3081. [Google Scholar] [CrossRef]
- Zezin, D.Y.; Migdisov, A.A.; Williams-Jones, A.E. The solubility of gold in H2O-H2S vapour at elevated temperature and pressure. Geochim. Cosmochim. Acta 2011, 75, 5140–5153. [Google Scholar] [CrossRef]
- Duan, Z.; Møller, N.; Weare, J.H. Equation of state for the NaCl-H2O-CO2 system: Prediction of phase equilibria and volumetric properties. Geochim. Cosmochim. Acta 1995, 59, 2869–2882. [Google Scholar] [CrossRef]
Figure 1.
Geology of the Beardmore–Geraldton greenstone belt, with the location of the Brookbank gold deposit. NVB = northern volcanic belt; NMB = northern metasedimentary belt; CVB = central volcanic belt; CMB = central metasedimentary belt; SMB = southern metasedimentary belt; SVB = southern volcanic belt. Modified after [22]. Reproduced with permission from the Ontario Geological Survey, published by the Queen’s Printer for Ontario.
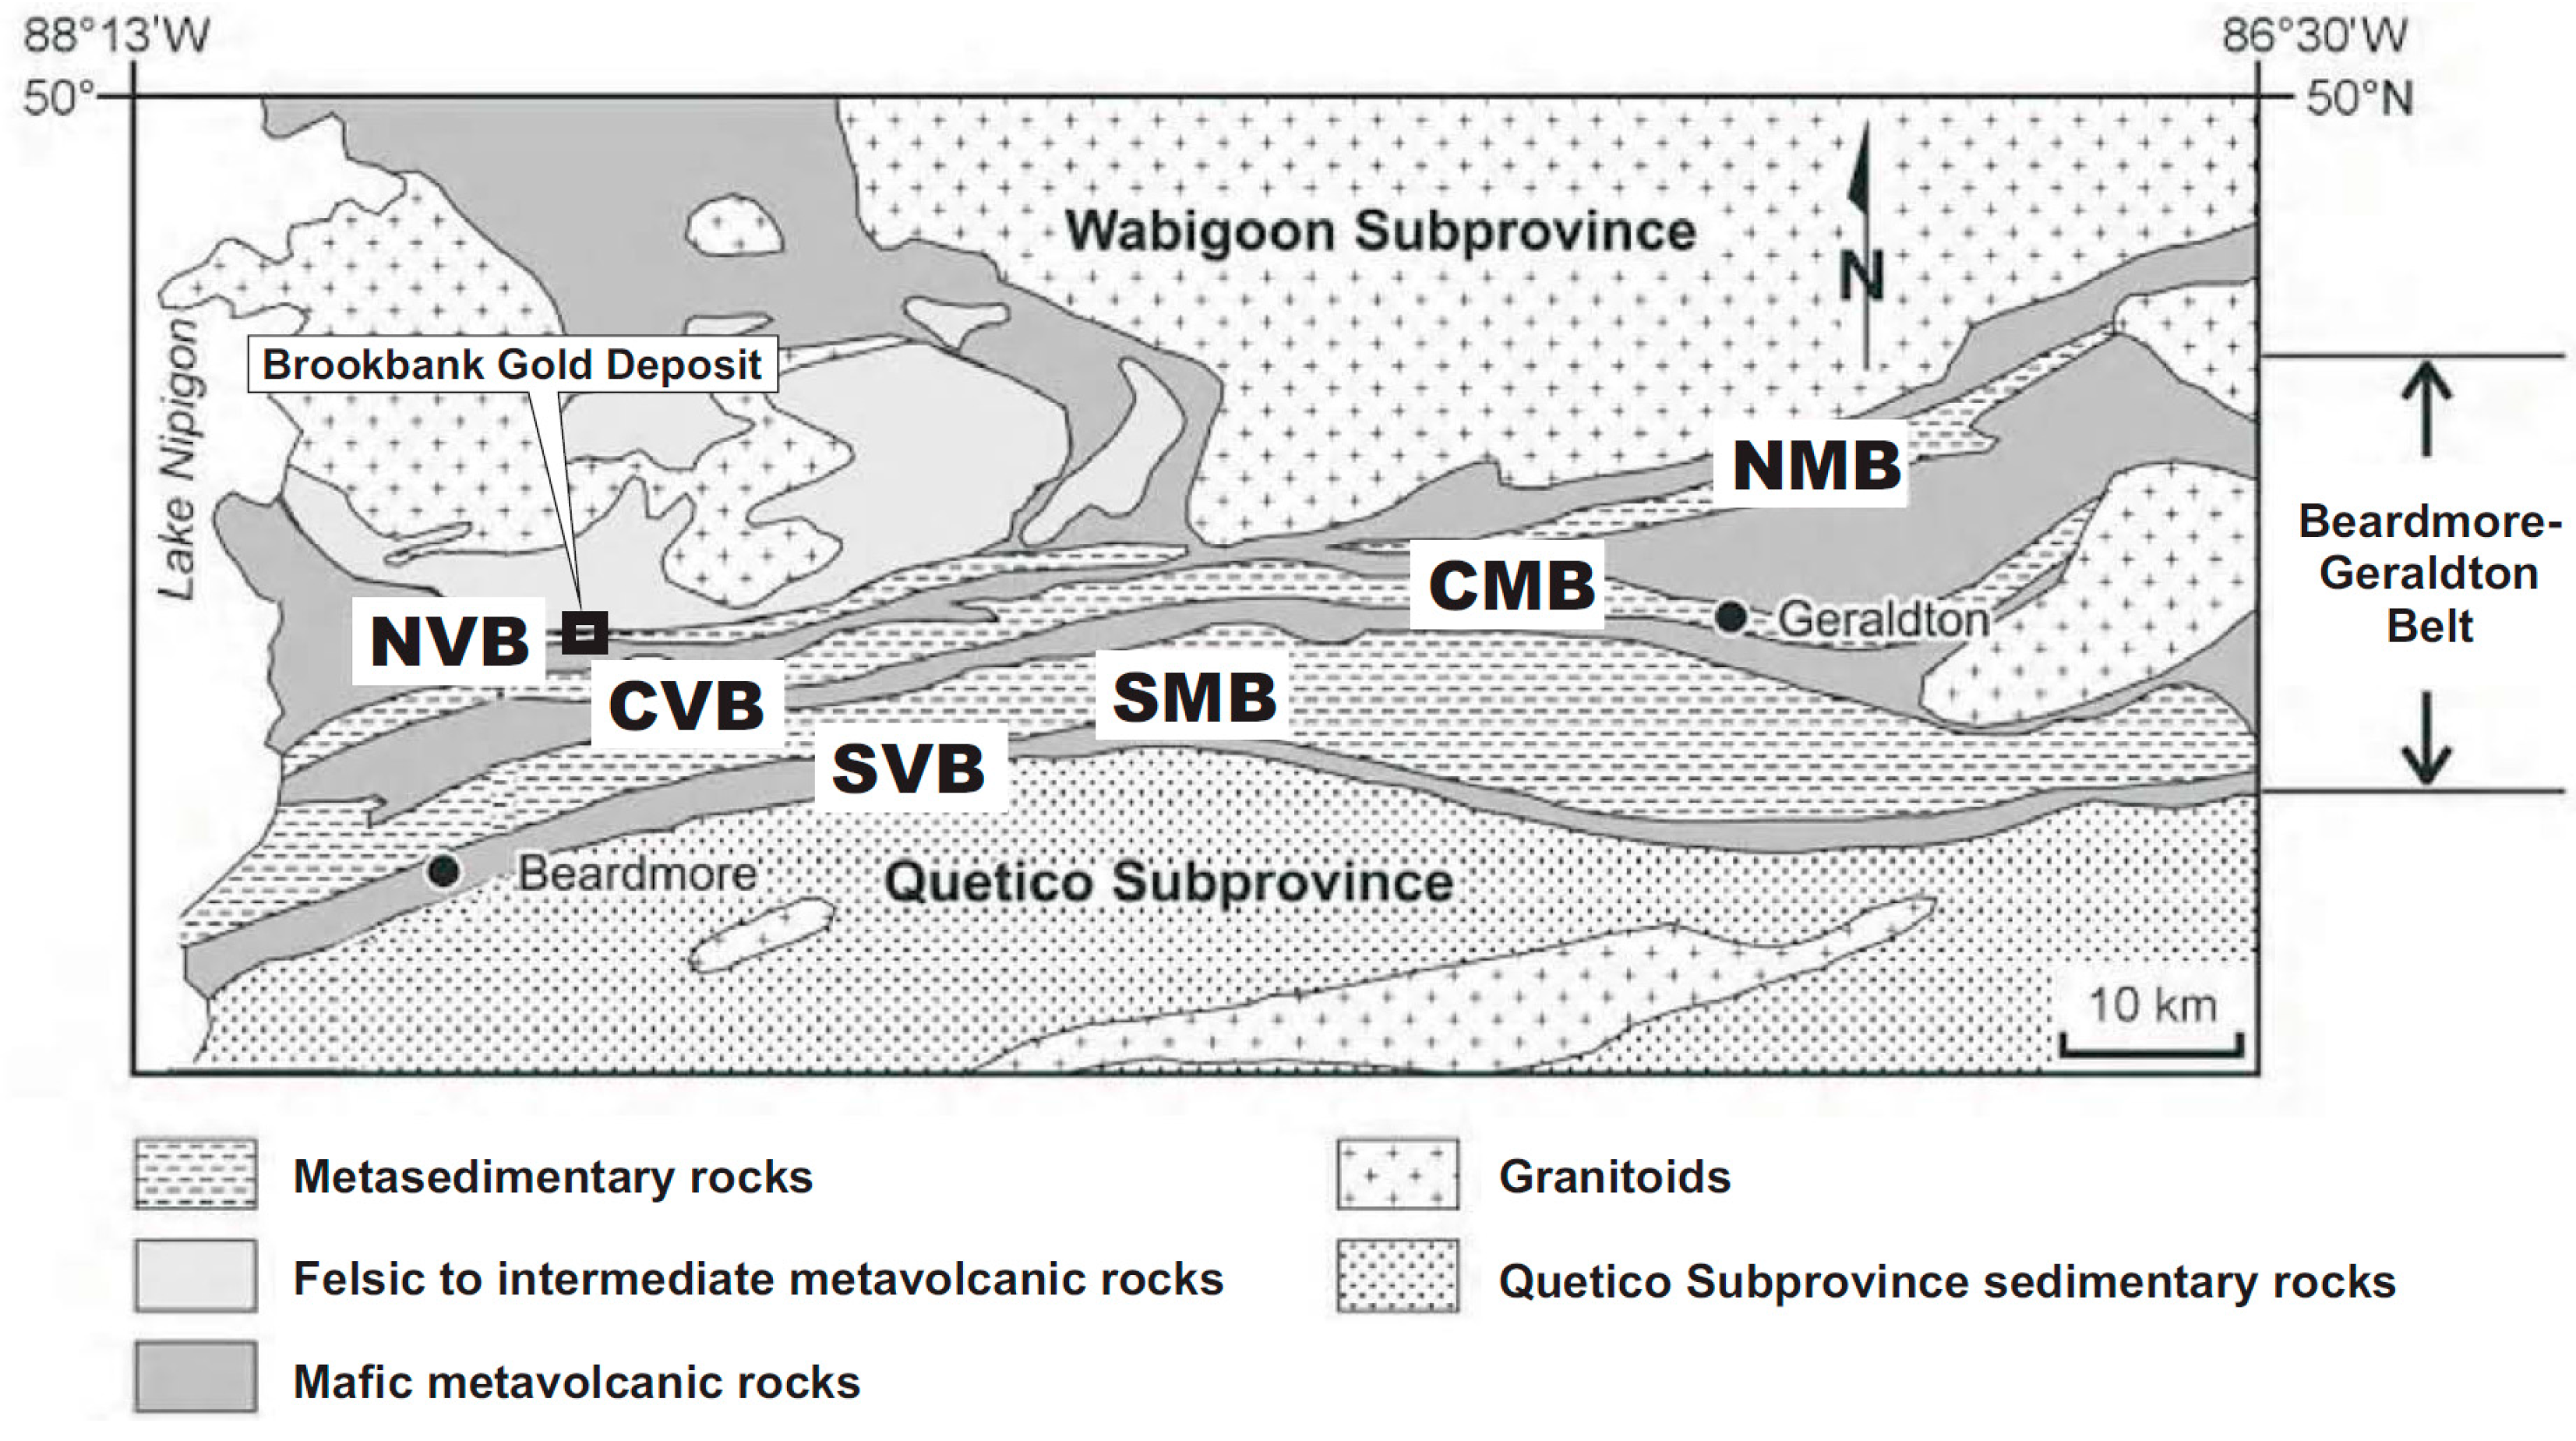
Figure 2.
Surface geology of the Brookbank deposit.
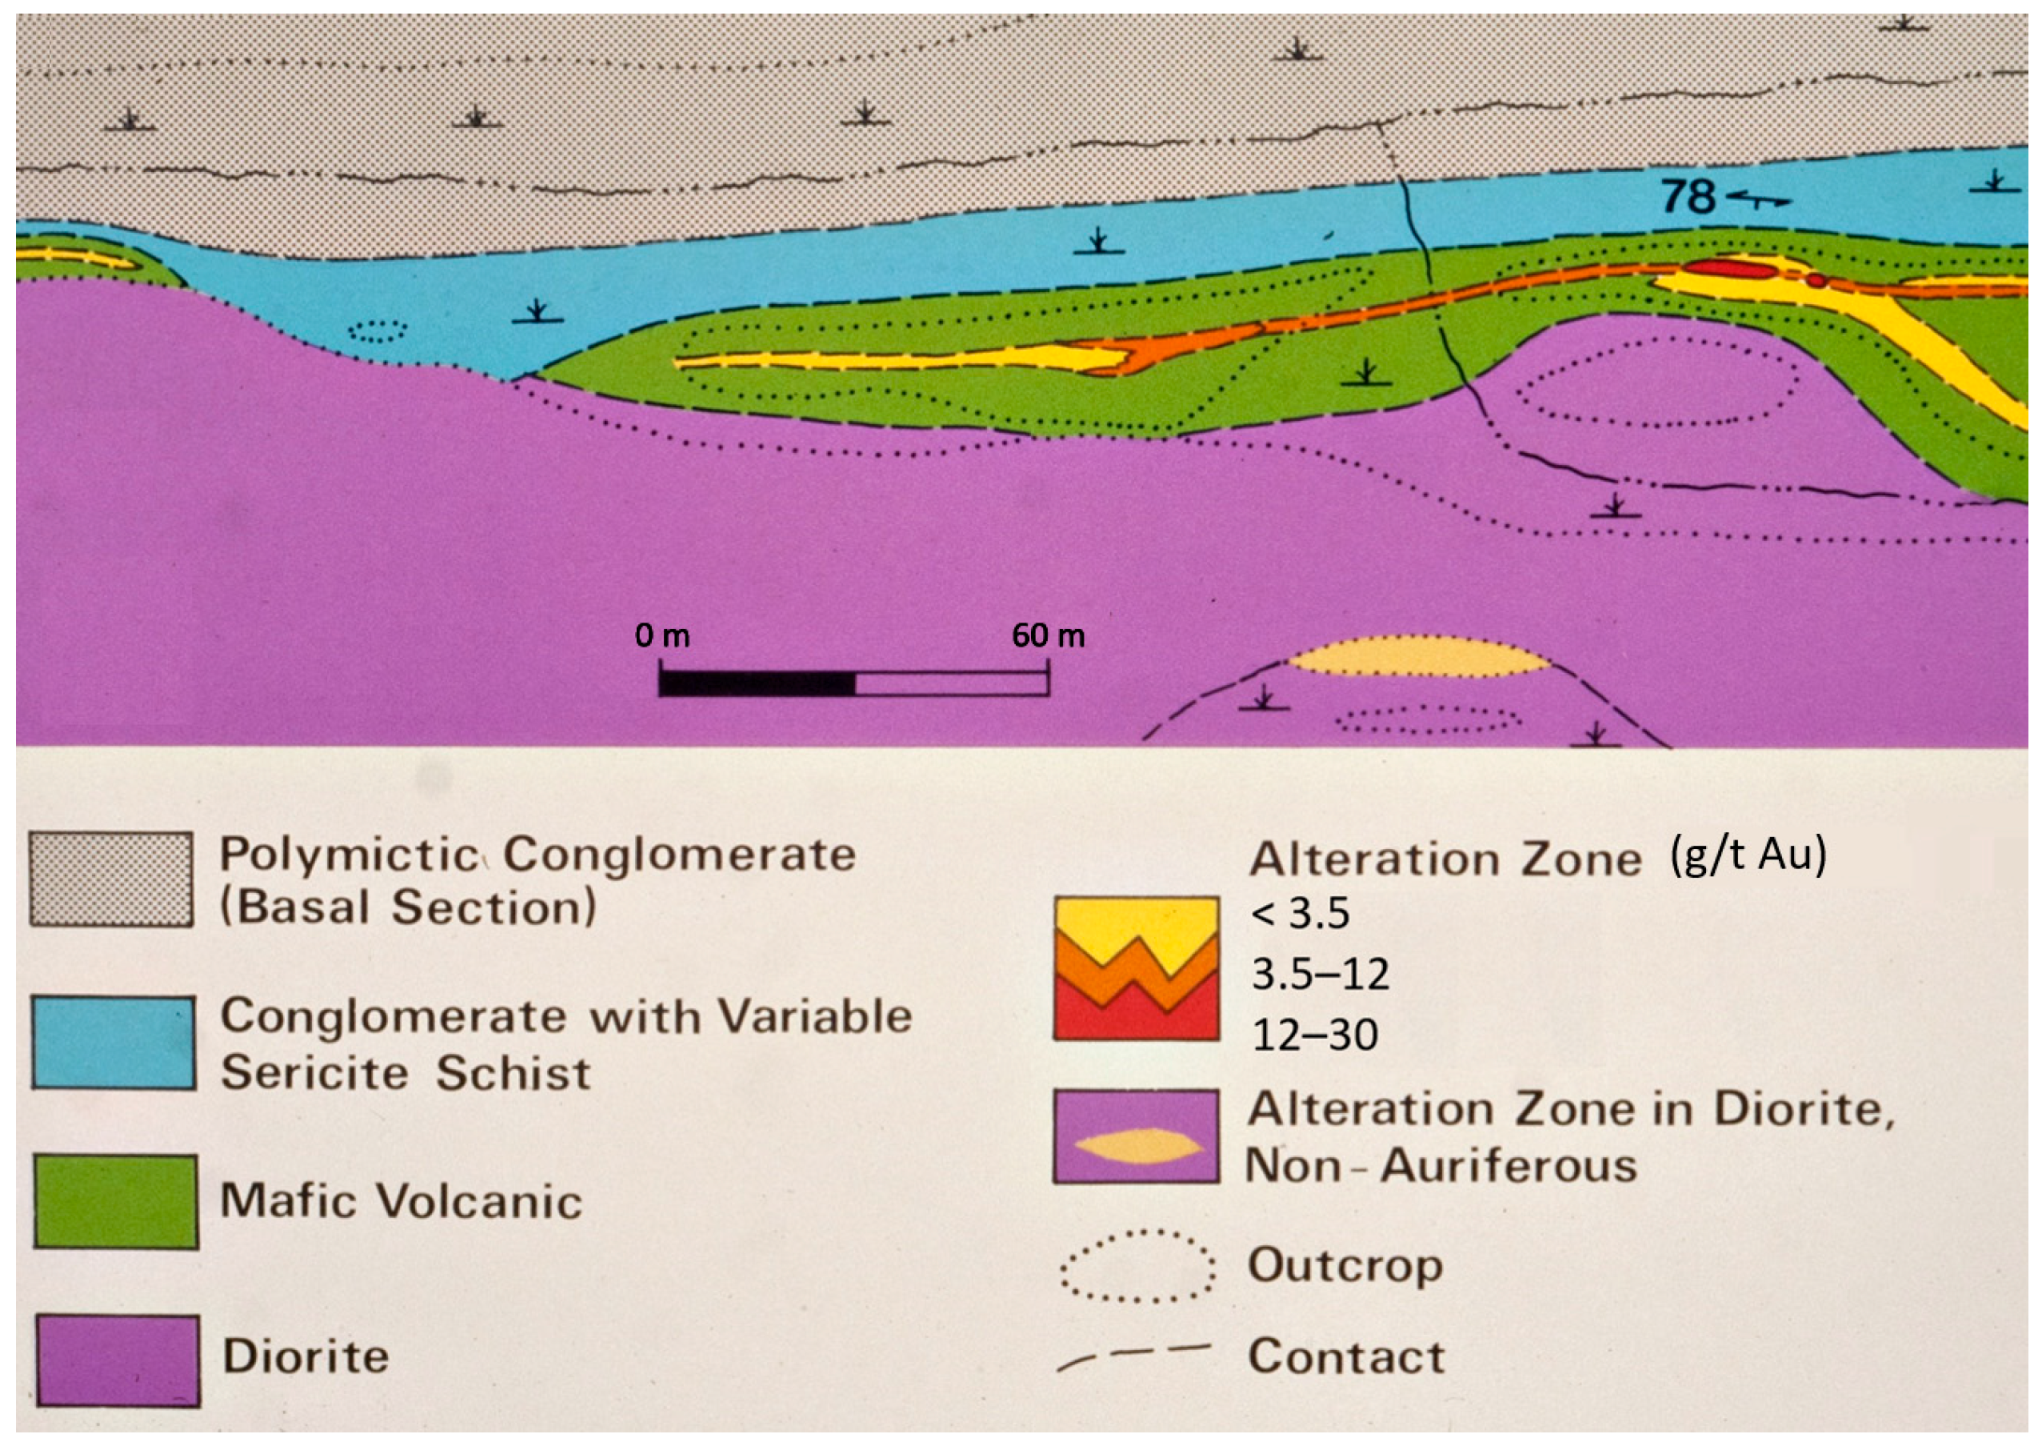
Figure 3.
Schematic cross-section of the Brookbank deposits. Unit colors as in Figure 2.
Figure 3.
Schematic cross-section of the Brookbank deposits. Unit colors as in Figure 2.
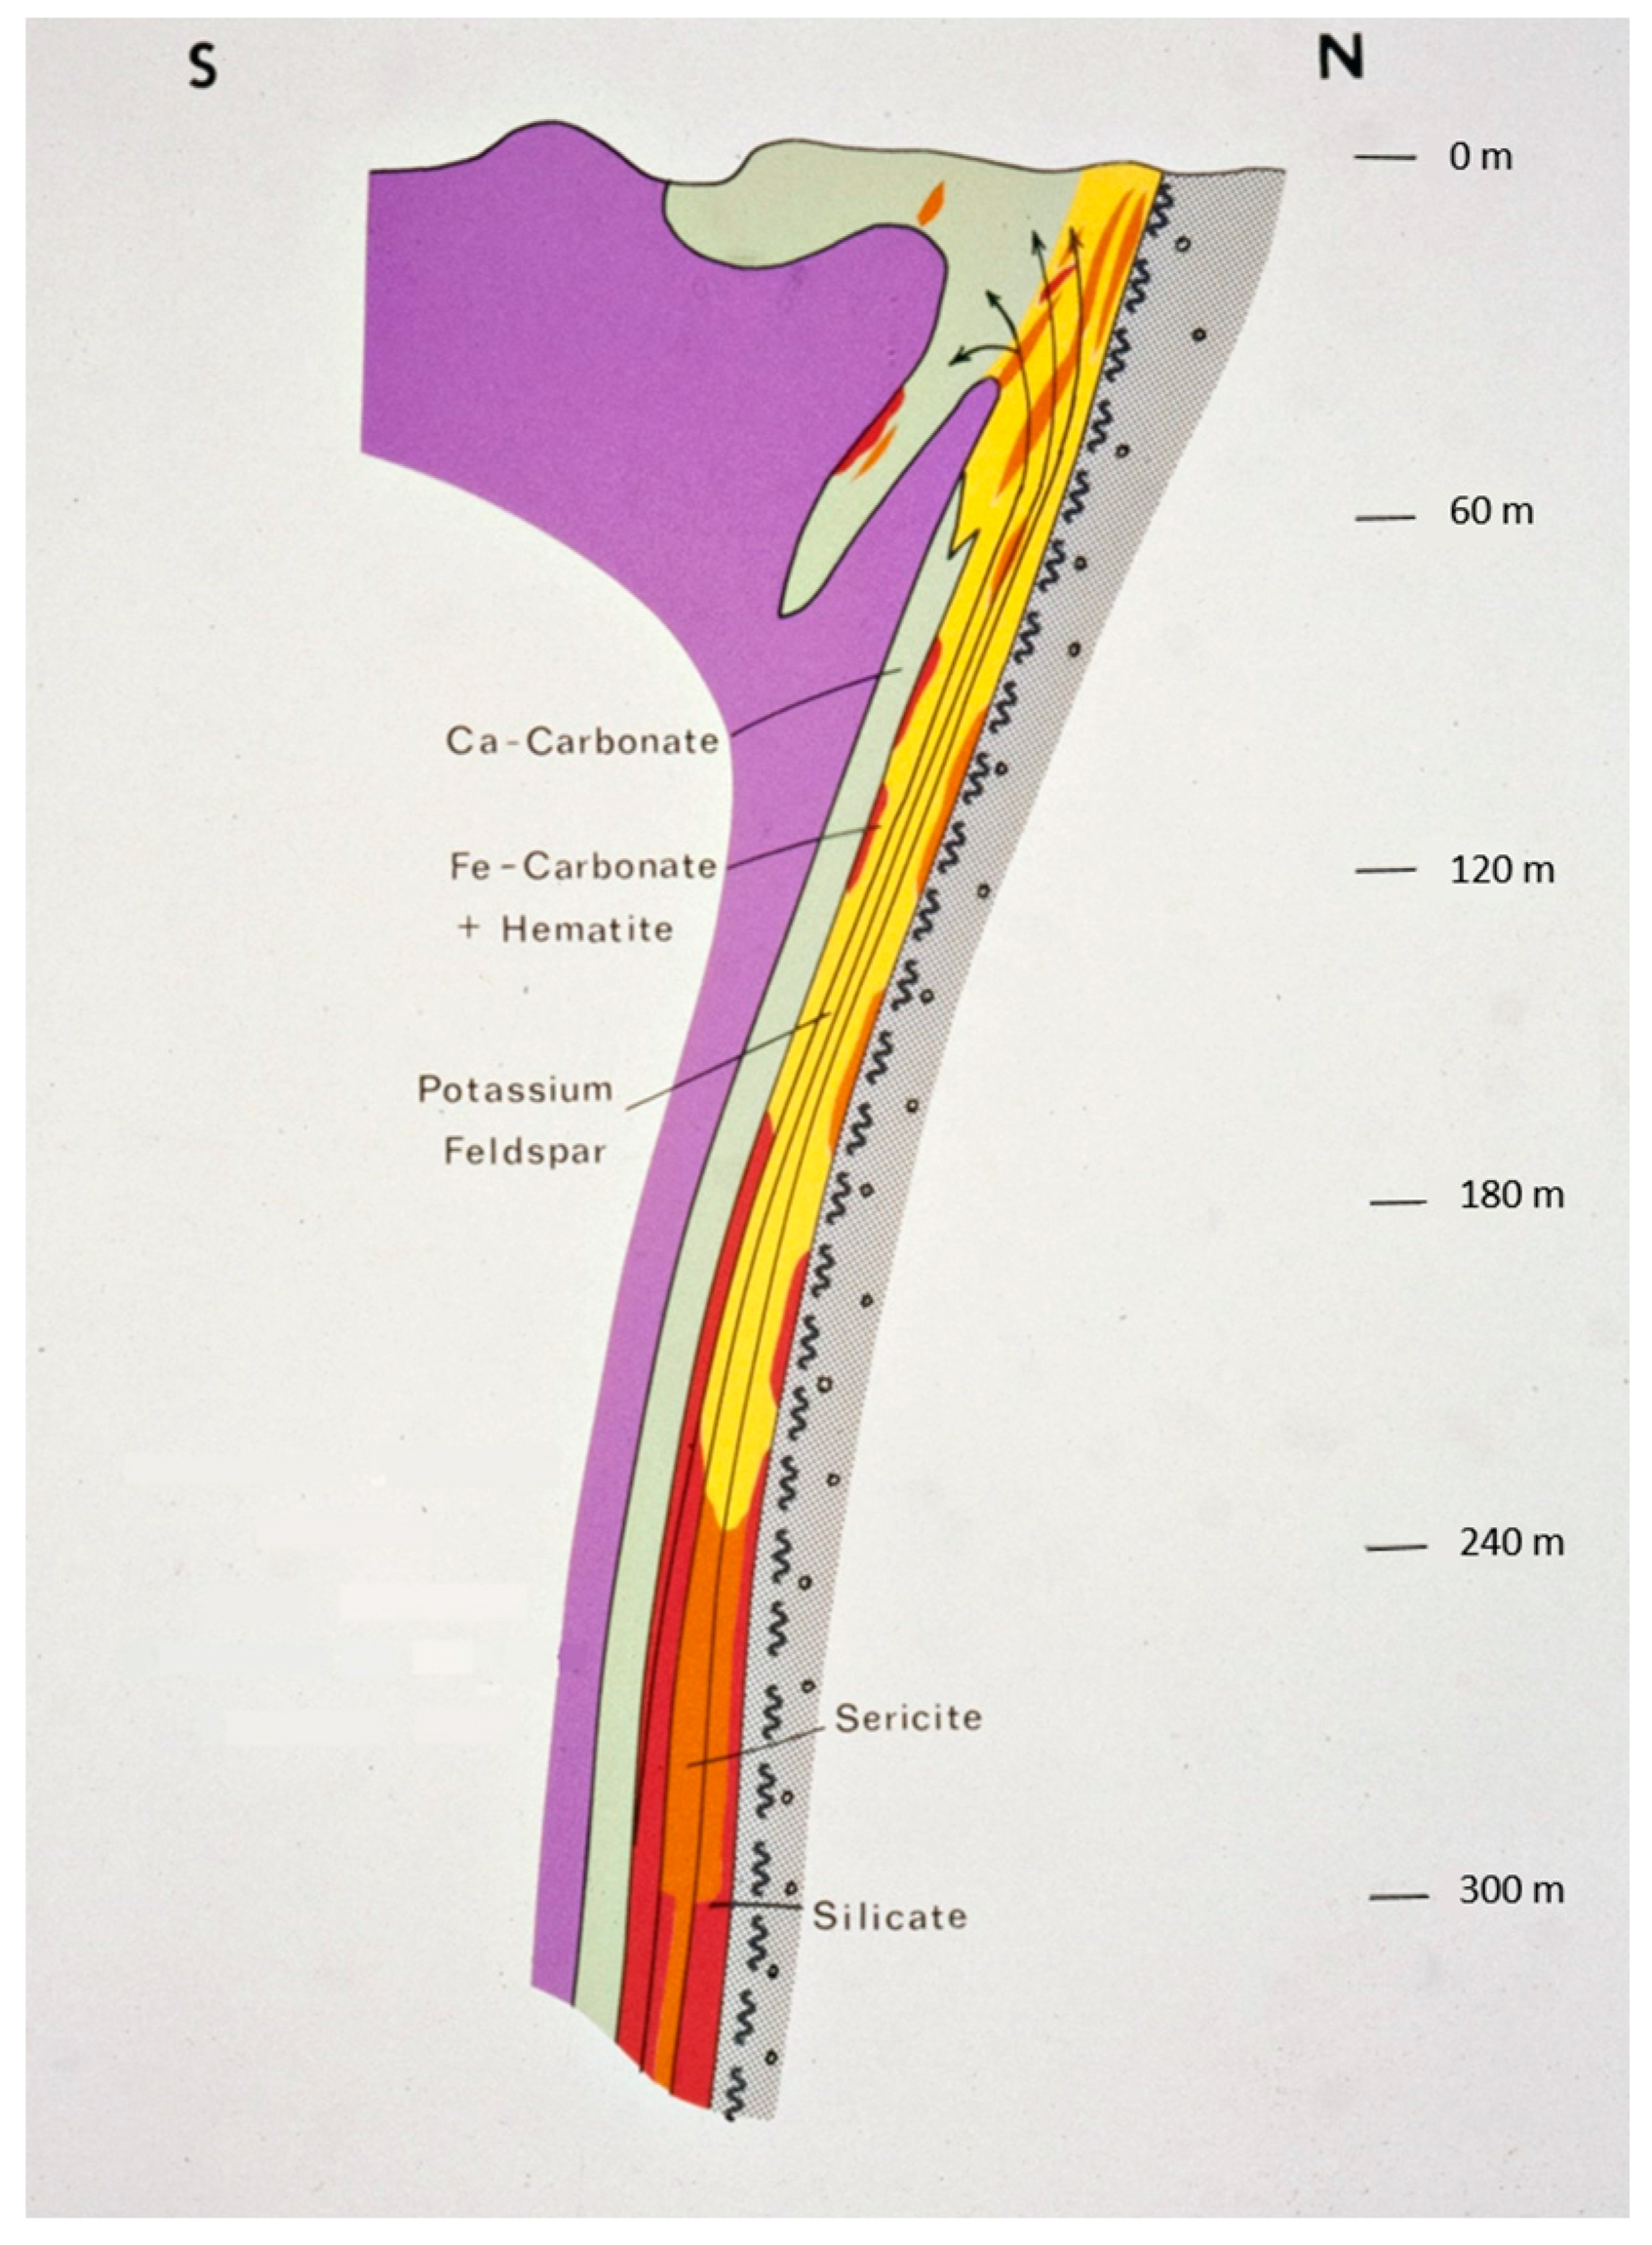
Figure 4.
Comparative homogenization temperatures of the stages at Brookbank and the Cherbourg Zone.
Figure 4.
Comparative homogenization temperatures of the stages at Brookbank and the Cherbourg Zone.


Figure 5.
The CO2-H2O system with the approximate position of inclusions homogenized to vapor for Brookbank and homogenized to liquid for the Cherbourg Zone. The values of mole percent CO2 are schematic based only on the homogenization temperatures of fluid inclusions. The effect of salinity is discussed in the text. Modified after [47]. Reproduced with permission from the Annual Reviews of Earth and Planetary Science; published by Annual Reviews.


Table 1.
Drill cores sampled, with depth of section sampled.
| Drill Hole | Maximum Depth (m) | Minimum Depth (m) |
|---|---|---|
| B49 | 189.1 | 154.5 |
| B56 | 226.2 | 203.3 |
| B58 | 265.8 | 241.4 |
| B53 | 303.9 | 271.3 |
| B43 | 323.7 | 306.9 |
| B50 | 417.3 | 399.0 |
| B54 | 512.1 | 497.4 |
| B61 | 586.1 | 581.3 |
| B46 | 768.0 | 743.7 |
Table 2.
Summary of fluid inclusion results.
| Stage | Brookbank | Cherbourg Zone |
|---|---|---|
| Stage 1A | 30 inclusions: type 1 and 3 Te: −22.0 to −22.9 Tm ice: −0.1 to −6.6 Th: 220.1 to 235.3 | 42 inclusions: type 1 and 3 Te: −21.1 to −22.9 Tm ice: −0.4 to −0.5 Th: 220.3 to 231.1 Tm clath *: 10.4 to 10.6 |
| Stage 1B | 15 inclusions: type 3 Te: −52.1 to −52.8 Tm ice: −0.3 to −0.8 Th: 230.1 to 266.4 | 35 inclusions: type 1 and 3 Te: −50.1 to −53.4 Tm ice: −0.4 to −0.5 Th: 229.3 to 231.0 |
| Stage 1C | 57 inclusions: type 1 and 3 Te: −55.0 to −55.9 Tm ice: −0.3 to −0.8 Th: 353.5 to 364.2 | Not observed |
| Stage 2 | 82 inclusions: type 4A and 4B Te: −33.9 to −35.8 Tm ice: 0.1 to −8.8 Th: 258.3 to 269.1 | 35 inclusions: type 4A and 4B Te: −35.0 to −35.9 Tm ice: −0.1 Th: 265.8 to 267.1 Tm clath *: 10.5 |
| Stage 3A | 40 inclusions: type 3 Te: −56.3 Tm ice: −0.7 to −8.3 Th: 32.3 to 32.9 | 8 inclusions: type 3 Te: −54.9 to −56.6 Tm ice: −0.9 Th: 32.0 to 55.9 Tm clath *: 10.4 |
| Stage 3B | Not observed | 23 inclusions: type 3 Te: −14.1 to −15.9 Tm ice: −1.1 to −1.2 Th: 21.6 to 69.8 |
* When observed.
Table 3.
Fluid inclusion terminology and types.
| Fluid Inclusion Terminology |
| Te = eutectic temperature Tm ice = melting temperature of ice Tm clath = melting temperature of clathrate Th = temperature of homogenization |
| Types of Fluid Inclusions (Phases present at room temperature) |
| Type 1: Laq + V Type 2: LCO2 + VCO2 Type 3: Laq + VCO2 + H2O Type 4A: Laq + : LCO2 + V Type 4B: Laq + : LCO2 + V + S |
| Laq = H2O + dissolved chloride S = unidentified unreactive solid |
Table 4.
Relative ages of cross-cutting veins.
| Sample No. | Th °C | Homog. Phase | Tm Ice °C | Relative Age | Stage * |
|---|---|---|---|---|---|
| BSK-B43-1043 | 266.5 | L | −0.5 | older | 2 |
| 32.5 | L | −0.9 | younger | 3A | |
| BSK-B46-2447 | 266.9 | L | −0.4 | oldest | 2 |
| 266.2 | L | −0.4 | younger | 2 | |
| 32.3 | V | −0.9 | younger | 3A | |
| 32.5 | L | −0.9 | youngest | 3A | |
| BSK-B46-2472 | 266.1 | L | −0.5 | oldest | 2 |
| 267.3 | V | −0.9 | younger | 2 | |
| 32.9 | V | −0.9 | younger | 3A | |
| 32.6 | V | −0.7 | youngest | 3A | |
| BSK-B58-826 | 268.2 | V | −0.5 | oldest | 2 |
| 266.4 | V | −0.4 | younger | 2 | |
| 32.9 | V | −4.3 | youngest | 3A | |
| BSK-B50-950 | 356.4 | V | −0.4 | older | 1C |
| 32.6 | V | −1.4 | younger | 3A |
* As determined by cross-cutting relationships.
Table 5.
Raman spectra results from Cherbourg Zone sample BSK-C-0+95E-2.
| Inclusion No. | Inclusion Type | Stage | Te | Tm Ice | Th | Homog Phase | Tm Clath | Phases Detected |
|---|---|---|---|---|---|---|---|---|
| 1 | 3 | 1 | −21.8 | −0.4 | 221.4 | L | 10.5 | CO2 |
| 2 | 3 | 1 | −21.8 | −0.4 | 221.4 | L | 10.5 | CO2 |
| 3 | 4A | 2 | −35.3 | −0.1 | 266.2 | V | - | H2O |
| 4 | 4A | 2 | −35.3 | −0.1 | 266.1 | V | - | H2O |
| 5 | 4A | 2 | −35.2 | −0.1 | 266.3 | V | - | H2O, N2 |
| 6 | 3 | 3 | −15.9 | −1.1 | 66.6 | L | - | CO2, N2 |
| 7 | 3 | 3 | −15.9 | −1.1 | 66.3 | L | - | CO2, N2 |
© 2018 by the authors. Licensee MDPI, Basel, Switzerland. This article is an open access article distributed under the terms and conditions of the Creative Commons Attribution (CC BY) license (http://creativecommons.org/licenses/by/4.0/).
Share and Cite
MDPI and ACS Style
Kowalski, B.; Kissin, S. A Fluid Inclusion Study of the Brookbank Deposit, Northwestern Ontario: A Transition from Mesothermal to Epithermal Gold Deposition. Minerals 2018, 8, 92. https://doi.org/10.3390/min8030092
AMA Style
Kowalski B, Kissin S. A Fluid Inclusion Study of the Brookbank Deposit, Northwestern Ontario: A Transition from Mesothermal to Epithermal Gold Deposition. Minerals. 2018; 8(3):92. https://doi.org/10.3390/min8030092
Chicago/Turabian StyleKowalski, Barbara, and Stephen Kissin. 2018. "A Fluid Inclusion Study of the Brookbank Deposit, Northwestern Ontario: A Transition from Mesothermal to Epithermal Gold Deposition" Minerals 8, no. 3: 92. https://doi.org/10.3390/min8030092
Note that from the first issue of 2016, this journal uses article numbers instead of page numbers. See further details here.