
Sharp Polarimetric Eyes: More Trees than Forest?

Steward Observatory, University of Arizona, Tucson, AZ 85721, USA
Galaxies 2016, 4(3), 27; https://doi.org/10.3390/galaxies4030027
Submission received: 14 July 2016
/
Revised: 29 August 2016
/
Accepted: 30 August 2016
/
Published: 7 September 2016
(This article belongs to the Special Issue Blazars through Sharp Multi-wavelength Eyes)
Abstract
:The Fermi Gamma-ray Space Telescope (Fermi) has focused the intensive multi-wavelength and international observational effort on blazars since it was launched in 2008. Part of this effort involves systematic monitoring of the highly variable polarization of the continuum emission from these objects. These observations are valuable in that they provide direct information on the degree of ordering and orientation on the sky of the magnetic field within the non-thermal emission region(s). Unfortunately, it is not yet possible to measure the polarization of the inverse-Compton continuum, only that of the lower-energy synchrotron emission. The inability to directly compare the polarization of the two dominant continuum sources in blazars is a drawback and leads to more ambiguities in determining their relative locations. There are many compelling examples of strong connections between γ-ray, X-ray, UV/optical/IR, and radio behavior in blazars that suggest the same region produces much of the observed emission at all wavelengths at least some of the time. However, the wealth of polarization behavior seen relative to flux changes invariably results in a complex situation that is difficult to interpret and model. The long-term blazar monitoring program undertaken at Steward Observatory is designed to primarily obtain accurate optical polarimetry of γ-ray-bright blazars during the Fermi mission with the goal of gaining important insights into the jet structure and physics of these objects. Data from this program are available to all researchers as soon as reductions are completed. I briefly detail the current status and progress of the program and the data products available. Although the wide variety of polarization behavior in blazars adds another layer of complexity to an already difficult problem, I summarize several important conclusions that can be drawn from the polarization information gathered during the Fermi era.
1. Introduction
The Large Area Telescope (LAT) aboard the Fermi Gamma-ray Space Telescope (Fermi) [1,2] has been monitoring the γ-ray sky for eight years and has been the focus of important studies of blazars, the dominant source of extragalactic MeV–GeV photons in the universe. In response to the opportunity that Fermi presents to the study of blazars, a major effort has been mounted to support the high-energy observatory with observations of γ-ray-bright blazars ranging from the TeV to centimeter radio energy bands so that the evolution of the spectral energy distributions (SEDs) of these active galactic nuclei (AGNs) can be examined in relation to the constant monitoring provided by Fermi. Steward Observatory (SO) of the University of Arizona has contributed to this effort by providing a fully public, systematic long-term optical spectropolarmetric, spectrophotometric, and photometric monitoring program of blazars that Fermi can detect on time scales of a few days or less [3]. Some of the results of this optical program and the issues raised by the polarization monitoring of blazars are discussed below. Data products of the Fermi/SO program are furnished to all researchers at: http://james.as.arizona.edu/~psmith/Fermi.
2. Facilities, Instrumentation, and Observations
Observations for the Fermi/SO blazar monitoring program began on 3 October 2008 (all dates in this article are UTC), a few months after the launch of the γ-ray observatory. Since then, data have been obtained for γ-ray-bright blazars during 648 nights through 1 August 2016. Two SO telescopes have primarily been used: the 2.3 m Bok Telescope located on Kitt Peak, AZ (324 nights) and the 1.54 m Kuiper Telescope on Mt. Bigelow, AZ (312 nights). Additional observations have been made during portions of 12 nights on the 6.5 m MMT, a facility jointly operated by the University of Arizona and the Smithsonian Institution. These data were obtained during brief gaps in unrelated science programs.
All of the observations for this program are made using the SPOL CCD photo-/spectropolarimeter [4]. The instrument is a highly portable, dual-beam polarimeter employing a wave plate (either λ/2 or λ/4) that is rotated to modulate incident polarization and a Wollaston prism to split the complementary polarizations. The detector is a SITe 800 × 1200 px2, thinned, and anti-reflection-coated CCD with a peak quantum efficiency of nearly 1 at ~6500 Å. Usually, a 600 lines/mm grating, covering 4000–7550 Å in first order and yielding a resolution of 15–20 Å is used for spectropolarimetry. Of the spectropolarimetric measurements obtained with the MMT, a majority employ a 954 lines/mm grating instead, covering 4100–7000 Å with a resolution of ~10 Å. In addition, a relatively small number of imaging polarimetry measurements have been made during the program at all of the telescopes, particularly in the first few years of monitoring. For these observations, the grating was replaced by a plane mirror in the instrument. At the Bok and Kuiper telescopes, a V-band filter was used. At the MMT, a variety of narrow bandpass filters were used depending on the needs of the primary science program scheduled for that night.
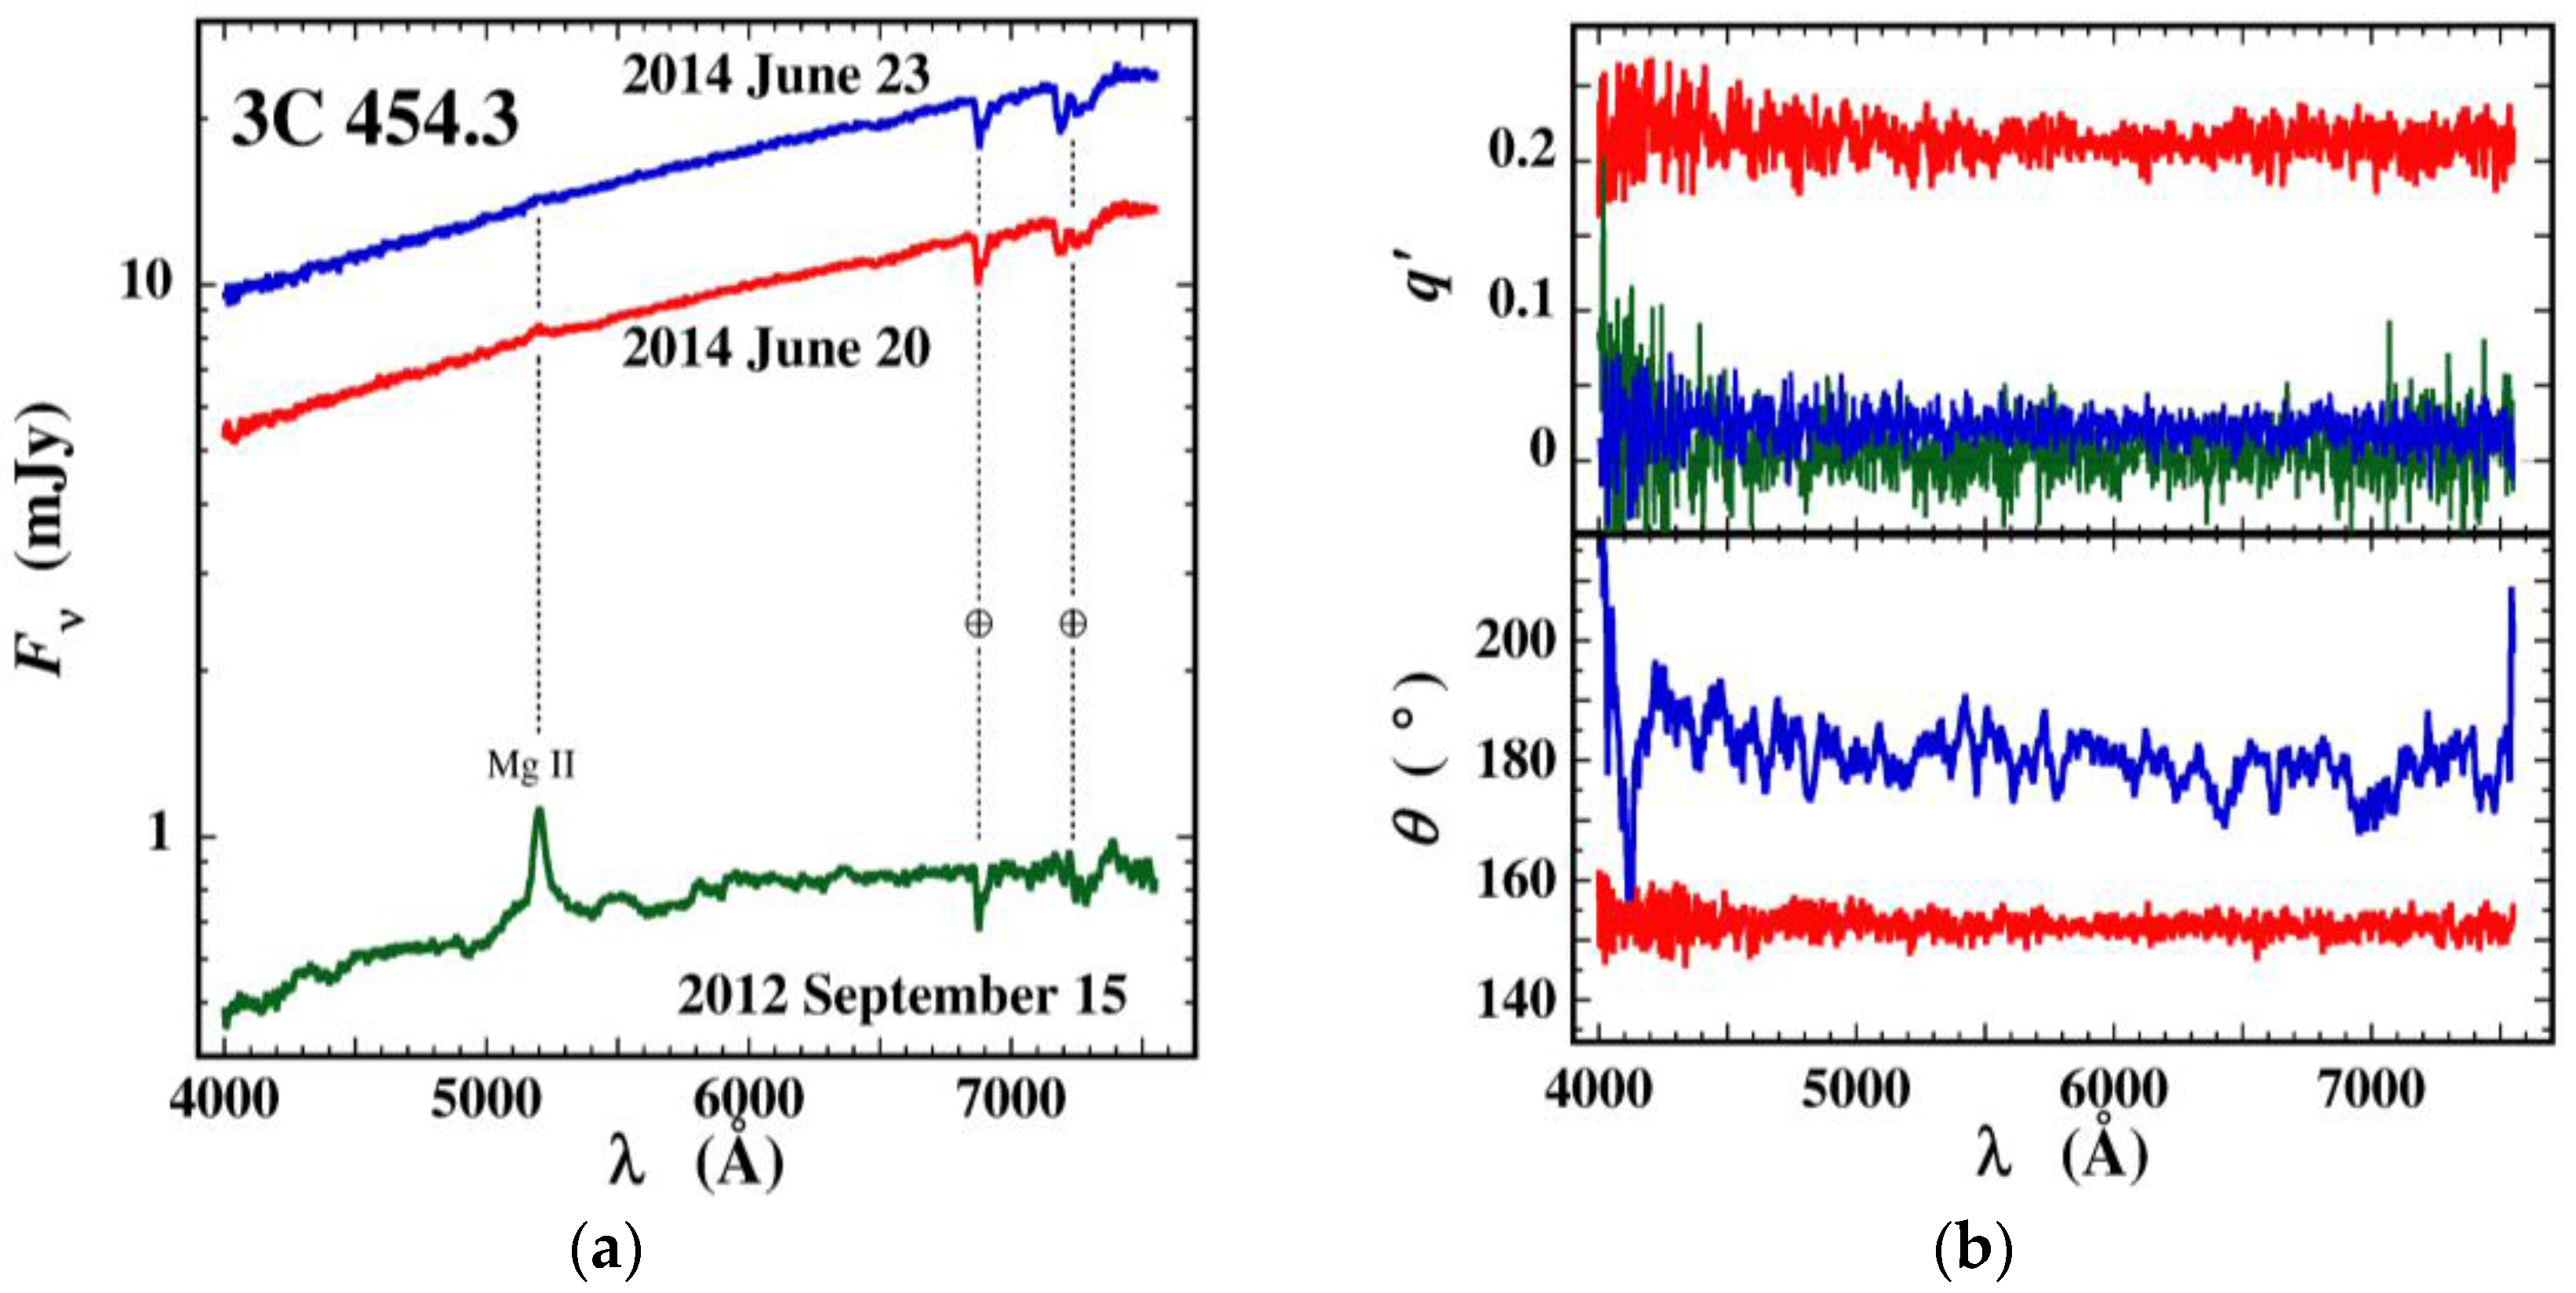
Three examples of individual observations of a blazar are shown in Figure 1. The primary data products are a calibrated flux spectrum and spectra of the linear polarization Stokes parameters (q and u). The Stokes spectra can be used to construct the spectra of the fractional degree of linear polarization (P, where P2 = q2 + u2) and the position angle of the polarization (θ, where θ = ½ tan u/q). All values of P quoted have been corrected for statistical bias using the prescription suggested by Wardle and Kronberg [5]. In Figure 1, the rotated Stokes parameter, q' = q cos 2θ + u sin 2θ, is shown to avoid the statistical bias in P, which is generally more pronounced when P is near 0%, as in the cases for 15 September 2012 and 23 June 2014 for 3C 454.3.
For ~80% of the entire polarization data archive, weather conditions were good enough to obtain differential spectrophotometric measurements using comparison stars in the fields of the monitored blazars. In many cases, the comparison stars have been calibrated and apparent V and R magnitudes can be determined. For objects where no calibration for the field stars is currently available, differential magnitudes are reported. All V measurements are available for the entire program. At present, R-band photometry of the blazar sample is available from September 2010 onward, although it is planned to derive R light curves spanning the entire SO program by the end of the optical monitoring.
The optical monitoring program is generally comprised of monthly observing campaigns that are 7–10 nights long. The campaigns avoid bright lunar phases so that faint (V ~ 18) targets can still be observed. The telescopes are closed during August because of the annual summer “monsoon” season in Arizona, so usually 11 campaigns are mounted each year for the program. From October 2008–July 2016, 85 observing campaigns have been completed. In total, 9834 polarization measurements together with 7832 flux measurements have been made for ~60 blazars.
3. Results
3.1. Variability
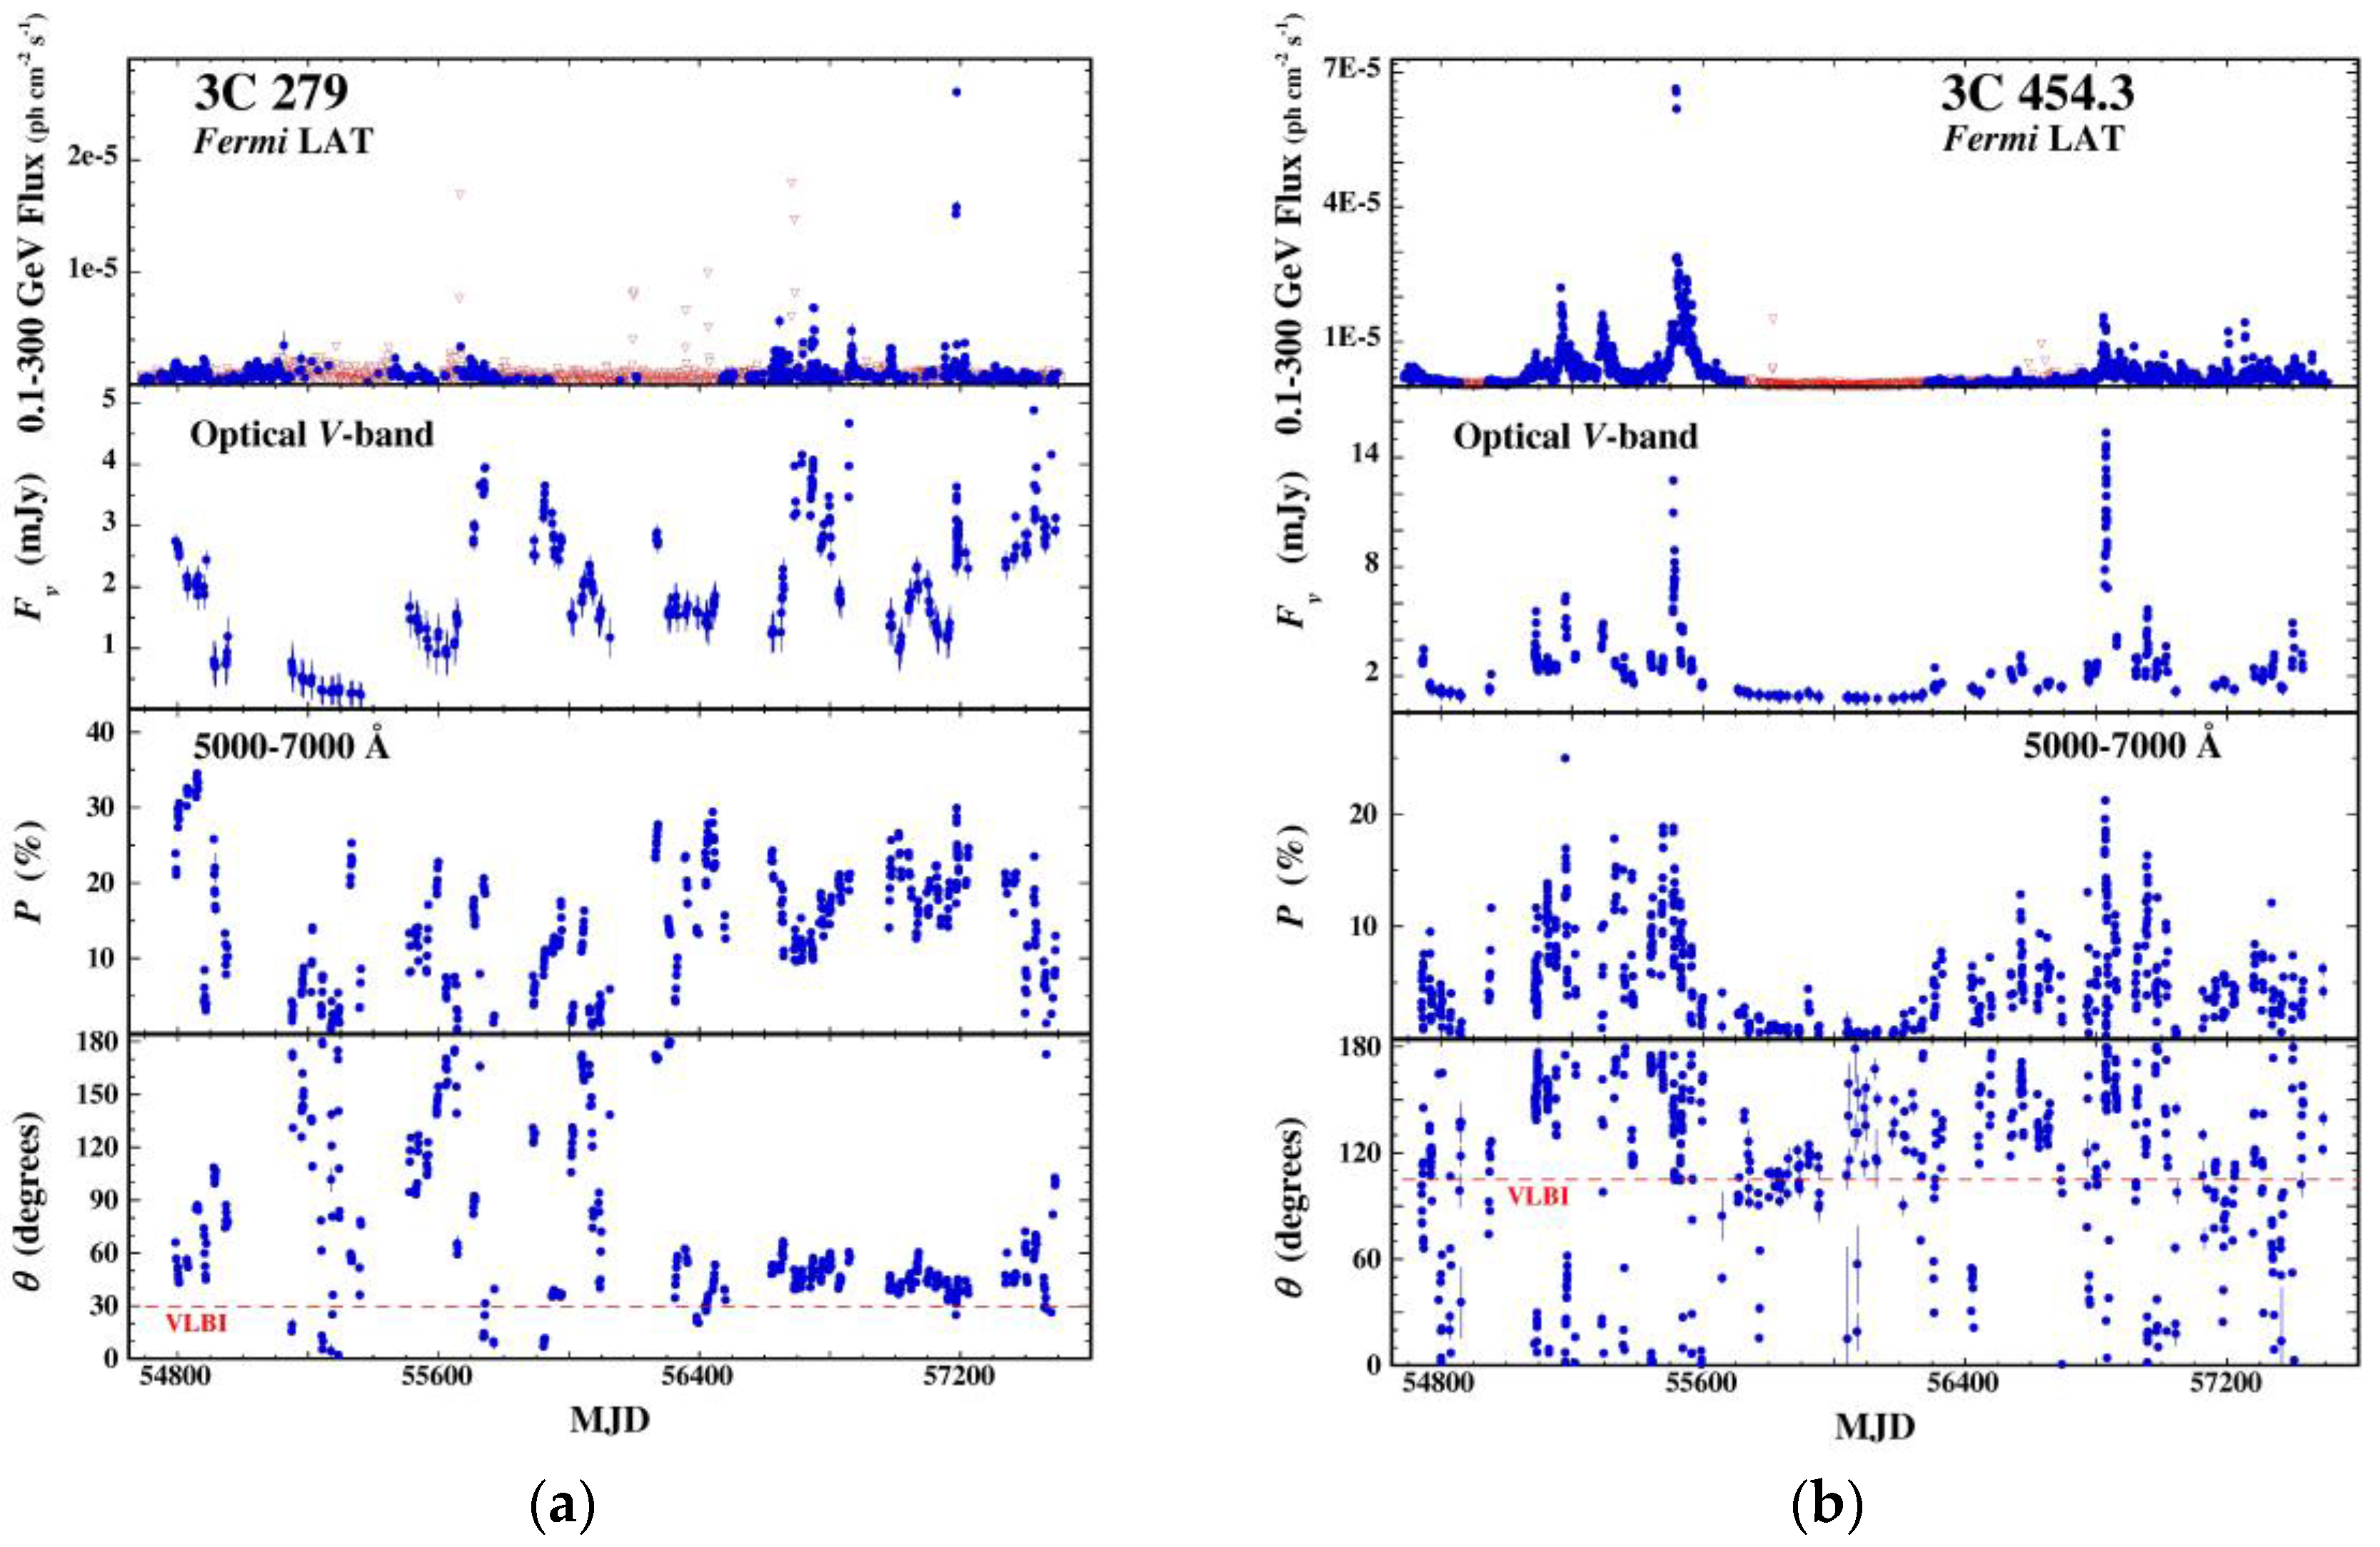
One of the main goals of the SO program is to systematically monitor polarization and flux variability on both daily and longer-term time scales for direct comparison to the high-energy flux variations observed by Fermi. Figure 2 gives examples of the long-term monitoring of the blazars 3C 279 and 3C 454.3.
Each object shows a rich history of both flux and polarization variability over the first eight years of the Fermi mission and each has undergone a brief but very bright γ-ray outburst. Differences in the long-term optical behavior of the two blazars are readily apparent. 3C 279 is generally more highly polarized than 3C 454.3, showing many periods when P = 20%–30%, whereas P > 20% has been seen on only two brief occasions for 3C 454.3. However, 3C 454.3 shows a stronger correlation between γ-ray flux and optical flux and polarization. High optical polarization and flux are only seen when the object can be detected by Fermi on daily time scales and much stronger polarization variability is seen when the blazar is optically and γ-ray bright. In addition, the chaos seen in the linear polarization variations observed in 3C 279 during the first four years of monitoring largely disappears during the next 3–4 years, with P = 10%–30% and θ remaining stable and roughly parallel to the high-frequency VLBI jet position angle even through major γ-ray and optical outbursts. 3C 454.3, in contrast, only shows relatively stable polarization during a period of γ-ray and optical quiescence, with θ remaining close to the position angle of the VLBI jet.
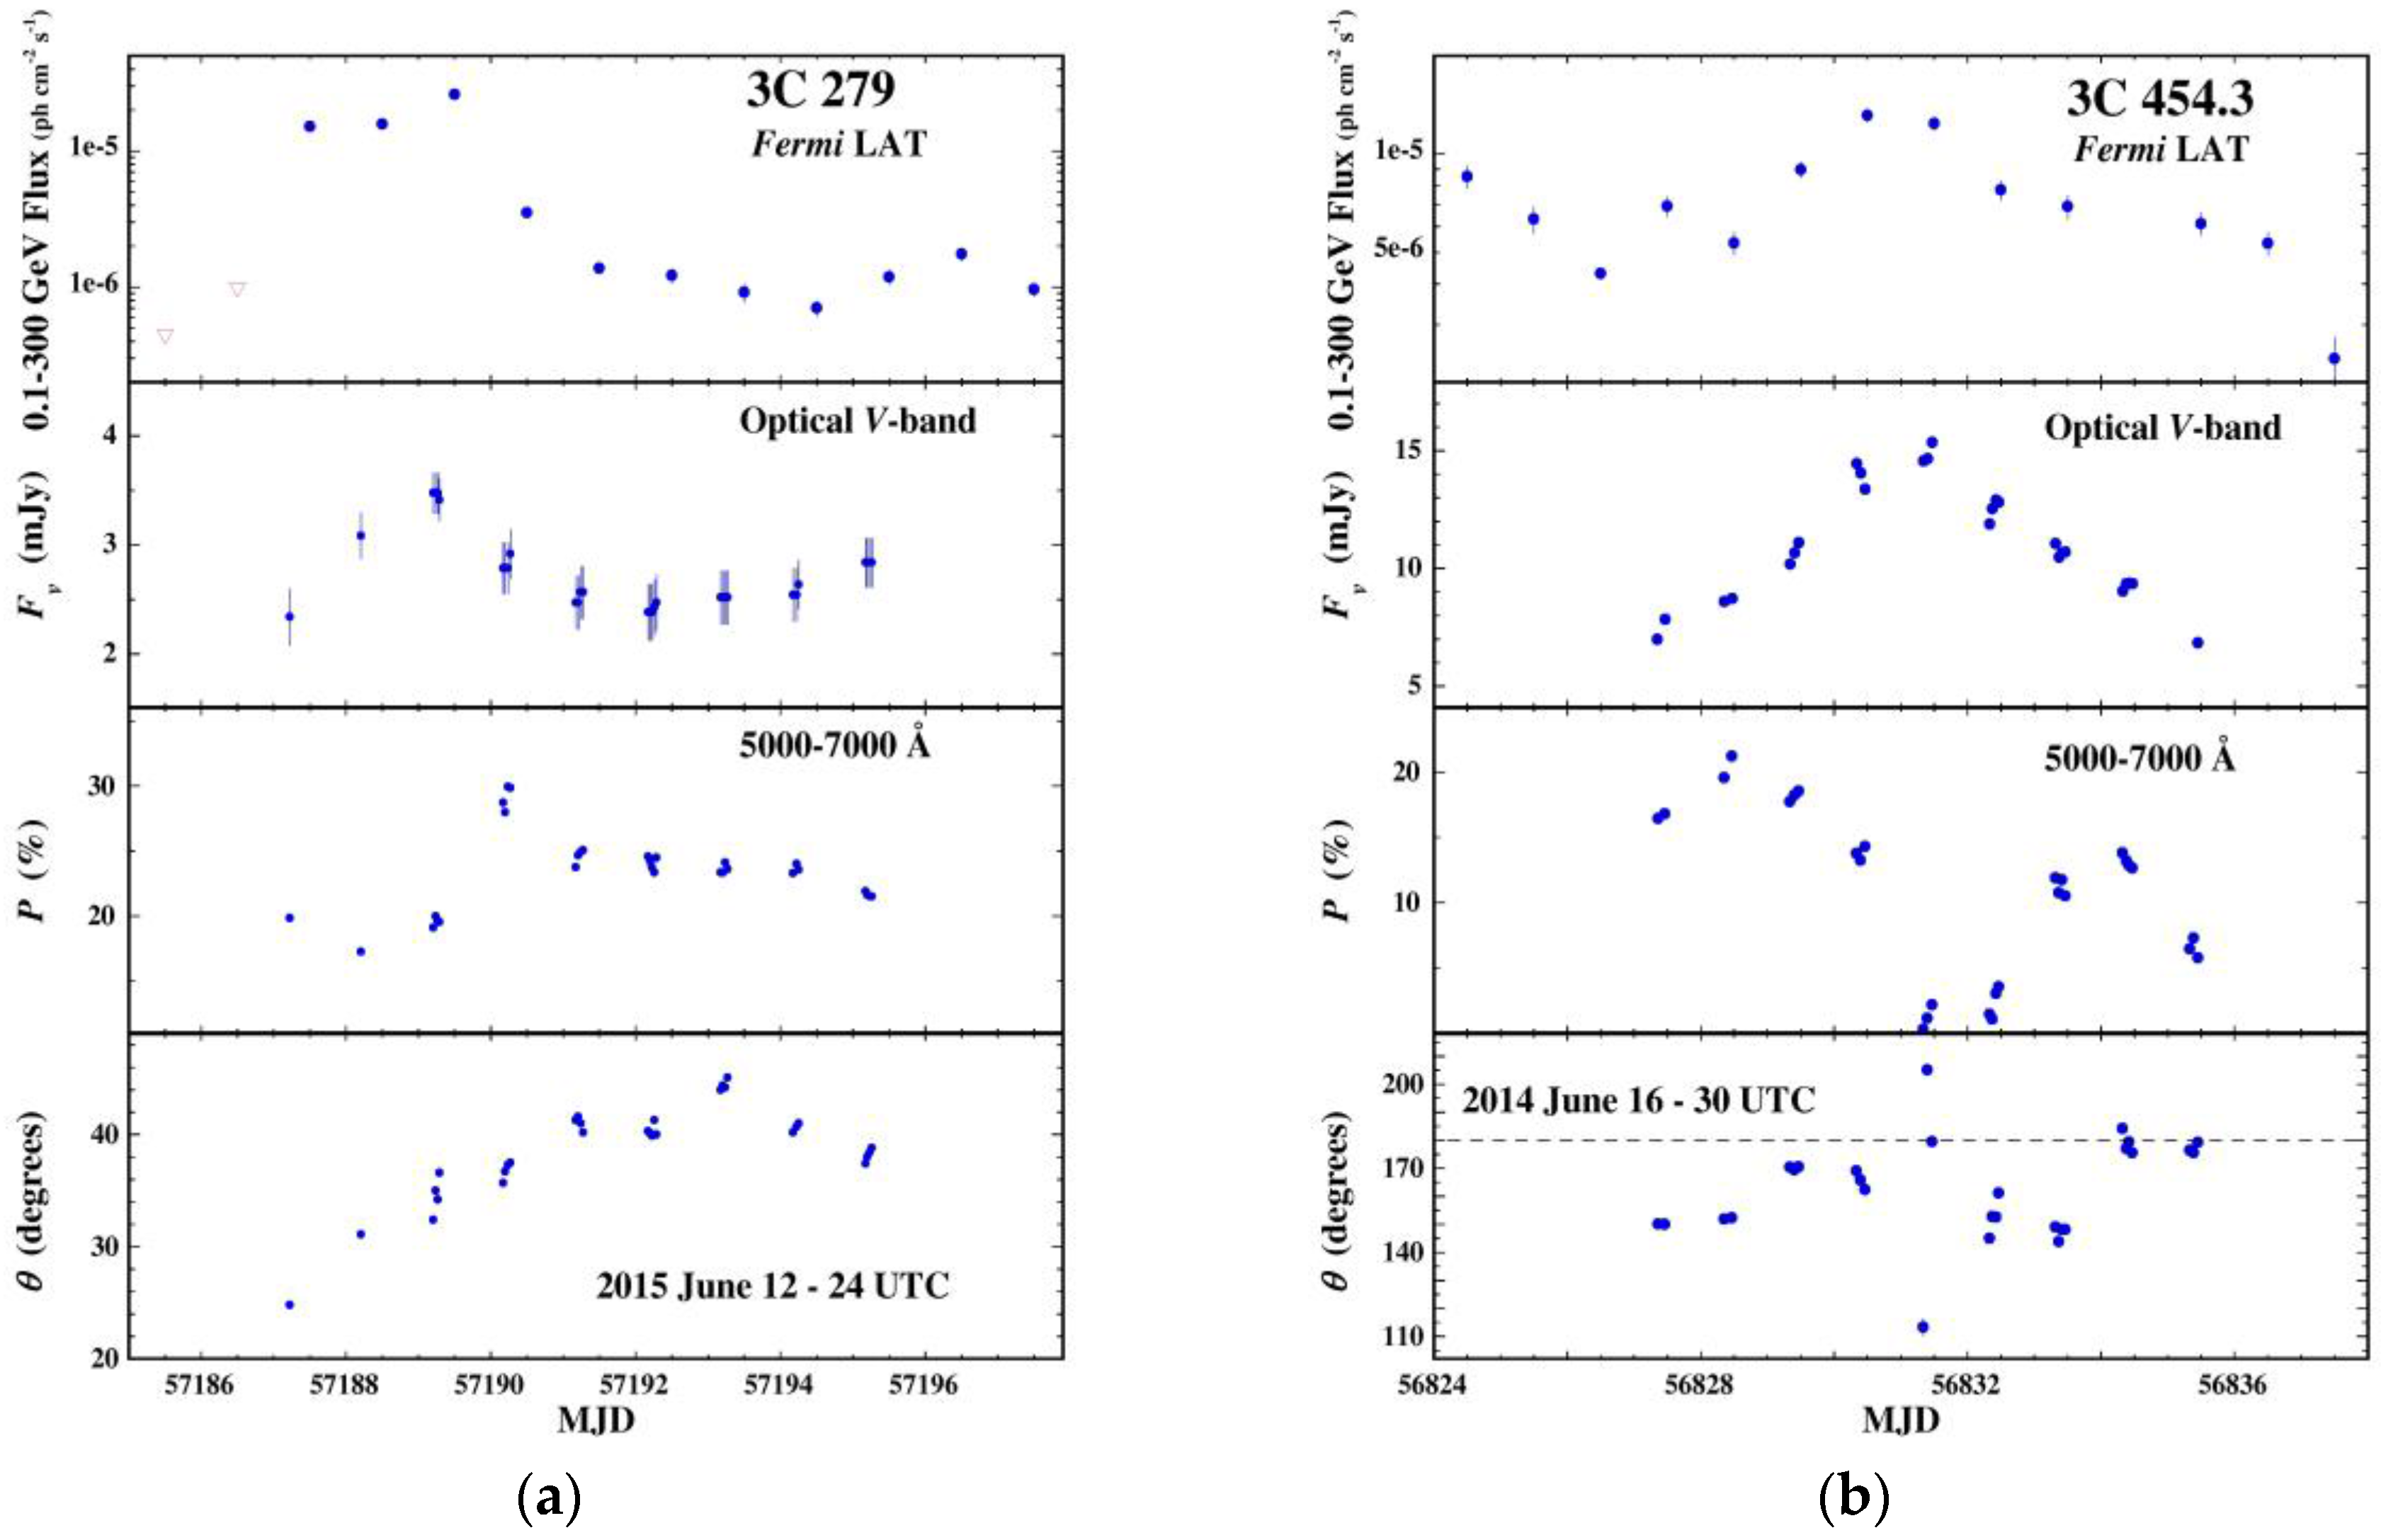
Differences in the optical polarization behavior of these two blazars can be further explored by comparing observations made during major γ-ray/optical outbursts. Figure 3 displays the γ-ray and SO optical data for 3C 279 made during the largest γ-ray outburst to date for this blazar and 3C 454.3 during the first major γ-ray/optical outburst after ~3 years of relative inactivity. For 3C 279, the γ-ray and optical flux peaks are coincident to within a day, but the polarization reaches an apparent maximum of ~30% the day after the flux peak. Throughout the outburst, P remained high (20%–30%) and θ remained close to the position angle of the inner radio jet and rotated quite smoothly from 25°–45° before reversing its direction during the last two days of the observing campaign.
During the 2014 June outburst of 3C 454.3, the γ-ray and optical flux peaks appear to be coincident as in 3C 279. The behavior of P, however, is radically different. Instead of reaching a maximum in polarization around the time of peak flux, the object becomes nearly unpolarized. The decline is rapid, taking only ~3 days for P to drop from 20% to near 0%. The polarization recovers to ~15% just as rapidly after the peak of the outburst. This behavior is consistent with that seen during major outbursts of 3C 454.3 earlier in the Fermi mission, suggesting that the same location and/or the same physical mechanism in the jet gives rise to strong outbursts [6].
The polarization differences between these two blazars suggests that the emission from the outbursts originates in regions with very different magnetic field geometries. The magnetic field in the flaring region has a high degree of ordering in 3C 279, whereas a magnetically more turbulent flow yields the low polarization observed in 3C 454.3 [7]. Alternatively, our line of sight to the active region of the jet may become closer to the jet axis for 3C 454.3, resulting in both a flux peak and a polarization minimum if the magnetic field has a symmetry axis that is along the jet axis (e.g., a helical field).
3.2. Polarization as a Function of Wavelength
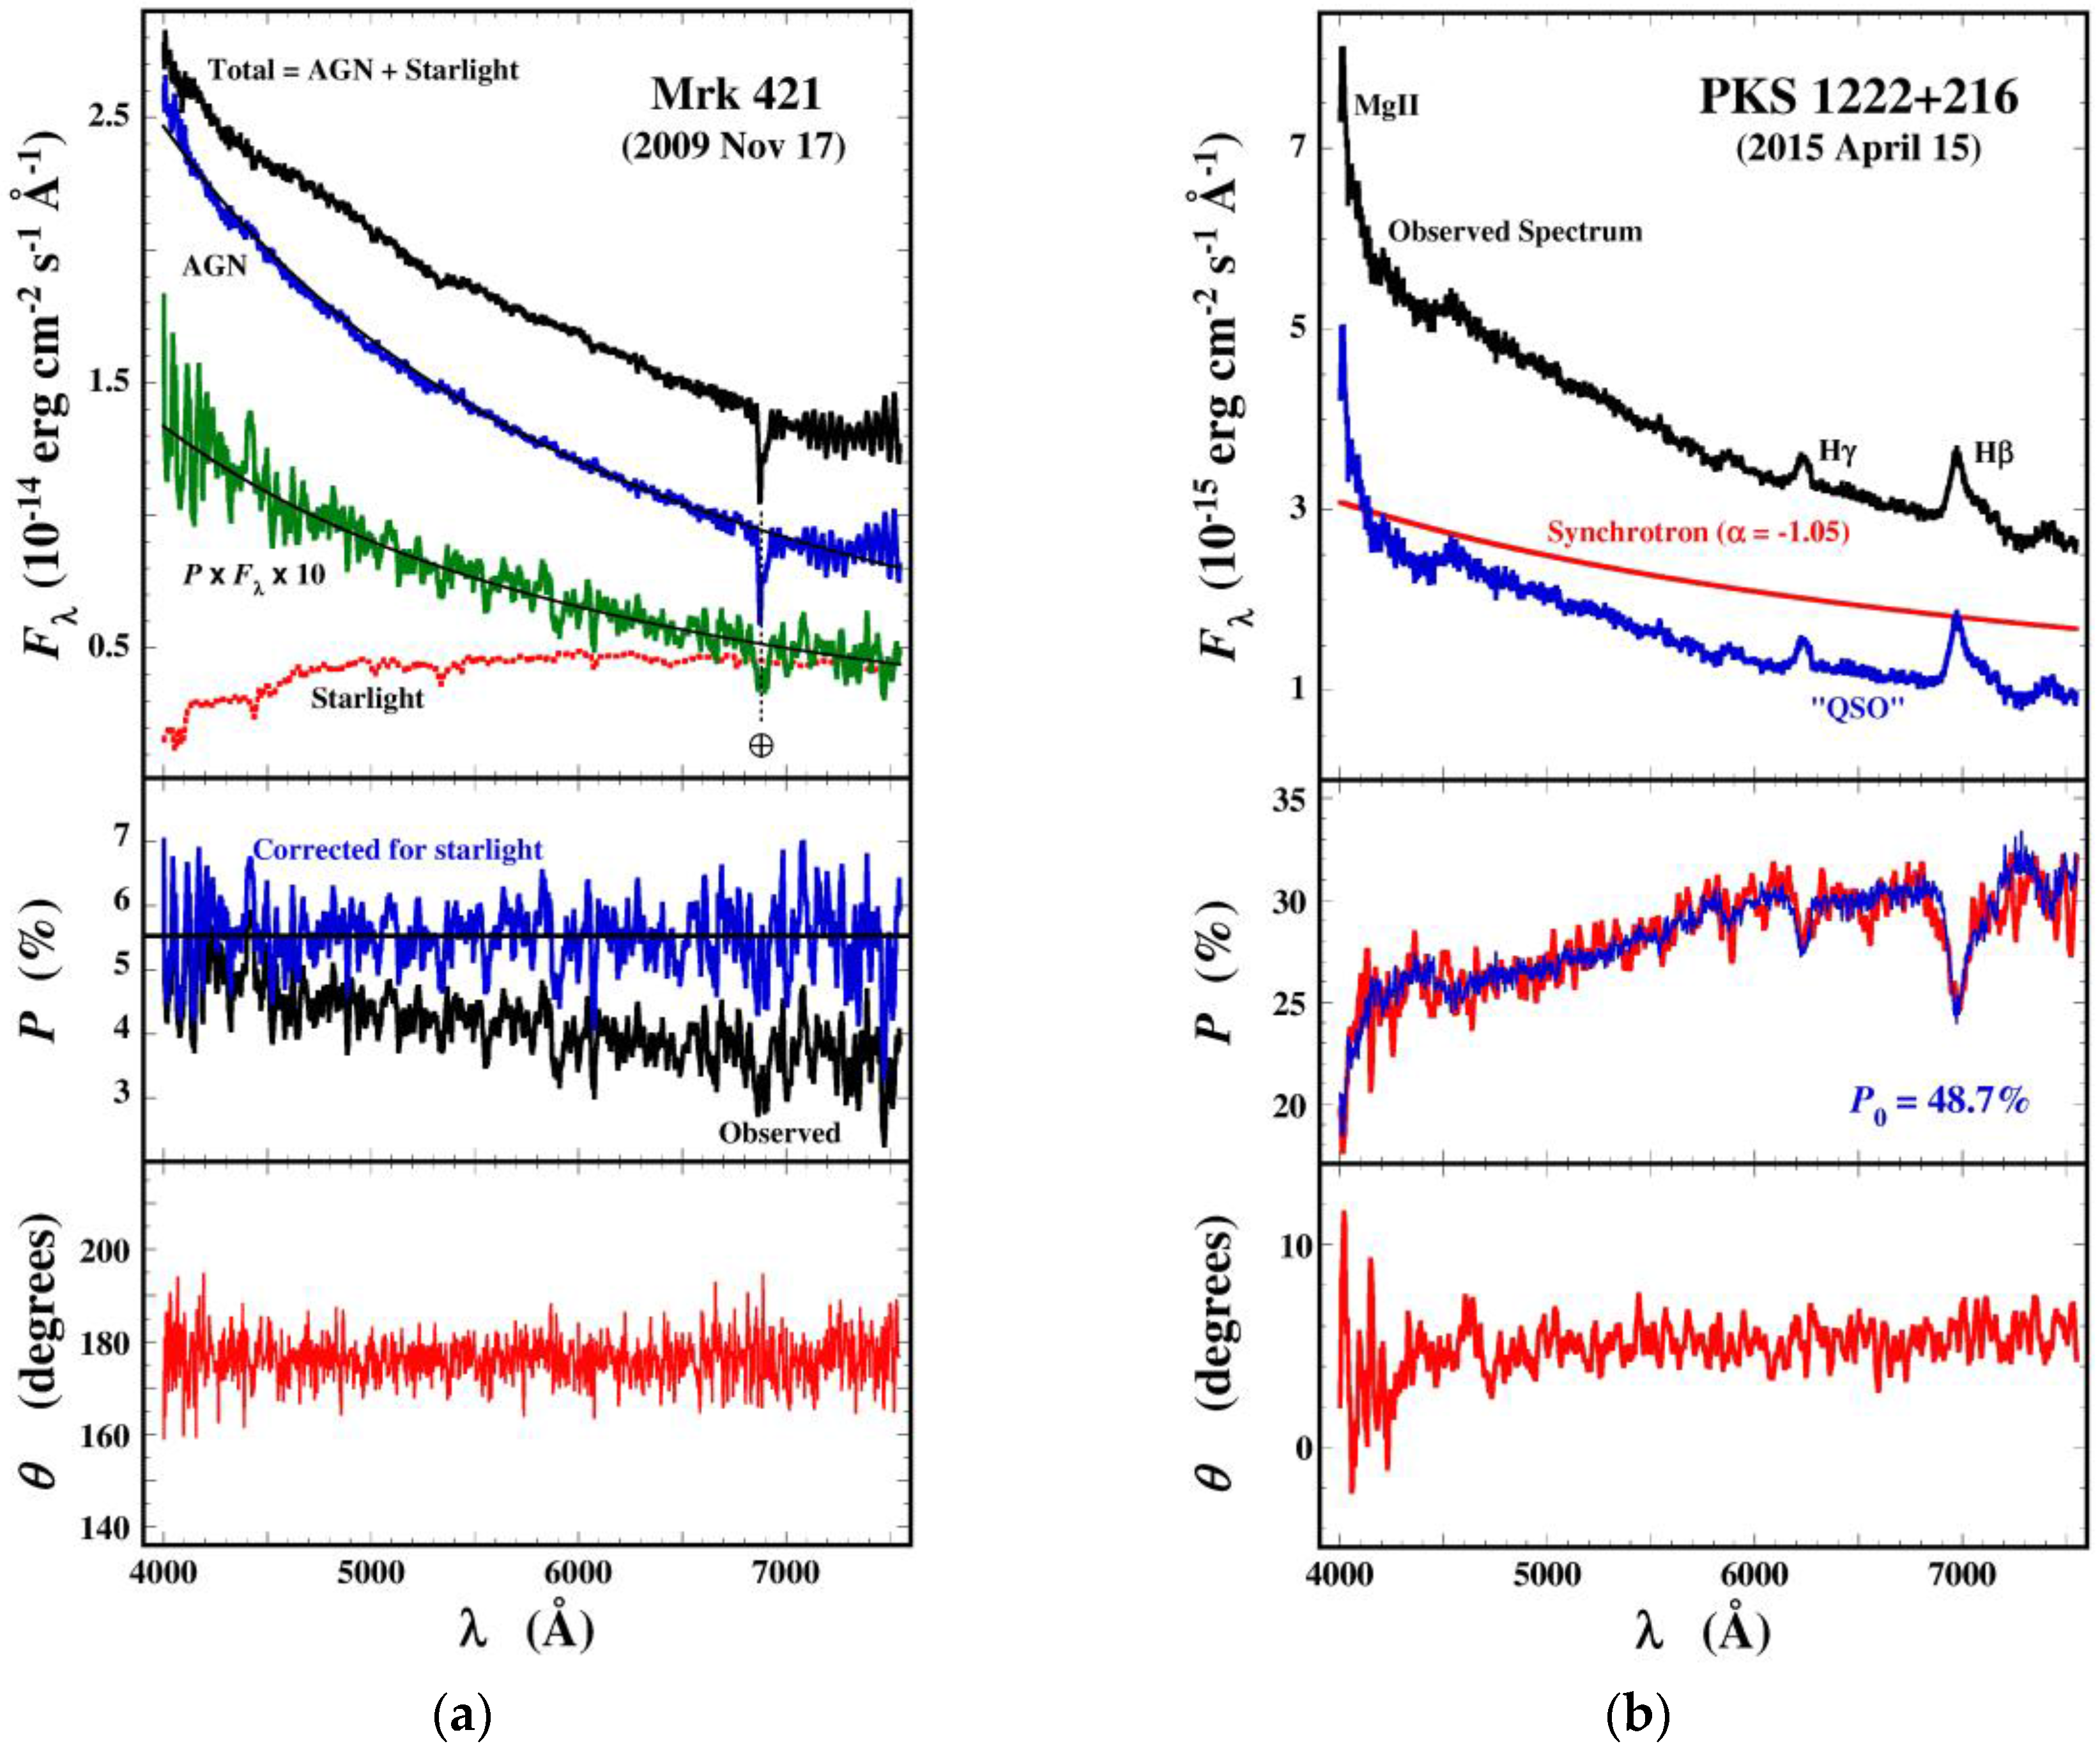
One of the unique strengths of the Fermi/SO monitoring program is the spectral information provided by the observations. For the flux spectra, a byproduct of the spectropolarimetry, studies have examined the level of variability observed in the broad emission lines of several flat-spectrum radio quasars (FSRQs) [8,9,10,11]. In addition, the data can be used to document differences and changes in the slopes of both the total and polarized continua. Another aspect of the spectral information available is the ability to identify multiple optical emission sources through their polarization signatures. Several objects in the γ-ray-selected sample are low-redshift BL Lac objects (e.g., Mrk421, Mrk501, BL Lac) with discernible contributions made to the observed optical emission by starlight from their host galaxies. In general, the late-type host galaxy spectrum is redder than the blazar continuum and as a result, the observed polarization decreases to the red as the galaxy host contributes more to the overall flux. This signature can be used to help disentangle the starlight from the non-thermal emission of the AGN, which is particularly useful in cases where stellar absorption features are significantly diluted by the blazar. For example, an observation of Mrk421 is shown in Figure 4a, and the spectrum has been decomposed to isolate the unpolarized stellar and polarized blazar components. With the single assumption that the blazar's intrinsic polarization is independent of wavelength (equivalent to the polarized and total AGN flux spectra having the same spectral index), the model indicates an intrinsic polarization of 5.5% and weak stellar absorption features are removed from the blazar continuum.
For powerful FSRQs, the contribution of the host galaxy within the observing apertures is not significant. Instead, many of these objects within the sample (e.g., PKS 0736+01, OJ248, PKS 1222+216, PKS 1510-08, B2 1633+382, 3C 454.3) are seen to harbor a blue, unpolarized continuum because of the fact that there is a systematic increase in P with wavelength (e.g., [12]). An observation of PKS 1222+216 made during a period of extremely high polarization that illustrates the polarization signature seen in many FSRQs is displayed in Figure 4b. A relatively stable, unpolarized QSO-like component dilutes the polarization of the jet and accounts for the wavelength dependence in P seen in the middle panel of the figure. As seen in other FSRQs, the emission lines are also not polarized. For PKS 1222+216, the relative contributions of the two continuum components and the strength of the wavelength dependence in P suggests an intrinsic synchrotron polarization of nearly 49% for the blazar. If the model is valid, this is the highest level of optical polarization seen for this class of AGNs. Using SO monitoring data, the blue spectral component has been polarimetrically identified into the ultraviolet out to C IV λ1550 in B2 1633+382 (z = 1.814) [13].
Furthermore, the existence of the two components leads to some of the strongest optical flux, color, and linear polarization correlations observed during program. Figure 5 shows two long-term trends for PKS 1222+216. The correlations displayed are as expected if the observed optical emission comprises both a highly variable synchrotron continuum and a much less variable and unpolarized “QSO” component, which presumably is the thermal emission from an accretion disk and the emission-line regions.
The previous two examples of wavelength-dependent polarization enable the isolation of non-beamed emission sources in blazar spectra. This, in turn, allows for the intrinsic properties of the beamed jet emission to be determined and compared to the behavior seen in other energy regions of the overall SED. There is another class of wavelength-dependent polarization observed that may probe the structure and conditions within the emission region(s) of the jet itself. Transitory episodes of wavelength dependence in P and/or θ are seen in many blazars, but most easily the BL Lac objects whose spectra are not complicated by QSO-like emission sources as in the FSRQs. The rapid evolution of the wavelength dependence and the fact that the polarization position angle can rotate with wavelength (a feature that cannot be explained by unpolarized emission sources) suggest that substructure within the non-thermal emission region and/or multiple regions is being observed.
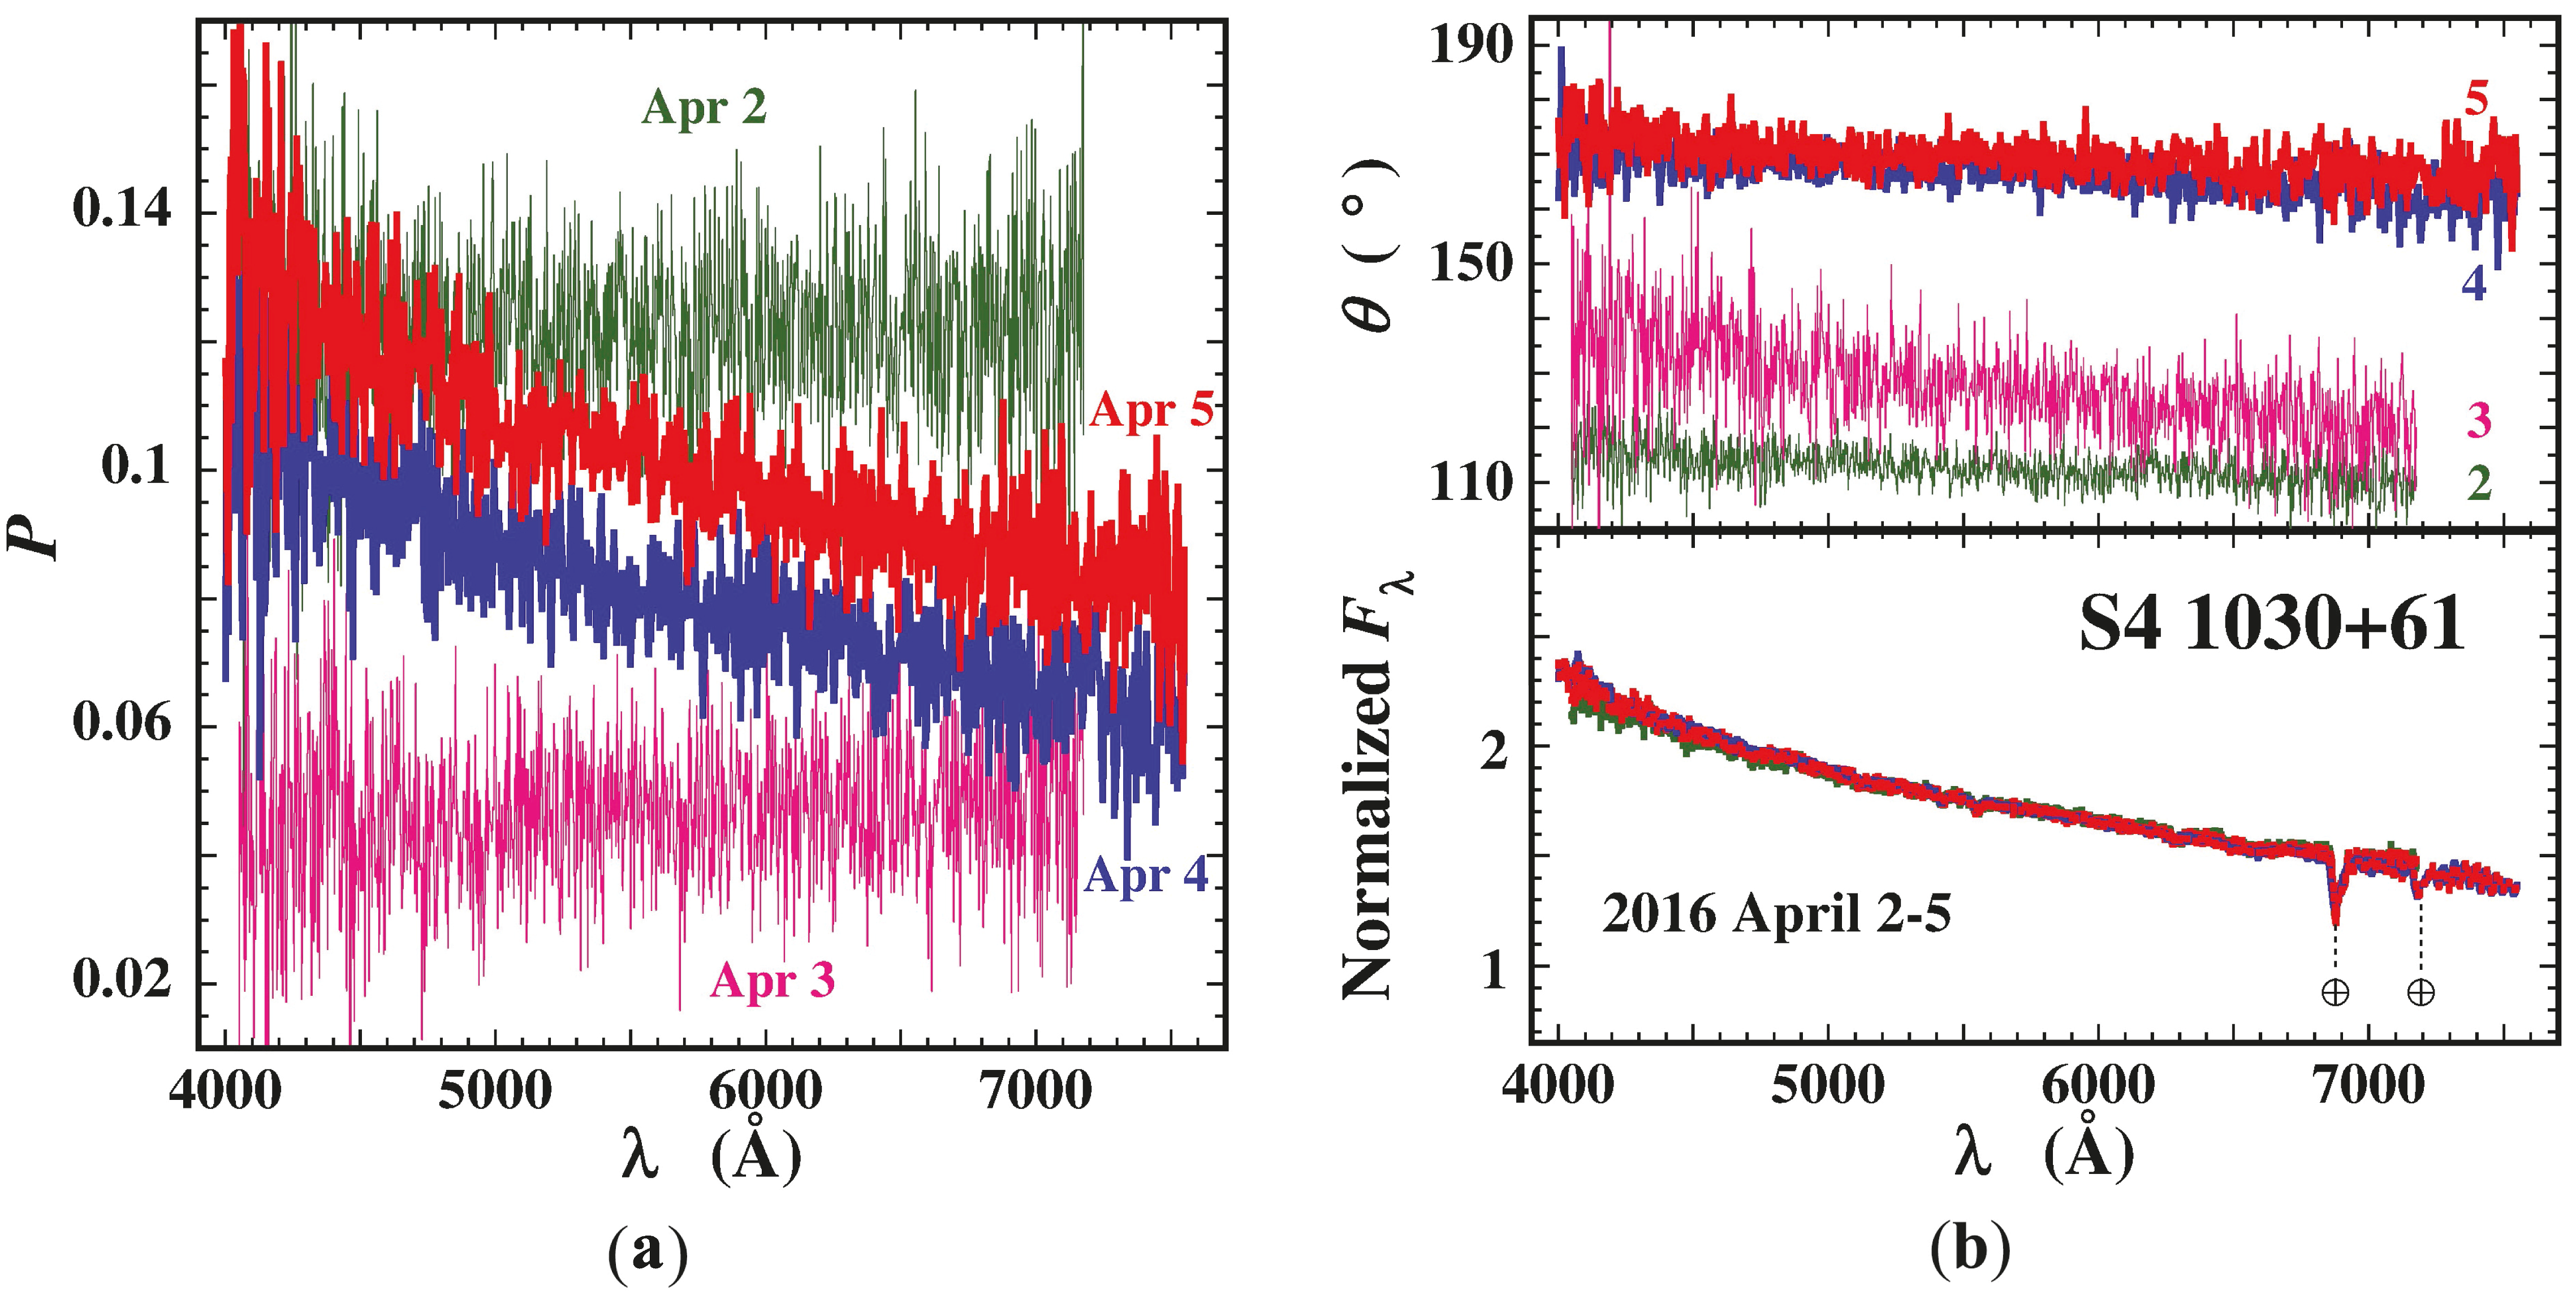
S4 1030+61 in 2016 April provides a vivid example of this type of wavelength-dependent polarization and its variability (Figure 6). In one day, P drops from 12% to 4% and then recovers back to ~10% over the next two nights while developing a strong increase in P toward the blue. Indeed, on April 4 and 5, P nearly doubles between 7000 Å and 4000 Å. At the same time, θ shows a dependence on λ such that it is at a larger position angle in the blue. This trend is most pronounced on 3 April when θ is nearly 20° greater at the blue end of the spectrum than in the red. There is limited flux information in the SO database during this period, but normalizing the flux spectra shows that all of the polarization variability occurs with the optical continuum slope remaining constant. It is impossible for wavelength-dependent polarization to arise from two distinct emission sources in the jet, each with wavelength-independent polarization, if their spectral indices are the same. Also, no evolution of the wavelength dependence in the polarization will be observed unless the spectral index of at least one of the components varies. This constraint makes it very difficult to explain the constant spectral index observed during this period. Therefore, the behavior displayed in Figure 6 for S4 1030+61 suggests that we are seeing structure and/or evolution of the magnetic field within the single optical emission region of the relativistic jet that provides most of the polarized flux.
4. Discussion
At first glance, the wealth of optical polarization behavior adds a level of complexity to the study of blazars that is difficult to digest. There are, however, constraints imposed by these observations that will eventually have to be considered in any models of these sources that attempt to explain their behavior. One such constraint is that accretion disks can only be included in SED models for BL Lac objects if their effect on the observed polarization cannot be detected to within the sensitivity of existing spectropolarimetry. Within the sample of BL Lac objects being monitored in support of Fermi, none are showing the polarization signature that is consistently apparent in many FSRQs. Given the general level of precision of the observations, this means that any UV/optical emission from a disk in BL Lac objects is far below the range of luminosity found for quasars. Of course, the lack of luminous disks in BL Lac objects could very well go hand-in-hand with their weak emission lines, suggesting that the disk is much more responsible than is the jet for supplying the UV photons needed to power the emission-line regions. So far, this assertion is supported by most of the emission-line variability studies that have used the SO spectrophotometric database. It follows that the lack of disk and line emission in BL Lac objects makes it unlikely that up-scattering of photons from these weak thermal sources is important in producing the γ-ray flux observed from these blazars.
Most of the time, the optical synchrotron emission from blazars shows little or no dependence on wavelength, but almost all objects in the sample have shown brief episodes of wavelength-dependent P and/or θ. Examples of this behavior, as shown for S4 1030+61 above, offer intriguing glimpses of the magnetic field structure and its evolution as emitting plasma moves down the jet. For S4 1030+61, an important constraint supplied by the observations is the static spectral slope that it exhibits despite rapid changes in the polarized flux spectrum. This alone appears to rule out multiple unrelated synchrotron sources as the reason for the emergence of strong wavelength-dependent polarization in this particular case. We are some ways away from folding this kind of information into models of blazars as we grapple with the complex nature of the overall flux and polarization variability of these sources. It is not helpful that wavelength-dependent polarization intrinsic to the non-thermal optical/UV continuum is relatively rare and that we currently lack any indicator in an object's behavior that would suggest when these episodes might occur. In addition, wavelength-dependent polarization episodes are brief, often lasting only a day or two, and the current spectropolarimetric monitoring cadence of roughly one day for the SO program is not fast enough to observe the onset and end of events, which may help to identify the relevant physical/geometrical mechanism(s) at play.
Future observations along lines that would help answer the many outstanding issues raised by polarization monitoring of blazars include contemporaneous polarization measurements of the inverse-Compton component. Although probably quite distant in the future, such measurements could tie down the relationship between the two main components that dominate the SEDs in blazars. More rapid, if not continuous, spectropolarimetric monitoring of blazars would offer clear advantages by alleviating ambiguities ranging from identifying systematic polarization position angle rotations, to seeing wavelength-dependent polarization develop and disappear. Although this approach is a logical next step, it will be very expensive in terms of telescope time.
Acknowledgments
Observations obtained by the Fermi/Steward Observatory blazar monitoring program have been funded through NASA/Fermi Guest Investigator grants NNX08AW56G, NNX09AU10G, NNX12AO93G, and NNX15AU81G. The author thanks Alan P. Marscher, Valeri M. Larionov, Svetlana G. Jorstad, Gary D. Schmidt, and Buell T. Jannuzi for their encouragement to pursue this project to support Fermi and the multi-wavelength effort to better understand blazars.
Conflicts of Interest
The authors declare no conflict of interest.
References
- Atwood, W.B.; Abdo, A.A.; Ackermann, M.; Althouse, W.; Anderson, B.; Axelsson, M.; Baldini, L.; Ballet, J.; Band, D.L.; Barbiellini, G.; et al. The Large Area Telescope on the Fermi Gamma-Ray Space Telescope Mission. Astrophys. J. 2009, 697, 1071–1102. [Google Scholar] [CrossRef]
- Ackermann, M.; Ajello, M.; Albert, A.; Allafort, A.; Atwood, W.B.; Axelsson, M.; Baldini, L.; Ballet, J.; Barbiellini, G.; Bastieriet, D.; et al. The Fermi Large Area Telescope on Orbit: Event Classification, Instrument Response Functions, and Calibration. Astrophys. J. 2012, 203, 4–73. [Google Scholar] [CrossRef]
- Smith, P.S.; Montiel, E.; Rightley, S.; Turner, J.; Schmidt, G.D.; Jannuzi, B.T. Coordinated Fermi/Optical Monitoring of Blazars and the Great 2009 September Gamma-ray Flare of 3C 454.3. 2009; arXiv:0912.3621v1. [Google Scholar]
- Schmidt, G.D.; Stockman, H.S.; Smith, P.S. Discovery of a Sub-megagauss Magnetic White Dwarf through Spectropolarimetry. Astrophys. J. 1992, 398, L57–L60. [Google Scholar] [CrossRef]
- Wardle, J.F.C.; Kronberg, P.P. The Linear Polarization of Quasi-stellar Radio Sources at 3.71 and 11.1 Centimeters. Astrophys. J. 1974, 194, 249–255. [Google Scholar] [CrossRef]
- Jorstad, S.G.; Marscher, A.P.; Smith, P.S.; Larionov, V.M.; Agudo, I.; Gurwell, M.; Wehrle, A.E.; Lähteenmäki, A.; Nikolashvili, M.G.; Schmidt, G.D.; et al. A Tight Connection between Gamma-Ray Outbursts and Parsec-scale Jet Activity in the Quasar 3C 454.3. Astrophys. J. 2013, 773, 147–173. [Google Scholar] [CrossRef]
- Marscher, A.P. Turbulent, Extreme Multi-zone Model for Simulating Flux and Polarization Variability in Blazars. Astrophys. J. 2014, 780, 87–96. [Google Scholar] [CrossRef]
- Smith, P.S.; Schmidt, G.D.; Jannuzi, B.T. The Optical Properties of PKS 1222+216 during the Fermi Mission. 2011; arXiv:1110.6040v1. [Google Scholar]
- León-Tavares, J.; Chavushyan, V.; Patiño-Álvarez, V.; Valtaoja, E.; Arshakian, T.G.; Popović, L.Č.; Tornikoski, M.; Lobanov, A.; Carramiñana, A.; Carrasco, L.; et al. Flare-like Variability of the Mg II λ2800 Emission Line in the g-ray Blazar 3C 454.3. Astrophys. J. 2013, 763, L36–L41. [Google Scholar] [CrossRef]
- Isler, J.C.; Urry, C.M.; Coppi, P.; Bailyn, C.; Chatterjee, R.; Fossati, G.; Bonning, E.W.; Maraschi, L.; Buxton, M. A Time-resolved Study of the Broad-line Region in Blazar 3C 454.3. Astrophys. J. 2013, 779, 100–109. [Google Scholar] [CrossRef]
- Isler, J.C.; Urry, C.M.; Bailyn, C.; Smith, P.S.; Coppi, P.; Brady, M.; MacPherson, E.; Hasan, I.; Buxton, M. The SMARTS Multi-Epoch Optical Spectroscopy Atlas (SaMOSA): An Analysis of Emission Line Variability in Southern Hemisphere Fermi Blazars. Astrophys. J. 2015, 804, 7–20. [Google Scholar] [CrossRef]
- Smith, P.S.; Balonek, T.J.; Heckert, P.A.; Elston, R. The Optical and Near-infrared Polarization Properties of the OVV Quasar 3C 345. Astrophys. J. 1986, 305, 484–495. [Google Scholar] [CrossRef]
- Raiteri, C.M.; Villata, M.; Smith, P.S.; Larionov, V.M.; Acosta-Pulido, J.A.; Aller, M.F.; D’Ammando, F.; Gurwell, M.A.; Jorstad, S.G.; Joshi, M.; et al. Variability of the Blazar 4C 38.41 (B3 1633+382) from GHz Frequencies to GeV Energies. Astron. Astrophys. 2012, 545, A48. [Google Scholar] [CrossRef]
Figure 1.
Observations of 3C 454.3 on three separate nights showing the information available to researchers from the spectropolarimetric program. The 2014 data show major changes in both flux (a) and linear polarization (b) within 3 days during a major γ-ray/optical outburst. Given the extremely low polarization of the object in 2012 (green spectra), the spectrum of θ is not shown in (b) for clarity. The Mg II emission line at a redshift of z = 0.859 and telluric spectral features are marked in (a). All figures in this article are plotted in the observed frame.

Figure 2.
The γ-ray and optical behavior of (a) 3C 279 and (b) 3C 454.3 since the launch of Fermi. The Fermi γ-ray light curve is comprised of daily measurements made by the LAT, with red symbols in the top panels indicating daily γ-ray flux upper limits. Error bars are included for all optical measurements, but are typically smaller than the plotted data points. Uncertainties in the V flux density measurements of 3C 279 are dominated by the uncertainty in the flux calibration of the comparison star used for differential spectrophotometry. The magnitude differences between 3C 279 and the comparison star are known to higher precision. Following the standard way chosen to report spectropolarimetric measurements in the public data archive, P and θ are determined using the median Stokes parameters in a 5000–7000 Å bandpass. In the bottom panels of both plots, a red dashed line denotes the approximate position angle of the inner VLBI jet at 43 GHz.

Figure 3.
Daily γ-ray flux and optical flux and polarization measurements of (a) 3C 279 and (b) 3C 454.3 during major outbursts. These plots follow the same format as in Figure 2. Red triangles in the top panel of (a) denote upper limits to the γ-ray flux as measured by the LAT. In the bottom panel of (b), θ = 0° = 180° is shown by the dashed, horizontal line.

Figure 4.
(a) Decomposition of the optical spectrum of Mrk 421 into active galactic nuclei (AGN) and host galaxy components. The model assumes that the intrinsic polarization of the blazar is ~5.5% and that it is constant with wavelength. The polarized flux spectrum (green) has been scaled up by a factor of 10 for clarity; (b) Spectral decomposition of PKS 1222+216 into a polarized power-law continuum from the blazar jet and an unpolarized blue continuum plus broad emission-line region similar to a QSO. The model (blue curve in the middle panel) satisfactorily reproduces the decreases in polarization observed at the wavelengths of emission lines and in the continuum toward the blue end of the spectrum. An intrinsic polarization of nearly 49% is implied for the optical synhcrotron emission. If correct, this would be the highest level of polarization seen in a blazar to date.

Figure 5.
Observed correlations between optical color and brightness (left panel) and the strength of wavelength dependence seen in P (right panel) as measured by the ratio in polarization observed at 4600 Å and 6600 Å for PKS 1222+216.
Figure 5.
Observed correlations between optical color and brightness (left panel) and the strength of wavelength dependence seen in P (right panel) as measured by the ratio in polarization observed at 4600 Å and 6600 Å for PKS 1222+216.

Figure 6.
Observations of S4 1030+61 while the blazar was undergoing a period of strong optical and γ-ray activity. (a) Pronounced variability in polarization and in how P changes with wavelength is seen over a period of four consecutive nights; (b) Strong variability in θ and its wavelength dependence are shown (upper panel) along with the stable optical spectral index (lower panel) observed during this period. The optical flux spectra have been normalized in the figure.

© 2016 by the author; licensee MDPI, Basel, Switzerland. This article is an open access article distributed under the terms and conditions of the Creative Commons Attribution (CC-BY) license (http://creativecommons.org/licenses/by/4.0/).
Share and Cite
MDPI and ACS Style
Smith, P.S. Sharp Polarimetric Eyes: More Trees than Forest? Galaxies 2016, 4, 27. https://doi.org/10.3390/galaxies4030027
AMA Style
Smith PS. Sharp Polarimetric Eyes: More Trees than Forest? Galaxies. 2016; 4(3):27. https://doi.org/10.3390/galaxies4030027
Chicago/Turabian StyleSmith, Paul S. 2016. "Sharp Polarimetric Eyes: More Trees than Forest?" Galaxies 4, no. 3: 27. https://doi.org/10.3390/galaxies4030027
Note that from the first issue of 2016, this journal uses article numbers instead of page numbers. See further details here.