Next Article in Journal / Special Issue
Variability of Blazars and Blazar Models over 38 Years
Previous Article in Journal / Special Issue
Broad Band Observations of Gravitationally Lensed Blazar during a Gamma-Ray Outburst
 
 
galaxies-logo
Article Menu

Article Menu

Article

The Connection between the Radio Jet and the γ-ray Emission in the Radio Galaxy 3C 120 and the Blazar CTA 102

by
Carolina Casadio
1,*,
José L. Gómez
2,
Svetlana G. Jorstad
3,4,
Alan P. Marscher
3,
Paola Grandi
5,
Valeri M. Larionov
4,6,
Matthew L. Lister
7,
Paul S. Smith
8,
Mark A. Gurwell
9,
Anne Lähteenmäki
6,10,
Iván Agudo
2,
Sol N. Molina
2,
Vishal Bala
3,
Manasvita Joshi
3,
Brian Taylor
3,
Karen E. Williamson
3,
Yuri Y. Kovalev
1,11,
Tuomas Savolainen
1,6,
Alexander B. Pushkarev
1,12,13,
Arkady A. Arkharov
13,
Dmitry A. Blinov
4,14,
George A. Borman
12,
Andrea Di Paola
15,
Tatiana S. Grishina
4,
Vladimir A. Hagen-Thorn
4,
Ryosuke Itoh
16,
Evgenia N. Kopatskaya
4,
Elena G. Larionova
4,
Liudmila V. Larionova
4,
Daria A. Morozova
4,
Elizaveta Rastorgueva-Foi
6,17,
Sergey G. Sergeev
12,
Merja Tornikoski
6,
Ivan S. Troitsky
4,
Clemens Thum
18 and
Helmut Wiesemeyer
1
add Show full author list remove Hide full author list
1
Max-Planck-Institut für Radioastronomie, Auf dem Hügel 69, 53121 Bonn, Germany
2
Instituto de Astrofísica de Andalucía, CSIC, Glorieta de la Astronomía, s/n, 18008 Granada, Spain
3
Institute for Astrophysical Research, Boston University, Boston, MA 02215, USA
4
Astronomical Institute, St. Petersburg State University, 198504 St. Petersburg, Russia
5
Istituto Nazionale di Astrofisica-IASFBO, 40127 Bologna, Italy
6
Aalto University Metsähovi Radio Observatory, FI-02540 Kylmälä, Finland
7
Department of Physics, Purdue University, 610 Purdue Mall, West Lafayette, IN 47907, USA
8
Steward Observatory, University of Arizona, Tucson, AZ 85721, USA
9
Harvard-Smithsonian Center for Astrophysics, Cambridge, MA 02138, USA
10
Aalto University Department of Radio Science and Engineering, FI-00076 Aalto, Finland
11
Astro Space Center, Lebedev Physical Institute, Russian Academy of Sciences, 117810 Moscow, Russia
12
Crimean Astrophysical Observatory, 98409 Nauchny, Crimea, Russia
13
Pulkovo Observatory, 196140 St. Petersburg, Russia
14
Department of Physics and Institute for Plasma Physics, University of Crete, GR-71003 Heraklion, Greece
15
INAF, Osservatorio Astronomico di Roma, 00136 Roma, Italy
16
Department of Physical Sciences, Hiroshima University, Hiroshima Prefecture 739-8511, Japan
17
School of Maths and Physics, University of Tasmania, Australia, Private Bag 37, TAS 7001 Hobart, Australia
18
Instituto de Radio Astronomía Milimétrica, 18012 Granada, Spain
*
Author to whom correspondence should be addressed.
Galaxies 2016, 4(4), 34; https://doi.org/10.3390/galaxies4040034
Submission received: 16 July 2016 / Revised: 14 September 2016 / Accepted: 15 September 2016 / Published: 27 September 2016
(This article belongs to the Special Issue Blazars through Sharp Multi-wavelength Eyes)

Abstract

:
We present multi-wavelength studies of the radio galaxy 3C 120 and the blazar CTA 102 during unprecedented γ-ray flares for both sources. In both studies the analysis of γ-ray data has been compared with a series of 43 GHz VLBA images from the VLBA-BU-BLAZAR program, providing the necessary spatial resolution to probe the parsec scale jet evolution during the high energy events. To extend the radio dataset for 3C 120 we also used 15 GHz VLBA data from the MOJAVE sample. These two objects which represent very different classes of AGN, have similar properties during the γ-ray events. The γ-ray flares are associated with the passage of a new superluminal component through the mm VLBI core, but not all ejections of new components lead to γ-ray events. In both sources γ-ray events occurred only when the new components are moving in a direction closer to our line of sight. We locate the γ-ray dissipation zone a short distance from the radio core but outside of the broad line region, suggesting synchrotron self-Compton scattering as the probable mechanism for the γ-ray production.

1. Introduction

The majority of active galactic nuclei (AGN) detected at γ-ray energies are blazars, as expected from the orientation of their jets that point closer to our line of sight, and only a few percentage are radio galaxies. The radio galaxy 3C 120 for example is not officially listed in any of the Fermi Gamma-Ray Space Telescope catalogs. Hence, the bright γ-ray flare detected by the Large Area Telescope (LAT) on board the Fermi satellite on 24 September 2014 from the radio galaxy 3C 120 [1], was an unexpected event. This bright flare seems actually associated with a prolonged γ-ray activity from the source that started in December 2012 and lasted until at least October 2014, which corresponds to our last data analyzed.
On the other hand, blazars usually display brighter γ-ray fluxes and more rapid variations. The blazar CTA 102 is more often observed in a quiescent state, leading to an average γ-ray flux rather low (∼5 × 10 - 9 photon cm - 2 s - 1 , 1 < E < 100 GeV), as reported in the third Fermi catalog [2]. However, occasionally this source shows bright γ-ray outbursts where it increases its daily flux by three orders of magnitude or more. A bright γ-ray flare was reported in April 2011, when the source reached a daily γ-ray flux of (1.4 ± 0.3) × 10 - 6 photon cm - 2 s - 1 [3], but it was in September 2012 when the source showed an unprecedented γ-ray outburst reaching a daily flux of (5.2 ± 1) × 10 - 6 photon cm - 2 s - 1 [4], also associated with bright optical and near-infrared (NIR) outbursts, as reported in [5,6], respectively.
We studied the γ-ray events of both sources, the radio galaxy 3C 120 and the blazar CTA 102. In both studies the analysis of γ-ray data has been compared with a series of 43 GHz VLBA images from the VLBA-BU-BLAZAR program (http://www.bu.edu/blazars/research.html), providing the necessary spatial resolution to probe the parsec scale jet evolution during the high energy events. In the case of 3C 120, to extend the observing period covered by radio data, we also used 15 GHz VLBA data from the MOJAVE survey (http://www.physics.purdue.edu/MOJAVE/). For CTA 102 we extended the study to the entire electromagnetic spectrum, collecting data from many ground telescopes and satellites.
The analysis of the entire dataset for both 3C 120 and CTA 102 and the results obtained in both studies have been recently reported in [7,8], respectively. Here we describe the main results achieved focusing the attention on the common properties displayed by these two sources during the high-energy events, despite belonging to two different classes of AGN.

2. Observations and Data Reduction

2.1. The VLBA Data Analysis

The radio data set of 3C 120 includes MOJAVE data from June 2008 to August 2013, and VLBA-BU-BLAZAR data from January 2012 to May 2014. The calibration of VLBA 15 GHz data has been performed by the MOJAVE team, following the procedure described in [9]. VLBA data at 43 GHz have been calibrated using a combination of AIPS and Difmap packages, as described in [10]. The final images have been restored with a common mean beam of 1.2 × 0.5 mas in a position angle (P.A.) of 0 ° and 0.3 × 0.15 mas (P.A. = 0 ° ) for the MOJAVE and VLBA-BU-BLAZAR programs, respectively. To follow the evolution of the radio jet we have modeled the radio emission performing a fitting of the visibilities to circular Gaussian components using Difmap. For each epoch we obtained a model-fit whose components contain information about the flux density, distance and position angle from the core, considered stationary over epochs, and the size.

2.2. The Fermi Data Analysis

The analysis of Fermi-LAT data of the radio galaxy 3C 120 covered the observing period from the start of the mission, August 2008, to October 2014. In this case we first performed the analysis in the 100 MeV–100 GeV band with a bin size of three months and then we reduced the integration time interval to 15 days in order to better constrain the epoch of the detections that we found in the 3 months-bin analysis. For CTA 102 we analyzed the γ-ray data from August 2008 to September 2013, producing a light curve in the energy band 100 MeV–200 GeV with an integration time of 1 day. The analysis with a smaller bin in this case was possible because of the higher γ-ray flux of the source. In both cases we considered a successful detection when the test statistic TS was greater than 10, which corresponds to a signal-to-noise ratio >3σ; when TS < 10 a 2σ upper limit of the flux is provided. For further details on the γ-ray analysis of both sources see [7,8].

2.3. CTA 102 Multi-Wavelength Analysis

In the case of CTA 102, which displayed in September 2012 a bright γ-ray outburst in coincidence with flares at optical and NIR wavelengths, we studied the source in the entire electromagnetic spectrum. Hence, we collected data from millimeter to γ-ray frequencies covering an observing period of 10 years, from June 2004 to June 2014. The millimeter-wave dataset, besides VLBA 43 GHz (7 mm) data, included data at 350 GHz (0.85 mm) and 230 GHz (1.3 mm) from the Sub Millimeter Array in Hawaii, 230 (1.3 mm) and 86.24 GHz (3.5 mm) data from the Telescope of the Institut de Radioastronomie Millimétrique in Pico Veleta (Spain), and 37 GHz (8 mm) data from the Metsähovi Radio Observatory (Finland).
NIR photometric data were obtained at the Lowell Observatory (Arizona, AZ, USA) and the Main Astronomical Observatory of the Russian Academy of Sciences located at Campo Imperatore (Italy).
We analyzed optical photometric data (UBVRI filters) coming from numerous observatories: the Calar Alto Observatory in Spain, the Liverpool Observatory in Canary Island (Spain), the Lowell Observatory in Arizona (US), the Steward Observatory in Arizona (US), the St. Petersburg State University in Russia, the Crimean Astrophysical Observatory in Ukraine, the Higashi-Hiroshima Observatory in Japan, and the Ultraviolet and Optical Telescope (UVOT) on board the Swift satellite.
Ultraviolet and X-ray data were taken from UVOT and X-ray Telescope, respectively, on board the Swift satellite. A more detailed description of the multi-wavelength dataset and the calibration procedures is reported in [7,8].

3. Results

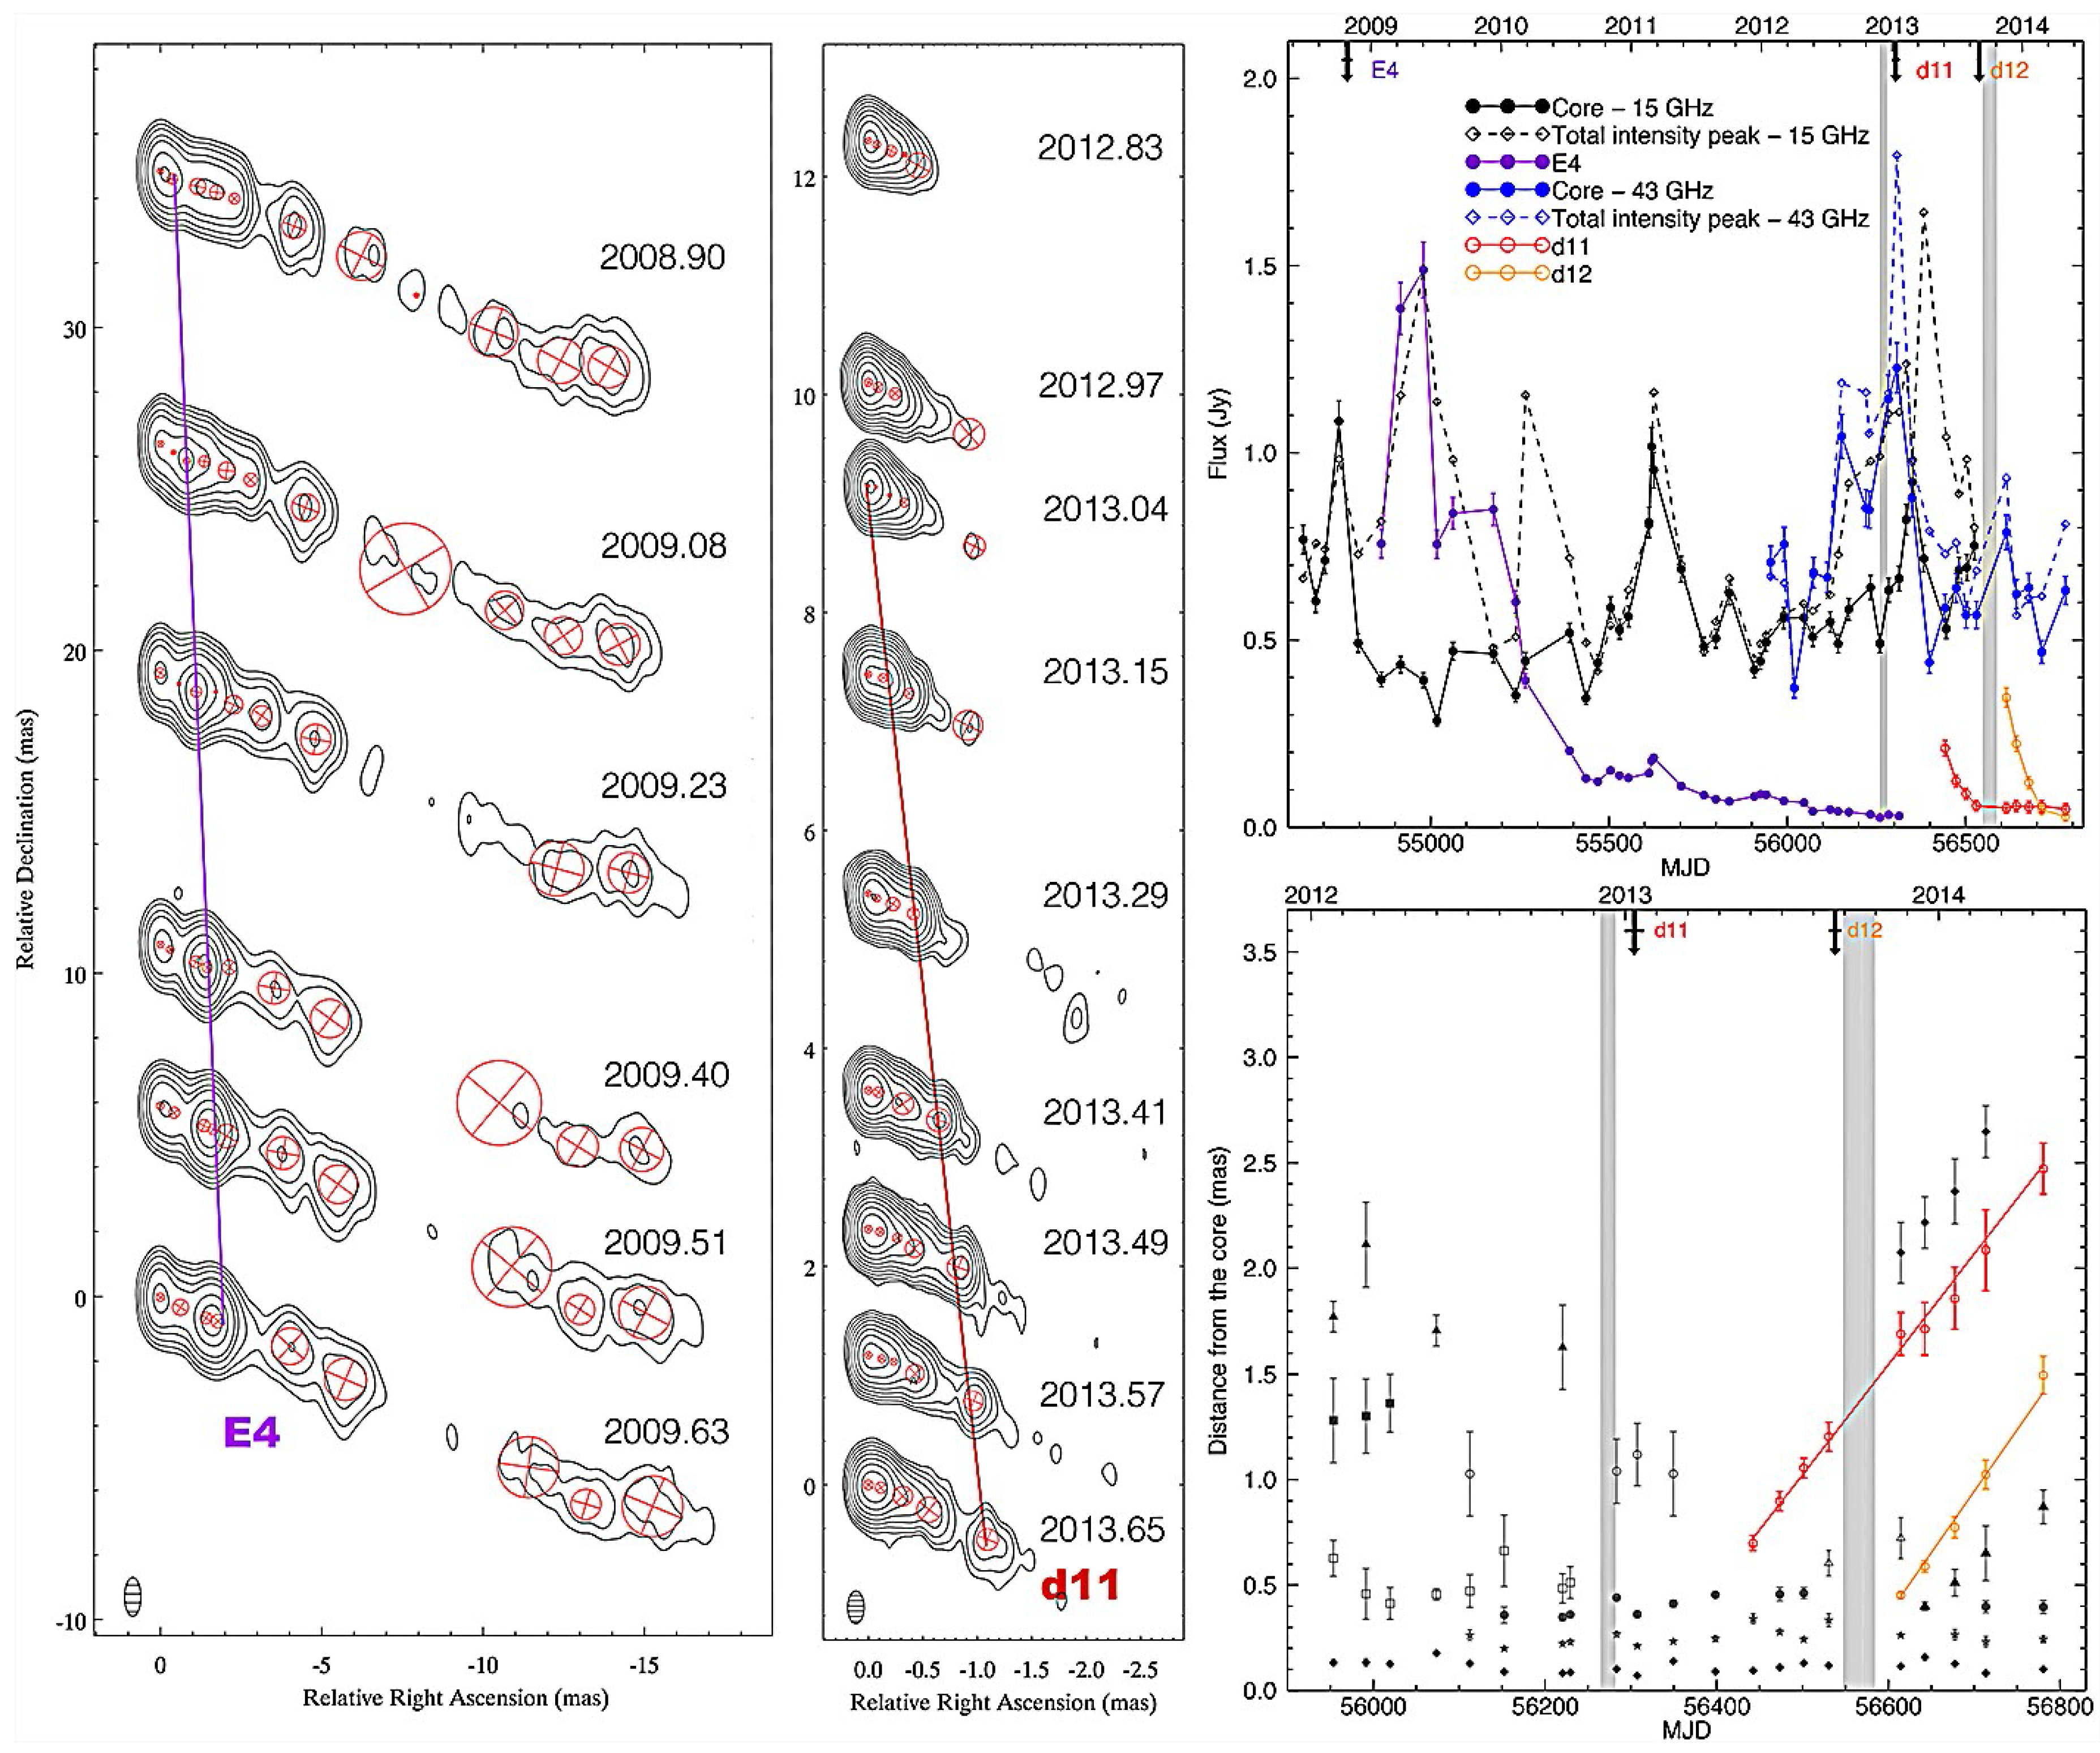
3.1. The Radio Galaxy 3C 120

The γ-ray analysis performed on 3C 120 with a bin width of three months revealed that the flare observed in September 2014 [1] was part of a prolonged γ-ray activity in the source covering the period from December 2012 up to at least the last epoch considered in our analysis, October 2014. From the 15-days bin analysis we were able to distinguish six γ-ray detections from December 2012 to October 2014, as we report in Table 1. The observing period covered by VLBA 43 GHz data allowed us to compare the γ-ray event in 3 December–18 December 2012 and the two detections in 14 September–14 October 2013 with the radio analysis.
In Figure 1 we display a sequence of VLBA images at 15 GHz (left) and 43 GHz (center) in total intensity where red circles are the model-fit components. In Figure 1 we also show the plots containing the 15 and 43 GHz light curves (right-top) and the distances from the core over time for the 43 GHz model-fit components only (right-bottom). From the light curves of the total intensity peaks we can distinguish two increase in flux; the first one occurred around 2009, only visible in 15 GHz data because of the lack of 43 GHz data in that period, and the second one between the end of 2012 and the beginning of 2013, visible first in the 43 GHz light curves and later on in the 15 GHz light curves, as expected due to opacity effect and energy stratification of electrons predicted by the shock-in-jet model [11]. The first radio flare is associated with the ejection of a bright component, E4, whose ejection is shown in the sequence of MOJAVE images and became brighter than the core itself. No clear detections came out from our analysis of Fermi data in coincidence with the appearance of component E4. On the other hand, we found that the γ-ray event in December 2012 is close to the second bright radio flare, which is associated with the ejection of of a new superluminal component, d11. The time of ejection (2013.03 ± 0.03), namely the time when the component d11 crossed the radio core at 43 GHz, is just after the γ-ray flare. Later on, another γ-ray event happened in 14 September–14 October 2013. Also during this event, the core displayed an increase in flux at 43 GHz, and a new superluminal component, d12, was ejected. Also the 15 GHz light curve of the core displayed a hint of increase close to the second γ-ray flare.
From the kinematics analysis of model-fit components at both 15 GHz and 43 GHz, we found that new components are seen in the jet of 3C 120 roughly every 8 months. These components revealed a clear pattern of decreasing apparent velocities, from a value of 6.21 ± 0.11c for a component ejected in April 2007 to values of 4.2 ± 0.2c and 4.7 ± 0.3c for components d11 and d12, respectively, ejected close to γ-ray events. This progressive slowdown in the apparent velocity of components could be explained by a change in the velocity and/or a change in the orientation of the components. A precession model for 3C 120 has been already proposed by [12] as well as by [13]. Interestingly, in [13], the authors interpreted the γ-ray event in September 2014 considering the jet as formed by a fast spine and a slower outer layer, where it is only the spine that changes its direction and occasionally points more toward the observer, as during γ-ray flares. By using the observed apparent velocities, and minimizing the required reorientation of the jet, we could estimate the Lorentz factor Γ = 6.3, and a change in viewing angle from 9.2 ° to 3.6 ° , where the latter corresponds to the epoch of the ejection of component d11 and the γ-ray event. This change in the orientation would lead to a change in the Doppler factor from δ∼6.2 to δ∼10.9, producing an enhancement of the γ-ray emission above the flux detectable by Fermi.
The delays between the time of ejections of components d11 and d12 and the 15 days-bin γ-ray detections allowed us to constrain the location of the γ-ray events, obtaining that the first event (December 2012) took place ∼2 pc (de-projected, considering θ = 3.6 ° ) upstream of the mm-VLBI core and the second event (September–October 2013) ∼2 pc (de-projected) downstream of the mm-VLBI core.

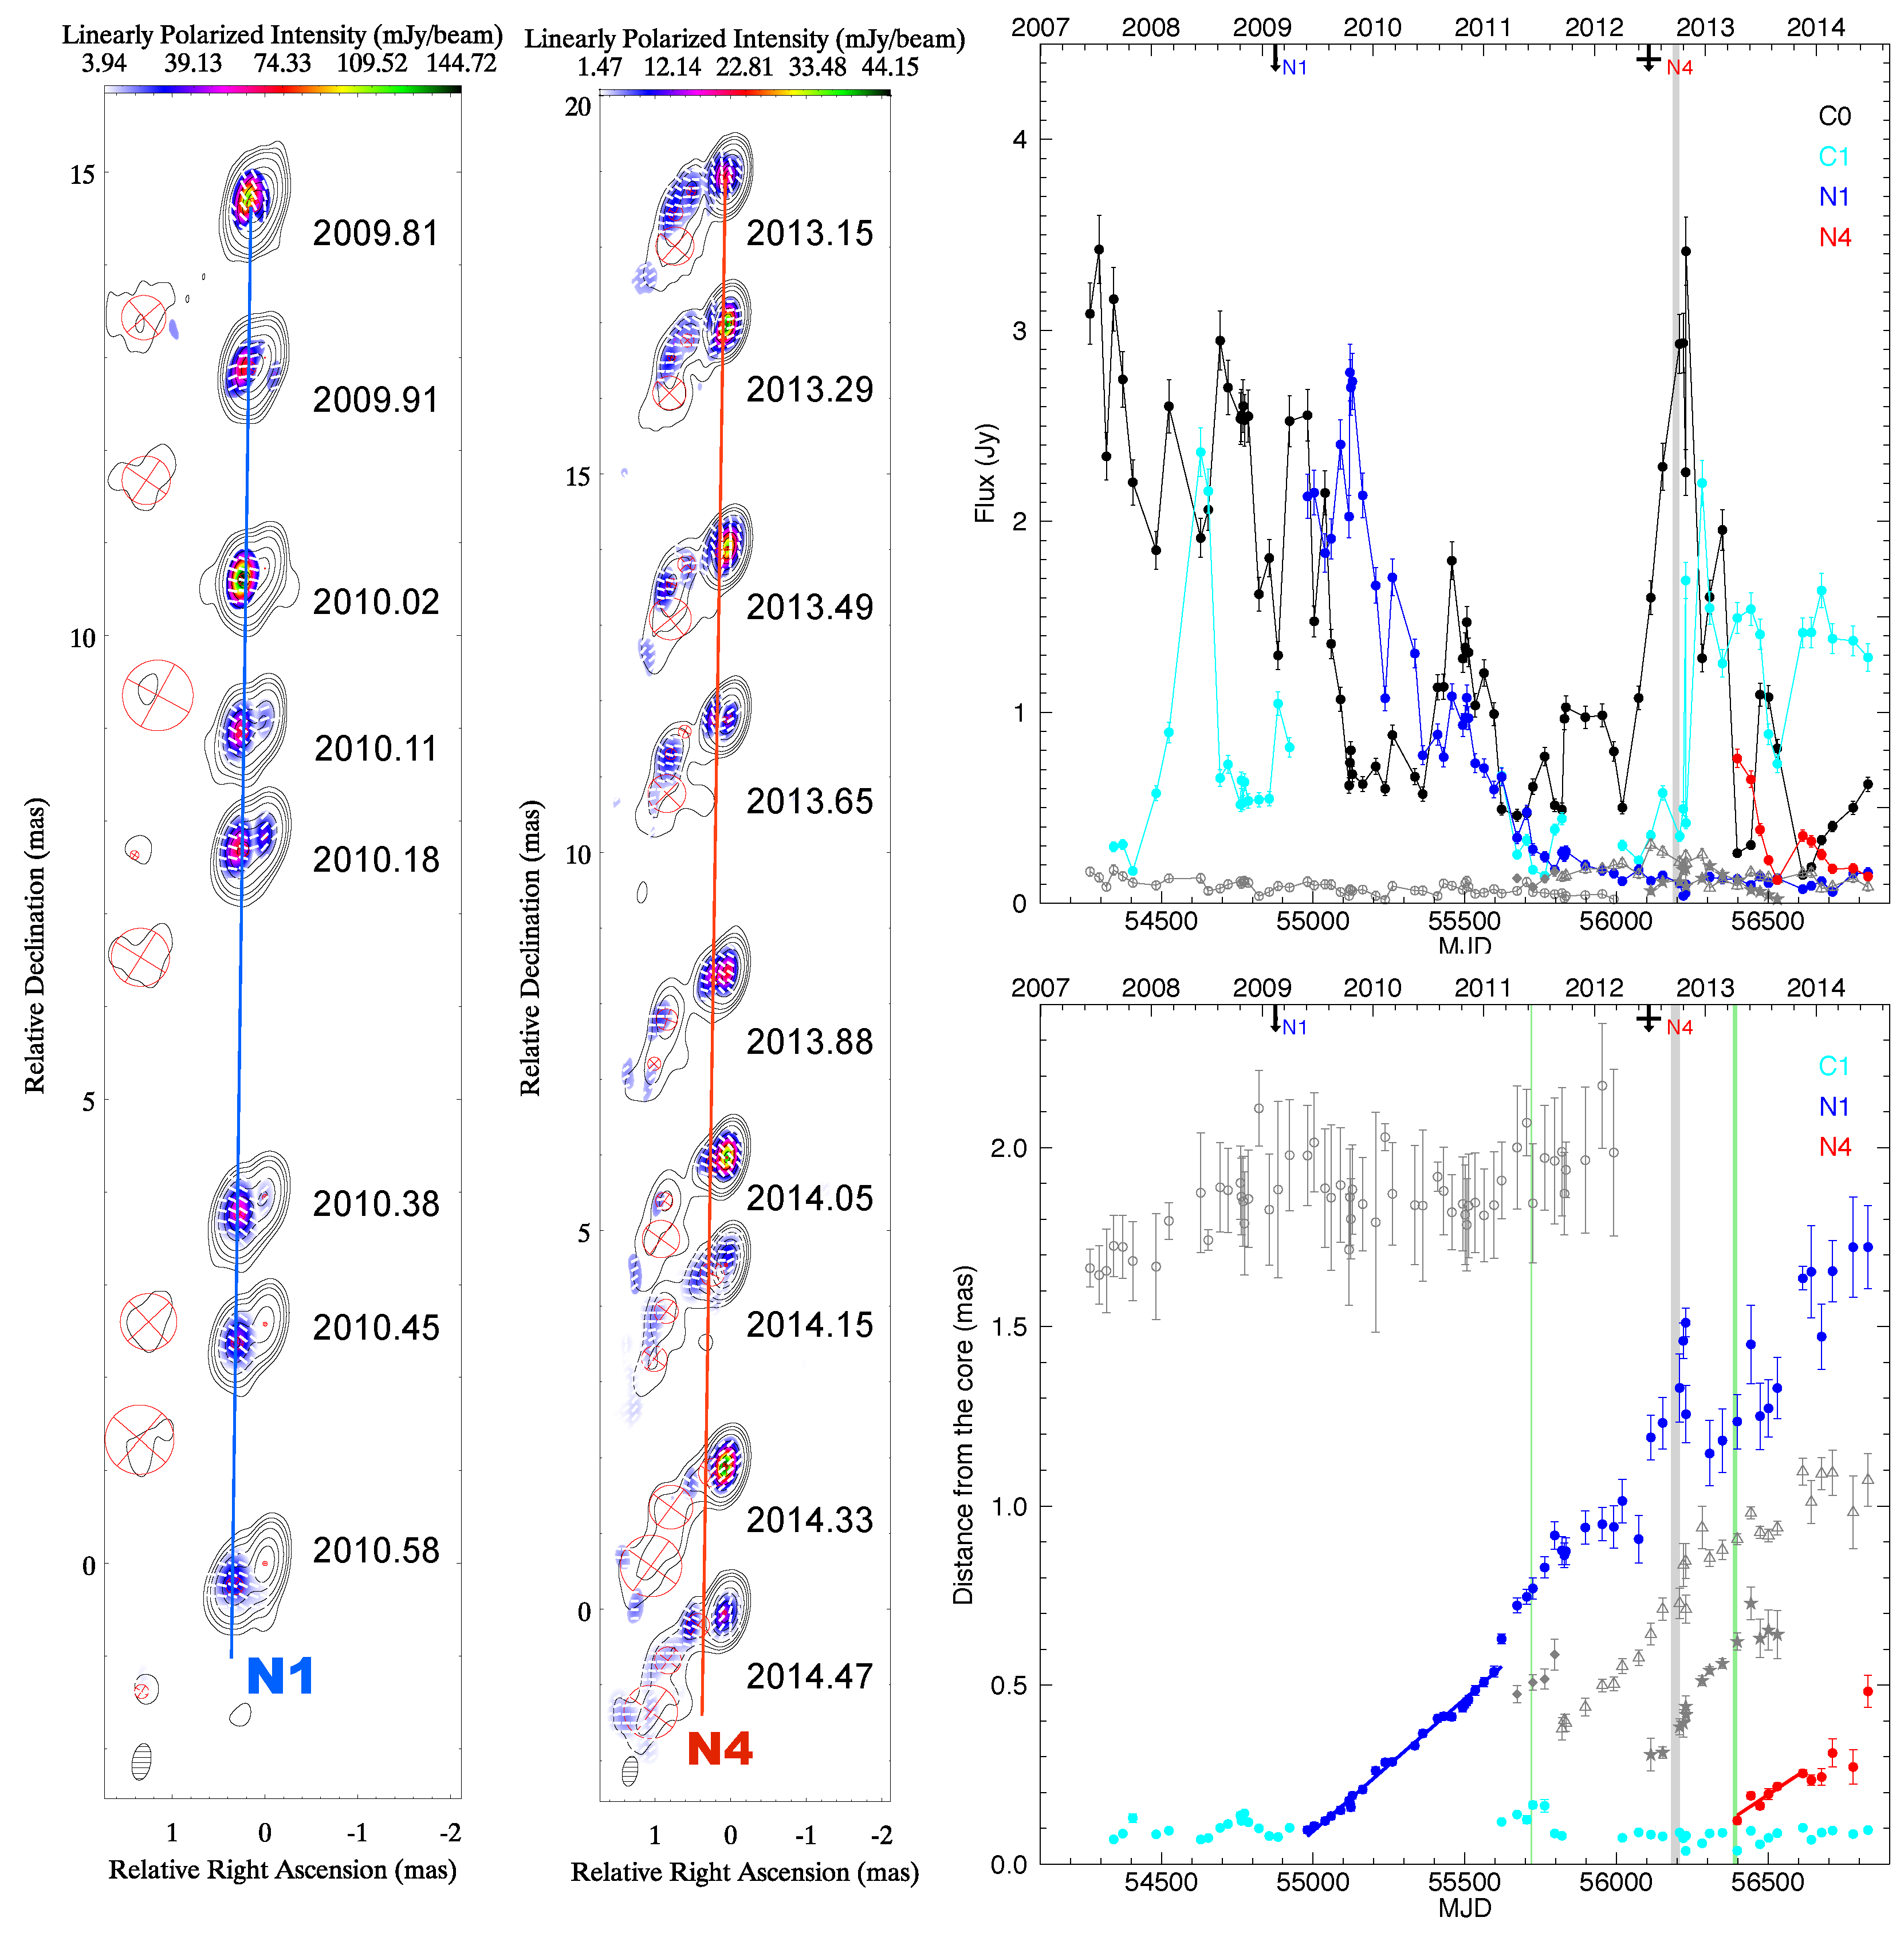
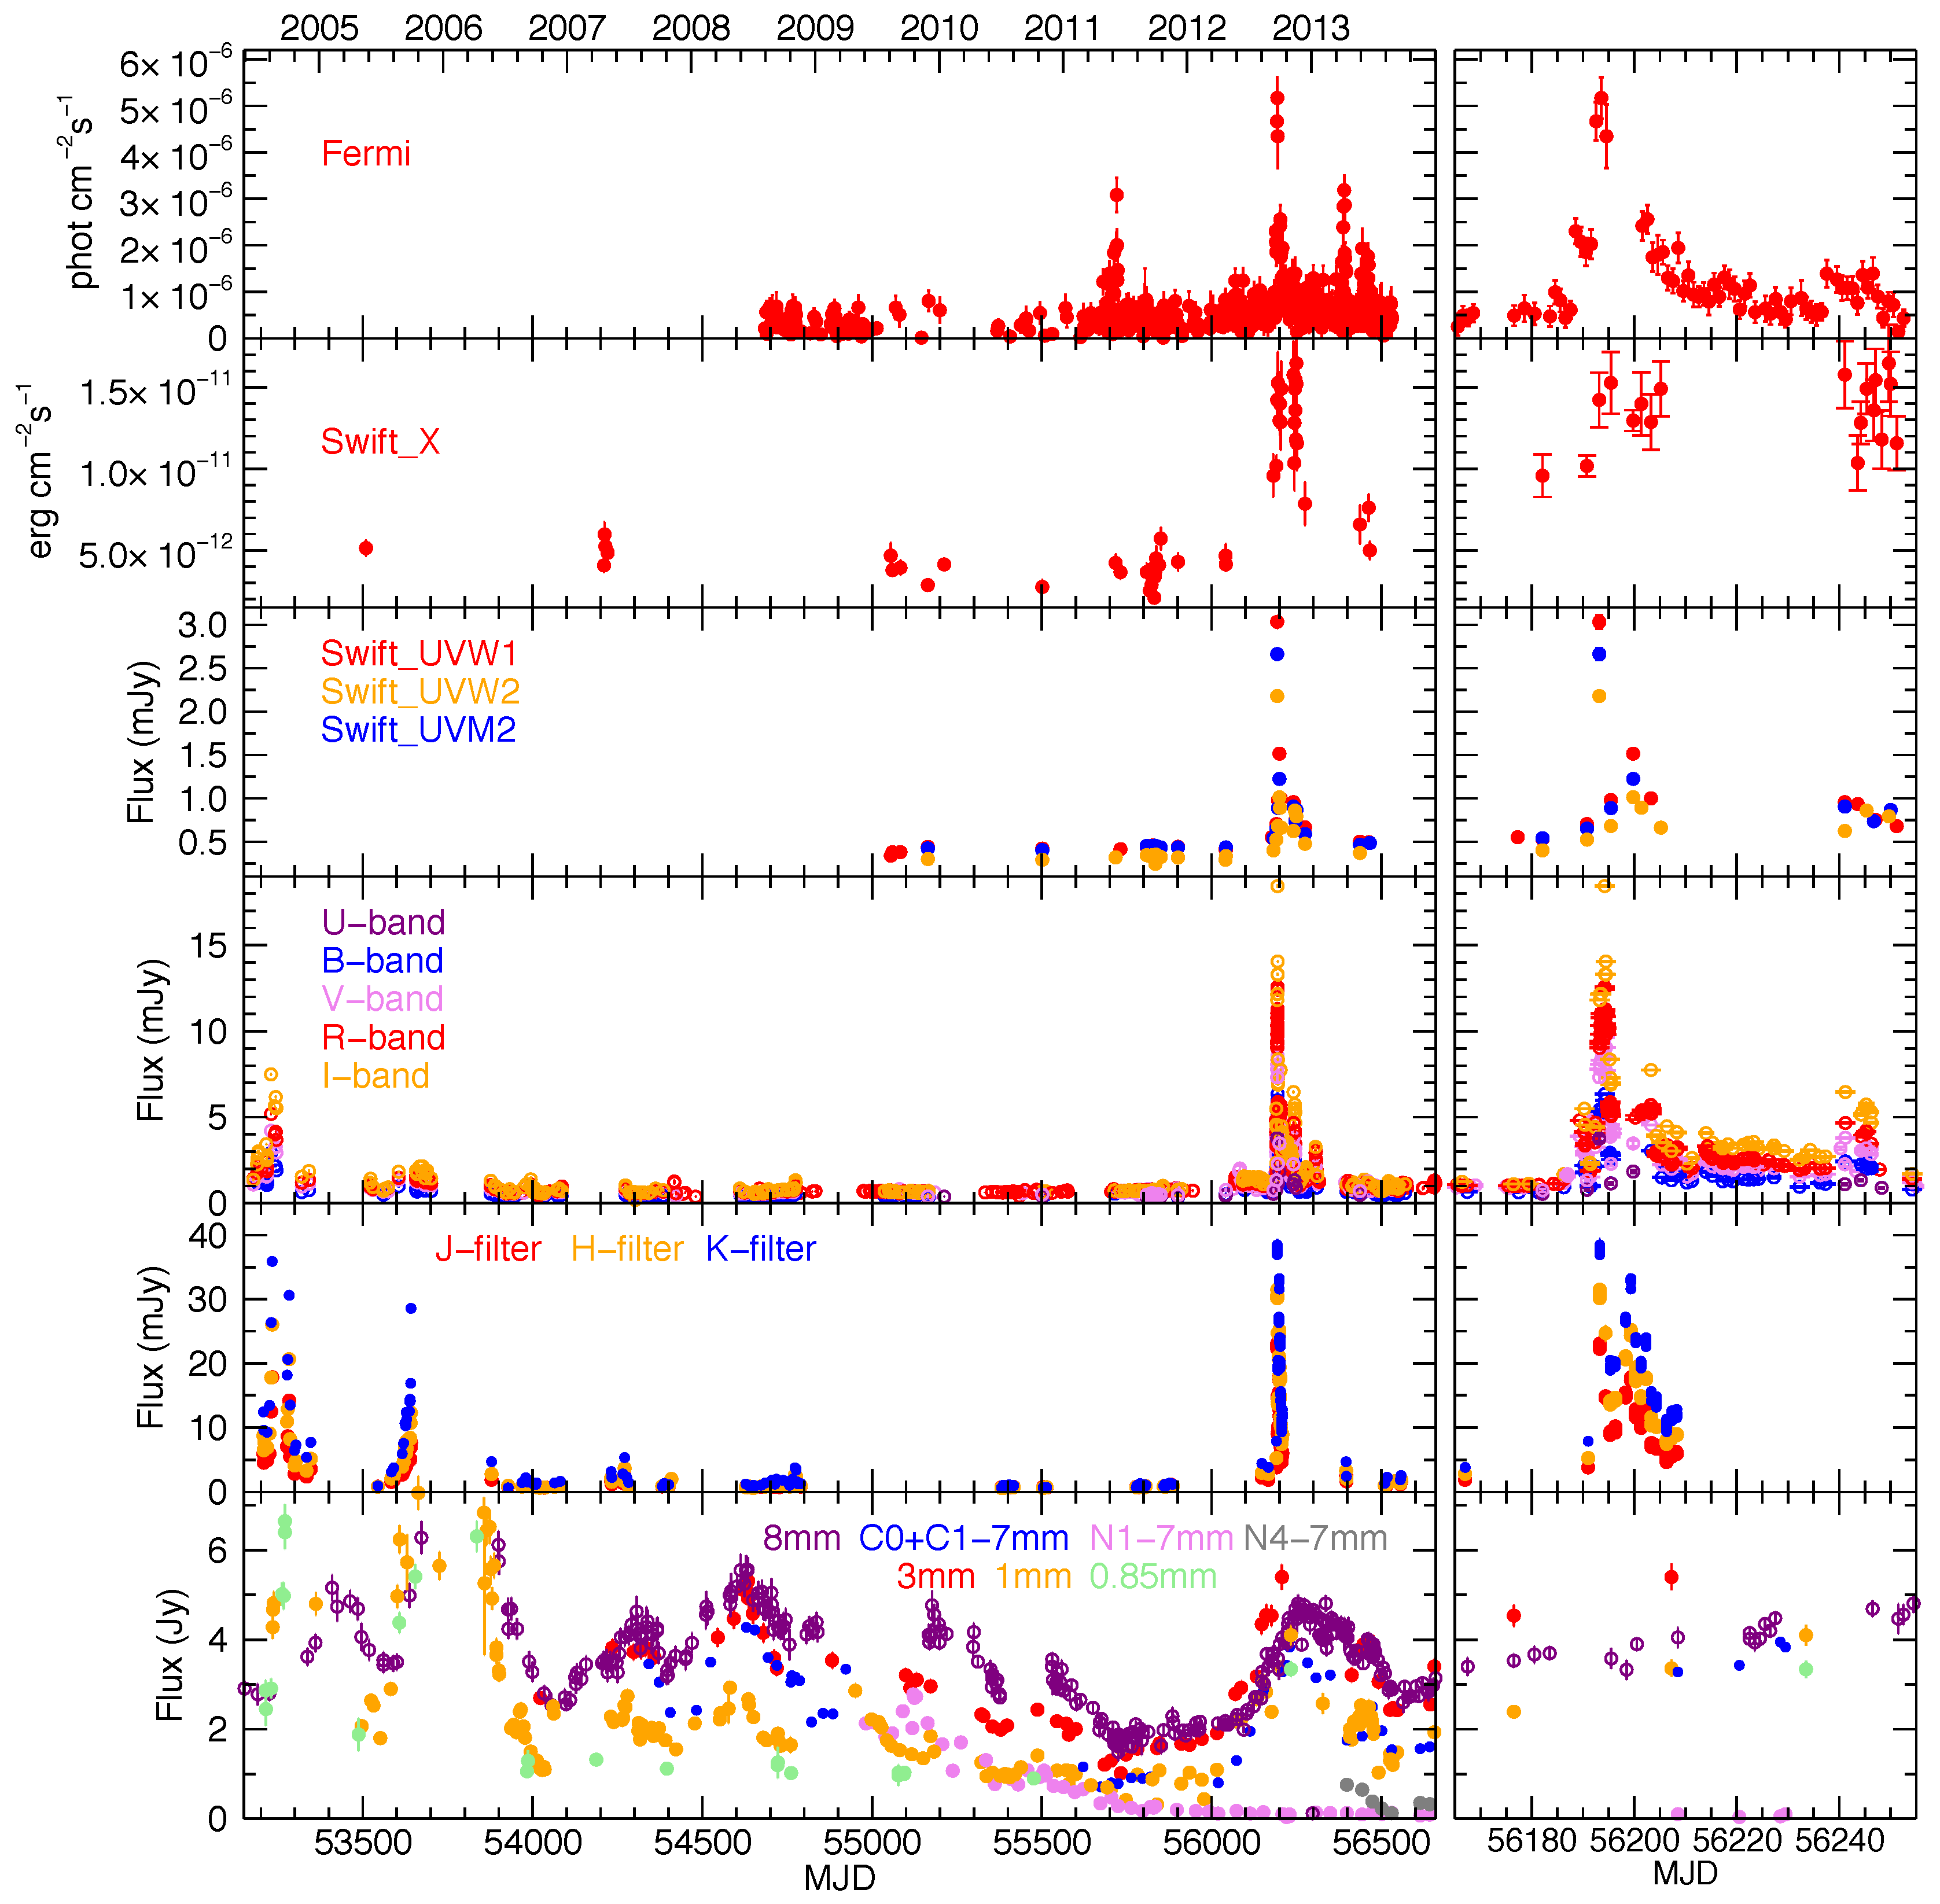
3.2. The Blazar CTA 102

In the case of the blazar CTA 102 we performed a multi-wavelength monitoring from millimeter to γ-ray frequencies collecting 10 years of data, from June 2004 up to June 2014. Figure 2 (left panel) displays the light curves obtained considering the entire dataset. Three γ-ray flares were observed between 2011 and 2013: two minors flares, one in June 2011 and the other one in April 2013, without counterpart at the other wavebands, and a third brighter flare in September–October 2012 where the source reached a daily flux of 5.2 × 10 - 6 photon cm - 2 s - 1 and at the same time other bright flares were observed at all the other analyzed wavebands.
Also in this case the γ-ray analysis was accompanied by the study of the evolution of the radio jet through a total of 80 VLBA images at 43 GHz in total and linearly polarized intensity from the VLBA-BU-BLAZAR program, which covers the observing period from June 2007 to June 2014. A sequence of some selected epochs are displayed in Figure 3 (left and central panel). From the light curves at 43 GHz of the core and the stationary component C1, located very close to the core (∼0.1 mas), we can identify two flaring periods: the first one is a prolonged event that extends from mid-2007 to the beginning of 2009, and the second one from mid-2012 to the end of 2012 (see Figure 3). The first millimeter flare is followed by the ejection of a bright component, N1, well visible also in VLBA images as shown in Figure 3. In this case the lack of γ-ray data prevents a comparison between radio and γ-ray emission, but we know from the optical light curve that no flares are observed at optical wavelengths in that period. Instead the second flaring period at millimeter wavebands, in 2012, is accompanied by the ejection of a weaker component, N4, and it is in coincidence with the bright γ-ray flare and also bright flares from NIR to X-ray frequencies.
Also in this case we analyzed the kinematics of model-fit components that we can follow in their motion along the jet and we calculated variability physical parameters, as described in more details in [8]. We observed a progressive increase in the variability Doppler factor associated with a progressive decrease in the variability viewing angle, where the component related to the main γ-ray flare, component N4, has the largest doppler factor (δ∼30) and the smallest viewing angle (θ = 1.2 ° ). Hence, we also found in this source evidence of a reorientation of the emitting region during the γ-ray flare as in 3C 120.
We found that component N4 was ejected in 2012.49 ± 0.11, within a time range between 47 and 127 days before the main γ-ray flare in 2012 (2012.73). This leads us to conclude that the bright γ-ray flare took place at a de-projected distance (considering θ = 1.2 ° ) >5 pc downstream of the core.

4. Conclusions

We performed two multi-wavelength studies, on the radio galaxy 3C 120 and the blazar CTA 102, during unprecedented γ-ray flares for both sources which have been already presented in [7,8]. Here we compare the main results obtained in both analysis. It is interesting to note that despite representing very different classes of AGN, the radio galaxy 3C 120 and the blazar CTA 102 display very similar properties during the γ-ray events. In particular we found that the γ-ray outbursts are associated with the passage of new superluminal components through the VLBI core, as seen also in other active galactic nuclei (e.g., [14]). However, not all ejections produce detectable γ-ray flares, and components responsible for the γ-ray emission are not necessary bright components. One of the key aspect to detect γ-ray emission is the orientation of the emitting region. In fact, components associated with the γ-ray flares move in a direction closer to our line of sight, leading to an increase in the Doppler factor, therefore enhancing the γ-ray emission above the flux detectable by Fermi. In both sources, the γ-ray events happened close to the millimeter core.
In both 3C 120 and CTA 102 the mm-VLBI core is located parsecs away from the black hole, at a distance of ∼10 4 - 5 Schwarzschild radii [15,16]. Hence, the location of the γ-ray dissipation zone close to the mm-VLBI core in both sources and at such distances from the black hole lead us to suggest the synchrotron self Compton mechanism for the production of γ-ray photons in both sources, due to the difficulty of having contributions of photons from the disk or the broad line region and probably also from the molecular torus.
It is important to note that the location of the γ-ray emission close to the mm-VLBI core and far from the black hole supports the hypothesis of a recollimation shock in the core.
From these studies we conclude that in both radio galaxies and blazars, the γ-ray flares, often in coincidence with outbursts at other energy bands, are related to the orientation of the jet and to the interaction between a moving and a stationary shock (the core).

Conflicts of Interest

The authors declare no conflict of interest.

References

  1. Tanaka, Y.T.; Cutini, S.; Ciprini, S.; Cheung, C.C.; Buehler, R.; Kocevski, D. Fermi LAT Detection of Gamma-ray Flaring Activity from Broad Line Radio Galaxy 3C 120. Available online: http://www.astronomerstelegram.org/?read=6529 (accessed on 14 September 2016).
  2. Acero, F.; Collaboration, F.-L. Fermi Large Area Telescope Third Source Catalog. Astrophys. J. Suppl. Ser. 2015, 218, 23. [Google Scholar] [CrossRef]
  3. Ciprini, S. Fermi LAT Detection of a GeV Flare from Blazar CTA 102. Available online: http://www.astronomerstelegram.org/?read=8478 (accessed on 14 September 2016).
  4. Orienti, M.; D’Ammando, F. Fermi LAT Detection of a Continuing Increase of Gamma-ray Activity of CTA 102. Available online: http://www.astronomerstelegram.org/?read=4409 (accessed on 14 September 2016).
  5. Larionov, V.; Blinov, D.; Jorstad, S. An Unprecedented Optical Outburst of the Blazar CTA102. Available online: http://www.astronomerstelegram.org/?read=4397 (accessed on 14 September 2016).
  6. Carrasco, L.; Luna, A.; Porras, A.; Mayya, D.Y. NIR Brightening of the Blazar CTA102. Available online: http://www.astronomerstelegram.org/?read=4442 (accessed on 14 September 2016).
  7. Casadio, C.; Gómez, J.L.; Grandi, P.; Jorstad, S.G.; Marscher, A.P.; Lister, M.L.; Kovalev, Y.Y.; Savolainen, T.; Ushkarev, A.B. The Connection between the Radio Jet and the Gamma-ray Emission in the Radio Galaxy 3C 120. Astrophys. J. 2015, 808, 162. [Google Scholar] [CrossRef]
  8. Casadio, C.; Gómez, J.L.; Jorstad, S.G.; Marscher, A.P.; Larionov, V.M.; Smith, P.S.; Gurwell, M.A.; Lähteenmäki, A.; Agudo, I.; Molina, S.N.; et al. A Multi-wavelength Polarimetric Study of the Blazar CTA 102 during a Gamma-Ray Flare in 2012. Astrophys. J. 2015, 813, 51. [Google Scholar] [CrossRef]
  9. Lister, M.L.; Cohen, M.H.; Homan, D.C.; Kadler, M.; Kellermann, K.I.; Kovalev, Y.Y.; Ros, E.; Savolainen, T.; Zensus, J.A. MOJAVE: Monitoring of Jets in Active Galactic Nuclei with VLBA Experiments. VI. Kinematics Analysis of a Complete Sample of Blazar Jets. Astrophys. J. 2009, 138, 1874–1892. [Google Scholar] [CrossRef]
  10. Jorstad, S.G.; Marscher, A.P.; Lister, M.L.; Stirling, A.M.; Cawthorne, T.V.; Gear, W.K.; Gomez, J.L.; Stevens, J.A.; Smith, P.S.; Forster, J.R.; et al. Polarimetric Observations of 15 Active Galactic Nuclei at High Frequencies: Jet Kinematics from Bimonthly Monitoring with the Very Long Baseline Array. Astrophys. J. 2005, 130, 1418–1465. [Google Scholar] [CrossRef]
  11. Marscher, A.P.; Gear, W.K. Models for high-frequency radio outbursts in extragalactic sources, with application to the early 1983 millimeter-to-infrared flare of 3C 273. Astrophys. J. 1985, 298, 114–127. [Google Scholar] [CrossRef]
  12. Caproni, A.; Abraham, Z. Can long-term periodic variability and jet helicity in 3C 120 be explained by jet precession? Mon. Not. R. Astron. Soc. 2004, 349, 1218–1226. [Google Scholar] [CrossRef]
  13. Janiak, M.; Sikora, M.; Moderski, R. Application of the spine-layer jet radiation model to outbursts in the broad-line radio galaxy 3C 120. Mon. Not. R. Astron. Soc. 2016, 458, 2360–2370. [Google Scholar] [CrossRef]
  14. Jorstad, S.G.; Marscher, A.P.; Smith, P.S.; Larionov, V.M.; Agudo, I.; Gurwell, M.; Wehrle, A.E.; Lähteenmäki, A.; Nikolashvili, M.G.; Schmidt, G.D.; et al. A Tight Connection between Gamma-Ray Outbursts and Parsec-scale Jet Activity in the Quasar 3C 454.3. Astrophys. J. 2013, 773, 147. [Google Scholar] [CrossRef]
  15. Marscher, A.P.; Jorstad, S.G.; Gómez, J.L.; Aller, M.A.; Teräsranta, H.; Lister, M.L.; Stirling, A.M. Observational evidence for the accretion-disk origin for a radio jet in an active galaxy. Nature 2002, 417, 625–627. [Google Scholar] [CrossRef] [PubMed]
  16. Fromm, C.M.; Perucho, M.; Ros, E.; Savolainen, T.; Zensus, J.A. On the location of the supermassive black hole in CTA 102. Astron. Astrophys. 2015, 576, A43. [Google Scholar] [CrossRef]
Figure 1. Left and center: Sequence of total intensity 15 GHz (left) and 43 GHz (center) VLBA images of 3C 120. The images show the appearance of components E4 and d11. Contours are traced at 0.0015, 0.004, 0.009, 0.02, 0.05, 0.10, 0.30, 0.60, 1.20 Jy/beam, in the 15 GHz sequence, and at 0.003, 0.006, 0.014, 0.03, 0.07, 0.15, 0.34, 0.74, 1.64 Jy/beam, in the 43 GHz image. Red circles represent model-fits components; Right: 15 GHz and 43 GHz light curves of the total intensity peaks and main model-fit components (top) and distance from the core vs. time (bottom) for the 43 GHz model-fit components. Grey shaded areas correspond to the γ-ray flares.
Galaxies 04 00034 g001
Figure 2. Light curves of CTA 102 from γ-ray to millimeter wavelengths. From top to bottom: γ-ray, X-ray, UV, optical, NIR, and millimeter-wave data; Left panel: data from May 2004 to January 2014; Right panel: expanded view during the γ-ray outburst between August and November 2012. Reproduced from [8] by permission of the AAS.
Galaxies 04 00034 g002
Figure 3. Left and center: Sequence of total intensity (in contours) and linearly polarized intensity (in colors) 43 GHz VLBA images of CTA 102. Contours are traced at 0.003, 0.008, 0.04, 0.1, 0.3, 0.6, 1.2, 1.8, 2.5, and 3.0 Jy beam - 1 . The images show the appearance of components N1 and N4. Red circles represent model-fits components; Right: Light curves (top) and distance from the core vs. time for the 43 GHz model-fit components. The grey vertical line corresponds to the main γ-ray flare and the green ones to the minor γ-ray flares in June 2011 and April 2013.
Galaxies 04 00034 g003
Table 1. γ-ray detections of 3C 120 in the energy range 0.5–100 GeV as we obtained from the 15 days-bin analysis. We report the integration time in MJD and date, the flux with the corresponding error in 10 - 8 photon cm - 2 s - 1 and the TS value associated with each γ-ray detection.
MJDDateFluxErrTS
56264−562793 December–18 December 20121.410.6010.6
56549−5656414 September–29 September 20131.650.5421.6
56564−5657929 September–14 October 20131.310.5313.3
56774−5678927 April–12 May 20141.150.5210.4
56819−5683411 June–26 June 20141.470.5913.8
56924−5693924 September–9 October 20142.520.8618.4

