Article

Polarization Vector Rotations: Real, Spurious, Hidden and Imaginary

by
Valeri M. Larionov
1,*,
Svetlana G. Jorstad
1,2,
Alan P. Marscher
2 and
Paul S. Smith
3
1
Astronomical Institute, St.-Petersburg State University, St.-Petersburg 198504, Russia
2
Institute for Astrophysical Research, Boston University, Boston, MA 02215, USA
3
Steward Observatory, University of Arizona, Tucson, AZ 85721, USA
*
Author to whom correspondence should be addressed.
Galaxies 2016, 4(4), 43; https://doi.org/10.3390/galaxies4040043
Submission received: 14 July 2016 / Revised: 26 September 2016 / Accepted: 27 September 2016 / Published: 11 October 2016
(This article belongs to the Special Issue Blazars through Sharp Multi-wavelength Eyes)

Abstract

:
Large and variable polarization is an inherent property of a majority of blazars. Systematic rotations of the polarization vector have been claimed for several blazars. In some cases, however, the reality of these rotations may be questionable. We suggest an additional method for the verification of the reality of polarization position angle rotations based on the correlation of the normalized Stokes parameters.

1. Introduction

Blazars represent a subclass of active galactic nuclei whose jets are closely aligned to our line of sight. Soon after their discovery, it was found that they possess very high polarization that may reach tens of per cent, and that the polarization varies on the time scales as short as minutes. This led to several monitoring campaigns that aimed to find connections between polarimetric variability and total flux variations, especially during major outbursts [1,2,3,4]. Theoretical models developed to explain the observed behaviour of the polarization degree ( P D ) and electric vector positional angle ( E V P A ) split into two large groups: deterministic and stochastic. Examples of deterministic models that consider the propagation of a shock wave along a helical path down the jet and take into account the variations of the viewing angle, Doppler factor, and time contraction can be found in [1,3,5,6]. Another approach is suggested by Marscher in [7], where the variations in flux and polarization are caused by continuous noise processes. A variety of models attempting to explain E V P A rotations are also presented in a recent paper [8]. Of course, it may be that both deterministic and stochastic behaviour may occur, with different relative contributions to the overall variations observed at any given time. It is generally believed that when a blazar is observed for a long period of time and only demonstrates rotations in the E V P A in the same direction, that it confirms the existence (or, at least, provides evidence in favour) of helical structure of the magnetic field within the jet. However, before applying a specific model to explain the observational behaviour of polarization parameters, it is necessary to ensure that the systematic rotation of the E V P A is really present and not an artifact caused by improperly interpreting the observational data.
During the last few years, several attempts to assess the risk of false discoveries of E V P A rotations have been made [8,9,10]. Kiehlmann et al.—based on a long-term (2008–2010) dense data set of 3C 279 [8]—determine the probability of reproducing the observed polarization variability with a random walk process. They conclude that two different processes govern polarization variations, depending on the brightness of the blazar. A stochastic process appears to apply during low-brightness states, and a deterministic process becomes dominant during flaring activity. They also show that the large systematic E V P A swing reported by [4] is an artifact caused by undersampled data. Blinov et al. in [10], based on the two-year observational data set of the ROBOPOL project, arrive at several important conclusions. Particularly: (1) there is no statistical association of the rotations with contemporaneous optical flares; (2) the average P D during the rotations tends to be lower than that in a non-rotating state. In this paper, we critically analyse the existing approaches based on E V P A changes alone and suggest another way of looking at polarimetric data. All optical data presented here are obtained at St. Petersburg University (LX-200 at St. Petersburg, AZT-8 at Ctimean Observatory), Boston University (Perkins telescope at Lowell Observatory), and Steward Observatory (Kuiper and Bok telescopes).

2. Search for Rotations

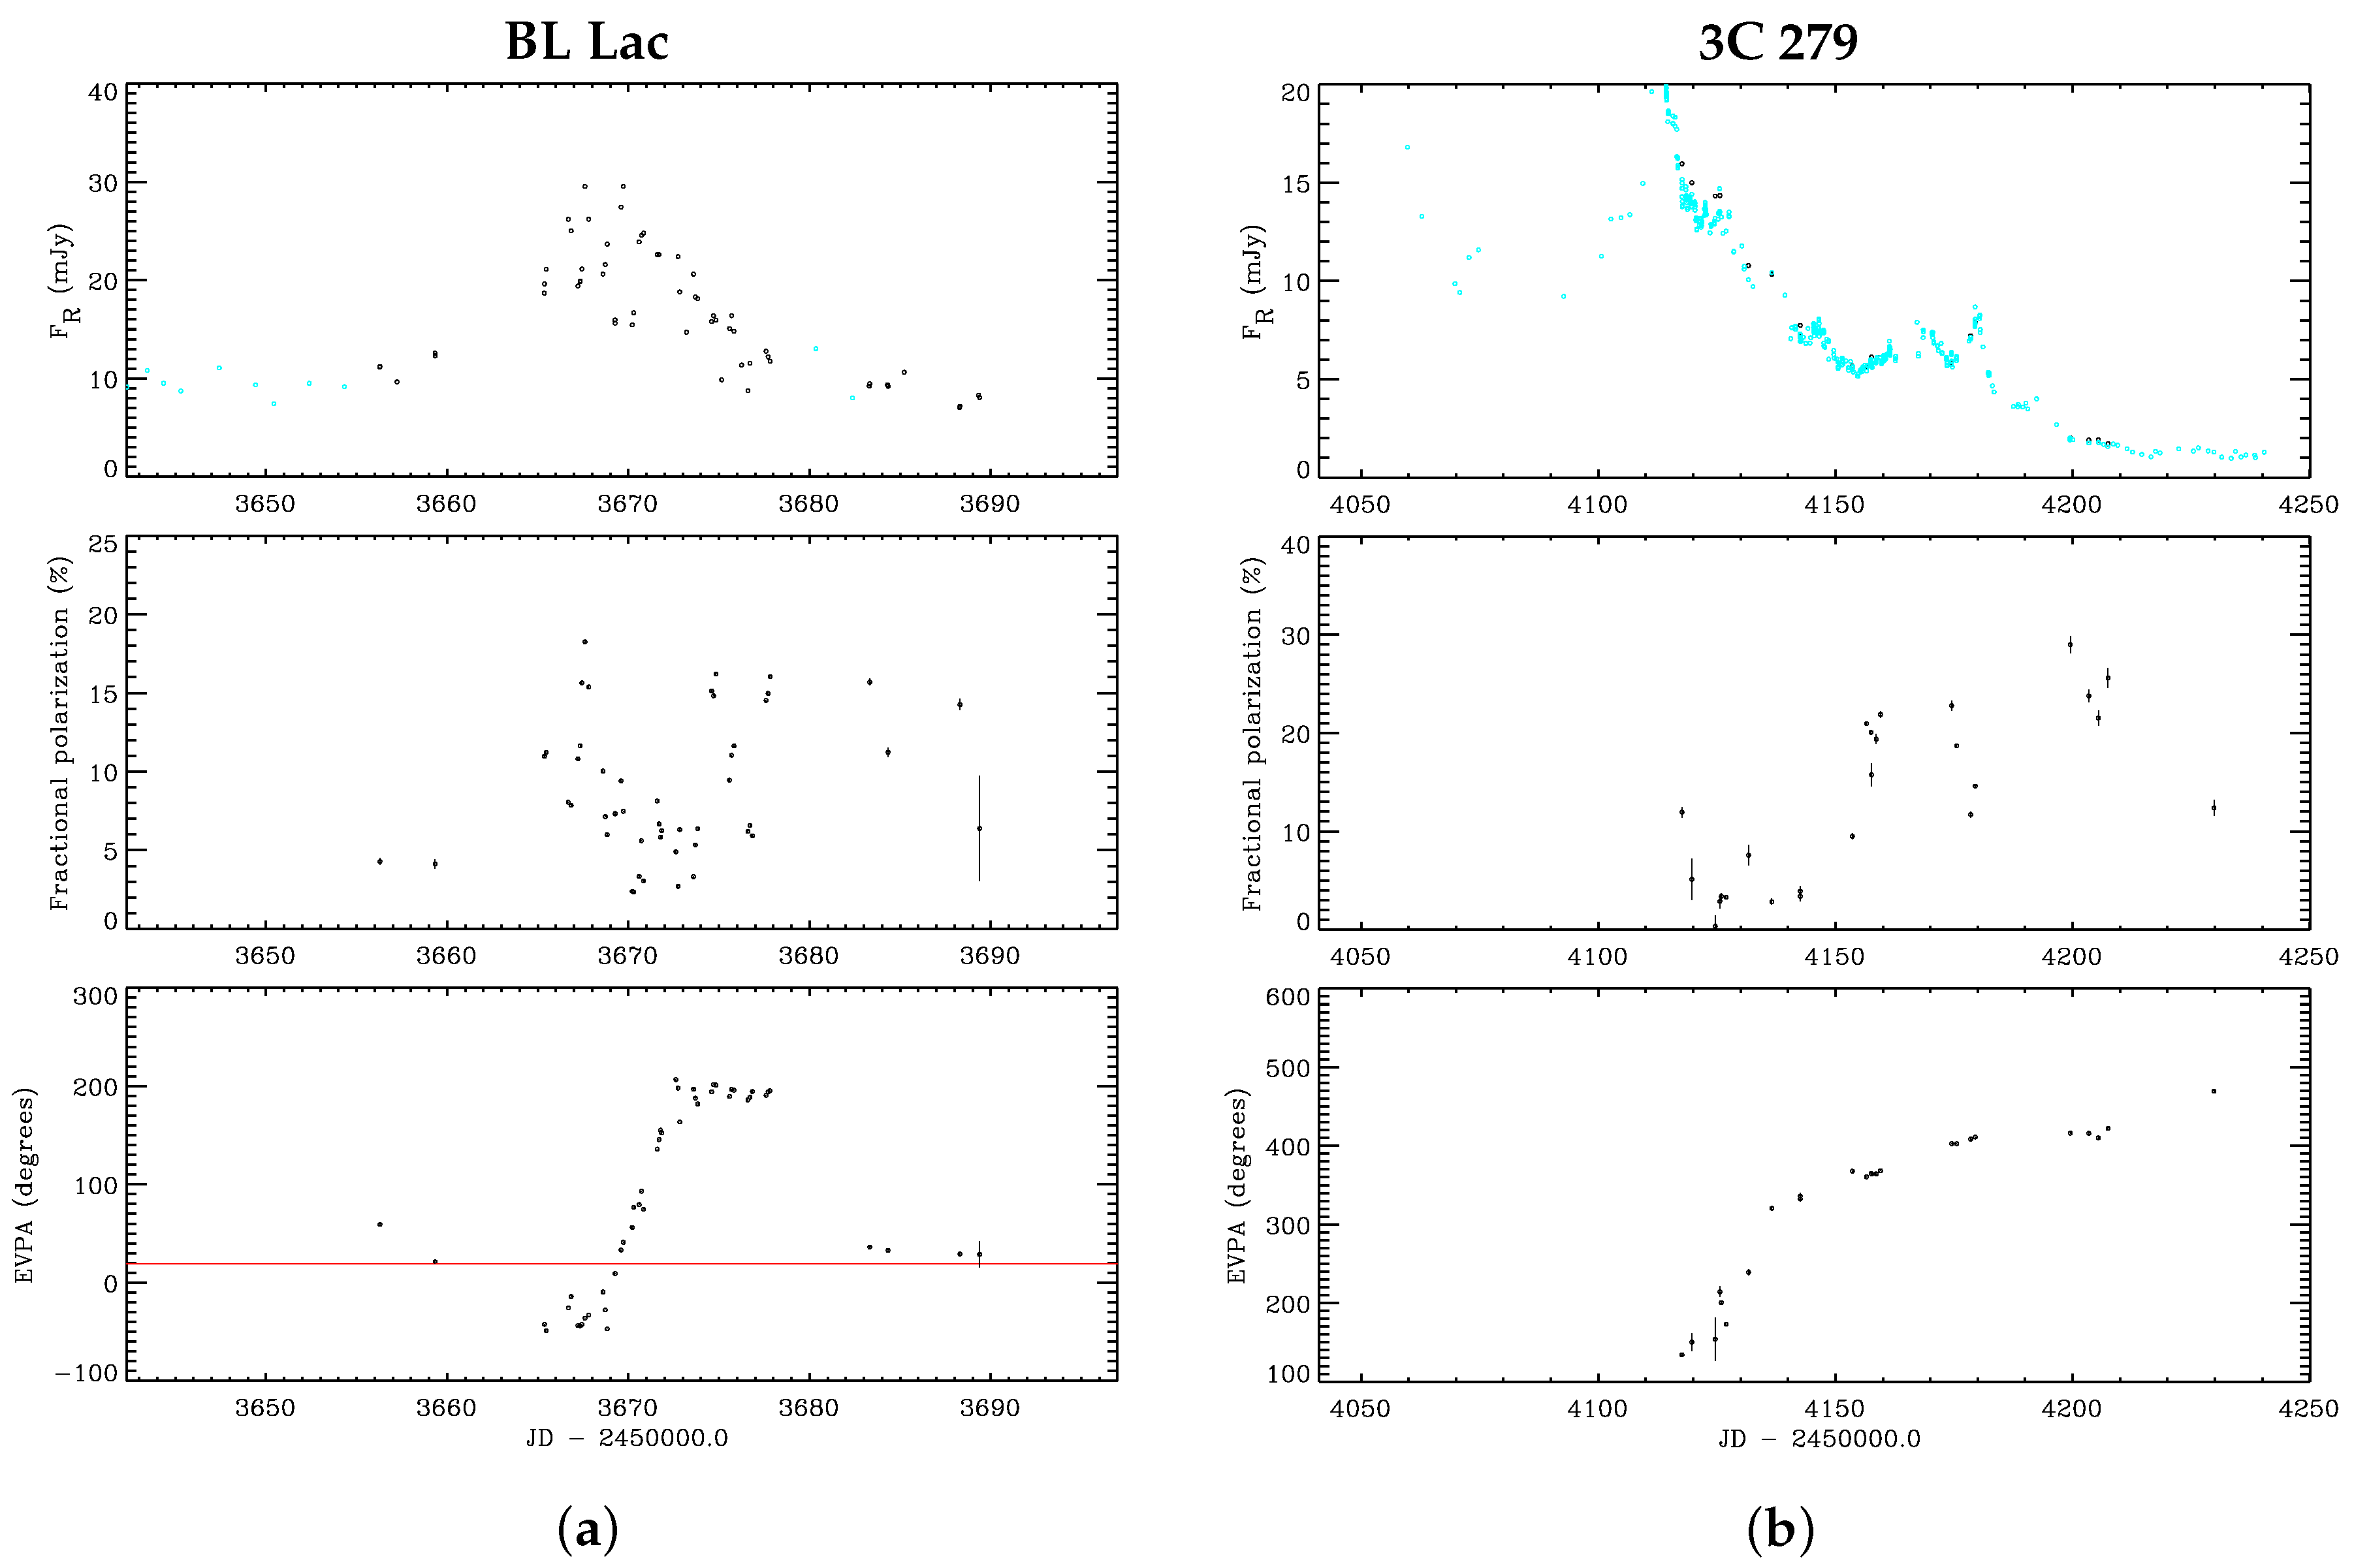
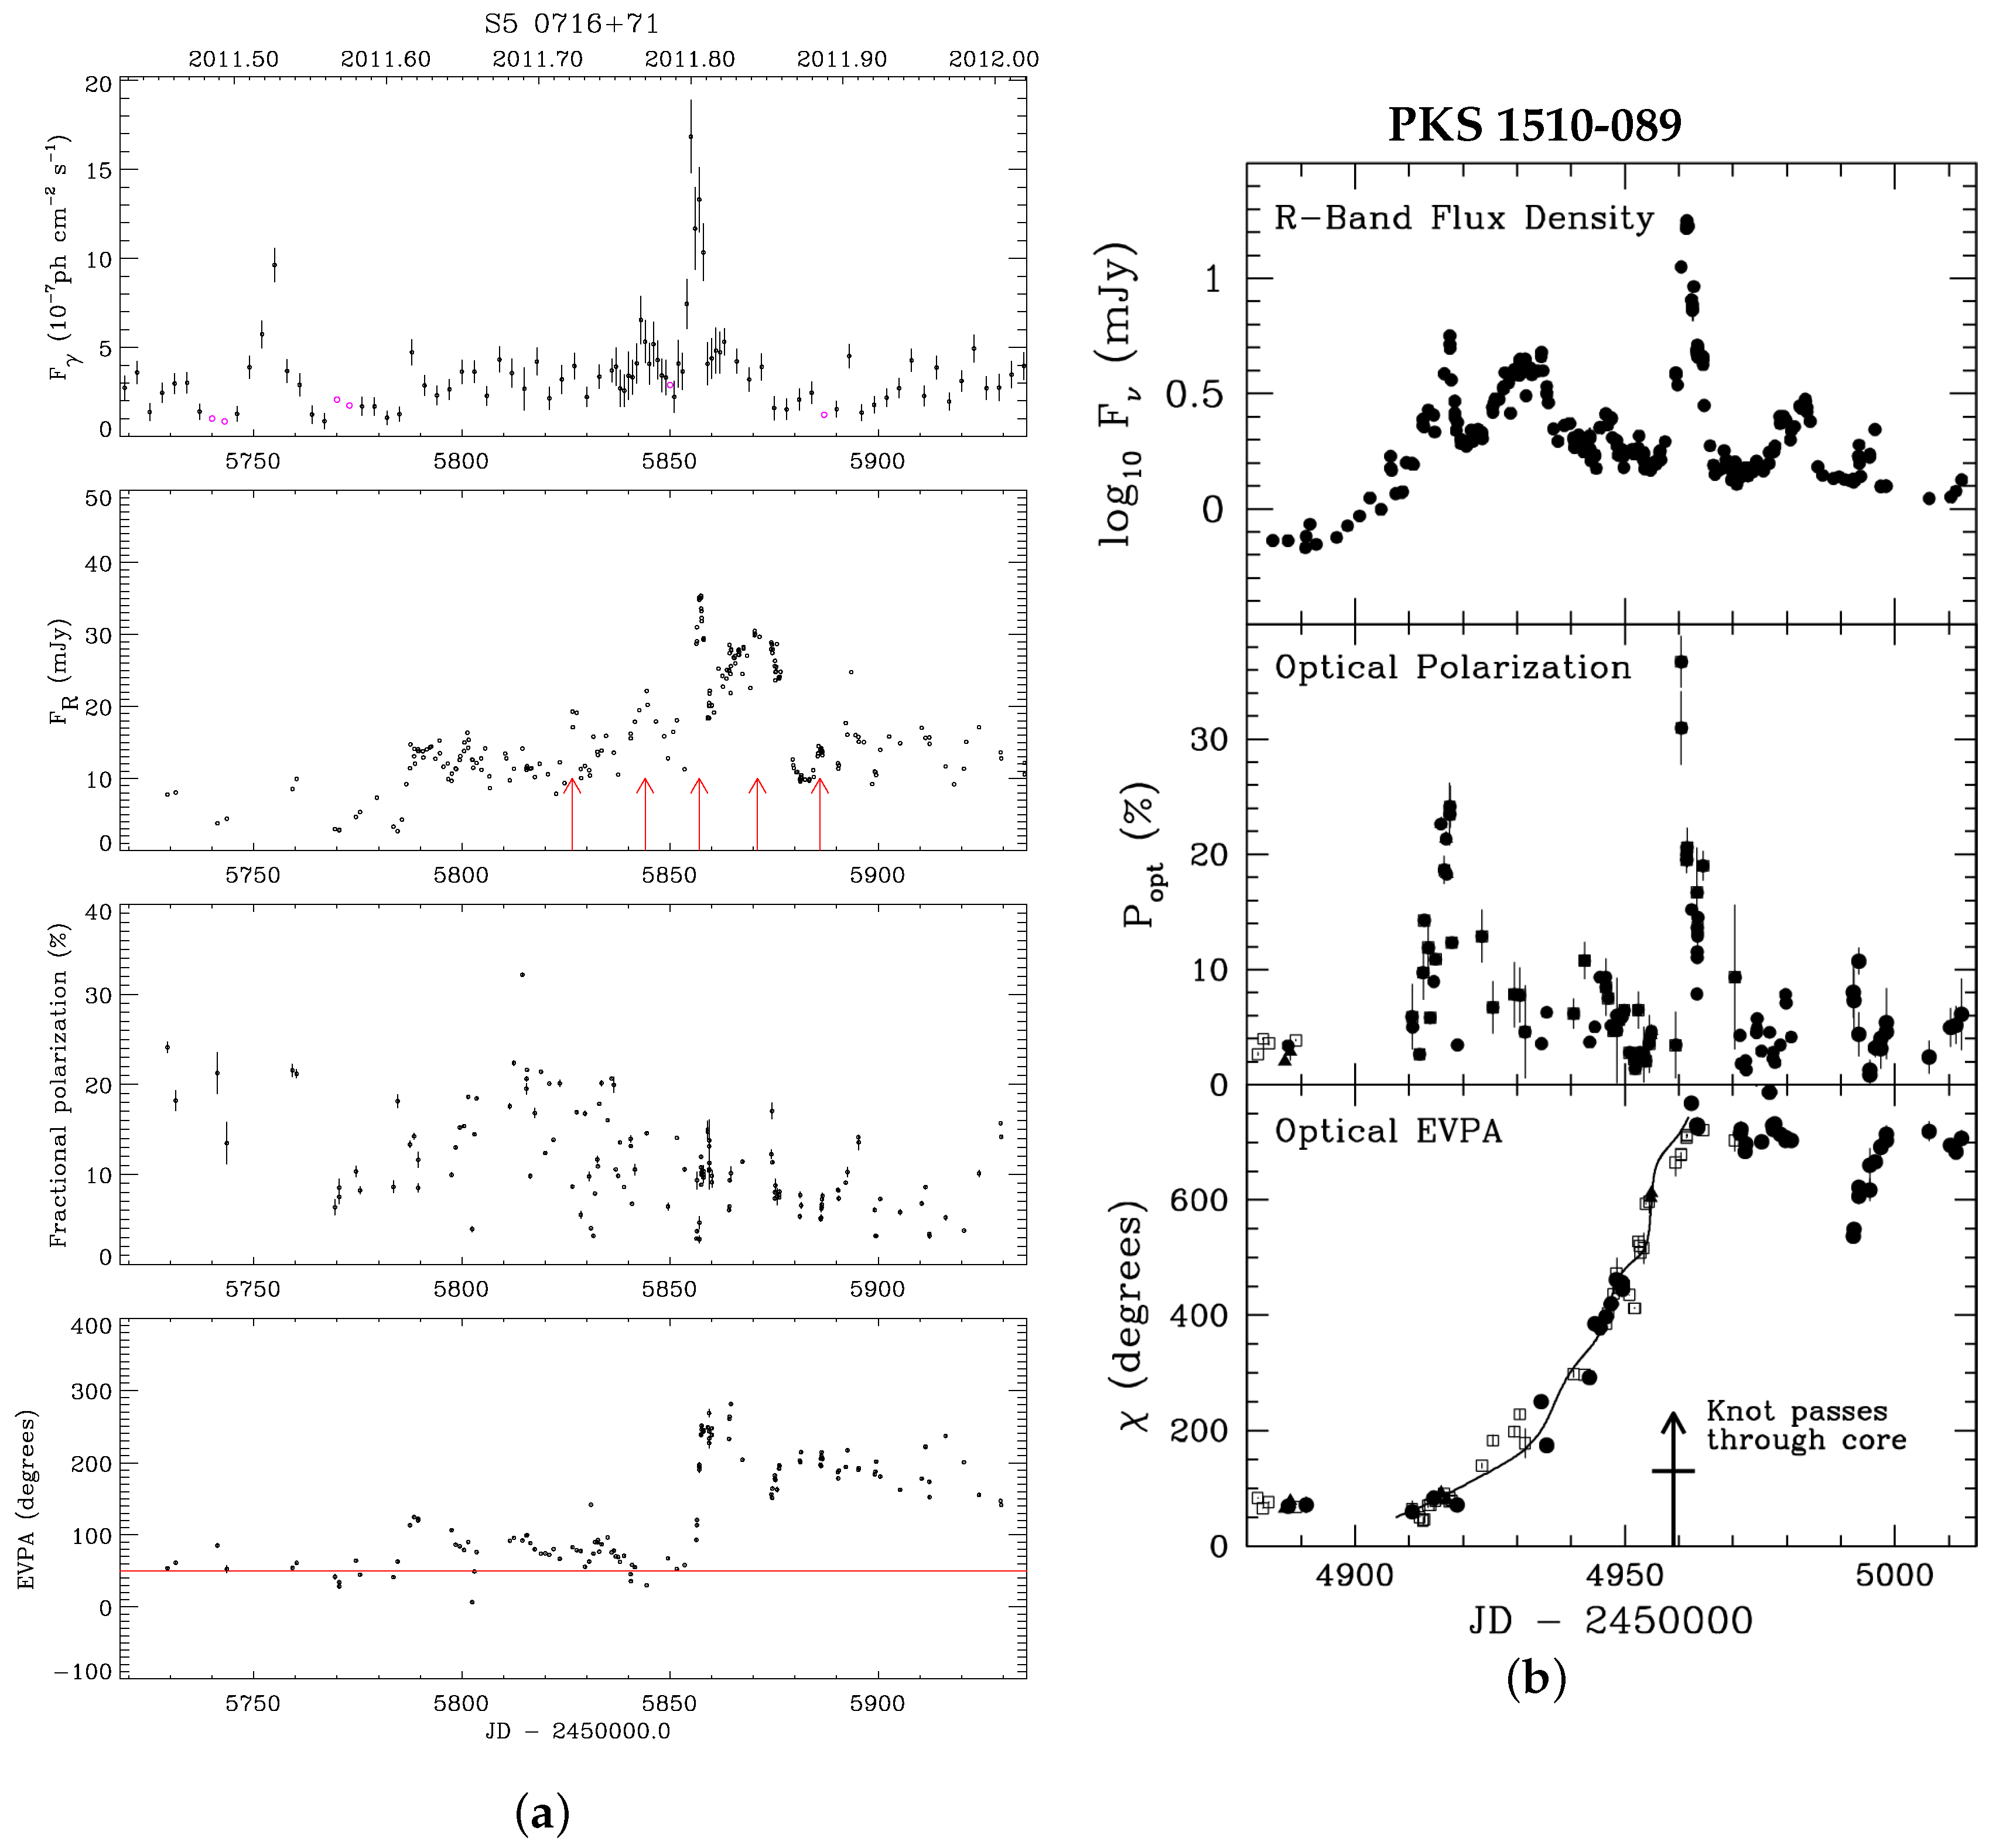
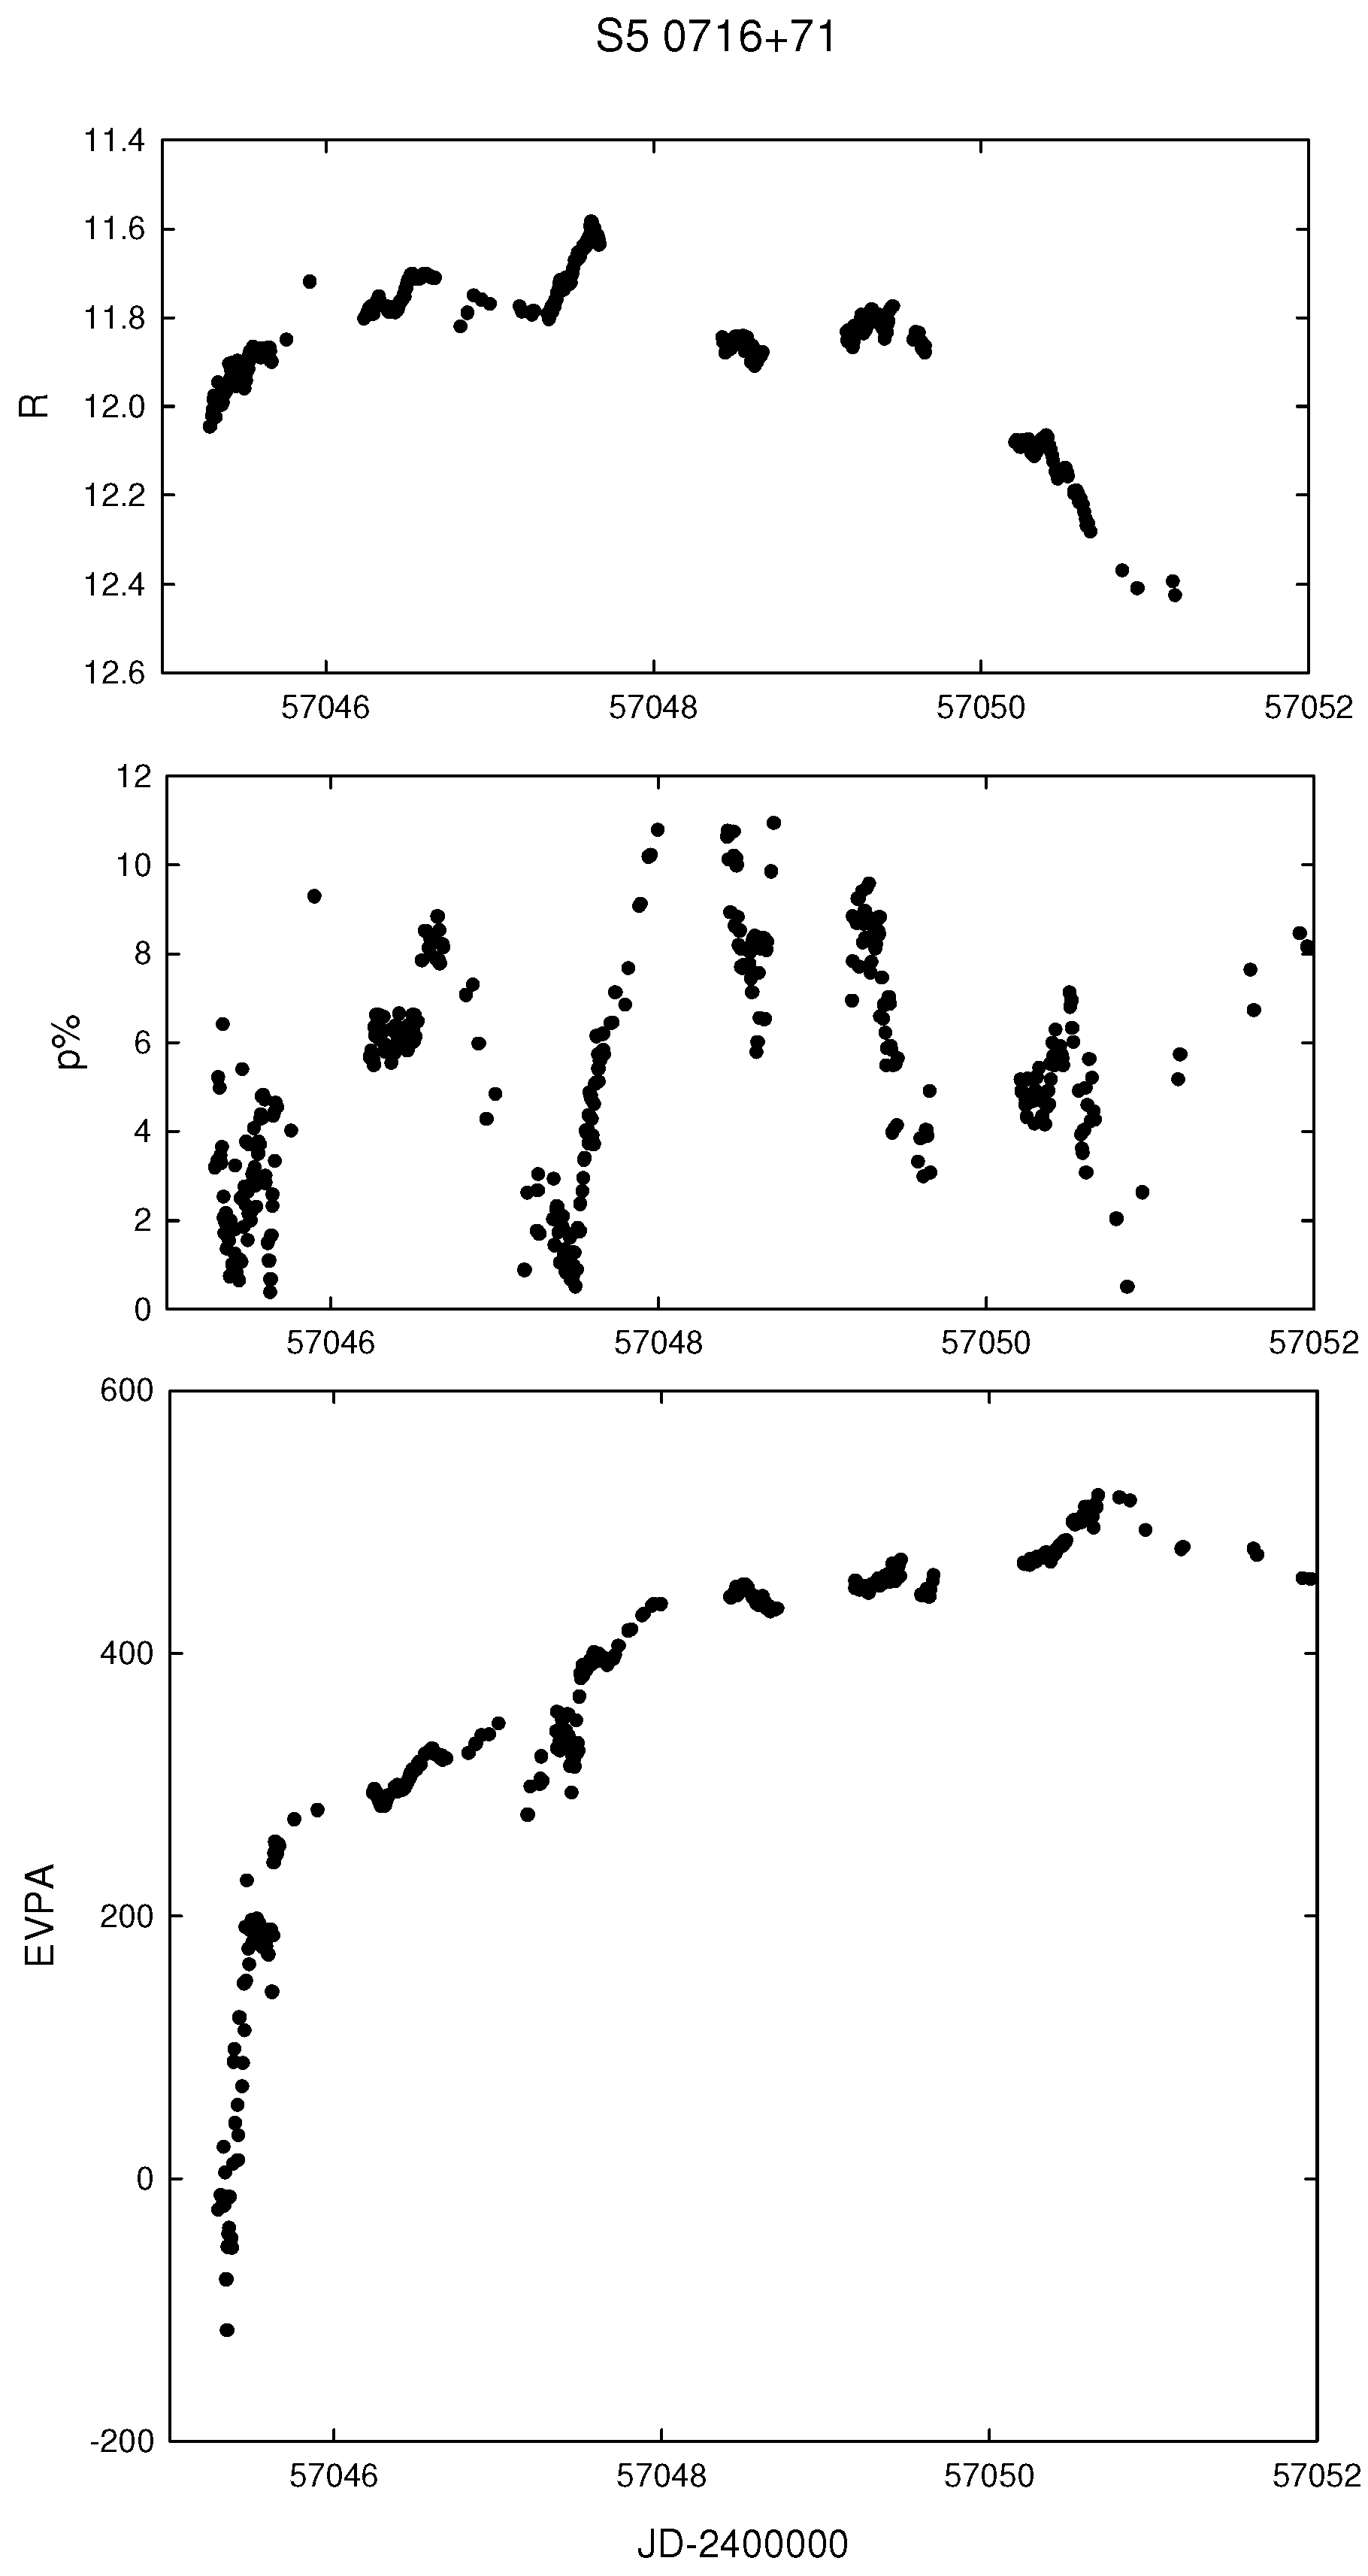
2.1. Rotations: Real

The results of earlier efforts to observe polarimetric rotations in blazars (though with somewhat sparse sampling) are given in [11] (OJ 287) and [12] (BL Lac). Several examples of densely-sampled reliable cases of rotations are given in [1,2,3,5,6] for BL Lac, 3C 279, PKS 1510-089, and S5 0716+71, (see also Figure 1 and Figure 2). All of these cases of definite rotations occurred during or close to major optical and/or γ-ray outbursts and to ejections of new superluminal VLBI jet components. Numerous cases of rotations are also reported in [9,10].
One of the most representative examples of ultra-fast rotation of the E V P A is shown in Figure 3 for S5 0716+71 during its huge outburst in January 2015. Over 10 days, photometric and polarization data were obtained from two hemispheres (St. Petersburg + Crimea + Arizona) with a maximum gap between adjacent observations not exceeding 0.4 day. The intra-night sampling density was of the order of a few minutes. We observed a 300 ° rotation during 4 h (40 data points) during the night of 22 January 2015, and another 300 ° rotation during next five nights (340 data points).

2.2. Rotations: Spurious and False

By definition, fractional polarization P D = ( q 2 + u 2 ) 1 / 2 and positional angle χ ( EVPA )   = 1 / 2 · arctan ( u / q ) , where q and u are the normalized linear Stokes parameters. In principle, any change of χ may be called “rotation”, but usually for blazars, we are interested in cases when a succession of polarimetric measurements shows a monotonic increase or decrease in χ. The position angle χ is defined in the range [ 0 ° , 180 ° ) or [– 90 ° , + 90 ° ), dependent on the observer’s preference. This leads to an n π ambiguity—there is no mathematically unique way to prefer the value χ over χ ± n π . In order to preserve smoothness of temporal variations of χ, we resolve the ± 180 ° ambiguity by adding or subtracting 180 ° each time the subsequent value of the χ is > 90 ° less/more than the preceding one and the time interval between adjacent points is small enough to consider them as causally related. The improper choice of this time interval may lead to a “discovery” of rotation, where it would be better to refrain from claiming this finding. Another possibility that can lead to incorrect conclusions concerning the variations observed in χ is a neglect of the dependence of the uncertainty in χ on the uncertainty estimated for P D and on P D itself:
σ χ = 28 . ° 6 · σ P D / P D
When the P D is close to 0, even small variations of positional angle may lead to the identification of rotations that actually did not occur. To illustrate this possibility, we take the observed polarization data for 3C 279, replace the values of χ with a constant and add a random value that is within the range of the observational uncertainties in the position angle measurements. We then define a “suspicious rotation” when three consecutive measurements show monotonic rotations of the E V P A exceeding 120 ° . We repeat these simulations several dozen times, identifying suspicious parts of the polarimetric curve. In Figure 4, red vertical bars mark the positions of possible false rotations. Of course, it is not necessary that all of the positions found this way correspond to false detections, but one should be cautious and look for additional evidence in favour of or against these rotations. However, if in the certain time interval (e.g., around TJD 5300 in Figure 4) we see a concentration of false detections, it most probably means that the rotation of E V P A is false. After arriving at this negative conclusion, we inspected the P D and flux behaviour around this time interval. It is not unexpected that the P D was close to the lowest values for all of this period, and the flux level was also close to the minimum observed.
This result may be compared to the findings in [10], who mention that there is no statistical association of the rotations with contemporaneous optical flares, and that the average P D during the rotations tends to be lower than that in a non-rotating state. Our reasoning suggests that at lower levels of polarization, there is a larger chance of falsely identifying a systematic rotation. This is both because the polarimetric signal-to-noise ratio is generally lower when P D is near 0, and the fact that in these cases, relatively small variations in the Stokes parameters can yield large rotations in χ.

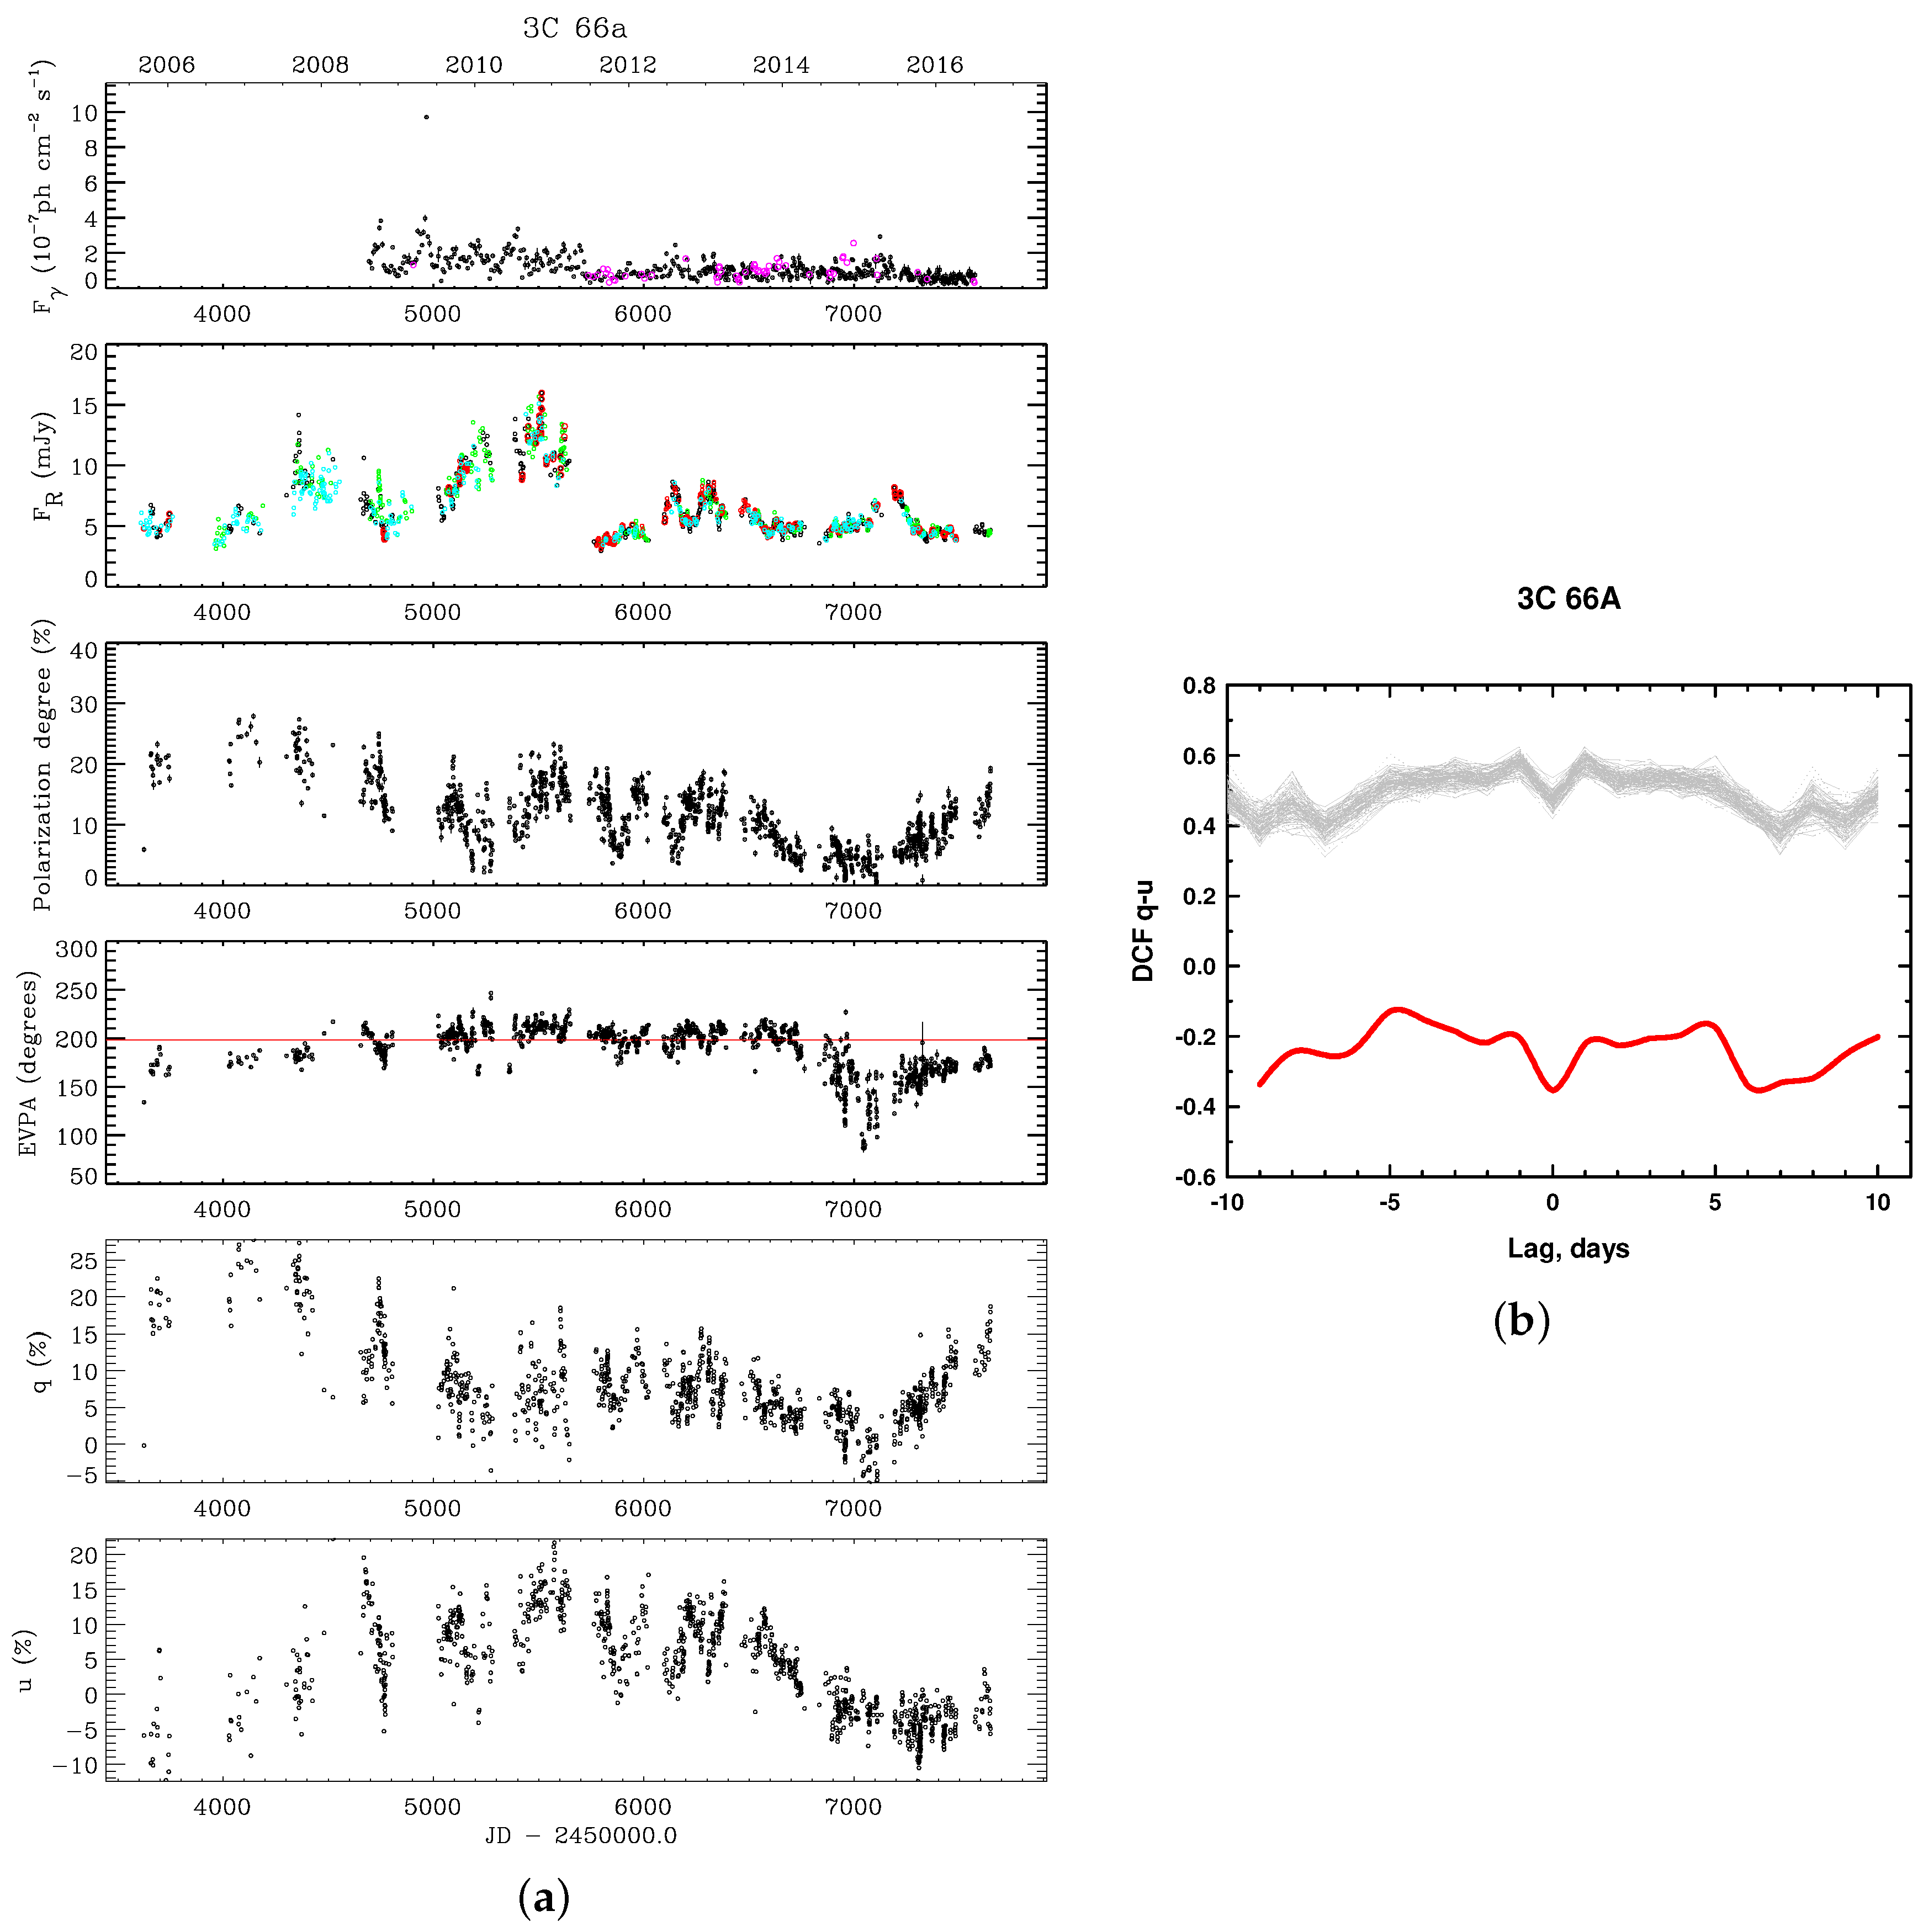
2.3. Rotations: Hidden

We recall the definition of normalized Stokes parameters: q = P D · cos ( 2 χ ) and q = P D · sin ( 2 χ ) . Therefore, if a monotonic rotation is present during the temporal evolution of the polarization parameters, the curves q ( t ) and u ( t ) must have a systematic shift relative to each other. In the opposite case, when only stochastic variability is present, no systematic shift is expected. Which of the cases is dominant may be tested, e.g., with the use of the discrete correlation function (DCF, see [13]). In addition, the direction of rotation (if rotation is indeed present) is obtained from the sign of the DCF slope at lag = 0: negative slope corresponds to anticlockwise rotation and vice versa. The distance between peaks with the same sign corresponds to the time interval for a 180 ° rotation. If the position of DCF extremum is at lag = 0, than it corresponds to the lack of rotation.
In Figure 5, we give an example of the latter case, when the variations of Stokes parameters of 3C 66A do not contain a regular pattern on short time scales. Gray lines correspond to 100 Monte Carlo simulations within the assumption that there is no regular periodic variability of E V P A , and the values of P D are taken from our observational dataset.
We see remarkable similarity between real and simulated DCFs, which immediately allows us to conclude that for the entire polarimetric data set of this blazar, no regular rotation can be found.
An example of different behaviour is given in Figure 6. The blazar CTA 102 demonstrates persistent clockwise rotation, as shown in [6]. It is remarkable that from the E V P A behaviour during the 2012 outburst, it is not possible to speak about rotations in a customary sense. However, the DCF analysis not only reveals the rotation during that time interval, but shows that it has a higher significance than the total data set.

3. Discussion

In the process of the examination of real observational polarimetric data, statistically and/or intrinsically noisy data and the inevitable gaps caused by the weather and visibility, consideration of only the changes of E V P A may lead both to false detections of rotations and to missing such events. We suggest that the analysis of the temporal variability of the normalized Stokes parameters q and u and calculating time lags between them using, for example, the discrete correlation function. In this way, it may be possible to uncover inherent periodic components in the polarimetric data set of blazar and to discard false detections, despite their attractiveness. The ability to use an entire polarimetric data set in a search of deterministic rotations in the EVPA is an evident advantage of this method. However, there are restrictions to this approach. For example, we cannot exclude the fact that even if the pattern caused by rotation is present in the whole data set of a given blazar, the time scale of variability may change, due to changes of viewing angle and corresponding changes of Doppler factor.

Acknowledgments

This work was supported by St.-Petersburg University research grants 6.38.335.2015, 6.42.1113.2016, travel grant 6.41.1301.2016 and RFBR grant 15-02-00949. The research at BU was supported in part by NASA grants NNX14AQ58G and NNX15AR34G. Blazar research at Steward Observatory is supported by NASA grants NNX08AW56G, NNX09AU10G, NNX12AO93G, and NNX12AU81G.

Author Contributions

All authors have participated in both the analysis and the scientific discussion.

Conflicts of Interest

The founding sponsors had no role in the design of the study; in the collection, analyses, or interpretation of data; in the writing of the manuscript, and in the decision to publish the results.

References

  1. Marscher, A.P.; Jorstad, S.G.; D’Arcangelo, F.D.; Smith, P.S.; Williams, G.G.; Larionov, V.M.; Oh, H.; Olmstead, A.R.; Aller, M.F.; Aller, H.D.; et al. The inner jet of an active galactic nucleus as revealed by a radio-to-γ-ray outburst. Nature 2008, 452, 966–969. [Google Scholar] [CrossRef] [PubMed]
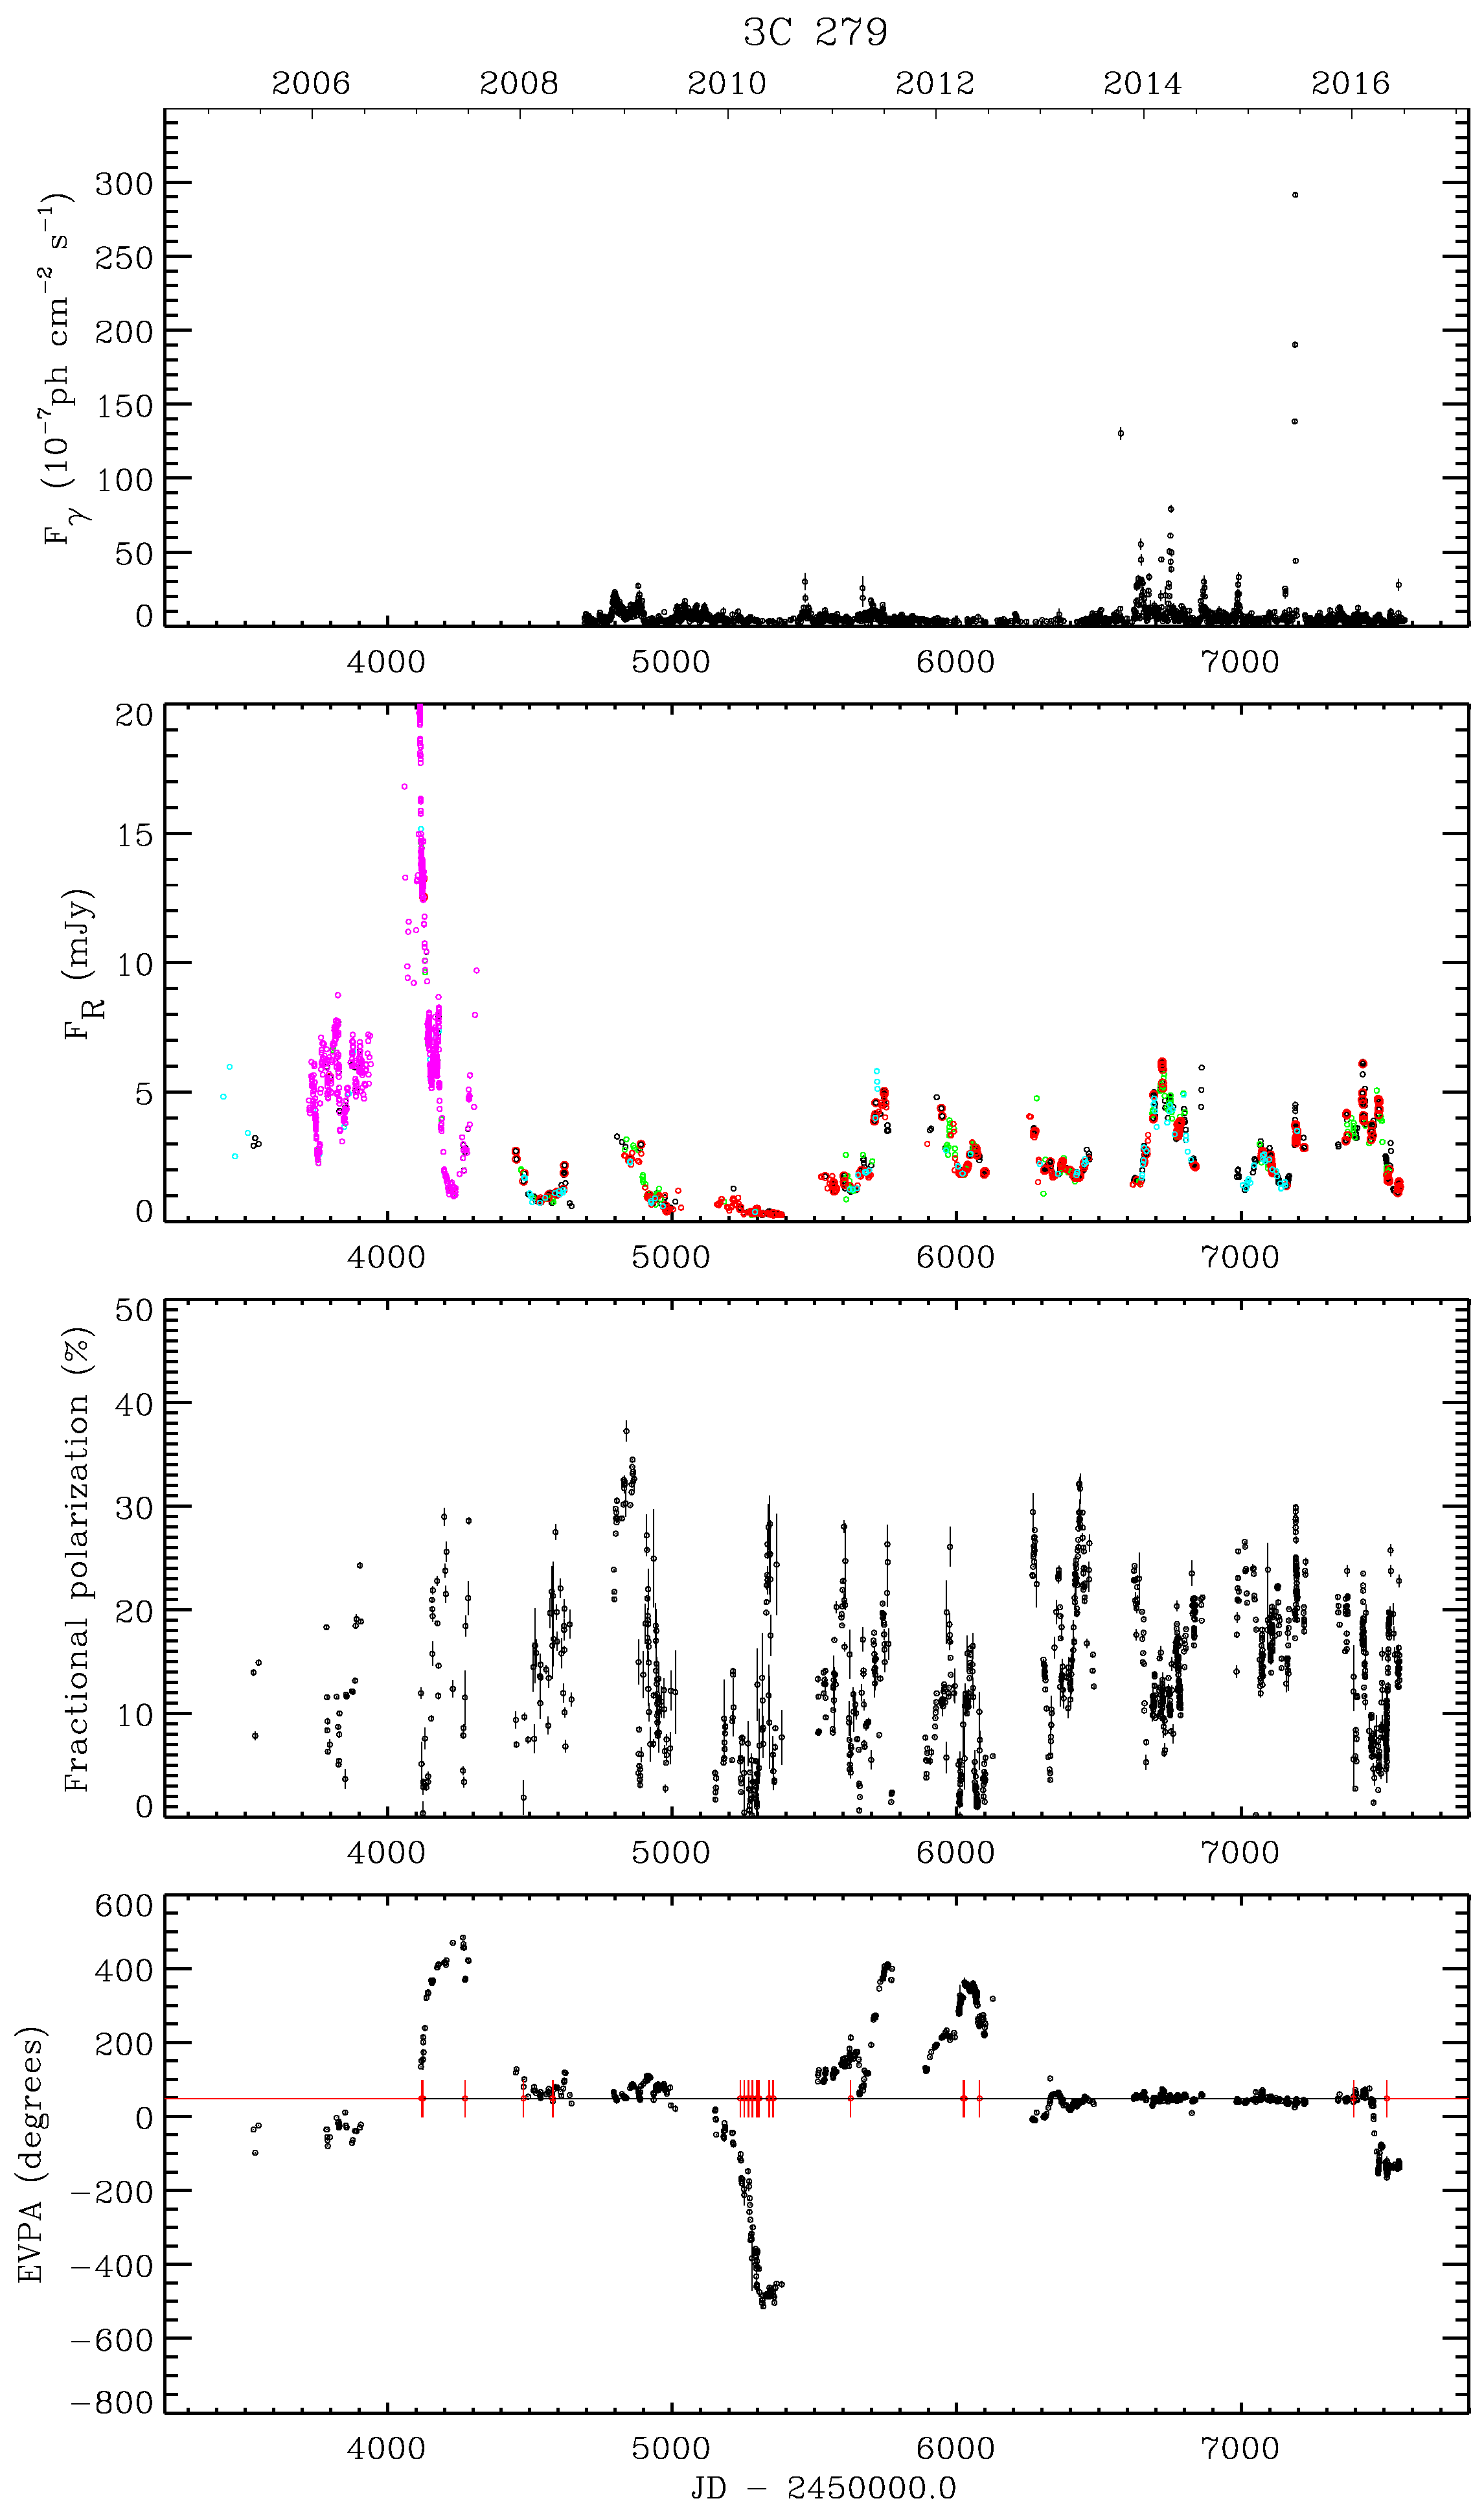
  2. Larionov, V.M.; Jorstad, S.G.; Marscher, A.P.; Raiteri, C.M.; Villata, M.; Agudo, I.; Aller, M.F.; Arkharov, A.A.; Asfandiyarov, I.M.; Bach, U.; et al. Results of WEBT, VLBA and RXTE monitoring of 3C 279 during 2006–2007. Astron. Astrophys. 2008, 492, 389–400. [Google Scholar] [CrossRef]
  3. Marscher, A.P.; Jorstad, S.G.; Larionov, V.M.; Aller, M.F.; Aller, H.D.; Lähteenmäki, A.; Agudo, I.; Smith, P.S.; Gurwell, M.; Hagen-Thorn, V.A.; et al. Probing the Inner Jet of the Quasar PKS 1510-089 with Multi-Waveband Monitoring During Strong Gamma-Ray Activity. Astrophys. J. 2010, 710, L126–L131. [Google Scholar] [CrossRef]
  4. Abdo, A.A.; Ackermann, M.; Ajello, M.; Axelsson, M.; Baldini, L.; Ballet, J.; Barbiellini, G.; Bastieri, D.; Baughman, B.M.; Bechtol, K.; et al. A change in the optical polarization associated with a γ-ray flare in the blazar 3C 279. Nature 2010, 463, 919–923. [Google Scholar] [CrossRef] [PubMed]
  5. Larionov, V.M.; Jorstad, S.G.; Marscher, A.P.; Morozova, D.A.; Blinov, D.A.; Hagen-Thorn, V.A.; Konstantinova, T.S.; Kopatskaya, E.N.; Larionova, L.V.; Larionova, E.G.; et al. The Outburst of the Blazar S5 0716+71 in 2011 October: Shock in a Helical Jet. Astrophys. J. 2013, 768, 40. [Google Scholar] [CrossRef]
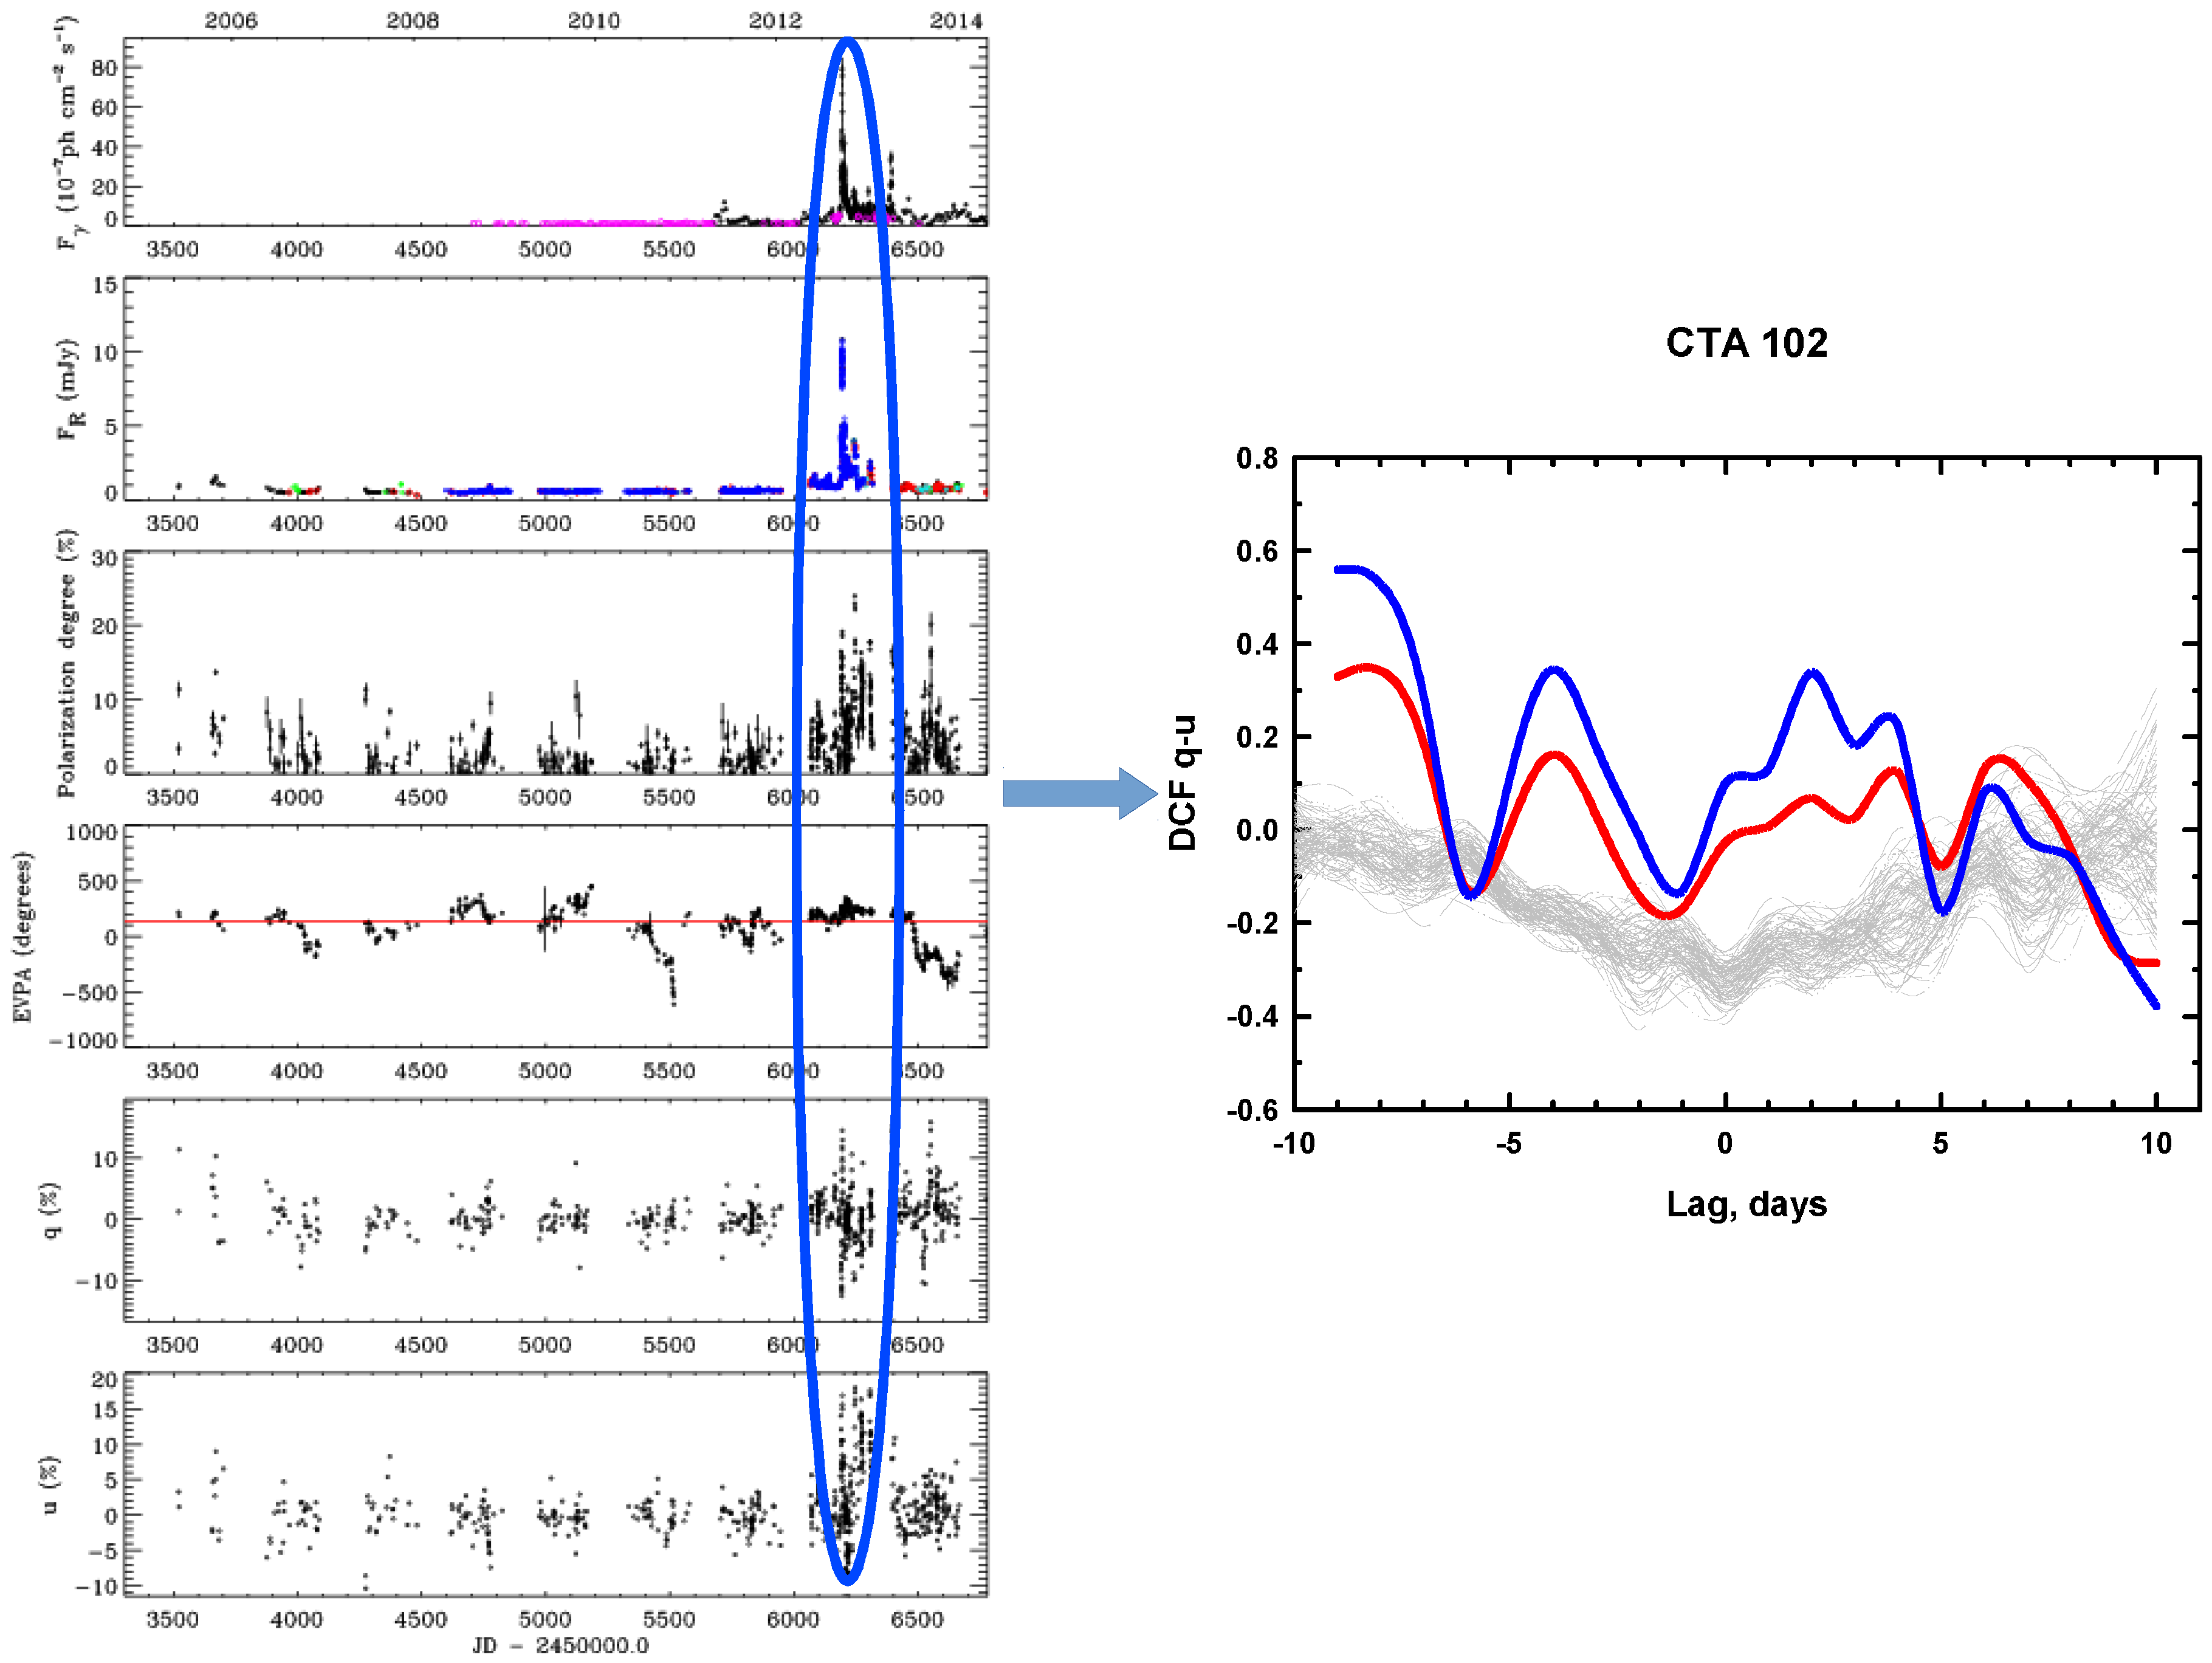
  6. Larionov, V.M.; Villata, M.; Raiteri, C.M.; Jorstad, S.G.; Marscher, A.P.; Agudo, I.; Smith, P.S.; Acosta-Pulido, J.A.; Arévalo, M.J.; Arkharov, A.A.; et al. Exceptional outburst of the blazar CTA 102 in 2012: The GASP-WEBT campaign and its extension. Mon. Not. R. Astron. Soc. 2016, 461, 3047–3056. [Google Scholar] [CrossRef]
  7. Marscher, A.P. Turbulent, Extreme Multi-zone Model for Simulating Flux and Polarization Variability in Blazars. Astrophys. J. 2014, 780, 87–96. [Google Scholar] [CrossRef]
  8. Kiehlmann, S.; Savolainen, T.; Jorstad, S.G.; Sokolovsky, K.V.; Schinzel, F.K.; Marscher, A.P.; Larionov, V.M.; Agudo, I.; Akitaya, H.; Benítez, E.; et al. Polarization angle swings in blazars: The case of 3C 279. Astron. Astrophys. 2016, 590, A10. [Google Scholar] [CrossRef]
  9. Blinov, D.; Pavlidou, V.; Papadakis, I.; Kiehlmann, S.; Panopoulou, G.; Liodakis, I.; King, O.G.; Angelakis, E.; Baloković, M.; Das, H.; et al. RoboPol: First season rotations of optical polarization plane in blazars. Mon. Not. R. Astron. Soc. 2015, 453, 1669–1683. [Google Scholar] [CrossRef]
  10. Blinov, D.; Pavlidou, V.; Papadakis, I.E.; Hovatta, T.; Pearson, T.J.; Liodakis, I.; Panopoulou, G.V.; Angelakis, E.; Baloković, M.; Das, H.; et al. RoboPol: Optical polarization-plane rotations and flaring activity in blazars. Mon. Not. R. Astron. Soc. 2016, 457, 2252–2262. [Google Scholar] [CrossRef]
  11. Kikuchi, S.; Mikami, Y.; Inoue, M.; Tabara, H.; Kato, T. A synchronous variation of polarization angle in OJ 287 in the optical and radio regions. Astron. Astrophys. 1988, 190, L8–L10. [Google Scholar]
  12. Sillanpää, A.; Takalo, L.O.; Nilsson, K.; Kikuchi, S. Photopolarimetry of Bl-Lacertae. Astrophys. Space Sci. 1993, 206, 55–70. [Google Scholar] [CrossRef]
  13. Edelson, R.A.; Krolik, J.H. The discrete correlation function—A new method for analyzing unevenly sampled variability data. Astrophys. J. 1988, 333, 646–659. [Google Scholar] [CrossRef]
Figure 1. ( a ) From top to bottom: optical R-band brightness evolution, optical fractional polarization, and position angle of polarization for BL Lac during the outburst of October 2005 [1]; ( b ) The same for 3C 279 outburst of January 2007 [2].
Galaxies 04 00043 g001
Figure 2. ( a ) From top to bottom: Fermi γ-ray flux, optical R-band flux, optical fractional polarization, and position angle of polarization for S5 0716+71 during the outburst of October 2011 [5]. Red vertical arrows mark positions of subflares; ( b ) Optical flux and polarization parameters of PKS 1510-089 during an outburst in 2009 [3].
Galaxies 04 00043 g002
Figure 3. Optical flux evolution, optical fractional polarization, and position angle of polarization of S5 0716+71 during a major outburst in January 2015.
Galaxies 04 00043 g003
Figure 4. From top to bottom: Fermi γ-ray light curve, optical R-band brightness evolution, optical fractional polarization, and position angle of polarization of 3C 279 over the time interval 2006–2016. The red bars in the bottom panel mark positions of simulated false rotations (see text).
Galaxies 04 00043 g004
Figure 5. ( a ) From top to bottom: Fermi γ-ray flux, optical R-band flux, optical fractional polarization, position angle of polarization, and normalised Stokes parameters for 3C 66a during 2006–2016; ( b ) Red line—discrete correlation function (DCF) between q and u normalized Stokes parameters for 3C 66a. Gray lines—Monte Carlo simulations under the assumption that no regular rotation of E V P A is present.
Galaxies 04 00043 g005
Figure 6. Left, from top to bottom: Fermi γ-ray light curve of CTA 102, R band light curve, evolution of P D , evolution of E V P A , evolution of Stokes parameters. Blue oval singles out the huge outburst of 2012. Right: blue line—DCF between q and u for the time interval of outburst, red line—for the whole data set, gray stripe is created by 100 Monte Carlo simulations assuming an absence of regular rotations.
Galaxies 04 00043 g006

