
The HI Distribution Observed toward a Halo Region of the Milky Way


Observatorio Astronómico de Quito, Escuela Politécnica Nacional, Av. Gran Colombia S/N, Quito 170403, Ecuador
*
Author to whom correspondence should be addressed.
Galaxies 2017, 5(3), 45; https://doi.org/10.3390/galaxies5030045
Submission received: 18 July 2017
/
Revised: 23 August 2017
/
Accepted: 24 August 2017
/
Published: 28 August 2017
(This article belongs to the Special Issue On the Origin (and Evolution) of Baryonic Galaxy Halos)
Abstract
:We use observations of the neutral atomic hydrogen (HI) 21-cm emission line to study the spatial distribution of the HI gas in a 80°90° region of the Galaxy halo. The HI column densities in the range of 3–11 × 10 cm have been estimated for some of the studied regions. In our map—obtained with a spectral sensitivity of ∼2 K—we do not detect any HI 21-cm emission line above 2 at Galactic latitudes higher than ∼46°. This report summarizes our contribution presented at the conference on the origin and evolution of barionic Galaxy halos.
1. Introduction
Neutral atomic hydrogen (HI) is the most abundant element in the interstellar medium, and its 21-cm emission line is a powerful tool to trace the structure and dynamics of the Milky Way Galaxy (Kalverla and Jürgen [1]). The HI gas in our own galaxy has a two-component structure; one is composed of cold neutral gas with temperatures ≲300 K and the other by warm neutral gas with temperatures ≳5000 K (Kalverla and Jürgen [1]). The HI disk of the Milky Way together with its spiral arms extend up to a radius of ∼35 kpc (Kalverla and Jürgen [1]). There is also a galaxy halo composed of HI gas with densities of 10 cm that extends in vertical height up to a distance of ∼4 kpc, and radially HI gas is detected in the outskirts (≳35 kpc) of the Milky Way (Kalverla and Jürgen [1]). All these important features have been discovered mainly thanks to studies carried out using the HI 21-cm emission line.
The HI column density (N) has been estimated across the galaxy by Dickey and Lockman [2], who estimated the highest and lowest N values of 2.6 × 10 at (l,b) = (339°,0°) and of 4.4 × 10 cm at (l,b) = (152°,62°), respectively. A recent HI 4 survey has been used to obtain all-sky column density maps of HI for the Milky Way (Ben Bekhti et al. [3]). The data of this survey have a spectral sensitivity of 43 mK and a spatial resolution of 16.2 arc-min.
In this work, we aim to map a defined region (chosen randomly) of the Milky Way ( and 13° ≤ b ≤ 180°) at the HI 21-cm emission line, which can help us to identify a disk-halo transition region. The data employed in our study have been obtained using the 2.3 m SALSA radio telescopes1 of the Onsala Space Observatory located in Sweden, which are operating at a wavelength of 21 cm. We also aim to check whether our N estimates derived for our selected regions are in good agreement with previous values derived by other authors (Dickey and Lockman [2], Ben Bekhti et al. [3]). Even working with a small telescope mainly used for student experiences, we expect to achieve acceptable results in comparison with those observations obtained from larger telescopes like Parkes and Dwingeloo.
2. Observations and Data Reduction
As mentioned previously, we used two small radio telescopes (see Figure 1) of the Onsala Space Observatory to carry out our observations. The observations were performed in September 2016. The telescopes provide a spatial resolution of 6° at 21 cm, and their receivers have a spectral resolution of 7.8 KHz per channel and 2 MHz bandwidth [4]. Using both telescopes, we mapped a region between galactic longitudes 87° and 180° and galactic latitudes 13° and 85°, in steps of 5.5°.
The data processing and analysis was done using the SalsaSpectrum software2. Unfortunately, the data obtained with the 2.3 m radio telescopes are not flux calibrated. To carry out this process, we observed several positions toward the galactic plane. Then, the obtained HI 21-cm spectra were compared with calibrated spectra of the same galactic positions previously observed (Higgs and Tapping [5]), obtaining in this way a flux calibration factor. The calibration observations were carried out toward four positions: l = 74°, b = 1°; l = 119°, b = −1°; l = 131.2°, b = 1°; and l = 140°, b = −3°. The intensity of our calibrated spectra is given in brightness temperature (T*). We noted that the HI 21-cm line intensities—observed toward the calibration positions—did not change by more than 20% as the integration time varied from 20 s to 160 s; therefore, our spectra are affected by 20% uncertainties in the intensity. We used an integration time of 20 s to observe the calibration positions and the target regions of the Milky Way.
3. Results
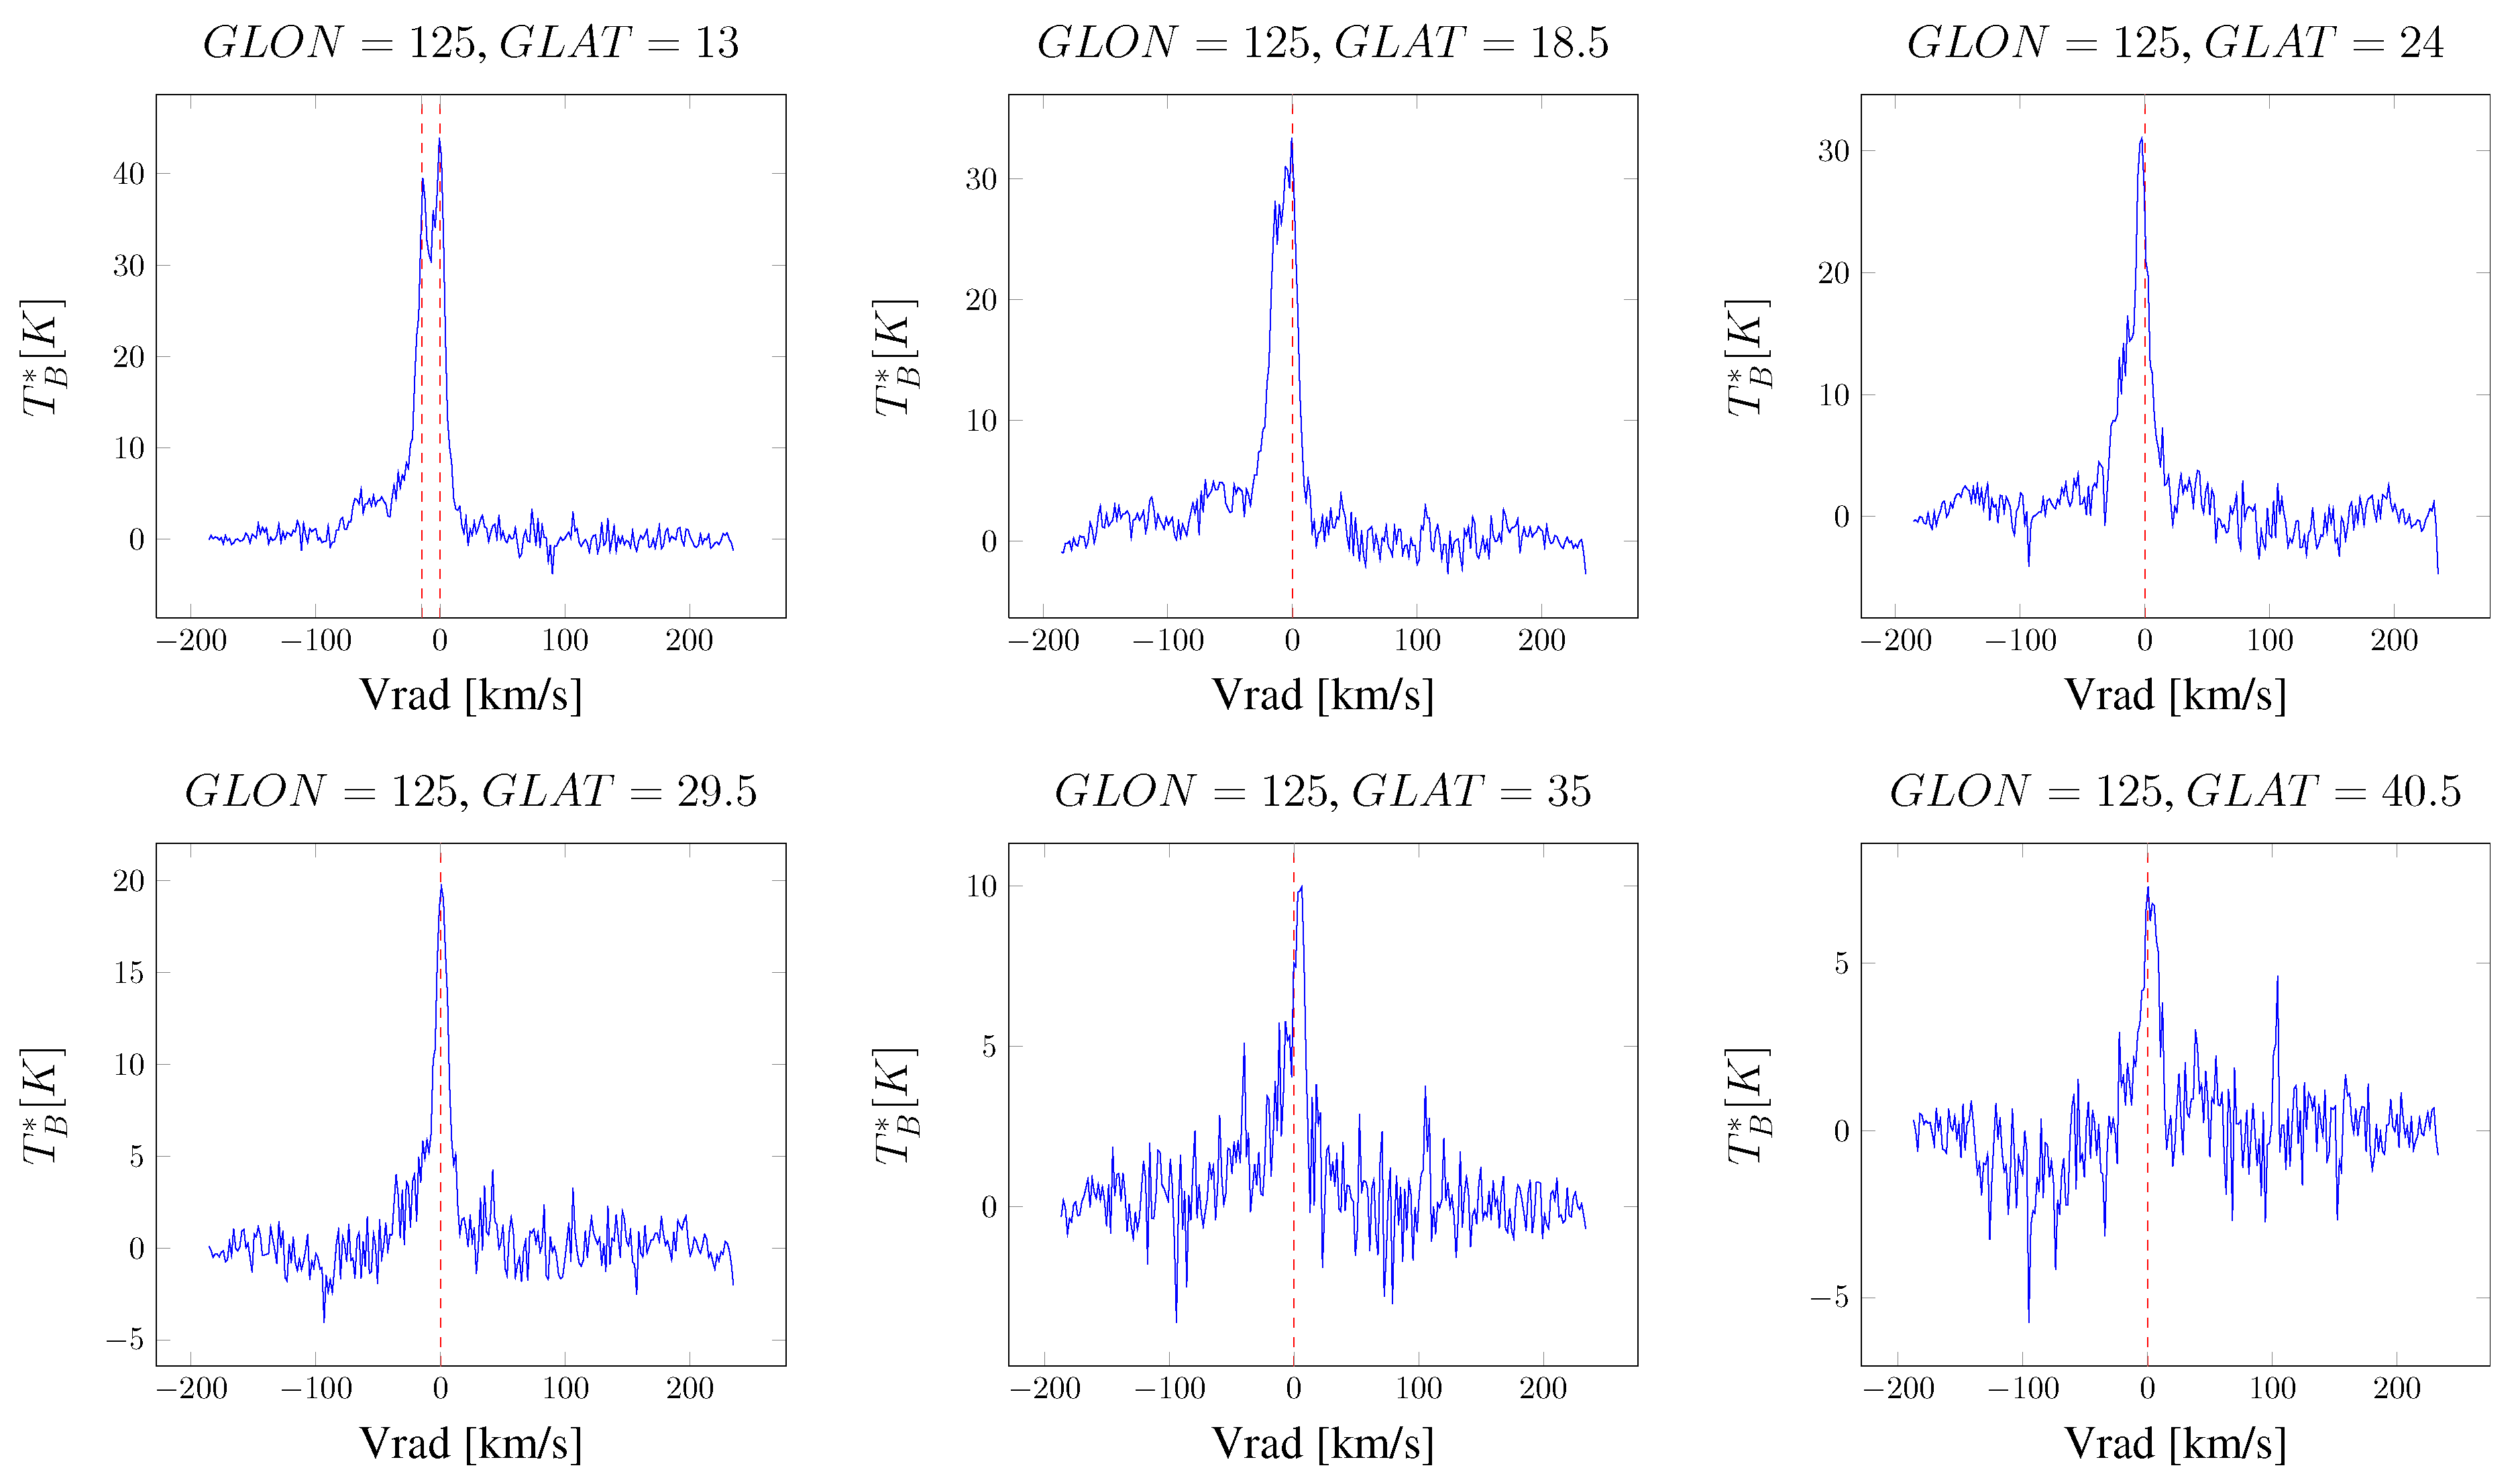
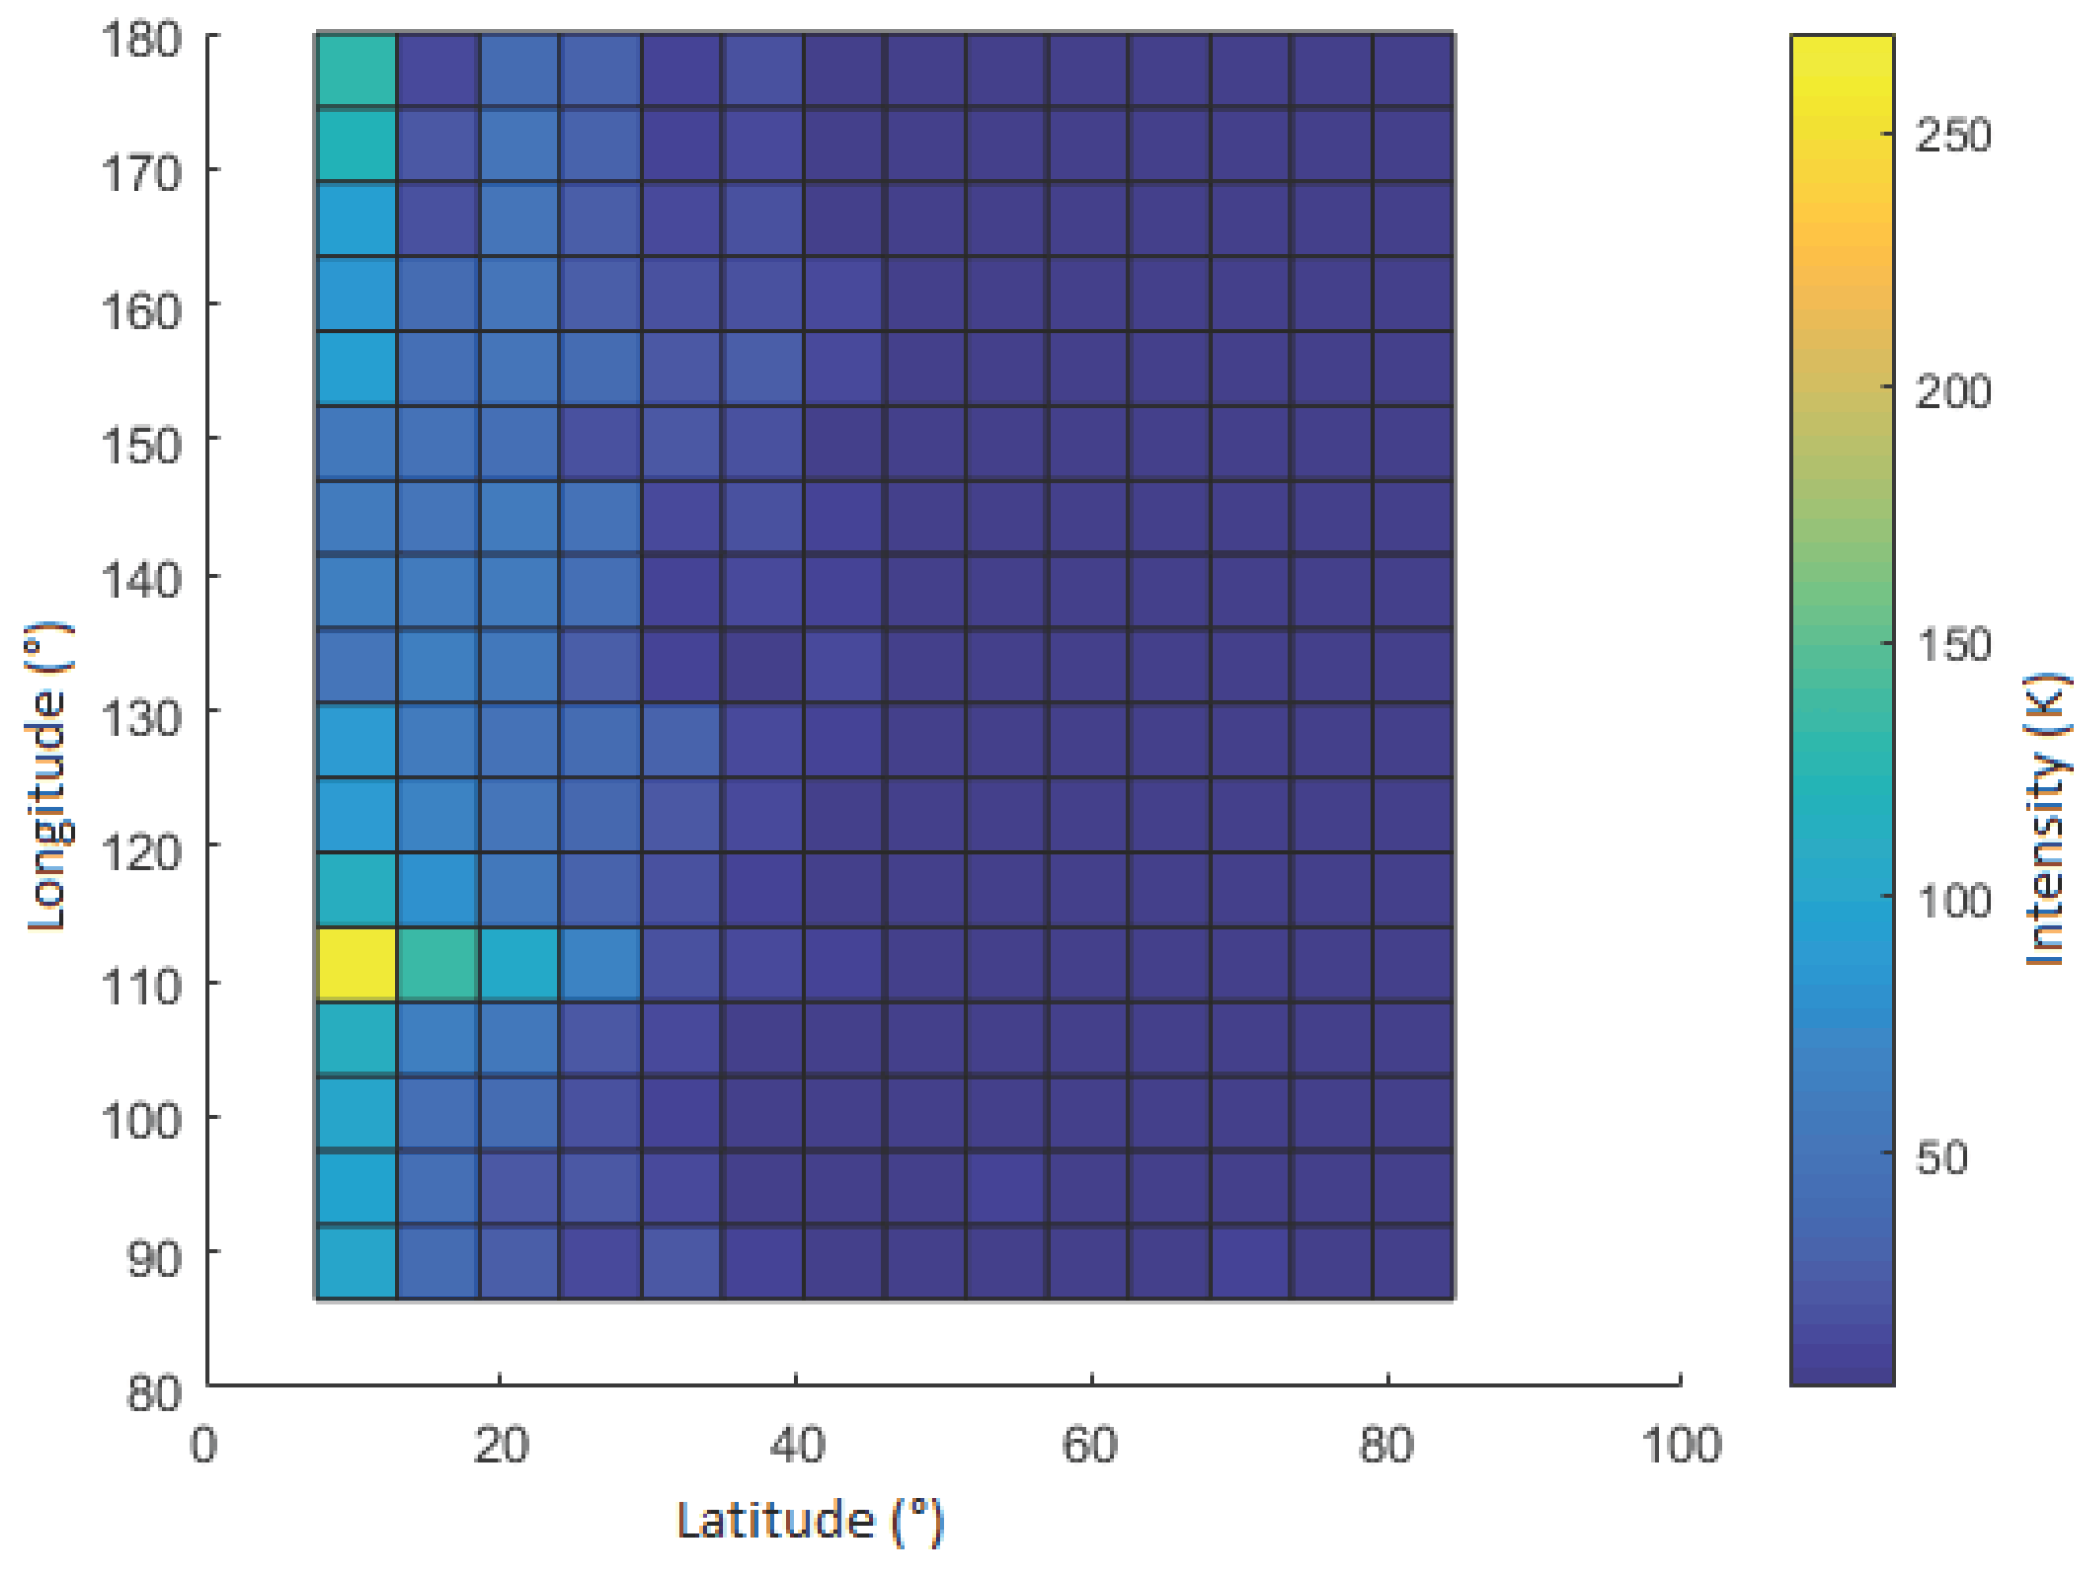
As we expected, the strongest HI 21-cm lines were detected at the lowest galactic latitudes (∼8°) covered in our study. In Figure 2 we show a sample of HI 21-cm emission profiles observed toward six selected positions in the Milky Way. As seen in this figure, the 21-cm lines show central line velocities of ∼0 km s, that correspond at low latitudes to our own galactic arm and at high latitudes to the galactic halo. The spectrum observed at l = 125° and b = 13° shows the HI emission line clearly tracing two gas components with velocities of 0 and −20 km s. The gas with negative velocities is likely associated with another spiral arm of the galaxy. We also show a peak-intensity map of the HI lines in Figure 3. We did not detect a HI 21-cm emission line above 2 (≈ 2 K) at galactic latitudes higher than ∼46°. For these regions, in our map we used 2 limits in the peak-intensity. This fact defines the lower boundary of the galactic halo, so we use this criterion based on the lack of a HI 21-cm emission line above 2 to define the start of the galactic halo. Nevertheless, another criteria may be used to define the start of the galactic halo; for example, a threshold in the decreasing number of Milky Way HI clouds as a function of the galactocentric radius (Ford et al. [6]).
On the other hand, we used the SalsaSpectrum software to subtract the underlying continuum emission and fit Gaussians to the H 21-cm lines. Then, we were able to estimate the integrated line intensities (), which are listed in Table 1 for the galactic positions indicated in Figure 2. In this figure, the last two HI 21-cm line profiles (GLAT: 35° and 40.5° ) show the lowest signal-to-noise ratio, so they were not considered. The remaining profiles were used to derive the hydrogen column density (N), which is proportional to (assuming an optically thin medium), and it can be estimated following the expression given by Dickey and Lockman [2]:
Using this expression, we estimated the hydrogen column density for our halo sub-regions confined between 13° and 30° of galactic latitude. The obtained values are given in Table 1.
4. Conclusions and Future Work
Using data obtained from the small SALSA telescope, we were able to obtain a peak-intensity map of the HI 21-cm emission line for a 80°× 90° region of the Milky Way. We did not detect any emission line above 2 at Galactic latitudes higher than ∼ 46°, so we have considered this latitude to define the galactic halo lower boundary.
We have also estimated atomic hydrogen column density N values, which fall in the range of 3–11 × 10 cm, for our four randomly-chosen positions of the Milky Way, under the assumption of an optically thin medium.
Despite the low spatial resolution of our observations, the derived N values are consistent with the values of ∼10–10 cm, provided for the same regions studied in our paper with a much higher spatial resolution instrument (Ben Bekhti et al. [3]). In the same context, our results are also in good agreement with the N range of 4.4 × 10 × 10 cm obtained by Dickey and Lockman [2] in their study of the HI gas across the galaxy.
Regarding our future work, instead of continuing the study of the large-scale distribution of HI gas in the Milky Way, we are interested in the study of the physical and dynamical properties of galactic high-velocity clouds. For that, we plan to apply for observing time in large radio telescopes such IRAM, Parkes, among others—instruments with much better spatial resolutions and data quality.
Author Contributions
All authors carried out the observations and performed the data reduction and analysis. E. López and J. Armijos wrote the manuscript.
Conflicts of Interest
The authors declare no conflict of interest.
References
- Kalverla, P.M.W.; Jürgen, K. The HI Distribution of the Milky Way. Annu. Rev. Astron. Astrophys. 2009, 47, 27–61. [Google Scholar] [CrossRef]
- Dickey, J.M.; Lockman, F.J. HI in the Galaxy. Annu. Rev. Astron. Astrophys. 1990, 28, 215–259. [Google Scholar] [CrossRef]
- Ben Bekhti, N.; Flöer, L.; Keller, R.; Kerp, J.; Lenz, D.; Winkel, B.; Bailin, J.; Calabretta, M.R.; Dedes, L.; Ford, H.A.; et al. HI4PI: A full-sky HI survey based on EBHIS and GASS. Astron. Astrophys. 2016, 594, A116. [Google Scholar]
- SALSA User Manual: Telescope Control and Data Analysis. Available online: http://vale.oso.chalmers.se/salsa/support (accessed on 17 June 2017).
- Higgs, L.A.; Tapping, K.F. The low-resolution DRAO survey of HI emission from the Galactic plane. Astron. J. 2000, 120, 2471–2487. [Google Scholar] [CrossRef]
- Ford, H.A.; Lockman, F.J.; McClure-Griffiths, N.M. Milky Way disk-halo transition in HI: Properties of the cloud population. Astrophys. J. 2010, 722, 367–379. [Google Scholar] [CrossRef]
| 1. | |
| 2. |
Figure 1.
The 2.3 m radio telescopes of the Onsala Space Observatory.
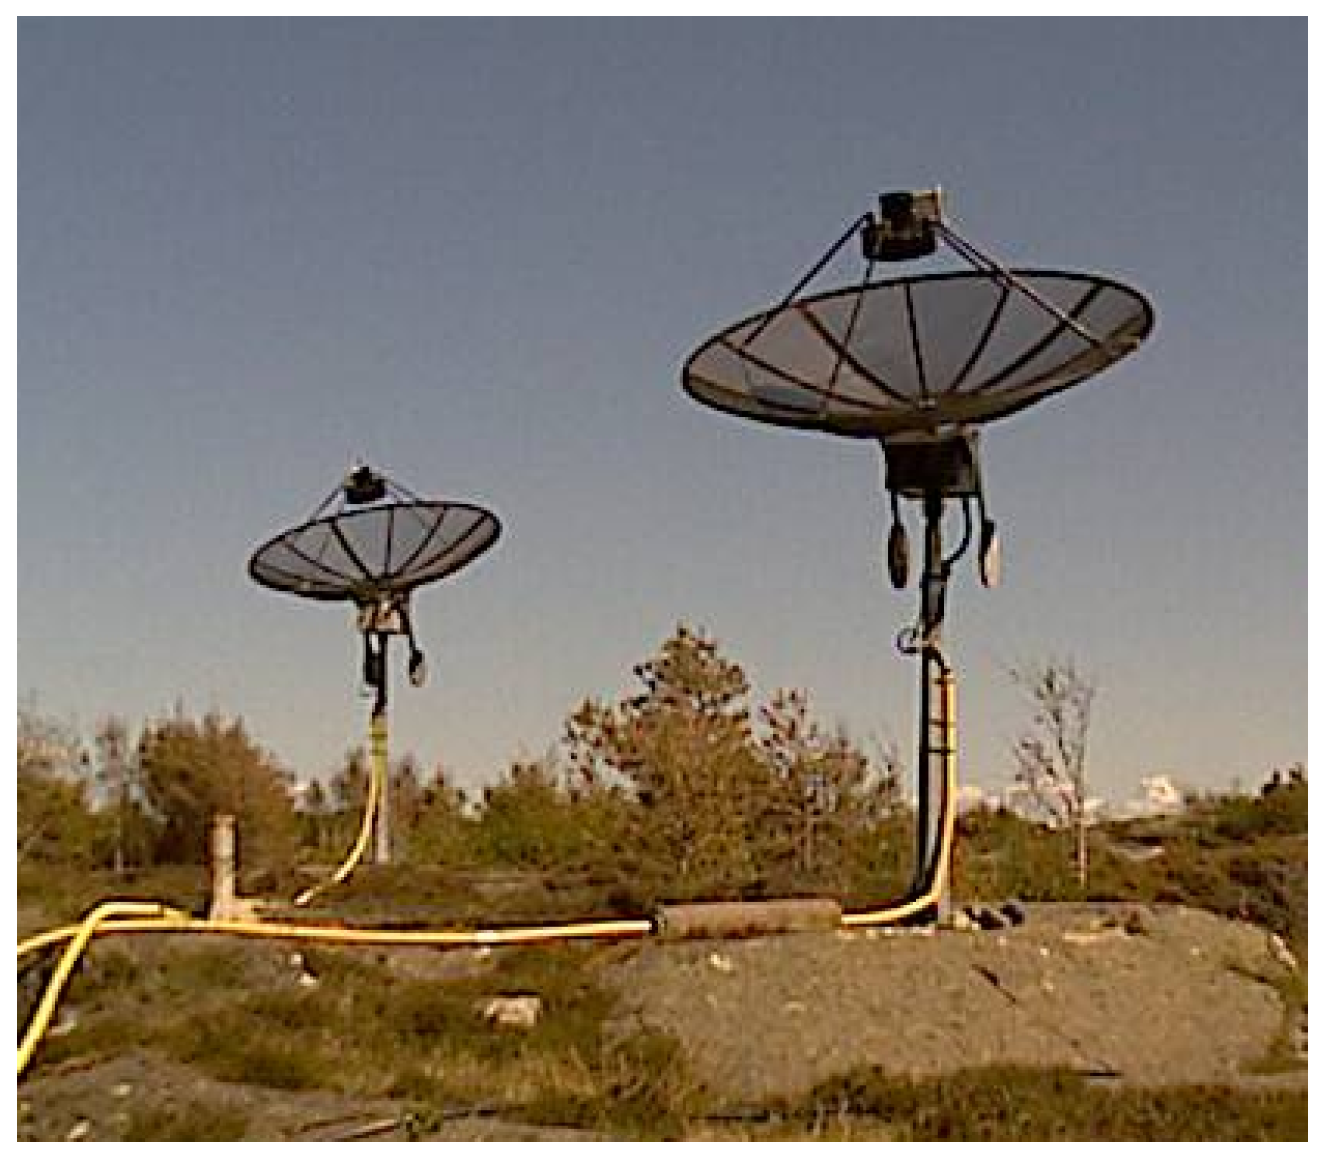
Figure 2.
Neutral atomic hydrogen (HI) 21-cm emission line observed toward six positions in the Milky Way. The dashed red line indicates the 0 km s velocity in all of the panels. In the upper-left panel, the velocity of km s—corresponding to another gas component with a radial velocity different than 0 km s—is also indicated.

Figure 3.
Peak-intensity map of HI 21-cm lines covering an 80° × 90° area of the Milky Way.


Table 1.
Parameters derived for four positions of the Milky Way.
| l Degrees | b Degrees | (K km s) | N (×10 cm) |
|---|---|---|---|
| 125 | 13.0 | 623.5 | 11.4 |
| 125 | 18.5 | 514.7 | 9.4 |
| 125 | 24.0 | 391.7 | 7.1 |
| 125 | 29.5 | 193.4 | 3.5 |
© 2017 by the authors. Licensee MDPI, Basel, Switzerland. This article is an open access article distributed under the terms and conditions of the Creative Commons Attribution (CC BY) license (http://creativecommons.org/licenses/by/4.0/).
Share and Cite
MDPI and ACS Style
López, E.; Armijos, J.; Llerena, M.; Aldás, F. The HI Distribution Observed toward a Halo Region of the Milky Way. Galaxies 2017, 5, 45. https://doi.org/10.3390/galaxies5030045
AMA Style
López E, Armijos J, Llerena M, Aldás F. The HI Distribution Observed toward a Halo Region of the Milky Way. Galaxies. 2017; 5(3):45. https://doi.org/10.3390/galaxies5030045
Chicago/Turabian StyleLópez, Ericson, Jairo Armijos, Mario Llerena, and Franklin Aldás. 2017. "The HI Distribution Observed toward a Halo Region of the Milky Way" Galaxies 5, no. 3: 45. https://doi.org/10.3390/galaxies5030045
Note that from the first issue of 2016, this journal uses article numbers instead of page numbers. See further details here.