
Revisiting the Globular Cluster Systems of NGC 3258 and NGC 3268

1
Instituto de Astrofísica de La Plata (CCT La Plata—CONICET, UNLP), Facultad de Ciencias Astronómicas y Geofísicas de la Universidad Nacional de La Plata, Paseo del Bosque S/N, B1900FWA La Plata, Argentina
2
Consejo Nacional de Investigaciones Científicas y Técnicas, Rivadavia 1917, C1033AAJ Ciudad Autónoma de Buenos Aires, Argentina
*
Author to whom correspondence should be addressed.
Galaxies 2017, 5(3), 48; https://doi.org/10.3390/galaxies5030048
Submission received: 27 June 2017
/
Revised: 18 August 2017
/
Accepted: 22 August 2017
/
Published: 31 August 2017
(This article belongs to the Special Issue On the Origin (and Evolution) of Baryonic Galaxy Halos)
Abstract
:We present a photometric study of NGC 3258 and NGC 3268 globular cluster systems (GCSs) with a wider spatial coverage than previous works. This allowed us to determine the extension of both GCSs, and obtain new values for their populations. In both galaxies, we found the presence of radial colour gradients in the peak of the blue globular clusters. The characteristics of both GCSs point to a large evolutionary history with a substantial accretion of satellite galaxies.
1. Introduction
The majority of the members in globular cluster (GC) populations are usually old stellar systems (e.g., [1,2]). They were formed under extreme environmental conditions, which are probably reachable only in massive star formation episodes during major mergers [3]. This implies a direct connection between the episodes that built up the globular cluster systems (GCSs) and the stellar population of the host galaxy. Hence, the study of a GCS is important to obtain a comprehensive picture of the evolutionary history of galaxies.
Our target galaxies, NGC 3258 and NGC 3268, are thought to make-up the bulk of the Antlia galaxy cluster, located in the Southern sky at a low Galactic latitude (≈19 deg). The central part seems to consist of two groups, each one dominated by one of these giant ellipticals (gEs) with similar luminosity. These two subgroups might be in a merging process, but surface brightness fluctuations distances [4,5,6] and radial velocities analysis [7,8] are not conclusive.
There are several studies about these GCSs [9,10,11] and the connection between their bright-end and ultra-compact dwarfs [12,13]. The aim of the present study is to complement previous ones by taking advantage of wider and deeper datasets. This results in a more accurate contamination estimation, and the possibility of calculating the GCSs’ spatial extensions and total populations.
2. Materials and Methods
The dataset consists of two wide fields ( arcmin) obtained at the Cerro Tololo 4-m telescope with the MOSAIC II camera in filters . One field contains both galaxies, while the other is located to the east (Figure 1). These double the areal coverage from Dirsch et al. [9], the more extended GCSs study of these galaxies. We also used four fields from VLT obtained with the FORS1 camera ( arcmin) in filters (see Figure 1). Table 1 contains the basic information of the observations. For MOSAIC data, we selected as the magnitude limit; for fainter magnitudes, the completeness falls below . In the case of FORS1 data, we selected as the magnitude limit, which implies a completeness limit of for GCs at less than 1 arcmin from the galaxies centre and for larger galactocentric distances.
GC candidates were selected in both datasets from point sources with colours in the usual range of GCs, i.e., and , and fainter than to avoid ultra-compact dwarfs (e.g., [14,15]), which implies and at the assumed distance.
We refer to Caso et al. [16] for further details on the data reduction and photometry.
3. Results
3.1. GCSs Spatial Extension
In order to complement the available datasets, taking advantage of their different properties, we derived the radial distributions of the GC candidates following a two-step procedure. First, we fitted power-laws to blue and red subpopulations, masking regions close to neighbour galaxies and bright stars. Considering that previous studies point to an overlap of both GCSs (e.g., [10]), we fitted the radial distributions iteratively, avoiding regions where the other GCS might be contributing to the observed surface density. We assumed that the outer limit of a GCS is achieved when its GC surface density is equal to 30 per cent of the background level. This criterion has been applied to several GCS studies, including those with a large field of view (FOV) (e.g., [17,18]). The background region selected to correct for contamination in the MOSAIC photometry is located in the eastern portion of our field, at more than 25 arcmin from both galaxies. It spans 489 arcmin, and the mean projected densities of point sources with similar colours and magnitudes than GC candidates are ≈0.45 arcmin and ≈0.2 arcmin, respectively, for blue and red GC candidates.
In the case of NGC 3258, the blue GCS reaches ≈17 arcmin (i.e., ≈170 kpc), while the red subpopulation appears more concentrated towards the galaxy, with an extension of ≈6 arcmin (i.e., ≈60 kpc). For NGC 3268, the extension of both subpopulations are similar, ≈14 arcmin and ≈12 arcmin for blue and red GCs, respectively.
For the innermost regions of the GCSs, we obtained the radial profiles from the FORS1 data, applying background and completeness corrections to the GC surface densities. In these cases, we fitted a modified Hubble distribution [9,19]:
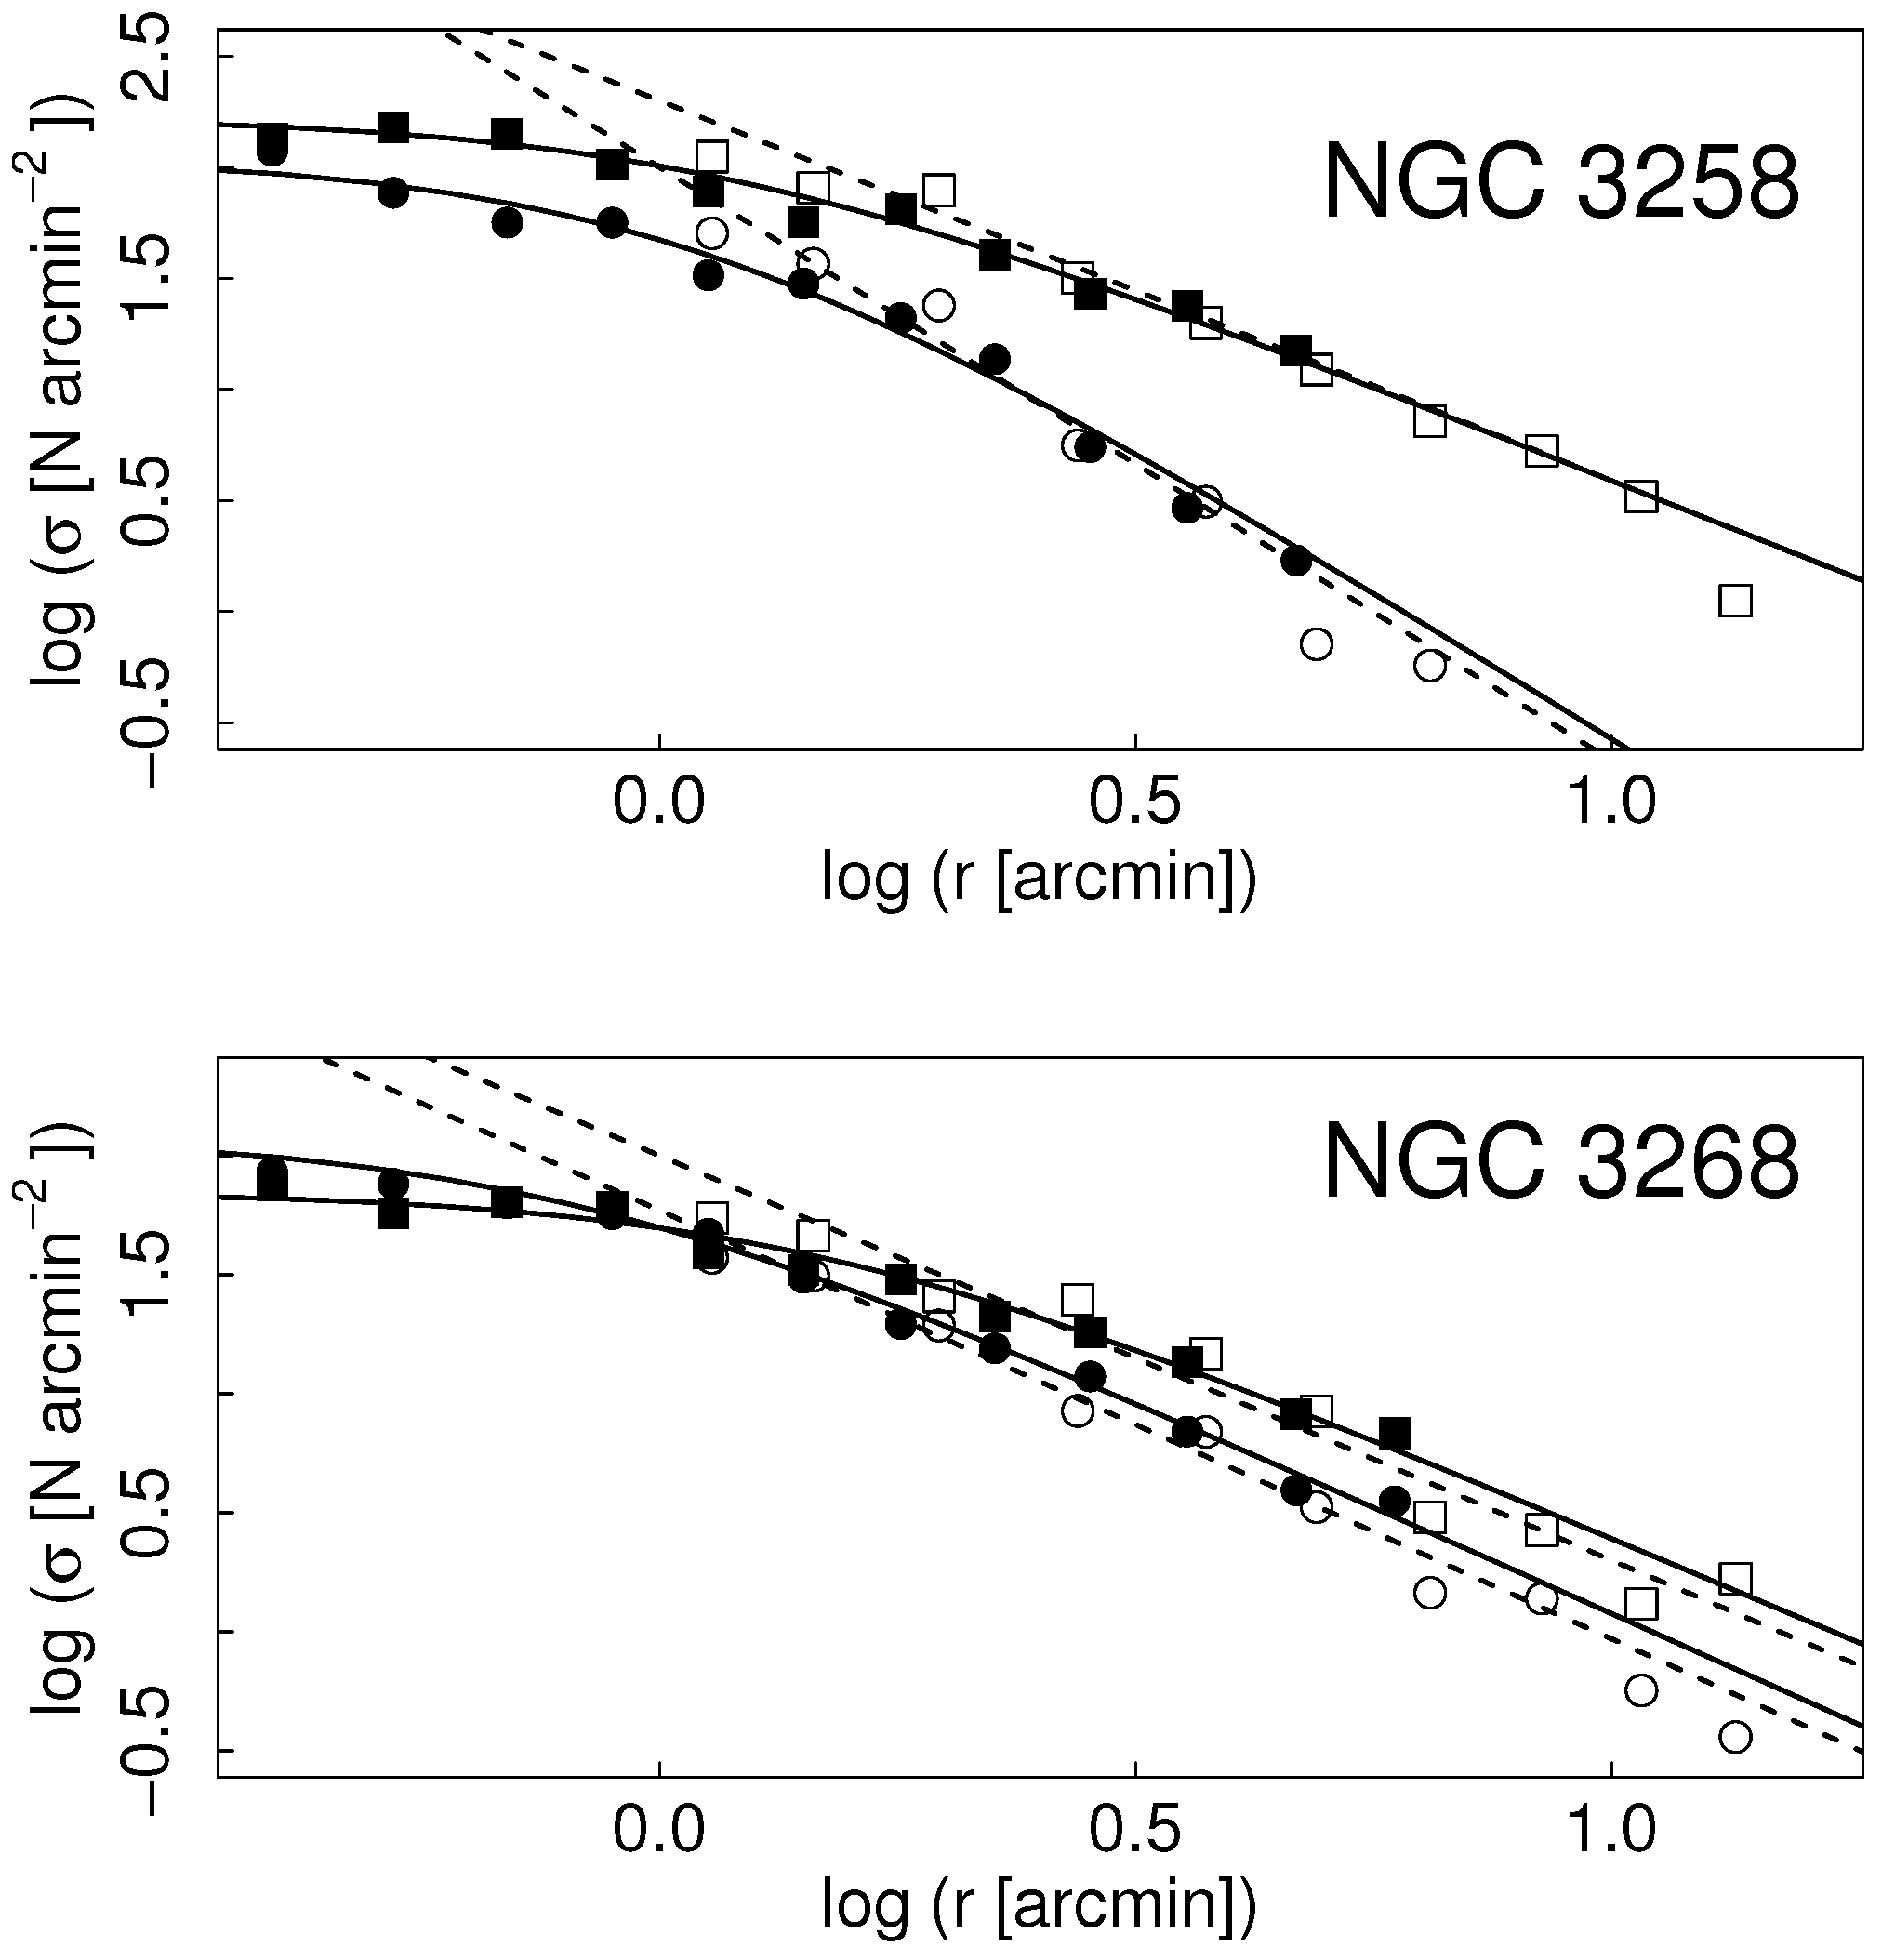
to consider the usual flattening in the inner GC radial profiles [20,21,22]. Figure 2 shows the background and completeness corrected radial profiles from FORS1 data for blue (filled squares) and red (filled circles) subpopulations. Open symbols represent the radial profiles obtained from MOSAIC data, properly scaled to match the deeper FORS1 data. Solid curves indicate the fitted Hubble distributions, while dashed ones correspond to the scaled power-laws fitted to MOSAIC data. Table 2 shows the parameters associated with the Hubble profiles.
The wider FOV allows us a better determination of the radial profile and the background level, which implies a more accurate estimation of the radial extension in both systems. The joint analysis of MOSAIC and FORS1 data results in a more general fit of the GCs radial distributions than previous studies.
3.2. Total Population of the GCSs
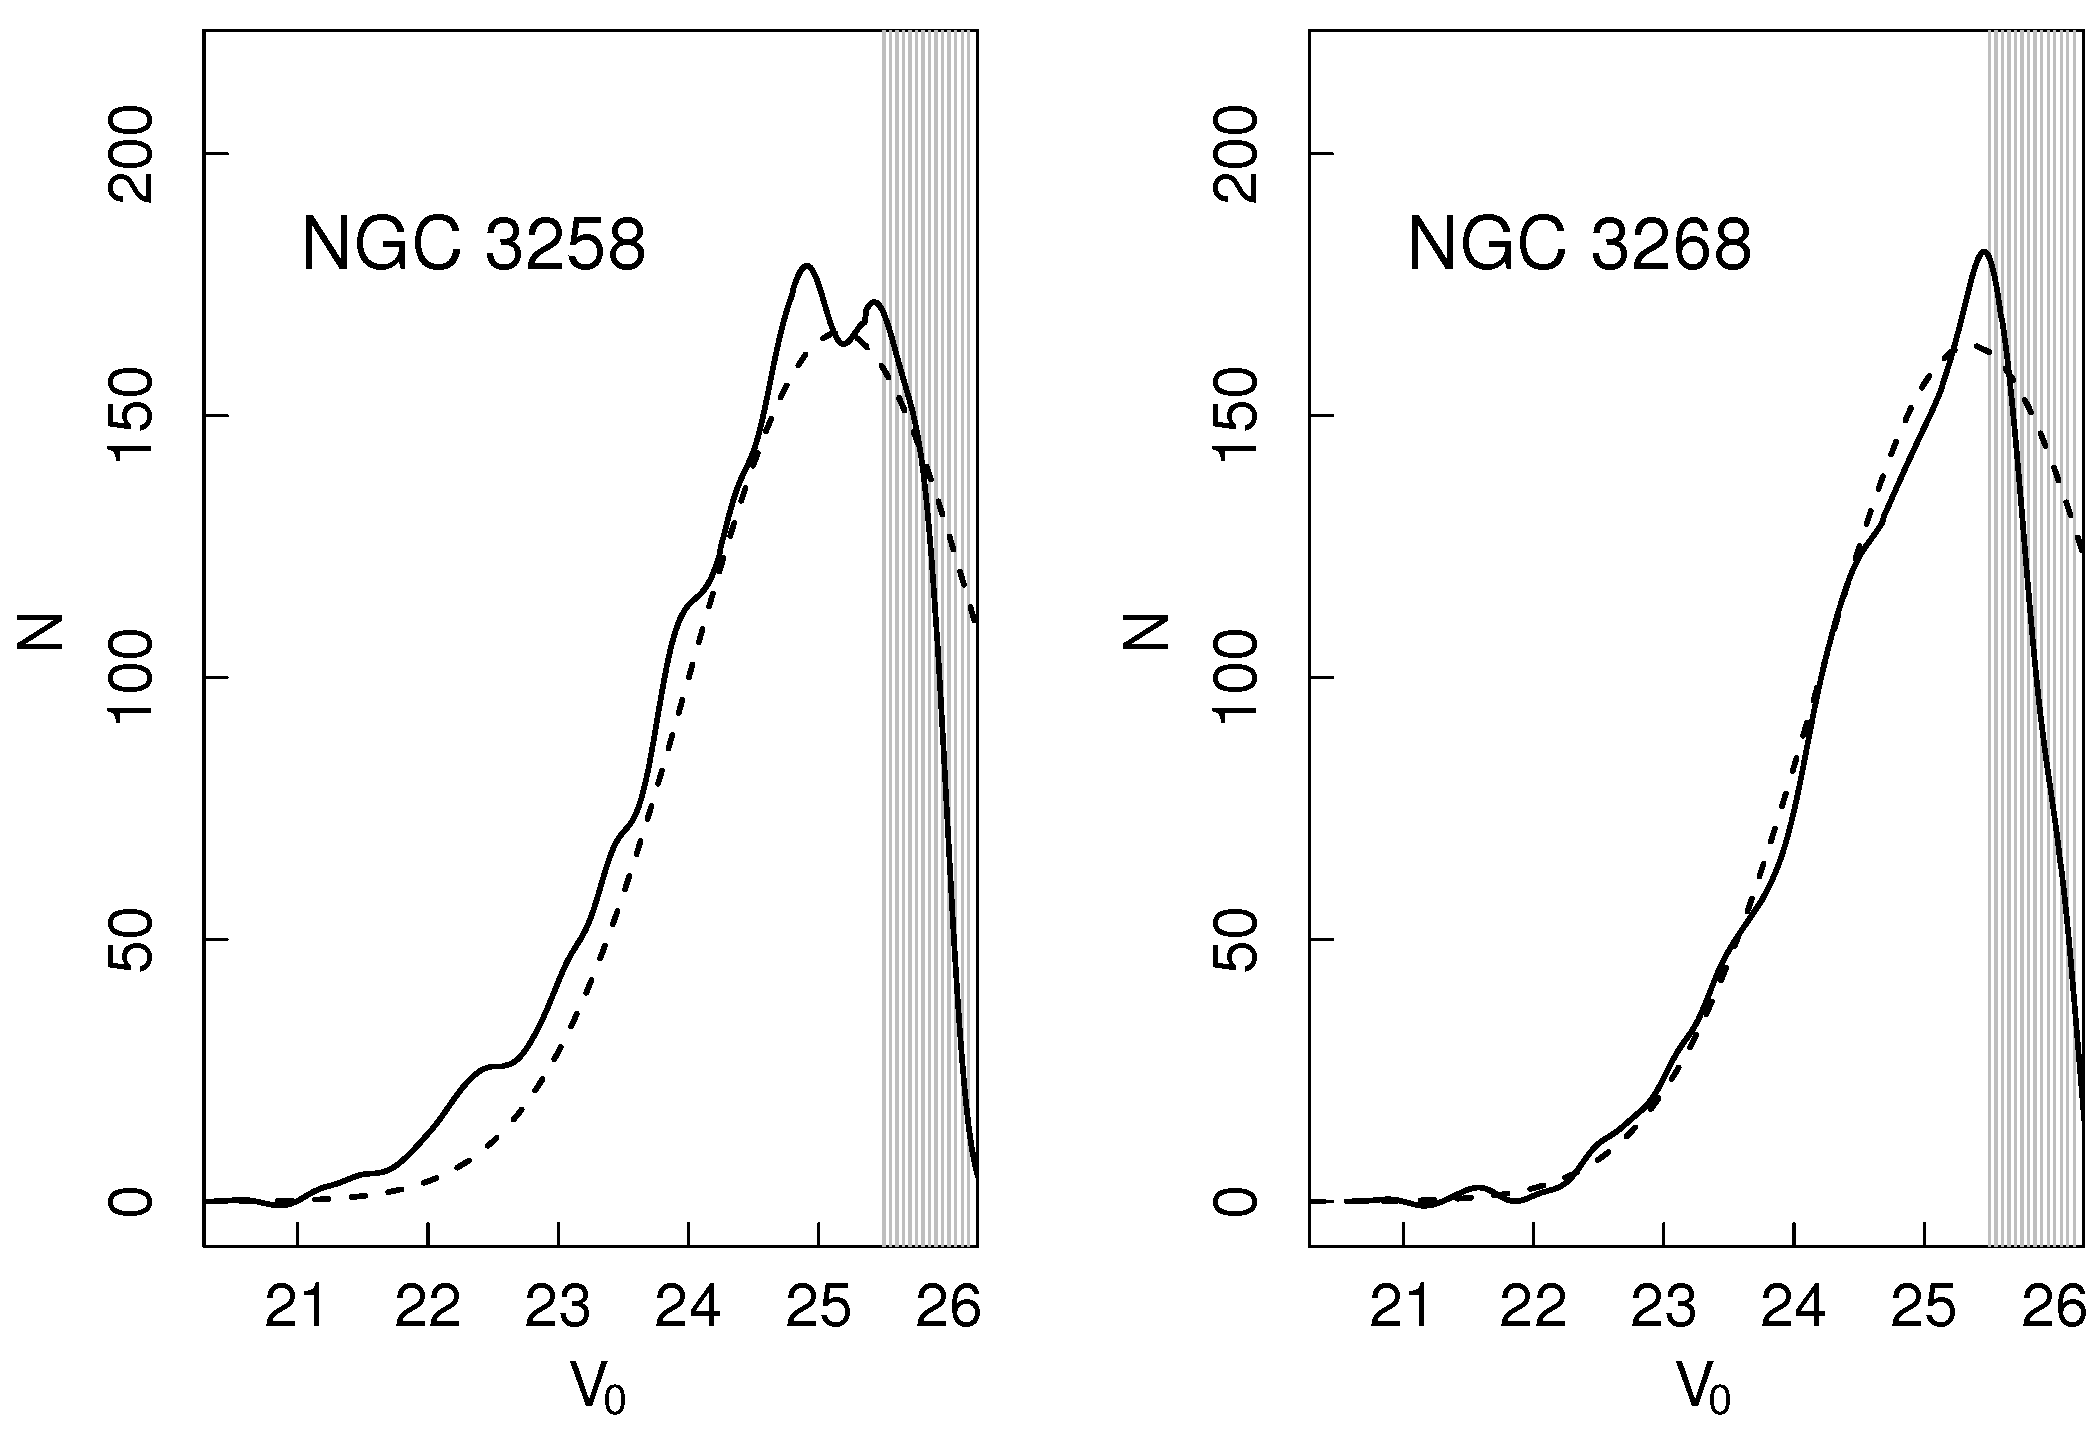
In order to calculate the population of the GCSs we obtained the background and completeness GC luminosity functions (GCLFs) from FORS1 data for both galaxies (Figure 3). It is largely documented in literature that GCLF in elliptical galaxies can be approximated by Gaussian profiles with a turn-over magnitude (TOM) (e.g., [1,23]). In both galaxies, the expected TOM was close to our magnitude limit. Hence, we used the distance moduli calculated by Tully et al. [6] to determine the TOM, for NGC 3258 and for NGC 3268. The rest of the Gaussian parameters were fitted from the data. From this procedure, we established that GCs brighter than represent ≈62% for NGC 3258 and ≈56% in the case of NGC 3268.
Then, we numerically integrated the GC radial profiles derived in the previous section along the entire radial extension of the GCSs. Finally, we corrected these values by the fraction of missing GCs due to our completeness limits. The results indicate a population of ≈6600 blue GCs and ≈1400 red ones for NGC 3258, which implies a fraction of red-to-total GCs of 0.18. In the case of NGC 3268, we obtained ≈5200 blue and ≈3000 red GCs, with 0.38.
The fraction of red GCs calculated in this work for both galaxies is similar to the values indicated by Bassino et al. [10]. Our results point to more populated GCSs, mainly due to the larger radial extension derived in this contribution. For instance, in case we integrate our radial distribution for NGC 3258 up to 10 arcmin, the number of GCs is in agreement with Bassino et al. [10] values. The same analysis for NGC 3268 results in a larger number of GCs.
3.3. Radial Gradients in the Colour Distribution
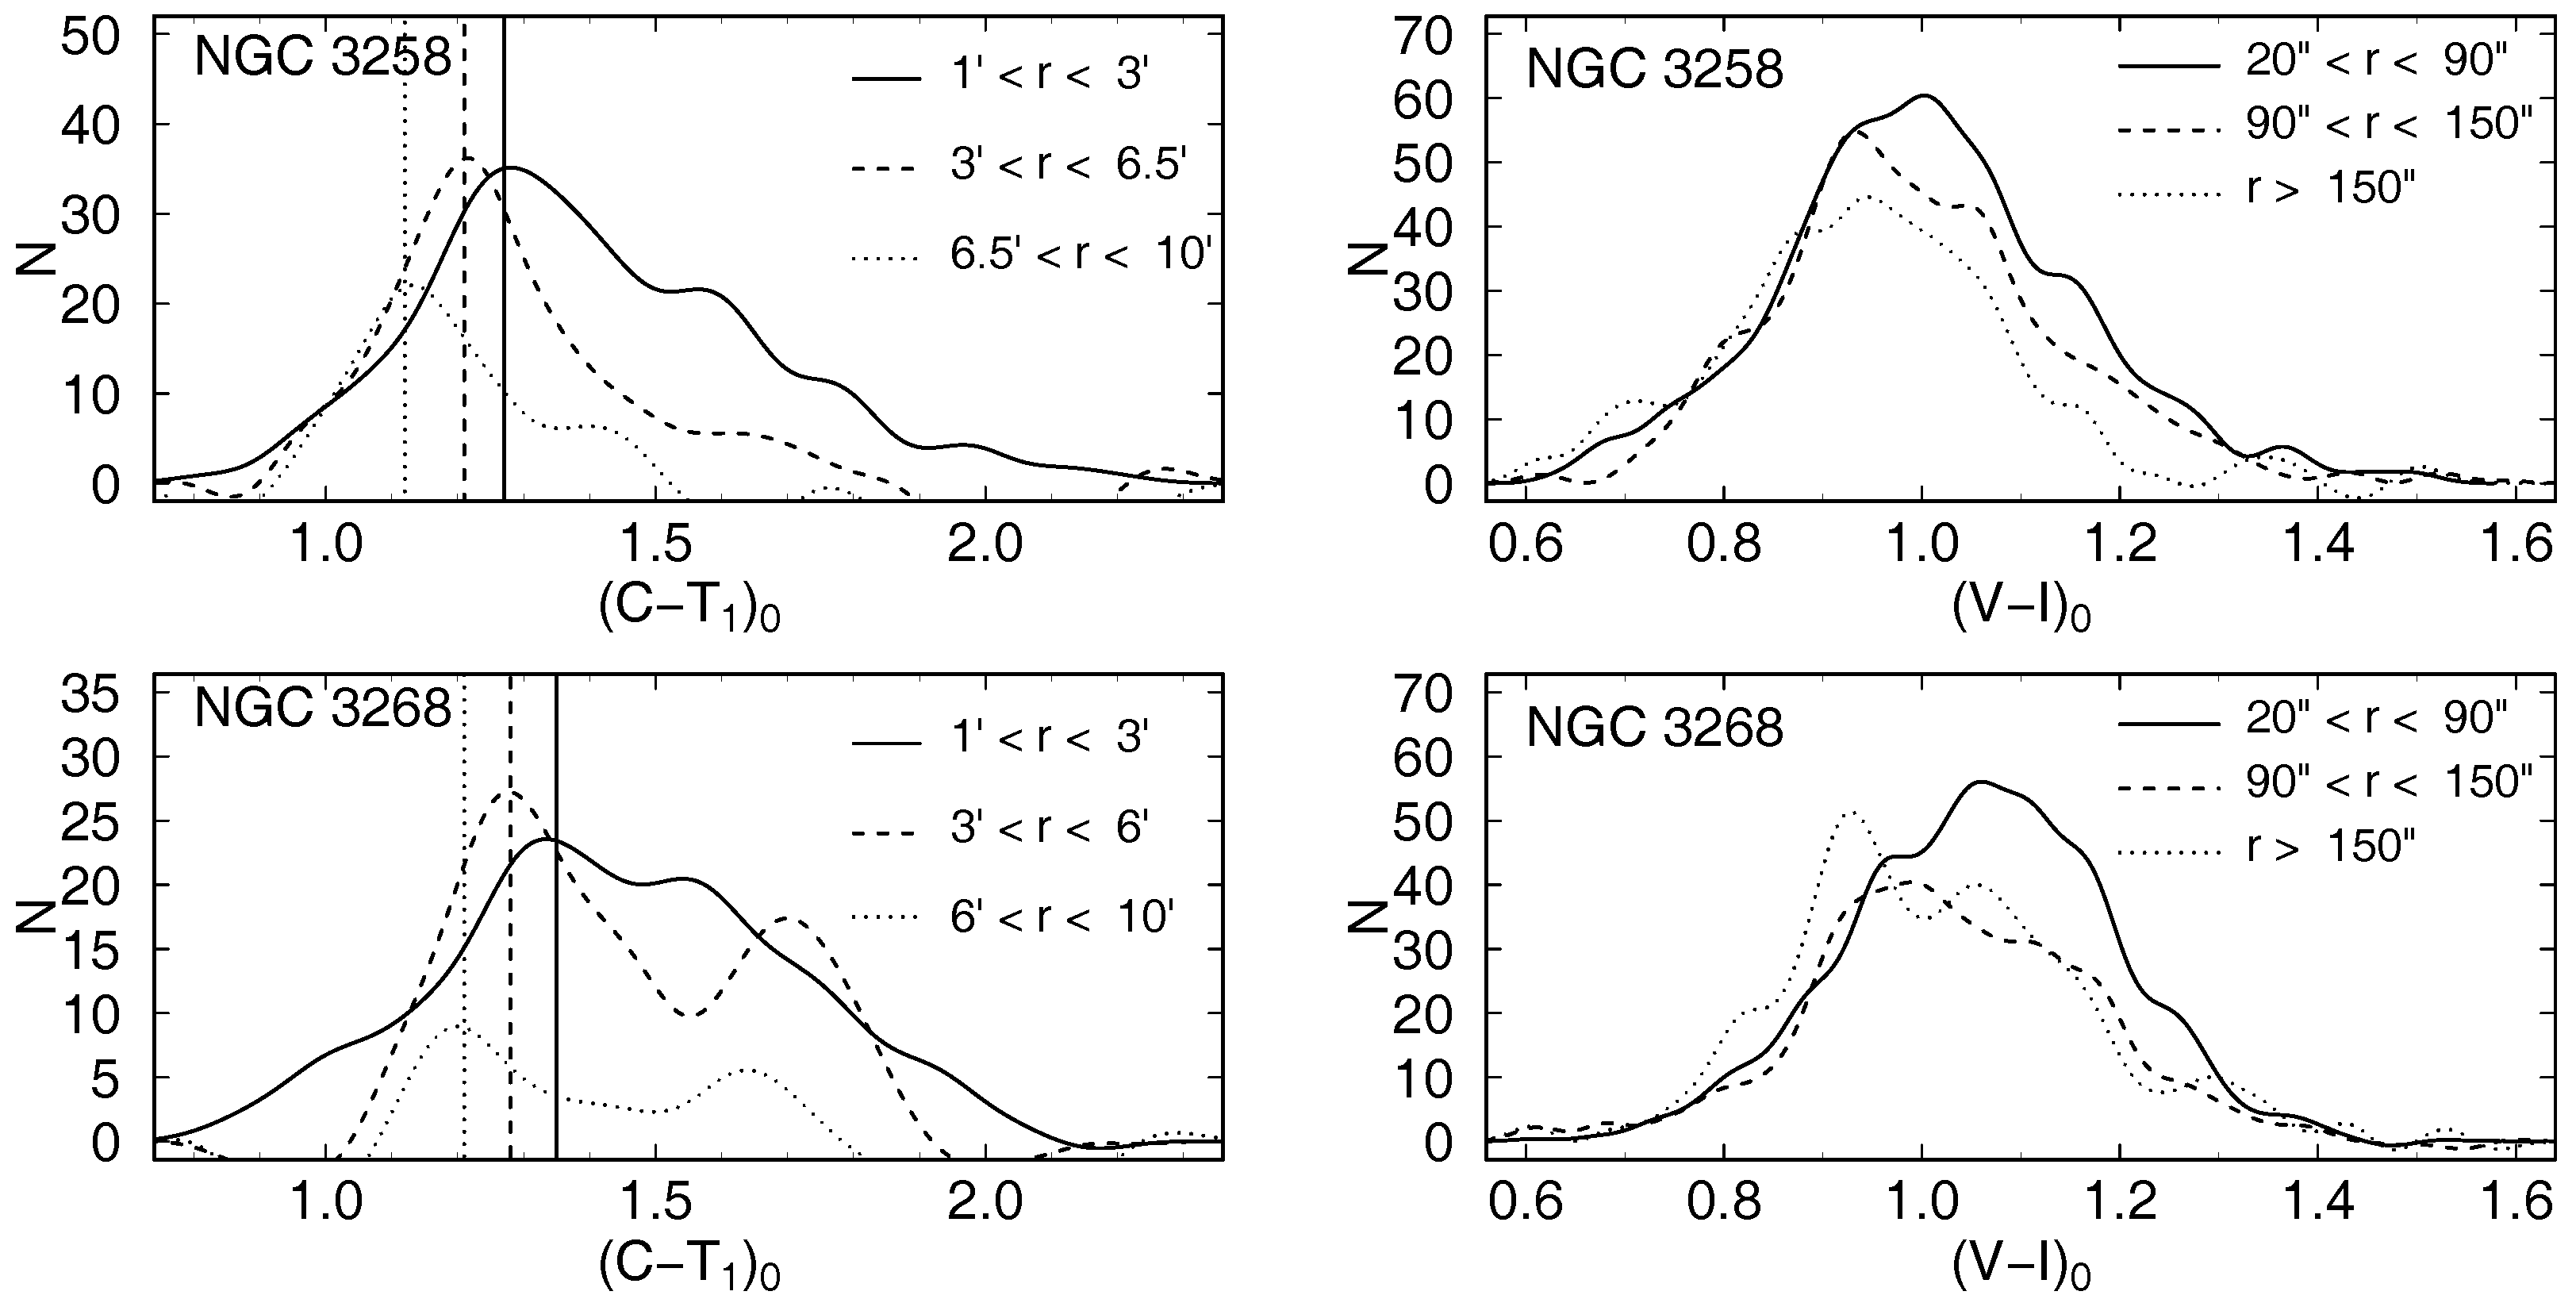
The left panels of Figure 4 show the smoothed and background corrected colour distribution for GC candidates around NGC 3258 (upper panel) and NGC 3268 (lower panel) from the MOSAIC data. The sample was split in three radial regimes. We statistically subtracted the contamination and applied the algorithm Gaussian mixture modeling (GMM) [24] to the clean samples to calculate the colour for the blue GC peak in the three ranges. After repeating the procedure 25 times in order to reduce statistical noise, the mean colours in the filters resulted , , and , respectively, in the case of NGC 3258, and , , and , respectively, for NGC 3268. These mean colours are indicated in the panels with vertical lines.
The right panels of Figure 4 are analogues for the FORS1 data. The smaller FOV and the lower sensitivity of colours with respect to make results noisy, but blue peaks seem to get bluer for GC candidates at galactocentric distances larger than 150”.
4. Summary
The rich and spatially extended GCSs in both galaxies point to rich evolutionary histories. The radial gradient in the colour peak of blue GCs found in NGC 3258 and NGC 3268 could be explained by the correlation between the colour and metallicity for blue GCs and the galaxy masses (e.g., [25,26]), and points to the relevant role of the accretion of satellite galaxies in the build-up of the outer regions of GCSs. Similar radial gradients have been found in other giant ellipticals, pointing to two phases in galaxy formation (e.g., [27]).
Acknowledgments
This research was funded with grants from Consejo Nacional de Investigaciones Científicas y Técnicas de la República Argentina (PIP 112-201101-00393), Agencia Nacional de Promoción Científica y Tecnológica (PICT-2013-0317), and Universidad Nacional de La Plata (UNLP 11-G124), Argentina.
Author Contributions
This paper was totally carried out by the authors.
Conflicts of Interest
The authors declare no conflict of interest.
References
- Brodie, J.P.; Strader, J. Extragalactic Globular Clusters and Galaxy Formation. Ann. Rev. Astron. Astrophys. 2006, 44, 193–267. [Google Scholar] [CrossRef]
- Tonini, C. The Metallicity Bimodality of Globular Cluster Systems: A Test of Galaxy Assembly and of the Evolution of the Galaxy Mass-Metallicity Relation. Astrophys. J. 2013, 762, 39. [Google Scholar] [CrossRef]
- Kruijssen, J.M.D. Globular cluster formation in the context of galaxy formation and evolution. Class. Quant. Grav. 2014, 31, 244006. [Google Scholar] [CrossRef]
- Blakeslee, J.P.; Lucey, J.R.; Barris, B.J.; Hudson, M.J.; Tonry, J.L. A synthesis of data from fundamental plane and surface brightness fluctuation surveys. Mon. Not. Roy. Astron. Soc. 2001, 327, 1004–1020. [Google Scholar] [CrossRef]
- Cantiello, M.; Blakeslee, J.P.; Raimondo, G.; Mei, S.; Brocato, E.; Capaccioli, M. Detection of Radial Surface Brightness Fluctuations and Color Gradients in Elliptical Galaxies with the Advanced Camera for Surveys. Astrophys. J. 2005, 634, 239–257. [Google Scholar] [CrossRef]
- Tully, R.B.; Courtois, H.M.; Dolphin, A.E.; Fisher, J.R.; Héraudeau, P.; Jacobs, B.A.; Karachentsev, I.D.; Makarov, D.; Makarova, L.; Mitronova, S.; et al. Cosmicflows-2: The Data. Astron. J. 2013, 146, 86. [Google Scholar] [CrossRef]
- Hess, K.M.; Jarrett, T.H.; Carignan, C.; Passmoor, S.S.; Goedhart, S. KAT-7 Science Verification: Cold Gas, Star Formation, and Substructure in the Nearby Antlia Cluster. Mon. Not. Roy. Astron. Soc. 2015, 452, 1617–1636. [Google Scholar] [CrossRef]
- Caso, J.; Richtler, T. Deconstructing the Antlia cluster core. Astron. Astrophys. 2015, 584. [Google Scholar] [CrossRef]
- Dirsch, B.; Richtler, T.; Bassino, L.P. The globular cluster systems of NGC 3258 and NGC 3268 in the Antlia cluster*. Astron. Astrophys. 2003, 408, 929–939. [Google Scholar] [CrossRef]
- Bassino, L.P.; Richtler, T.; Dirsch, B. VLT photometry in the Antlia cluster: The giant ellipticals NGC 3258 and NGC 3268 and their globular cluster systems. Mon. Not. Roy. Astron. Soc. 2008, 386, 1145–1156. [Google Scholar] [CrossRef]
- Harris, W.E.; Whitmore, B.C.; Karakla, D.; Okoń, W.; Baum, W.A.; Hanes, D.A.; Kavelaars, J.J. Globular Cluster Systems in Brightest Cluster Galaxies: Bimodal Metallicity Distributions and the Nature of the High-Luminosity Clusters. Astrophys. J. 2006, 636, 90–114. [Google Scholar] [CrossRef]
- Caso, J.P.; Bassino, L.P.; Richtler, T.; Smith Castelli, A.V.; Faifer, F.R. Ultracompact dwarfs around NGC 3258 in the Antlia cluster. Mon. Not. Roy. Astron. Soc. 2013, 430, 1088–1101. [Google Scholar] [CrossRef]
- Caso, J.P.; Bassino, L.P.; Richtler, T.; Calderón, J.P.; Smith Castelli, A.V. Ultracompact dwarfs around NGC 3268. Mon. Not. Roy. Astron. Soc. 2014, 442, 891–899. [Google Scholar] [CrossRef]
- Mieske, S.; Hilker, M.; Misgeld, I. The specific frequencies of ultra-compact dwarf galaxies. Astron. Astrophys. 2012, 537, A3. [Google Scholar] [CrossRef]
- Norris, M.A.; Kannappan, S.J.; Forbes, D.A.; Romanowsky, A.J.; Brodie, J.P.; Faifer, F.R.; Huxor, A.; Maraston, C.; Moffett, A.J.; Penny, S.J.; et al. The AIMSS Project - I. Bridging the star cluster-galaxy divide. Mon. Not. Roy. Astron. Soc. 2014, 443, 1151–1172. [Google Scholar] [CrossRef] [Green Version]
- Caso, J.P.; Bassino, L.P.; Gómez, M. Globular cluster systems as tracers of the evolutionary history in NGC 3258 and NGC 3268. Mon. Not. Roy. Astron. Soc. 2017, 470, 3227–3238. [Google Scholar] [CrossRef]
- Bassino, L.P.; Faifer, F.R.; Forte, J.C.; Dirsch, B.; Richtler, T.; Geisler, D.; Schuberth, Y. Large-scale study of the NGC 1399 globular cluster system in Fornax. Astron. Astrophys. 2006, 451, 789–796. [Google Scholar] [CrossRef]
- Caso, J.P.; Richtler, T.; Bassino, L.P.; Salinas, R.; Lane, R.R.; Romanowsky, A. The paucity of globular clusters around the field elliptical NGC 7507. Astron. Astrophys. 2013, 555, A56. [Google Scholar] [CrossRef]
- Binney, J.; Tremaine, S. Galactic Dynamics. Nature 1987, 326, 219. [Google Scholar] [CrossRef]
- Elson, R.A.W.; Grillmair, C.J.; Forbes, D.A.; Rabban, M.; Williger, G.M.; Brodie, J.P. HST imaging of the globular clusters in the Fornax cluster-NGC 1379. Mon. Not. Roy. Astron. Soc. 1998, 295, 240. [Google Scholar] [CrossRef]
- Capuzzo-Dolcetta, R.; Mastrobuono-Battisti, A. Globular cluster system erosion in elliptical galaxies. Astron. Astrophys. 2009, 507, 183–193. [Google Scholar] [CrossRef]
- Brodie, J.P.; Romanowsky, A.J.; Strader, J.; Forbes, D.A.; Foster, C.; Jennings, Z.G.; Pastorello, N.; Pota, V.; Usher, C.; Blom, C.; et al. The SAGES Legacy Unifying Globulars and GalaxieS Survey (SLUGGS): Sample Definition, Methods, and Initial Results. Astrophys. J. 2014, 796, 52. [Google Scholar] [CrossRef]
- Jordán, A.; McLaughlin, D.E.; Côté, P.; Ferrarese, L.; Peng, E.W.; Mei, S.; Villegas, D.; Merritt, D.; Tonry, J.L.; West, M.J. The ACS Virgo Cluster Survey. XII. The Luminosity Function of Globular Clusters in Early-Type Galaxies. Astrophys. J. Suppl. 2007, 171, 101–145. [Google Scholar] [CrossRef]
- Muratov, A.L.; Gnedin, O.Y. Modeling the Metallicity Distribution of Globular Clusters. Astrophys. J. 2010, 718, 1266–1288. [Google Scholar] [CrossRef]
- Strader, J.; Brodie, J.P.; Forbes, D.A. Metal-Poor Globular Clusters and Galaxy Formation. Astron. J. 2004, 127, 3431–3436. [Google Scholar] [CrossRef]
- Peng, E.W.; Jordán, A.; Côté, P.; Blakeslee, J.P.; Ferrarese, L.; Mei, S.; West, M.J.; Merritt, D.; Milosavljević, M.; Tonry, J.L. The ACS Virgo Cluster Survey. IX. The Color Distributions of Globular Cluster Systems in Early-Type Galaxies. Astrophys. J. 2006, 639, 95–119. [Google Scholar] [CrossRef]
- Forbes, D.A.; Spitler, L.R.; Strader, J.; Romanowsky, A.J.; Brodie, J.P.; Foster, C. Evidence for two phases of galaxy formation from radial trends in the globular cluster system of NGC 1407. Mon. Not. Roy. Astron. Soc. 2011, 413, 2943–2949. [Google Scholar] [CrossRef]
Figure 1.
The MOSAIC (white regions) and FORS1 (black regions) fields are overlaid on a arcmin DSS image of the Antlia cluster. North is up and east is to the left.
Figure 1.
The MOSAIC (white regions) and FORS1 (black regions) fields are overlaid on a arcmin DSS image of the Antlia cluster. North is up and east is to the left.
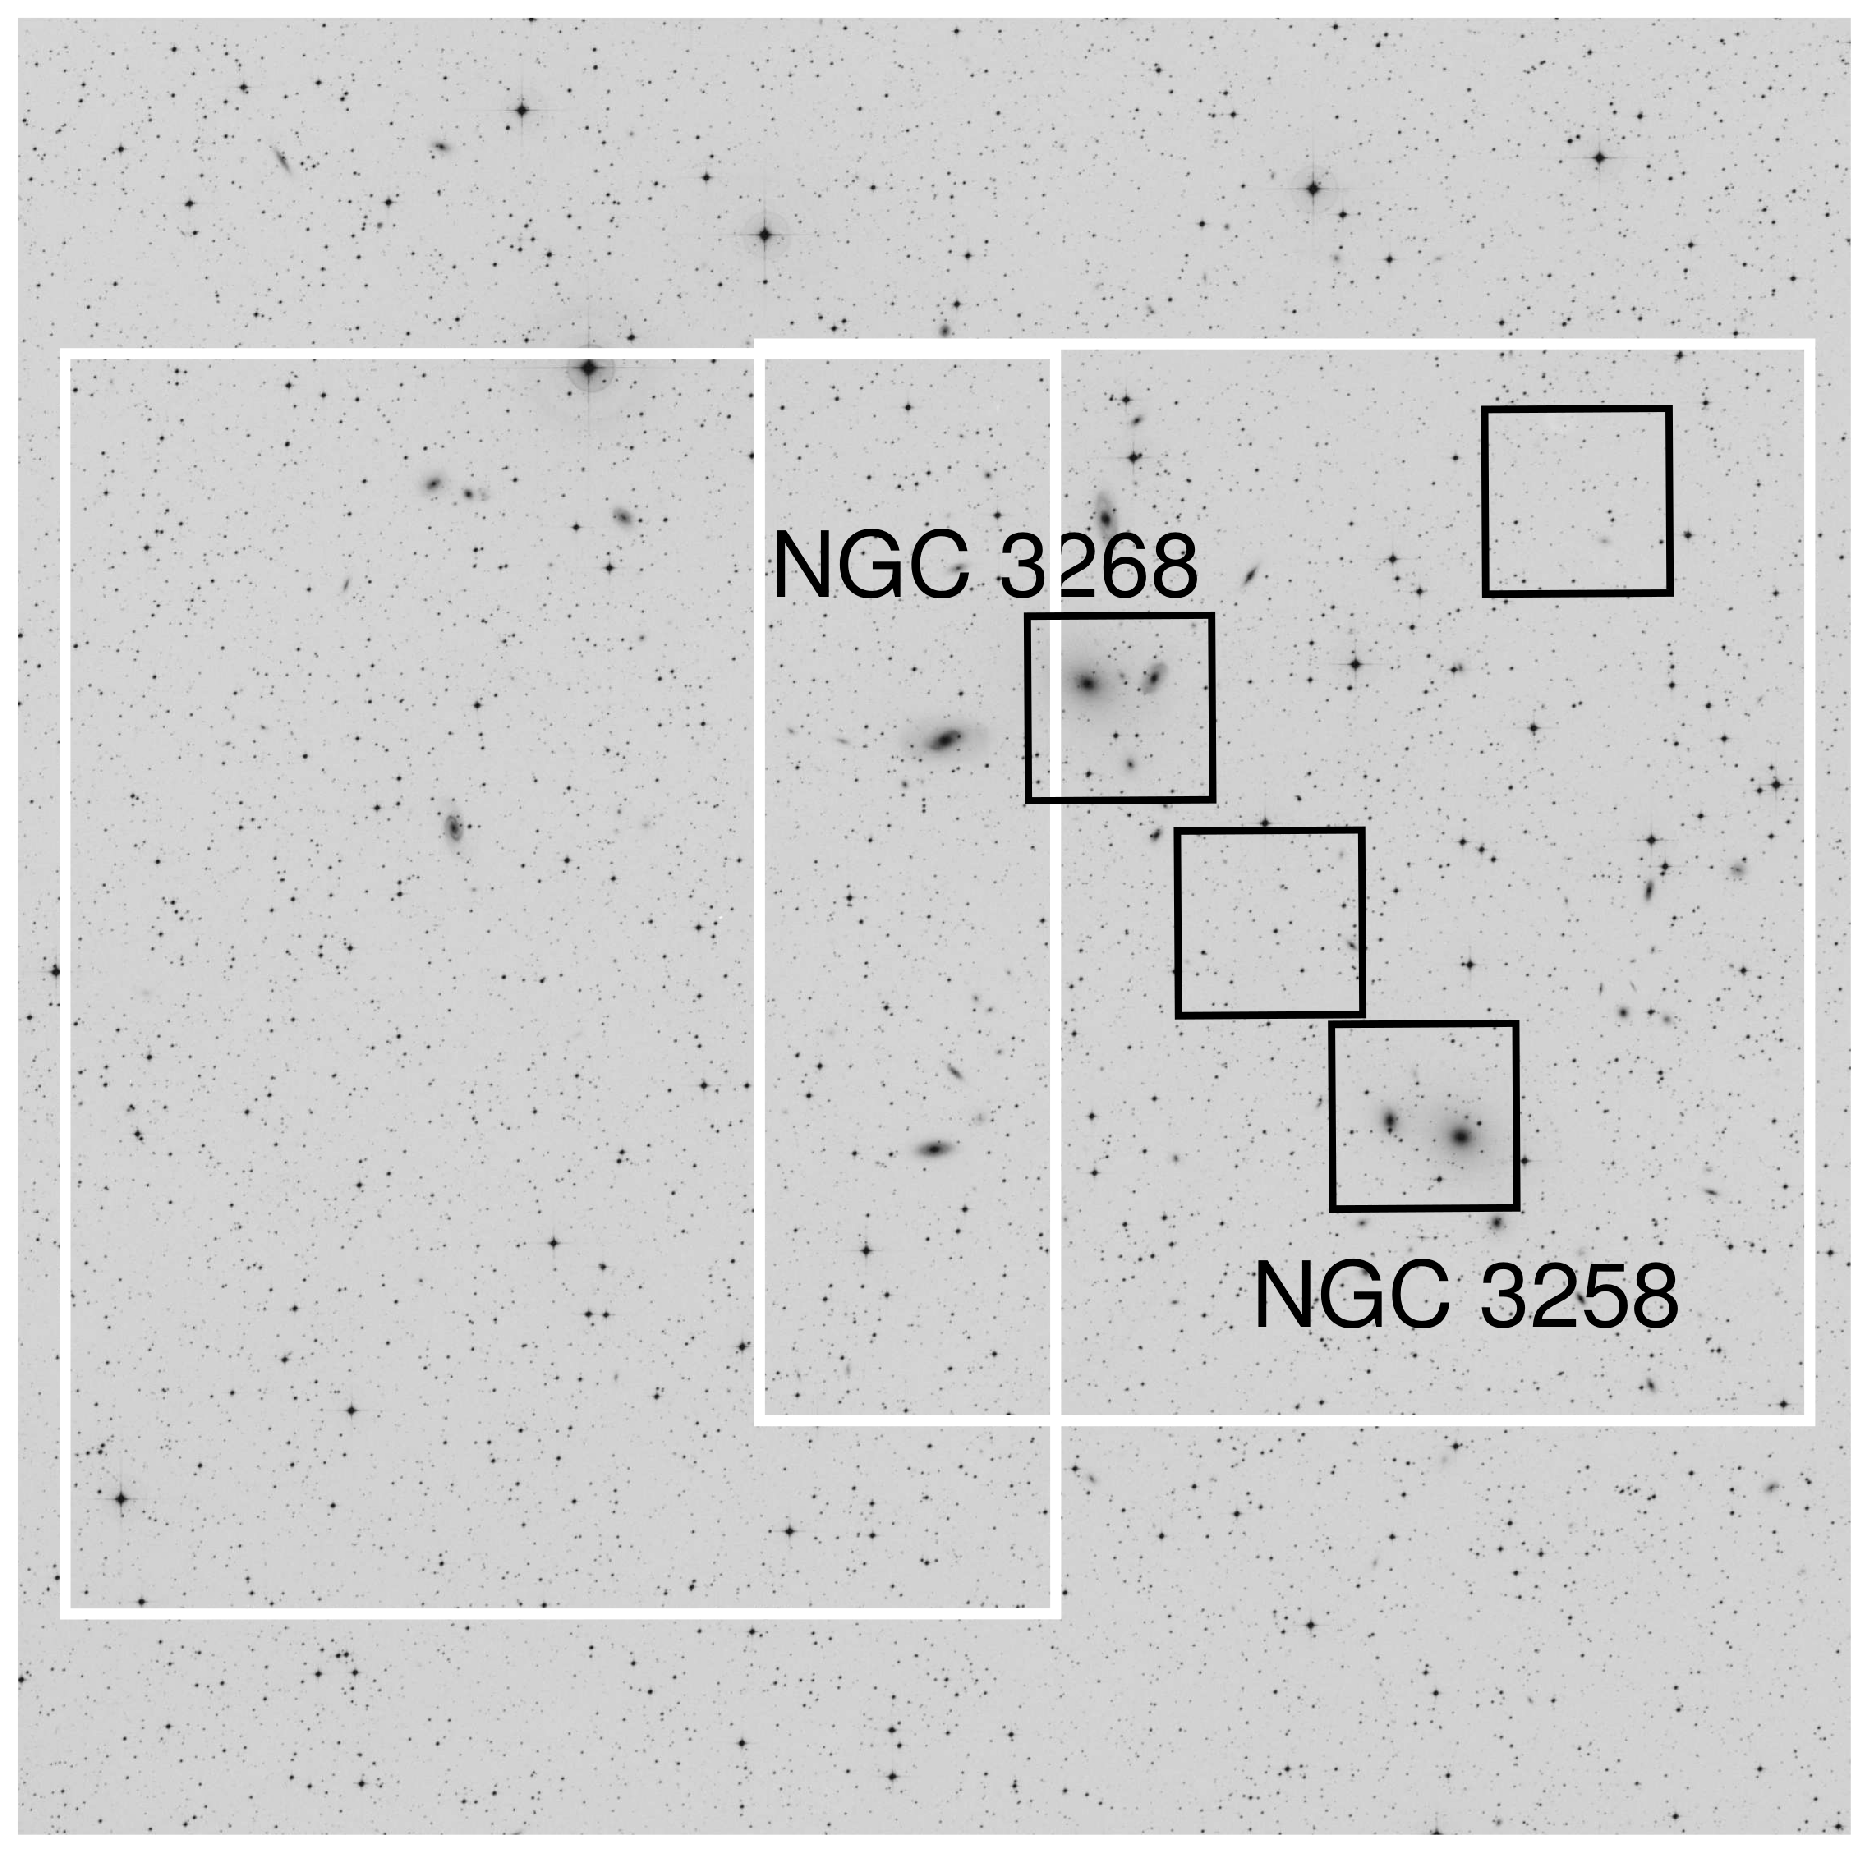
Figure 2.
Background and completeness corrected radial profiles from FORS1 data for blue (filled squares) and red (filled circles) globular clusters (GCs). The open symbols shows the MOSAIC data, properly scaled. Solid curves represent the Hubble modified profile fitted to FORS1 data, and dashed ones the power-laws fitted to MOSAIC data.

Figure 3.
In each panel the smoothed GC luminosity function from FORS1 data is represented with a solid line, while the dashed one represents the Gaussian fitted to the data. The shaded regions indicate the regions with fainter magnitudes than our limit due to the completeness drop.
Figure 3.
In each panel the smoothed GC luminosity function from FORS1 data is represented with a solid line, while the dashed one represents the Gaussian fitted to the data. The shaded regions indicate the regions with fainter magnitudes than our limit due to the completeness drop.

Figure 4.
Left panels: smoothed colour distributions for GC candidates from MOSAIC data, split in three radial distance regimes. Vertical lines indicate mean colours for the blue subpopulation, obtained with Gaussian mixture modeling (GMM) [24]. Right panels: analogue figures for GC candidates from FORS1 data.


Table 1.
Basic data from observations. FWHM: full width at half maximum.
| Name | Obs. Date | Exp. Time | Typical |
|---|---|---|---|
| MOSAIC data | |||
| Central Field | April 2002 | s in s in | |
| East Field | May 2004 | s in s in | |
| FORS1 data | |||
| March 2003 | s in s in I | ||
Table 2.
Parameters of the modified Hubble distribution fitted to the FORS1 radial profiles.
| NGC 3258 | NGC 3268 | |||
|---|---|---|---|---|
| Blue GCs | Red GCs | Blue GCs | Red GCs | |
| a | ||||
© 2017 by the authors. Licensee MDPI, Basel, Switzerland. This article is an open access article distributed under the terms and conditions of the Creative Commons Attribution (CC BY) license (http://creativecommons.org/licenses/by/4.0/).
Share and Cite
MDPI and ACS Style
Caso, J.P.; Bassino, L. Revisiting the Globular Cluster Systems of NGC 3258 and NGC 3268. Galaxies 2017, 5, 48. https://doi.org/10.3390/galaxies5030048
AMA Style
Caso JP, Bassino L. Revisiting the Globular Cluster Systems of NGC 3258 and NGC 3268. Galaxies. 2017; 5(3):48. https://doi.org/10.3390/galaxies5030048
Chicago/Turabian StyleCaso, Juan Pablo, and Lilia Bassino. 2017. "Revisiting the Globular Cluster Systems of NGC 3258 and NGC 3268" Galaxies 5, no. 3: 48. https://doi.org/10.3390/galaxies5030048
Note that from the first issue of 2016, this journal uses article numbers instead of page numbers. See further details here.