
Evidence for Toroidal B-Field Components in AGN Jets on Kiloparsec Scales


1
Department of Physics, University College Cork, Cork, Ireland
2
Hamburger Sternwarte, Universität Hamburg, Gojenbergsweg 112, 21029 Hamburg, Germany
*
Author to whom correspondence should be addressed.
Galaxies 2017, 5(4), 61; https://doi.org/10.3390/galaxies5040061
Submission received: 23 August 2017
/
Revised: 26 September 2017
/
Accepted: 28 September 2017
/
Published: 4 October 2017
(This article belongs to the Special Issue Polarised Emission from Astrophysical Jets)
Abstract
:Though helical magnetic fields are generally believed to arise when the jets of Active Galactic Nuclei (AGN) are launched, it is still unclear what role they play (and if they survive) to the largest jet scales. A helical or toroidal B-field may contribute substantially to the collimation of the jet. This B-field structure can be detected in images of the Faraday rotation measure (RM)—a measure of the change in polarisation angle of an electromagnetic wave as it passes through a magneto-ionic medium. The Faraday rotation measure is directly proportional to the line-of-sight magnetic field; therefore a monotonic gradient in the RM transverse to the jet indicates similar behaviour of the line-of-sight B-field component. This type of analysis has mostly been done on parsec scales using VLBI observations at centimetre wavelengths, while relatively few studies have probed decaparsec to kiloparsec scales. The detection of RM gradients with significances of 3 or more on such large scales can demonstrate the presence of a toroidal field component, which may be associated with a helical field that has persisted to these distances from the centre of the AGN. We present the results of new Faraday rotation analyses for 2 AGN on kiloparsec scales based on multiwavelength VLA observations, with robust transverse RM gradients detected in both. Furthermore, the direction of the inferred toroidal B-fields on the sky supports previous results indicating a predominance of outward currents in the jets on kiloparsec scales.
1. Introduction
Analysis of the polarized emission from radio jets from Active Galactic Nuclei (AGN) is a powerful tool for investigating their magnetic (B) field structure. The radio emission from these jets is synchrotron radiation originating from relativistic charged particles accelerated by B-fields. Synchrotron radiation is intrinsically polarized and has a theoretical upper limit to its polarized fraction of ∼70% for a uniform B-field and a random pitch-angle distribution for the radiating electrons [1]. The polarization angle, , can be used to estimate the direction of the B-field projected on the plane of the sky. The line-of-sight B-field however can also be investigated using Faraday rotation, the change in the angle of linear polarization as the electromagnetic wave passes through a region with free electrons and magnetic field. The ‘rotation’ is caused by a delay between the left and right circularly polarized components of the electromagnetic wave. The rotation measure (RM) is defined as follows:
where denotes the polarization angle, is the intrinsic polarization angle, is the magnetic field, is a path element along the line of sight, is the electron density, and is the observing wavelength; by fitting versus the fitted slope and intercept on the axis give the RM and intrinsic polarization angle, . A gradient in the RM transverse to the jet indicates a similar trend in the line-of-sight magnetic field. Such a gradient is a strong indicator for a toroidal magnetic field component, which may be confining the jet. The direction of this gradient also gives information regarding the direction of the toroidal B-field component, which, in turn implies a direction for the associated electrical current in the jet using the right hand rule from basic physics. This publication focuses on the larger scale RM gradients using observations made with the VLA. Reliable transverse RM gradients on kiloparsec scale have previously only been detected in 2 other extragalactic radio sources [2,3]; our detection of significant RM gradients in Coma A and 3C 465 adds substantially to these results. The method by which the gradients considered here were analysed is identical to the method used in [2,3,4,5]. The significance of an RM gradient was calculated using its end point values and associated errors. This is a conservative estimate as the error in the RM increases at the edges of the jet as there is less polarized intensity. The significance was calculated by dividing the total change in the RM by the errors at the end points of the gradients added in quadrature.
2. Results
2.1. Coma A
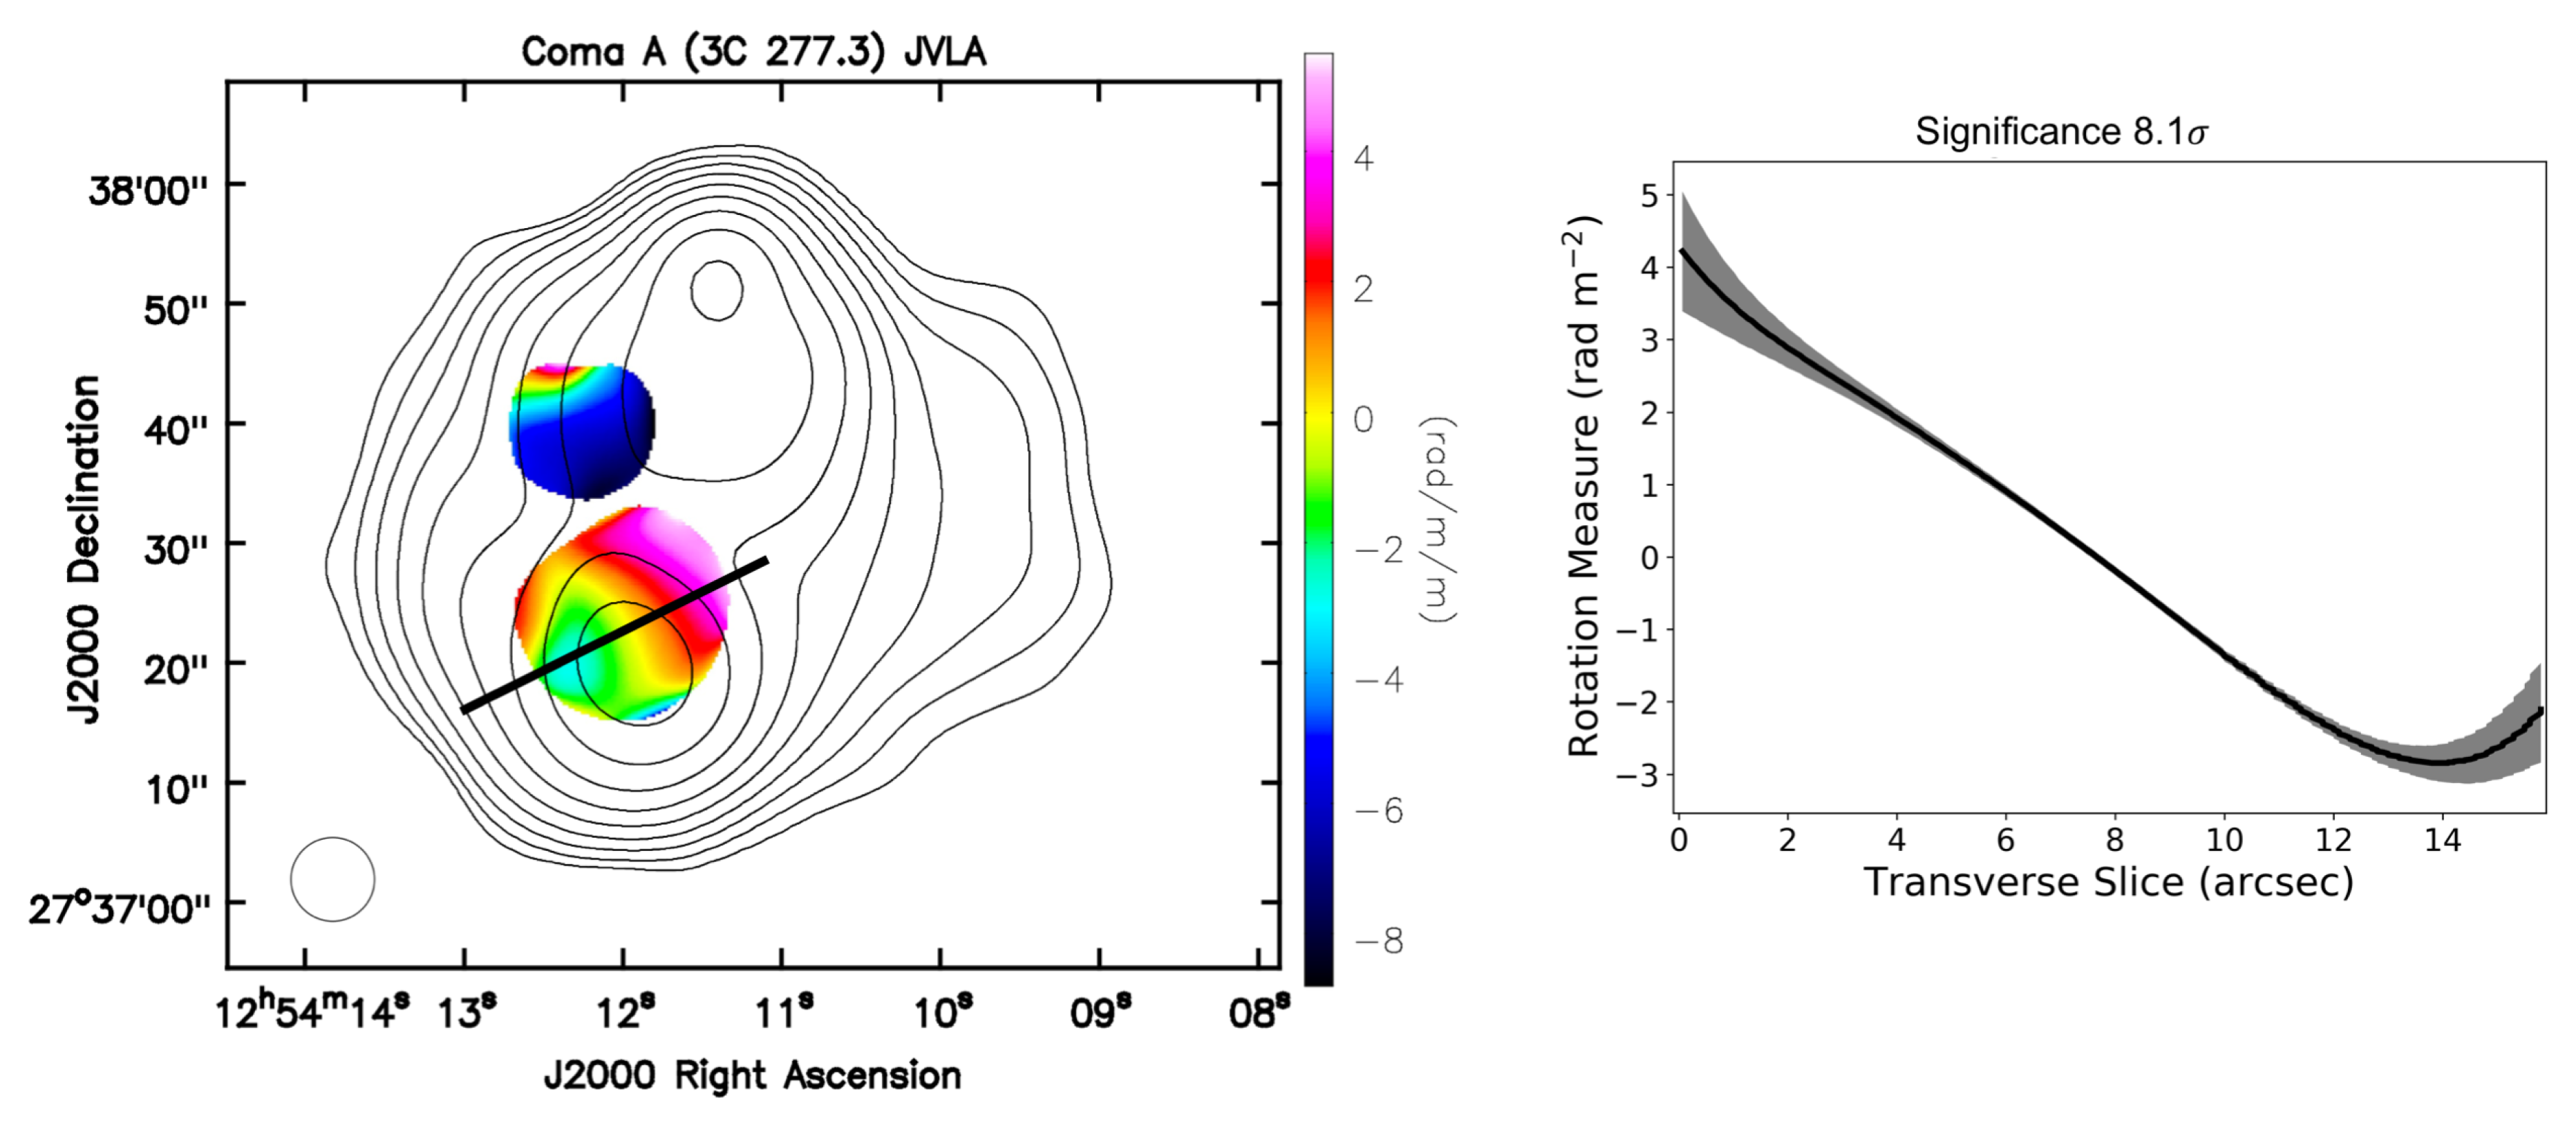
Coma A (3C 277.3) is a twin-lobed radio galaxy at redshift [6]. This AGN shows an unusual jet structure with a bright hotspot in the northern lobe and a deflected jet and knots in the southern lobe. The morphology of the jets is discussed in detail in [6,7]. Observations from 1–2 using the NRAO Karl Jansky Very Large Array (JVLA) were analysed. The observational setup is outlined in Table 1 (project 13B-083). The data were calibrated in the CASA software package using standard techniques. The flux calibrator and the polarization angle calibrator was 3C 286. The data were imaged in 16 separate 64 bandwidth intervals. The images were made using a uv taper to ensure they shared a common resolution and were smoothed to have a common 7″ beam. To calculate the RM, versus fits were performed using the rmfit task in CASA. The Galactic contribution to the RM is [8] and has been subtracted from the displayed RM maps to give a better approximation to the true RM in the vicinity the radio source. A gradient in the RM is visible across the southern jet. As can be seen in Figure 1, the significance of the gradient is ≃8.
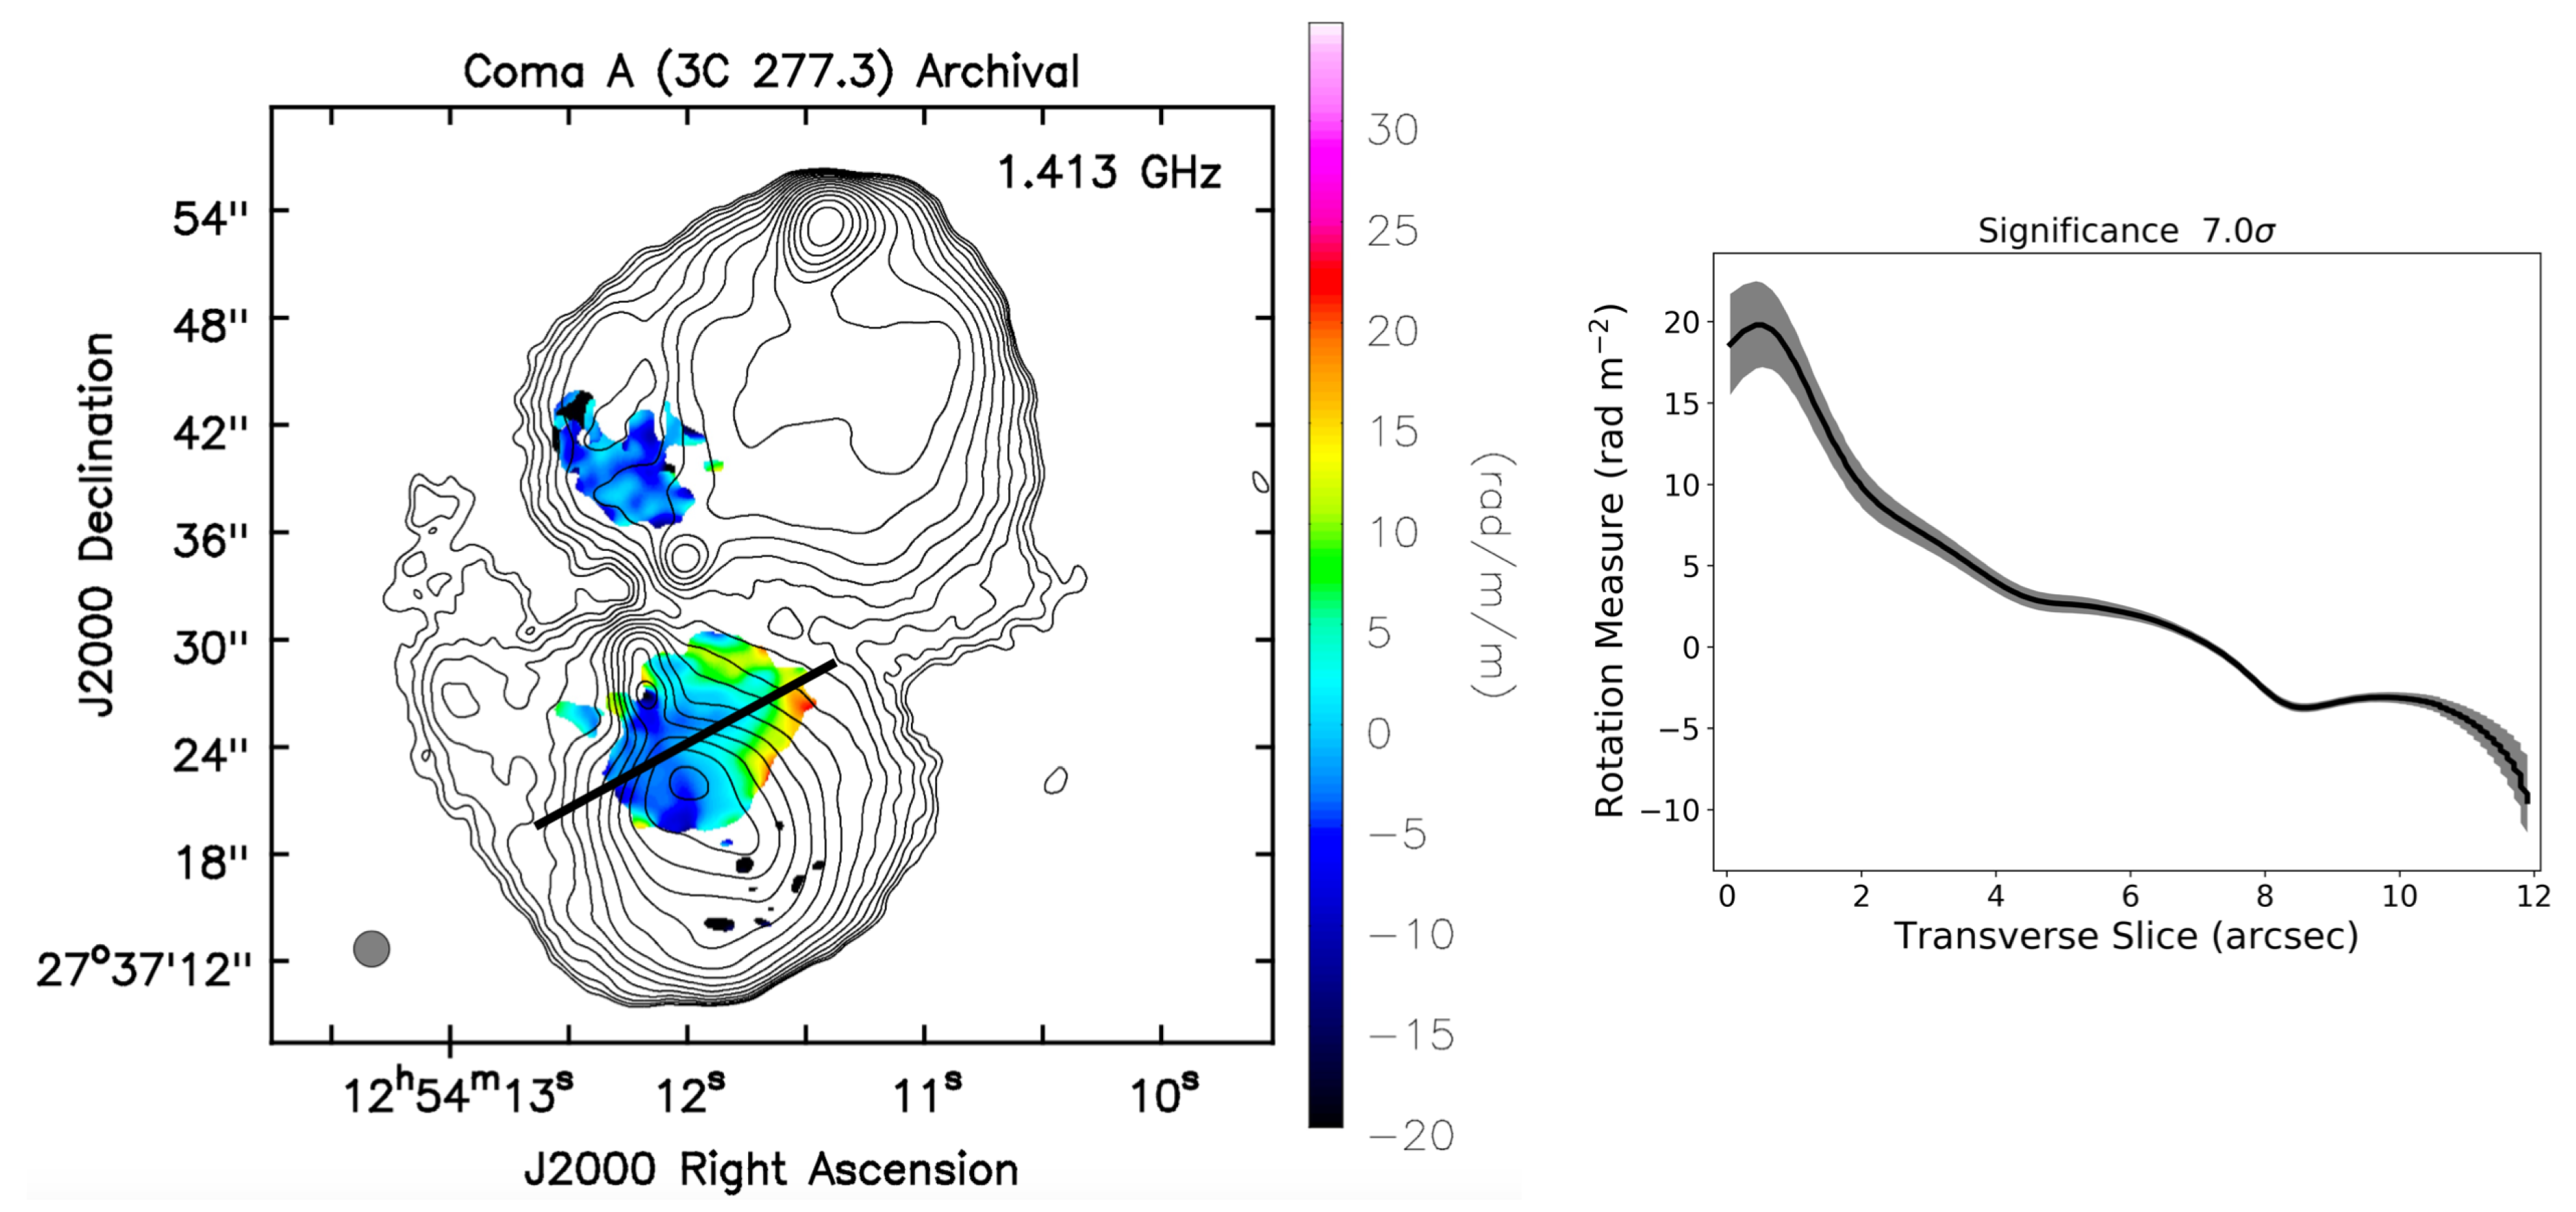
To confirm the result seen in these 1–2 data, archival VLA observations were analysed also. The archival VLA data used in this study are outlined in Table 1. The data were calibrated using the AIPS software package using standard techniques; 3C 286 was the flux calibrator and the polarization angle calibrator for these observations. Images made using a multi-scale CLEAN in the CASA package. As can be seen in Table 1, the VLA configurations are different for each observation; conveniently this gives all observations well matched coverage. An RM map was constructed using a common 2″ beam for each frequency and fitting versus using a weighted least squares fitting algorithm written in python and implemented in CASA.
A transverse RM gradient can be seen in Figure 2 in the same location it was detected in the JVLA image in Figure 1. A slice of RM values along the black line in the left panel is given on the right panel in Figure 2. The significance of this gradient is . The gradient is not as smooth as the gradient in Figure 1 and not strictly monotonic; this is an inevitable result, considering the large distances covered, turbulence in the jet, and any random magnetic field components that may be present. In both the archival VLA and JVLA images the observed RM gradient changes from positive to negative; such a change in the rotation measure can only be explained by a change in direction for the line-of-sight magnetic field, and not a change in electron density. The direction of the transverse RM gradient in Coma A implies that the toroidal B field is oriented toward/away from the observer on the western/eastern side of the southern lobe, corresponding to an outward current in the jet, from basic physics (the right-hand rule).
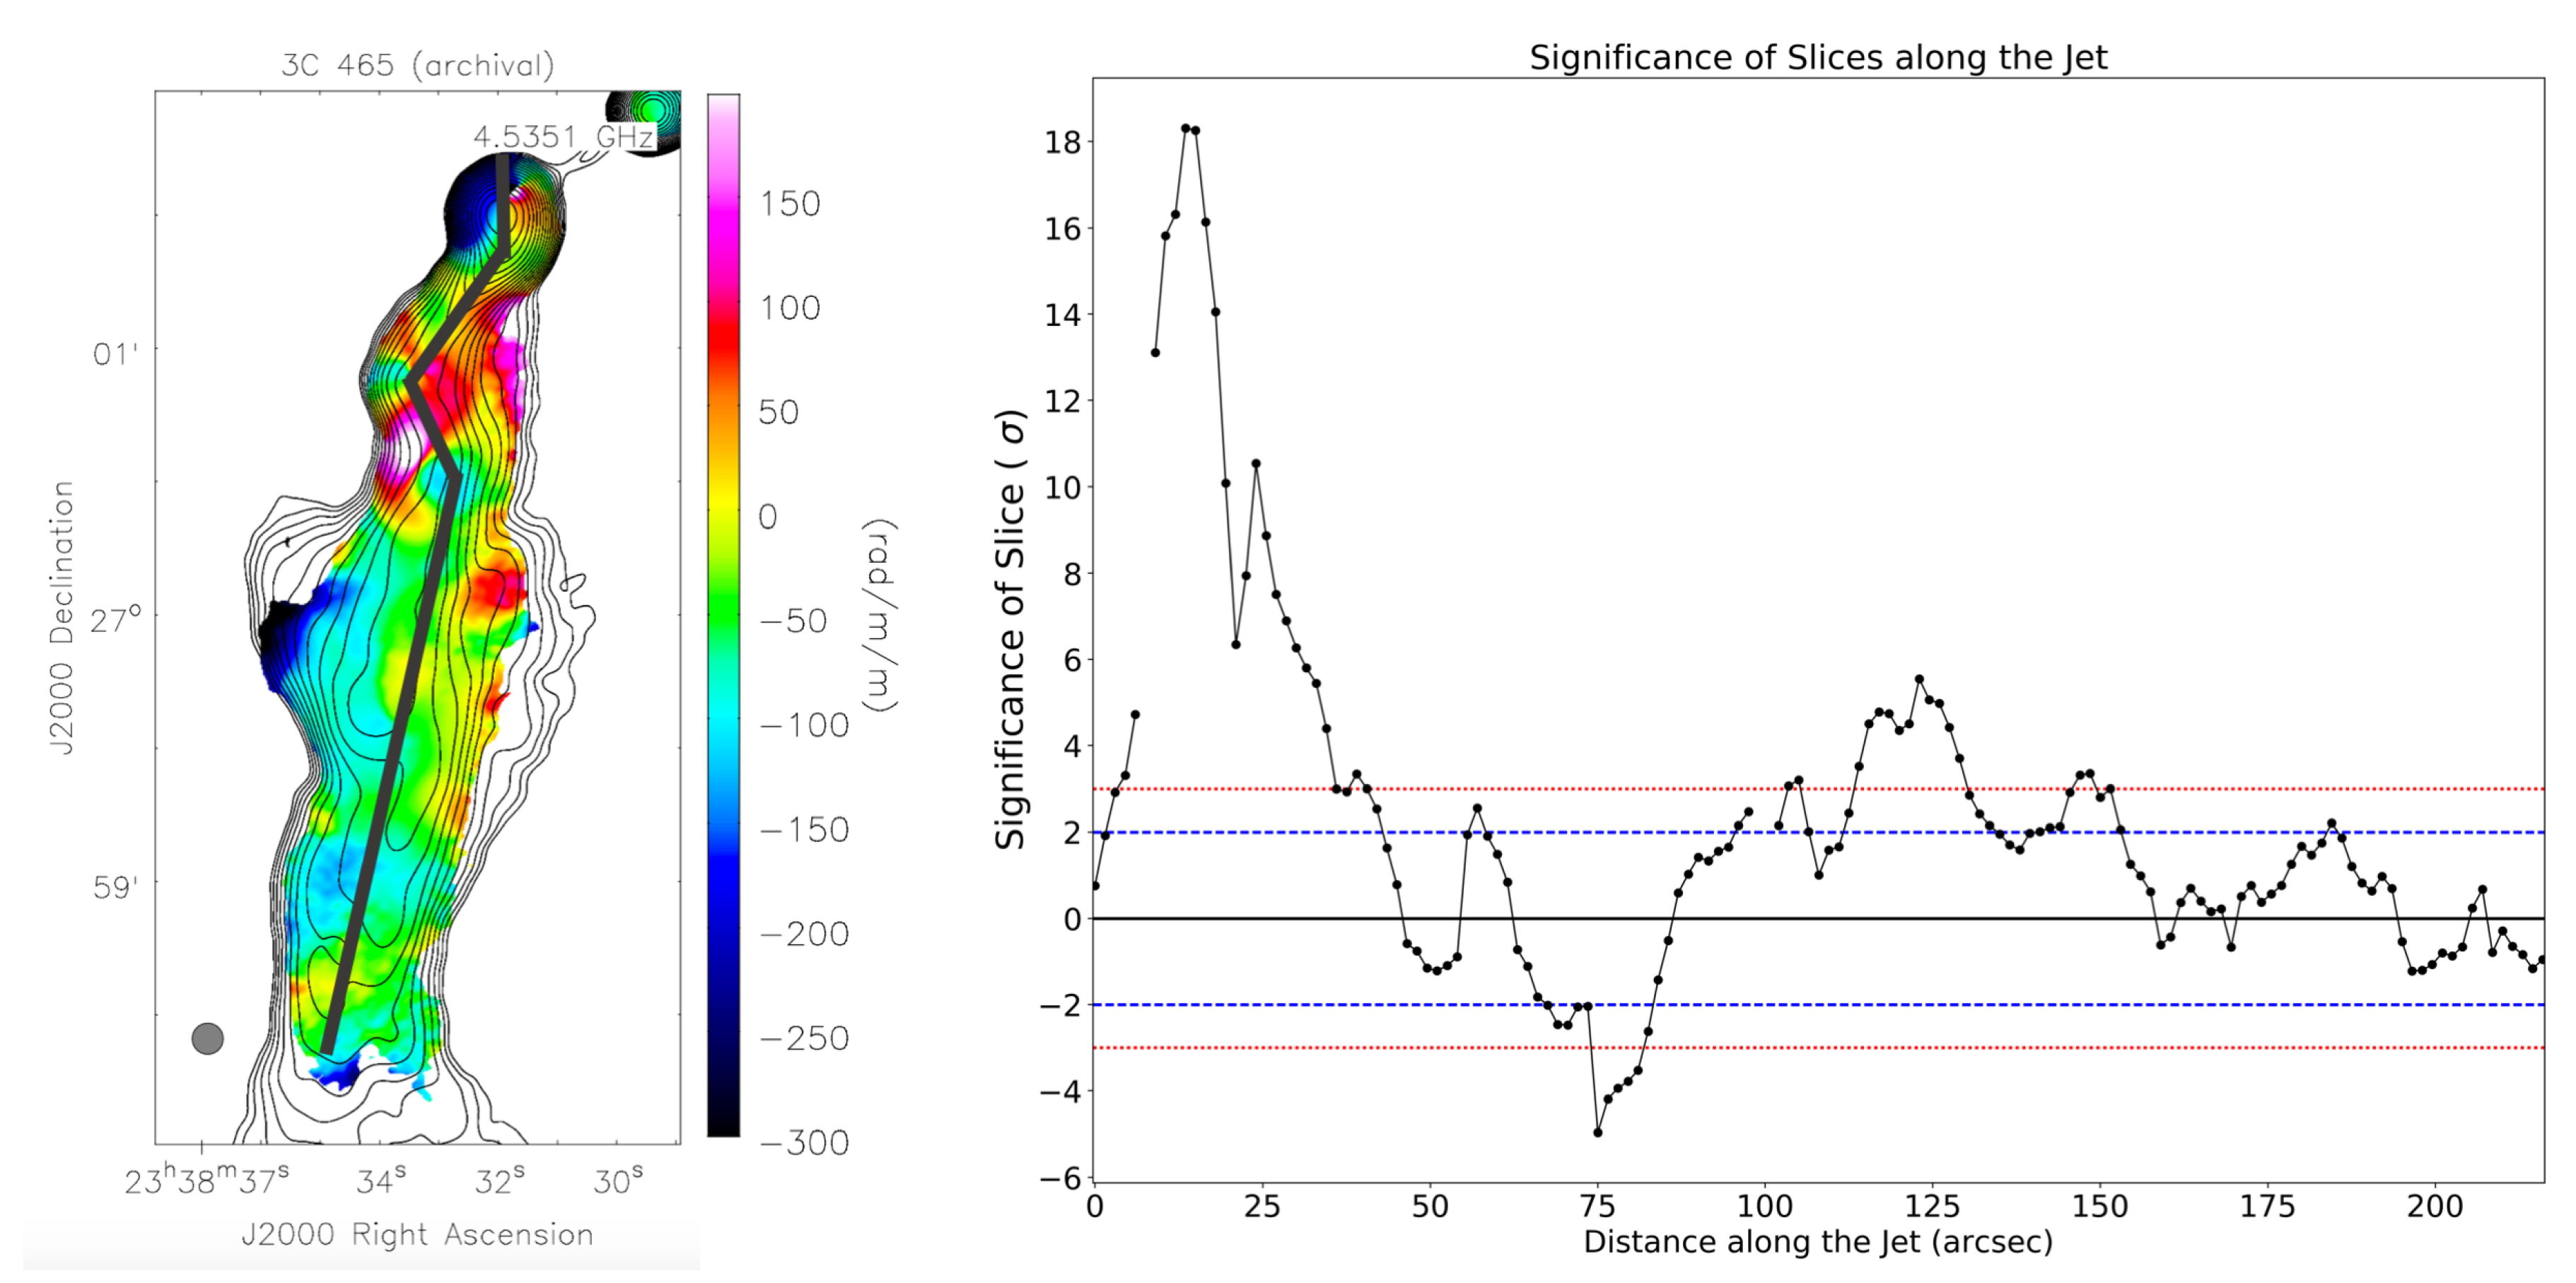
2.2. 3C 465
The radio galaxy 3C 465, at redshift z = 0.0302, was also investigated [9]. The data we used were originally analysed and published in [10]. An RM map presented in [10] seems to show a possible transverse RM gradient, and we wished to verify this. The raw data were downloaded from the NRAO VLA archive and calibrated in AIPS using standard techniques, the images were also made in AIPS. The multifrequency data were observed at 4.5–5 and at 8–8.9 in the VLA C configuration. The RM image was constructed using a 7″ beam and the vs fits to calculate the RM were made using a weighted least squares fitting algorithm written in python and implemented in CASA. The Galactic contribution to the RM of −47.5 [8] was subtracted from the RM images. The left panel of Figure 3 shows a close up of the southern jet and its RM distribution; a clear tendency for less negative or even positive RM values along the western side of the jet can be seen. The change from positive to negative RM is suggestive of a toroidal magnetic field component due to the implied change in direction of the line-of-sight B-field component. A plot showing the results of taking a series of RM slices across the jet at different distances along the jet is shown in the right panel: the horizontal axis shows the distance along the jet where a slice was taken and the vertical axis the significance of the corresponding RM gradient. A positive/negative significance indicates a gradient corresponding to an outward/inward current along the jet. The plot shows that the vast majority of the gradients above the 2 and 3 markings are positive and imply an outward current. The only region where there are briefly gradients with a significance of less than is in the region of the jet where the direction changes, at a declination of approximately +27°0́30″. The morphology of the jet in this region may be a cause for the unusual RM structure here.
3. Discussion
The two AGN considered here both show transverse rotation measure gradients across their kiloparsec scale jets. The sign of the RM also changes along these transverse RM gradients, which can only be explained by a change in direction of the magnetic field along the line of sight and not by a change in electron density. The toroidal B-field that gives rise to the observed RM gradients may be a component of a helical jet B-field. The direction of the gradient plays an important role in supporting models for the generation of such a helical field. The ‘Cosmic Battery’ model discussed in [3,11] predicts that, on smaller scales observable using VLBI a helical field corresponding to an inward current will dominate, while on larger scales, a magnetic field configuration corresponding to an outward current is expected to dominate. This is because the ‘Cosmic Battery’ predicts a nested helix structure with different helices dominating the observed Faraday rotation on different scales. Using the VLBA many significant RM gradients have been found on parsec scales with directions implying mostly inward currents [4,5]. Christodoulou et al. [3] show that all observed significant RM gradients on larger scales imply outward currents, consistent with the ‘Cosmic Battery’; the results presented here lend further support to this picture. Using Table 1 from [3] and the results from this study a total of 11 out of 11 firm gradients on larger scales imply outward currents. The likelihood of this preference in current direction being completely random can be calculated using a binomial probability distribution, this is simply a probability of which is about a chance of being a random result.
Further investigation is required of a larger sample of AGN at different frequency ranges to further test this “Cosmic Battery” model, however these early results are very promising.
Acknowledgments
This research was funded by a Government of Ireland Postgraduate Scholarship from the Irish Research Council. The VLA is an instrument of the National Radio Astronomy Observatory, a facility of the National Science Foundation operated under cooperative agreement by Associated Universities, Inc.
Author Contributions
All the imaging and data analysis were performed by Sebastian Knuettel. Supervision, revision and suggestions were made by Denise Gabuzda. Shane P. O’Sullivan provided access to the JVLA observations and provided guidance in their calibration and analysis.
Conflicts of Interest
The authors declare no conflict of interest.
Abbreviations
The following abbreviations are used in this manuscript:
| RM | Rotation Measure |
| AGN | Active Galactic Nucleus |
| VLBI | Very Long Baseline Interferometry |
| VLBA | Very Long Baseline Array |
| VLA | Very Large Array |
| JVLA | Jansky Very Large Array |
| NRAO | National Radio Astronomy Observatory |
| AIPS | Astronomical Image Processing System |
| CASA | Common Astronomy Software Applications |
References
- Pacholczyk, A.G. Radio Astrophysics. Nonthermal Processes in Galactic and Extragalactic Sources; W. H. Freeman: New York, NY, USA, 1970. [Google Scholar]
- Gabuzda, D.C.; Knuettel, S.; Bonafede, A. Evidence for a toroidal magnetic-field component in 5C 4.114 on kiloparsec scales. Astron. Astrophys. 2015, 583, A96. [Google Scholar] [CrossRef]
- Christodoulou, D.; Gabuzda, D.; Knuettel, S.; Contopoulos, I.; Kazanas, D.; Coughlan, C. Dominance of outflowing electric currents on decaparsec to kiloparsec scales in extragalactic jets. Astron. Astrophys. 2016. [Google Scholar] [CrossRef]
- Gabuzda, D.C.; Reichstein, A.R.; O’Neill, E.L. Are spine-sheath polarization structures in the jets of active galactic nuclei associated with helical magnetic fields? Mon. Not. R. Astron. Soc. 2014, 444, 172–184. [Google Scholar] [CrossRef]
- Gabuzda, D.C.; Knuettel, S.; Reardon, B. Transverse Faraday-rotation gradients across the jets of 15 active galactic nuclei. Mon. Not. R. Astron. Soc. 2015, 450, 2441–2450. [Google Scholar] [CrossRef]
- Bridle, A.H.; Fomalont, E.B.; Palimaka, J.J.; Willis, A.G. VLA observation of radio/optical knots in 3C 277.3 = Coma A. Astrophys. J. 1981, 248, 499–503. [Google Scholar] [CrossRef]
- Van Breugel, W.; Miley, G.; Heckman, T.; Butcher, H.; Bridle, A. Optical emission-line gas associated with the radio source 3C 277.3. Astrophys. J. 1985, 290, 496–500. [Google Scholar] [CrossRef]
- Taylor, A.R.; Stil, J.M.; Sunstrum, C. A Rotation Measure Image of the Sky. Astrophys. J. 2009, 702, 1230–1236. [Google Scholar] [CrossRef]
- Wegner, G.; Colless, M.; Saglia, R.P.; McMahan, J.R.K.; Davies, R.L.; Burstein, D.; Baggley, G. The peculiar motions of early-type galaxies in two distant regions—II. The spectroscopic data. Mon. Not. R. Astron. Soc. 1999, 305, 259–296. [Google Scholar] [CrossRef]
- Eilek, J.A.; Owen, F.N. Magnetic Fields in Cluster Cores: Faraday Rotation in A400 and A2634. Astrophys. J. 2002, 567, 202–220. [Google Scholar] [CrossRef]
- Contopoulos, I.; Christodoulou, D.M.; Kazanas, D.; Gabuzda, D.C. The Invariant Twist of Magnetic Fields in the Relativistic Jets of Active Galactic Nuclei. Astrophys. J. 2009, 702, L148–L152. [Google Scholar] [CrossRef]
Figure 1.
Left panel shows a Faraday rotation image made using a wideband JVLA observation from 1–2 , the beam is shown by the circle in the lower left corner of the image. The Stokes I contours correspond to the 1.5 and start at 1 and increase in factors of 2. The data for 16 frequencies in this range were fitted using the CASA rmfit task. Right panel shows the slice taken of the rotation measure (RM) along the path taken by the black line in the right panel. The gray shading is the 1 error in the RM for each value.

Figure 2.
Left panel shows a Faraday rotation measure image made using archival VLA observations at 1.4 , 4.9 and 15 . The VLA configurations used ensured the coverage was matched. The total intensity contours start at 0.6 mJy and increase by factors of . The beam is shown by the circle in the lower left corner of the image. Right panel shows the slice taken along the RM along the path taken by the black line in the right panel. The gray shading is the 1 error in the RM for each value.

Figure 3.
Left panel shows a Faraday rotation measure image of the southern jet of 3C 465 made using archival VLA observations at 4.5–5 and 8–8.9 . The contours show the total intensity at 4.534 starting at 0.3 mJy and increasing by factors of . The beam is shown by the circle in the bottom left hand corner of the left panel. Right panel shows the significance of transverse RM gradients along the jet, starting at the northern end of the hotspot. The estimated jet direction is given by the thick, dark-grey line superposed on the RM image in the left panel. The significance of the RM gradients is measured every 1.5″ along the jet. The levels of and are given as blue and red dashed lines respectively.

Table 1.
Table outlining the VLA observations of Coma A. is the observing frequency. The bandwidth is and t is the total integration time on Coma A. The single horizontal line separates the archival VLA from the Jansky Very Large Array (JVLA) data.
Table 1.
Table outlining the VLA observations of Coma A. is the observing frequency. The bandwidth is and t is the total integration time on Coma A. The single horizontal line separates the archival VLA from the Jansky Very Large Array (JVLA) data.
| Project | MHz | MHz | Configuration | Approx Resolution | Observing Date | t h |
|---|---|---|---|---|---|---|
| VANB | 1413 | 25 | VLA A | 1.2″ | 18 March 1981 | 4.7 |
| VANB | 4885 | 50 | VLA B | 1.4″ | 1 June 1981 | 4.1 |
| AB348 | 14940 | 100 | VLA C | 2.0″ | 26 August 1985 | 6.2 |
| 13B-083 | 994–2006 | VLA B | 6.4″–3.2″ | 29 December 2013 | 1.8 |
Data previously published in [7]; Data consist of two channels 50 apart each with 50 bandwidth. Central frequency is given; For imaging data was binned into 16 separate bins with 64 bandwidth.
© 2017 by the authors. Licensee MDPI, Basel, Switzerland. This article is an open access article distributed under the terms and conditions of the Creative Commons Attribution (CC BY) license (http://creativecommons.org/licenses/by/4.0/).
Share and Cite
MDPI and ACS Style
Knuettel, S.; Gabuzda, D.; O’Sullivan, S.P. Evidence for Toroidal B-Field Components in AGN Jets on Kiloparsec Scales. Galaxies 2017, 5, 61. https://doi.org/10.3390/galaxies5040061
AMA Style
Knuettel S, Gabuzda D, O’Sullivan SP. Evidence for Toroidal B-Field Components in AGN Jets on Kiloparsec Scales. Galaxies. 2017; 5(4):61. https://doi.org/10.3390/galaxies5040061
Chicago/Turabian StyleKnuettel, Sebastian, Denise Gabuzda, and Shane P. O’Sullivan. 2017. "Evidence for Toroidal B-Field Components in AGN Jets on Kiloparsec Scales" Galaxies 5, no. 4: 61. https://doi.org/10.3390/galaxies5040061
Note that from the first issue of 2016, this journal uses article numbers instead of page numbers. See further details here.