A Comparative Study of Multiwavelength Blazar Variability on Decades to Minutes Timescales

Astronomical Observatory of the Jagiellonian University, ul. Orla 171, 30-244 Kraków, Poland
Galaxies 2018, 6(1), 34; https://doi.org/10.3390/galaxies6010034
Submission received: 20 February 2018
/
Revised: 28 February 2018
/
Accepted: 2 March 2018
/
Published: 8 March 2018
(This article belongs to the Special Issue Polarised Emission from Astrophysical Jets)
Abstract
:Multiwavelength blazar variability is produced by noise-like processes with the power-law form of power spectral density (PSD). We present the results of our detailed investigation of multiwavelength (-ray and optical) light curves covering decades to minutes timescales, of two BL Lac objects namely, PKS 0735+178 and OJ 287. The PSDs are derived using discrete Fourier transform (DFT) method. Our systematic approach reveals that OJ 287 is, on average, more variable than PKS 0735+178 at both optical and -ray energies on the corresponding time scales. On timescales shorter than ∼10 days, due to continuous and dense monitoring by the Kepler satellite, a steepening of power spectrum is observed for OJ 287. This indicates the necessity of an intermittent process generating variability on intra-night timescales for OJ 287.
1. Introduction
Blazars are relatively a rare class of active galactic nuclei (AGN) whose total radiative energy output is dominated by the Doppler-boosted, broad-band and non-thermal processes; synchrotron (radio–to–optical) and inverse-Compton (IC; ∼X-ray–to–-ray) occurring in relativistic jets [1]. Besides showing extreme luminosities up to ∼ ergs s [2], blazars are also extremely variable on timescales ranging from decades to hours and even down to minutes with intensity changes of a factor of few, especially prominent at X-ray and -ray energies [3,4]. The origin of such dramatic flux changes, in particular their relation to larger amplitude variability, typically 1–2 orders of magnitude, but on longer timescales is still widely debated [5]. The variations on short-timescales provide an additional challenge at higher energies, as large jet bulk Lorentz factors () are needed to overcome the photon opacity arguments [6] which are rather too extreme to be reconciled with the currently favored models for the jet formation in AGN [7]. The statistical properties of multiwavelength (radio-to--ray) blazar light curves, in particular, the simple power-law shape of power spectral densities (PSDs; defined as P() where is the temporal frequency and is the slope), indicate that the variability is generated by correlated noise-like processes on timescales ranging from decades to minutes [8]. Here, we present a comparative study of the synchrotron and the IC variability of two BL Lac objects, namely, PKS 0735+178 and OJ 287 using decade-long optical and -ray light curves.
2. Methodology: Light Curve Generation and PSD Analysis
Optical and -ray light curves of the blazars PKS 0735+178 and OJ 287 are presented in [9,10], respectively. The Fermi-LAT light curves were generated following the standard unbinned likelihood analysis1. The daily averaged R-band photometric light curves for the sources are collected from various observational programmes [9,10]. In case of OJ 287, the 117-year-long optical light curve could be generated by combining the historical light curve [11] and our own monitoring programmes. In addition, several nights of intra-night data at R-band are also available for these blazars [12,13]. The R-band magnitudes were calibrated using the standard stars [14] with an accuracy of ≤2–5 percent and converted to fluxes using zero point magnitude flux of 3064 Jy. For these light curves, the PSDs were generated using DFT method (Section 3).
3. PSD Construction: DFT
Following [9,15], the PSD of an evenly sampled light curve of length N points is given by the periodogram which is defined as the squared modulus of the discrete Fourier transform (DFT):
Here the flux values are mean corrected (i.e., mean is subtracted from the flux values) to remove the zero frequency power and the DFT is computed for freuencies between to , i.e., for for N even, and . The normalized power is obtained
The normalized periodogram as defined in Equation (2) yields the total excess variance when integrated over positive frequencies. Meanwhile, the noise floor levels corresponding to the variability power due solely to statistical fluctuations are estimated, e.g., as in [16]
where, is the mean variance of the measurement uncertainties on the flux values. The evenly spaced time-series is obtained by linear-interpolation between the observed data points [15]. The periodogram obtained using Equation (2), is known as the ‘raw’ periodogram. Since it consist of independently distributed variables with two degrees of freedom, each estimate has a standard deviation around the true value equal the true value itself, providing a noisy estimate of the spectral power [17]. Therefore, in order to obtain a reliable estimate of spectral power, ‘raw’ periodograms are averaged in frequency space (‘binned’ periodograms, shown by filled circles in Figure 1 and Figure 2) by a factor of 1.6 with frequency taken as a geometric mean of that frequency bin. Finally, a factor of –0.25068 is added in the logarithmic ‘binned’ periodograms estimates to remove the bias because of the shape of distribution due to the transformation of the linear to log space [17]. For the analysis, the logarithmic ‘binned’ PSDs are fitted with a single power law above the noise floor level due to measurement uncertainties using a linear fit defined as where is the slope and the reported error corresponds to rms residual between the model and the data.
4. Result and Discussion
- The PSD slopes obtained from our analysis for the long-term -ray and optical light curves of the BL Lac objects and on timescales ranging from many years to weeks indicate that the statistical character of -ray flux changes ( 1; flickering/pink noise) is different than that for optical flux changes ( 1.5–2.9; red noise) (Figure 1 and Figure 2).
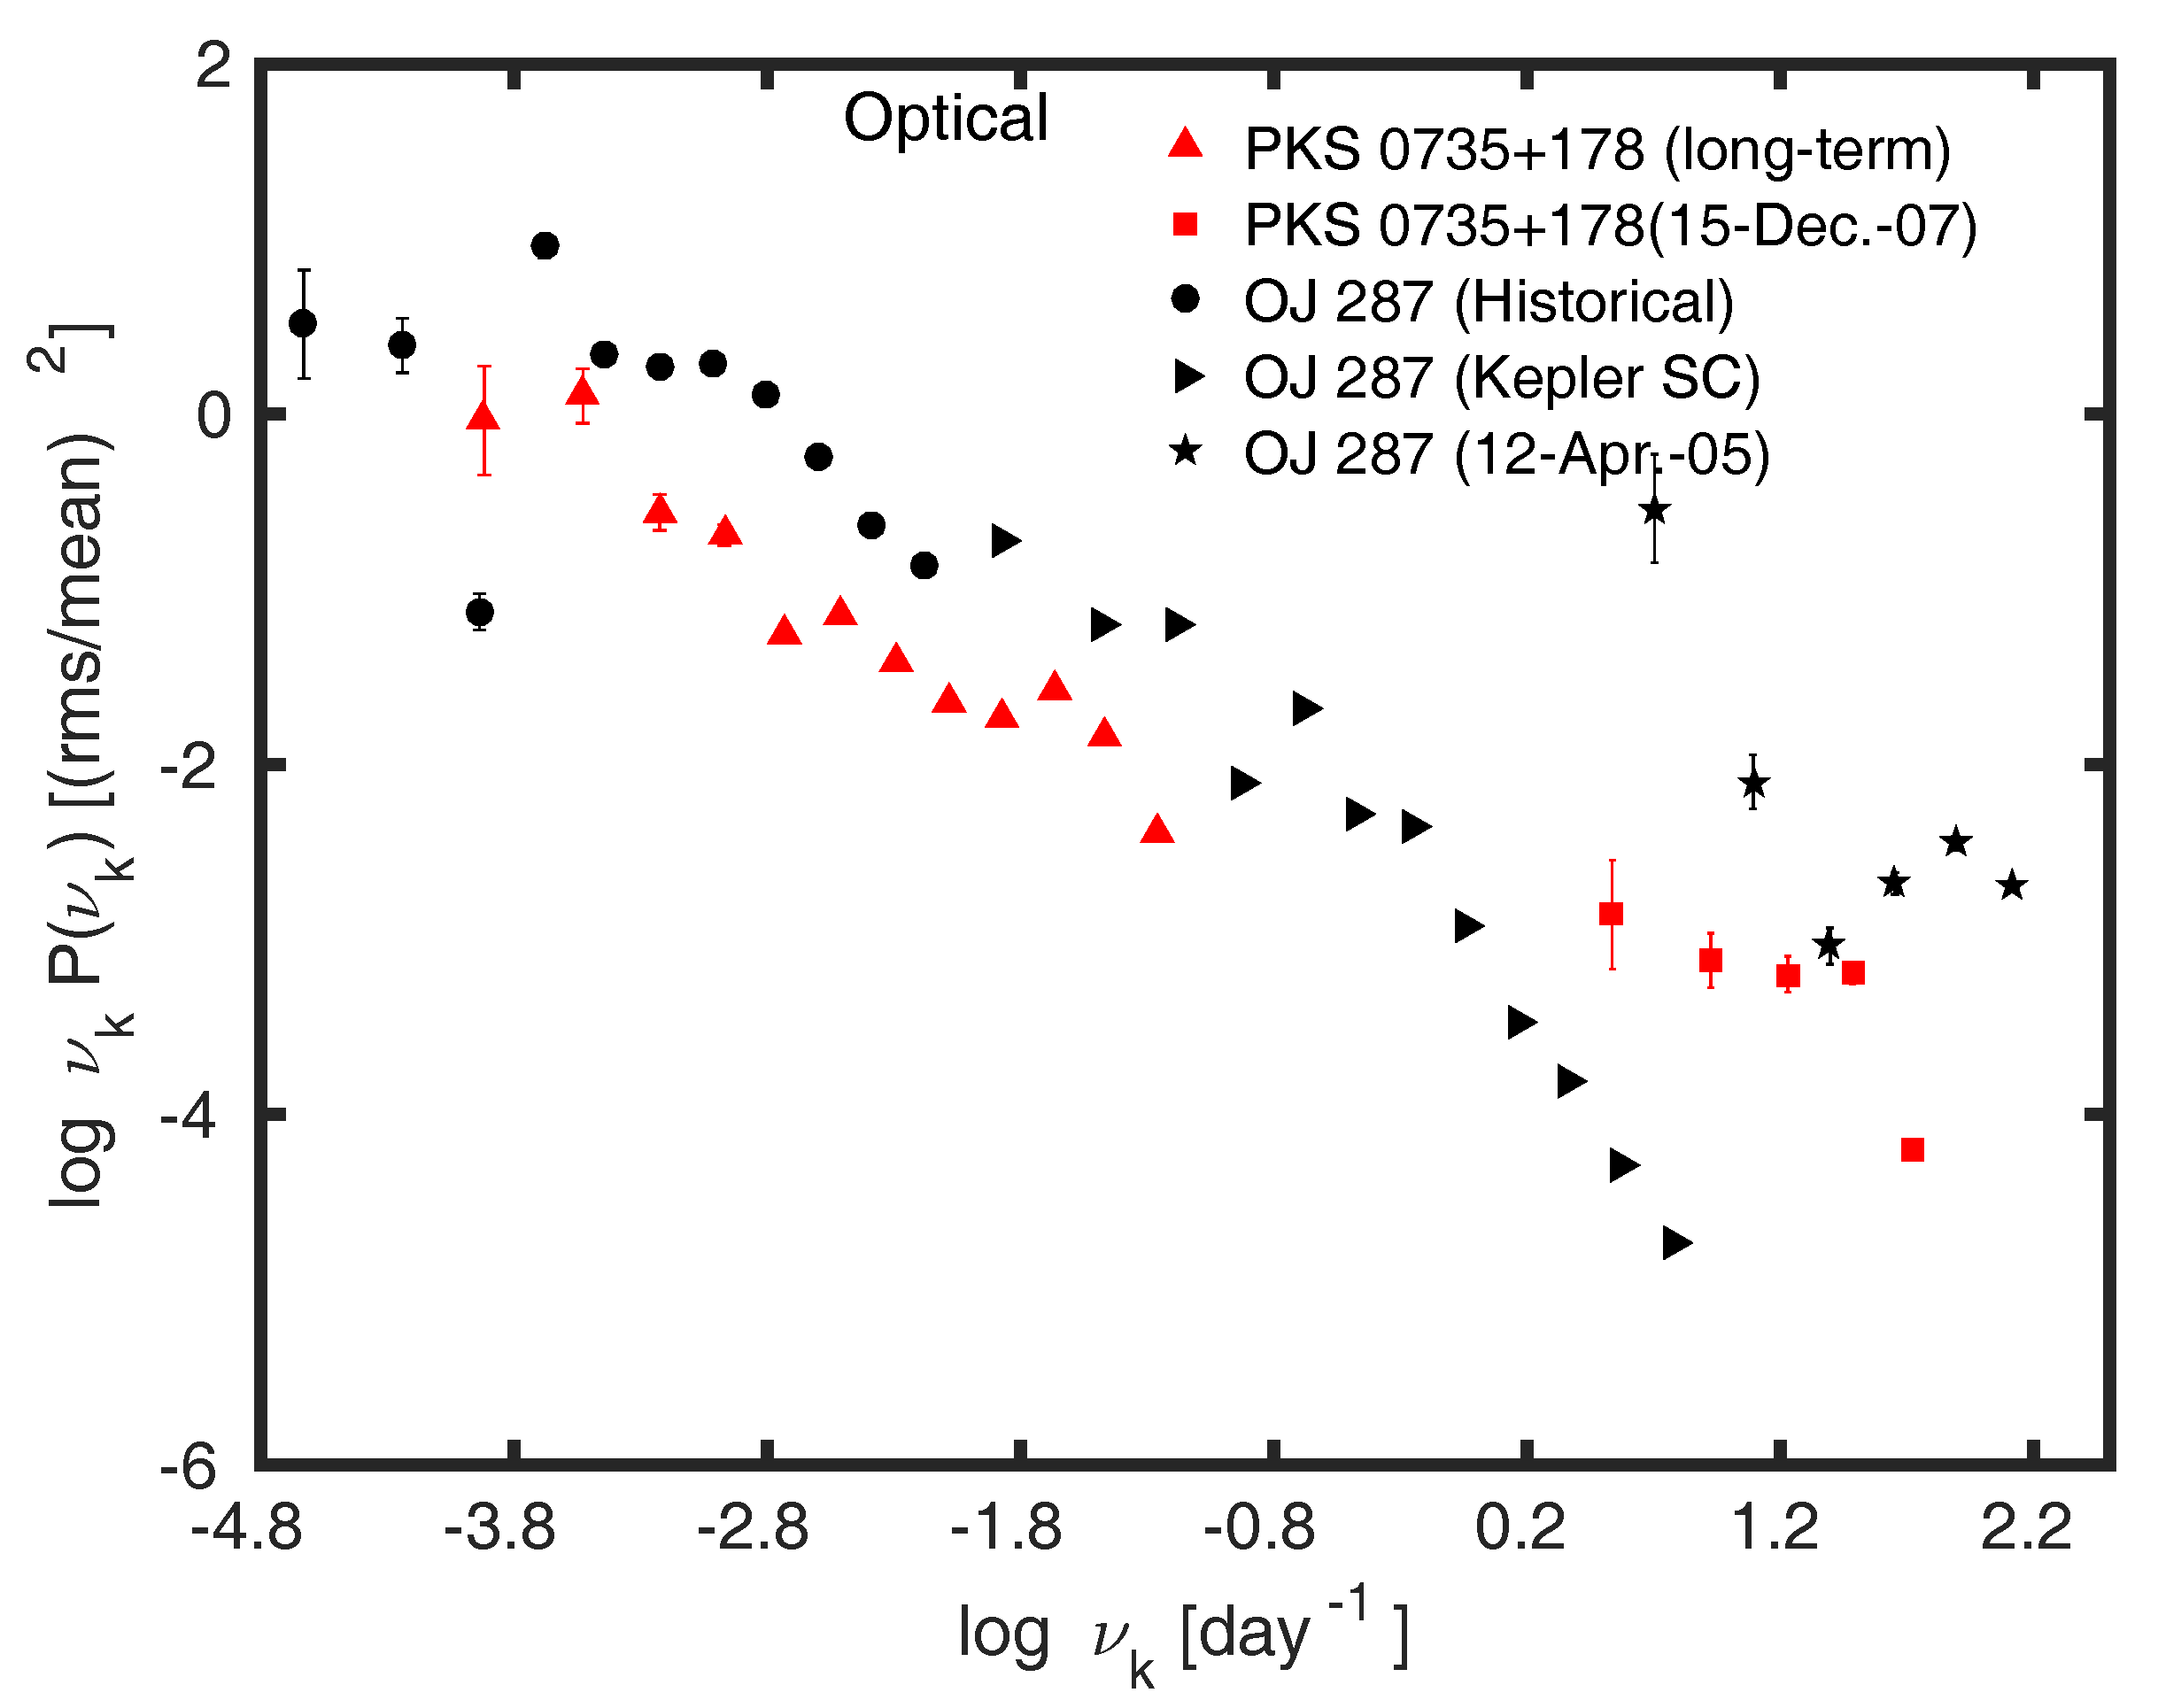
- An explicit comparison of the PSDs derived at -ray shows a clear indication of more variability power on timescales 1000 days for OJ 287 as compared to PKS 0735+178 (Figure 3). On the other hand, the optical PSDs, show stronger variability on timescales longer than ∼100 days (Figure 4). Again, on the intra-night timescales, we see larger amplitude variability for OJ 287. However, inclusion of the Kepler spectrum shows a steepening on timescales below ∼10 days, indicating a possible intermittency of the process generating intra-night variability. We note that such intermittency is observed for PKS 0735+178 and in other blazars as well [9].
- OJ 287 is a well-known binary black-hole system with roughly ∼12 year quasi-periodic oscillation (QPO) seen in optical and radio light curves [18,19]. Our analysis using the DFT method does not reveal a clear peak in the PSD corresponding to historical optical light curve (Figure 4). This could be due to extremely sparse sampling of the light curve before the year 1970 or due to the transitory nature of the QPO behaviour [20].
We interpreted based on PSD analyses [9,10,21] using multiwavelength (GHz band radio, R-band, X-rays and -LAT) light curves, the entire broad band emission is generated in an extended yet highly turbulent jet. The statistically different characters of multiwavelength variability was explained by hypothesizing that the synchrotron variability is driven by single stochastic process operating on years to minutes timescales, while the IC variability is shaped by a linear superposition of two stochastic processes with relaxation timescales ∼1000–10,000 and ∼1 day. We further speculated that the driver behind the former process could be related to the dissipation of the turbulent jet magnetic field supplied by an accretion flow [22]; such dissipation is expected to be shaped by a combination of (global) MHD-timescales in jet, possibly modified by the magnetic reconnection on intranight timescales. The additional process operating at -ray frequencies, on the other hand, could be related to inhomogeneities in the local populations of soft photons available for the inverse-Compton upscattering, leading to the “light-crossing timescale” relaxation of about ∼one day (for a jet with Doppler boosting factor ). The results reported here allowed us to extend the optical PSD of OJ 287 down to minutes timescales with the usage of the intra-night light curve, which were not covered earlier due to high instrumental noise floor (white noise; ) of the Kepler measurements [23]. We note that the quoted measurement errors for Kepler data used in the present study are underestimated by ∼1–2 orders of magnitude. An explicit comparison of synchrotron and IC variability in P vs. plot (akin to squared fractional variability, by definition [16]) reveals that OJ 287 is, on average more variable than PKS 0735+178 on timescales of ≤1000 (-ray) and ≤100 days (optical).
5. Conclusions
Our present results for the blazars are based on good-quality, densely sampled, decade-long multiwavelength light curves on timescales ranging from decade–to–weeks at -ray frequencies and down to intra-night timescales at optical frequencies. Different statistical characters of synchrotron ( 2; red/brownian–noise) and IC ( 1; pink/flicker–noise) variability as reported here are difficult to account for within the framework of single zone synchrotron self-Compton (SSC) origin of the broad-band blazar emission as the particle energies contributing to synchrotron and IC luminosities are the same. The Presented results indicates the necessity of detailed investigation of multiwavelength PSDs using larger blazar samples to understand the complexities of energy generation processes in blazars.
Acknowledgments
AG thanks the referees for the constructive comments which have improved the quality of the manuscript. AG ackowledges the support of the Polish National Science Centre through the grants DEC- 2012/04/A/ST9/00083 and 2013/09/B/ST9/00026. The Fermi-LAT Collaboration acknowledges support from a number of agencies and institutes for both development and the operation of the LAT as well as scientific data analysis. These include NASA and DOE in the United States, CEA/Irfu and IN2P3/CNRS in France, ASI and INFN in Italy, MEXT, KEK, and JAXA in Japan, and the K. A. Wallenberg Foundation, the Swedish Research Council, and the National Space Board in Sweden. Additional support from INAF in Italy and CNES in France for science analysis during the operations phase is also gratefully acknowledged.
Author Contributions
This manuscript is prepared by AG.
Conflicts of Interest
The authors declare no conflicts of interest.
Abbreviations
The following abbreviations are used in this manuscript:
| DFT | Discrete Fourier transform |
References
- Madejski, G.; Sikora, M. Gamma-Ray Observations of Active Galactic Nuclei. Annu. Rev. Astron. Astrophys. 2016, 54, 725–760. [Google Scholar] [CrossRef]
- Ghisellini, G.; Tavecchio, F.; Maraschi, L.; Celotti, A.; Sbarrato, T. The power of relativistic jets is larger than the luminosity of their accretion disks. Nature 2014, 515, 376–378. [Google Scholar] [CrossRef] [PubMed] [Green Version]
- Zhu, S.F.; Xue, Y.Q.; Brandt, W.N.; Cui, W.; Wang, Y.J. Extremely rapid X-ray flares of tev blazars in the rxte era. arXiv, 2017; arXiv:1712.00459. [Google Scholar]
- Aharonian, F.; Akhperjanian, A.G.; Bazer-Bachi, A.R.; Behera, B.; Beilicke, M.; Benbow, W.; Berge, D.; Bernlöhr, K.; Boisson, C.; Bolz, O.; et al. An Exceptional Very High Energy Gamma-Ray Flare of PKS 2155–304. Astrophys. J. Lett. 2007, 664, L71–L74. [Google Scholar] [CrossRef]
- Falomo, R.; Pian, E.; Treves, A. An optical view of BL Lacertae objects. Annu. Rev. Astron. Astrophys. 2014, 22, 73. [Google Scholar] [CrossRef]
- Ghisellini, G.; Tavecchio, F. Rapid variability in TeV blazars: The case of PKS2155-304. Mon. Not. R. Astron. Soc. 2008, 386, L28–L32. [Google Scholar] [CrossRef]
- McKinney, J.C.; Blandford, R.D. Stability of relativistic jets from rotating, accreting black holes via fully three-dimensional magnetohydrodynamic simulations. Mon. Not. R. Astron. Soc. 2009, 394, L126–L130. [Google Scholar] [CrossRef]
- Finke, J.D.; Becker, P.A. Fourier Analysis of Blazar Variability. Astrophys. J. 2014, 791, 21. [Google Scholar] [CrossRef]
- Goyal, A.; Stawarz, L.; Ostrowski, M.; Larionov, V.; Gopal-Krishna; Wiita, P.J.; Joshi, S.; Soida, M. Multi-wavelength variability study of the classical BL Lac object PKS 0735+178 on timescales ranging from decades to minutes. arXiv, 2017; arXiv:1702.02504. [Google Scholar]
- Goyal, A.; Stawarz, L.; Zola, S.; Marchenko, V.; Soida, M.; Nilsson, K.; Ciprini, S.; Baran, A.; Ostrowski, M.; Wiita, P.J.; et al. Stochastic modeling of multiwavelength variability of the classical BL Lac object OJ 287 on timescales ranging from decades to hours. arXiv, 2017; arXiv:1709.04457. [Google Scholar]
- Hudec, R.; Bašta, M.; Pihajoki, P.; Valtonen, M. The historical 1900 and 1913 outbursts of the binary blazar candidate OJ287. Astron. Astrophys. 2013, 559, A20. [Google Scholar] [CrossRef]
- Goyal, A.; Gopal-Krishna; Anupama, G.C.; Sahu, D.K.; Sagar, R.; Britzen, S.; Karouzos, M.; Aller, M.F.; Aller, H.D. Unusual optical quiescence of the classical BL Lac object PKS 0735+178 on intranight time-scale. Mon. Not. R. Astron. Soc. 2009, 399, 1622–1632. [Google Scholar] [CrossRef]
- Gopal-Krishna; Goyal, A.; Joshi, S.; Karthick, C.; Sagar, R.; Wiita, P.J.; Anupama, G.C.; Sahu, D.K. Rapid optical variability of TeV blazars. Mon. Not. R. Astron. Soc. 2011, 416, 101–117. [Google Scholar] [CrossRef]
- Ciprini, S.; Takalo, L.O.; Tosti, G.; Raiteri, C.M.; Fiorucci, M.; Villata, M.; Nucciarelli, G.; Lanteri, L.; Nilsson, K.; Ros, J.A. Ten-year optical monitoring of PKS 0735+178: Historical comparison, multiband behavior, and variability timescales. Astron. Astrophys. 2007, 467, 465–483. [Google Scholar] [CrossRef] [Green Version]
- Max-Moerbeck, W.; Richards, J.L.; Hovatta, T.; Pavlidou, V.; Pearson, T.J.; Readhead, A.C.S. A method for the estimation of the significance of cross-correlations in unevenly sampled red-noise time series. Mon. Not. R. Astron. Soc. 2014, 445, 437–459. [Google Scholar] [CrossRef]
- Vaughan, S.; Edelson, R.; Warwick, R.S.; Uttley, P. On characterizing the variability properties of X-ray light curves from active galaxies. Mon. Not. R. Astron. Soc. 2003, 345, 1271–1284. [Google Scholar] [CrossRef]
- Papadakis, I.E.; Lawrence, A. Improved Methods for Power Spectrum Modelling of Red Noise. Mon. Not. R. Astron. Soc. 1993, 261, 612. [Google Scholar] [CrossRef]
- Sillanpaa, A.; Takalo, L.O.; Pursimo, T.; Lehto, H.J.; Nilsson, K.; Teerikorpi, P.; Heinaemaeki, P.; Kidger, M.; de Diego, J.A.; Gonzalez-Perez, J.N.; et al. Confirmation of the 12-year optical outburst cycle in blazar OJ 287. Astron. Astrophys. 1996, 305, L17. [Google Scholar]
- Valtaoja, E.; Teräsranta, H.; Tornikoski, M.; Sillanpää, A.; Aller, M.F.; Aller, H.D.; Hughes, P.A. Radio Monitoring of OJ 287 and Binary Black Hole Models for Periodic Outbursts. Astrophys. J. 2000, 531, 744–755. [Google Scholar] [CrossRef]
- Vaughan, S.; Uttley, P.; Markowitz, A.G.; Huppenkothen, D.; Middleton, M.J.; Alston, W.N.; Scargle, J.D.; Farr, W.M. False periodicities in quasar time-domain surveys. Mon. Not. R. Astron. Soc. 2016, 461, 3145–3152. [Google Scholar] [CrossRef]
- Goyal, A.; Stawarz, Ł.; Ostrowski, M.; Larionov, V. Radio-to-γ-Ray, Broadband Variability Study of the Classical BL Lac Object PKS 0735+178. Galaxies 2016, 4, 42. [Google Scholar] [CrossRef]
- O’Riordan, M.; Pe’er, A.; McKinney, J.C. Blazar Variability from Turbulence in Jets Launched by Magnetically Arrested Accretion Flows. Astrophys. J. 2017, 843, 81. [Google Scholar] [CrossRef]
- Edelson, R.; Mushotzky, R.; Vaughan, S.; Scargle, J.; Gandhi, P.; Malkan, M.; Baumgartner, W. Kepler Observations of Rapid Optical Variability in the BL Lacertae Object W2R1926+42. Astrophys. J. 2013, 766, 16. [Google Scholar] [CrossRef]
| 1 |
Figure 1.
Power spectral densities (PSDs) corresponding to multiwavelength light curves for the blazar PKS 0735+178. The dashed gray line and solid circles denote the raw and binned periodogram estimates, respectively, while the dashed horizontal line indicates the noise floor level due to the measurement errors. (a) High energy -ray light curve using the Fermi-LAT data at photon energies 0.1–200 GeV (2008–2015) [9]. (b) Daily averaged R-band light curve (1993–2015) [9]. (c) Intra-night R-band light curve obtained on 15 December 2007 [12].
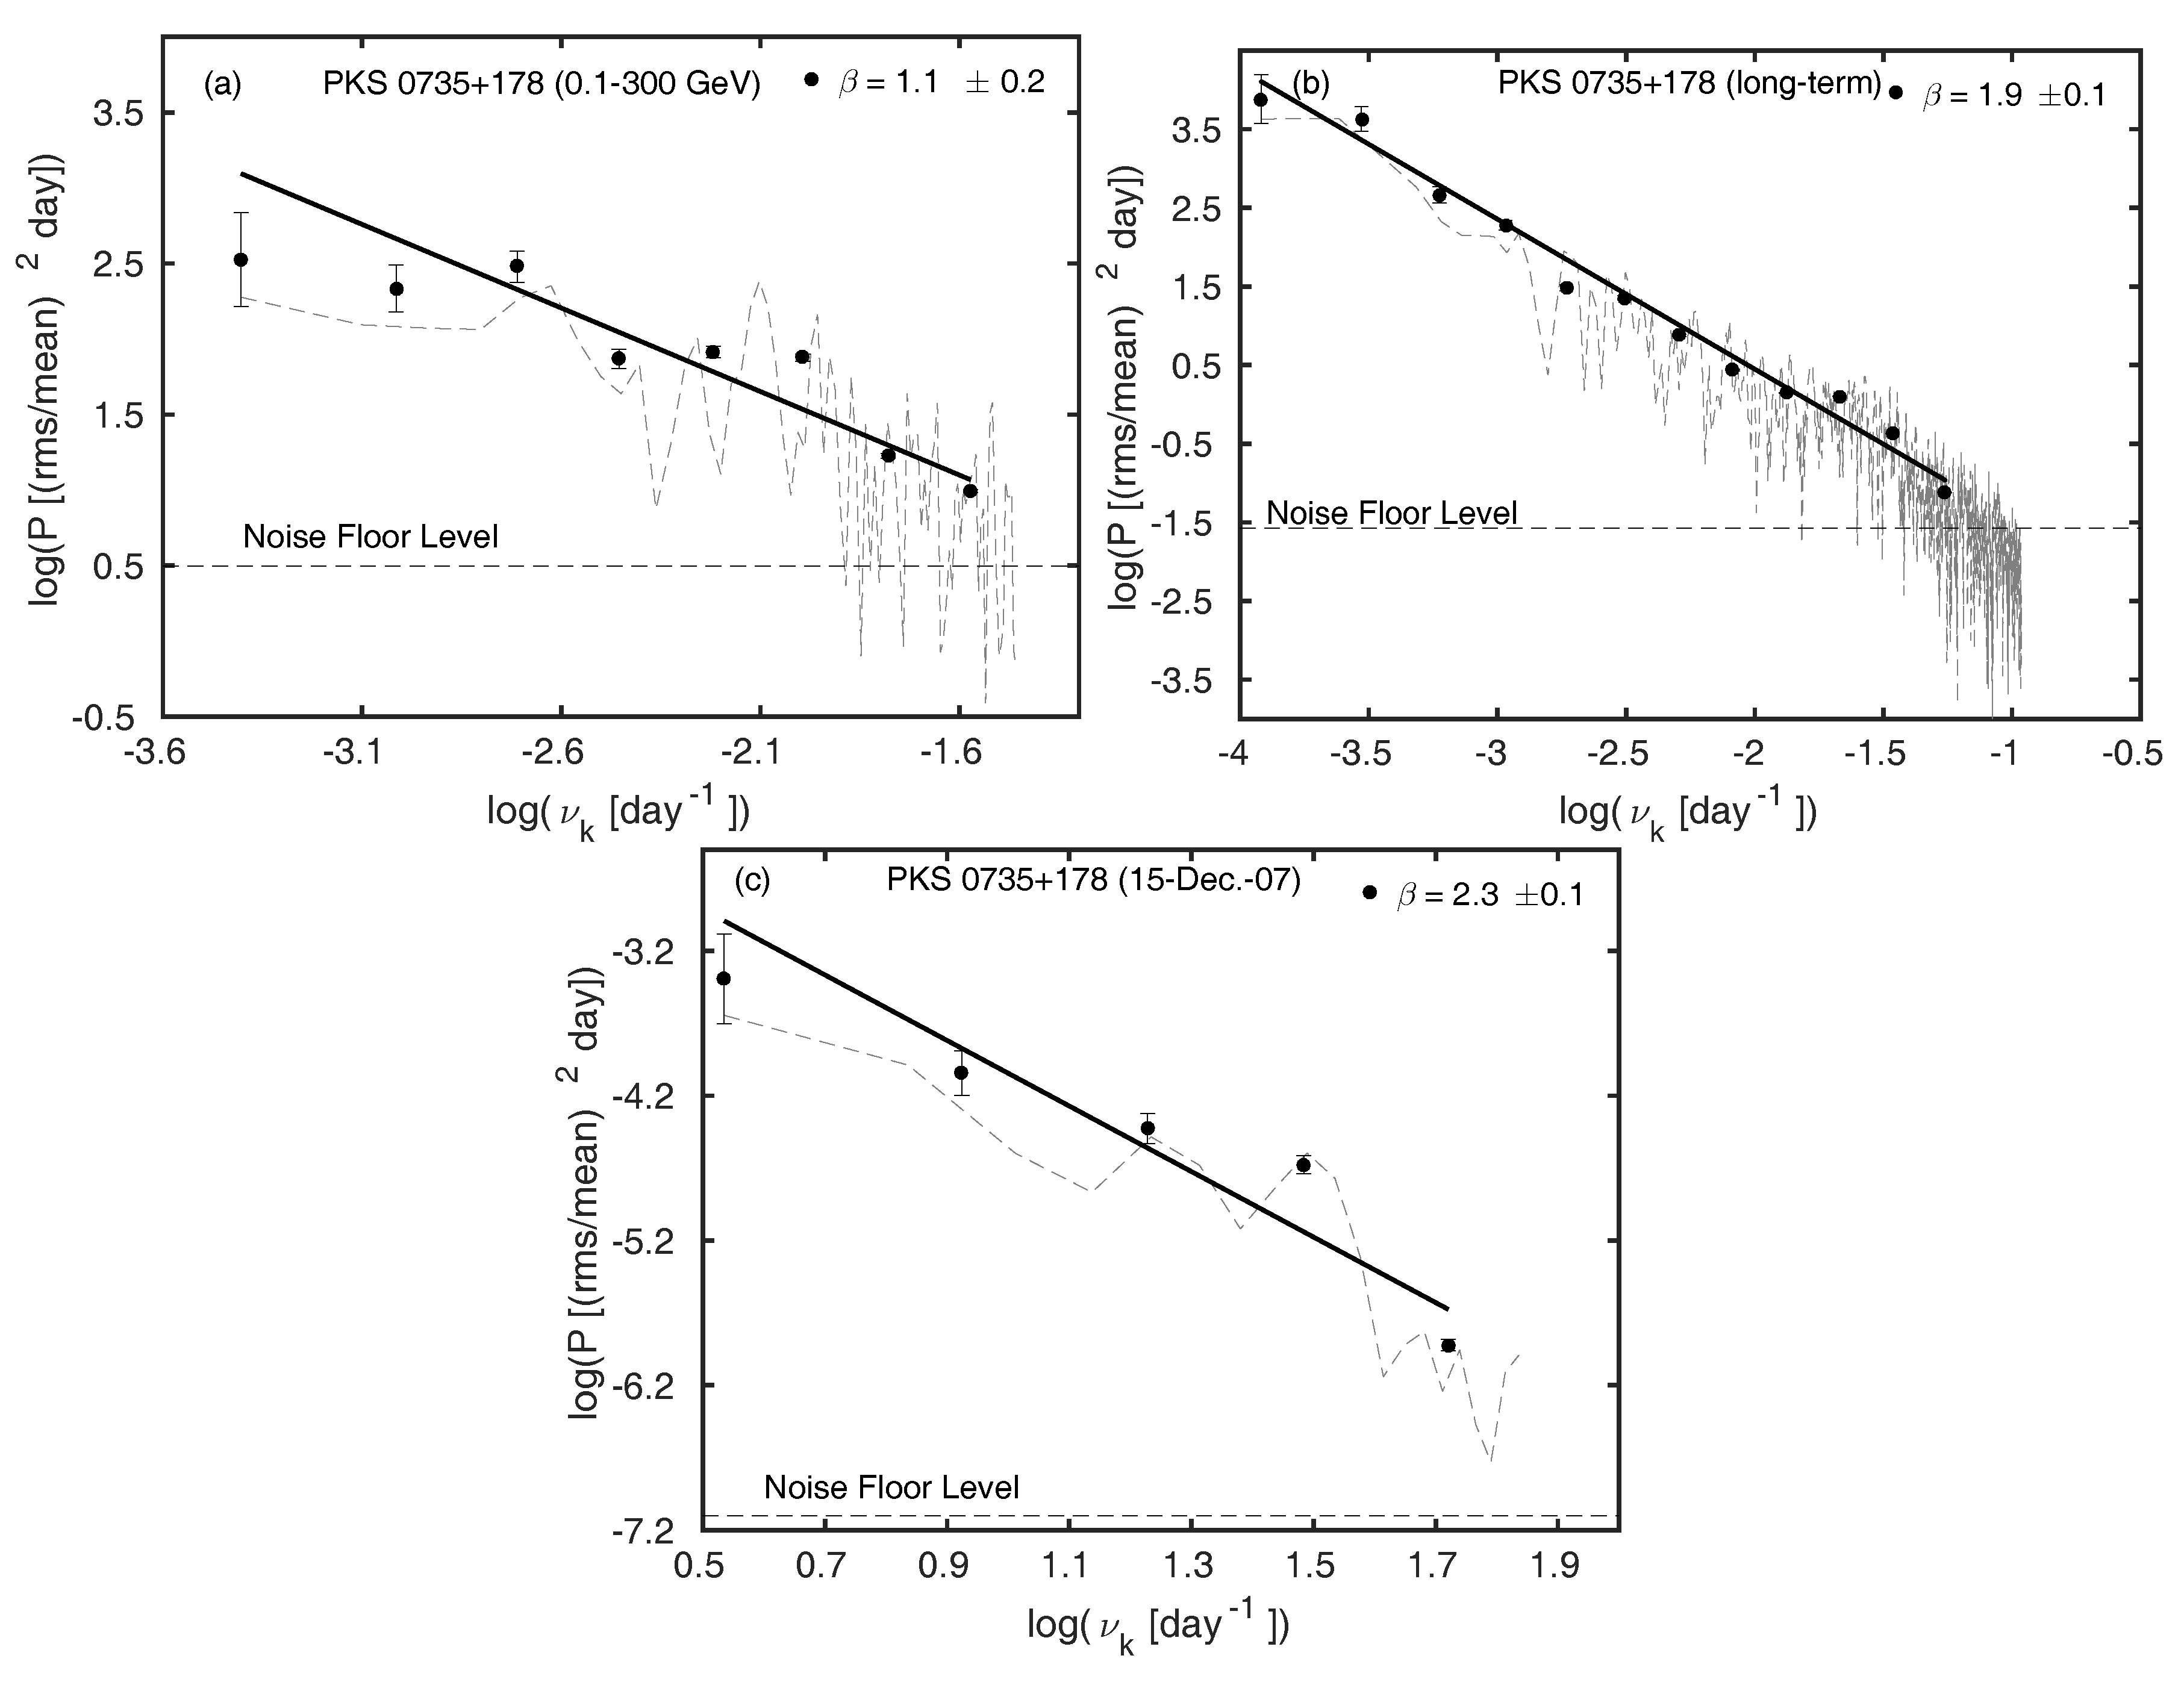
Figure 2.
PSDs corresponding to multiwavelength light curves for the blazar OJ 287. The dashed gray line and solid circles denote the raw and binned periodogram estimates, respectively, while the dashed horizontal line indicates the noise floor level due to the measurement errors. (a) High energy -ray light curve using the Fermi-LAT data at photon energies 0.1–300 GeV (2008–2016) [10]. (b) Daily averaged historical R-band light curve (1990–2017) [10]. (c) Kepler satellite light curve [10]. (d) Intra-night R-band light curve obtained on 12 April 2005 [12].
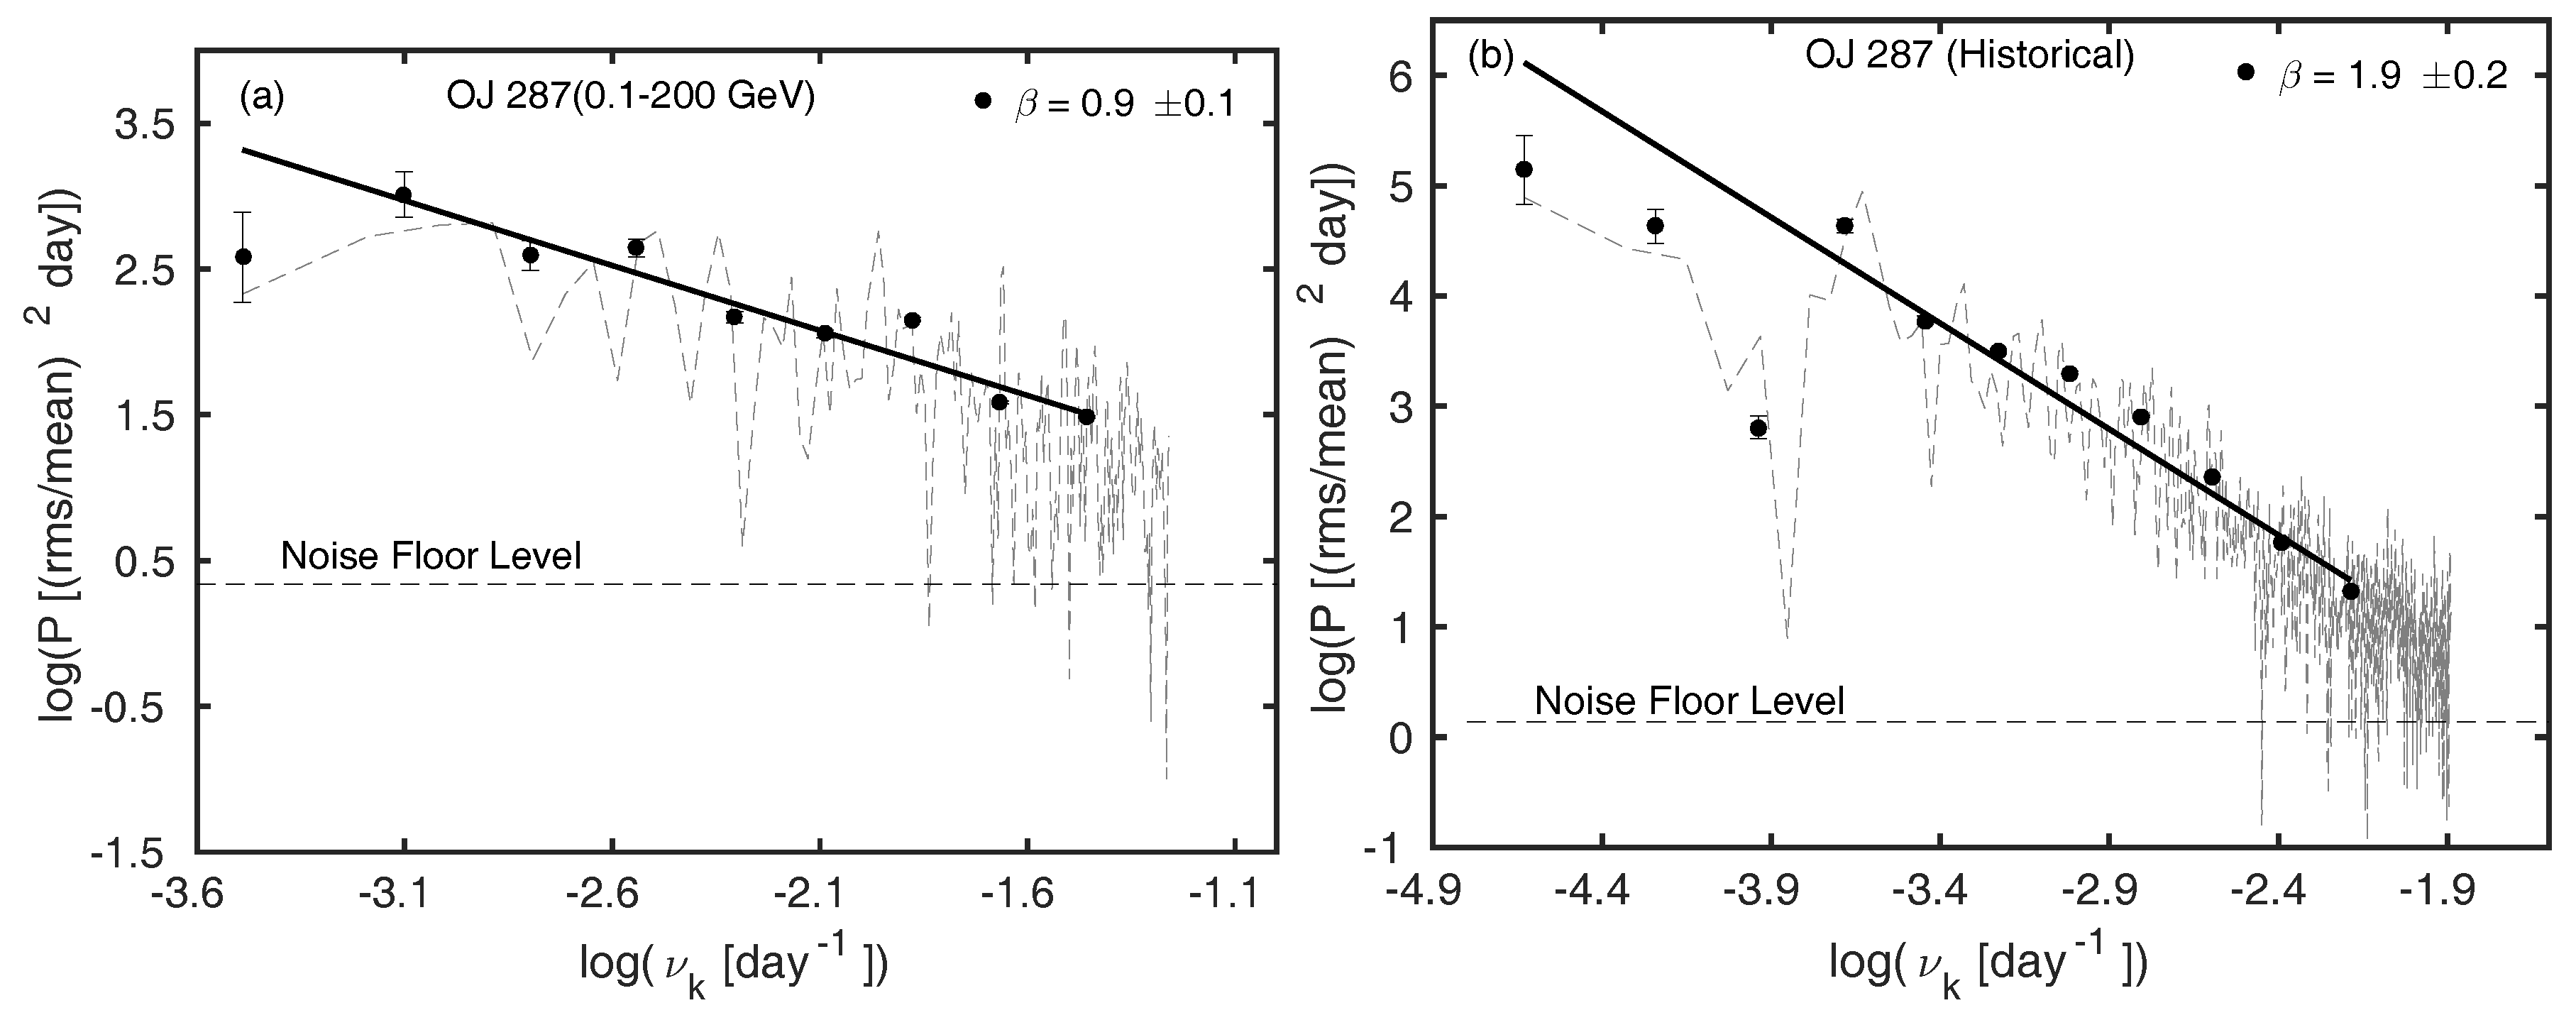
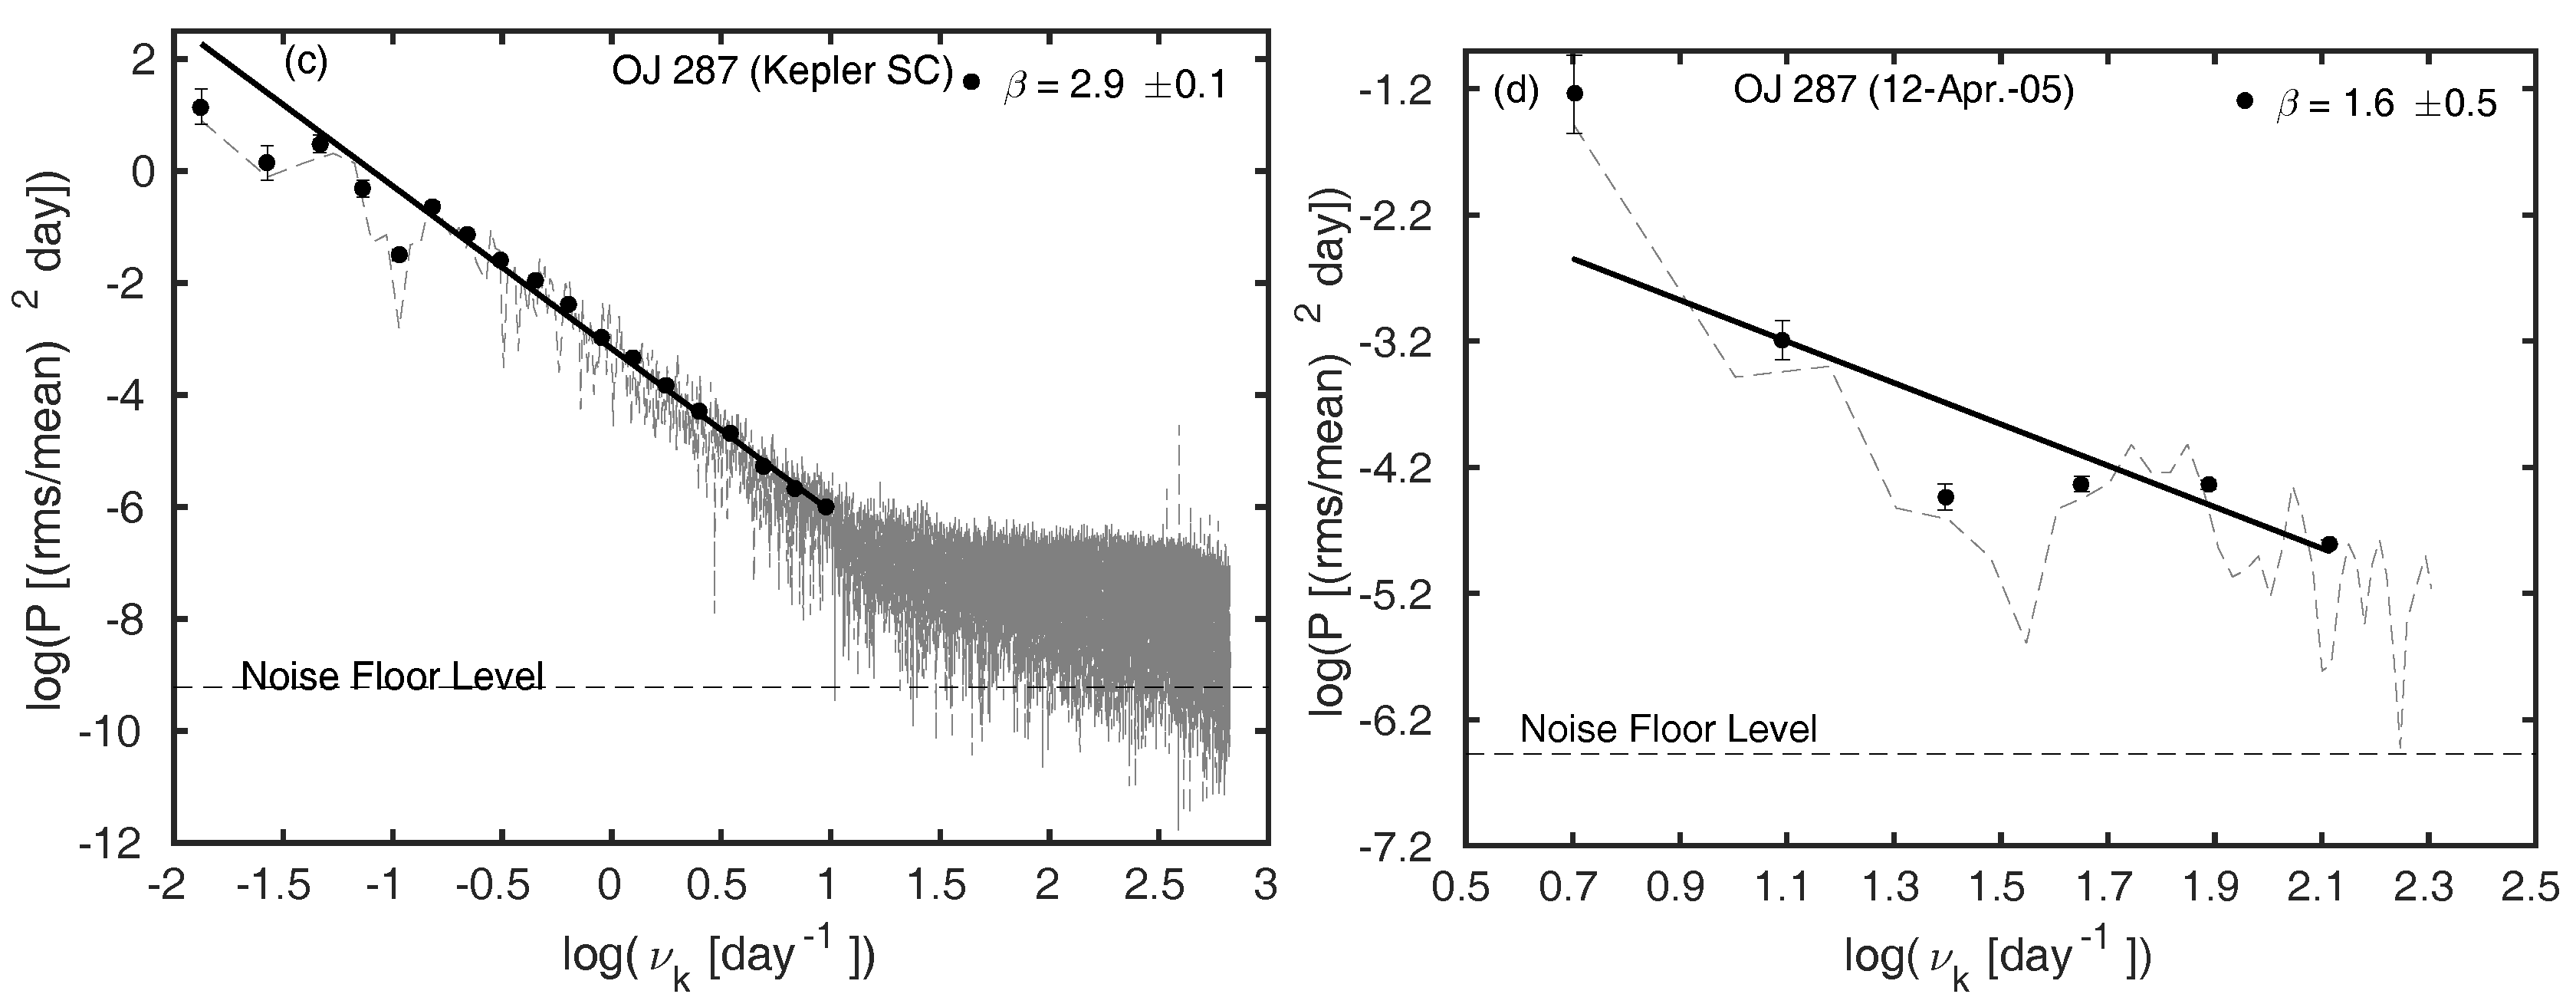
Figure 3.
Composite Fermi-LAT PSDs using the ‘binned’ periodogram estimates for the studied blazars covering ∼3 dex in temporal frequency.
Figure 3.
Composite Fermi-LAT PSDs using the ‘binned’ periodogram estimates for the studied blazars covering ∼3 dex in temporal frequency.
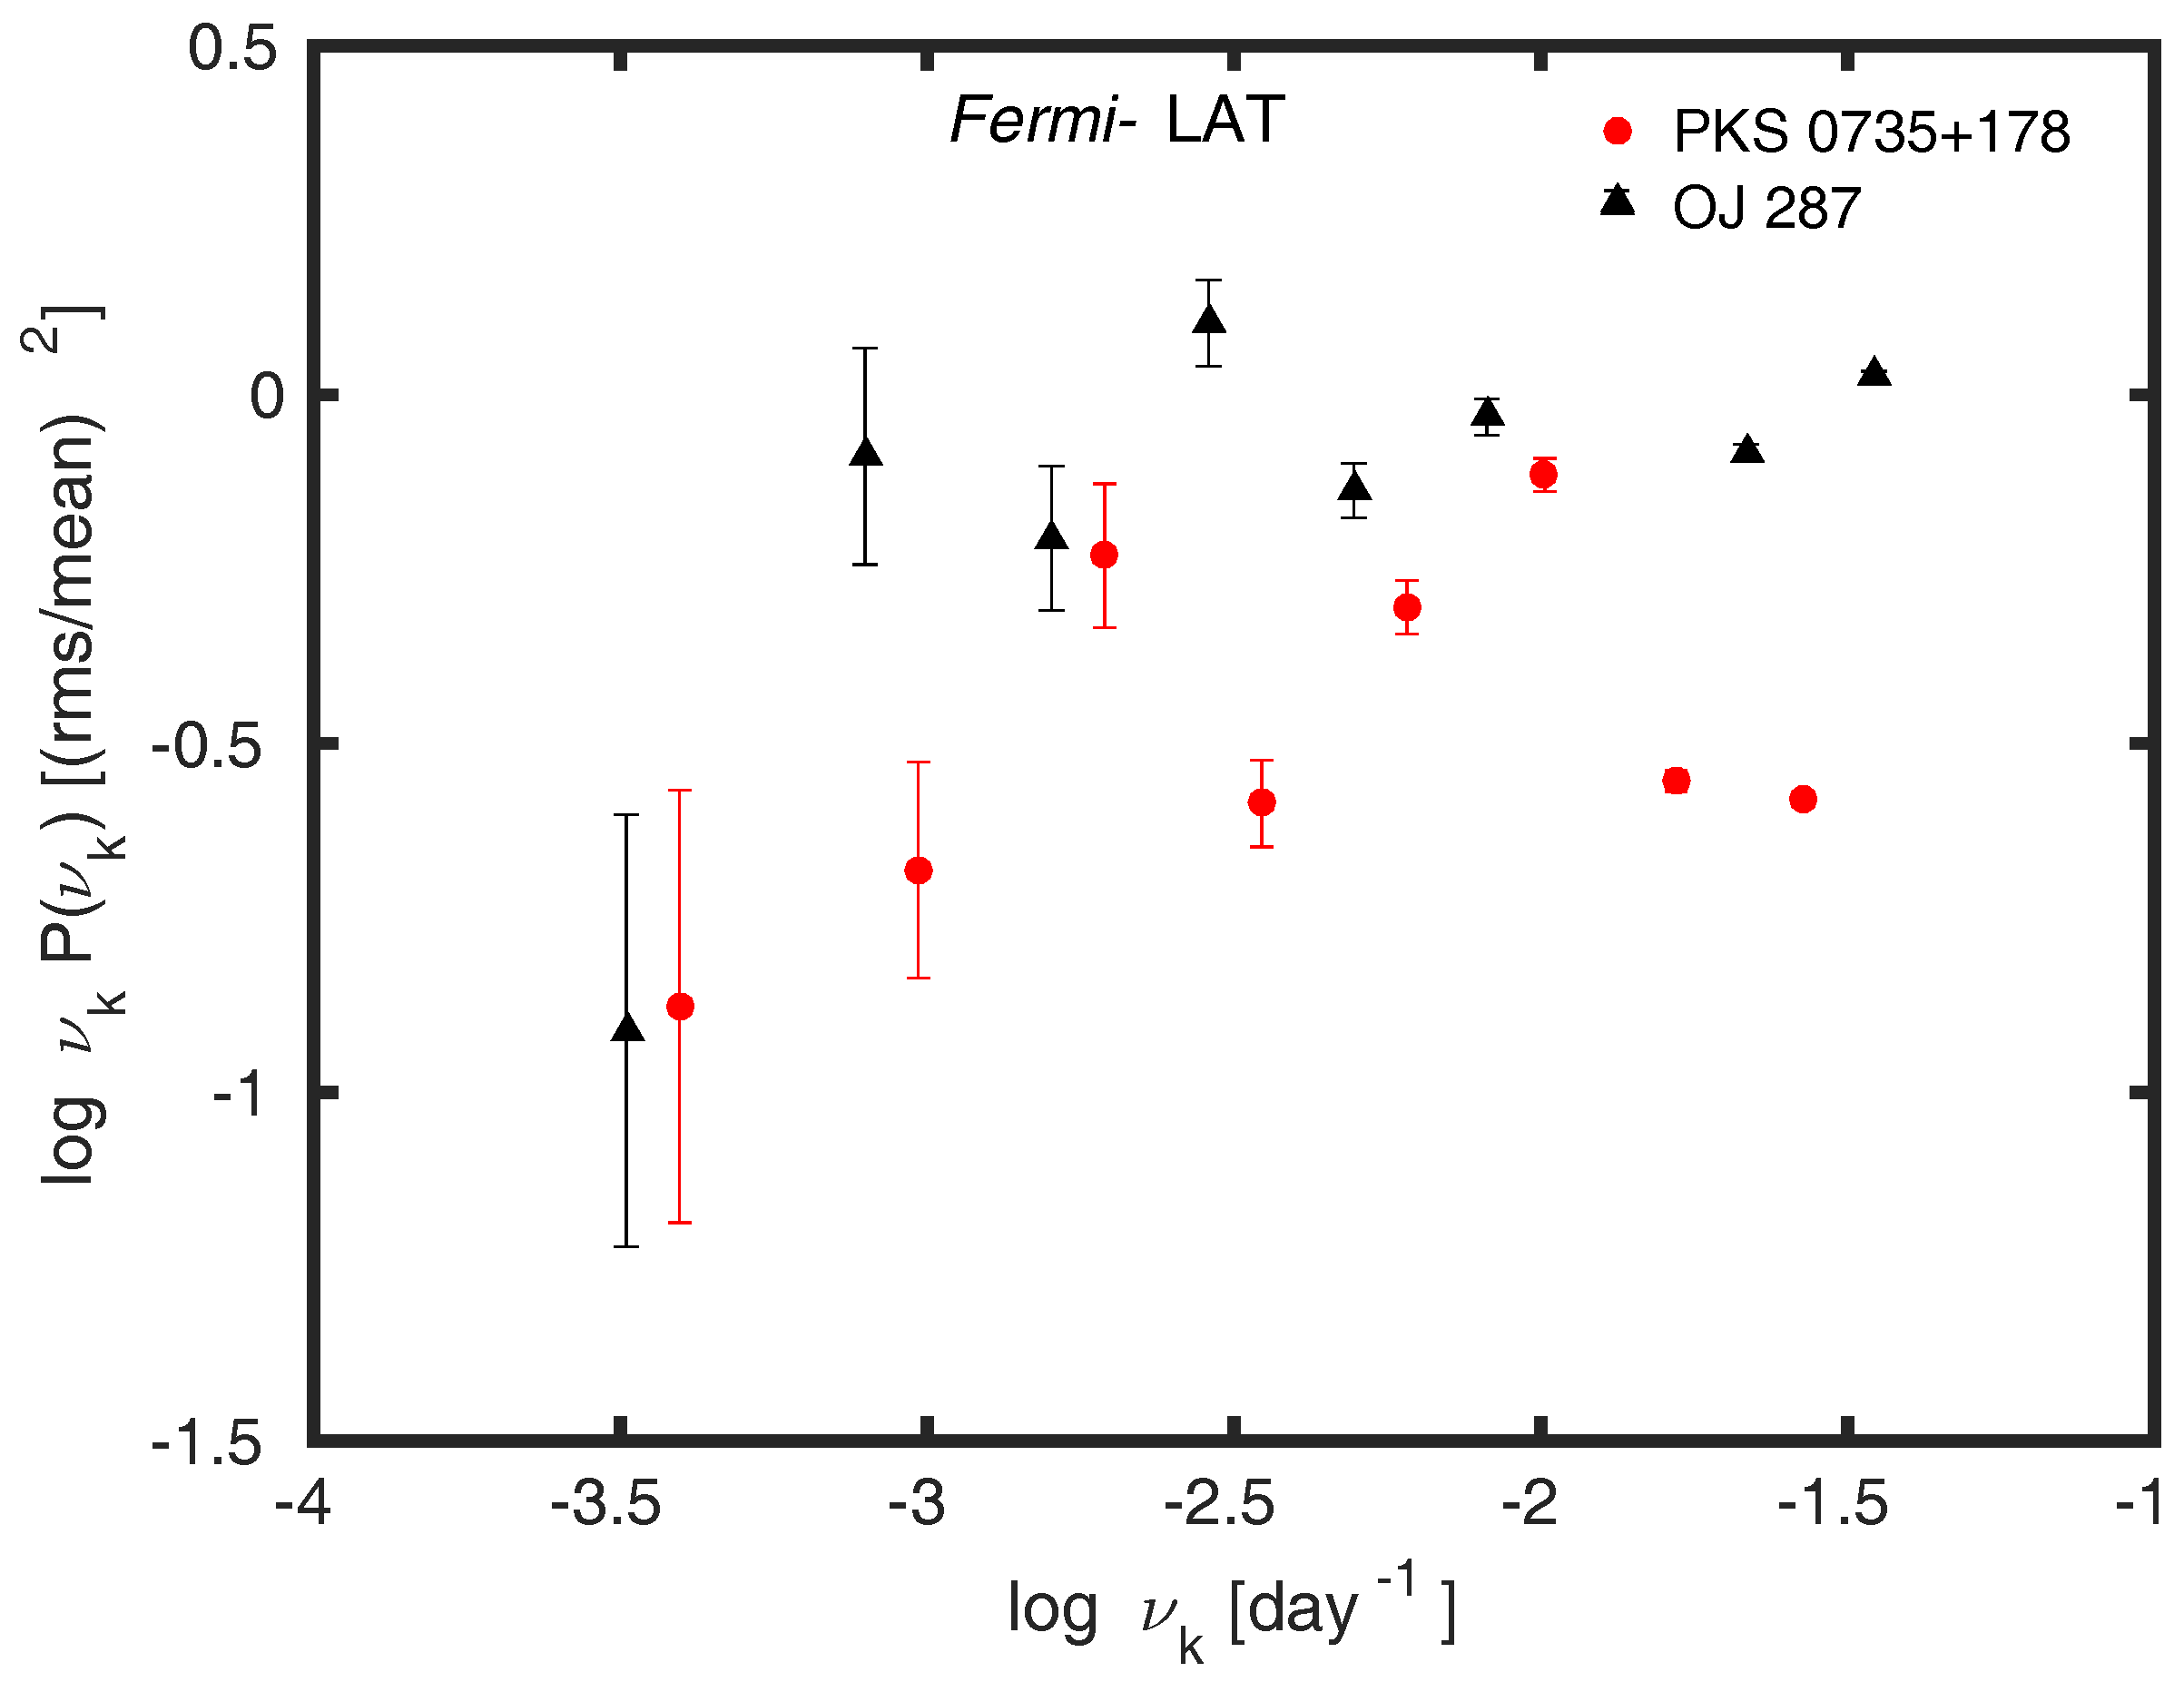
Figure 4.
Composite PSDs in the optical band using the ‘binned’ periodogram estimates for the studied blazars covering ∼6 dex in temporal frequency.
Figure 4.
Composite PSDs in the optical band using the ‘binned’ periodogram estimates for the studied blazars covering ∼6 dex in temporal frequency.
© 2018 by the author. Licensee MDPI, Basel, Switzerland. This article is an open access article distributed under the terms and conditions of the Creative Commons Attribution (CC BY) license (http://creativecommons.org/licenses/by/4.0/).
Share and Cite
MDPI and ACS Style
Goyal, A. A Comparative Study of Multiwavelength Blazar Variability on Decades to Minutes Timescales. Galaxies 2018, 6, 34. https://doi.org/10.3390/galaxies6010034
AMA Style
Goyal A. A Comparative Study of Multiwavelength Blazar Variability on Decades to Minutes Timescales. Galaxies. 2018; 6(1):34. https://doi.org/10.3390/galaxies6010034
Chicago/Turabian StyleGoyal, Arti. 2018. "A Comparative Study of Multiwavelength Blazar Variability on Decades to Minutes Timescales" Galaxies 6, no. 1: 34. https://doi.org/10.3390/galaxies6010034
Note that from the first issue of 2016, this journal uses article numbers instead of page numbers. See further details here.