Sub-Hour X-Ray Variability of High-Energy Peaked BL Lacertae Objects


1
Astrophysical Observatory, Ilia State University, Colokashvili Av. 3/5, Tbilisi 0162, Georgia
2
INAF, Osservatorio Astronomico di Brera, Via E. Bianchi 46, 23807 Merate, Italy
3
Astronomy Department, University of Michigan, Ann Arbor, MI 48109-1107, USA
Galaxies 2018, 6(1), 37; https://doi.org/10.3390/galaxies6010037
Submission received: 2 January 2018
/
Revised: 26 February 2018
/
Accepted: 7 March 2018
/
Published: 15 March 2018
(This article belongs to the Special Issue Microvariability of Blazars)
Abstract
:The study of multi-wavelength flux variability in BL Lacertae objects is very important to discern unstable processes and emission mechanisms underlying their extreme observational features. While the innermost regions of these objects are not accessible from direct observations, we may draw conclusions about their internal structure via the detection of flux variations on various timescales, based on the light-travel argument. In this paper, we review the sub-hour X-ray variability in high-energy peaked BL Lacertae sources (HBLs) that are bright at X-rays and provide us with an effective tool to study the details related to the physics of the emitting particles. The X-ray emission of these sources is widely accepted to be a synchrotron radiation from the highest-energy electrons, and the complex spectral variability observed in this band reflects the injection and radiative evolution of freshly-accelerated particles. The detection of sub-hour X-ray flux variability is very important since it can be related to the small-scale jet turbulent structures or triggered by unstable processes occurring in the vicinity of a central supermassive black hole. We summarize the fastest X-ray variability instances detected in bright HBLs and discuss their physical implications.
Keywords:
BL Lacertae objects: individual: Mrk 4211. Introduction
The BL Lacertae objects (BL Lacs) are active nuclei of elliptical galaxies [1] showing a rapid variability at all frequencies, high and variable radio-optical polarization, compact and flat-spectrum radio emission, superluminal motion of some radio-components, smooth and broad non-thermal continuum covering the entire electromagnetic spectrum from the radio range to -rays and the absence of emission lines in the optical band [2].
Along with the flat-spectrum radio quasars (FSRQs), BL Lacertae objects form one of the extreme classes of active galactic nuclei (AGNs), blazars, which can be powered by the accretion onto supermassive black holes (SMBHs) and have relativistic jets pointed along the observer’s line-of-sight [3]. The Doppler boosting is related to the combination of relativistic speed and a small jet inclination angle that amplifies the observed flux, shifts the observed emission to higher frequencies and decreases the variability timescale. This effect is crucial to preserve the -ray photons from the strong attenuation by the surrounding low-energy radiation field (via the photon-photon pair production mechanism). Thanks to their widely-extended spectral energy distribution, covering the 18–19 frequency decades, blazars can be detected at any frequency in this range. These sources are the most numerous among the identified high-energy (HE, MeV) point sources observed with the Fermi Large Area Telescope (LAT; Atwood et al. [4]), as well as the most frequently-detected class of the extragalactic TeV sources1.
Relativistic charged particles within blazar jets should be responsible for the non-thermal spectral energy distribution (SED), which is characterized by two broad peaks in the log − log spectral representation. Depending on the position of the synchrotron SED peak , BL Lacs are divided into two subclasses (see Padovani and Giommi [5] and the references therein): high-energy-peaked objects (HBLs, peaking at UV–X-ray frequencies) and low-peaked objects (LBLs, with situated in the infrared–optical part of the spectrum). Additionally, the third subclass of intermediate-energy-peaked BL Lacs (IBLs) shows the synchrotron peak situated in the optical–UV bands [6].
The energies at which the SED peaks occur, as well as the relative intensity of these peaks provide a powerful tool to diagnose the properties of the jet emission zone (electron/positron/proton energies, magnetic field, etc.). The origin of the lower-energy peak is relatively well understood, explained by synchrotron radiation emitted by relativistic electrons in the magnetized jet (based on its non-thermal spectral shape and radio-optical polarization), while the nature of the higher-energy component (the keV–TeV range in LBLs and the MeV–TeV range in HBLs) is still under debate. However, there is a variety of models explaining its origin: (1) an inverse Compton (IC) scattering of synchrotron photons by their “parent” electron-positron plasma (the so-called synchrotron self-Compton model (SSC); Marscher and Gear [7]); (2) hadronic models incorporating the generation of hard X-ray–-ray photons by relativistic protons, either directly (proton synchrotron; [8]) or indirectly (e.g., synchrotron emission from a secondary electron population; Mannheim [9]). Among these scenarios, a valid model can be selected by means of the intensive multi-wavelength (MWL) flux variability and inter-band cross-correlation studies. Namely, the one-zone SSC model predicts a nearly simultaneous variability of the synchrotron and Compton components, while the multi-zone SSC and hadronic models can involve a more complicated, uncorrelated MWL variability [10]. The synchrotron proton scenario may be more favorable for objects such as Mrk 421 due to the lower density of the external photon fields necessary for effective photoproduction. On the other hand, hadronic models generally need a higher level of tuning to reproduce the observed highly-correlated X-ray/gamma-ray variability, especially that observed on intraday timescales [11].
The study of the MWL flux variability on various timescales makes us able to constrain the jet internal structure (based on the light-travel argument) and the location of the energy dissipation site with respect to the central black hole. In this paper, we review the X-ray flux variability of bright HBL sources on sub-hour timescales, which mostly is based on the published results from our intensive study [12,13,14,15,16,17,18,19]. The detection and detailed investigation of sub-hour X-ray instances is very important since they can be related to the smallest scale turbulent structures in the jet or triggered by unstable processes occurring in the vicinity of the central supermassive black hole.
2. Flux Variability
BL Lacs show strong variability in different spectral bands, accessible with modern astronomical instruments and detectors. Therefore, they represent one of the favorite targets for the MWL campaigns performed with various ground-based and space telescopes. BL Lacs have shown a very wide diapason of the variability timescales, ranging from years (at the radio-optical frequencies) down to a few minutes (X-ray and TeV energy ranges). The most extreme flux variability is observed at the very high-energy -rays (VHE, GeV). Namely, the nearby HBL source Mrk 421 (z = 0.031) underwent two dramatic TeV outbursts on 7 May 1996. The first one had a doubling time of about 1 h, and the flux increased by more than a factor of 50. During the second outburst, which lasted approximately 30 min, the flux increased by a factor of 20–25 [20]. The source showed rapid VHE variability with a flux-doubling time as short as 20 min in January–April 2001 [21]. The work in [22] revealed a VHE flux-doubling time of about 36 min from the MAGIC observation of Mrk 421 performed on 29 April 2006.
In the case of Mrk 501 (z = 0.034), the most extreme variability with flux-doubling times down to 2 min and flux variations by a factor of 10 in less than one hour was reported by [23] from the MAGIC observations performed on 30 June and 9 June 2005. Moreover, it underwent an extreme VHE variability during the HEGRAobservations in April 1997, boosting its brightness by a factor 20 [24], and the MAGIC campaign showed a variability by a factor of 23, including a flare by a factor of four in 4 d in April–August 2013 [25]. Finally, the source showed a flux-doubling time shorter than 10 min during the HESSobservations of 23–24 June 2014 [26].
A southern TeV-detected HBL source PKS 2155-304 (z = 0.116) underwent an extreme VHE flare on 28 July 2006, reaching a flux level of ∼7 Crab above 200 GeV, and the peak fluxes, measured with 1-min time intervals, were twice higher. Moreover, lower amplitude flares on timescales of about 200 s were also detected [27]. On 29 July, The VHE flux boosted to ∼11 Crab, with the increase/decay timescales of ∼1 h [28]. The earlier HESS campaign in 2002–2003 also showed an extreme increase by a factor of 2.7 in ∼0.5 h.
The largest variability in the TeV energy range is expected in the framework of one-zone SSC scenarios. Namely, a quadratic relation should be observed during the X-ray and VHE fluxes in the Thomson regime (see Aharonian et al. [28]). However, the aforementioned flares in PKS 2155-304 showed a cubic relation between the X-ray and VHE fluxes that is impossible to produce within one-zone SSC scenarios. However, a bigger challenge was posed by a so-called “orphan” TeV-flare in another nearby TeV-detected HBL source 1ES 1959+650 (z = 0.048) on 4 June 2002 when an extreme VHE -ray flare by a factor of ∼15 in 5 h was not accompanied by those in other spectral bands [29].
On the other hand, the variability of the timescales becomes progressively greater with the decreasing observation frequency and can be as long as a few years in the radio-optical part of the electromagnetic spectrum (see, e.g., Lindfors et al. [30]).
The shortest variability timescale can be used to evaluate the central black hole mass as [31]:
Moreover, the timescale of the particular variability instance may constrain the upper limit of the jet area, producing the variable emission as follows [32]:
where is the Doppler factor of the emission zone producing this variable flux:
with the bulk Lorentz factor of the emission zone; the ratio of the velocity of this area to c (the speed of light in vacuum); the angle between the jet and our line-of-sight.
Since HBLs generally show their synchrotron and higher-energy peaks at X-rays and VHE -rays, respectively, they are expected to undergo the strongest and fastest flux variability in these energy ranges. According to the basic scenario (see, e.g., Chiapetti et al. [33]), the X-ray emission is due to synchrotron radiation from the highest-energy electrons, and the complex spectral variability observed in this band therefore reflects the injection and radiative evolution of freshly-accelerated particles. Therefore, the detection of sub-hour X-ray flux variability may provide us with very important information about the sizes of the smallest-scale jet turbulences and draw conclusions about the properties of ultra-relativistic particles.
The Wolter-type telescopes NuSTAR [34] and X-ray Telescope (XRT) onboard the satellite Swift [35,36] provide us with an opportunity to detect sub-hour X-ray variability of HBLs occurring on timescales as short as a few hundred seconds. Thanks to the unique characteristics, good photon statistics and low background counts of these instruments, we can investigate a flux variability on different timescales from minutes to years, obtain high-quality spectra for the majority of the observations, derive different spectral parameters and study their timing behavior.
Generally, the flux variability in blazars is broadly divided into three classes based on their duration (see, e.g., Gupta et al. [37], Wagner and Witzel [38]): (i) long-term variability (LTV), with timescales from several months to years; (ii) short-term variability (STV), occurring on timescales from several days to a few months; (iii) intra-day variability (IDV), involving brightness fluctuations during the time intervals from a few minutes to less than one day.
3. X-Ray Microvariability within 1 ks Intervals
We performed an intensive search for the intra-day X-ray variability for different bright HBLs (see Kapanadze et al. [12,13,14,15,16,17,18,19,39], etc.). For this purpose, we constructed light curves with different time bins and used the variability indicator introduced by [40]. For the particular observation with the fluxes , each with the standard error , we computed the quantity:
which should be distributed as with degrees of freedom in the case of purely random errors. We consider the source to be variable if the probability of exceeding the observed by chance is <0.1 percent, and it is classified as non-variable if the probability is >0.5 percent (see Andruchow et al. [41]).
We provide a summary of the IDVs in Table 1, Table 2 and Table 3, which were detected for different bright HBLs at the 99.9 percent confidence level (compiled using the results provided in our aforementioned papers). For each instance, the fractional root mean square (rms) variability amplitude and its error were calculated as [42]:
with the sample variance; the mean square error; the mean flux. Table 1 also contains the ranges of the spectral parameters, which are derived from the spectra extracted from the segments of the given observation. Namely, the 0.3–10 keV spectra of HBLs generally are curved and fit well with the log-parabolic model [43]:
with the pivot energy fixed to 1 keV; a the photon index at the energy ; b the curvature parameter. By means of the best-fit values of the parameters a and b, the position of the SED peak and the flux at the peak are calculated as:
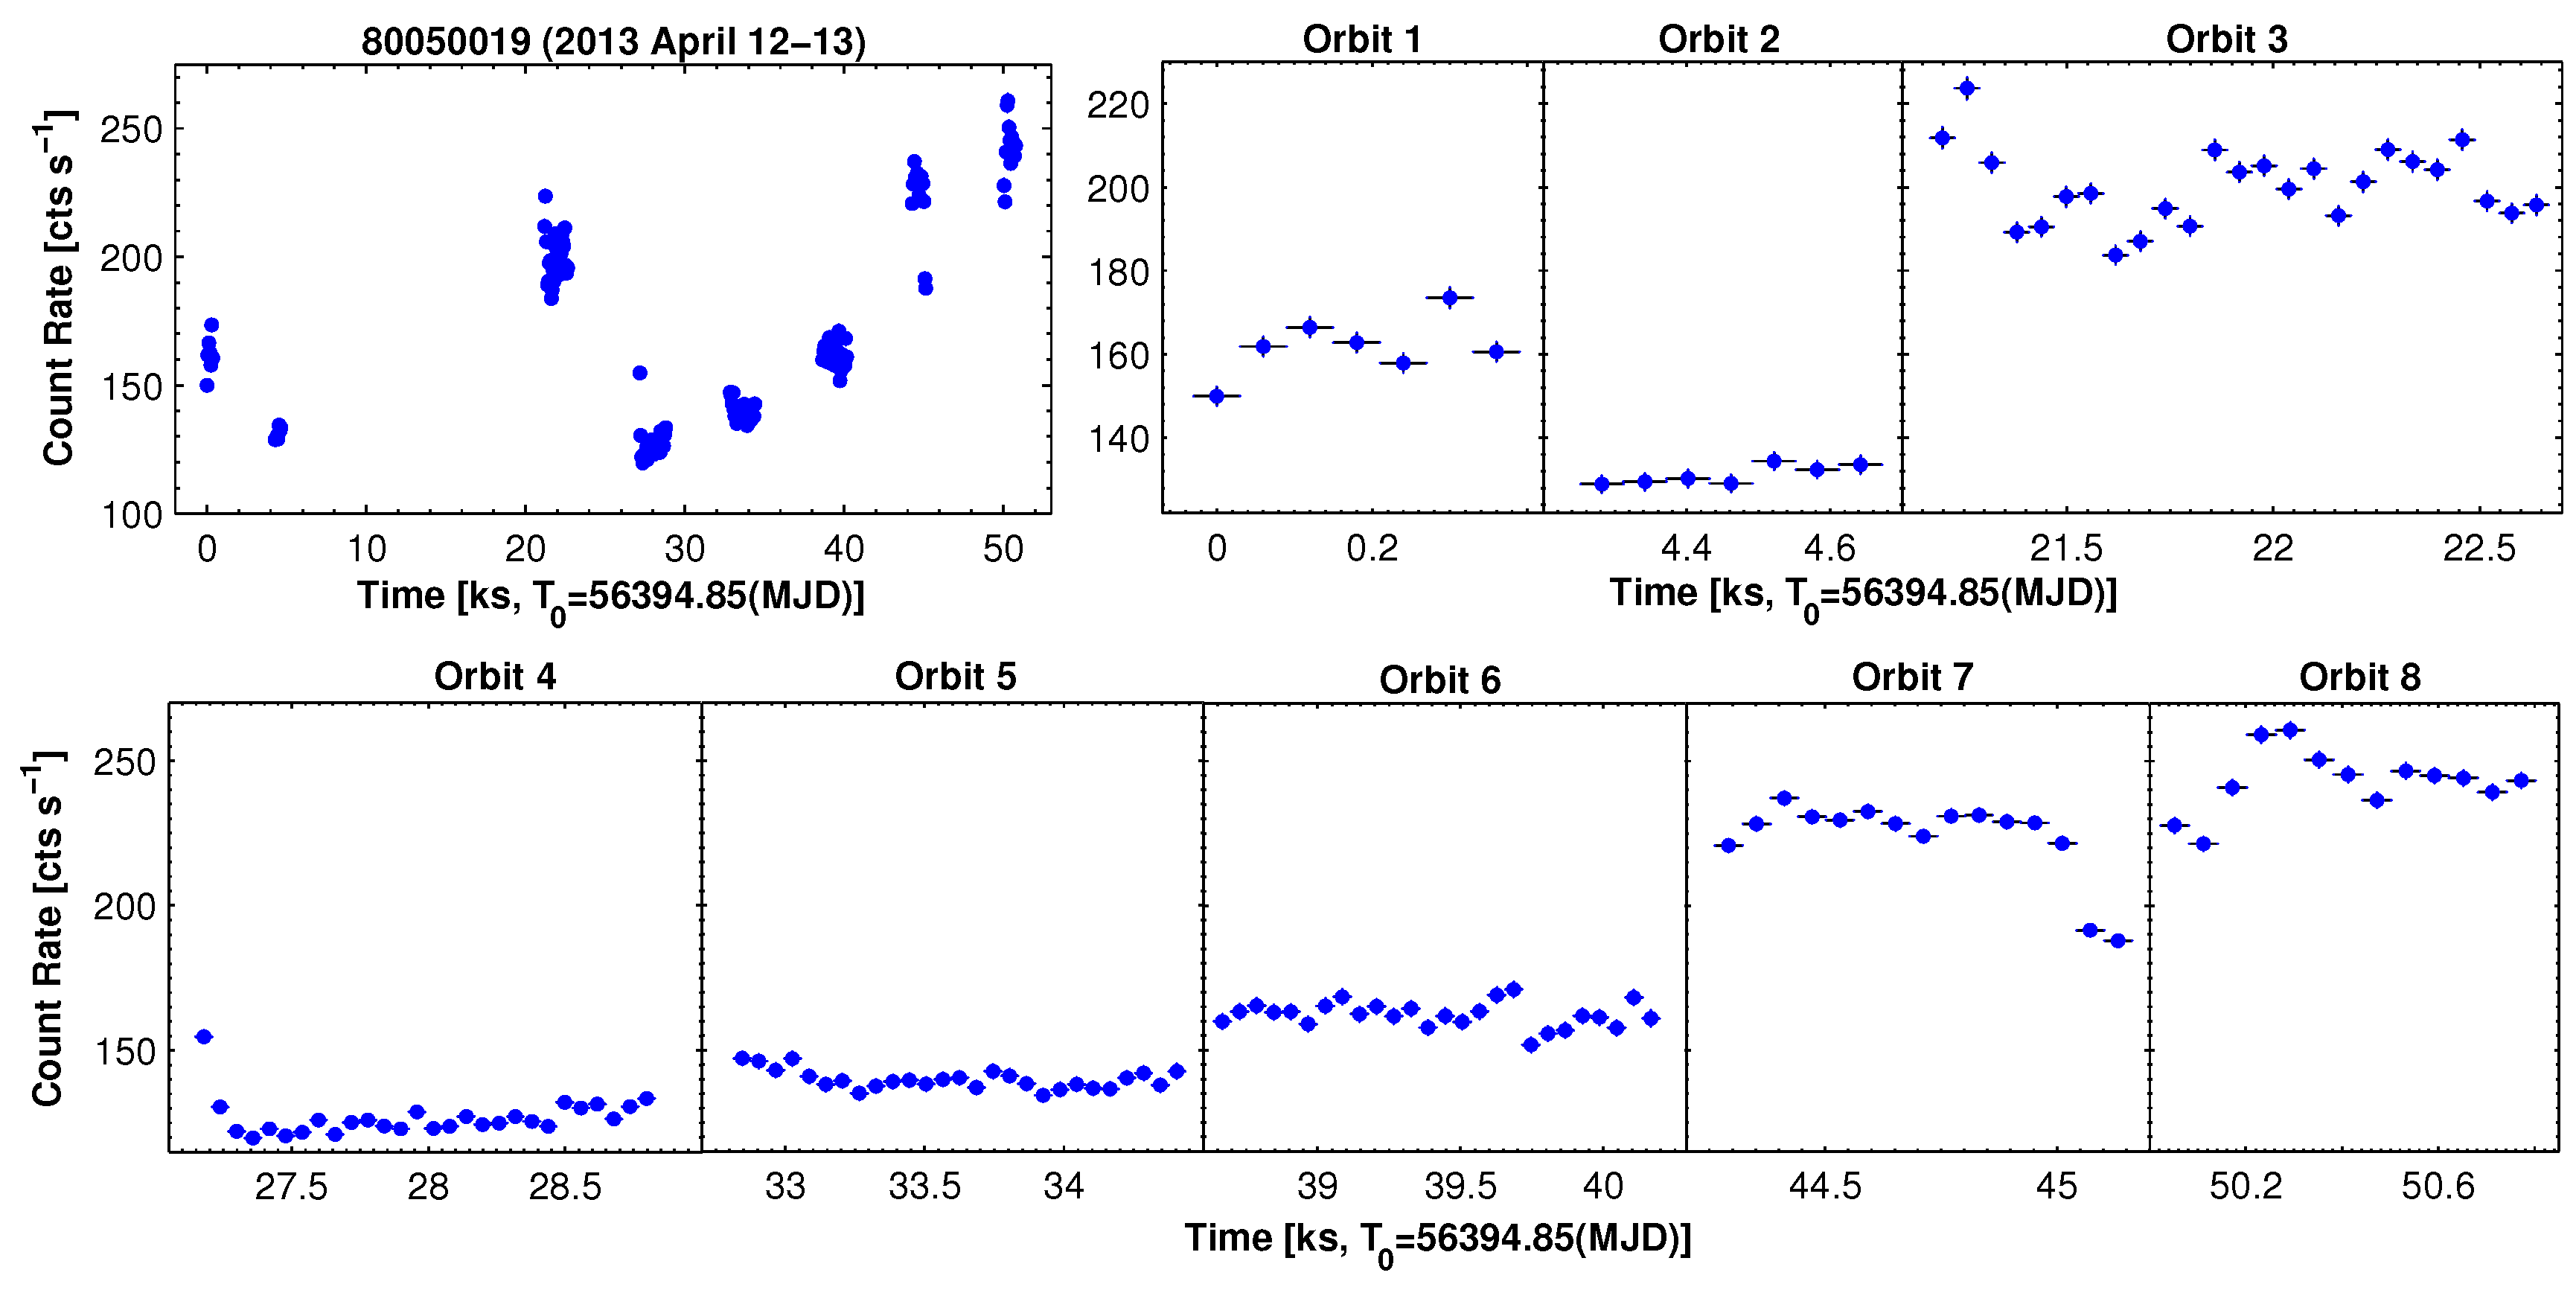
Mrk 421 has shown the most violent sub-hour variability in the 0.3–10 keV energy range. Table 1 presents the list of the IDVs observed within 1 ks observational runs of Swift-XRT. Figure 1 presents the light curves from the observation with ObsID 00080050019 (12–13 April), corresponding to the epoch of the highest historical X-ray maximum during the giant X-ray outburst in April 2013. This extended observation was split into eight parts corresponding to the different Swift orbits. The XRT pointing to Mrk 421 during each orbit lasted less than 1 ks and exhibited a flux variability with = 2.2(0.4)%–5.9(0.3)%. After the flux increase by about 10% during the first orbit lasting 420 s, the source showed a lower brightness (about 25% smaller) during the second orbit (Figure 1). The time separation between these orbits was 3.8 ks. After the fluctuations by 4–7% during Orbit 7 (lasting 840 s), the flux showed a brightening by 17% in the first 240-s segment of Orbit 8 (starting after 4.86 ks), followed by a decay by 10%. Other IDVs were characterized by fractional amplitudes = 1.9–6.7%. During some IDVs, the source showed a spectral variability with the ranges = 0.08–0.09, = 0.12–0.17, = 0.5–8.2 keV (see Columns (5)–(7) of Table 1).
Other bright HBLs have shown X-ray flux variability at the 99.9% confidence level on timescales shorter than 1 ks very rarely. Namely, only one instance per object is seen for 1ES 1959+650, Mrk 501 and PKS 2155-304. Namely, the latter source showed a very fast instance during its low X-ray state on 15 July 2011 (MJD 55757) with almost a symmetric flare profile exhibiting brightness increase and drop by ∼30% in ∼400 s (see Kapanadze et al. [39]).
Along with the instances summarized in Table 1, Mrk 421, 1ES 1959+650 and Mrk 501 exhibited a flux variability at the 99.9% confidence level within some 1 ks parts of the XRT observations listed in Table 2 (see the next section).
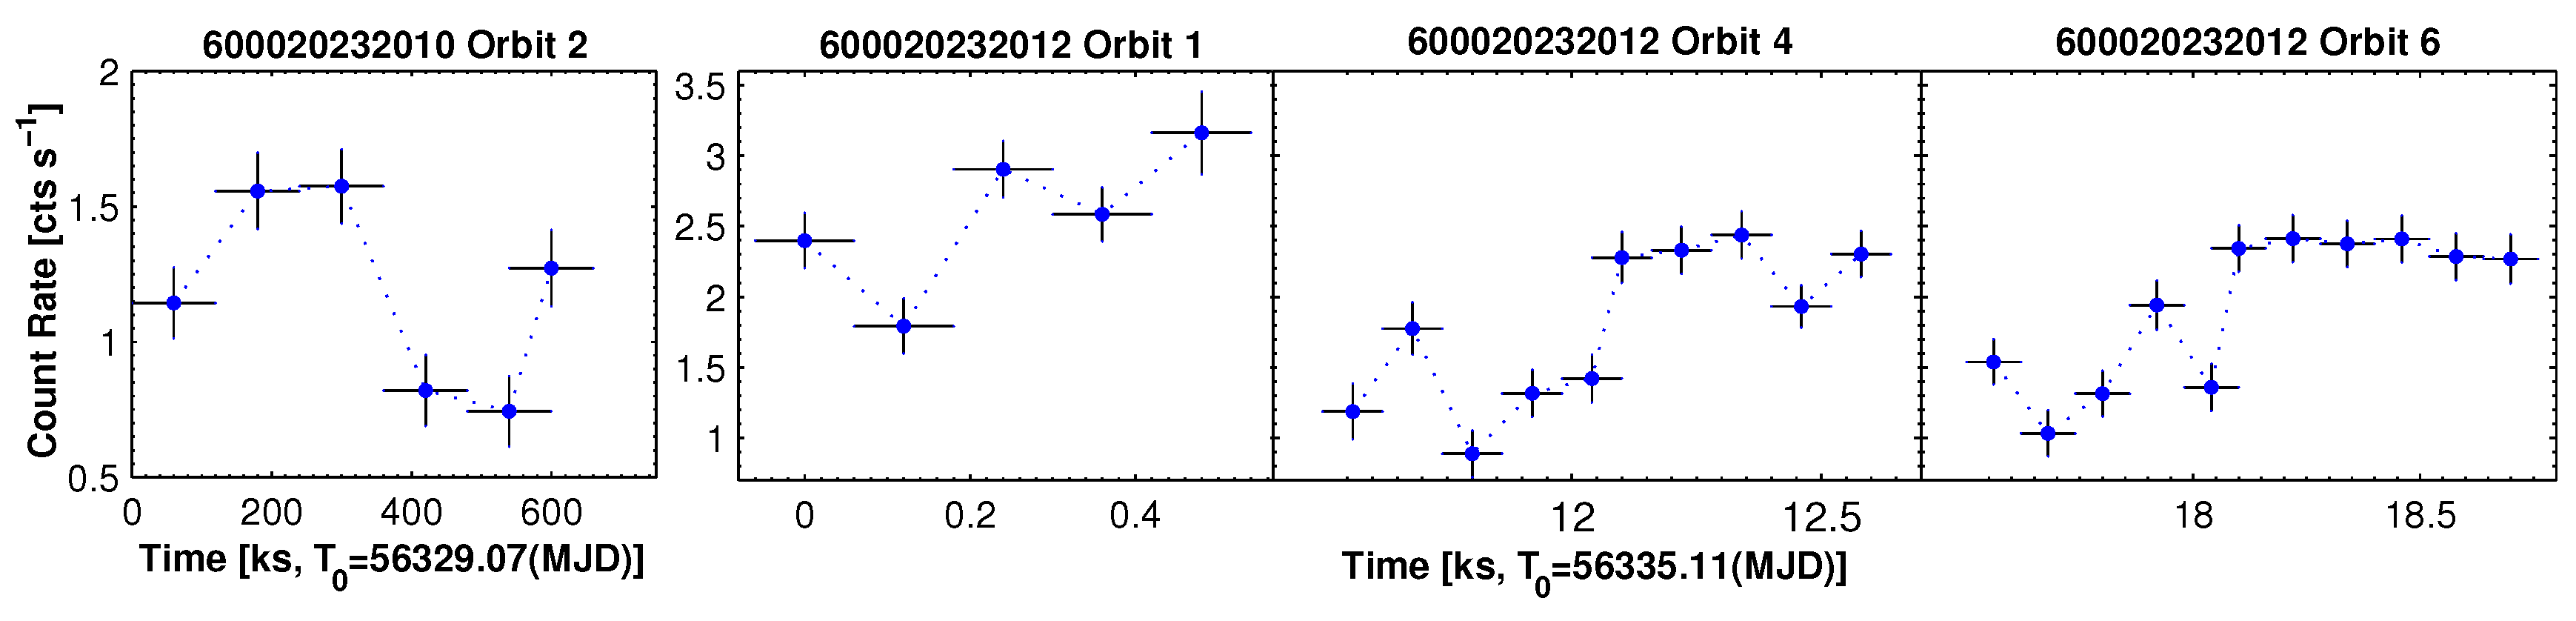
Figure 2 presents the four very fast instances from the 3–79 keV observations of Mrk 421 performed on 6 and 12 February 2013 with NuSTAR (see Table 3 for the corresponding summary). The observations at hard X-ray frequencies provide a direct insight into the highest energy particles through detection of synchrotron emission [25]. Moreover, the NuSTAR observations allow us to study the properties of the lower energy particles via the detection of the IC-emission produced via the photon upscattering by lower energy electrons. Note that the energy-dependent cooling timescale can lead to more rapid variability at hard X-ray frequencies than in the soft X-ray energy range [25].
During the instances presented in Figure 2, the source showed a brightness decline by 90% in 360 s and increases by 20–50% in 240–450 s. The 3–79 keV flux variability at the 99.9% confidence level was also observed within some 1 ks parts of the longer-term instances listed in Table 3. The work in [44] reported on the fastest flux doubling time scale of 14.01 ± 5.03 min from the NuSTAR observations of Mk 421 during 10–19 April 2013, although those result seems to be obtained from very short segments of the light curves, which show a large slope, although the flux increase factor is less than two.
From the past X-ray observations of Mrk 501, an extreme IDV was reported by [45] when an increase of the 2–10 keV flux by 60 percent in 200 s was followed by a drop by 40 percent in 600 s during the observation performed with the Photon Counting Array (PCA) onboard the satellite Rossi X-ray Timing Explorer (RXTE) on 25 May 1998. However, this detection was attributed to the instrumental effects by [46].
4. Sub-Hour X-Ray IDVs on Timescales Longer than 1 ks
Table 2 gives the summary of sub-hour 0.3–10 keV IDVs observed on timescales longer than 1 ks (compiled on the basis of Kapanadze et al. [12,15,17,18,19]). Similar to faster IDVs discussed in the previous section, most of these instances occurred in Mrk 421. They show fractional variability amplitudes of 1.4–20.4%. Some out of these IDVs were accompanied by the variability of the spectral parameters a, b and at the 3 confidence level with different amplitudes up to = 0.46, = 0.28 and = 1.63 keV.
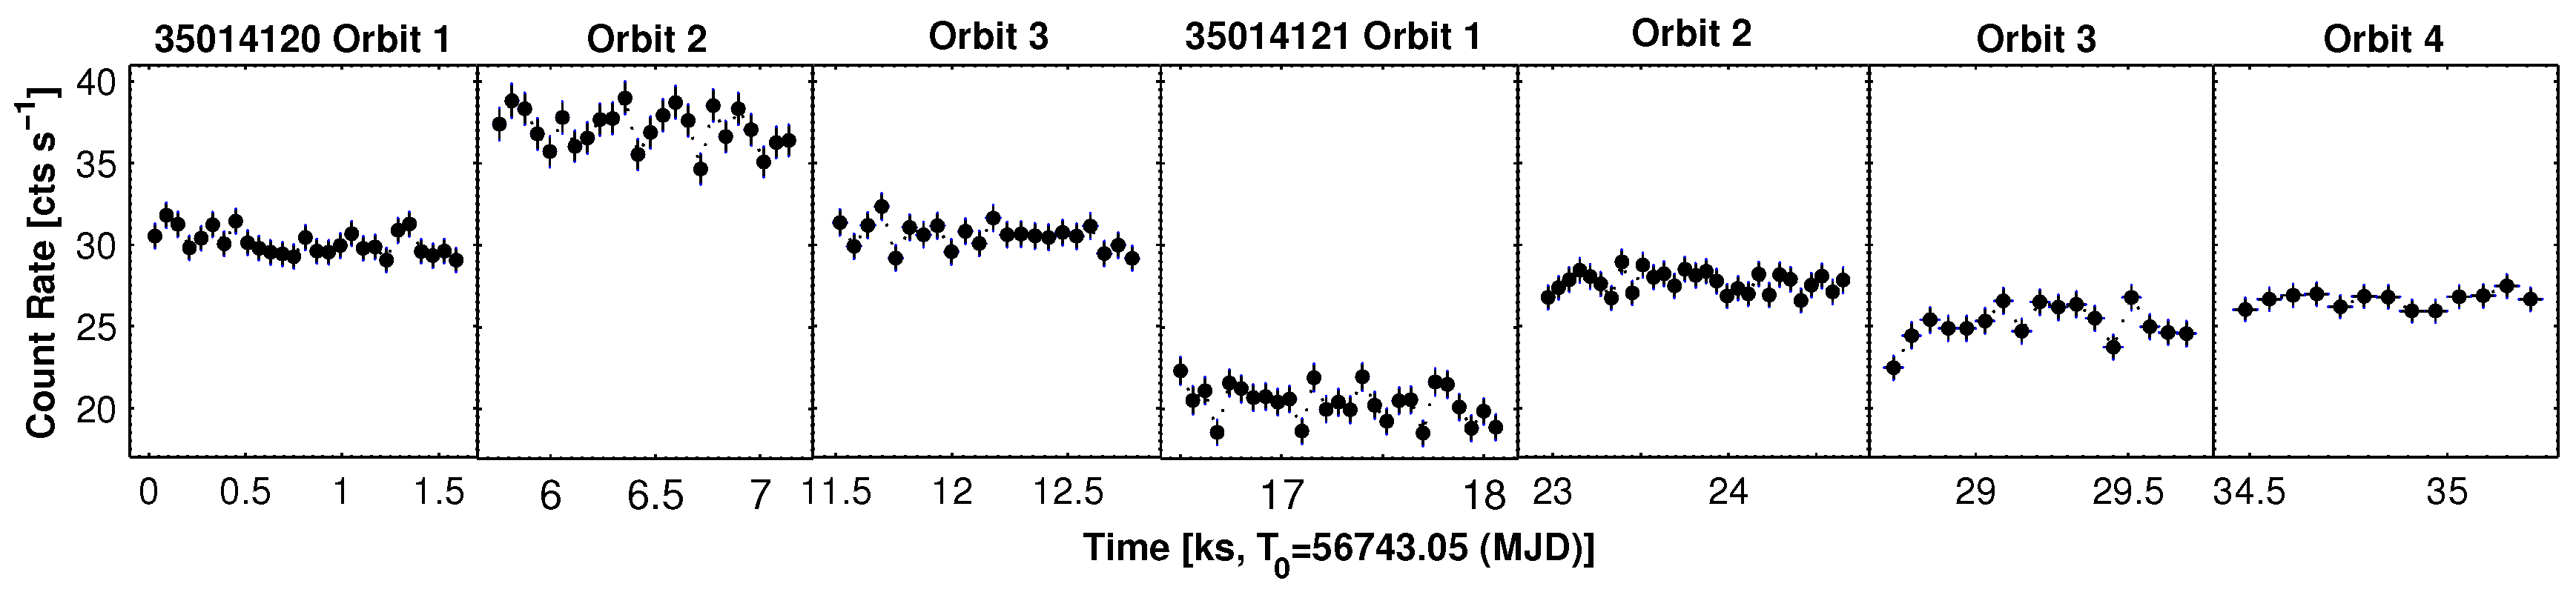
Figure 3 presents another example of the 0.3–10 keV IDV of Mrk 421 observed with Swift-XRT on 27 March 2014. Besides the flux halving in about 10 ks, the source showed a sub-hour flux variability during some orbits, associated with the spectral variability by = 0.07, = 0.18 and = 0.35 keV.
From other bright HBLs, 1ES 1959+650 was active on sub-hour timescales during June–July 2016 when it underwent one of the strongest 0.3–10 keV flares since the start of Swift observations. These instances yielded the fractional amplitude of 6–20 percent and the largest spectral variability by = 0.09, = 0.42 and = 2.23 keV (see Table 2).
We revealed 45 instances of the 3–79 keV IDV in Mrk 421 from the publicly available NuSTAR observations performed during January–May 2013. Here, a represents the photon index at 10 keV. The most dramatic variability was recorded during the extended observation on 11–12 April, which was spread over 26 NuSTAR orbits with a total duration of 117 ks. The 3–79 keV count rate showed an increase by a factor of 8.8 in 23.6 h (see Figure 4), superimposed by a minor flare (a brightening by 50% in 2.2 h) centered on = 1.09 d since the start of this observation. The flux increase was accompanied by strong spectral hardening by = 0.45, as well as by shifting of the synchrotron SED peak position by more than 2 keV towards higher energies. The source underwent a sub-hour flux variability during 13 orbits of this observation with fractional amplitudes of 3.5–8.7%, and these instances were characterized by the strongest spectral variability corresponding to = 0.11, = 0.26 and = 1.52 keV.
As for the X-ray campaigns with other space missions, ssub-hour variability with two overlapping flares of even shorter durations in Mrk 421 was reported by [47] from the RXTE-PCA observations of a high X-ray state in 2001. The work in [48] reported on the two very fast X-ray micro-flares within about 20 min with substantial substructures, implying variability on even shorter timescales. Other instances with the shortest rise or decay time of 1 ks were also detected by the same authors. On 23 October 2002, the RXTE-PCA observation of PKS 2155-304 showed an increase of the 2–10 keV flux by 60 percent during the 1.5 ks interval [49].
5. Discussion and Conclusions
In the framework of shock-in-jet scenario (see, e.g., Sokolov et al. [50]), longer-term blazar flares can be related to the propagation of a shock moving down the jet, while the interaction between the shock front and jet inhomogeneities triggers shorter-term flares. Moreover, the relativistic magnetohydrodynamic simulations of [51] showed that the shock propagation through an inhomogeneous jet medium can lead to the amplification of turbulent magnetic fields in a shocked area (due to its interaction with higher-density inhomogeneities existing in the pre-shock medium). The higher-energy photons are expected to originate in the smallest areas, which contain the strongest magnetic field, yielding the most rapid time variability (see Mizuno et al. [51]).
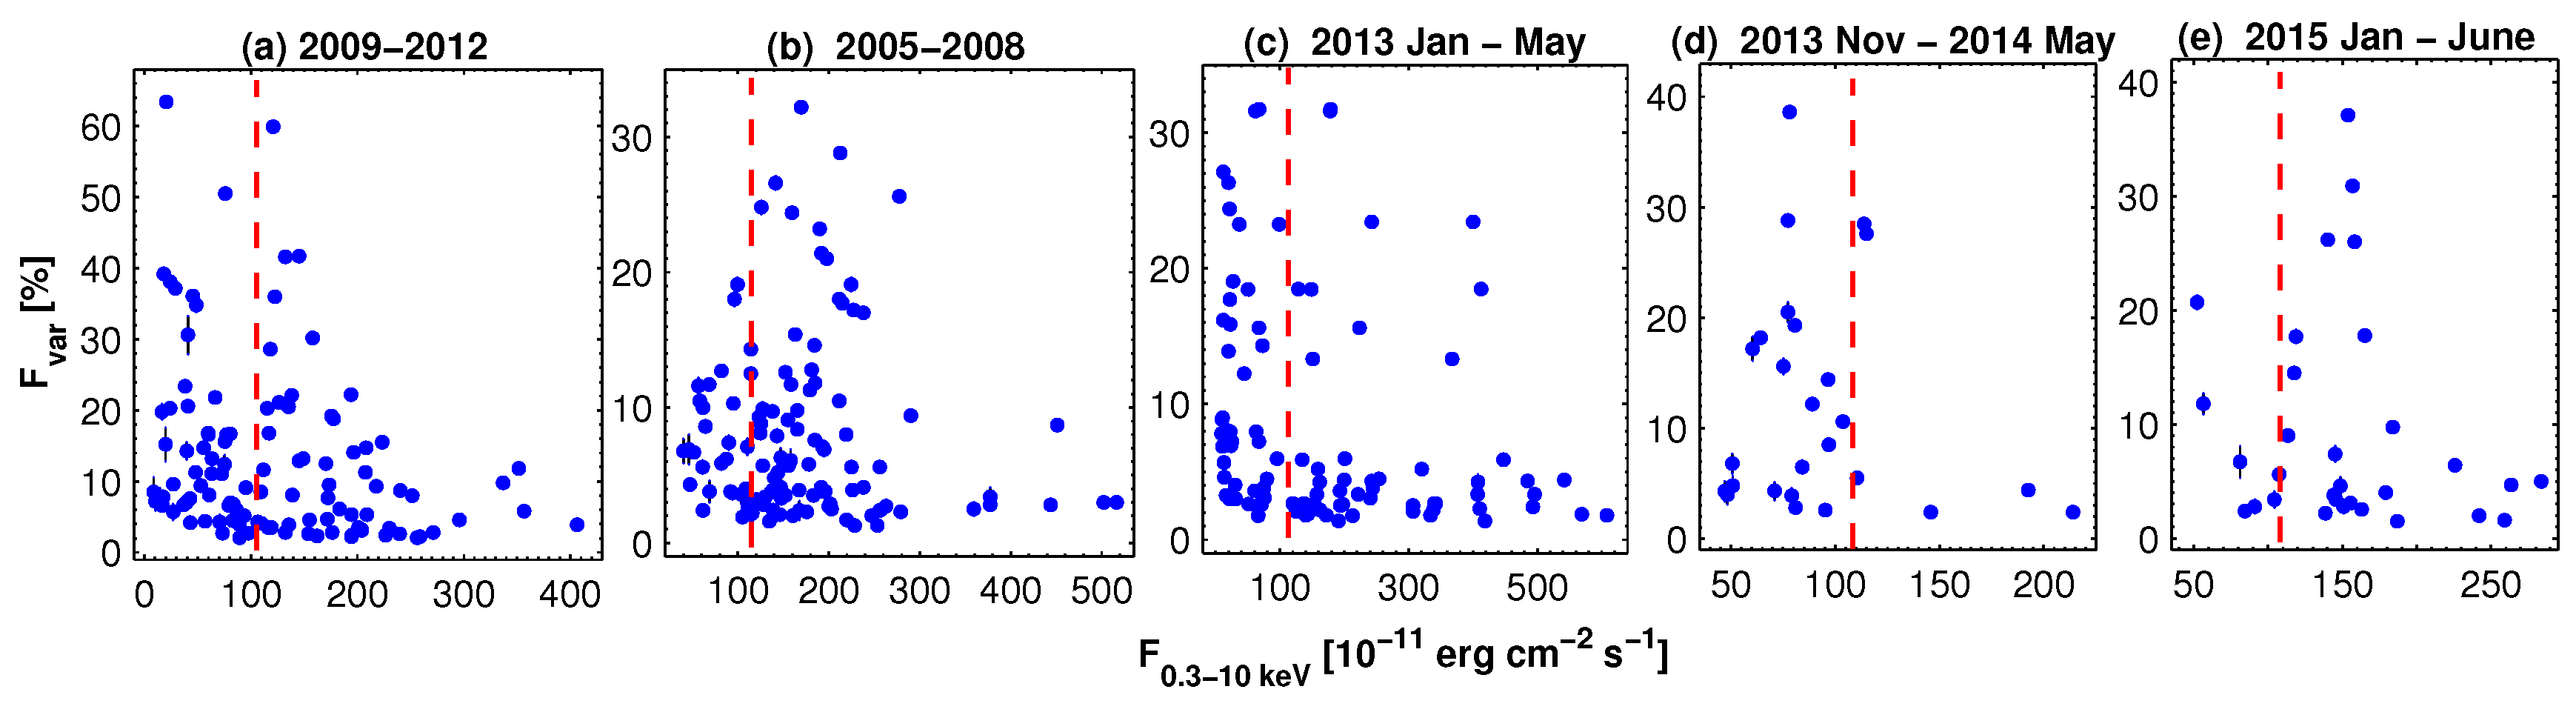
Figure 5 presents the quantity from 0.3–10 keV IDVs in Mrk 421 as a function of the de-absorbed 0.3–10 keV flux in different epochs. We see that these events were observed at any brightness state in 2009–2012 (the first panel), and a similar situation was observed during January–May 2013 (Figure 5c). In 2005–2008 and January–June 2015 (Figure 5b,e), the 0.3–10 keV IDVs were mostly observed in higher states, and the opposite situation was in November 2013–May 2014 (Figure 5d). The IDVs in the flaring epochs favor the shock-in-jet scenario (interaction of a propagating shock front with jet inhomogeneities; Sokolov et al. [50]). IDVs caused by other mechanisms occurring in the innermost blazar area should be more conspicuous when the source is relatively faint, i.e., the variable emission from the black hole vicinity will not be “shadowed” by the huge amount of the flux produced near the shock front (see, e.g., Kapanadze et al. [12,13,39]). We conclude that the importance of the flow disturbances occurring in the innermost AGN region and triggering 0.3–10 keV IDVs could be higher in November 2013–May 2014, and these processes, along with the shock-in-jet scenario, could be at work in 2009–2012.
Very fast IDVs are also explained with so-called hot-spot models incorporating fast flares, which emerge at different locations on the accretion disc [52]. In that case, these instances should be more conspicuous when the AGN is in a faint (quiescent) stage, i.e., with no flaring activities in the jet pointed toward the observer. However, this possibility seems less important for BL Lacs since no disc component is evident in their spectral energy distribution. Therefore, accretion discs are thought to be radiatively less efficient in these sources (see, e.g., Fossati et al. [10]).
Along with the 0.3–10 keV flux, different spectral parameters showed variability on intraday timescales in Mrk 421, the most in 2005–2008 and January–May 2013 when these variations occurred even within 1 ks observational runs (see Kapanadze et al. [12,18]). For example, the spectrum softened/hardened by = 0.07–0.10 in 330–500 s, and the SED peaks’ position showed shifts by 1.2–3.2 keV towards higher energies in 400–600 s. Sub-hour flux variability also was significantly more frequent in these periods, especially during the giant X-ray flare in April 2013. The spectral variability of Mrk 421 on sub-hour timescales was less extreme in 2009–2012 and November 2013–June 2015 [15,19]. We conclude that these differences could be related to the considerably stronger turbulence in the jet area producing X-ray emission in these periods than in 2005–2008 and January–May 2013: a shock propagation can strongly amplify the turbulence in the magnetized jet material. As noted above, the higher-energy photons (including those having the 0.3–10 keV and 3–79 keV energies) are expected to originate in the smallest turbulent areas with the strongest magnetic field, which also can lead to the most rapid flux variability (based on the light-travel argument). Adopting the typical value of the Doppler factor = 10 (see, e.g., Fossati et al. [10], Aleksić [11]), Equation (2) yields that the size of the jet turbulent area, producing the X-ray emission during the very fast instances discussed in Section 3, can be smaller than 10 cm.
The densely-sampled Swift-XRT observations of Mrk 421, performed in April–June 2006 and January–April 2013, as well as the NuSTAR campaign in the latter period showed that the source exhibited an unequal activity on intra-day time scales in different time intervals. This result can be related to the different strength of the turbulence in the corresponding epochs. Therefore, further densely-sampled X-ray observations with Swift and other space missions are crucial for the detection of sub-hour flux and spectral variability, which may yield further progress in our understanding of small-scale structures and very fast processes occurring in the innermost area of these extreme AGNs.
Acknowledgments
B.K. acknowledges Shota Rustaveli National Science Foundation and Ilia State University for the research grant FR/377/6-290/14. He thanks the anonymous referees for the useful comments that helped to improve the quality of the paper. This research has made use of the XRTDAS software, developed under the responsibility of the ASDC, Italy, as well as the data obtained through the High Energy Astrophysics Science Archive Research Center Online Service, provided by the NASA/Goddard Space Flight Center.
Conflicts of Interest
The author declares no conflict of interest.
References
- Scarpa, R.; Urry, C.M.; Falomo, R.; Pesce, J.S.; Treves, A. The Hubble Space Telescope Survey of BL Lacertae Objects. II. Host Galaxies. Astrophys. J. 2000, 532, 816. [Google Scholar] [CrossRef]
- Piranimonte, S.; Perri, M.; Giommi, P.; Landt, H.; Padovani, P. The sedentary survey of extreme high-energy peaked BL Lacs-III. Results from optical spectroscopy. Astron. Astrophys. 2007, 470, 787. [Google Scholar] [CrossRef]
- Urry, C.M.; Padovani, P. Unified schemes for radio-loud active galactic nuclei. Publ. Astron. Soc. Pac. 1995, 107, 803. [Google Scholar] [CrossRef]
- Atwood, W.B.; Abdo, A.A.; Ackermann, M.; Althouse, W.; Anderson, B.; Axelsson, M.; Baldini, L.; Ballet, J.; Band, D.L.; Barbiellini, G. The large area telescope on the Fermi gamma-ray space telescope mission. Astrophys. J. 2009, 697, 1071. [Google Scholar] [CrossRef]
- Padovani, P.; Giommi, P. The connection between x-ray-and radio-selected BL Lacertae objects. Astrophys. J. 1995, 444, 567. [Google Scholar] [CrossRef]
- Falomo, R.; Pian, E.; Treves, A. An optical view of BL Lacertae objects. Astron. Astrophys. Rev. 2014, 22, 37. [Google Scholar] [CrossRef]
- Marscher, A.P.; Gear, W.K. Models for high-frequency radio outbursts in extragalactic sources, with application to the early 1983 millimeter-to-infrared flare of 3C 273. Astrophys. J. 1985, 298, 114–127. [Google Scholar] [CrossRef]
- Mücke, A.; Protheroe, R.J.; Engel, R.; Rachen, J.P.; Stanev, T. BL Lac objects in the synchrotron proton blazar model. Astropart. Phys. 2003, 18, 593. [Google Scholar] [CrossRef]
- Mannheim, K. The proton blazar. Astron. Astrophys. 1993, 69, 60. [Google Scholar]
- Fossati, G.; Buckley, J.H.; Bond, I.H.; Bradbury, S.M.; Carter-Lewis, D.A.; Chow, Y.C.K.; Cui, W.; Falcone, A.D.; Finley, J.P.; Gaidos, J.A.; et al. Multiwavelength observations of Markarian 421 in 2001 March: An unprecedented view on the X-ray/TeV correlated variability. Astrophys. J. 2008, 677, 906. [Google Scholar] [CrossRef]
- Aleksić, J.; Ansoldi, S.; Antonelli, L.A.; Antoranz, P.; Babic, A.; Bangale, P.; Barrio, J.A.; González, J.B.; Bednarek, W.; Bernardini, E.; et al. MAGIC observations of MWC 656, the only known Be/BH system. Astron. Astrophys. 2015, 576, A36. [Google Scholar] [CrossRef]
- Kapanadze, B.; Dorner, D.; Vercellone, S.; Romano, P.; Aller, H.; Aller, M.; Hughes, P.; Reynolds, M.; Kapanadze, S.; Tabagari, L. X-ray flaring activity of mrk 421 in the first half of 2013. Astrophys. J. 2016, 831, 102. [Google Scholar] [CrossRef]
- Kapanadze, B.; Romano, P.; Vercellone, S.; Kapanadze, S.; Mdzinarishvili, T.; Kharshiladze, G. The long-term Swift observations of the high-energy peaked BL Lacertae source 1ES 1959+650. Mon. Not. R. Astron. Soc. 2016, 457, 704–722. [Google Scholar] [CrossRef]
- Kapanadze, B.; Dorner, D.; Vercellone, S.; Romano, P.; Kapanadze, S.; Mdzinarishvili, T. A recent strong X-ray flaring activity of 1ES 1959+650 with possibly less efficient stochastic acceleration. Mon. Not. R. Astron. Soc. 2016, 461, L26–L31. [Google Scholar] [CrossRef]
- Kapanadze, B.; Dorner, D.; Romano, P.; Vercellone, S.; Kapanadze, S.; Tabagari, L. Mrk 421 after the Giant X-Ray Outburst in 2013. Astrophys. J. 2017, 848, 103. [Google Scholar] [CrossRef]
- Kapanadze, B.; Dorner, D.; Romano, P.; Vercellone, S.; Mannheim, K.; Lindfors, E.; Nilsson, K.; Reinthal, R.; Takalo, L.; Kapanadze, S.; et al. The prolonged X-ray flaring activity of Mrk 501 in 2014. Mon. Not. R. Astron. Soc. 2017, 469, 1655–1672. [Google Scholar] [CrossRef]
- Kapanadze, B.; Dorner, D.; Vercellone, S.; Romano, P.; Hughes, P.; Aller, M.; Aller, H.; Reynolds, M.; Kapanadze, S.; Tabagari, L. The second strong X-ray flare and multifrequency variability of 1ES 1959+650 in 2016 January–August. Mon. Not. R. Astron. Soc. 2018, 473, 2542–2564. [Google Scholar] [CrossRef]
- Kapanadze, B.; Vercellone, S.; Romano, P.; Hughes, P.; Aller, M.; Aller, H.; Kharshiladze, O.; Kapanadze, S.; Tabagari, L. Swift Observations of Mrk 421 in Selected Epochs. I. The Spectral and Flux Variability in 2005–2008. Astrophys. J. 2018, 854, 66. [Google Scholar] [CrossRef]
- Vercellone, S.; Romano, P.; Hughes, P.; Aller, M.; Aller, H.; Kharshiladze, O.; Tabagari, L. Swift Observations of Mrk 421 in Selected Epochs. II. An Extreme Spectral And Flux Variability an 2009–2012. Astrophys. J. 2018; submitted. [Google Scholar]
- Gaidos, J.; Akerlof, C.W.; Biller, S.; Boyle, P.J.; Breslin, A.C.; Buckley, J.H.; Carter-Lewis, D.A.; Catanese, M.; Cawley, M.F.; Fegan, D.J.; et al. Extremely rapid bursts of TeV photons from the active galaxy Markarian 421. Nature 1996, 383, 319–320. [Google Scholar] [CrossRef]
- Aharonian, F.; Akhperjanian, A.; Beilicke, M.; Bernlöhr, K.; Börst, H.; Bojahr, H.; Bolz1, O.; Coarasa, T.; Contreras, J.; Cortina, J.; et al. Variations of the TeV energy spectrum at different flux levels of Mkn 421 observed with the HEGRA system of Cherenkov telescopes. Astron. Astrophys. 2002, 393, 89–99. [Google Scholar] [CrossRef]
- Alecsic, J.; Anderhub, H.; Antonelli, L.A.; Antoranz, P.; Backes, M.; Baixeras, C.; Balestra, S.; Barrio, J.A.; Bastieri, D.; González, B.J.; et al. MAGIC TeV gamma-ray observations of Markarian 421 during multiwavelength campaigns in 2006. Astron. Astrophys. 2010, 519, A32. [Google Scholar] [CrossRef]
- Albert, J.; Aliu, E.; Anderhub, H.; Antoranz, P.; Armada, A.; Baixeras, C.; Barrio, J.A.; Bartko, H.; Bastieri, D.; Becker, J.K.; et al. Variable Very High Energy Y-ray Emission from Markarian 501. Astrophys. J. 2007, 669, 862–883. [Google Scholar] [CrossRef] [Green Version]
- Sambruna, R.; Aharonian, F.A.; Krawczynski, H.; Akhperjanian, A.G.; Barrio4, J.A.; Bernlöhr, K.; Bojahr, H.; Calle, I.; Contreras, J.L.; Cortina, J.; et al. Correlated Intense X-Ray and TeV Activity of Markarian 501 in 1998 June. Astrophys. J. 2000, 538, 127–133. [Google Scholar] [CrossRef]
- Furniss, A.; Noda, K.; Boggs, S.; Chiang, J.; Christensen, F.; Craig, W.; Giommi, P.; Hailey, C.; Harisson, F.; Madejski, G.; et al. First NuSTAR observations of mrk 501 within a radio to tev multi-instrument campaign. Astrophys. J. 2015, 812, 65. [Google Scholar] [CrossRef]
- Chakraborty, N.; Cologna, G.; Kastendieck, M.A.; Rieger, F.; Romoli, C.; Wagner, S.J.; Jacholkowska, A.; Taylor, A. Rapid variability at very high energies in Mrk 501. In Proceedings of the 34th International Cosmic Ray Conference, The Hague, The Netherlands, 30 July–6 August 2015. [Google Scholar]
- Aharonian, F.; Akhperjanian, A.G.; Bazer-Bachi, A.R.; Behera, B.; Beilicke, M.; Benbow, W.; Berge, D.; Bernlöhr, K.; Boisson, C.; Bolz, O.; et al. An Exceptional Very High Energy Gamma-Ray Flare of PKS 2155-304. Astrophys. J. 2007, 664, L71. [Google Scholar] [CrossRef]
- Aharonian, F.; Akhperjanian, A.G.; Anton, G.; de Almeida, U.B.; Bazer-Bachi, A.R.; Becherini, Y.; Behera, B.; Benbow, W.; Bernlöhr, K.; Boisson, C.; et al. Simultaneous multiwavelength observations of the second exceptional Y-ray flare of PKS 2155-304 in July 2006. Astron. Astrophys. 2009, 502, 749–770. [Google Scholar] [CrossRef]
- Krawczynski, H.; Hughes, S.B.; Horan, D.; Aharonian, F.; Aller, M.F.; Aller, H.; Boltwood, P.; Buckley, J.; Coppi, P.; Fossati, G.; et al. Multiwavelength Observations of Strong Flares from the TeV Blazar 1ES 1959+650. Astrophys. J. 2004, 601, 151–164. [Google Scholar] [CrossRef]
- Lindfors, E.J.; Hovatta, T.; Nilsson, K.; Reinthal, R.; Ramazani1, V.F.; Pavlidou, V.; Max-Moerbeck, W.; Richards, J.; Berdyugin, A.; Takalo1, L.; et al. Optical and radio variability of the northern VHE gamma-ray emitting BL Lacertae objects. Astron. Astrophys. 2016, 593, A98. [Google Scholar] [CrossRef]
- Liang, E.W.; Liu, H.T. The masses of central supermassive black holes and the variability time-scales in gamma-ray loud blazars. Mon. Not. R. Astron. Soc. 2003, 340, 632–638. [Google Scholar] [CrossRef]
- Tramacere, A.; Giommi, P.; Perri, M.; Verrecchia, F.; Tosti, G. Swift observations of the very intense flaring activity of Mrk 421 during 2006. I. Phenomenological picture of electron acceleration and predictions for MeV/GeV emission. Astron. Astrophys. 2009, 501, 879–898. [Google Scholar] [CrossRef]
- Chiapetti, L.; Urry, C.M.; Maraschi, L.; Madejski, G.; McHardy, I.M.; Koratkar, A.; Treves, A.; Chiappetti, L.; Grandi, P.; Hartman, R.C.; et al. Ultraviolet and Multiwavelength Variability of the Blazar 3C 279: Evidence for Thermal Emission. Astrophys. J. 1999, 521, 112–120. [Google Scholar]
- Harrison, F.A.; Craig, W.W.; Christensen, F.E.; Hailey, C.J.; Zhang, W.W.; Boggs, S.E.; Stern, D.; Cook, W.R.; Forster, K.; Giommi, P.; et al. The nuclear spectroscopic telescope array (nustar) high-energy X-ray mission. Astrophys. J. 2013, 770, 103. [Google Scholar] [CrossRef]
- Burrows, D.N.; Hill, J.E.; Nousek, J.A.; Kennea, J.A.; Wells, A.; Osborne, J.P.; Abbey, A.F.; Beardmore, A.; Mukerjee, K.; Short, A.D.T.; et al. The Swift X-ray Telescope. Space Sci. Rev. 2005, 120, 165–195. [Google Scholar] [CrossRef]
- Gehrels, N.; Chincarini, G.; Giommi, P.; Mason, K.O.; Nousek, J.A.; Wells, A.A.; White, N.E.; Barthelmy, S.D.; Burrows, D.N.; Cominsky, L.R.; et al. The Swift Gamma-Ray Burst Mission. Astrophys. J. 2004, 611, 1005–1020. [Google Scholar] [CrossRef]
- Gupta, A.C.; Agarwal, A.; Bhagwan, J.; Strigachev, A.; Bachev, R.; Semkov, E.; Gaur, H.; Damljanovic, G.; Vince, O.; Wiita, P.J. Multiband optical variability of three TeV blazars on diverse time-scales. Mon. Not. R. Astron. Soc. 2016, 458, 1127–1137. [Google Scholar] [CrossRef]
- Wagner, S.; Witzel, R. Intraday Variability In Quasars and BL Lac Objects. Annu. Rev. Astron. Astrophys. 1995, 33, 163–198. [Google Scholar] [CrossRef]
- Kapanadze, B.; Romano, P.; Vercellone, S.; Kapanadze, S. The X-ray behaviour of the high-energy peaked BL Lacertae source PKS 2155-304 in the 0.3–10 keV band. Mon. Not. R. Astron. Soc. 2014, 444, 1077–1094. [Google Scholar] [CrossRef]
- Kesteven, M.J.L.; Bridle, A.H.; Brandie, G.W. Variability of extragalactic sources at 2.7 GHz. I—Results of a 2-year monitoring program. Astrophys. J. 1976, 81, 919–932. [Google Scholar] [CrossRef]
- Andruchow, I.; Romero, G.E.; Cellone, S.A. Polarization microvariability of BL Lacertae objects. Astron. Astrophys. 2005, 442, 97–107. [Google Scholar] [CrossRef]
- Vaughan, S.; Edelson, R.; Warwick, R.S.; Uttley, P. On characterizing the variability properties of X-ray light curves from active galaxies. Mon. Not. R. Astron. Soc. 2003, 345, 1271–1284. [Google Scholar] [CrossRef]
- Massaro, E.; Perri1, M.; Giommi, P.; Nesci, R. Log-parabolic spectra and particle acceleration in the BL Lac object Mkn 421: Spectral analysis of the complete BeppoSAX wide band X-ray data set. Astron. Astrophys. 2004, 413, 489–503. [Google Scholar] [CrossRef]
- Paliya, V.S.; Böttcher, M.; Diltz, C.; Stalin, C.S.; Sahayanathan, S.; Ravikumar, C.D. The violent hard X-ray variability of MRK 421 observed by NuSTAR in 2013 April. Astrophys. J. 2015, 811, 143. [Google Scholar] [CrossRef]
- Catanese, M.; Sambruna, R. A Rapid X-ray Flare from Markarian 501. Astrophys. J. 2000, 534, L39–L42. [Google Scholar] [CrossRef] [PubMed]
- Xue, Y.; Cui, W. X-ray Flares from Markarian 501. Astrophys. J. 2005, 622, 160–167. [Google Scholar] [CrossRef]
- Cui, W. X-ray Flaring Activity of Markarian 421. Astrophys. J. 2004, 605, 662–669. [Google Scholar] [CrossRef]
- Blazejowski, M.; Blaylock, G.; Bond, I.H.; Bradbury, S.M.; Buckley, J.H.; Carter-Lewis, J.H.; Celik, O.; Cogan, P.; Cui, W.; Daniel, M.; et al. A Multiwavelength View of the TeV Blazar Markarian 421: Correlated Variability, Flaring, and Spectral Evolution. Astrophys. J. 2005, 630, 130–141. [Google Scholar] [CrossRef]
- Aharonian, F.; Akhperjanian, A.G.; Bazer-Bachi, A.R.; Beilicke, M.; Benbow, W.; Berge, D.; Bernlöhr1, K.; Boisson, C.; Bolz1, O.; Borrel, V.; et al. Multi-wavelength observations of PKS 2155-304 with HESS. Astron. Astrophys. 2005, 442, 895–907. [Google Scholar] [CrossRef] [Green Version]
- Sokolov, A.; Marscher, A.P.; McHardy, I.M. Synchrotron Self-Compton Model for Rapid Nonthermal Flares in Blazars with Frequency-dependent Time Lags. Astrophys. J. 2004, 613, 725–746. [Google Scholar] [CrossRef]
- Mizuno, Y.; Pohl, M.; Niemiec, J.; Zhang, B.; Nishikawa, K.-I.; Hardee, P.E. Magnetic field amplification and saturation in turbulence behind a relativistic shock. Mon. Not. R. Astron. Soc. 2014, 439, 3490–3503. [Google Scholar] [CrossRef]
- Mangalam, A.V.; Wiita, P.J. Accretion disk models for optical and ultraviolet microvariability in active galactic nuclei. Astrophys. J. 1993, 406, 420–429. [Google Scholar] [CrossRef]
| 1 |
Figure 1.
The first panel in the upper row: the most extreme intraday variability of Mrk 421 during the Swift-X-ray Telescope (XRT) observations performed on 12–13 April 2013; the next panels and bottom row: zoomed-in 0.3–10 keV light curves from each orbit of this observation.
Figure 1.
The first panel in the upper row: the most extreme intraday variability of Mrk 421 during the Swift-X-ray Telescope (XRT) observations performed on 12–13 April 2013; the next panels and bottom row: zoomed-in 0.3–10 keV light curves from each orbit of this observation.

Figure 2.
Very fast 3–79 keV IDVs in Mrk 421 from the NuSTAR observations performed on 6 February 2013 (first panel) and 12 February (second, third and fourth panels).
Figure 2.
Very fast 3–79 keV IDVs in Mrk 421 from the NuSTAR observations performed on 6 February 2013 (first panel) and 12 February (second, third and fourth panels).

Figure 3.
The 0.3–10 keV variability of Mrk 421 observed with Swift-XRT on 27 March 2014 (reproduced from Kapanadze et al. [15]).
Figure 3.
The 0.3–10 keV variability of Mrk 421 observed with Swift-XRT on 27 March 2014 (reproduced from Kapanadze et al. [15]).

Figure 4.
The extended NuSTAR observation of Mrk 421 on 11–12 June 2012 (reproduced from Kapanadze et al. [12]).
Figure 4.
The extended NuSTAR observation of Mrk 421 on 11–12 June 2012 (reproduced from Kapanadze et al. [12]).
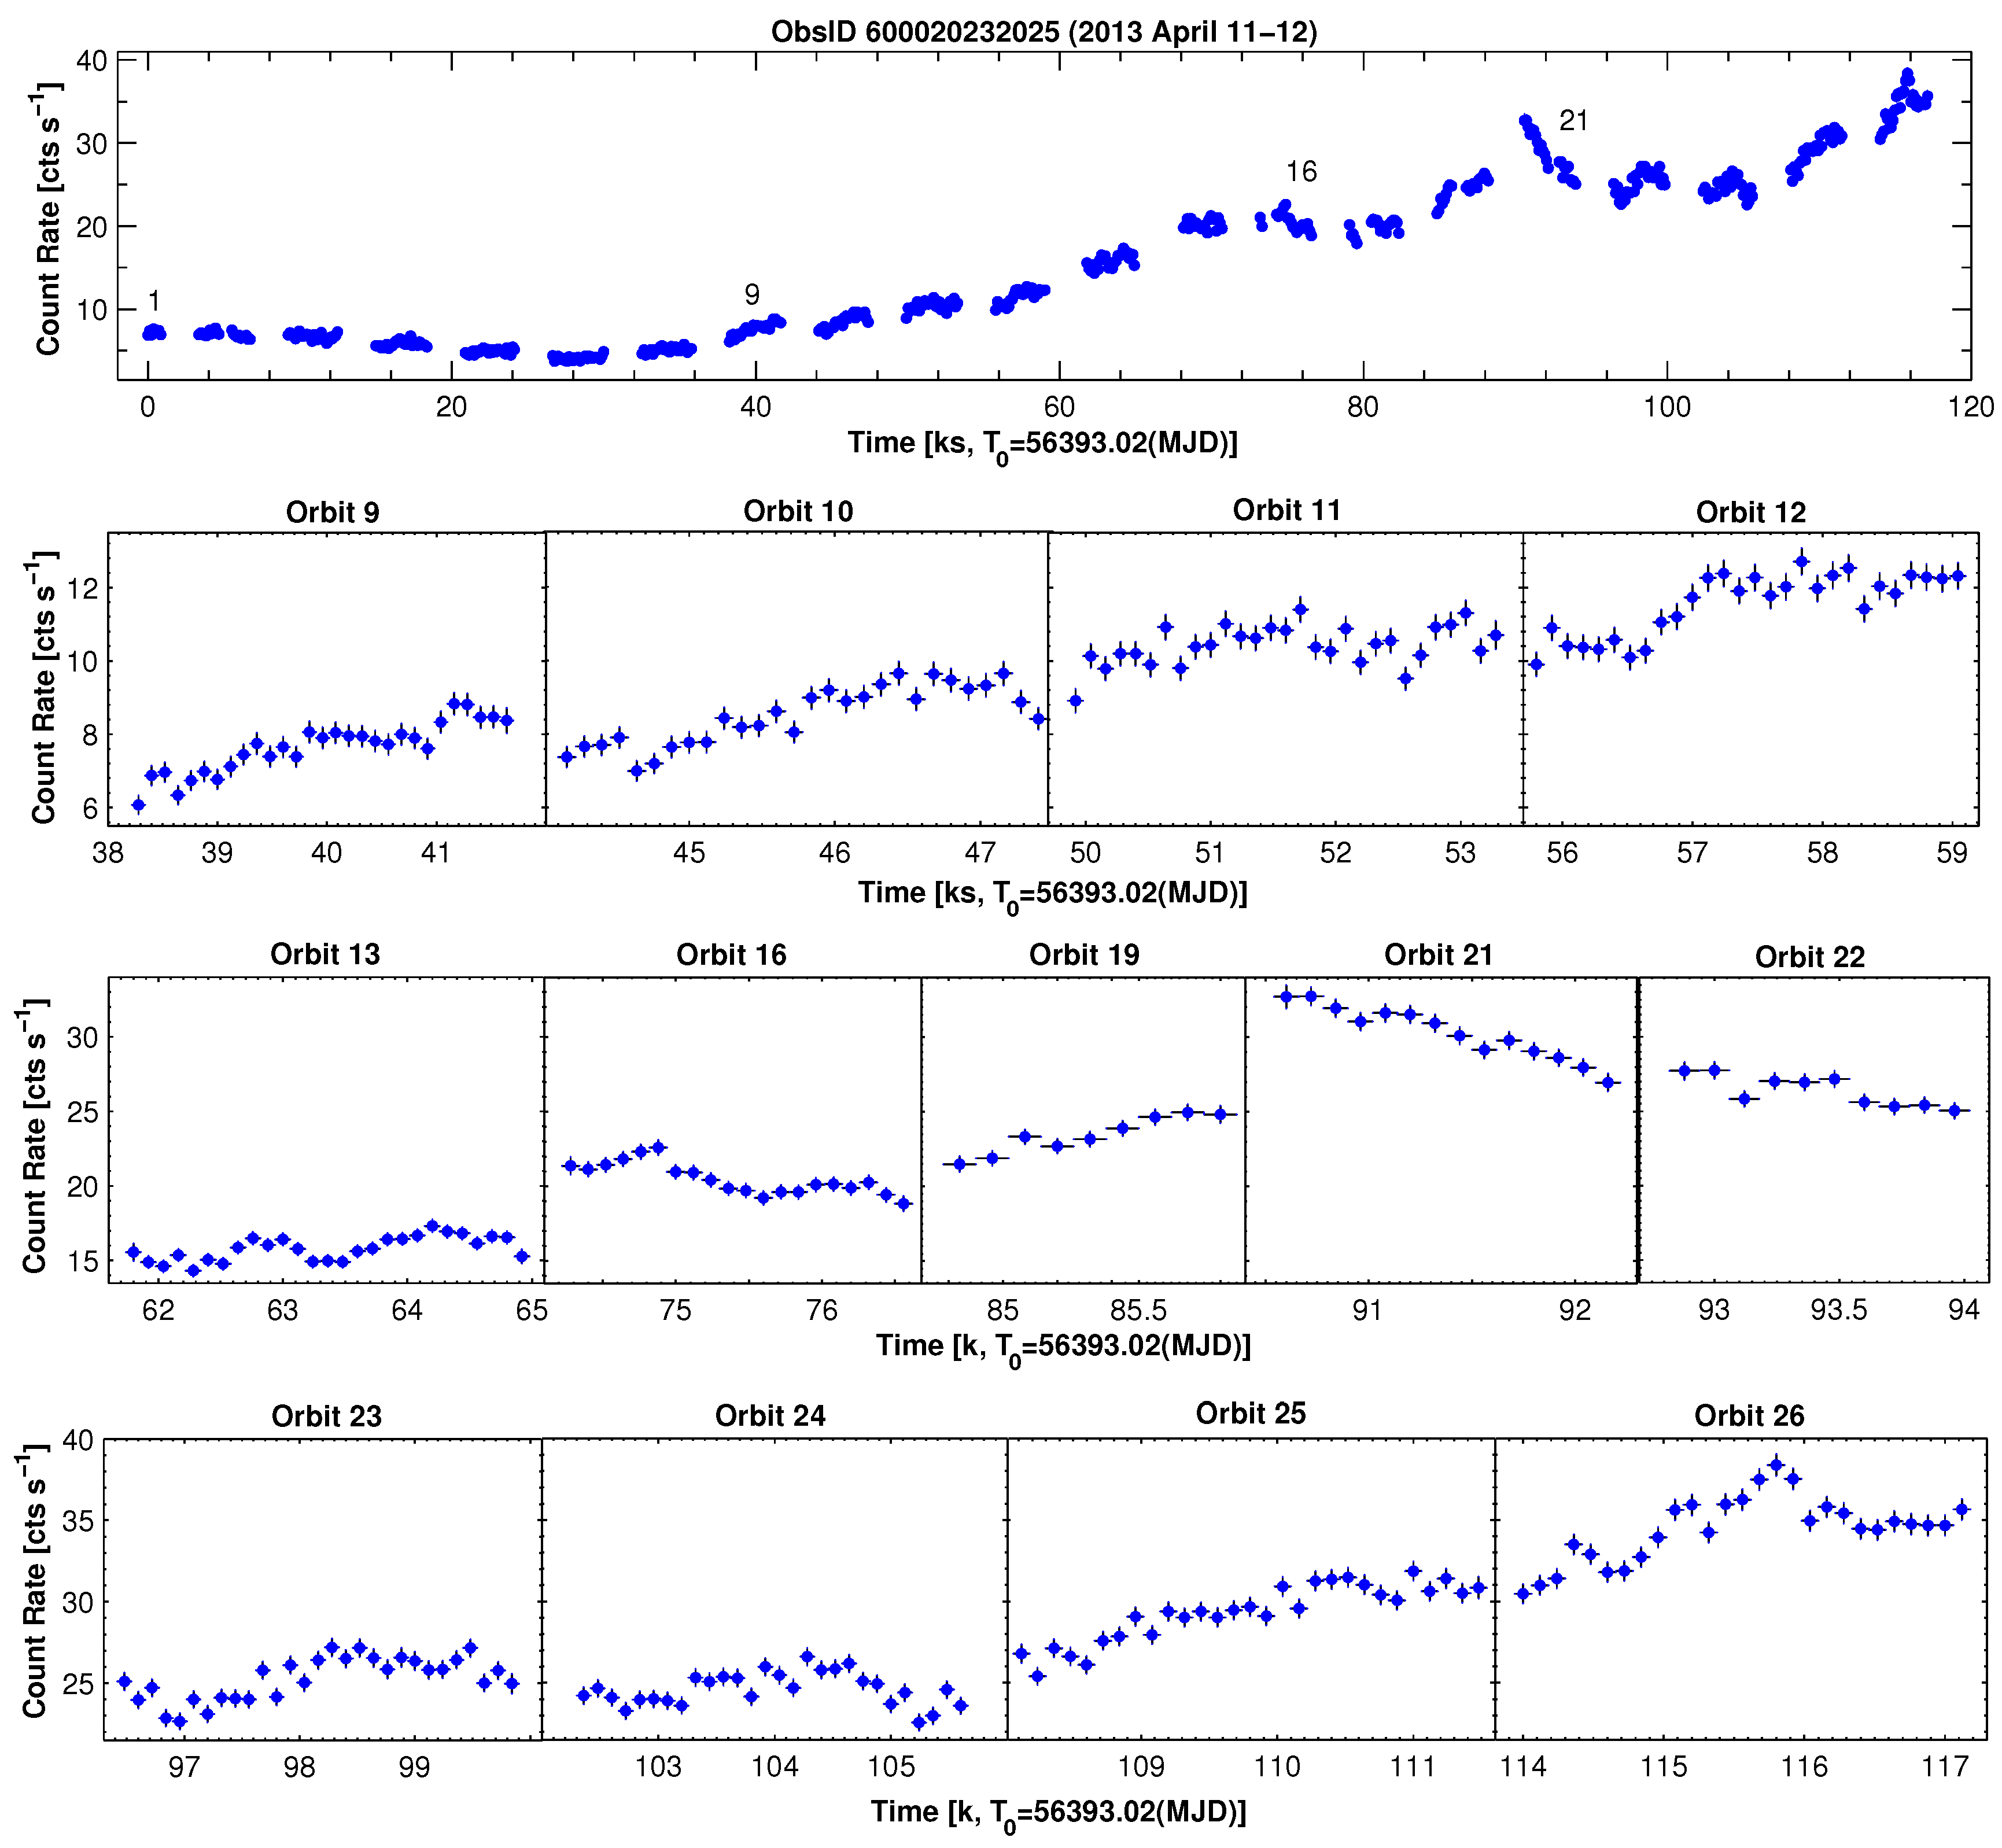
Figure 5.
values from the 0.3–10 keV IDVs in Mrk 421 plotted versus unabsorbed 0.3–10 keV flux in different periods. The vertical, red dashed line represents the mean weighted value of the 0.3–10 keV flux during 2005–2015 (reproduced from Kapanadze et al. [19]).
Figure 5.
values from the 0.3–10 keV IDVs in Mrk 421 plotted versus unabsorbed 0.3–10 keV flux in different periods. The vertical, red dashed line represents the mean weighted value of the 0.3–10 keV flux during 2005–2015 (reproduced from Kapanadze et al. [19]).


Table 1.
Summary of the 0.3–10 keV sub-hour intra-day variabilities (IDVs) observed in bright high-energy peaked BL Lacertae sources (HBLs) on timescales shorter than 1 ks with Swift-XRT. In Column (1), “Or” stands for “Orbit”. The third column gives the duration of the particular observation (in seconds); Columns (5)–(7) give the ranges of the photon index, the curvature parameter and the position of the synchrotron spectral energy distribution (SED) peak.
| ObsID(s) | Dates | T (s) | a | b | (keV) | |
|---|---|---|---|---|---|---|
| (1) | (2) | (3) | (4) | (5) | (6) | (7) |
| Mrk 421 | ||||||
| 00030352015 Or10 | 2006-06-25 | 830 | 2.0 (0.5) | 1.93 (0.02)–1.98 (0.02) | 0.07 (0.04)–0.10 (0.04) | 1.39 (0.14)–2.24(0.20) |
| 00030352032 Or1 | 2007-11-15 | 720 | 3.6 (0.7) | 2.12 (0.02)–2.14 (0.02) | 0.30 (0.05)–0.34 (0.05) | 0.58 (0.06)–0.67 (0.07) |
| 00030352036 Or2 | 2007-11-19 | 970 | 6.8 (0.9) | 2.26 (0.02) | 0.29 (0.05) | 0.36 (0.06) |
| 00030352038 Or2 | 2007-12-15 | 610 | 2.4 (0.7) | 2.17 (0.02)–2.18 (0.02) | 0.23 (0.04)–0.32 (0.04) | 0.43 (0.06)–0.52 (0.06) |
| 00030352051 Or2 | 2008-01-14 | 720 | 3.8 (0.7) | 2.36 (0.02)–2.39 (0.02) | 0.23 (0.04)–0.26 (0.04) | 0.14 (0.03)–0.20 (0.04) |
| 00030352053 Or1 | 2008-01-16 | 610 | 6.1 (0.8) | 2.22 (0.02)–2.28 (0.02) | 0.32 (0.05)–0.42 (0.05) | 0.37 (0.06)–0.55 (0.07) |
| 00032202001 Or1 | 2008-05-02 | 900 | 3.8 (0.8) | 2.11 (0.02)–2.12 (0.02) | 0.15 (0.05)–0.25 (0.05) | 0.43 (0.06)–0.58 (0.06) |
| 00032202003 Or2 | 2008-04-07 | 650 | 3.4 (0.6) | 2.16 (0.02)–2.20 (0.02) | 0.25 (0.04)–0.26 (0.04) | 0.41 (0.06)-0.48 (0.06) |
| 00030352099 Or2 | 2008-06-12 | 250 | 3.4 (0.7) | 1.73 (0.02) | 0.22 (0.04)–0.26 (0.04) | 3.31 (0.25)–4.11 (0.32) |
| 00030352099 Or3 | 2008-06-12 | 720 | 3.0 (0.4) | 1.76 (0.02)–1.79 (0.02) | 0.13 (0.04)–0.25 (0.04) | 2.88 (0.22)–6.42 (0.39) |
| 00030352099 Or4 | 2008-06-12 | 610 | 3.0 (0.4) | 1.72 (0.02)–1.81 (0.02) | 0.13 (0.04)–0.25 (0.04) | 3.16 (0.24)–5.38 (0.33) |
| 00030352099 Or5 | 2008-06-12 | 540 | 2.5 (0.5) | 1.65 (0.02)–1.73 (0.02) | 0.13 (0.04)–0.31 (0.05) | 3.67 (0.31)–11.94 (1.07) |
| 00030352099 Or6 | 2008-06-12 | 720 | 2.8 (0.4) | 1.72 (0.02)–1.75 (0.02) | 0.15 (0.04)–0.24 (0.04) | 3.83 (0.31)–6.98 (0.57) |
| 00030352182 | 2010-01-16 | 900 | 4.3 (0.9) | 1.95 (0.02)–1.97 (0.02) | 0.18 (0.05)–0.22 (0.05) | 1.21 (0.10)–1.30 (0.10) |
| 00030352215 Or2 | 2010-02-27 | 720 | 4.6 (0.7) | 1.85 (0.02)–1.87 (0.02) | 0.17 (0.05)–0.19 (0.05) | 2.20 (0.18)–2.76 (0.21) |
| 00030352239 | 2010-03-29 | 970 | 7.7 (0.9) | 1.81 (0.02)–1.83 (0.02) | 0.16 (0.04)–0.24 (0.04) | 2.49 (0.19)–3.40 (0.27) |
| 00031202066 | 2011-01-17 | 970 | 5.7 (1.1) | 2.71 (0.02) | 0.35 (0.06) | 0.10 (0.03) |
| 00080050018 Or11 | 2013-04-12 | 960 | 2.1 (0.3) | 1.91 (0.02)–2.00 (0.02) | 0.13 (0.04)–0.26 (0.04) | 1.00 (0.09)–1.52 (0.11) |
| 00080050019 Or1 | 2013-04-12 | 420 | 4.3 (0.6) | 1.83 (0.03)–1.86 (0.03) | 0.29 (0.05)–0.34 (0.05) | 1.74 (0.19)–1.81 (0.15) |
| 00080050019 Or2 | 2013-04-12 | 780 | 5.9 (0.5) | 1.85 (0.02)–1.93 (0.02) | 0.13 (0.05)–0.26 (0.05) | 1.86 (0.37)–1.95 (0.30) |
| 00080050019 Or7 | 2013-04-13 | 720 | 3.3 (0.3) | 1.85 (0.01)–1.93 (0.01) | 0.24 (0.03)–0.36 (0.03) | 1.40 (0.06)–1.62 (0.05) |
| 00080050019 Or8 | 2013-04-13 | 780 | 4.3 (0.3) | 1.91 (0.02)–1.97 (0.02) | 0.23 (0.03)–0.35 (0.04) | 1.15 (0.07)–1.34 (0.07) |
| 00035014063 Or2 | 2013-04-14 | 840 | 1.9 (0.4) | 1.68 (0.01) | 0.16 (0.03) | 10.00 (2.18) |
| 00035014083 | 2013-12-13 | 970 | 4.4 (0.4) | 1.83 (0.02)–1.92 (0.02) | 0.12 (0.05)–0.27 (0.05) | 1.78 (0.05)–3.16 (0.28) |
| 00035014087 | 2013-12-23 | 970 | 4.3 (0.9) | 2.33 (0.02) | 0.15 (0.05) | 0.08 (0.02) |
| 00035014159 | 2015-01-11 | 970 | 4.6 (0.8) | 1.87 (0.03)–1.93 (0.03) | 0.27 (0.06)–0.44 (0.06) | 1.30 (0.13)–1.47 (0.14) |
| 00035014173 | 2015-02-06 | 860 | 6.7 (1.4) | 1.89 (0.03)–1.93 (0.02) | 0.15 (0.05)–0.27 (0.06) | 1.60 (0.16)–1.70 (0.16) |
| 00035014235 | 2015-06-17 | 970 | 2.2 (0.5) | 2.30 (0.02)–2.34 (0.02) | 0.29 (0.06)–0.38 (0.05) | 0.27 (0.05)–0.40 (0.06) |
| 1ES 1959650 | ||||||
| 00035025224 | 2016-05-09 | 720 | 6.2 (1.4) | 1.94 (0.04) | 0.18 (0.07) | 1.47 (0.18) |
| Mrk 501 | ||||||
| 00035023022 | 2014-05-07 | 830 | 8.8 (1.7) | 1.89 (0.03)–1.92 (0.03) | 0.12 (0.07)–0.13 (0.06) | 2.15 (0.41)–2.65 (0.43) |
| PKS 2155-304 | ||||||
| 00030795082 | 2011-07-15 | 0.78 | 15.8 (1.0) | 2.33 (0.02) | 0.32 (0.06) | 0.31 (0.06) |
Table 2.
Summary of the 0.3–10 keV sub-hour IDVs observed in bright HBLs on timescales longer than 1 ks with Swift-XRT. In Column (1), “Or” stands for “Orbit”. The third column gives the total length of the particular observation; Columns (5)–(7) give the ranges of the photon index, the curvature parameter and the position of the synchrotron SED peak.
| ObsID (s) | Dates | T (h) | a | b | (keV) | |
|---|---|---|---|---|---|---|
| (1) | (2) | (3) | (4) | (5) | (6) | (7) |
| Mrk 421 | ||||||
| 00030352006 Or1 | 2006-04-26 | 0.33 | 7.1 (0.6) | 1.89 (0.02)–1.94 (0.02) | 0.10 (0.04)–0.18 (0.05) | 1.71 (0.16)–2.02 (0.18) |
| 00030352013 Or15 | 2006-06-21 | 0.67 | 2.4 (0.4) | 1.93 (0.02)–1.96(0.02) | 0.07 (0.04)–0.19 (0.04) | 1.53 (0.14)–3.16 (0.25) |
| 00030352077 | 2008-02-15 | 0.42 | 3.3 (0.5) | 2.07 (0.02)–2.09 (0.09) | 0.10 (0.04)–0.26 (0.05) | 0.35 (0.06)–0.73 (0.08) |
| 00030352099 Or7 | 2008-06-12 | 0.57 | 2.8 (0.2) | 1.62 (0.02)–1.75 (0.02) | 0.14 (0.04)–0.25 (0.04) | 5.01 (0.32)–10.86 (0.71) |
| 00030352155 Or1 | 2009-11-12 | 0.53 | 5.3 (0.3) | 1.55 (0.02)-1.62 (0.02) | 0.17 (0.04)–0.34 (0.04) | 4.59 (0.39)–13.11 (1.35) |
| 00030352176 Or1 | 2010-01-11 | 0.28 | 5.3 (0.6) | 2.13 (0.02)–2.19 (0.02) | 0.34 (0.05)–0.42 (0.05) | 0.53 (0.06)–0.70 (0.08) |
| 00030352181 | 2010-01-16 | 0.33 | 3.5 (0.6) | 2.12 (0.02)–2.17 (0.02) | 0.18 (0.04)–0.27 (0.04) | 0.34 (0.05)–0.60 (0.06) |
| 00030352183 Or1 | 2010-01-17 | 0.30 | 2.7 (0.7) | 2.17 (0.02)–2.21 (0.02) | 0.14 (0.04)–0.19 (0.04) | 0.18 (0.04)–0.36 (0.05) |
| 00031630001 Or1 | 2010-02-18 | 0.30 | 5.8 (0.4) | 1.79 (0.02)–1.86 (0.02) | 0.24 (0.04)–0.41 (0.04) | 1.72 (0.12)–2.49 (0.19) |
| 00031630001 Or2 | 2010-02-18 | 0.37 | 2.8 (0.4) | 1.81 (0.02)–1.87 (0.02) | 0.25 (0.04)–0.34 (0.04) | 1.72 (0.13)–2.07 (0.16) |
| 00031630002 Or2 | 2010-02-19 | 0.40 | 2.2 (0.4) | 1.88 (0.02)–1.93 (0.02) | 0.14 (0.04)–0.26 (0.04) | 1.49 (0.11)–1.85 (0.13) |
| 00031630003 Or4 | 2010-02-20 | 0.30 | 2.4 (0.5) | 1.83 (0.02)–1.89 (0.02) | 0.21 (0.04)–0.30 (0.04) | 1.78 (0.13)–2.08 (0.16) |
| 00031202046 | 2010-12-03 | 0.37 | 4.2 (0.2) | 2.24 (0.02)–2.70 (0.02) | 0.53 (0.06)–0.57 (0.06) | 0.56 (0.08)–0.62 (0.08) |
| 00080050001 Or1 | 2013-01-02 | 1.60 | 6.9 (0.8) | 2.81 (0.02) | 0.33 (0.07) | 0.06 (0.04) |
| 00035014033 Or5 | 2013-01-15 | 1.56 | 8.0 (0.8) | 2.49 (0.02) | 0.33 (0.06) | 0.20 (0.06) |
| 00035014034 Or2 | 2013-01-15 | 1.32 | 7.2 (0.9) | 2.42 (0.02) | 0.19 (0.06) | 0.08 (0.07) |
| 00035014040 | 2013-02-01 | 1.08 | 4.0 (0.8) | 2.28(0.02) | 0.18 (0.05) | 0.17 (0.08) |
| 00080050005 Or3 | 2013-02-12 | 1.44 | 3.1 (0.7) | 2.40 (0.02) | 0.10 (0.04) | 0.01 (0.02) |
| 00080050005 Or5 | 2013-02-12 | 1.74 | 5.7 (0.9) | 2.41 (0.03) | 0.14 (0.07) | 0.03 (0.06) |
| 00080050005 Or6 | 2013-02-12 | 1.62 | 3.2 (0.6) | 2.49 (0.02) | 0.12 (0.04) | 0.01 (0.01) |
| 00080050006 Orb1 | 2013-02-14 | 1.66 | 3.3 (0.8) | 2.49 (0.02) | 0.14 (0.04) | 0.02 (0.02) |
| 00080050011 Or4 | 2013-03-11 | 1.44 | 6.9 (0.7) | 2.57 (0.01) | 0.23 (0.04) | 0.06 (0.03) |
| 00080050013 Or6 | 2013-03-17 | 1.56 | 4.6 (1.0) | 2.32 (0.03) | 0.19 (0.03) | 0.14 (0.09) |
| 00032792001 Or1 | 2013-04-11 | 1.56 | 2.6 (0.6) | 2.26 (0.02)–2.36(0.02) | 0.17 (0.05)–0.25 (0.05) | 0.09(0.06)–0.26(0.07) |
| 00080050018 Or2 | 2013-04-12 | 1.20 | 3.3 (0.3) | 1.83 (0.02)–1.93 (0.02) | 0.10 (0.03)–0.22 (0.04) | 1.97(0.16)–2.97(0.33) |
| 00080050018 Or3 | 2013-04-12 | 1.56 | 2.7 (0.3) | 1.90 (0.02)–1.97 (0.02) | 0.17(0.03)–0.27 (0.04) | 1.14(0.07) - 1.56(0.11) |
| 00080050018 Or4 | 2013-04-12 | 1.68 | 5.2 (0.3) | 1.89 (0.02)–1.97 (0.02) | 0.18 (0.05)–0.38 (0.05) | 1.21(0.11)–1.78(0.17) |
| 00080050018 Or5 | 2013-04-12 | 1.68 | 1.4 (0.3) | 1.87 (0.02)–1.93 (0.02) | 0.24 (0.03)–0.36 (0.03) | 1.38 (0.09)–1.70 (0.13) |
| 00080050018 Or6 | 2013-04-12 | 1.62 | 2.3(0.4) | 1.89(0.03)–1.94(0.03) | 0.11(0.05)–0.27(0.05) | 1.53(0.12)–1.97(0.34) |
| 00080050019 Or3 | 2013-04-13 | 1.50 | 4.4 (0.2) | 1.82 (0.02)–1.90 (0.02) | 0.21 (0.05)–0.32 (0.04) | 1.59 (0.13)–1.93 (0.16) |
| 00080050019 Or4 | 2013-04-13 | 1.56 | 2.5 (0.3) | 1.80 (0.2)–1.91 (0.01) | 0.17 (0.06)–0.32 (0.06) | 1.57 (0.11)–1.97 (0.30) |
| 00080050019 Or5 | 2013-04-13 | 1.62 | 1.8 (0.4) | 1.81 (0.04)–1.93 (0.02) | 0.19 (0.05)–0.47 (0.07) | 1.38 (0.10)–1.78 (0.22) |
| 00080050019 Or6 | 2013-04-13 | 1.56 | 2.2 (0.4) | 1.91 (0.02)–1.98 (0.02) | 0.18 (0.04)–0.25 (0.05) | 1.14 (0.10)–1.64 (0.17) |
| 00032792002 Or3 | 2013-04-14 | 1.50 | 6.0 (0.3) | 2.08 (0.02)–2.14 (0.02) | 0.20 (0.04)–0.33 (0.05) | 0.48 (0.06)–0.76 (0.04) |
| 00032792002 Or4 | 2013-04-14 | 1.68 | 2.5(0.4) | 2.19 (0.01)–2.25(0.01) | 0.22 (0.04)–0.29 (0.04) | 0.27 (0.07)–0.44 (0.08) |
| 00035014063 Or3 | 2013-04-15 | 1.32 | 2.7 (0.4) | 1.72 (0.02)–1.80 (0.02) | 0.13 (0.03)–0.20 (0.05) | 4.22 (0.80)–7.81 (2.38) |
| 00035014063 Or4 | 2013-04-15 | 1.14 | 2.4 (0.3) | 1.68 (0.02)–1.74 (0.01) | 0.16 (0.03)–0.23 (0.03) | 4.96 (0.78)–7.50 (1.98) |
| 00035014064 Or6 | 2013-04-16 | 1.67 | 2.6 (0.4) | 2.16 (0.02)–2.21 (0.03) | 0.17 (0.04)–0.27 (0.05) | 0.28 (0.08)–0.57 (0.57) |
| 00035014065 Or2 | 2013-04-17 | 1.08 | 3.6 (0.4) | 2.03 (0.02) | 0.12 (0.05) | 0.75 (0.11) |
| 00035014065 Or3 | 2013-04-17 | 1.50 | 3.1 (0.3) | 1.91 (0.02)–1.97 (0.02) | 0.09 (0.03)–0.15 (0.04) | 1.41(0.18)–2.37(0.42) |
| 00035014065 Or4 | 2013-04-17 | 1.74 | 3.8 (0.3) | 1.95 (0.02) | 0.09 (0.04) | 1.90 (0.37) |
| 00035014065 Or5 | 2013-04-17 | 1.68 | 1.8 (0.4) | 1.91 (0.02)–1.95 (0.02) | 0.11 (0.05)–0.16 (0.04) | 2.05 (0.22)–2.37 (0.41) |
| 00035014065 Or6 | 2013-04-17 | 1.68 | 4.5 (0.3) | 1.86 (0.02)-1.90 (0.02) | 0.11 (0.04) | 2.84 (0.62)–2.87 (0.82) |
| 00035014082 | 2013-12-11 | 0.28 | 2.4 (0.5) | 2.05 (0.02)–2.12 (0.03) | 0.12 (0.05)–0.26 (0.05) | 0.32 (0.05)–0.80 (0.10) |
| 00035014105 | 2014-02-11 | 0.32 | 6.8 (0.9) | 2.31 (0.02) | 0.14 (0.06)–0.15 (0.06) | 0.08 (0.03)–0.09 (0.03) |
| 00035014120 Or2 | 2014-03-27 | 0.40 | 20.5 (0.9) | 2.24 (0.02)–2.31 (0.02) | 0.17(0.05)–0.35(0.05) | 0.12(0.03)–0.47(0.07) |
| 00035014147 Or5 | 2014-04-30 | 0.28 | 4.3 (0.8) | 2.22 (0.02)–2.27 (0.02) | 0.16 (0.06)–0.19 (0.06) | 0.14 (0.03)–0.29 (0.05) |
| 00035014184 | 2015-03-01 | 0.63 | 11.8 (0.9) | 2.21 (0.03)–2.25 (0.02) | 0.15 (0.05)–0.24 (0.07) | 0.15 (0.04)–0.36 (0.06) |
| 00035014197 | 2015-04-01 | 0.42 | 1.6 (0.4) | 1.94 (0.02)–2.04 (0.02) | 0.23 (0.05)–0.37 (0.06) | 0.88 (0.10)–1.21 (0.13) |
| 00035014198 | 2015-04-02 | 0.42 | 5.6 (0.3) | 1.92 (0.02)–2.07 (0.02) | 0.23 (0.04)–0.38 (0.05) | 0.73 (0.08)–1.30 (0.12) |
| 00035014200 | 2015-04-04 | 0.31 | 2.0 (0.4) | 1.92 (0.02)–2.07 (0.02) | 0.23 (0.04)–0.38 (0.05) | 0.73 (0.08)–1.30 (0.12) |
| 00092204002 | 2015-04-28 | 0.28 | 2.8 (0.6) | 2.20 (0.02)–2.32 (0.02) | 0.25 (0.06)–0.36 (0.06) | 0.23 (0.05)–0.57 (0.07) |
| 00035014227 | 2015-05-29 | 0.28 | 3.4 (0.5) | 1.92 (0.02)–2.10 (0.02) | 0.34 (0.06)–0.48 (0.06) | 0.71 (0.09)–1.06 (0.10) |
| 1ES 1959+650 | ||||||
| 00035025230 | 2016-06-04 | 0.28 | 19.6 (2.6) | 1.68 (0.08)–1.93 (0.06) | 0.35 (0.11)–0.77 (0.14) | 1.26 (0.16)–1.61 (0.26) |
| 00035025231 | 2016-06-06 | 0.28 | 5.0 (1.4) | 1.59 (0.05)–1.71 (0.05) | 0.22 (0.09)–0.47 (0.10) | 2.73 (0.32)–4.56 (0.52) |
| 00034888001 | 2016-06-14 | 0.56 | 13.7 (1.4) | 1.57 (0.05)–1.67 (0.05) | 0.25 (0.10)–0.41 (0.08) | 3.35 (0.37)-4.57 (0.58) |
| 00034588005 | 2016-07-01 | 0.28 | 6.0 (1.1) | 1.58 (0.04)–1.64 (0.04) | 0.23 (0.07)–0.36 (0.07) | 3.83 (0.36)–6.06 (0.59) |
Table 3.
Summary of the 3–79 keV IDVs observed in Mrk 421 with NuSTAR. In Column (1), “Or” stands for “Orbit”. The third column gives the total length of the particular observation; Columns (5)–(7) give the ranges of the photon index, the curvature parameter and the position of the synchrotron SED peak.
| ObsID (s) | Dates | T (h) | a | b | (keV) | |
|---|---|---|---|---|---|---|
| (1) | (2) | (3) | (4) | (5) | (6) | (7) |
| Mrk 421 | ||||||
| 600020232010 Or1 | 2013-02-06 | 0.93 | 28.9 (2.4) | 3.08 (0.02) | 0.31 (0.05) | 0.18 (0.08) |
| 600020232010 Or2 | 2013-02-06 | 0.20 | 27.6 (4.9) | 3.08 (0.02) | 0.31 (0.05) | 0.18 (0.08) |
| 600020232010 Or3 | 2013-02-06 | 1.80 | 25.1 (2.4) | 3.08 (0.02) | 0.31 (0.05) | 0.18 (0.08) |
| 600020232012 Or1 | 2013-02-12 | 0.17 | 18.5 (4.0) | 2.82 (0.02) | 0.19 (0.04) | 0.07 (0.05) |
| 600020232016 Or5 | 2013-03-05 | 0.87 | 10.1 (2.2) | 3.09 (0.02) | 0.16 (0.05) | 0.004 (0.008) |
| 600020232018 Or1 | 2013-03-11 | 0.83 | 9.9 (2.2) | 3.20 (0.02) | 0.18 (0.05) | 0.005 (0.008) |
| 600020232020 Or3 | 2013-03-17 | 0.87 | 11.3 (2.1) | 2.84 (0.02) | 0.21 (0.04) | 0.10 (0.05) |
| 600020232025 Or10 | 2013-04-11 | 0.97 | 8.7 (0.7) | 2.68 (0.02)–2.71 (0.02) | 0.17 (0.06)–0.28 (0.06) | 0.09 (0.07)–0.61 (0.21) |
| 600020232025 Or11 | 2013-04-11 | 0.97 | 4.2 (0.6) | 2.61 (0.03)–2.64 (003) | 0.14 (0.08)–0.19 (0.07) | 0.07 (0.10)–0.21 (0.15) |
| 600020232025 Or12 | 2013-04-11 | 0.93 | 6.8 (0.6) | 2.62 (0.03)–2.68 (0.03) | 0.09 (0.07)–0.23 (0.06) | 0.04 (006)–0.39 (0.17) |
| 600020232025 Or13 | 2013-04-11 | 0.90 | 4.4 (0.6) | 2.58 (0.03)–2.67 (0.03) | 0.15 (0.07)–0.26 (0.07) | 0.12 (0.12)–0.51 (0.22) |
| 600020232025 Or16 | 2013-04-11 | 0.67 | 4.5 (0.6) | 2.62 (0.02)–2.64 (0.02) | 0.17 (0.06)–0.37 (0.06) | 0.15 (0.11)–1.41 (0.36) |
| 600020232025 Or19 | 2013-04-11 | 0.30 | 4.9 (0.8) | 2.68 (0.03)–2.78 (0.04) | 0.31 (0.08)–0.57 (0.11) | 0.55 (0.22)–2.07 (0.65) |
| 600020232025 Or21 | 2013-04-12 | 0.47 | 5.5(0.5) | 2.56(0.03)–2.62(0.03) | 0.15(0.07)–0.37(0.07) | 1.15(0.38)–1.88(0.53) |
| 600020232025 Or22 | 2013-04-12 | 0.33 | 3.4(0.7) | 2.62(0.03)–2.66(0.03) | 0.24(0.07)–0.25(0.07) | 0.46(0.22)–0.58(0.26 |
| 600020232025 Or23 | 2013-04-12 | 0.97 | 4.7 (0.2) | 2.65 (0.03)–2.76 (0.03) | 0.20 (0.08)–0.38 (0.08) | 0.24 (0.18)–1.06 (0.31) |
| 600020232025 Or24 | 2013-04-12 | 0.93 | 3.5 (0.4) | 2.73 (0.02)–2.78 (0.02) | 0.31 (006)–0.41 (0.06) | 0.66 (0.20)–1.22 (0.28) |
| 600020232025 Or25 | 2013-04-12 | 0.97 | 5.7 (0.4) | 2.74 (0.02)–2.78 (0.03) | 0.30 (0.06)–0.46 (0.07) | 0.54 (0.17)–1.42 (0.34) |
| 600020232025 Or26 | 2013-04-12 | 0.90 | 5.5 (0.4) | 2.70 (0.02)–2.81 (0.03) | 0.30 (0.06)–0.53 (0.06) | 0.68 (0.21)–2.14 (0.40) |
| 600020232027 Or5 | 2013-04-12 | 0.54 | 4.2 (0.5) | 2.63 (0.02)–2.73 (0.03) | 0.30 (0.06)–0.48 (0.07) | 0.84 (0.27)–1.82 (0.42) |
| 600020232027 Or7 | 2013-04-12 | 0.43 | 2.4 (0.6) | 2.67 (0.04)–2.70 (0.02) | 0.28 (0.06)–0.35 (0.06) | 0.64 (0.23)–1.00 (0.23) |
| 600020232029 Or2 | 2013-04-13 | 0.60 | 4.2 (0.8) | 2.96 (0.04)–2.98 (0.02) | 0.43 (0.09)–0.48 (0.09) | 0.74 (0.25)–1.00 (0.23) |
| 600020232029 Or7 | 2013-04-13 | 0.93 | 7.6 (0.5) | 2.86 (0.03)–2.90 (0.03) | 0.28 (0.08)–0.44 (0.09) | 0.29 (0.15)–0.97 (0.31) |
| 600020232031 Or2 | 2013-04-14 | 0.60 | 4.9 (0.6) | 2.49 (0.02)–2.53 (0.020 | 0.18 (0.06)–0.23 (0.06) | 0.34 (0.19)–0.86 (0.35) |
| 600020232031 Or4 | 2013-04-14 | 0.50 | 4.7 (0.6) | 2.38 (0.02)–2.42 (0.02) | 0.26 (0.06)–0.40 (0.06) | 0.65 (0.38)–2.42 (073) |
| 600020232031 Or5 | 2013-04-14 | 0.47 | 5.2 (0.5) | 2.38 (0.02)–2.42 (0.02) | 0.26 (0.06)–0.40 (0.06) | 1.86 (0.69)–3.16 (0.82) |
| 600020232031 Or6 | 2013-04-14 | 0.43 | 7.8 (0.5) | 2.34 (0.02)–2.39 (0.02) | 0.23 (0.06)–0.45 (0.07) | 1.65 (0.68)–3.98 (0.90) |
| 600020232031 Or7 | 2013-04-15 | 0.93 | 6.0 (0.3) | 2.32 (0.02)–2.40 (0.02) | 0.23 (0.06)–0.47 (0.05) | 1.73 (0.72)–4.35 (0.85) |
| 600020232031 Or8 | 2013-04-15 | 0.97 | 3.9 (0.3) | 2.29 (0.02)–2.37 (0.02) | 0.25 (0.06)–0.42 (0.06) | 2.25 (0.96)–4.00 (1.11) |
| 600020232031 Or9 | 2013-04-15 | 0.93 | 9.3 (0.3) | 2.28 (0.02)–2.35 (0.02) | 0.22 (0.06)–0.44 (0.04) | 2.19 (0.98)–4.33 (0.73) |
| 600020232033 Or2 | 2013-04-15 | 0.57 | 7.8 (0.8) | 2.55 (0.02)–2.62 (0.03) | 0.13 (0.07)–0.17 (0.07) | 0.08 (0.10)–0.15 (0.12) |
| 600020232033 Or7 | 2013-04-16 | 0.93 | 10.5 (0.6) | 2.64 (0.03)–2.71 (0.03) | 0.17 (0.08)–0.33 (009) | 0.13 (0.13)–0.84 (0.36) |
| 600020232033 Or8 | 2013-04-16 | 0.93 | 12.1 (0.7) | 2.76 (0.03) | 0.36 (0.07) | 0.08 (0.04) |
| 600020232035 Or2 | 2013-04-16 | 0.62 | 4.7 (0.9) | 2.66 (0.03) | 0.15 (0.07) | 0.06 (0.07) |
| 600020232035 Or3 | 2013-04-16 | 0.37 | 8.2 (0.9) | 2.59 (0.03) | 0.23 (0.08) | 0.52 (0.29) |
| 600020232035 Or5 | 2013-04-17 | 0.97 | 16.1 (0.5) | 2.40 (0.02)–2.51 (0.03) | 0.11 (0.06)–0.21 (0.07) | 0.38 (0.28)–1.12 (0.58) |
| 600020232035 Or6 | 2013-04-17 | 0.93 | 8.3 (0.4) | 2.42 (0.02)–2.54 (002) | 0.26 (0.06)–0.35 (0.07) | 0.67 (0.28)–2.21 (0.68) |
| 600020232035 Or7 | 2013-04-17 | 0.97 | 6.0 (0.4) | 2.43 (0.02)–2.50 (0.02) | 0.18 (0.06)–0.39 (0.07) | 0.49 (0.27)–2.57 (0.077) |
| 600020232035 Or8 | 2013-04-17 | 0.93 | 5.8 (0.4) | 2.39 (0.02)–2.46 (0.02) | 0.26 (0.07)–0.35 (0.07) | 1.67 (0.69)–2.51 (0.85) |
| 600020232035 Or9 | 2013-04-17 | 0.93 | 10.6 (0.4) | 2.32 (0.02)–2.41 (0.02) | 0.19 (0.06)–0.53 (0.07) | 1.44 (0.72)–4.19 (1.02) |
| 600020232037 Or1 | 2013-04-18 | 0.93 | 11.5 (0.4) | 2.95 (0.05) | 0.28 (0.09) | 0.27 (0.16) |
| 600020232037 Or2 | 2013-04-18 | 0.93 | 7.8 (1.6) | 2.97 (0.04) | 0.44 (0.11) | 0.79 (0.31) |
| 600020232037 Or3 | 2013-04-18 | 0.97 | 10.6 (1.9) | 3.05 (0.05) | 0.30 (0.012) | 0.18 (0.14) |
| 600020232037 Or4 | 2013-04-18 | 0.93 | 14.2 (1.7) | 2.97 (0.04) | 0.27 (0.10) | 0.16 (0.12) |
| 600020232039 Or3 | 2013-04-19 | 0.93 | 11.8 (2.1) | 3.01 (0.02) | 0.13 (0.05) | 0.001 (0.002) |
© 2018 by the author. Licensee MDPI, Basel, Switzerland. This article is an open access article distributed under the terms and conditions of the Creative Commons Attribution (CC BY) license (http://creativecommons.org/licenses/by/4.0/).
Share and Cite
MDPI and ACS Style
Kapanadze, B. Sub-Hour X-Ray Variability of High-Energy Peaked BL Lacertae Objects. Galaxies 2018, 6, 37. https://doi.org/10.3390/galaxies6010037
AMA Style
Kapanadze B. Sub-Hour X-Ray Variability of High-Energy Peaked BL Lacertae Objects. Galaxies. 2018; 6(1):37. https://doi.org/10.3390/galaxies6010037
Chicago/Turabian StyleKapanadze, Bidzina. 2018. "Sub-Hour X-Ray Variability of High-Energy Peaked BL Lacertae Objects" Galaxies 6, no. 1: 37. https://doi.org/10.3390/galaxies6010037
Note that from the first issue of 2016, this journal uses article numbers instead of page numbers. See further details here.