
The Reduction of Static Friction of Rubber Contact under Sea Water Droplet Lubrication

1
College of Mechanical and Transportation Engineering, China University of Petroleum, Beijing 102249, China
2
Laboratory of Tribology and Surface Engineering, China University of Petroleum, Beijing 102249, China
*
Authors to whom correspondence should be addressed.
Lubricants 2017, 5(2), 12; https://doi.org/10.3390/lubricants5020012
Submission received: 29 March 2017
/
Revised: 25 April 2017
/
Accepted: 7 May 2017
/
Published: 12 May 2017
Abstract
:In this work, a series of experimental tests is carried out in laboratory conditions which set the rubber compound (soft and stiff), the normal load, and the direction of propagation of sea water droplets into the interface of rubber–steel pipe contact as variables. The results show that the maximum static frictions (F) of rubber–pipe contacts increase as the normal load increases in both dry and lubricating conditions, and the values of F for the softer rubber are higher than that for the stiffer rubber. However, significant reduction in static friction is found due to the lubrication of sea water droplets. The influence of lubrication is stronger when the droplets propagate into the contact interfaces at the tail edge than that at the front edge. Capture sequences of the contact region facilitate the lubrication of seawater droplets by accelerating the progress of separation in the contact interfaces, thus reducing the static friction force. This investigation improves our understanding of the lubrication of sea water droplets during pipe-laying operation, and it will help us to conduct further research on the accuracy and safety of offshore engineering.
1. Introduction
Rubber-like materials are widely applied in many engineering fields such as sealing, tire and offshore installation due to their strong mechanical properties, wear resistance and anti-corrosion [1,2,3,4]. Tribological behaviors of rubber-like materials in soft contact have been investigated both experimentally and theoretically in the last several decades. It is well known that the friction force of rubber is derived as the product of the total area of the real contact. The friction forces of rubbers on steel increase with normal load, because of the increase in real contact area resulting from the deformation of rubber asperities [5]. Persson [6] presented a discussion on how the resulting friction force depends on the nature of the real contact.
The adhesion effect plays a very important role in affecting rubber friction on certain contact conditions. According to Schallamach [7] and Barquins [8], the friction force is velocity dependent and takes a maximum value around a few centimeters per second. Johnson and Greenwood [9] revealed an adhesion map for choosing appropriate mechanical models as a solution of the adhesion between elastic spheres. Schwarz [10] gave a generalized analytical model for the elastic deformation of adhesive contact between a sphere and a flat surface.
In addition, static frictional contacts between rubber and rigid materials have been widely studied and the adhesion effect and viscoelastic properties of rubber cannot be neglected. Galligan et al. [11] discussed the nature of static friction and creep. Roberts and Thomas [12] tested the static friction of smooth clean vulcanized rubber. Loeve et al. [13] investigated the static friction of stainless steel wire rope–rubber contacts. Deladi et al. [14] modeled the static friction for contact between rough rubber and metal surfaces. As described in several works by Barquins et al [15,16], Savkoor [17,18] or more recently by Scheibert et al [19] or Audry and co-workers [20], the static friction of rubber contacts involves complex peeling and micro-slip phenomena which deserve a fracture mechanics description.
Moreover, rubber-like materials sliding against rigid metals under wet conditions is a common process for many engineering applications [21,22,23,24]. The frictional behaviors of rubber-like materials with liquid lubricant are of great importance for steady performance and safety of the equipment. Therefore, many authors have focused on water lubricating rubber contacts. The well-known Stribeck curve helped us to identify the lubrication regime for each specific contact condition [25]. J. K. Lancaster reviewed the friction and wear performances of polymers sliding on metal with water lubrication; he suggested complicated trends of friction forces due to the interaction between adhesion and surface properties [26]. Roberts also explained that the mechanical properties of the vulcanized rubber were modified by liquid absorption [27]. Persson et al. took the phenomenon of water entrapment into the context of tire rubber-road contact [28]. A. Koenen et al. revealed several influencers on the friction properties of wiper blade and windscreen contact [29]. Moreover, the special contribution to friction by thin water film under high contact pressure has been observed in several studies at nanoscale [30].
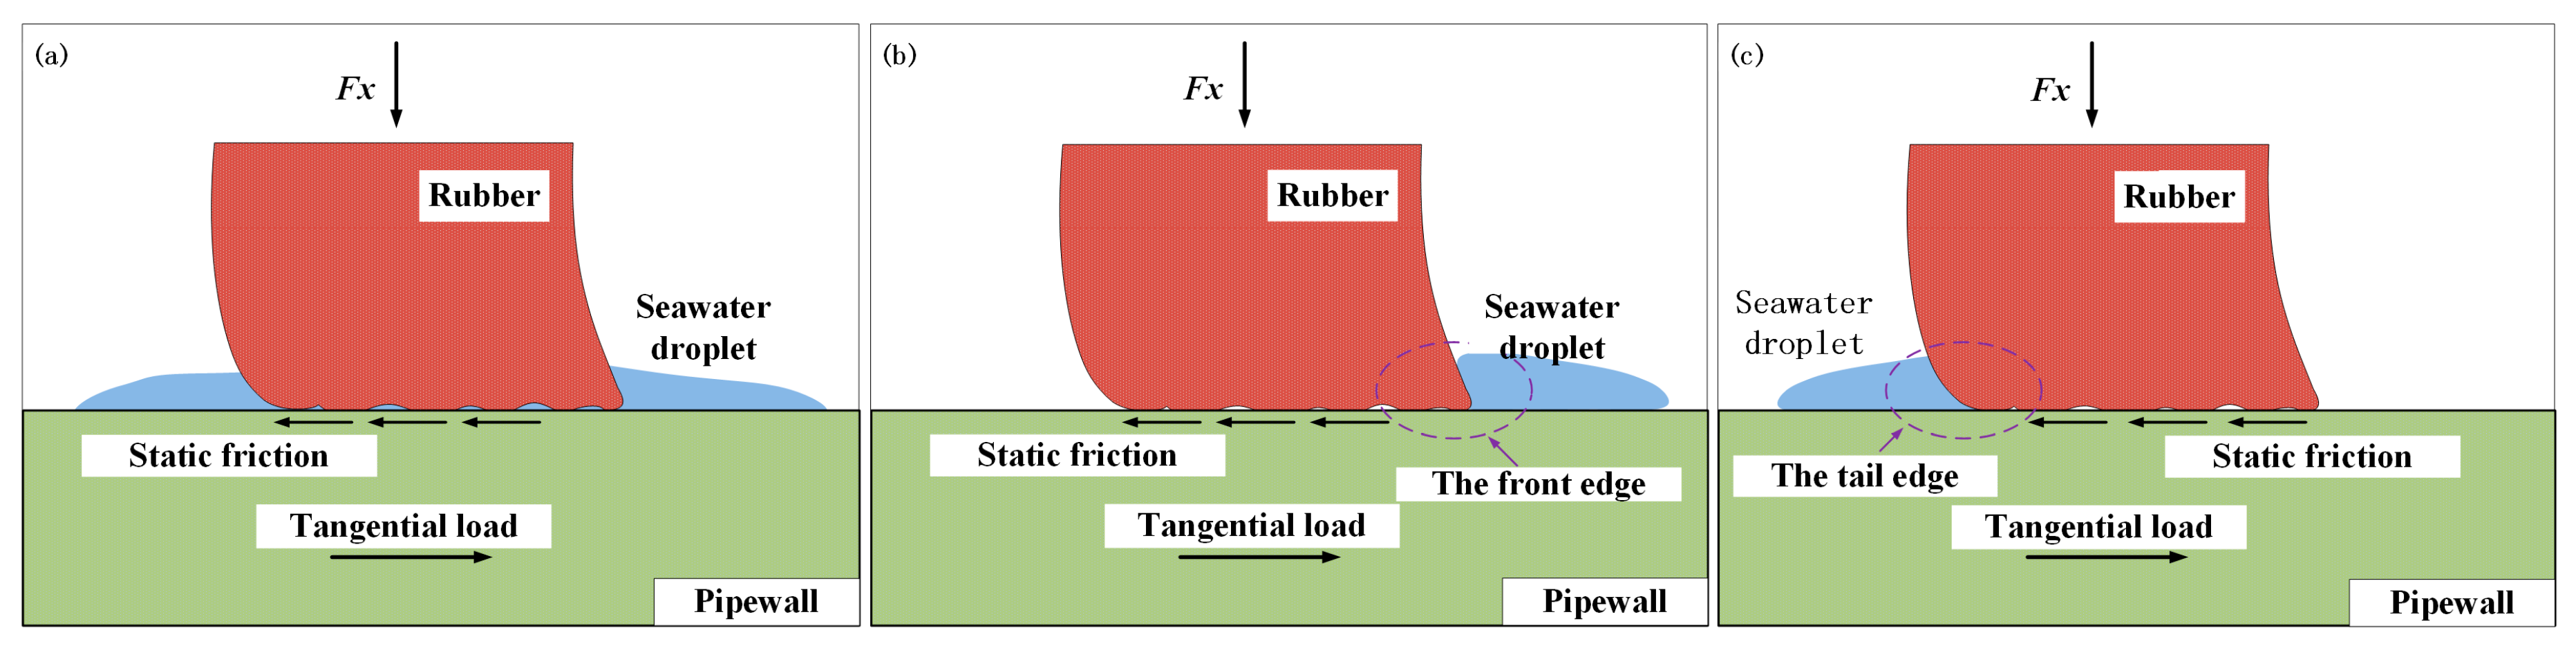
However, despite this progress, the project of static frictional behaviors of soft-rigid contact during the deep-water pipe-laying operations has rarely been discussed. Deep-water pipe-laying is known as a standard industrial process for the installation or maintenance of offshore equipment [31,32,33,34]. It is inevitable that sea water droplets will splash on the pipe surface during pipeline installation. The frictional behaviors of the soft contact between the rubber block and pipe with sea water droplets are of importance for the accuracy and safety of the pipe-laying operation. Three main kinds of contact situations between rubber and pipe with the lubrication of sea water droplets are schematically shown in Figure 1. Sea water droplets can splash at the central, front and tail parts of contact. In this study, a series of experiments for soft rubber–rigid pipe contact with the lubrication of sea water is carried out with a home-built friction instrument based on the three fundamental lubricating conditions, with the aim of investigating the static friction behaviors under different lubricating processes. The evolution of the contact area caused by increasing the tangential load has been discussed in detail. Furthermore, comparison of the effect of sea water droplets for each condition has been discussed.
2. Experimental
2.1. Samples
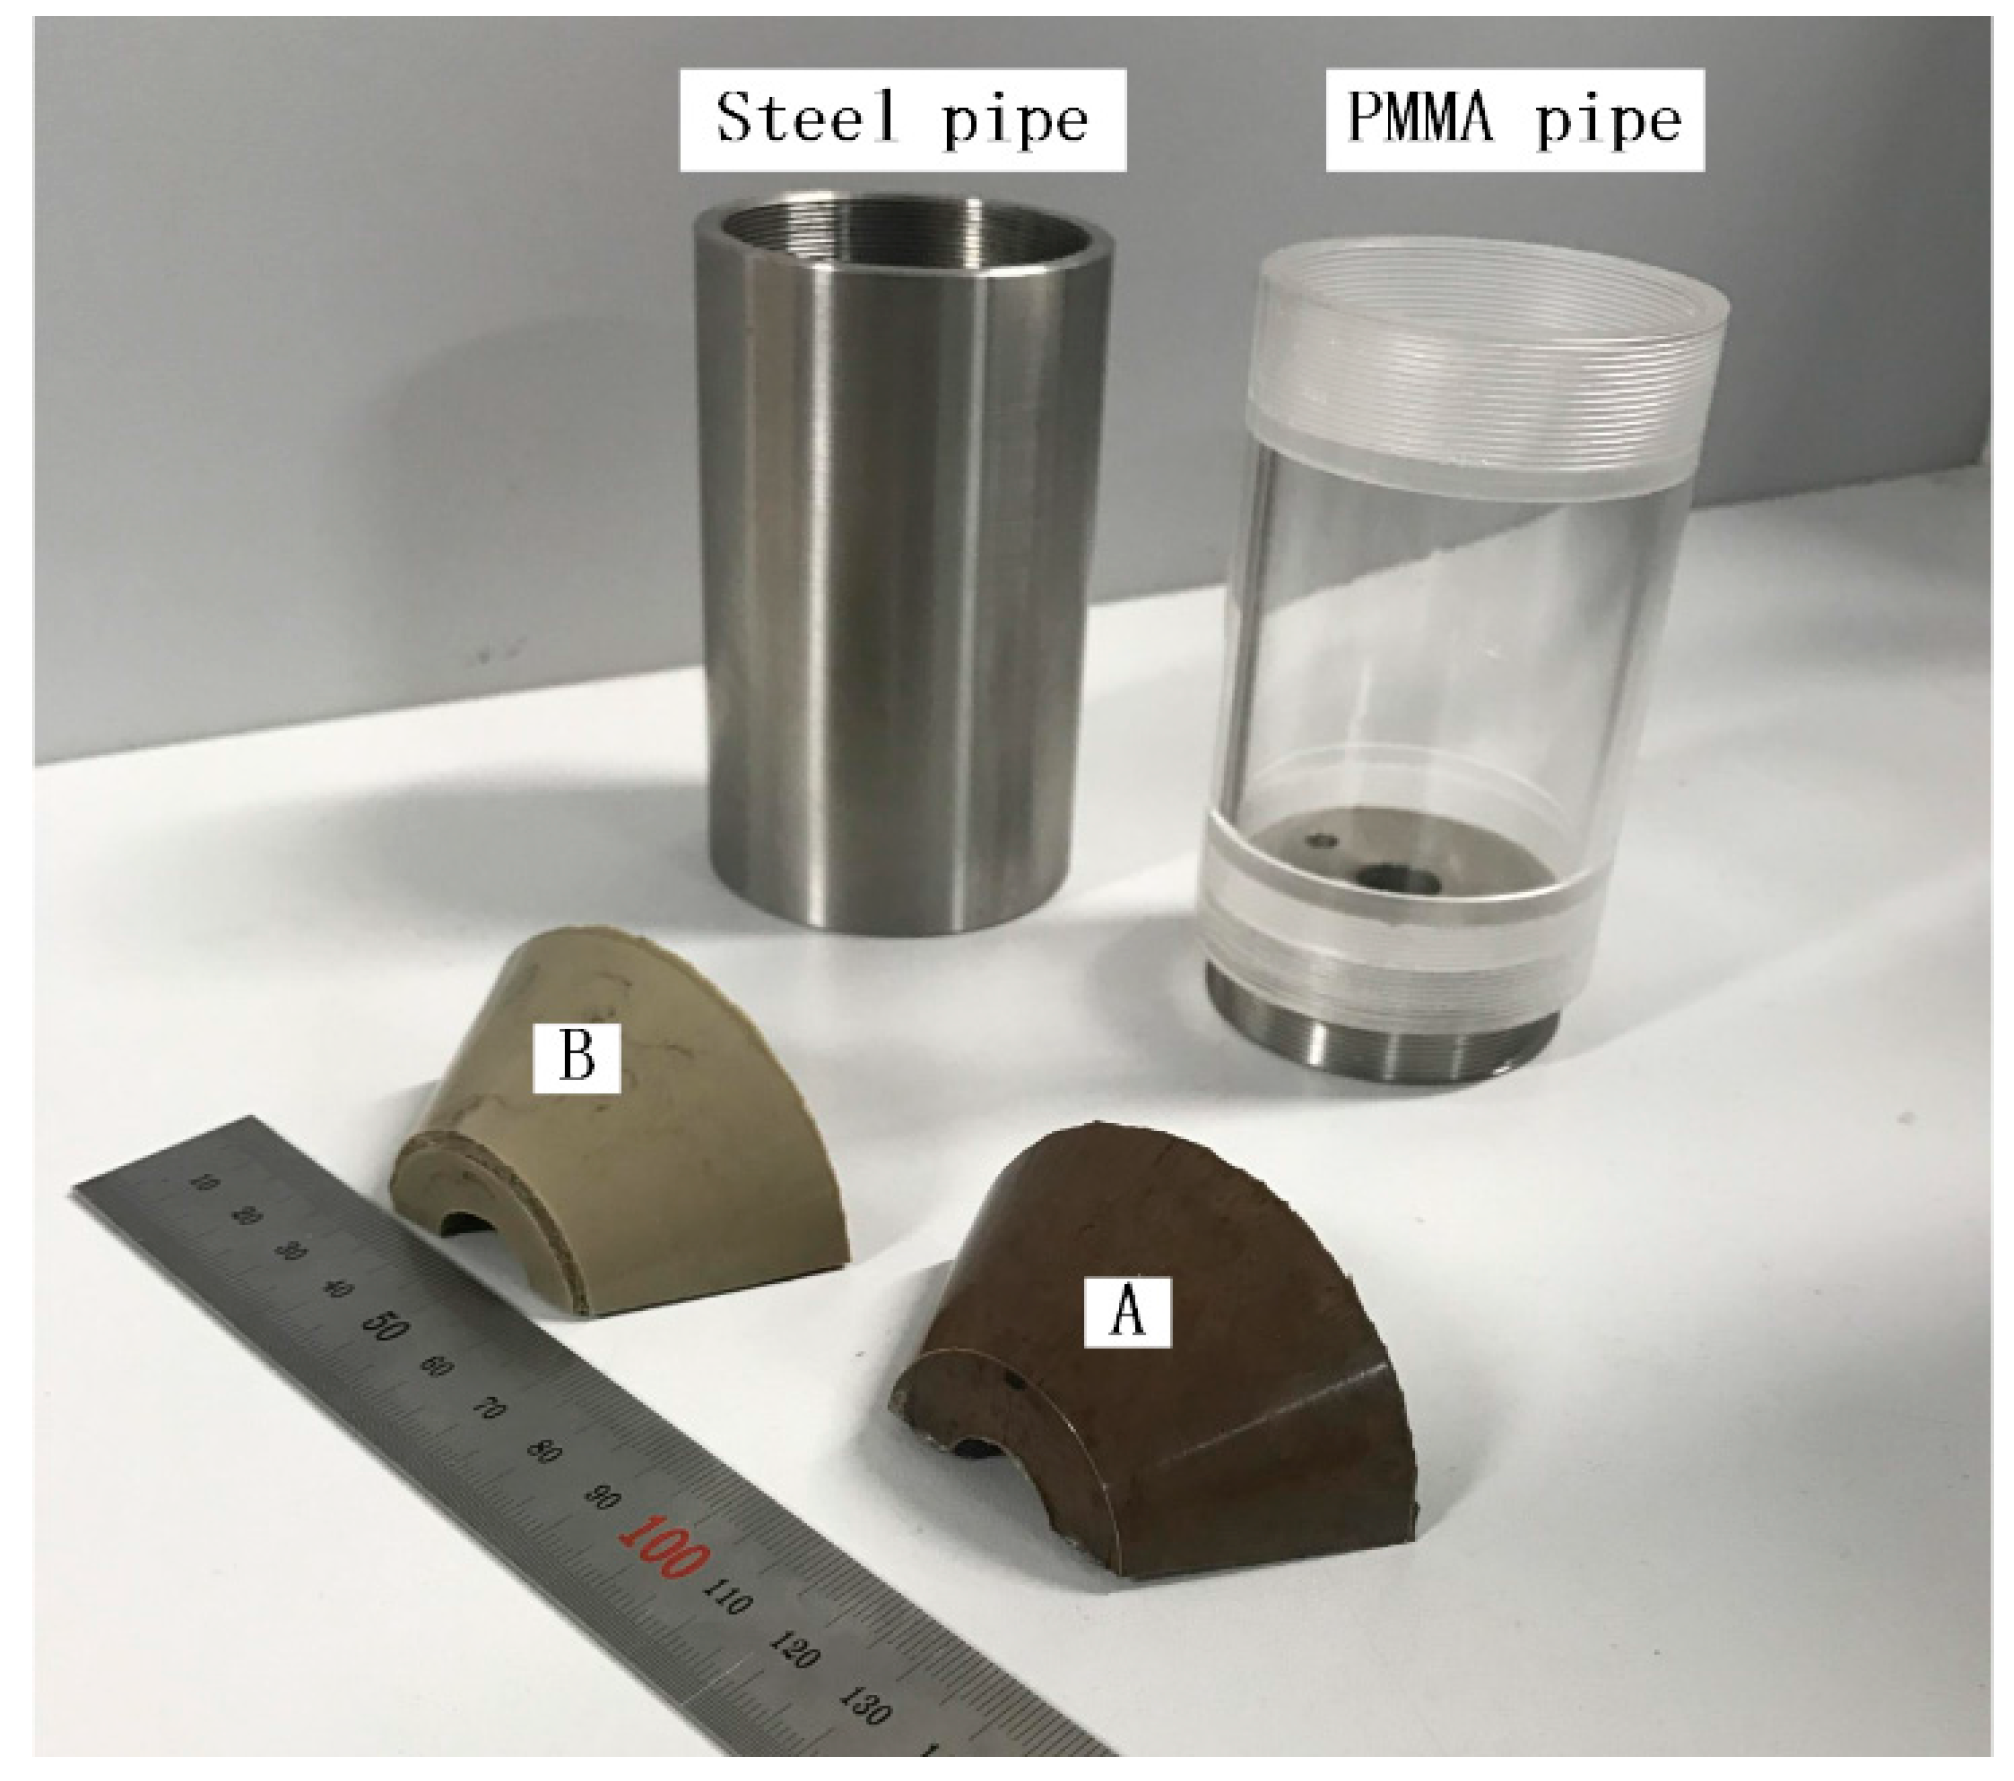
Figure 2 illustrates the shapes of rubber and pipe samples. A special mould is used to manufacture vulcanized rubber samples in the shape of a half oblique frustum cone, to simulate the contacting conditions of rubber blocks in tension with the pipe wall during the pipe-laying process. Meanwhile, the surface of the mould is polished to unify the surface roughness of the rubber sample. Uniaxial tensile tests are carried out using a universal test machine (model Lina™ WDTII-20, Shenzhen Lina Instrument Technology CO., Ltd., Shenzhen, China) according to the standard ISO 37:1994. The crosshead displacement rate is set at 500 mm/min, and the initial separation distance between two clamp holders is 36 mm. The hardness of samples is tested by a LX-A tester according to the standard ISO 7619:2004. Specific corresponding parameters of rubber and pipe samples are listed in Table 1.
Six black lines are drawn on the surface of the rubber with a marker pen to identify the deformation differences in the contact area. When normal and tangential load are applied to the rubber–pipe contact system, each black line will bend due to the shearing deformation of the rubber surface. The extent of the bend of the black line indicates the level of shear stress at that location. The higher the shear stress level, the greater the extent of bend of the black line. Therefore, the distribution of shear stress on the surface of the rubber can be deduced qualitatively by identifying the different extents of bend of the black lines. Even though the marker pen ink contributes negligibly to the test records, the relative displacement of the contact surfaces can be noticed when the ink moves away from the black line.
It is necessary to note that the major difference between rubber A and B is the elastic modulus which is resulted from the different densities of the crosslink [35]. Therefore, the two rubber samples behave remarkably differently in the viscoelastic aspect. Moreover, the surfaces of both kinds of pipe samples are polished designedly to unify the roughness of them. Therefore, the influence of the surface roughness difference is not discussed in this study.
2.2. Tribological Instrument
A schematic diagram of the tribological instrument is shown in Figure 3. The instrument mainly consists of three components: normal loading module; rubber-pipe contact testing module; and tangential loading module. Normal load is applied to the rubber samples via the lever arm. The pipe sample is mounted at the top of the linear slide rail so that it can slide in the Y-direction smoothly. It is necessary to note that the coefficient of friction (COF) of the linear slide rail without normal loading is nearly 0.12, and it will not increase so much (5%) when the range of the normal load is from 0 N to 100 N. The tangential load is driven by a motor and reducer through wire rope which connects the sides of the pipe and reducer. A spring is used to eliminate rigid motional tendency and vibration which are caused by the running of the motor and reducer. The normal load and tangential load are detected by force sensors. The displacement of pipe is tested by a laser displacement sensor (model Panasonic™ HG-C1030L; Panasonic industrial devices SUNX Suzhou CO., Ltd., Suzhou, China) which is mounted on the base of the instrument. All testing data is recorded in a computer.
In order to observe the frictional behaviors of the contact area between rubber and polymethyl methacrylate (PMMA), the portable video camera (model Supereys™ A005; Shenzhen Deyufu Instrument Technology CO., Ltd., Shenzhen, China) is positioned perpendicular to the contact surface across the PMMA pipe. This digital camera provides a macroscopic recording in a whole test run.
2.3. Experimental Procedures
A contact area is formed between rubber and pipe samples when normal load is applied to the rubber-pipe contact system. Then, tangential load starts to be imposed with a pre-set constant increasing rate. As tangential load is continuously increasing, macroscopic slip between the surface of the rubber and pipe takes place. The increasing rate of tangential load can be controlled by altering the output rotation speed of the motor and reducer.
A series of tests was carried out to investigate the effect of the lubrication of sea water droplets in the rubber-steel contact system. The combinations of parameters are given in Table 3.
Specifically, procedures of injecting sea water into the contact system for the three fundamental lubricating conditions are slightly different. In order to lubricate the central part of contact, sea water is sprinkled onto the surface of the pipe before rubber is squeezed on the pipe in normal direction. The amount of sea water should be sufficient to ensure that a steady water film region is spread on the surface of the pipe to cover the contact area completely. On the contrary, for lubricating conditions which are at the front part and tail part of the contact system, sea water is applied to the front edge and the tail edge of contact respectively after the contact area is stably formed.
Simultaneously, other groups of tests with the same independent variables between rubber and PMMA pipe were carried out to uncover the similarities between rubbers in contact with steel and PMMA. Moreover, digital recordings were exploited to investigate the behaviors of the contact areas between rubber and PMMA samples.
At the beginning of a test, only normal load was applied, and maintained for 180 s without changing any other parameter of the test. The procedure was operated before tangential load was applied to ensure the same normal loading condition. During this time, the radius of the contact area increases gradually to the maximum value and becomes unchanged; the principle of the changing contact radius is revealed by Lee and Radok who took the creep property of the rubbery material into account in studying soft-rigid contact [37]. Furthermore, maintaining the unloading time above three minutes between each test run considerably minimizes the repetition effects during tests including viscoelastic rubber samples [38].
After finishing the first test run, we needed to unload the samples and move the pipe to the initial position for the second test run. The residual sea water on the counter surfaces was removed artificially. It is necessary to note that tangential force data tend to be stable after seven successive test runs. As a consequence, 10 runs for each variable combination were carried out and the last three groups of data are regarded as test values to eliminate the deviation of data at the initial stage of the test [39].
The temperature and relative humidity of the laboratory remained at 25 °C (StDev 0.1–0.5) and 40% (StDev 3–5%) respectively throughout the tests via central air-conditioning.
2.4. Confirmation of the Maximum Static Friction
Figure 4a illustrates a combination of test records of the rubber A-steel contact system for the central part lubricating condition. These tests are carried out at 10 N normal load with increasing rates of tangential load at 0.062 N/s and 1.5 N/s, respectively. The results are reproducible for each combination of normal load and increasing rate of tangential load which are tested.
A local enlargement of a single testing curve is shown in Figure 4b to demonstrate how the maximum static friction and maximum partial displacement are confirmed. At the beginning of the test, the tangential load curve starts to increase with a constant increasing rate. The entire curve does not show any significant fluctuation until a sudden drop emerges from the top of the curve. The displacement curve also shows a surprising increase at the same time. This time point is chosen as the instant of macroscopical slip, and the values of tangential load and displacement at that time point are treated as the maximum static friction and the maximum partial displacement, respectively.
3. Results
3.1. The Maximum Static Friction
All the test results are shown with the maximum static frictions in respect to rubber types; dry and lubricating conditions; normal loads; and increasing rates of tangential load.
A series of maximum static frictions (F) of rubber A and B in contact with steel for dry and lubricating conditions is plotted in Figure 5a,b, respectively. In general, the trends of F for each testing condition are the same; values of F increase with increasing normal load. It is obvious that the friction of each test decreases when sea water is added into the central part of rubber-steel contact systems. Sea water shows strong lubrication ability to reduce friction levels with quite a high proportion. The lubrication of seawater is more active for rubber A than that for rubber B. When compared with dry conditions, the proportion for rubber A ranges from 30% to 45%, while for rubber B, the range is 5–30%. The only exception takes place for the rubber B test which is below 10 N normal load with an increasing rate of tangential load at 1.5 N/s.
Another comparison can be easily seen for rubber A tests for which friction levels, with an increasing rate of tangential load at 1.5 N/s, are always higher than that with an increasing rate of tangential load at 0.062 N/s. Difference of friction levels between the two different tangential loading conditions is not quite apparent at 10 N and 20 N normal load conditions. However, the difference increases as normal load increases.
Even though almost the same tendency is shown in tests of rubber B, the difference of friction levels between two tangential loading conditions stays at a low proportion range. Moreover, when normal load is 40 N, the lubricated friction for the 1.5 N/s increasing rate of tangential load is lower than that for the 0.062 N/s rate.
3.2. Efficiency of Lubrication
In order to investigate the different lubricating conditions in the central, the front and the tail contact part, we set α as a ratio of the efficiency of the three lubricating conditions. The α is denoted as a simple function that
where Flx includes Flc, Flf and Flt; these three factors represent the maximum static friction of rubber-steel contact under each of the three lubricating conditions, respectively. Flc can be seen as the reference value to examine the lubrication efficiency for the other two typical lubricating conditions. Therefore, the values of α for the central part of the lubricated tests constantly equal 1. The higher value of α reveals higher friction; therefore, the lubrication efficiency is not as good as that for the central part lubricating condition. Values of α for the other two typical lubricating conditions which are under different loading processes are shown in Figure 6.
Figure 6a represents a combination of values of α for rubber A tests. Apparently, most of the values of α for the tail part lubricating conditions are lower than that for the front part conditions, except for only one test which is under 10 N normal load with a 0.062 N/s increasing rate of tangential load. This phenomenon means that lubrication at the tail part of contact is commonly more active than that at the front part of contact. The values of α in the most tests exceed 1, it indicates that the levels of lubrication at the two side parts are lower than that at the central part.
In Figure 6b, some similar trends are observed, for example, lubrication at the tail part of contact behaves more vigorously than that at the front part for the rubber B contact system. Lubrication at the central part is also more active than that at the other side parts.
3.3. Deformation of Contact
The pictures of contact are extracted frame by frame from testing video files (video format: 1600 × 1200 pixels, 24 bit, 60 frames per second). We select the image which represents the typical shape of the contact region for each deformation phase of the rubber sample. In order to highlight the deformation of the contact region, we keep the image of contact at the center of the picture and crop the picture to 200 × 200 pixels. Therefore, a series of pictures is demonstrated in Figure 7, Figure 8 and Figure 9 to identify the evolution of the contact region throughout the tests of three typical lubricating conditions.
Firstly, the evolution of contact for the central part lubricating condition is shown in Figure 7. Sea water has spread onto the pipe surface and has formed a stationary lubricating film before rubber is normal loaded against to the pipe. Figure 7a illustrates steady contact between the rubber and pipe with seawater lubrication after a certain time which is mentioned in the experimental procedures section. As soon as the tangential load is imposed, the shape of the contact area starts deforming. At the beginning of tangential loading, as shown in Figure 7b, the white arrows indicate that the front edge of contact shrinks backward slightly, while the rear edge expands smoothly. The red arrow is pointing in the opposite shearing direction to the rear edge of the contact region. It is obvious that the scale of deformation at the front edge is slightly lower than that at the rear edge. This phenomenon of contact can be regarded as a consequence of integral elastic deformation of the rubber sample. The bend of line 2 which is shown in Figure 7c indicates that the rubber surface, at the rear edge of contact, is moving towards with pipe and no relative displacement of counter surfaces takes place during this status. The increasing bend of line 2 in Figure 7d reveals remarkable shear of the surface of rubber due to the continuously increasing tangential load. Relative displacement of the counter surfaces is observed within the yellow dotted ovals, as shown by partial traces of ink which are separated from the black marker pen lines. As long as the tangential load is increasing, more and more separations of partial traces of ink appear within the apparent contact area (Figure 7e). The bend at the rear edge of contact is more distinct than that at the front edge. Finally, as soon as the contact separations occupy most of the contact region, macroscopic slip emerges (Figure 7f).
4. Discussion
There are two major factors that influence friction levels not only in the sliding condition but also in the static contact system [40]. The principal factor is the adhesion force between the counter surfaces, which primarily influences the level of friction. The second factor is the viscoelastic property of rubber, which can be seen as an inherent response to external environmental conditions. In this study, adhesion force is still playing a very important role which affects the levels of static friction within the real contact area.
In most of the tests, values of F at the 1.5 N/s increasing rate of tangential load are higher than that at 0.062 N/s. This phenomenon may be caused by the viscoelastic property of rubber. The explanation is based on previous research by Schallamach [7] and Barquins [8]. Adhesion load increases as relative displacement velocity increases, however, the end of the adhesion phase decreases. Therefore, it is deduced that there is a critical speed for which the friction takes the maximum value. The relative displacement velocities in our tests are apparently lower than the critical speed; therefore, the friction increases with a higher increasing rate of tangential load. This phenomenon can also indicate that the viscoelastic property of rubber still works at the level of static friction for lubricating conditions.
The lubrication of water has complicated influences on the static friction level of rubber. The water film can be entrapped within the apparent contact area due to the convenient elastic deformation of rubber [27]. The sealing effect of the water film is introduced when the rubber is normal against the rough surface of the substrate [28]. The entrapment of water and the sealing effect belong to the essential principle that the water film, within the apparent contact area, supports the normal load and smoothens the counter surfaces, consequently leading to a reduction of adhesion force in the contact system, thus reducing the rubber friction [41]. However, the thin water film and the tacky condition may generate the influence of the capillary effect. The capillary effect establishes capillary bridges among the surface asperities of rubber and the water film, resulting in the enhancement of adhesion and resistance to shear [42]. Therefore, the lubrication of water has two opposite effects on rubber friction based on the certain investigating condition. It is known that a sufficient amount of water leads to the large thickness of the lubricating film and the complete wetting condition. The capillary effect cannot be highlighted during such a testing situation in our study.
4.1. The Central Part Lubrication
The Stribeck curve provides guidance to identify the lubricating regime in the central part wetting tests. Even though the tests aim to investigate the static frictional behaviors of rubber, and no macroscopical displacement takes place during most tests, the relative partial displacement emerges as soon as the tangential load is imposed. Therefore, the contact system can be seen as an assemblage of the real contact area surrounded by a circle of the partial sliding zone. We can deduce the relative sliding velocity at the level of a few centimeters per second due to the displacement–time curves. We can clearly conclude that the central part lubrication is belong to the scope of boundary lubrication. In the boundary regime, water lubrication follows the principle of reducing the static friction. Therefore, the maximum static friction for the central part lubricating condition is universally lower than that in the dry condition for both rubber A and B tests.
The different extent of bend between line 2 and 5 (Figure 7) reflects the strong difference of the shear stress between the rear edge and the front edge of the contact zone. This phenomenon is well established with previous results obtained in the dry condition [15,38]. Lubrication in the central part of contact can be seen as a function that weakens the adhesion effect within the entire contact zone rather than changing the deformation principle of the rubber surface. Under this assumption, the difference of the maximum static friction between the two rubber types can be understood with the same explanation as for dry condition tests: the lower the elastic moduli, the stronger the contact deformation; therefore, the static friction increases as the real contact area increases. Furthermore, the maximum static friction decreases due to the creep of the rubber surface when sheared for a certain period of time [15]. The improvement of static friction which is achieved at a higher increasing rate of tangential load is also good evidence to prove the assumption.
4.2. Comparison of the Two Side Parts of Lubrication
The effect of lubrication on the contact of the two side parts is quite different from that on the central part lubricating condition; this is because sea water solution is applied to each part of the contact zone until the contact is stably formed. Therefore, there is no entrapment of water or sealing water before the tangential load is imposed. If the counter surfaces are smooth enough, then the lubricating film would be propagated along with the boundary of the central contact area and partial slip zone. The counter surfaces in this study are not as smooth as the ideal assumption, and the water film can propagate into the contact zone through gaps between asperities in contact due to seepage flow mechanics. Therefore, the lubricating film can reduce the adhesion force around the crack line of the interfaces. However, the effect of lubricating water within the apparent contact zone is smaller than that at the central part lubricating condition. Figure 10 provides evidence to compare the extent of deformation at the rear edge of the apparent contact zone for the three lubricating conditions. The largest shear stress is shown in Figure 10b and sea water is concentrated at the front part of contact. There is no lubrication at the tail part of contact; the distance to the initiate position at the rear edge of contact is 2.08 mm, so the maximum static friction stays at a high level. The deformation which is shown in Figure 10c is evidently smaller than that in Figure 10b; it indicates that lubrication acts more efficiently and results in lower static friction for the tail part lubricating conditions. However, its deformation (1.51 mm) is still larger than that for the central part lubricating tests (1.25 mm). Furthermore, the contact displacement for each lubricating condition is shown in Figure 10d; we can observe the variation tendency of the maximum displacements in the three tests, and the tendency is similar with the variation of the deformations at the rear edge of the contact. This phenomenon can also prove the different effects of lubrication for the three lubricating conditions. Therefore, values of α are always greater than 1. It is necessary to note that the maximum contact displacement is apparently higher than the deformation distance at the rear edge, because there are two major deformation styles—elastic deformation of the whole rubber sample and tangential deformation which is located at the rear edge—which contribute to the contact displacement from the initiate position. An obvious exception for the value of α is obtained in rubber A tests; the value is under 10 N normal load and at a 1.5 N/s increasing rate of tangential load. This is possibly because the static contact system undergoes an unstable status which is under relatively low normal loading with a high increasing shear rate. The unusual value of the maximum static friction which is shown in Figure 5b may be convincing evidence; the friction of the lubricating condition is slightly higher than that in the dry condition test which is under 10 N normal load with an increasing rate of tangential load at 1.5 N/s.
The above discussions may not completely explain the accurate lubricating effects among all of the experimental results. However, the results of this study suggest that the static friction behaviors of rubber are affected by different lubricating conditions. The maximum static friction decreases with the lubrication of sea water. These results may provide experimental support for further systematic studies on tensioner design and more accurate investigation of the tribological behavior of static rubber contact.
5. Conclusions
A series of experimental tests was carried out using a home-built friction instrument to investigate the static friction behaviors of contact between rubber and pipe. The maximum static friction decreases due to the lubrication of sea water; the extent of the decline ranges from 30% to 45% for the relative soft rubber compound; the range is not greater than 30% for the relative stiff rubber compound. All tests in this study are believed to be in the boundary lubrication condition. The water film can be seen to weaken the adhesion effect of the contact system rather than changing the deformation principle of the rubber surface. The differences of frictions between 0.062 N/s and 1.5 N/s and the increasing rate of tangential load indicate that the effect of rubber’s viscoelastic property still works at the level of static friction for the lubricating conditions. Lubrication at the two side parts of contact shows lower efficiency than that in the central part of contact due to the different extent of lubricating film.
Acknowledgments
This research is sponsored by the National Natural Science Foundation of China (No. 51375495), the Tribology Science Fund of State Key Laboratory of Tribology (No. SKLTKF14A08) and the Science Foundation of China University of Petroleum, Beijing (No. 2462017BJB06, C201602).
Author Contributions
Yong-Jie Zhou set up the test devices, performed tribology, and wrote the manuscript; Yan-Bao Guo performed mechanical testing, analysis, and contributed in writing the manuscript; and De-Guo Wang conceived research, analyzed results.
Conflicts of Interest
The authors declare no conflict of interest.
References
- Persson, B.N.; Albohr, O.; Tartaglino, U.; Volokitin, A.I.; Tosatti, E. On the nature of surface roughness with application to contact mechanics, sealing, rubber friction and adhesion. J. Phys. Condens. Matter 2004, 17, R1. [Google Scholar] [CrossRef] [PubMed]
- Cao, W. Study on properties of recycled tire rubber modified asphalt mixtures using dry process. Constr. Build. Mater. 2007, 21, 1011–1015. [Google Scholar] [CrossRef]
- Xu, Y.; Liu, Y.; Kan, C.; Shen, Z.; Shi, Z. Experimental research on fatigue property of steel rubber vibration isolator for offshore jacket platform in cold environment. Ocean Eng. 2009, 36, 588–594. [Google Scholar] [CrossRef]
- Guo, Y.; Cao, Z.; Wang, D.; Liu, S. Improving the friction and abrasion properties of nitrile rubber hybrid with hollow glass beads. Tribol. Int. 2016, 101, 122–130. [Google Scholar] [CrossRef]
- Arvanitaki, A.; Briscoe, B.J.; Adams, M.J.; Johnson, S.A. The friction and lubrication of elastomers. Tribol. Ser. 1995, 30, 503–511. [Google Scholar]
- Persson, B.N. Theory of rubber friction and contact mechanics. J. Chem. Phys. 2001, 115, 3840–3861. [Google Scholar] [CrossRef]
- Schallamach, A. How does rubber slide? Wear 1971, 17, 301–312. [Google Scholar] [CrossRef]
- Barquins, M.; Courtel, R. Rubber friction and the rheology of viscoelastic contact. Wear 1975, 32, 133–150. [Google Scholar] [CrossRef]
- Johnson, K.L.; Greenwood, J.A. An adhesion map for the contact of elastic spheres. J. Colloid Interface Sci. 1997, 192, 326–333. [Google Scholar] [CrossRef] [PubMed]
- Schwarz, U.D. A generalized analytical model for the elastic deformation of an adhesive contact between a sphere and a flat surface. J. Colloid Interface Sci. 2003, 261, 99–106. [Google Scholar] [CrossRef]
- Galligan, J.M.; McCullough, P. On the nature of static friction. Wear 1985, 105, 337–340. [Google Scholar] [CrossRef]
- Roberts, A.D.; Thomas, A.G. Static friction of smooth clean vulcanized rubber. Rubber Chem. Technol. 1977, 50, 266–271. [Google Scholar] [CrossRef]
- Loeve, A.J.; Krijger, T.; Mugge, W.; Breedveld, P.; Dodou, D.; Dankelman, J. Static friction of stainless steel wire rope-rubber contacts. Wear 2014, 319, 27–37. [Google Scholar] [CrossRef]
- Deladi, E.L.; De Rooij, M.B.; Schipper, D.J. Modelling of static friction in rubber-metal contact. Tribol. Int. 2007, 40, 588–594. [Google Scholar] [CrossRef]
- Barquins, M. Adherence, friction and wear of rubber-like materials. Wear 1992, 158, 87–117. [Google Scholar] [CrossRef]
- Barquins, M. Influence of dwell time on the adherence of elastomers. J. Adhes. 1982, 14, 63–82. [Google Scholar] [CrossRef]
- Savkoor, A.R.; Briggs, G.A.D. The effect of tangential force on the contact of elastic solids in adhesion. Proc. R. Soc. Lond. A 1977, 336, 103–116. [Google Scholar] [CrossRef]
- Savkoor, A.R. Mechanics of sliding friction of elastomers. Wear. 1986, 113, 37–60. [Google Scholar] [CrossRef]
- Trømborg, J.; Scheibert, J.; Amundsen, D.S.; Thøgersen, K.; Malthe-Sørenssen, A. Transition from static to kinetic friction: Insights from a 2D model. Phys. Rev. Lett. 2011, 107, 074301. [Google Scholar]
- Nguyen, D.T.; Paolino, P.; Audry, M.C.; Chateauminois, A.; Fretigny, C.; Chenadec, Y.L.; Portigliatti, M.; Barthel, E. Surface pressure and shear stress fields within a frictional contact on rubber. J. Adhes. 2011, 87, 235–250. [Google Scholar] [CrossRef]
- Koenen, A.; Sanon, A. Tribological and vibroacoustic behavior of a contact between rubber and glass (application to wiper blade). Tribol. Int. 2007, 40, 1484–1491. [Google Scholar] [CrossRef]
- Jagger, E.T.; Walker, P.S. Second paper: Further studies of the lubrication of synthetic rubber rotary shaft seals. Proc. Inst. Mech. Eng. 1966, 181, 191–204. [Google Scholar] [CrossRef]
- Zhang, S.W. State of the art of polymer tribology. Tribol. Int. 1998, 31, 49–60. [Google Scholar] [CrossRef]
- Goto, S.; Takahashi, H.; Oya, T. Clarification of the mechanism of wiper blade rubber squeal noise generation. JSAE Rev. 2001, 22, 57–62. [Google Scholar] [CrossRef]
- Gelinck, E.R.M.; Schipper, D.J. Calculation of Stribeck curves for line contacts. Tribol. Int. 2000, 33, 175–181. [Google Scholar] [CrossRef]
- Lancaster, J.K. A review of the influence of environmental humidity and water on friction, lubrication and wear. Tribol. Int. 1990, 23, 371–389. [Google Scholar] [CrossRef]
- Roberts, A.D. Squeeze films between rubber and glass. J. Phys. D Appl. Phys. 1971, 4, 423. [Google Scholar] [CrossRef]
- Persson, B.N.; Tartaglino, U.; Albohr, O.; Tosatti, E. Rubber friction on wet and dry road surfaces: The sealing effect. Phys. Rev. B 2005, 71, 035428. [Google Scholar] [CrossRef]
- Deleau, F.; Mazuyer, D.; Koenen, A. Sliding friction at elastomer/glass contact: Influence of the wetting conditions and instability analysis. Tribol. Int. 2009, 42, 149–159. [Google Scholar] [CrossRef]
- Opitz, A.; Ahmed, S.U.; Schaefer, J.A.; Scherge, M. Friction of thin water films: A nanotribological study. Surf. Sci. 2002, 504, 199–207. [Google Scholar] [CrossRef]
- Clauss, G.F.; Weede, H.; Riekert, T. Offshore pipe laying operations-Interaction of vessel motions and pipeline dynamic stresses. Appl. Ocean Res. 1992, 14, 175–190. [Google Scholar] [CrossRef]
- Guarracino, F.; Mallardo, V. A refined analytical analysis of submerged pipelines in seabed laying. Appl. Ocean Res. 1999, 21, 281–293. [Google Scholar] [CrossRef]
- Lenci, S.; Callegari, M. Simple analytical models for the J-lay problem. Acta Mech. 2005, 178, 23–39. [Google Scholar] [CrossRef]
- Mattiazzo, G.; Mauro, S.; Guinzio, P.S. A tensioner simulator for use in a pipelaying design tool. Mechatronics 2009, 19, 1280–1285. [Google Scholar] [CrossRef]
- Cao, Z.Q.; Wang, D.G.; Cong, C.B.; Wang, Y.F.; Zhou, Q. Dependence of abrasion behavior on cross-linked heterogeneity in unfilled nitrile rubber. Tribol. Int. 2014, 69, 141–149. [Google Scholar] [CrossRef]
- Wang, J.; Yan, F.; Xue, Q. Tribological behavior of PTFE sliding against steel in sea water. Wear 2009, 267, 1634–1641. [Google Scholar] [CrossRef]
- Lee, E.H.; Radok, J.R.M. The contact problem for viscoelastic bodies. J. Appl. Mech. 1960, 27, 438–444. [Google Scholar] [CrossRef]
- Fukahori, Y.; Gabriel, P.; Busfield, J.J.C. How does rubber truly slide between Schallamach waves and stick–slip motion? Wear 2010, 269, 854–866. [Google Scholar] [CrossRef]
- Skouvaklis, G.; Blackford, J.R.; Koutsos, V. Friction of rubber on ice: A new machine, influence of rubber properties and sliding parameters. Tribol. Int. 2012, 49, 44–52. [Google Scholar] [CrossRef]
- Roberts, A.D. A guide to estimating the friction of rubber. Rubber Chem. Technol. 1992, 65, 673–686. [Google Scholar] [CrossRef]
- Jia, J.H.; Zhou, H.D.; Gao, S.Q.; Chen, J.M. A comparative investigation of the friction and wear behavior of polyimide composites under dry sliding and water-lubricated condition. Mater. Sci. Eng. A 2003, 356, 48–53. [Google Scholar] [CrossRef]
- Riedo, E.; Lévy, F.; Brune, H. Kinetics of capillary condensation in nanoscopic sliding friction. Phys. Rev. Lett. 2002, 88, 185505. [Google Scholar] [CrossRef] [PubMed]
Figure 1.
Schematic diagram of the major lubricating conditions in pipe-laying operation. (a) The central part of lubrication; (b) The front part of lubrication; (c) The tail part of lubrication.
Figure 1.
Schematic diagram of the major lubricating conditions in pipe-laying operation. (a) The central part of lubrication; (b) The front part of lubrication; (c) The tail part of lubrication.

Figure 2.
The shapes of rubber and pipe samples. Two types of rubber samples: rubber A and B; Two types of pipe samples: steel pipe and polymethyl methacrylate (PMMA) pipe.
Figure 2.
The shapes of rubber and pipe samples. Two types of rubber samples: rubber A and B; Two types of pipe samples: steel pipe and polymethyl methacrylate (PMMA) pipe.

Figure 3.
Schematic diagram of the tribological instrument. The instrument mainly consists of three components: normal loading module; rubber-pipe contact testing module; and tangential loading module. A portable video camera is positioned perpendicular to the contacting surface across the PMMA pipe to provide a macroscopic recording of the contact.

Figure 4.
Confirmation of the maximum static friction. (a) Combination of two test records under 10 N normal load with a 0.062 N/s and 1.5 N/s increasing rate of tangential load; (b) Local enlargement of a single testing curve.
Figure 4.
Confirmation of the maximum static friction. (a) Combination of two test records under 10 N normal load with a 0.062 N/s and 1.5 N/s increasing rate of tangential load; (b) Local enlargement of a single testing curve.
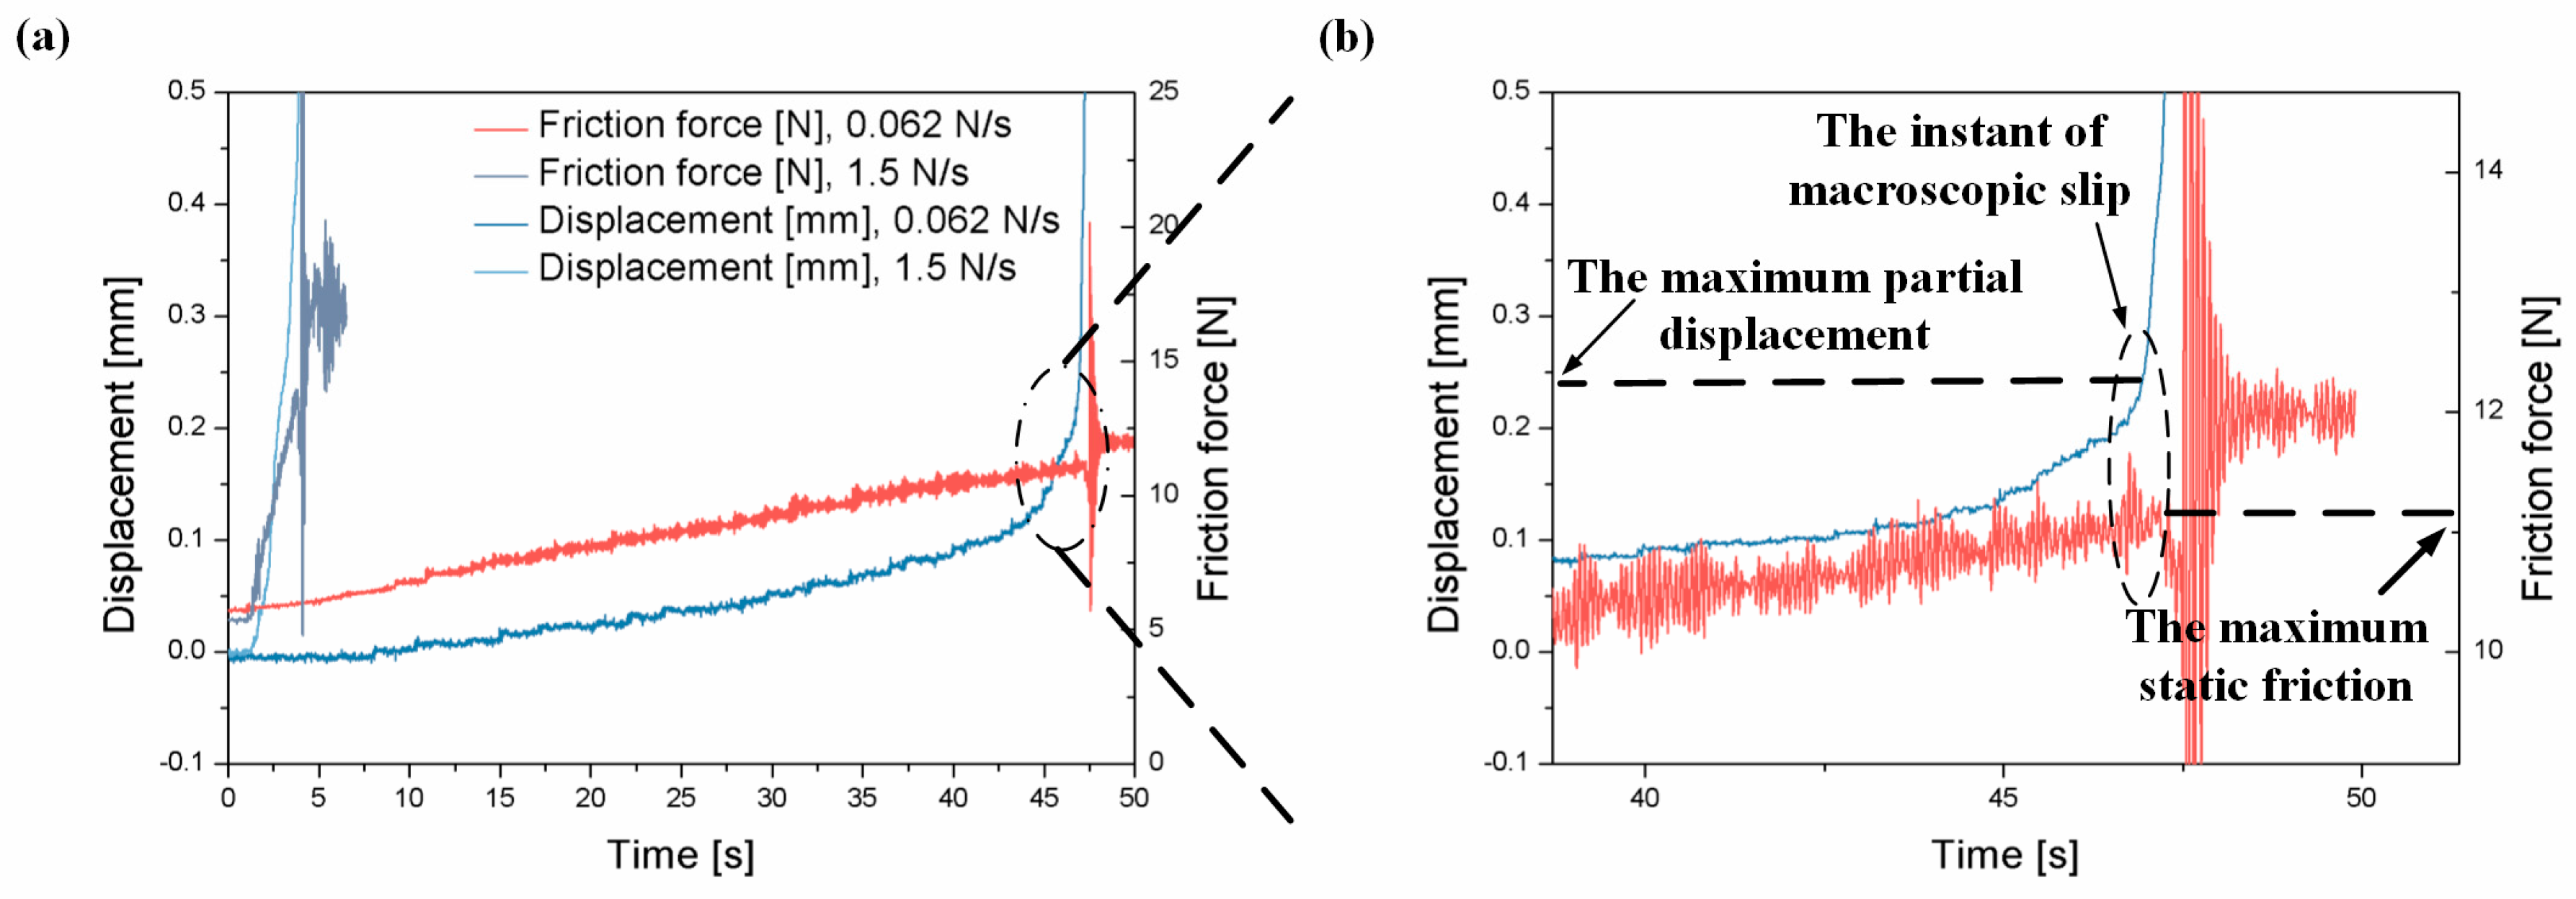
Figure 5.
A series of maximum static frictions (F) of rubber in contact with steel for dry and lubricating conditions. (a) Results of rubber A tests; (b) Results of rubber B tests.
Figure 5.
A series of maximum static frictions (F) of rubber in contact with steel for dry and lubricating conditions. (a) Results of rubber A tests; (b) Results of rubber B tests.
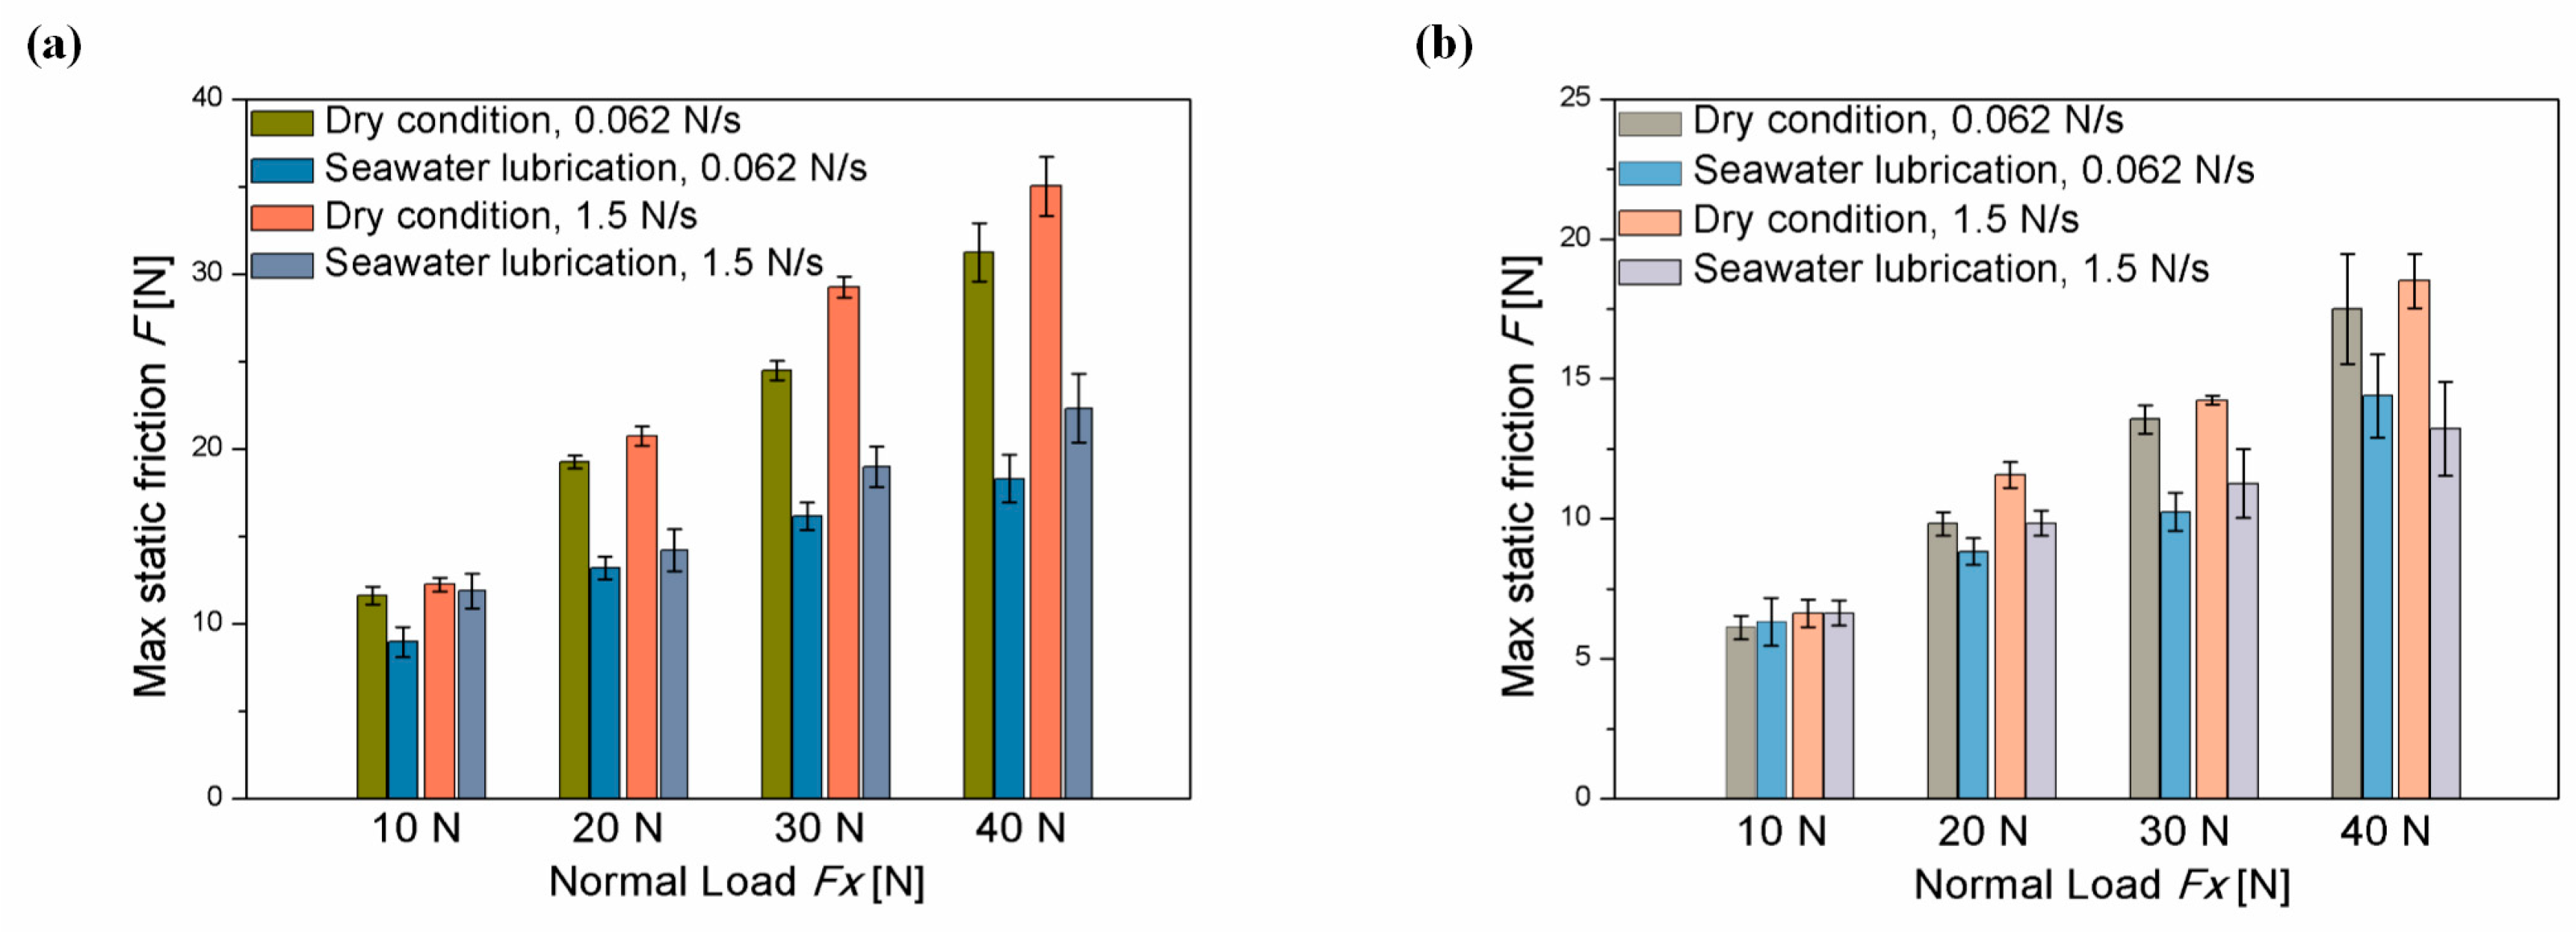
Figure 6.
Lubrication efficiency at the two side parts of contact. (a) Results of rubber A tests; (b) Results of rubber B tests.
Figure 6.
Lubrication efficiency at the two side parts of contact. (a) Results of rubber A tests; (b) Results of rubber B tests.
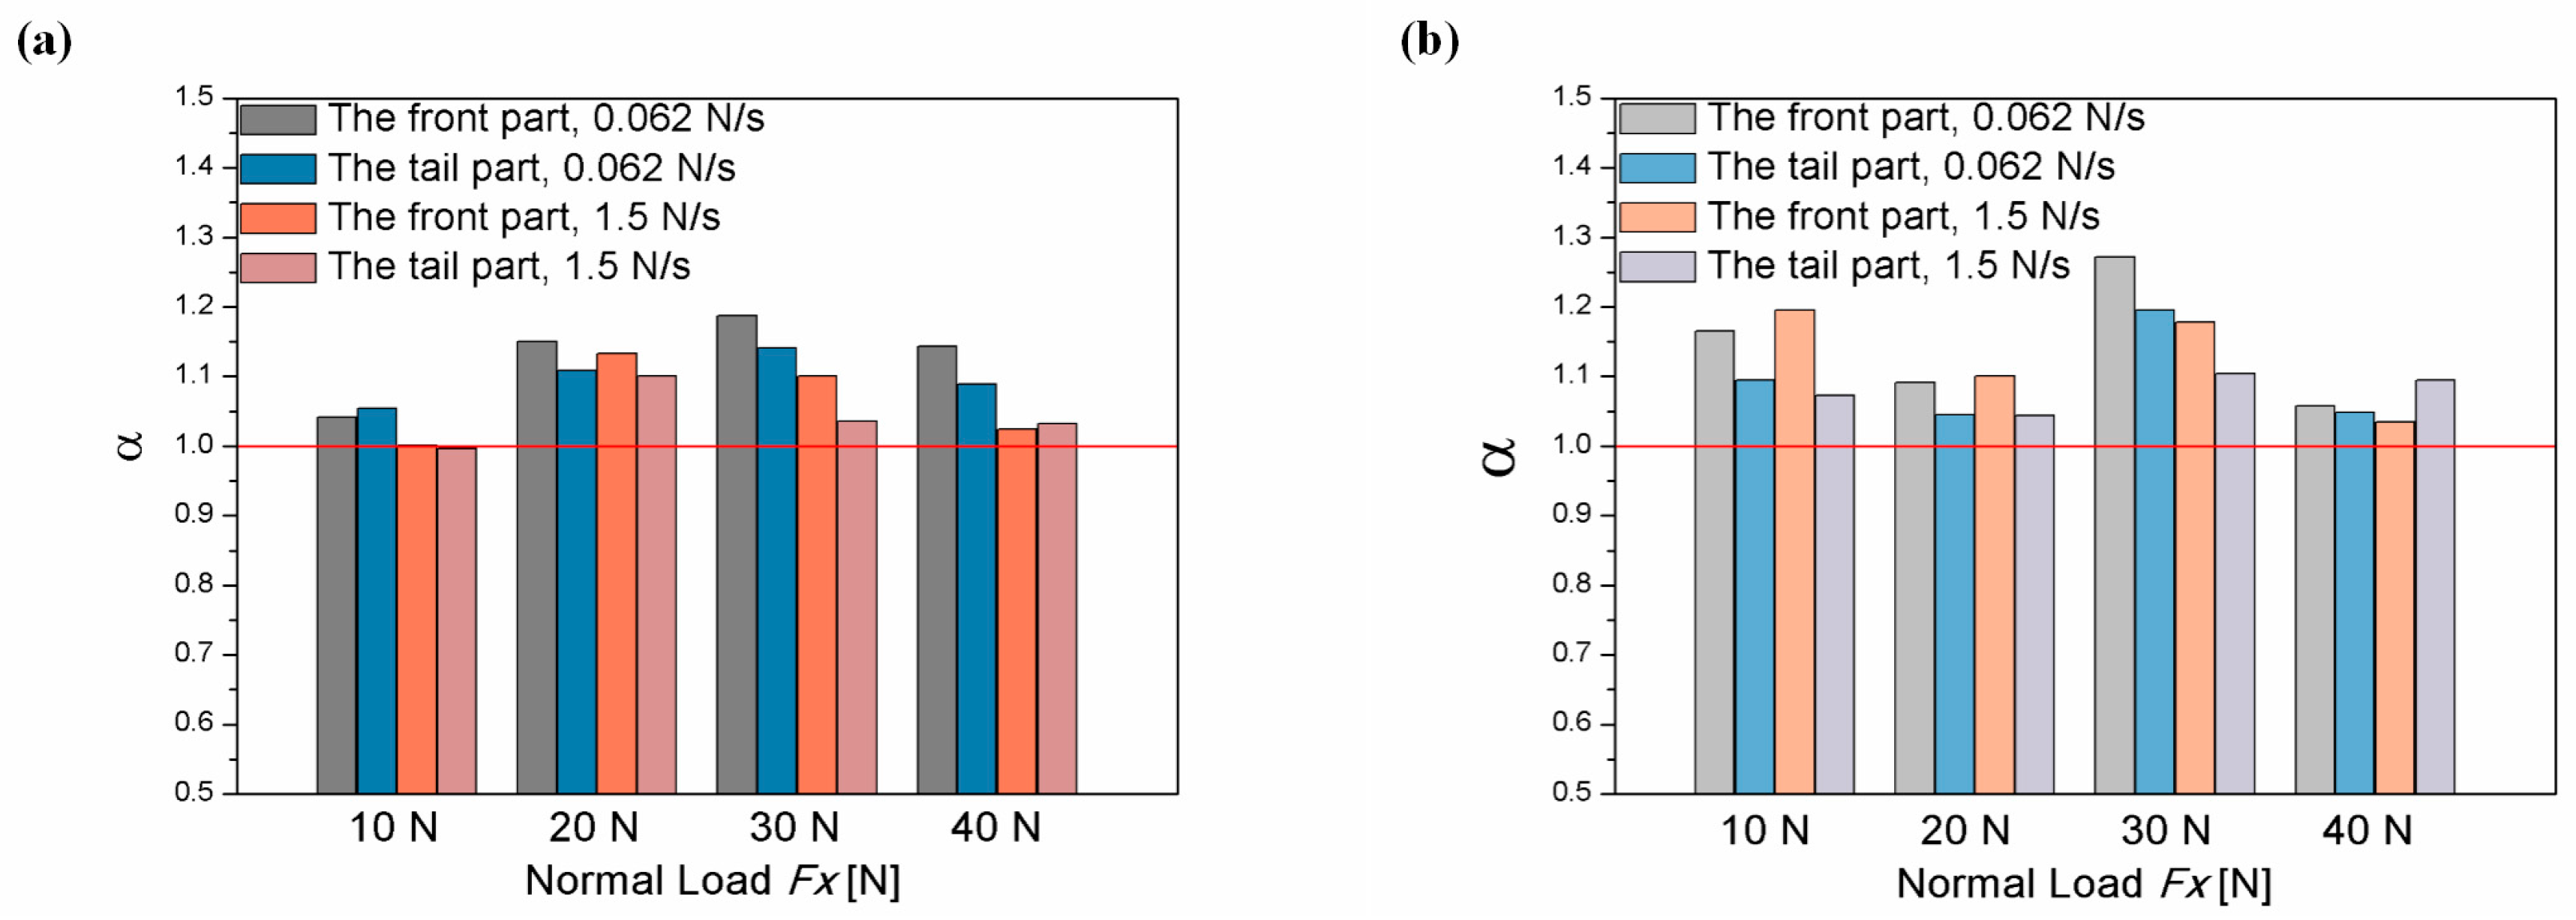
Figure 7.
Evolution of the apparent contact area in the rubber A-PMMA test, for the central part lubricating condition. The test is under 20 N normal load with a 0.062 N/s increasing rate of tangential load. The black lines on the surface of the rubber are marked as 1–6. (a) Steady contact between rubber and pipe without tangential load; (b) Deformation of the contact at the beginning of tangential load; (c) Rubber surface which, at the rear edge of contact, is moving towards with pipe; (d) Partial traces of ink which are separated from the black marker pen lines; (e) More and more separations of partial traces of ink appear within the apparent contact area; (f) Macroscopic slip is emerging. The white arrows indicate the direction of expansion of the contact region; The red arrows indicate the deformation of the rubber surface; The yellow dotted circles indicate the relative displacement of interfaces (the interpretation also applies to Figure 8 and Figure 9).
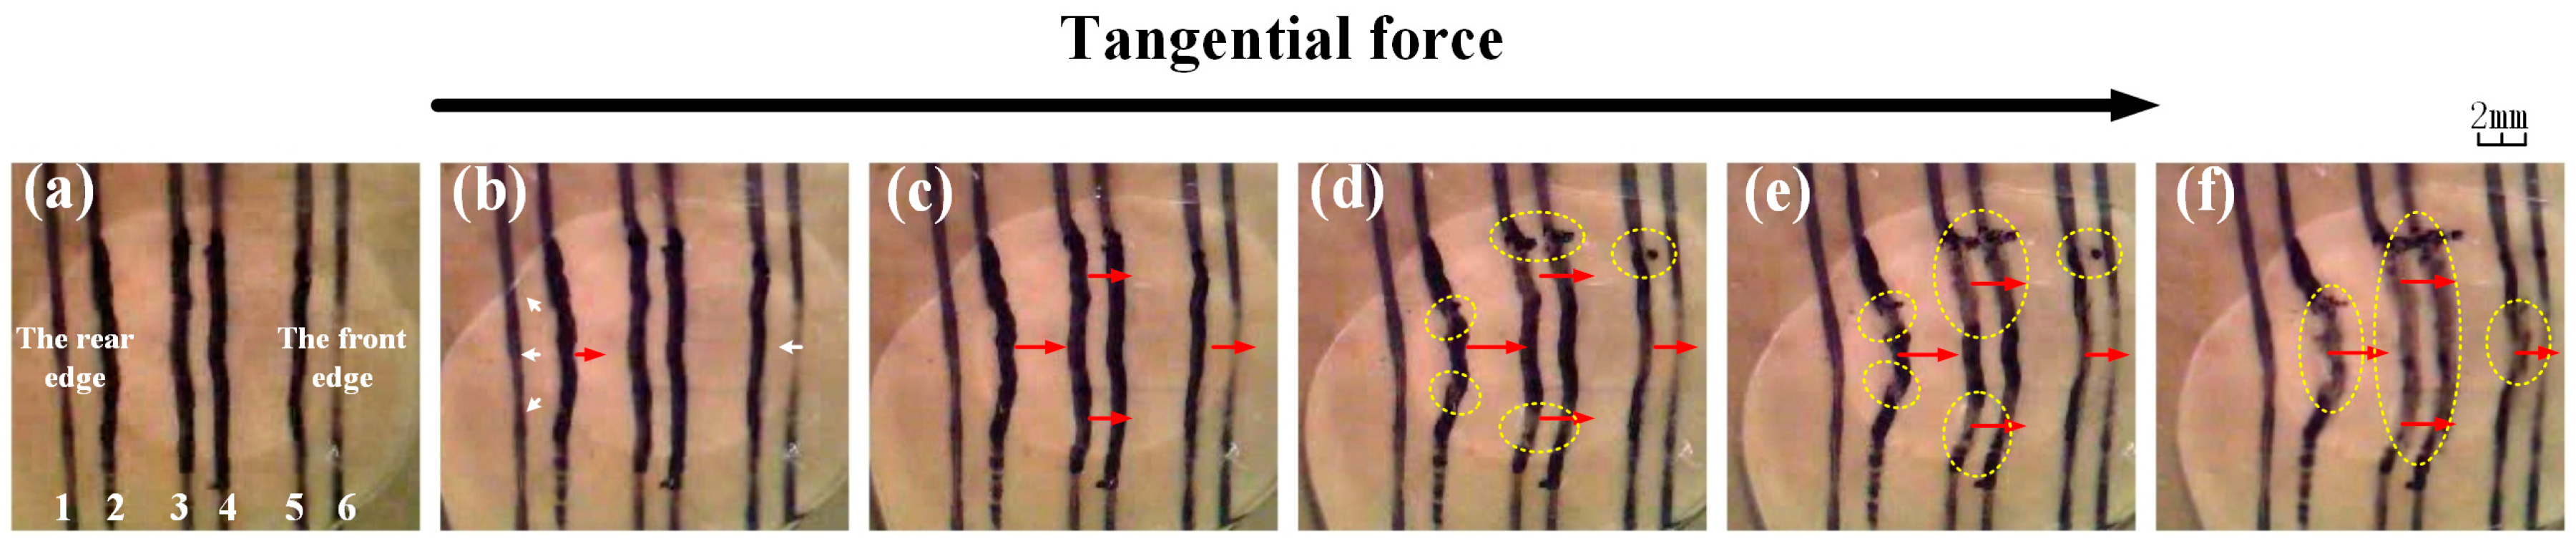
Figure 8.
Evolution of the apparent contact area in the rubber A-PMMA test, for the front part lubricating condition. The test is under 20 N normal load with a 0.062 N/s increasing rate of tangential load. (a) Steady contact between the rubber and pipe without tangential load; (b) Deformation of the contact at the beginning of tangential load; (c) Rubber surface which, at the rear edge of contact, is moving towards with pipe; (d) Partial traces of ink which are separated from the black marker pen lines; (e) More and more separations of partial traces of ink appear within the apparent contact area; (f) Macroscopic slip is emerging.
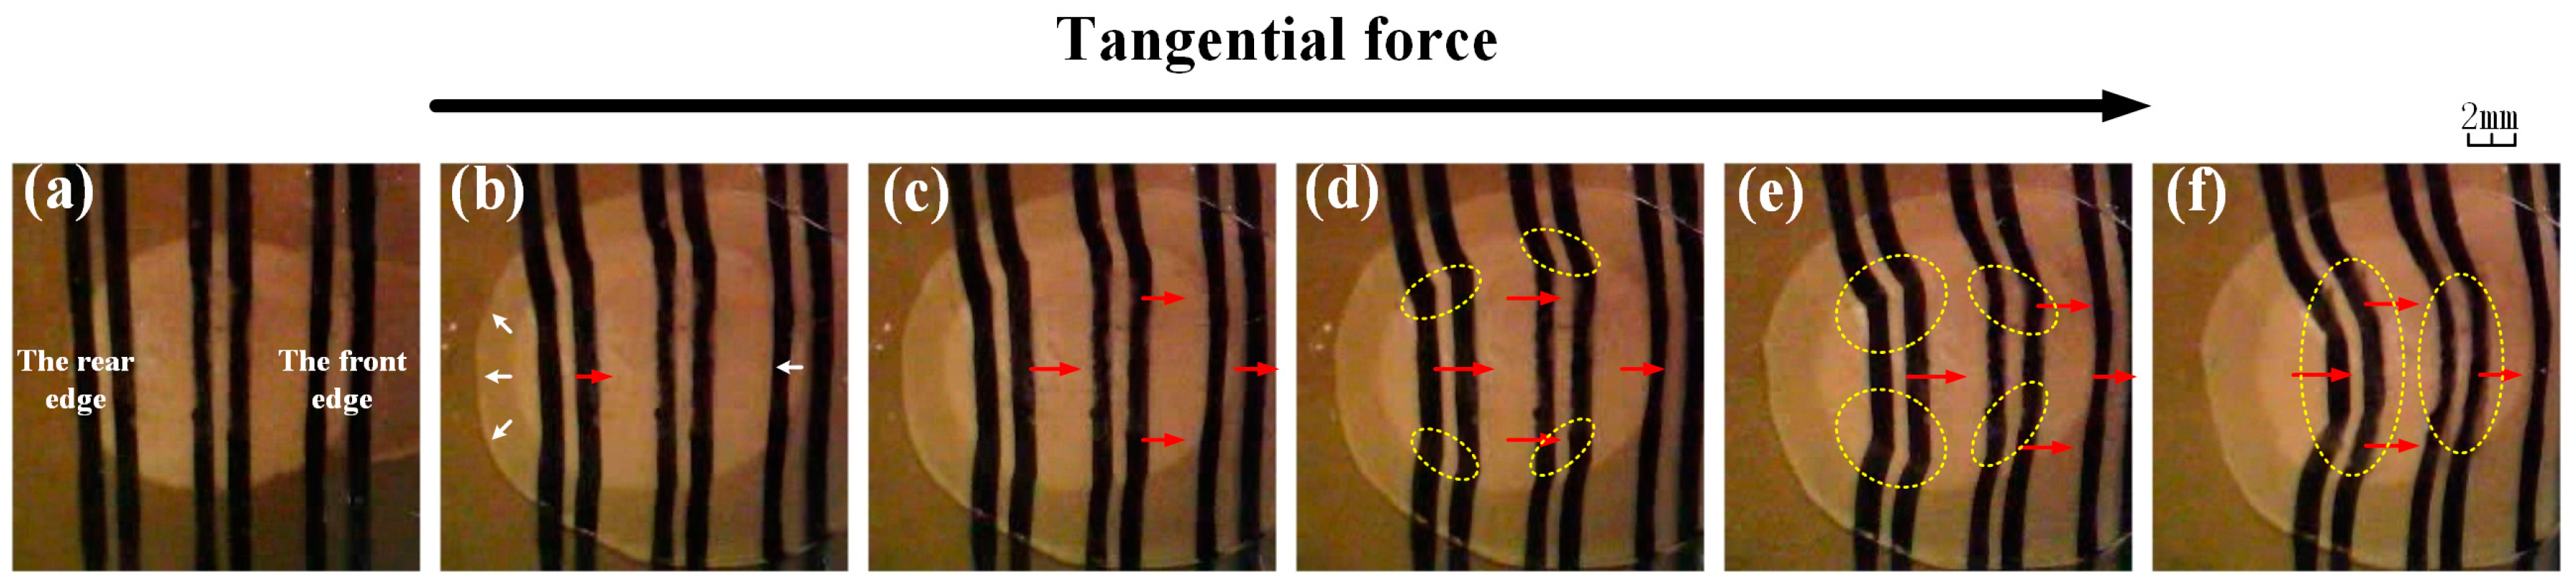
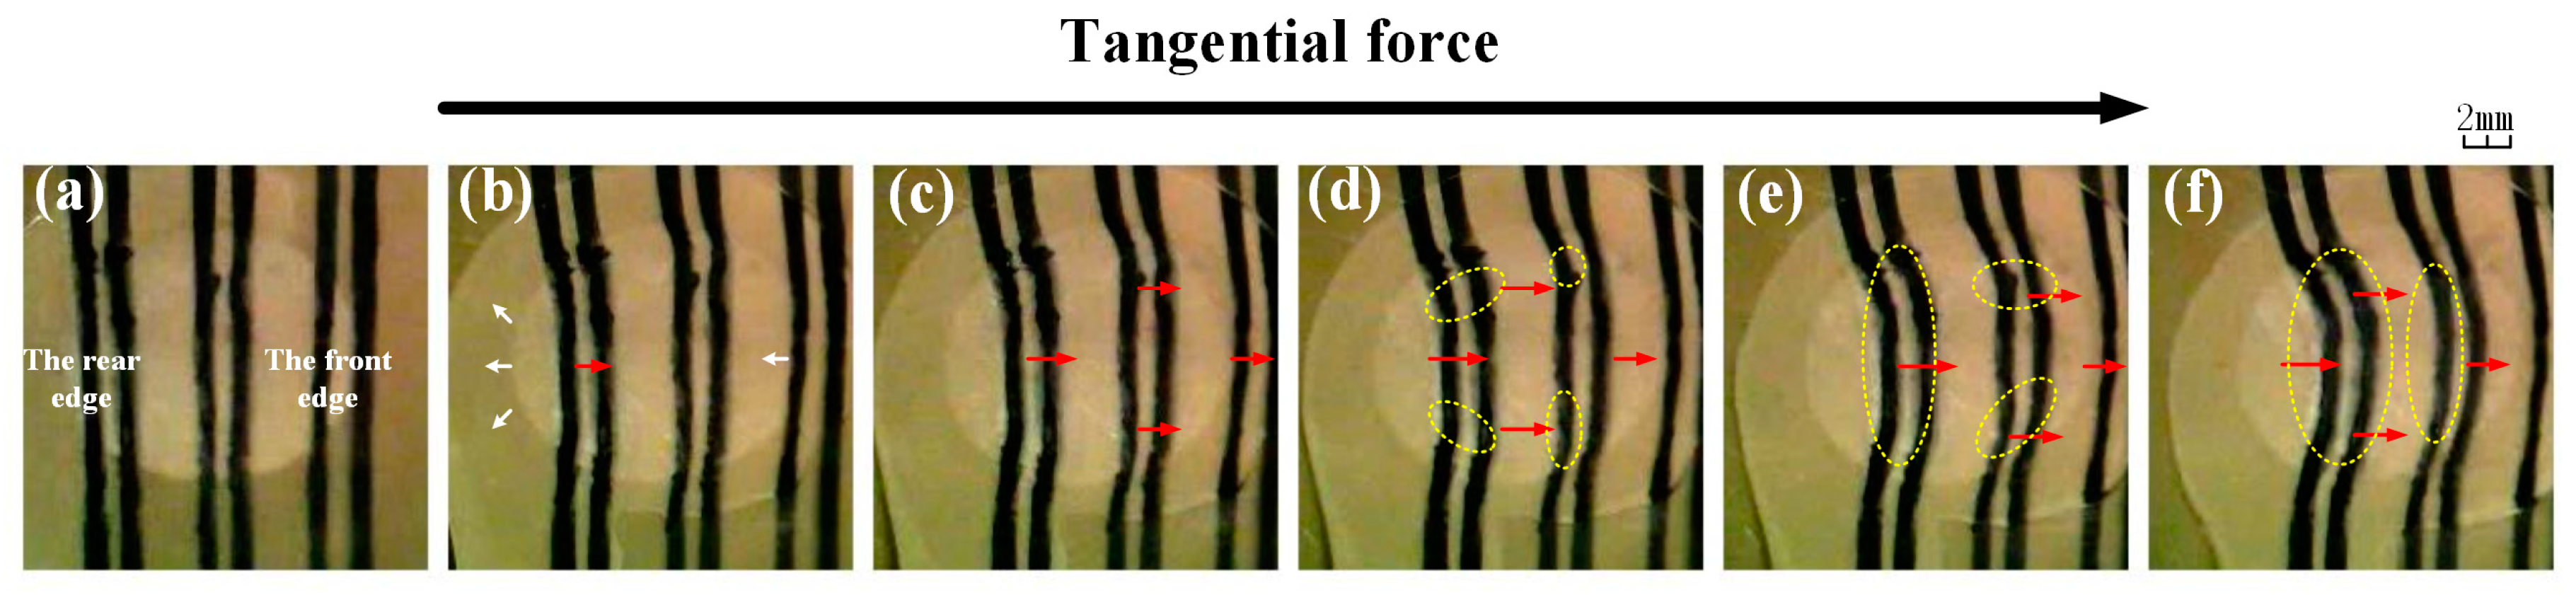
Figure 9.
Evolution of the apparent contact area in the rubber A-PMMA test, for the tail part lubricating condition. The test is under 20 N normal load with a 0.062 N/s increasing rate of tangential load. (a) Steady contact between the rubber and pipe without tangential load; (b) Deformation of the contact at the beginning of tangential load; (c) Rubber surface which, at the rear edge of contact, is moving towards with pipe; (d) Partial traces of ink which are separated from the black marker pen lines; (e) More and more separations of partial traces of ink appear within the apparent contact area; (f) Macroscopic slip is emerging.

Figure 10.
Comparison of deformations at the rear edge of contact for the different lubricating conditions. (a) Deformation of the rear edge for the central part lubricating condition; (b) Deformation of the rear edge for the front part lubricating condition; (c) Deformation of the rear edge for the tail part lubricating condition. (d) Comparison of the maximum displacements of contact for the three lubricating conditions; the tests were conducted under 20 N normal load, with a 1.5 N/s increasing rate of tangential load.


Table 1.
Mechanical properties of the unfilled nitrile butadiene rubber (NBR) samples and pipe samples.
Table 1.
Mechanical properties of the unfilled nitrile butadiene rubber (NBR) samples and pipe samples.
| Rubber Type | Mechanical Properties | |||
| Elastic Modulus [MPa] | Tensile Strength [MPa] | Shore Hardness | Roughness [Ra] | |
| A | 2.26 | 13.2 | 37 | 3.1 |
| B | 3.7 | 12.79 | 51 | 3.2 |
| Pipe Type | Mechanical Properties | |||
| Elastic Modulus [MPa] | HRC | Roughness [Ra] | ||
| Steel | 2.1 × 10⁵ | 80 | 1.7 | |
| PMMA | 3 × 10³ | 99 | 1.6 | |
Table 2.
Chemical composition of sea water solution.
| Compound | NaCl | Na2SO4 | MgCl2 | CaCl2 | SrCl2 | KCl | NaHCO3 | KBr | H3BO3 | NaF |
|---|---|---|---|---|---|---|---|---|---|---|
| Concentration (g/L) | 24.53 | 4.09 | 5.20 | 1.16 | 0.025 | 0.695 | 0.201 | 0.101 | 0.027 | 0.003 |
Table 3.
Parameters of friction tests.
| Rubber | Pipe | Normal Load [N] | Increasing Rate of Tangential Load [N/s] |
|---|---|---|---|
| A | Steel, PMMA | 10, 20, 30, 40 | 0.062, 1.5 |
| B | Steel, PMMA |
© 2017 by the authors. Licensee MDPI, Basel, Switzerland. This article is an open access article distributed under the terms and conditions of the Creative Commons Attribution (CC BY) license (http://creativecommons.org/licenses/by/4.0/).
Share and Cite
MDPI and ACS Style
Zhou, Y.-J.; Wang, D.-G.; Guo, Y.-B. The Reduction of Static Friction of Rubber Contact under Sea Water Droplet Lubrication. Lubricants 2017, 5, 12. https://doi.org/10.3390/lubricants5020012
AMA Style
Zhou Y-J, Wang D-G, Guo Y-B. The Reduction of Static Friction of Rubber Contact under Sea Water Droplet Lubrication. Lubricants. 2017; 5(2):12. https://doi.org/10.3390/lubricants5020012
Chicago/Turabian StyleZhou, Yong-Jie, De-Guo Wang, and Yan-Bao Guo. 2017. "The Reduction of Static Friction of Rubber Contact under Sea Water Droplet Lubrication" Lubricants 5, no. 2: 12. https://doi.org/10.3390/lubricants5020012
Note that from the first issue of 2016, this journal uses article numbers instead of page numbers. See further details here.