The Test-Retest Reliability of New Generation Power Indices of Wingate All-Out Test


1
Coaching Education Department, Faculty of Sport Sciences, Ege University, Izmir 35050, Turkey
2
Health Sciences Institution, Ege University, Izmir 35050, Turkey
*
Author to whom correspondence should be addressed.
Sports 2018, 6(2), 31; https://doi.org/10.3390/sports6020031
Submission received: 16 March 2018
/
Revised: 30 March 2018
/
Accepted: 2 April 2018
/
Published: 7 April 2018
Abstract
:Although reliability correlations of traditional power indices of the Wingate test have been well documented, no study has analyzed new generation power indices based on milliseconds obtained from a Peak Bike. The purpose of this study was to investigate the retest reliability of new generation power indices. Thirty-two well-trained male athletes who were specialized in basketball, football, tennis, or track and field volunteered to take part in the study (age: 24.3 ± 2.2 years; body mass: 77 ± 8.3 kg; height: 180.3 ± 6.3 cm). Participants performed two Wingate all-out sessions on two separate days. Intra-class correlation coefficient (ICC), standard error measurement (SEM), smallest real differences (SRD) and coefficient of variation (CV) scores were analyzed based on the test and retest data. Reliability results of traditional power indices calculated based on 5-s means such as peak power, average power, power drop, and fatigue index ratio were similar with the previous findings in literature (ICC ≥ 0.94; CV ≤ 2.8%; SEM ≤ 12.28; SRD% ≤ 7.7%). New generation power indices such as peak power, average power, lowest power, power drop, fatigue index, power decline, maximum speed as rpm, and amount of total energy expenditure demonstrated high reliability (ICC ≥ 0.94; CV ≤ 4.3%; SEM ≤ 10.36; SRD% ≤ 8.8%). Time to peak power, time at maximum speed, and power at maximum speed showed a moderate level of reliability (ICC ≥ 0.73; CV ≤ 8.9%; SEM ≤ 63.01; SRD% ≤ 22.4%). The results of this study indicate that reliability correlations and SRD% of new generation power and fatigue-related indices are similar with traditional 5-s means. However, new time-related indices are very sensitive and moderately reliable.
1. Introduction
The Wingate all-out test requires pedaling with maximal effort for 30 s against a constant workload that is based on body mass [1]. The test is easy to administer, non-invasive, and can be conducted with an inexpensive mechanically braked cycle ergometer, thus it has achieved widespread use among laboratories for analyzing the anaerobic performance of various population groups [2,3,4,5,6,7]. Peak Power (PP5s), Average Power (AP5s), Lowest Power (LP5s), Power Drop (PD5s), and Fatigue Index (FI5s) have been well-known traditional power indices [1]. PP5s, AP5s, and LP5s are calculated over averages of 5-s intervals. FI5s and PD5s are the fatigue-related power indices and they are calculated via PP5s and LP5s. PD5s is the power drop-off throughout the test, while FI5s is the power decline as a percentage of the PP5s.
In the 2000s, mechanically braked new Peak Bike 894E ergometers with hardware and software upgrades were introduced. Nowadays, it is possible to obtain new generation power indices which are calculated in millisecond sensitivity instead of 5-s means . The new generation power indices include instantaneous outcomes such as Peak Power (PP) as the highest running average of one second in watts; Average Power (AP) as the average power of the entire test in watts; Lowest Power (LP) as the lowest running average of one second period in watts; Fatigue Index (FI) as relative power decline from start to end; Power Drop (PD) as drop in power from start to end. Additionally, it is possible to obtain new parameters such as time to peak power (tpp) as time to elicit peak power from start to middle of the one second period in milliseconds; maximum speed as rpm (vmax) reached maximum instantaneous speed during the whole test as rpm; power at maximum speed (P@vmax) as power at time of maximum rpm; time at maximum speed (t@vmax) as the time at maximum speed in milliseconds; decline in power (Pdec) as the difference between peak power and power at the end; and amount of total energy expenditure (etot). It can be said that PP, tpp, vmax, P@vmax, and t@vmax are the measures of explosive power (alactic performance, neuromuscular fatigue, etc.), while AP, LP, FI, PD, Pdec, and etot are used to measure lactic (anaerobic) capacity.
Numerous studies have reported that the traditional power indices have high reliability correlations ranging from 0.89 to 0.98 [1,8,9,10,11]. The validity of the traditional power indices has been examined by correlating them with field and laboratory test results. Observations showed that validity correlations have a wide range that reaches up to 0.92 [5,12,13,14,15]. However, the validity of Wingate’s traditional indices tend to have low correlation coefficients (r = 0.32) when using skill specific test results as criterion [16]. Although retest reliability and the validity of traditional power indices have been well documented since the end of 1970s, reliability analyses of new generation indices have not, to the authors’ knowledge, been analyzed yet. The new generation indices can sensitively determine and classify athletic performance due to both an increasing number of new parameters and their sensitivities. As such, nowadays, new generation indices are preferentially used for standard laboratory assessments and scientific texts instead of traditional 5-s means. However, there has been only one study, reported by Jaafar et al. [17], that has evaluated effects of different work-loads (8.7 and 11% of body mass) on the reliability of the Wingate test indices and some physiological responses. Intra-class correlation coefficient (ICC) scores of the test indices were reported as greater than the level of 0.89 in this study. However, the effects of traditional Wingate test load (10% of body mass for trained athletes [1,18]) and reliability correlations of the new generation power outputs such as t@vmax, P@vmax, tpp, vmax, and etot were not analyzed in this study. The aim of this study was therefore to determine the retest reliability of both traditional and new generation power, fatigue, and time-related indices obtained from the Wingate all-out test by using the recommended traditional work-load of 10% of body mass.
2. Materials and Methods
2.1. Experimental Approach to the Problem
A repeated measures study design was carried out in this study. Participants performed comprehensive familiarization sessions in order to overcome the learning effect. Subsequently, two Wingate all-out trials were conducted on two separate days for data collection (Session-1 and Session-2). The results were used to investigate the test-retest reliability. The testing time of day was standardized for each session to minimize any effects of circadian variance. Additionally, test sessions were conducted in a laboratory in order to provide standard climatic environment (20–21 °C temperature and 50–55% relative humidity) for each session.
2.2. Participants
Thirty-two well-trained male athletes who did not have any serious injury background volunteered to take part in the study (age: 24.3 ± 2.2 years; body mass: 77 ± 8.3 kg; height: 180.3 ± 6.3 cm). Athletes were specialized in basketball, football, tennis, or track and field. They were participating in physical training for about 6–8 h∙wk−1 throughout the test period. Written informed consent for participation was obtained after the explanation of the purpose and the test protocol. The approval of the university ethics committee was also granted (EGE.SBF.16-04/11). Participants were requested not to take part in any exhaustive exercise 24 h prior to the testing sessions. They were also asked not to take any beverages containing alcohol or caffeine a day before the test.
2.3. Procedures
Familiarization sessions and main tests were performed on a mechanically braked Monark Peak Bike cycle ergometer (Peak Bike 894, Monark, Vansbro, Sweden). Seat height and handle bar adjustments were made for each participant to allow for a comfortable riding position. Additionally, toe clips were used to allow participants to apply correct pedaling techniques [19]. They were instructed to preserve their seating position throughout sessions to avoid any effect of postural change [20].
2.4. Familiarization Sessions
The aim of the familiarization sessions was to adapt participants to the Wingate protocol and test specificities. Familiarizing session was consisted of four stages: (i) Since a correct pedaling technique is important to reveal potential maximum power production [21], participants performed pedaling exercises for two sets of 10 min each [22]. (ii) Then, flywheel’s rope was taken off and Peak Bike was used as a type of Power Cycle [23]. We asked participants to accelerate the flywheel and reach maximum velocity as soon as possible. When they achieved the score of less than two seconds at the end of two successive bursts, they upgraded to the next level of familiarization process. (iii) After enough time to rest, we asked the participants to experience just the beginning of the Wingate all-out test administration (5–6 s). After an initial burst of a 2–3-s unloaded period, a test-load, corresponding to 10% of body mass, was applied to the system [1,18] at 120 rpm [23,24,25,26,27,28,29]. Participants tried to reach time to peak power less than two seconds. We carried out repetitions until participants could overcome two successive bursts. (iv) After enough time for recovery (a period of 5–6 h in general), participants performed a single 30-s all-out test to gain practice effect which is a necessity before the real test administration [30]. Strong verbal encouragements were given throughout the administration. Additionally, we questioned Borg’s scale (6 to 20) and checked whether participants gave the scores of 19 or 20 [31]. Moreover, we analyzed the power-time curve to detect any segmental disorder [32]. If there was a gradual decrement in power-time curve and there was no any error, participants become entitled to take part in the main reliability study.
2.5. Wingate All-Out Test Administrations
After a period of 24 h, the first test (session-1) was performed. Each participants cycled at 70–80 rpm against a workload corresponding to 2% of his individual body mass as a warm-up. In this period, they performed three bursts of 3 s at the end of the third, fourth, and fifth minute. Then, participants rested for 5 min following the warm-up session [18]. The test-load was set at 10% of each individual’s body mass, as recommended for trained male athletes. Participants started the all-out test administration with maximal effort without a load until they reached 120 rpm to overcome the flywheel inertia. Then, the test-load was applied to the system, and data collection was immediately commenced. Strong verbal encouragements were given throughout the test. At the end of the all-out administration, athletes were asked to cycle for another 5 min for gradual cool down. The next day, participants performed second tests (session-2) by the same standards.
2.6. Statistical Analysis
Data were evaluated by SPSS 21 (SPSS Inc., Chicago, IL, USA). Levene’s test was used to check variance homogeneity. The Shapiro-Wilk test was used for determining normality of data distribution. Relative reliability was analyzed by the intra-class correlation coefficient (ICC) and 95% confidence interval (CI) was estimated with a two-factor mixed-effect model with absolute agreement. Absolute reliability was assessed by standard error measurement (SEM), which is calculated by dividing the standard deviation of difference with [16]. Smallest real differences (SRD) were calculated as . SRD% was calculated by dividing SRD by the mean of two tests multiplied by 100 [33]. The agreements between measurements were verified qualitatively using Bland and Altman plots [34]. SEM and mean values in both tests were used in order to compute coefficient variation (CV) [35]. Smallest worthwhile change (SWC) was determined by multiplying between-subjects standard deviations (SD) with 0.2. Effect size values were determined by Cohen’s d. Results that were 0.2–0.49 were considered “small”, 0.5–0.79 “medium”, and ≥0.8 “large”. The statistical significance level was set at p ≤ 0.05 for all analyses.
3. Results
The results of test-retest reliability of traditional power indices are displayed in Table 1. Among traditional Wingate indices, PP5s showed the highest reliability coefficients, as expected (ICC = 0.99; CV = 0.97%; SRD% = 2.69%).
The test-retest reliability correlations of new generation power indices are presented in Table 2. PP, AP, LP, PD, FI, vmax, Pdec, and etot showed high reliability (ICC ≥ 0.94; CV ≤ 4.3%; SRD% ≤ 8.78%). tpp, P@vmax, and t@vmax demonstrated moderate reliability coefficients (ICC ≥ 0.73; CV ≤ 8.9%; SRD% ≤ 22.43%).
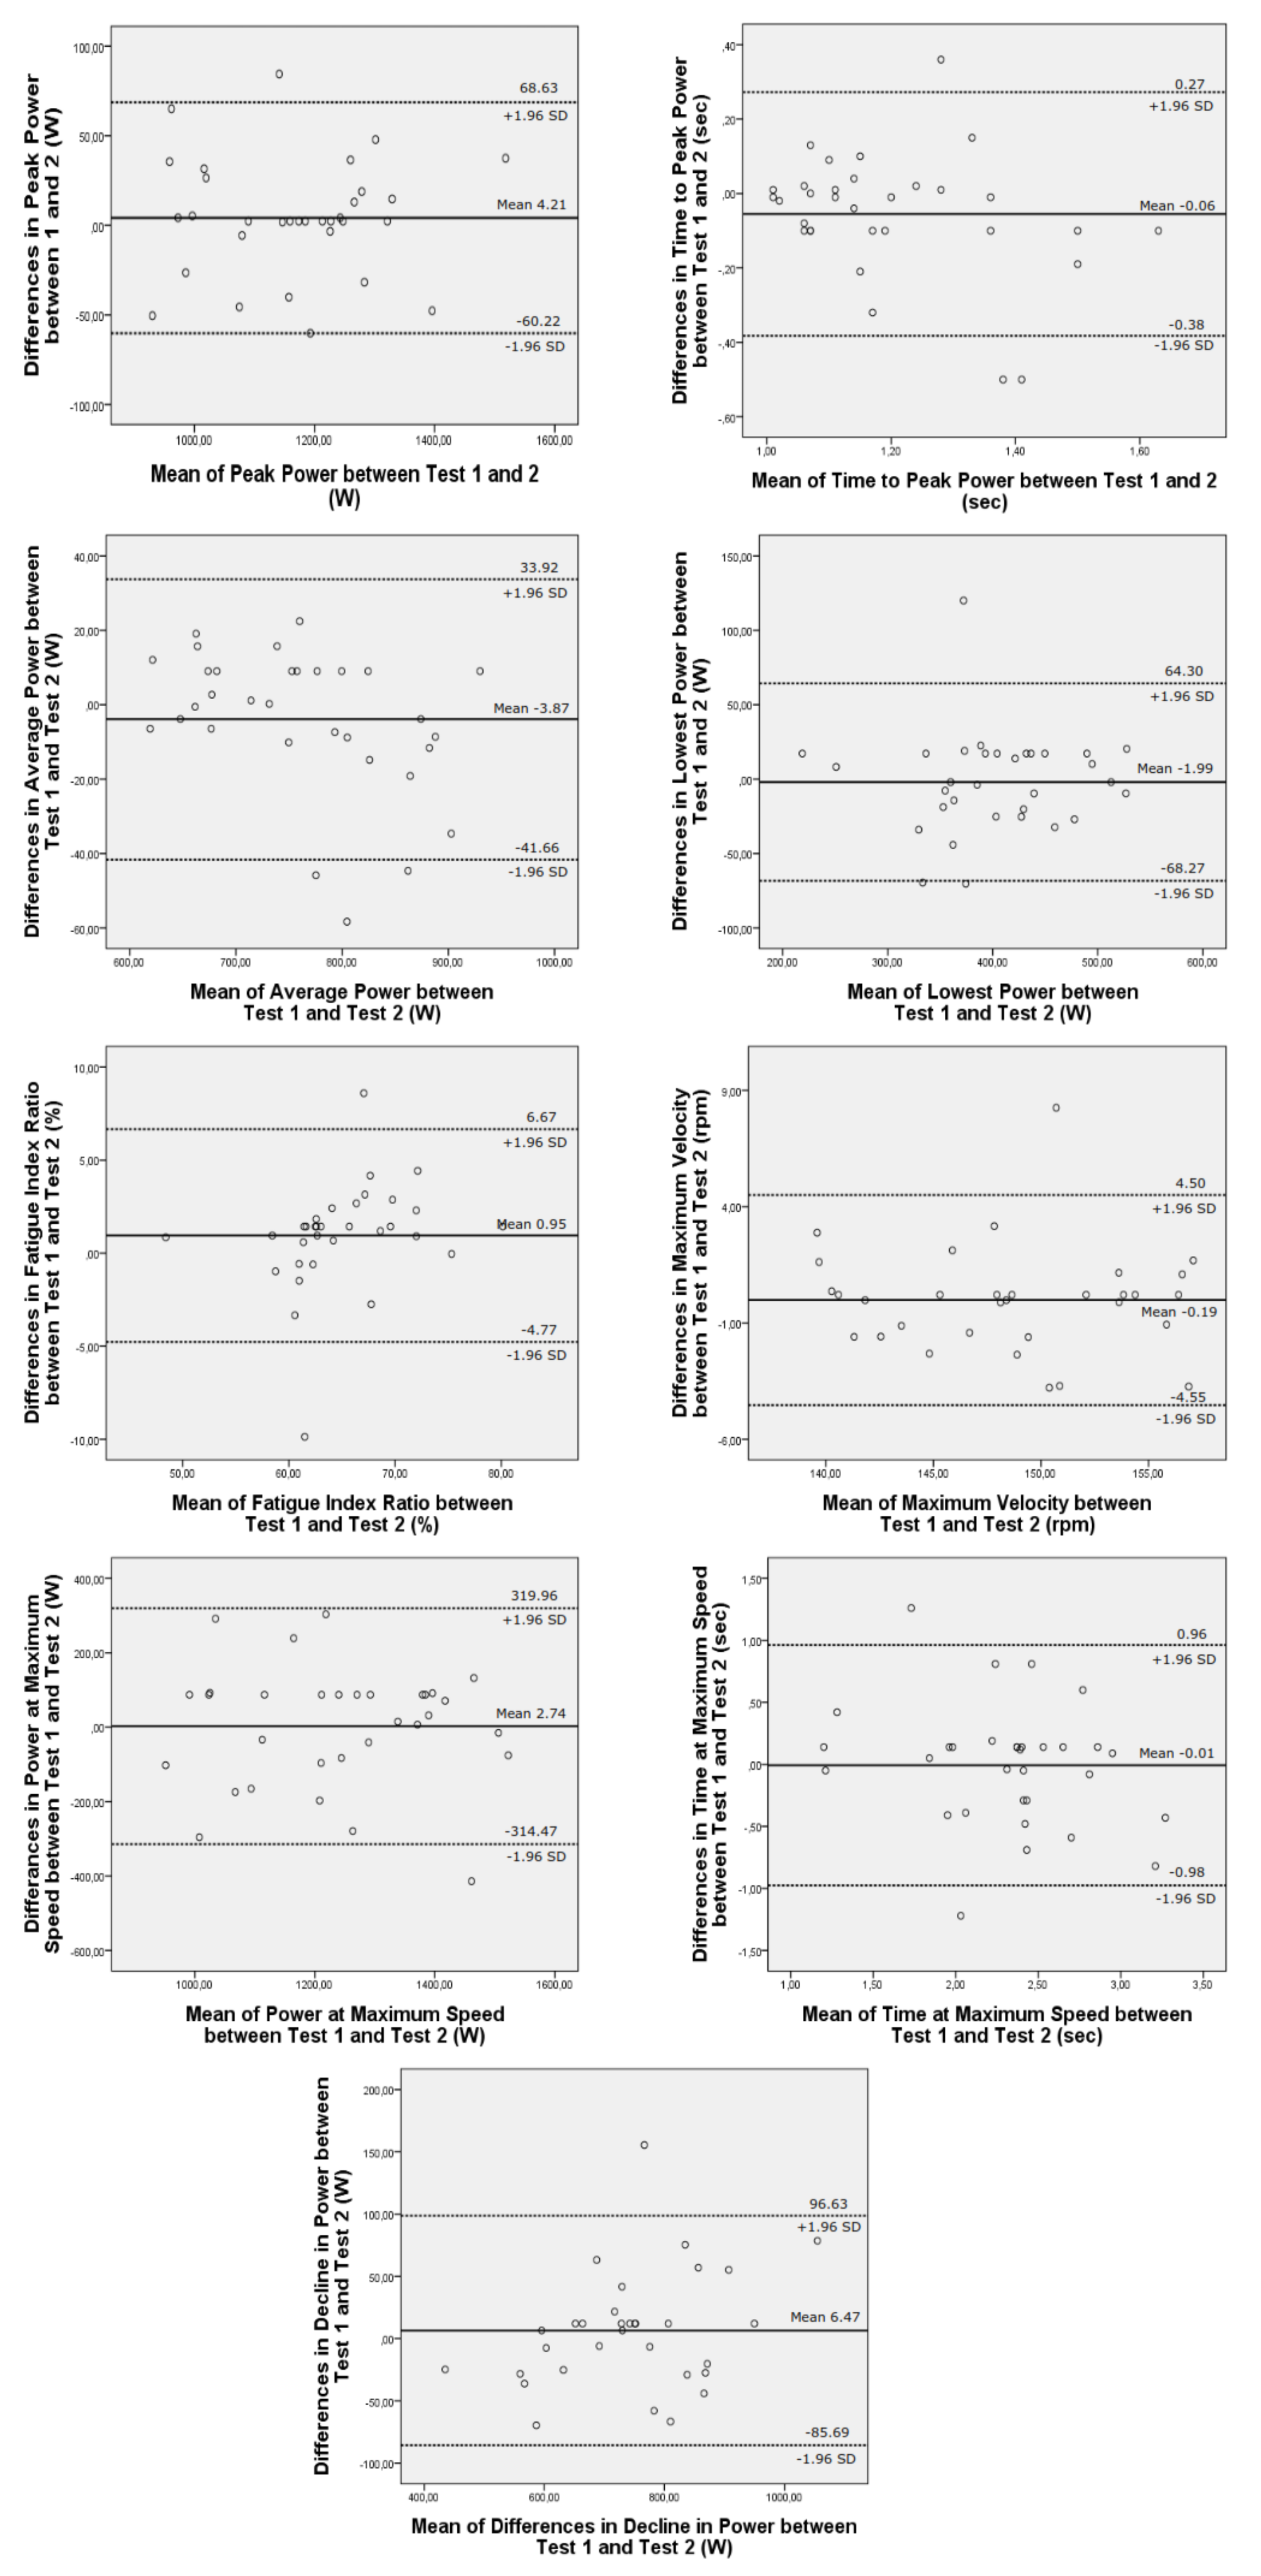
Bland-Altman plots for mean new generation power indices (Figure 1) illustrates that no major systematic bias was found in all plots, although there were some outliers. Analyses also revealed small ratio effects and heteroscedasticity in differences between repeated trails.
4. Discussion
Since new generation indices can sensitively determine and classify athletic performance due to both an increasing number of new parameters and their sensitivities based on raw data, new generation indices means have been increasingly used for standard laboratory assessments and scientific texts instead of tradition 5-s means. However, as of yet, there has not been a comprehensive reliability study in this regard. The aim of this study was therefore to investigate the retest reliability of the new generation power indices. In the present study, traditional indices were found to have high ICC values, and low scores for both SEM and SRD%. Moreover, reliability levels of PP, AP, LP, PD, FI, vmax, Pdec, and etot were found to be reliable and similar with the traditional ones (ICC ≥ 0.94; score of SRD% ≤ 8.78%). However, power and time-related indices calculated based on milliseconds such as tpp (ICC = 0.73; CV = 4.53%; SRD% = 12.56%), P@vmax (ICC = 0.76; CV = 6.55%; SRD% = 14.63%), and t@vmax (ICC = 0.73; CV = 8.88%; SRD% = 22.43%) showed moderate agreement.
As quoted by Monark’s official web-site, “the value 0.0449 means that for each rpm magnet passing the rpm sensor t the crank rotated 0.0449 revolutions (14/52/6 = ratio flywheel to crank/6 magnets). The frequency of the reading is dependent on the rpm. With 100 rpm you have about (52/14 × 6 × 100/60) 37 data points per second and this is with the resolution of 57600Hz!” [36]. It can be said that it is currently possible to have more sensitive raw data at the end of the Wingate administrations, as is seen on technical information. However, the data flow speed at the beginning of the test may cause some problems. We had some problematic t@vmax and P@vmax outcomes which had negative values (i.e., −200 s), while others were valid and as expected. It seems that the ability of optical sensors may have failed to satisfactorily calculate t@vmax and P@vmax during high-speed movements of the flywheel. The rapid over-loading of the system during the acceleration phase may lead to a miscommunication between sensors and magnets. Note that we removed all test results of those participants who gave invalid data from our study. As of yet, to the authors' knowledge, there has been no study that has reported any findings related to t@vmax or P@vmax in the literature.
Since P@vmax is calculated based on a moment measured in milliseconds where the velocity is the highest, it is very sensitive. Similarly, t@vmax is also calculated based on instantaneous velocity data. Moreover, tpp, which is calculated as time to elicit peak power from start to middle of the one second period in milliseconds, gives a moderate level of reliability. However, other power indices are calculated by one second means of instantaneous raw data. Therefore, the calculated P@vmax is greater than the PP at the end of the Wingate all-out test due to differences in time periods considered.
Martin et al. [23] claim that their Power Cycle can measure power based on instantaneous data in every 3° of pedal crank rotation or averaged over one complete revolution of the crank. They have reported that calculated power with resistance provided solely by the moment of inertia of the flywheel was ~2100 watts and occurred at a pedaling rate of ~130 rpm, while power data averaged over one complete revolution of the pedal crank was ~1300 watts with ~120 rpm. Peak power outputs revealed in ~2 s, and mean values of athletes’ maximum velocity were reported as ~230–240 rpms as measured in a period less than ~3–4 s. It should be noted that Peak Bike’s flywheel-weight and inertial characteristics are exactly the same as the Power Cycle. Based on this information, it may be assumed that the start cadence of the Wingate all-out test has to be fixed around 120–130 rpms, and in this case, tpp has to be revealed in a period of less than 2 s. Indeed, it is known that the most proper initial rpm to start the test is not the value of maximum crank velocities such as 230–240 rpms. Gullstrand and Larsson [18] suggest that “the power output is not optimal as the subject cannot pedal faster than up to a certain rate. Normally, most subjects will lose the neuromuscular controlled pedal frequency at approximately 200 rpm. This may occasionally be seen in an uneven frequency where for a short time the fluent pedaling is interrupted”. On the contrary, the value of 70 cadences shown as a default rpm in Monark software seems too low to reveal the highest individual peak power value. That is why we fixed the start rpm to the value of 120 based on the information obtained from Martin and his colleagues’ research [23]. In this context, the start rpm seems highly crucial. Instead of a fixed rpm, individually determined initial rpm may be a better alternative to improve new generation instantaneous power and time-related outcomes’ reliabilities; however, to the authors’ knowledge, there has not been a widely accepted method to evaluate a proper start rpm based on athletes’ individual performance characteristics.
Another important concept is the need for a comprehensive familiarization session. Since Peak Bike gives new generation power and time-related instantaneous measures, a comprehensive familiarization session that consists of (a) a session teaching overall pedaling technique, (b) short inertial-loading bursts without using any load, (c) a sufficient number of sprints with real test-load administrations, and (d) a whole all-out test practice for a 30-s test experience should be applied before real measurements are taken. Although many laboratories pay attention to athletes’ adaptations to test ergometer or protocol specificities when they test aerobic power (VO2max) or capacity, researchers do not spend enough time to familiarize the athletes if they test anaerobic power and/or capacity. On the contrary, anaerobic tasks can be more affected from lack of familiarization or non-standardized test administrations. Moreover, inattentive applications may alter instantaneous indices more dramatically than that of traditional ones. That is why it seems that a comprehensive familiarization session, which was performed in this study, is very important to increase determined test indices’ ICC values and to decrease the score of smallest worthwhile change (SWC).
Zajac et al. [37] indicated higher values of traditional power outputs in a 10-s Wingate administration with highly trained athletes. They also reported that peak power was reached more rapidly in 10 s than the 30-s test. They concluded that a psychological barrier in the 30-s test may affect the test’s anaerobic power outcomes. Since the instantaneous power outputs are more sensitive, they may be altered even more dramatically with the duration of the test. In order to examine power outputs related to explosive power such as PP, tpp, vmax, etc., it may be more accurate to administer tests of shorter durations (i.e., 5 to 10 s) to participants.
Pekünlü and his colleagues [38] suggested a new calculation method for fatigue called the mechanical work drop (MWD). The MWD is calculated by integrating instantaneous raw power data. This integration method examines the area under the power time curve between the time at instantaneous peak power and the test ending. They reported that MWD (ICC = 0.92, CV = 4.53%) may be more sensitive to the detection of real changes in fatigue compared to FI (ICC = 0.71, CV = 6.46%). In the present study, the calculated mechanical work drop’s ICC correlation was found to be 0.98 (CV = 2.31%) which is still greater than the PD and FI%.
Mean etot scores obtained from Peak Bike’s software were approximately 20,000–21,000 joules in the present study. However, the total metabolic energy expenditure of the Wingate all-out test was previously calculated by analyzing the fractions of the energy from aerobic, anaerobic alactic, and lactic acid metabolisms [39,40]. It was shown that a total of ~125–130 kJ of energy is utilized during a standard 30-s all-out test, which is highly above than the etot that was seen in the present study, likely because this value refers to an indirect measure of work done throughout the 30 s but not a value of metabolic energy expenditure. The value of etot indirectly calculated based on raw data was seen to be highly reliable (ICC = 0.97 and CV = 1.74%).
Surprisingly, average power indices calculated by traditionally based 5-s means (AP5s = ~720 W) were found to be significantly lower than that of calculated based on instantaneous raw data (AP = ~760 W) (p < 0.01). This may have resulted from inertial correction settings of the software used. The underlying reasons for the differences should be clarified by the Wingate Institute.
5. Conclusions
Reliability results of traditional power indices calculated based on 5-s means were similar with the previous findings in literature. Instantaneous new generation power indices are also reliable test outcomes. However, tpp, t@vmax, and P@vmax, which are calculated based on instantaneous raw data, are more sensitive than the others. This may be because it seems that they reflect a moment where the rpm is the highest, while the others are calculated by one second means. SRDs% for tpp, t@vmax, and P@vmax were between 12.46 and 22.43, which was considered to be low [41]. Operators may have some nonsense t@vmax and P@vmax data at the end of some tests. We inferred that this problem could be caused by a miscommunication in data flow during high-speed movements of the flywheel. Test administers should consider the fact that new generation power indices could be more easily affected by a lack of familiarization.
Acknowledgments
We state no professional relationships with companies or manufacturers who will benefit from the results of the present study. This study was not founded by any organization.
Author Contributions
O.O. conceived and designed the experiments; O.O., G.A.B., H.A., and E.V. performed the experiments; O.O., G.A.B., H.A., and E.V. analyzed the data; O.O., E.V., and G.A.B. wrote the paper.
Conflicts of Interest
The authors declare that they have no competing interests.
References
- Bar-Or, O. The Wingate Anaerobic Test: An Update on Methodology, Reliability and Validity. Sports Med. 1987, 4, 381–394. [Google Scholar] [CrossRef] [PubMed]
- Parker, D.F.; Carriere, L.; Hebestreit, H.; Bar, O. Anaerobic Endurance and Peak Muscle Power in Children with Spastic Cerebral Palsy. Am. J. Dis. Child. 1992, 146, 1069–1073. [Google Scholar] [CrossRef] [PubMed]
- Miszko, T.A.; Cress, M.E.; Slade, J.M.; Covey, C.J.; Agrawal, S.K.; Doerr, C.E. Effect of Strength and Power Training on Physical Function in Community-Dwelling Older Adults. J. Gerontol. Ser. A Biol. Sci. Med. Sci. 2003, 58, M171–M175. [Google Scholar] [CrossRef]
- Lewis, S.F.; Haller, R.G. Physiologic Measurement of Exercise and Fatigue with Special Reference to Chronic Fatigue Syndrome. Clin. Infect. Dis. 1991, 13, S98–S108. [Google Scholar] [CrossRef]
- Hoffman, J.R.; Epstein, S.; Einbinder, M.; Weinstein, Y. A Comparison Between the Wingate Anaerobic Power Test to Both Vertical Jump and Line Drill Tests in Basketball Players. J. Strength Cond. Res. 2000, 14, 261. [Google Scholar] [CrossRef]
- Chia, M.; Armstrong, N.; Childs, D. The Assessment of Children’s Anaerobic Performance Using Modifications of the Wingate Anaerobic Test. Pediatr. Exerc. Sci. 1997, 9, 80–89. [Google Scholar] [CrossRef]
- Armstrong, N.; Welsman, J.R.; Kirby, B.J. Performance on the Wingate Anaerobic Test and Maturation. Pediatr. Exerc. Sci. 1997, 9, 253–261. [Google Scholar] [CrossRef]
- Evans, J.A.; Quinney, H.A. Determination of resistance settings for anaerobic power testing. Can. J. Appl. Sport Sci. 1981, 6, 53–56. [Google Scholar] [PubMed]
- Hachana, Y.; Attia, A.; Nassib, S.; Shephard, R.J.; Chelly, M.S. Test-Retest Reliability, Criterion-Related Validity, and Minimal Detectable Change of Score on an Abbreviated Wingate Test for Field Sport Participants. J. Strength Cond. Res. 2012, 26, 1324–1330. [Google Scholar] [CrossRef] [PubMed]
- Inbar, O.; Bar-Or, O.; Skinner, J.S. The Development of the Wingate Anaerobic Test. In The Wingate Anaerobic Test; Human Kinetics: Champaign, IL, USA, 1996; pp. 1–7. ISBN 0873229460. [Google Scholar]
- Patton, J.F.; Duggan, A. An evaluation of tests of anaerobic power. Aviat. Space Environ. Med. 1987, 58, 237–242. [Google Scholar] [CrossRef] [PubMed]
- Del Coso, J.; Mora-Rodríguez, R. Validity of cycling peak power as measured by a short-sprint test versus the Wingate anaerobic test. Appl. Physiol. Nutr. Metab. 2006, 31, 186–189. [Google Scholar] [CrossRef] [PubMed]
- Kaczkowski, W.; Montgomery, D.L.; Taylor, A.W.; Klissouras, V. The relationship between muscle fiber composition and maximal anaerobic power and capacity. J. Sports Med. Phys. Fitness 1982, 22, 407–413. [Google Scholar] [PubMed]
- Sands, W.A.; McNeal, J.R.; Ochi, M.T.; Urbanek, T.L.; Jemni, M.; Stone, M.H. Comparison of the Wingate and Bosco Anaerobic Tests. J. Strength Cond. Res. 2004, 18, 810–815. [Google Scholar] [CrossRef] [PubMed]
- Stannarius, R.; Li, J.; Weissflog, W. Ferroelectric Smectic Phase Formed by Achiral Straight Core Mesogens. Phys. Rev. Lett. 2003, 90, 025502. [Google Scholar] [CrossRef] [PubMed]
- Watson, R.C.; Sargeant, T.L. Laboratory and on-ice test comparisons of anaerobic power of ice hockey players. Can. J. Appl. Sport Sci. 1986, 11, 218–224. [Google Scholar] [PubMed]
- Jaafar, H.; Rouis, M.; Coudrat, L.; Attiogbé, E.; Vandewalle, H.; Driss, T. Effects of Load on Wingate Test Performances and Reliability. J. Strength Cond. Res. 2014, 28, 3462–3468. [Google Scholar] [CrossRef] [PubMed]
- Gullstrand, L.; Larsson, L. The Wingate Test; Monark Exercise AB: Eskilstuna, Sweden, 1999. [Google Scholar]
- LaVoie, N.; Dallaire, J.; Brayne, S.; Barrett, D. Anaerobic testing using the Wingate and Evans-Quinney protocols with and without toe stirrups. Can. J. Appl. Sport Sci. 1984, 9, 1–5. [Google Scholar] [PubMed]
- McLester, J.R.; Green, J.M.; Chouinard, J.L. Effects of Standing vs. Seated Posture on Repeated Wingate Performance. J. Strength Cond. Res. 2004, 18, 816–820. [Google Scholar] [CrossRef] [PubMed]
- Dorel, S.; Couturier, A.; Lacur, J.-R.; Vandewalle, H.; Hautier, C.; Hug, F. Force-Velocity Relationship in Cycling Revisited. Med. Sci. Sports Exerc. 2009, 42, 1174–1183. [Google Scholar] [CrossRef] [PubMed]
- Ozkaya, O. Familiarization effects of an elliptical all-out test and the Wingate test based on mechanical power indices. J. Sports Sci. Med. 2013, 12, 521–525. [Google Scholar] [PubMed]
- Martin, J.C.; Wagner, B.M.; Coyle, E.F. Inertial-load method determines maximal cycling power in a single exercise bout. Med. Sci. Sports Exerc. 1997, 29, 1505–1512. [Google Scholar] [CrossRef] [PubMed]
- Buttelli, O. Effect of fatigue on maximal velocity and maximal torque during short exhausting cycling. Eur. J. Appl. Physiol. Occup. Physiol. 1996, 73, 175–179. [Google Scholar] [CrossRef] [PubMed]
- Kyle, C.R.; Mastropaolo, J. Predicting racing bicyclist performance using the unbraked flywheel method of bicycle ergometry. In Biomechanics of Sport and Kinanthropometry; Landry, F, Orban, W., Eds.; Symposia Specialist: Miami, FL, USA, 1976; pp. 211–220. [Google Scholar]
- Sargeant, A.J.; Hoinville, E.; Young, A. Maximum leg force and power output during short-term dynamic exercise. J. Appl. Physiol. 1981, 51, 1175–1182. [Google Scholar] [CrossRef] [PubMed]
- Hintzy, F.; Belli, A.; Grappe, F.; Rouillon, J.D. Optimal pedalling velocity characteristics during maximal and submaximal cycling in humans. Eur. J. Appl. Physiol. Occup. 1999, 79, 426–432. [Google Scholar] [CrossRef] [PubMed]
- Van Soest, A.J.; Casius, L.J.R. Which factors determine the optimal pedal rate in sprint cycling. Med. Sci. Sports Exerc. 2000, 32, 1927–1934. [Google Scholar] [CrossRef] [PubMed]
- Hautier, C.A.; Linossier, M.T.; Belli, A.; Lacour, J.R.; Arsac, L.M. Optimal velocity for maximal power production in non-isokinetic cycling is related to muscle fibre type composition. Eur. J. Appl. Physiol. Occup. Physiol. 1996, 74, 114–118. [Google Scholar] [CrossRef] [PubMed]
- Barfield, J.-P.; Sells, P.D.; Rowe, D.A.; Hanningan-Downs, K. Practice Effect of the Wingate Anaerobic Test. J. Strength Cond. Res. 2002, 16, 472–473. [Google Scholar] [CrossRef] [PubMed]
- Wittekind, A.L.; Micklewright, D.; Beneke, R. Teleoanticipation in all-out short duration cycling. Br. J. Sports Med. 2009, 45, 114–119. [Google Scholar] [CrossRef] [PubMed]
- Ozkaya, O.; Colakoglu, M.; Ozgonenel, O.; Fowler, D.; Colakoglu, S.; Tekat, A. Wingate anaerobic testing with a modified electromagnetically braked elliptical trainer. Part I: Methodological considerations. Isokinet. Exerc. Sci. 2009, 17, 107–113. [Google Scholar] [CrossRef]
- Campanini, I.; Merlo, A. Reliabilty, smallest real difference and concurrent validity of indices computed from GRF components in gait of stroke patients. Gait Posture 2009, 30, 127–131. [Google Scholar] [CrossRef] [PubMed]
- Martin Bland, J.; Altman, D.G. Statistical methods for assessing agreement between two methods of clinical measurement. Lancet 1986, 327, 307–310. [Google Scholar] [CrossRef]
- Hopkins, W.G.; Schabort, E.J.; Hawley, J.A. Reliability of Power in Physical Performance Tests. Sports Med. 2001, 31, 211–234. [Google Scholar] [CrossRef] [PubMed]
- Monark Exercise, AB. Available online:. Available online: http://monarkexercise.se/support/all-models/?lang=en (accessed on 1 November 2017).
- Zajac, A.; Jarzabek, R.; Wařkiewicz, Z. The Diagnostic Value of the 10- and 30-Second Wingate Test for Competitive Athletes. J. Strength Cond. Res. 1999, 13, 16–19. [Google Scholar] [CrossRef]
- Pekünlü, E.; Ozkaya, O.; Yapicioglu, B. Drop in mechanical work: A highly reliable fatigue-related output in Wingate All-out Test. Isokinet. Exerc. Sci. 2016, 24, 25–31. [Google Scholar] [CrossRef]
- Ozkaya, O.; Colakoglu, M.; Kuzucu, E.O.; Delextrat, A. An Elliptical Trainer May Render the Wingate All-out Test More Anaerobic. J. Strength Cond. Res. 2014, 28, 643–650. [Google Scholar] [CrossRef] [PubMed]
- Beneke, R.; Pollmann, C.; Bleif, I.; Leithäuser, R.M.; Hütler, H. How anaerobic is the wingate anaerobic test for humans? Eur. J. Appl. Physiol. 2002, 87, 388–392. [Google Scholar] [CrossRef] [PubMed]
- Flansbjer, U.-B.; Holmbäck, A.M.; Downham, D.; Patten, C.; Lexell, J. Reliability of gait performance tests in men and women with hemiparesis after stroke. J. Rehabil. Med. 2005, 37, 75–82. [Google Scholar] [CrossRef] [PubMed]
Figure 1.
Bland-Altman plots showing test-retest reliability of new generation power indices (n = 32).
Figure 1.
Bland-Altman plots showing test-retest reliability of new generation power indices (n = 32).


Table 1.
Results of test-retest reliability of traditional power indices calculated based on 5-s means (n = 32).
Table 1.
Results of test-retest reliability of traditional power indices calculated based on 5-s means (n = 32).
| Variable | Session 1 | Session 2 | ICC (95% CL) | Cohen’s d | SEM | SRD | SRD% | CV (95% CL) | SWC |
|---|---|---|---|---|---|---|---|---|---|
| PP5s (W) | 1060.33 ± 122.70 | 1065.92 ± 127.32 | 0.987 (0.974–0.994) | −0.05 | 9.95 | 0.28 | 2.69 | 0.97 (0.45–1.49) | 2.81 |
| AP5s (W) | 710.90 ± 82.41 | 728.02 ± 88.83 | 0.984 (0.967–0.992) | −0.20 | 11.04 | 0.31 | 4.27 | 1.54 (0.58–2.12) | 3.12 |
| LP5s (W) | 457.69 ± 74.29 | 472.52 ± 77.37 | 0.966 (0.931–0.984) | −0.20 | 12.28 | 0.34 | 7.66 | 2.77 (1.56–3.97) | 3.47 |
| PD5s (W·s−1) | 20.09 ± 3.63 | 19.78 ± 3.29 | 0.970 (0.938–0.985) | 0.09 | 0.45 | 0.01 | 6.38 | 2.30 (1.29–3.31) | 0.13 |
| FI5s (%) | 56.63 ± 6.53 | 55.59 ± 5.79 | 0.948 (0.893–0.975) | 0.17 | 1.08 | 0.03 | 5.23 | 1.89 (1.05–2.72) | 0.30 |
PP5s = Peak power in 5-s means; AP5s = Average power in 5-s means; LP5s = Lowest power in 5-s means; PD5s = Power drop based on 5-s means; FI5s (%) = Fatigue index ratio in 5-s means; ICC = Intra-class correlation coefficient; SEM = Standard error of measurement; SRD = Smallest real difference; CV = Coefficient of variation; SWC = Smallest worthwhile change; Data are means ± SD.
Table 2.
Results of test-retest reliability of new generation power indices (n = 32).
| Variable | Session-1 | Session-2 | ICC (95% CL) | Cohen’s d | SEM | SRD | SRD% | CV (95% CL) | SWC |
|---|---|---|---|---|---|---|---|---|---|
| PP (W) | 1169.35 ± 142.57 | 1165.15 ± 142.16 | 0.986 (0.972–0.993) | −0.03 | 11.82 | 0.33 | 2.89 | 1.04 (0.52–1.56) | 3.34 |
| tPP (s) | 1.17 ± 0.16 | 1.23 ± 0.20 | 0.730 (0.447–0.868) | −0.33 | 0.06 | 0.01 | 12.56 | 4.53 (2.07–7.00) | 0.02 |
| AP (W) | 760.54 ± 84.68 | 764.41 ± 92.55 | 0.988 (0.976–0.994) | −0.04 | 6.97 | 0.19 | 2.48 | 0.89 (0.48–1.31) | 1.97 |
| LP (W) | 401.46 ± 74.42 | 403.45 ± 73.02 | 0.944 (0.886–0.973) | −0.03 | 12.00 | 0.33 | 8.78 | 4.28 (0.74–7.81) | 4.52 |
| PD (W·s−1) | 25.60 ± 4.47 | 25.08 ± 4.01 | 0.973 (0.945–0.987) | 0.12 | 0.53 | 0.01 | 5.92 | 3.21 (−0.07–6.49) | 0.24 |
| FI (%) | 65.43 ± 6.41 | 64.48 ± 5.63 | 0.938 (0.873–0.970) | 0.15 | 1.09 | 0.03 | 4.64 | 2.82 (−0.52–6.15) | 0.07 |
| vmax (rpm) | 148.54 ± 5.59 | 148.55 ± 5.71 | 0.957 (0.911–0.979) | −0.01 | 0.76 | 0.01 | 1.42 | 1.68 (−1.69–5.05) | 0.70 |
| P@vmax (W) | 1240.90 ± 180.46 | 1238.16 ± 184.42 | 0.755 (0.498–0.880) | 0.02 | 63.01 | 1.75 | 14.63 | 6.55 (2.81–10.28) | 22.74 |
| t@vmax (ms) | 2.30 ± 0.51 | 2.31 ± 0.61 | 0.730 (0.508–0.883) | −0.02 | 0.18 | 0.01 | 22.43 | 8.88 (3.89–13.86) | 0.06 |
| Pdec (W) | 747.33 ± 138.10 | 740.86 ± 123.59 | 0.967 (0.932–0.984) | 0.05 | 17.30 | 0.48 | 6.41 | 3.43 (0.05–6.81) | 3.43 |
| etot (kJ) | 21.47 ± 2.51 | 21.33 ± 2.73 | 0.968 (0.934–0.984) | 0.05 | 0.37 | 10.36 | 4.81 | 1.74 (1.15–2.33) | 0.11 |
PP = Peak power; AP = Average power; LP = Lowest power; PD = Power drop; FI (%) = Fatigue index ratio; tPP = Time to peak power; vmax = Maximum velocity; P@vmax = Power at maximum speed; t@vmax = Time at maximum speed; Pdec = Decline in power; etot = Total energy expenditure; ICC = Intra-class correlation coefficient; SEM = Standard error of measurement; SRD = Smallest real difference; CV = Coefficient of variation; SWC = Smallest worthwhile change; Data are means ± SD.
© 2018 by the authors. Licensee MDPI, Basel, Switzerland. This article is an open access article distributed under the terms and conditions of the Creative Commons Attribution (CC BY) license (http://creativecommons.org/licenses/by/4.0/).
Share and Cite
MDPI and ACS Style
Ozkaya, O.; Balci, G.A.; As, H.; Vardarli, E. The Test-Retest Reliability of New Generation Power Indices of Wingate All-Out Test. Sports 2018, 6, 31. https://doi.org/10.3390/sports6020031
AMA Style
Ozkaya O, Balci GA, As H, Vardarli E. The Test-Retest Reliability of New Generation Power Indices of Wingate All-Out Test. Sports. 2018; 6(2):31. https://doi.org/10.3390/sports6020031
Chicago/Turabian StyleOzkaya, Ozgur, Gorkem Aybars Balci, Hakan As, and Emre Vardarli. 2018. "The Test-Retest Reliability of New Generation Power Indices of Wingate All-Out Test" Sports 6, no. 2: 31. https://doi.org/10.3390/sports6020031
Note that from the first issue of 2016, this journal uses article numbers instead of page numbers. See further details here.