Article

Phase Evolution and Mechanical Behavior of the Semi-Solid SIMA Processed 7075 Aluminum Alloy

by
Behzad Binesh
and
Mehrdad Aghaie-Khafri
*
Faculty of Materials Science and Engineering, K. N. Toosi University of Technology, Tehran 1999143344, Iran
*
Author to whom correspondence should be addressed.
Metals 2016, 6(3), 42; https://doi.org/10.3390/met6030042
Submission received: 12 December 2015 / Revised: 4 February 2016 / Accepted: 6 February 2016 / Published: 23 February 2016
(This article belongs to the Special Issue Aluminum Alloys)

Abstract

:
Microstructural and mechanical behaviors of semi-solid 7075 aluminum alloy were investigated during semi-solid processing. The strain induced melt activation (SIMA) process consisted of applying uniaxial compression strain at ambient temperature and subsequent semi-solid treatment at 600–620 °C for 5–35 min. Microstructures were characterized by scanning electron microscope (SEM), energy dispersive spectroscopy (EDS), and X-ray diffraction (XRD). During the isothermal heating, intermetallic precipitates were gradually dissolved through the phase transformations of α-Al + η (MgZn2) → liquid phase (L) and then α-Al + Al2CuMg (S) + Mg2Si → liquid phase (L). However, Fe-rich precipitates appeared mainly as square particles at the grain boundaries at low heating temperatures. Cu and Si were enriched at the grain boundaries during the isothermal treatment while a significant depletion of Mg was also observed at the grain boundaries. The mechanical behavior of different SIMA processed samples in the semi-solid state were investigated by means of hot compression tests. The results indicated that the SIMA processed sample with near equiaxed microstructure exhibits the highest flow resistance during thixoforming which significantly decreases in the case of samples with globular microstructures. This was justified based on the governing deformation mechanisms for different thixoformed microstructures.

Graphical Abstract

1. Introduction

Semi-solid metal processing is a single step fabrication method for production of near net shape metallic parts [1,2,3]. Advantages of semi-solid processing when it is compared with the conventional casting, forging, and powder metallurgy processes are (i) reduction of the porosity, macrosegregation, and surface cracks; (ii) high dimensional accuracy of the produced parts; (iii) extending of the forming die life due to decreasing of the casting temperature and required forming force; and (iv) the uniform filling of the die and reduction of the manufacturing stages and costs [4,5].
The main goal in the semi-solid forming processes is to achieve a thixotropic microstructure consisting of fine and spherical solid grains which are uniformly distributed in the liquid matrix [6,7]. Various routes have been developed for production of thixotropic aluminum, magnesium, lead, and also ferrous alloys including mechanical and magneto-hydrodynamic (MHD) stirring processes, the thermo-mechanical strain induced melt activation (SIMA) process and the spray casting process [7,8,9]. The SIMA process which is based on the mechanical work was introduced by Young et al. [10] in the 1980s. This process has received great attention in recent years due to its simplicity, low equipment costs, and its capability to process many engineering alloys [8]. The two main stages of the SIMA process are cold or warm plastic deformation and then partial remelting in the semi-solid range [11,12].
Many studies have been focused on the semi-solid microstructure of cast aluminum alloys due to superior semi-solid formability [12,13]. However, the cast products show poorer mechanical properties than wrought alloys e.g., 2xxx, 6xxx, and especially 7xxx series. This restricts their applicability in the high strength applications such as aerospace and automotive. On the other hand, control of the semi-solid heat treatment in the wrought alloys is relatively difficult due to their wide solidification range and high sensitivity of solid fraction to temperature variations (steep slope of the solid fraction versus temperature). Furthermore, the wrought alloys are severely susceptible to formation of hot tearing during the forming process [14]. Consequently, investigation on the semi-solid microstructure of wrought aluminum alloys to achieve an appropriate thixotropic microstructure is vital. Yong et al. [15] prepared an appropriate 7075 semi-solid feedstock by 50% swaging of the specimens at room temperature and then heat treating at 590 °C. They also investigated the properties of the thixoforged part. Multi step heat treatment in thixoforming processes was investigated by Chayong et al. [16,17]. Atkinson et al. [18] studied the recrystallization of 7075 Al alloy during the recrystallization and partial melting (RAP) process. Vaneetveld et al. [19] investigated the effects of heating parameters on the recrystallization in the RAP process and suggested using the high solid fraction to prevent hot tearing in the thixoforging process. Bolouri et al. [20] studied the effect of cold work on the semi-solid microstructure by compression straining of the samples up to 40% and Mohammadi et al. [21] investigated the effects of the isothermal treatment on the semi-solid microstructure of extruded samples.
Previous studies on the semi-solid processing of 7075 aluminum alloy were mainly restricted to investigations in the field of thixotropic feedstock preparation criteria and producing some thixoformed parts. However, detailed information of the phase transformations during partial remelting and the correlation between the initial microstructure and rheological behavior as well as their final mechanical properties needs to be further investigated. There is a lack of thorough research on this topic in the literature. Consequently, the present work aims to investigate the phase evolution and kinetics of partial remelting during isothermal treatment in the mushy zone and the semi-solid deformation behavior of AA7075 alloy.

2. Experimental Procedure

2.1. Materials and Thermal Analysis

Commercial extruded round bar of 7075-T6 aluminum alloy was used as the starting material, the chemical composition of which is shown in Table 1.
In order to determine the solidus and liquidus temperatures and the solid volume fraction versus the temperature curve of 7075 alloy, thermal analysis was carried out using a Metler Star SW 10 differential scanning calorimeter (DSC) apparatus, Metler, Giessen, Germany. Samples of the material (30 mg) were put into the alumina pan and then heated to 700 °C at 10 °C/min under nitrogen atmosphere. The solid volume fraction-temperature relationship was determined using the obtained DSC curve.

2.2. SIMA Process

The SIMA process was carried out to obtain a thixotropic microstructure in 7075 Al alloy. Cylindrical samples with a diameter of 30 mm and height of 35 mm were machined from the starting material. The samples were stress relieved at 460 °C for 1 h, and then air cooled. Compression of cylindrical samples, with a compression ratio of 20%, was carried out at room temperature using a high strain rate (~15 s−1) hammer apparatus. The compressed specimens were machined to samples with a diameter of 20 mm and height of 15 mm to ensure uniform strain in the core section. Isothermal treatment of samples was carried out at three different temperatures of 600, 610, and 620 °C with an accuracy of ±1 °C for 5–35 min in a resistance furnace. Heating cycles were interrupted at predetermined interval times and then samples were quenched to study the microstructure.

2.3. Compression Tests

The thixoforming process consisting of hot compression experiments at the semi-solid temperature range was carried out on the specimens of different initial microstructures. The cylindrical specimens with 11 mm in height and 7 mm in diameter, according to ASTM E209 standard, were prepared from the SIMA processed samples. The isothermal hot compression tests were carried out at temperatures of 600 and 610 °C and strain rate of 0.3 s−1 using a Gotech-Al7000 model universal testing machine, Gotech, Taichung, Taiwan, equipped with an electrical resistance furnace. The specimens were first preheated to the preset temperature and soaked for 5 min to homogenize the samples. The specimens were then compressed up to a strain of 0.6 followed by rapid quenching in water. A high accuracy load cell was used to record the true stress values, and the true strain values were computed using the displacement data. A very thin mica plate was used to reduce the friction effect and to prevent the adhesion of the specimen on the die. The specimens were sectioned parallel to the deformation direction to study the microstructural changes.

2.4. Metallography and Microstructural Characterization

The microstructure of the quenched samples was examined using the standard metallography method. The surface perpendicular to the direction of the compression was ground with standard SiC abrasive papers and polished with 0.25 µm diamond paste. Samples were etched using modified Keller etchant solution (3 mL HF, 2 mL HCl; 20 mL HNO3; 175 mL H2O). Microstructural investigations were carried out using a Neophot 32 optical microscope, Norfab, Trondheim, Norway, and Vega©Tescan, Tescan, Libušina, Czech Republic, and Mira3Tescan field emission scanning electron microscope, Tescan, Libušina, Czech Republic, equipped with EDS detector (Tescan, Libušina, Czech Republic). The linear intercept method was used to determine the average grain size. A series of straight lines with a specified length was considered on the optical micrographs for each sample and the average grain size was determined by division of the line length (L) by the number of intercepted grains (N). The shape factor of the solid grains was measured by means of Clemex professional edition image analyzer software (version 5.0, Clemex Technologies Inc., Longueuil, QC, Canada) and using Equation (1) [22]:
F = N = 1 N 4 π A / P 2 N
where A and P are area and perimeter of the solid grains, respectively, and N is the number of grains. For each sample, measurements were taken from the whole sectioned area including 300–400 solid particles per sample.
X-ray diffraction (XRD) analysis was used to investigate phase evolution in the semi-solid treated samples. XRD experiment was carried out using a Philips X’pert model apparatus, Panalytical, Eindhoven, The Netherlands, with CuKα target and wave length of 0.15406 nm.

3. Results and Discussion

3.1. Microstructure and Thermal Analysis of the Starting 7075 Alloy

Figure 1 shows the scanning electron microscope (SEM) micrographs of the as-received 7075 aluminum alloy. It can be observed (Figure 1a,b) that the microstructure of the alloy consists of directed α-Al grains and some precipitate particles in the direction of the initial extrusion process. It is worth noting that Zn, Cu, and Mg are the main alloying elements in 7075 alloy which play an important role in the formation of precipitates. In the 7xxx series of aluminum alloys, when the Zn:Mg ratios are between 1:2 and 1:3, MgZn2 (η) precipitates are produced at ageing temperatures below 200 °C and are the main strengthening factor in 7xxx alloys [18]. The dimensions of these precipitates are only a few tens of nanometer which can only be revealed by TEM technique. Considering Figure 1b–d, EDS analysis results of the coarse precipitate particles, as summarized in Table 2, suggested them to be (I) Al2CuMg intermetallic phase (which is usually denoted as S-phase) with relatively smooth corners (C1 and C2 in Figure 1b,d), (II) Al6(Cu,Fe) intermetallic phase which is also known as Al23Fe4Cu or α(FeCu) with polygonal (B1 in Figure 1b) or irregular (B2 in Figure 1c) shapes, (III) Al7Cu2Fe (β) phase with irregular shapes which have been elongated along the extrusion direction (A in Figure 1b) and (IV) dark Mg2Si precipitates with irregular shapes (D in Figure 1c). Considering the EDS analysis results, Fe-rich intermetallic phases (Al6(Cu,Fe) and Al7Cu2Fe) also contain small amounts of manganese which can be substituted for iron as a result of their close atomic radii.
Figure 2a shows the DSC curve of the 7075 aluminum sample. The solidus and liquidus temperatures based on the DSC curve were 486 and 649 °C, respectively. The characteristic values of the areas under the DSC peaks calculated for mass unity are also included in Figure 2a. The liquid or solid fraction versus the temperature curve was obtained by integration of the DSC curve (Figure 2b). The results were used to determine the isothermal heat treatment temperatures in the SIMA process. It is worth noting that the liquid or solid volume fraction at a known temperature based on Figure 2b is not exactly the same as its values appearing in the micrographs. This is due to insufficient cooling rate of the semi-solid samples after isothermal treatment. In other words, some of the liquid fraction that transforms to the solid during quenching is considered as solid fraction and therefore the liquid volume fraction observed in the micrographs is always lower than that determined by Figure 2b.

3.2. Microstructural Evolution during Partial Remelting of the Compressed 7075 Alloy

Microstructures of 7075 specimens after 20% compression and isothermal heat treating at the semi-solid temperature of 600 °C for various times during the SIMA process are shown in Figure 3. The initial microstructure consisted of plastically deformed grains that gradually transforms to a globular microstructure of spherical and equiaxed grains after heating and partial remelting at 600 °C. Micrographs of Figure 3a,b show that following 5 min heating of the sample at 600 °C, no evidence of recrystallization was observed. Following the increase of the heating time up to 10 min, a near equiaxed microstructure consisting of elongated and polygonal solid grains with what appears to be quenched liquid at the grain boundaries was formed (Figure 3c and Figure 4a). In some zones, the size of these grains is quite small which implies a recrystallization phenomenon. Moreover, the formation of the liquid phase is expected to be as a result of partial remelting during isothermal holding at 600 °C. The results of research conducted by Atkinson et al. [18] revealed that liquids are first formed at the recrystallized grain boundaries of RAP processed 7075 alloy because these are areas with higher solute concentrations. However, the liquid phase has not penetrated thoroughly into the grain boundaries which results in incomplete grain boundary wetting, as shown in Figure 4a. The mechanism of low melting point phase formation in the semi-solid microstructure is extensively discussed in Section 3.4. With further extension of the heating time up to 15 min, the whole microstructure was transformed into individual polygonal grains due to separation and increase of the liquid phase (Figure 3d). The grain size significantly increased compared with that of the grains which had just recrystallized and separated, shown in Figure 3c. This indicates that the separation and coarsening were in competition.
Comparing the primary grain size of the deformed sample and the resulting polygonal particle size, it can be suggested that the recrystallization and separation dominated during the period of 5 min to 10 min or at a longer time and then the coarsening became the dominant process. During the coarsening stage, it was found that the liquid amount is relatively small and the neighboring grains are only separated by a thin liquid layer (Figure 3c,d).
During the isothermal heating period of 15 min to 25 min, the interconnection between the solid grains reduced and the grains gradually became spherical (Figure 3e). The spheroidization mainly occurred during this stage. During the period of 25 min to 35 min, the liquid phase obviously increased (comparing Figure 3e,f) which finally led to intergranular formation of thick eutectic regions following 35 min heating of the sample (indicated by the E letter in Figure 3f). This is evidenced with the eutectic phase becoming the predominant feature at grain boundaries after semi-solid soaking (Figure 4b). It can be expected that the coarsening of spherical grains will occur with raising of the heating time over 35 min.
In addition, some intragranular islands which are claimed to be liquid pools just before quenching, were observed within the solid grains. Therefore, the semi-solid microstructure consisted of α-Al spherical solid grains, intergranular eutectic liquid film and entrapped liquid droplets within the solid grains. Entrapped liquid droplets were produced in two different ways. The first was as a consequence of alloying elements segregation within the solid particles during the partial remelting. In this case, some fine liquid droplets entrap within the solid grains. The second one was due to coalescence of solid grains with complex geometrical shape during the heating stage to decrease the solid-liquid phase interfacial energy. In this condition, larger droplets of the liquid phase, in comparison with the former, were created within the grains [23]. As is observed in Figure 3, with longer holding times some of the fine liquid droplets as a result of coalescence phenomena or atomic diffusion joined to the larger liquid droplets. Subsequently, these new liquid droplets become more spherical to reduce the solid/liquid interfacial energy. Finally, with further increase of the holding time, a lesser number of the entrapped liquid droplets was produced owing to diffusion into the liquid phase matrix that surrounded the solid grains.

3.3. Kinetics of the Microstructural Evolution during Partial Remelting

Considering the obtained results in the present study, the kinetics of the microstructural evolution of 7075 samples during the SIMA process can be divided into four steps. (I) recovery, recrystallization and structural separation, (II) coarsening of polygonal solid grains, (III) spheroidization of polygonal solid grains and (IV) coarsening of spherical grains. Recovery, recrystallization, and structural separation mainly occur in the early stages of the isothermal heating operation. During recovery and recrystallization, vacancies are joined to each other and dislocations are rearranged as low energy structures by climbing or cross slipping and subgrain boundaries are created. In this step, grains of high dislocation density are replaced by new subgrains with less dislocation density. Moreover, because the holding temperature is higher than the eutectic line, partial remelting also occurred [20,23]. It has been found that when the angle between subgrains is greater than 20°, the surface energy of the grain boundaries is greater than two fold of the solid/liquid interfacial energy (γgb > 2γsl). If these grain boundaries contact with liquid phase, the grain boundaries are replaced by a thin liquid film. Considering the vice versa case i.e. γgb < 2γsl, low energy grain boundaries will be formed which are not wetted by the liquid phase. If two solid grains reach together through such a low energy boundary, they can be joined together and stimulate the coalescence of solid particles [24].
With rising of the isothermal heating time, the liquid volume fraction becomes greater and isolated polygonal solid grains are created. By continuing the heating process, these grains grow and coarsen. The growth and coarsening of the solid grains in the SIMA process are controlled by two mechanisms of coalescence and Ostwald ripening. During the growing and coarsening of the microstructure, diffusion of the solid material from regions with high curvature to low curvature points occurs based on Equation (2) [12]. This subsequently provides the required driving force for spheroidization of solid grains.
Δ T r = 2 σ T m V s k Δ H
where ∆Tr = TmT represents the difference to the equilibrium melting point, Tm is the equilibrium transformation temperature, k is the mean surface curvature of the solid particles, σ is the surface tension and ∆H (a negative value) is the molar change in the enthalpies of the solid and liquid.
As long as the grains are not spherical during semi-solid treatment, the spheroidization process leads to change of the particles shape from polygonal to spherical where the numbers per unit volume remain constant. Following this stage, smaller grains which have a lower melting point according to Equation (2), are melted in favor of the larger grains and the numbers per unit volume are reduced. The microstructure of samples that have been subjected to partial remelting in the SIMA process, are evolved by one of the mentioned mechanisms depending on the sphericity of solid grains and the amount of the liquid volume fraction [25].
Ostwald ripening is a diffusion controlled mechanism and acts as the dominant mechanism at high liquid volume fractions i.e. high heating temperatures and long holding times. This mechanism is less effective in particle growth but has a great influence on the spheroidization of solid grains. In contrast, the coalescence mechanism which needs shorter holding times and a small amount of liquid fractions, is more effective in grain growth and has a minor effect on the spheroidization process [25,26,27].
When the liquid fraction is low (early stages of heating operation), the solid grains are readily in contact with one another, and coalescence is the dominant mechanism in the coarsening of the microstructure. This can be verified by considering the microscopic images shown in Figure 3d–f. The arrows on the micrographs show that some grain boundaries are removed due to coalescence of the solid grains. Therefore, it can be concluded that the growing and coarsening of grains in the sample heated at 600 °C for 15 min mainly occurs through the coalescence mechanism due to the relatively low liquid fraction (Figure 3d). With further increase of the holding time (Figure 3e,f), the liquid fraction increased and Ostwald ripening mechanism was more effective in the coarsening process. When the majority of the solid grains gained uniform surface curvature through these two mechanisms, the growth of spherical grains commences. Therefore, spheroidization and further growth of solid grains by the two mentioned competing mechanisms are expected in the SIMA process [25].

3.4. Phase Evolution and Alloying Element Distribution during Partial Remelting of Compressed 7075 Alloy

A close examination of the micrographs in 
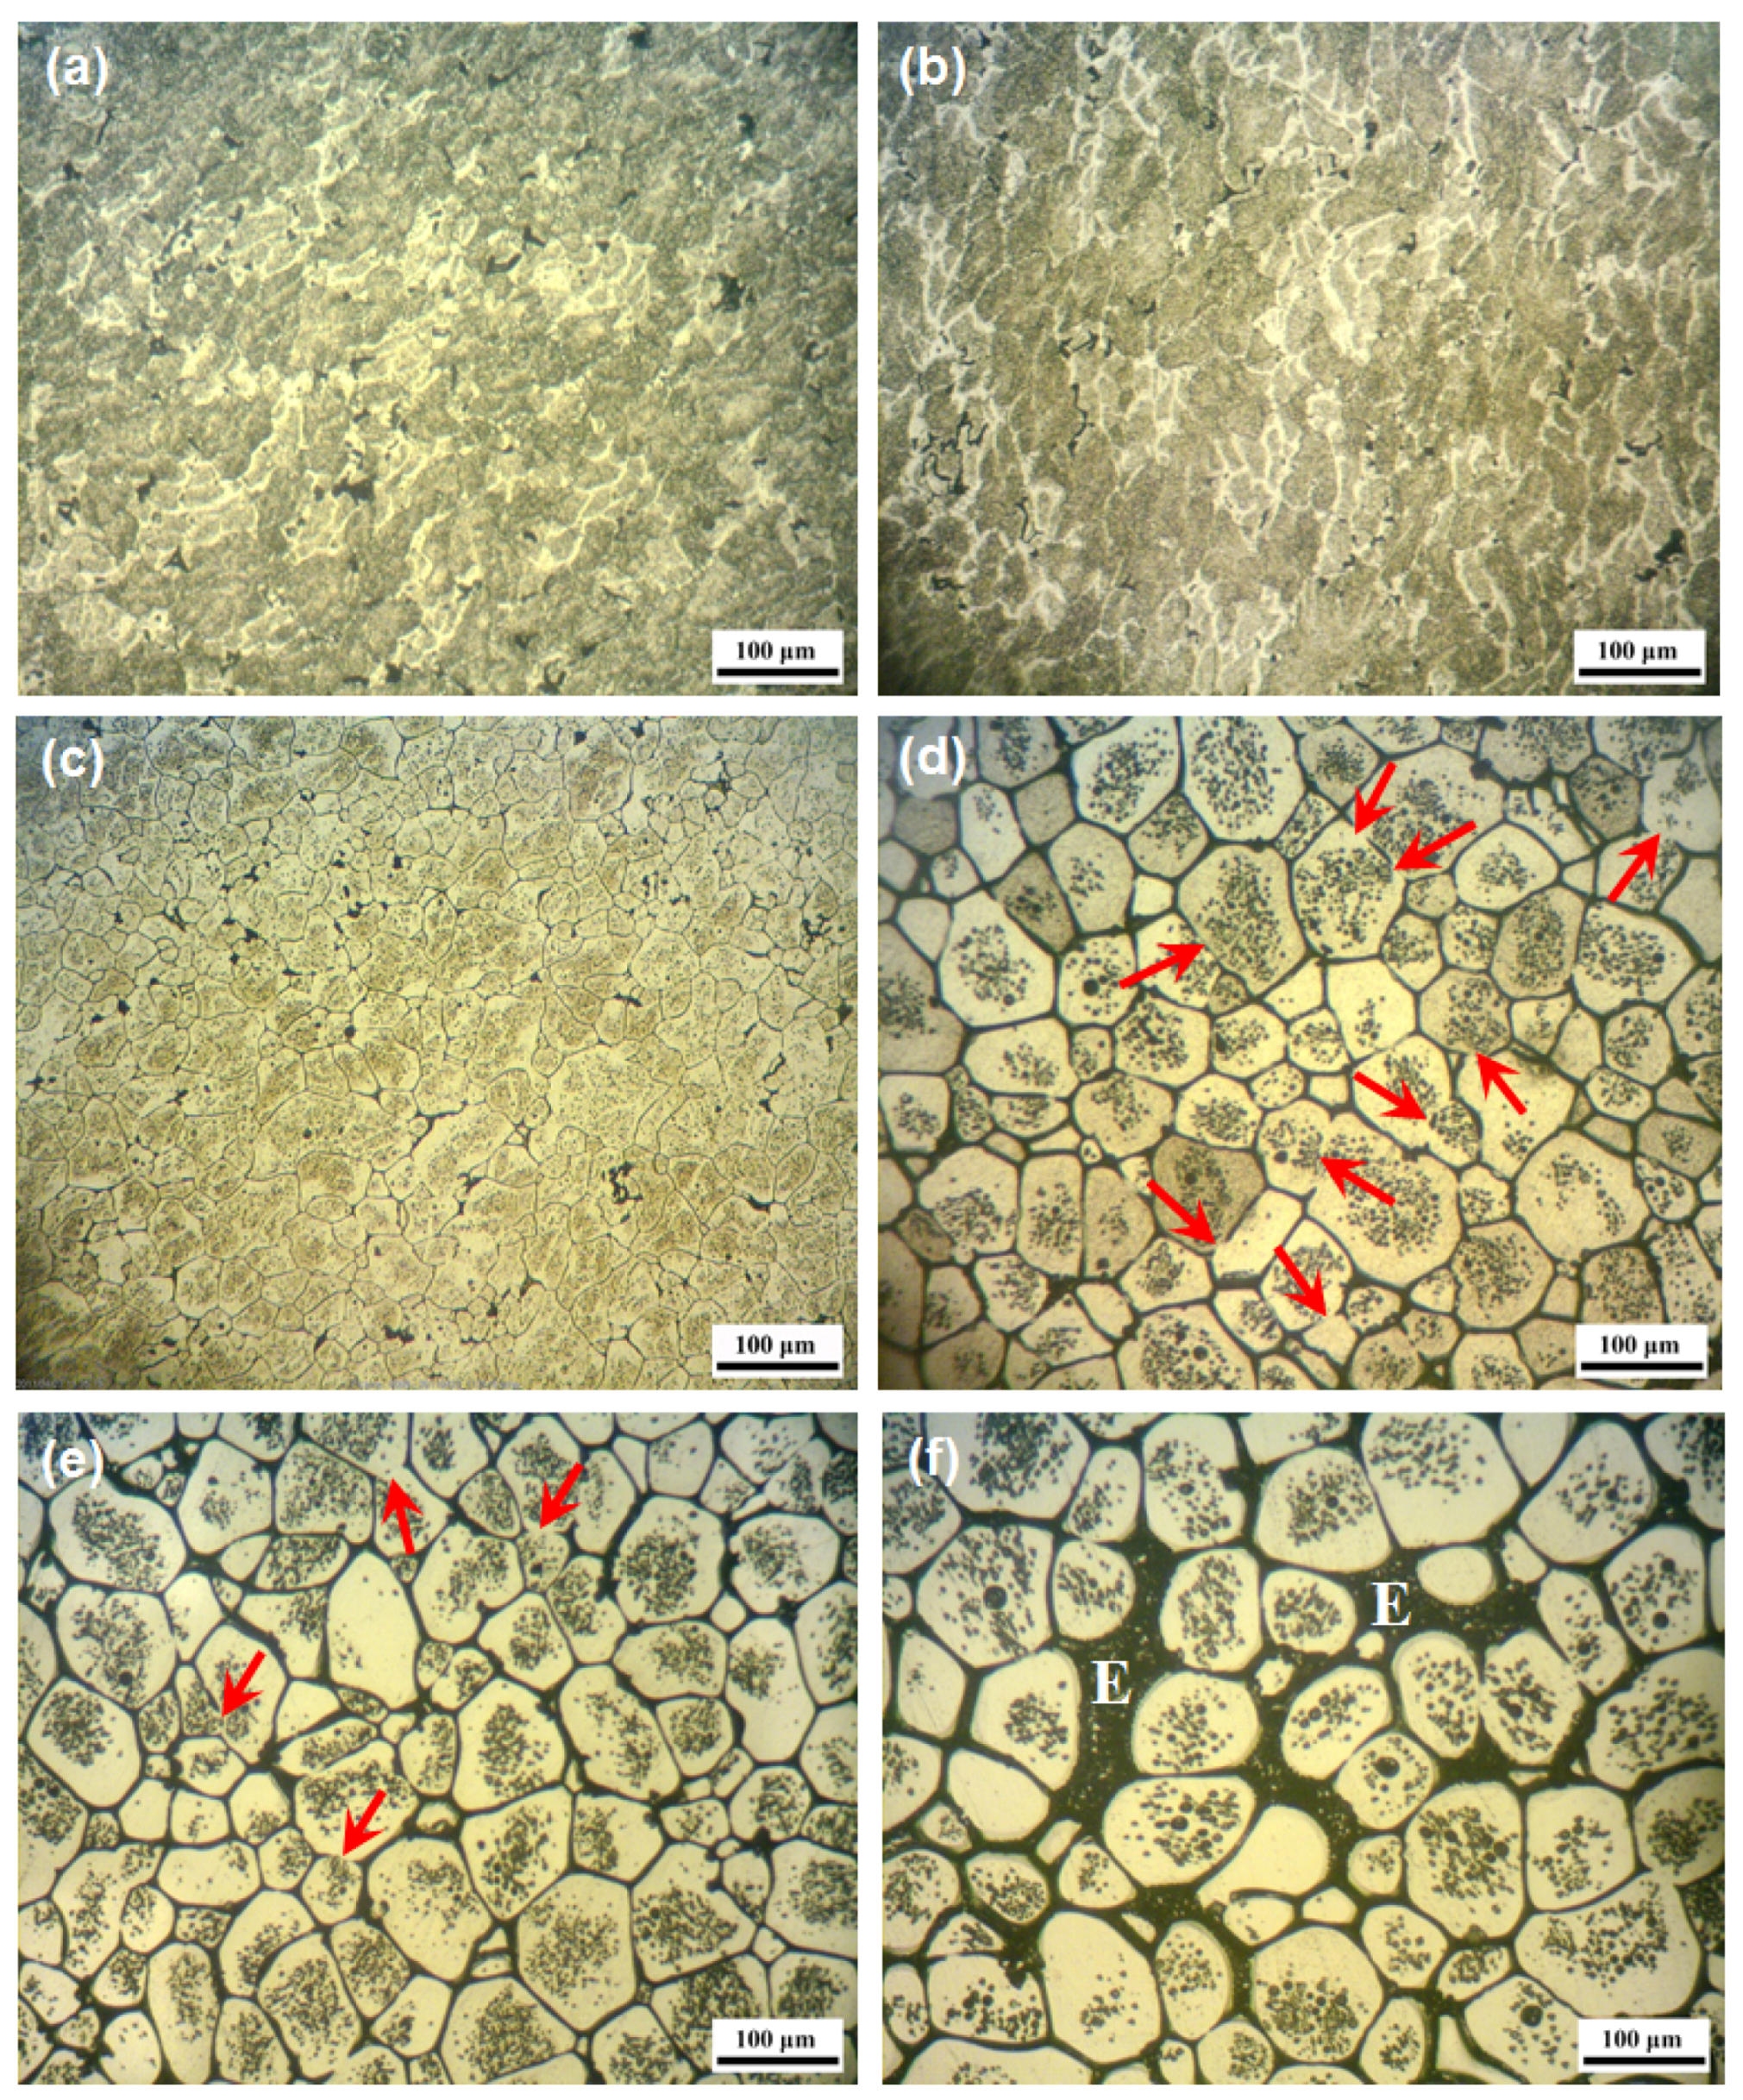
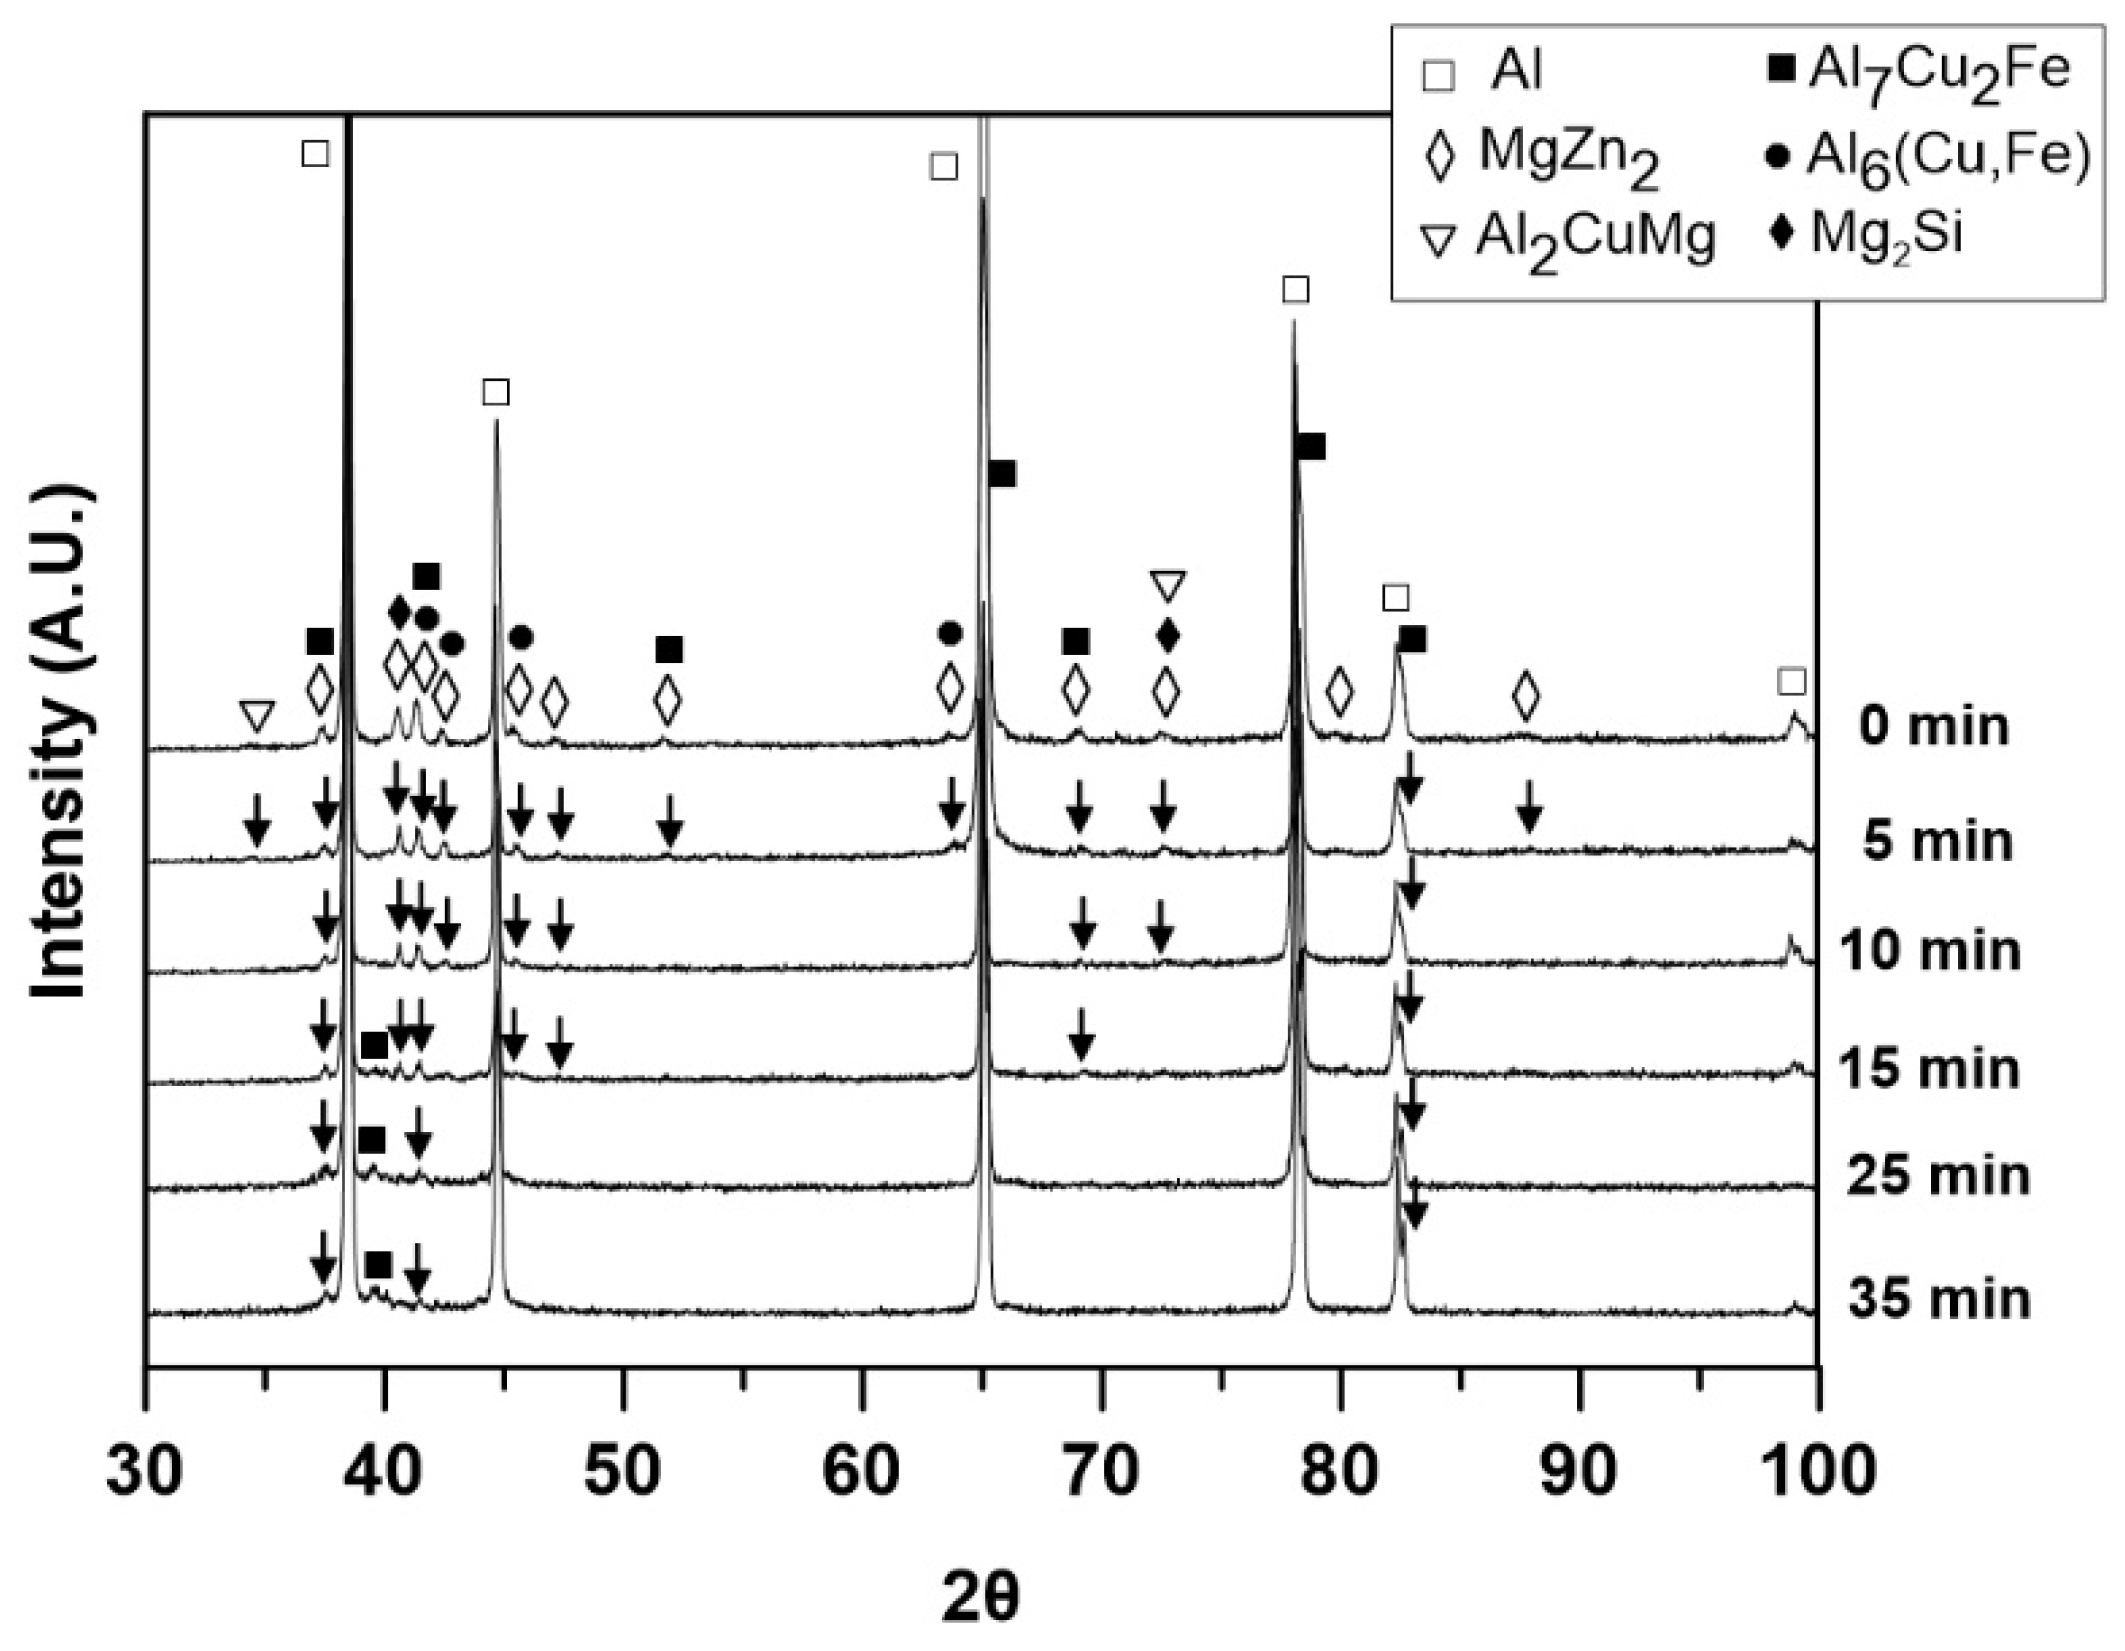
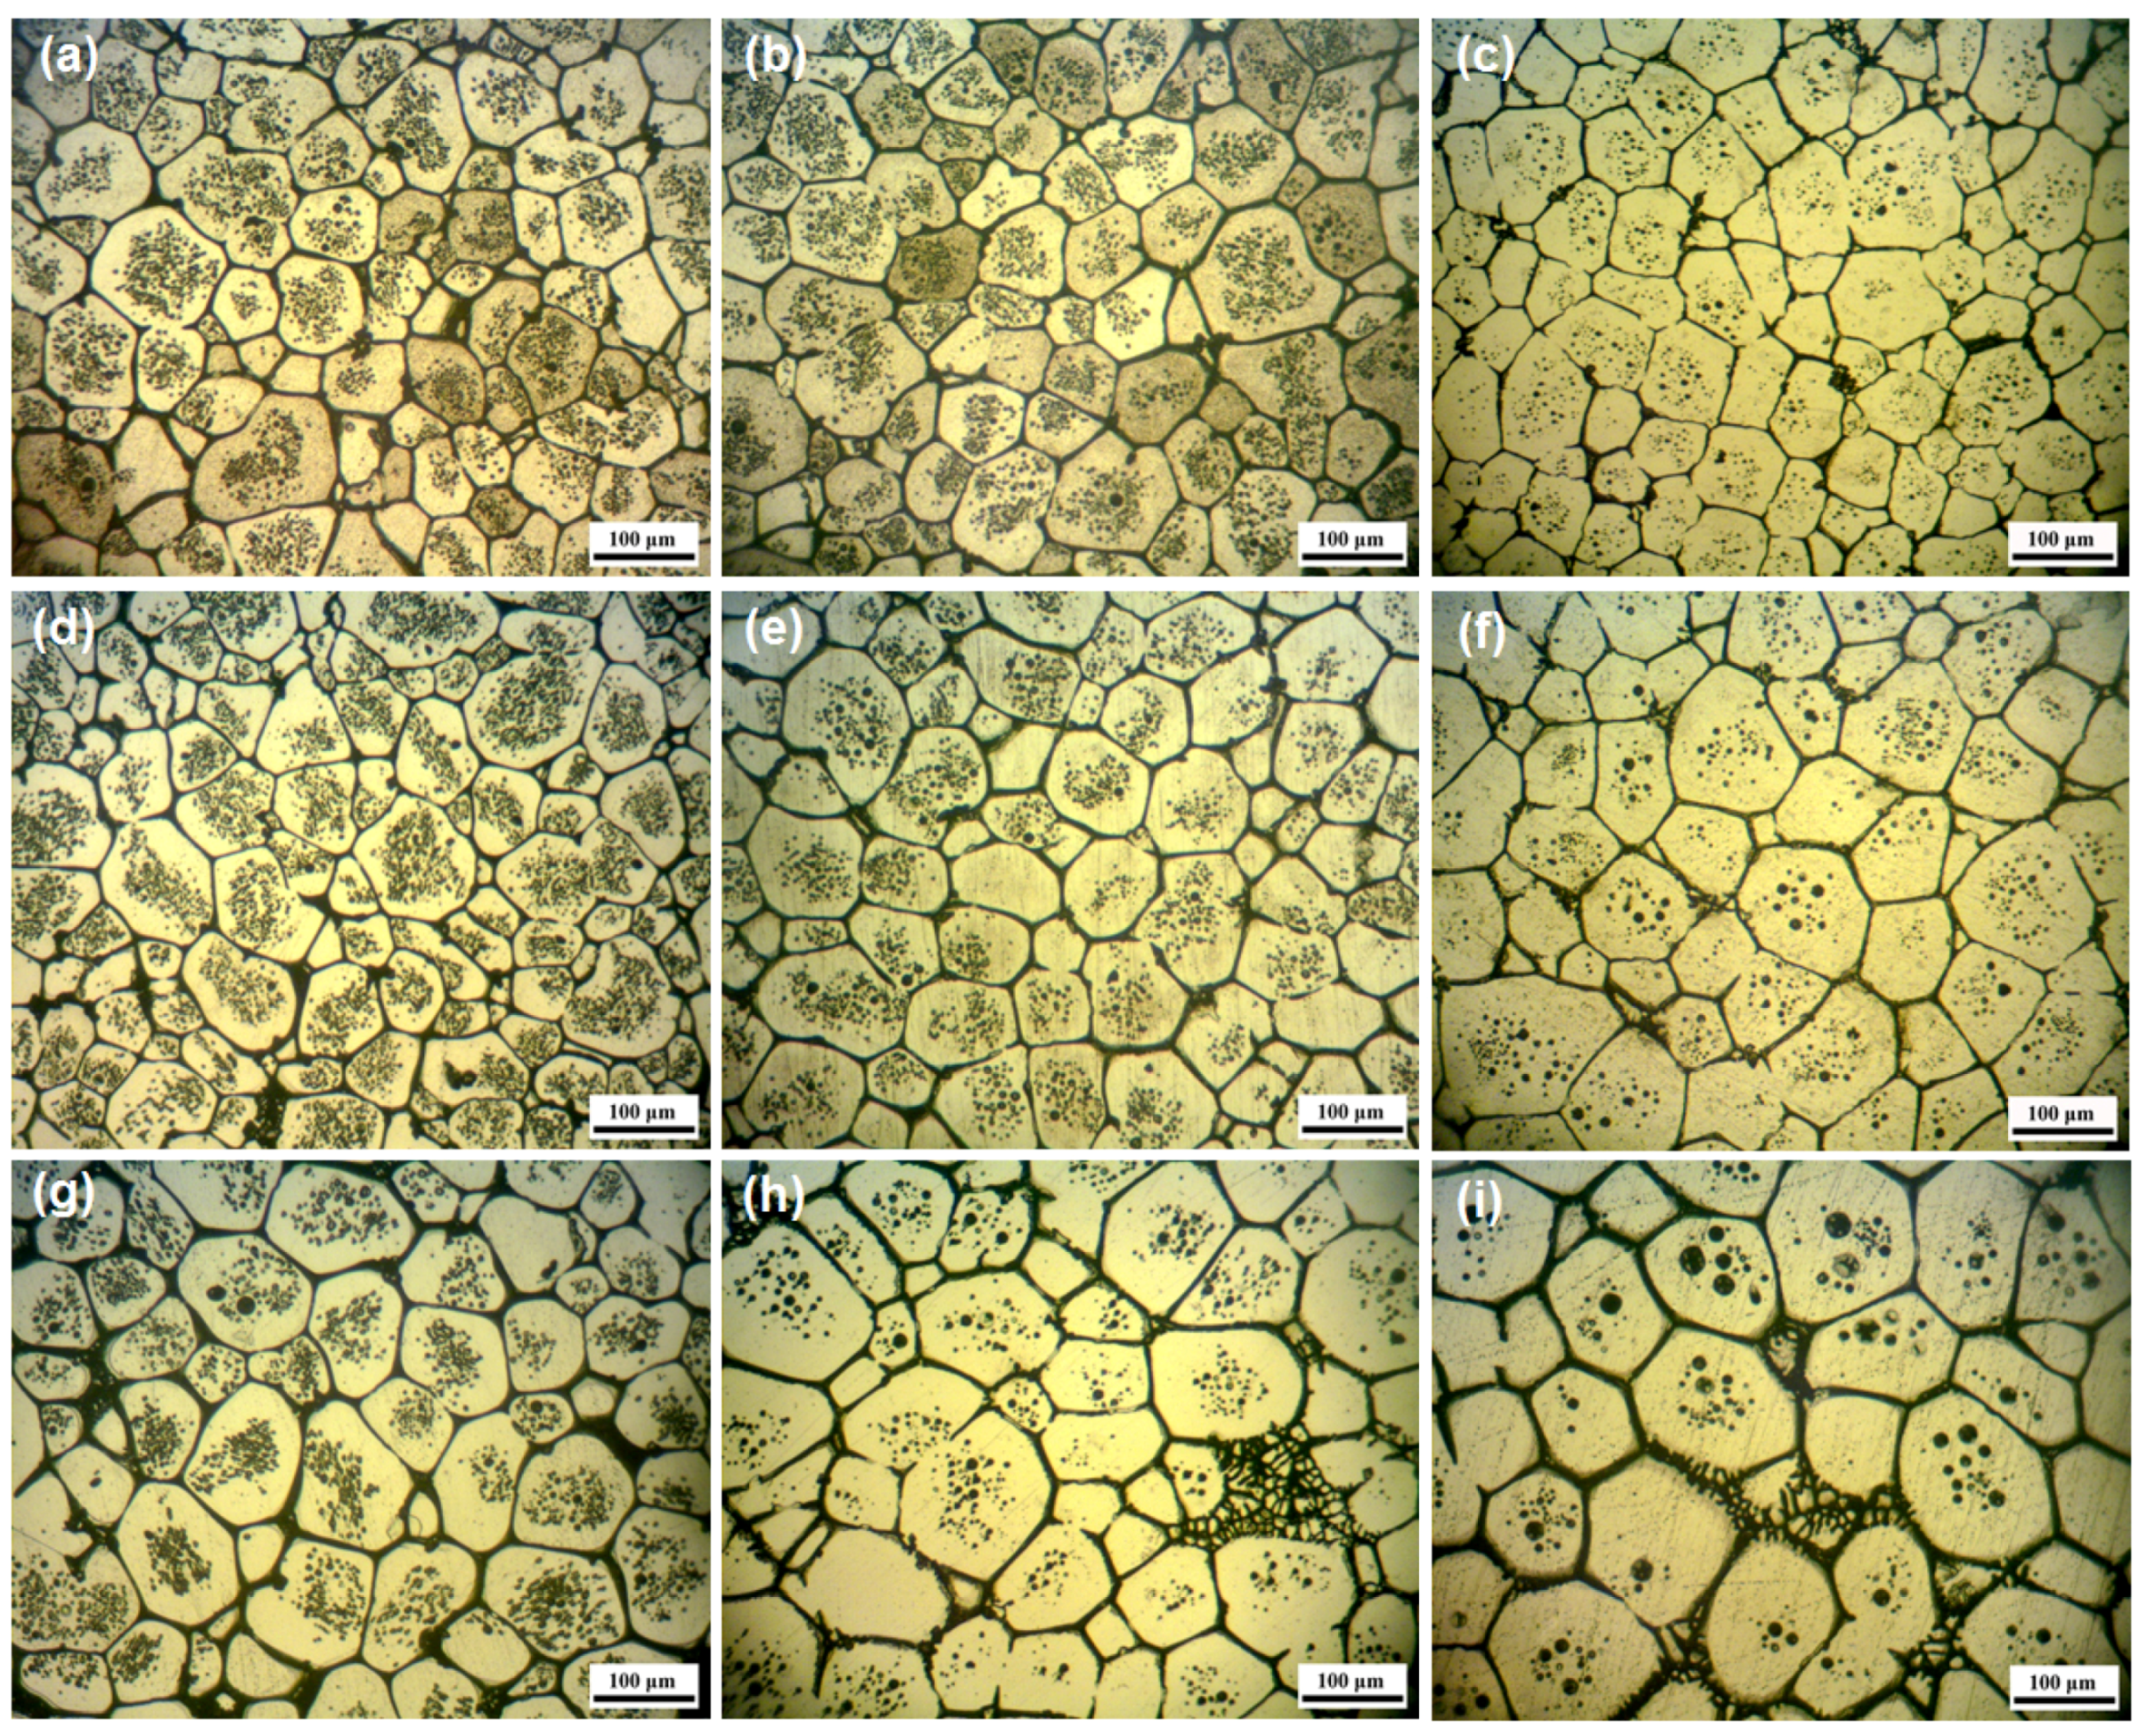
Figure 3 reveals that the volume fractions of precipitates in the microstructure reduce with the rise of the isothermal holding time. This is clearly confirmed by increasing the brightness of the recrystallized solid grains. XRD results shown in Figure 5 also confirm this phenomenon. The X-ray diffraction pattern of the 20% compressed sample prior to the isothermal treatment, indicated that the microstructure consists of α-Al phase and η, S, Al6(Cu,Fe), Al7Cu2Fe, and Mg2Si intermetallic phases, which is similar to the as-received sample (Figure 1). According to the X-ray diffraction patterns of samples heat treated at 600 °C for 5 to 35 min, it is clear that the intensity of η, S, and Mg2Si peaks decrease with the increase of the holding time. The diffraction peaks of the 20% compressed sample are shown by symbols and the corresponding peaks in each case are specified by arrows for the other samples in Figure 5. The diffraction peaks of η, S, and Mg2Si phases almost disappeared after heating for 25 min. However, some diffraction peaks of Fe-rich intermetallic phases (Al7Cu2Fe and Al6(Cu, Fe)) show little change with prolonging of the holding time. Considering the sample heated for 35 min, the presence of Al7Cu2Fe and Al6(Cu, Fe) phases was distinguishable. However, no evidence of η, S, and Mg2Si phases was observed. This illustrates that Fe-rich secondary particles cannot be dissolved into the matrix for the semi-solid treatment conditions used in the present study.
Previous work reported that the melting temperature of η-phase in 7xxx alloys is 475–480 °C [26,27]. This is fairly well correlated with the first peak in the DSC curve of the starting material with an enthalpy of 2.7 J/g in Figure 1. The solution temperatures of S and Mg2Si phases are 490–501 °C [28,29] and 478–525 °C [30], respectively, depending on the Mg content of the alloy. Considering the XRD results (Figure 5) and solution temperature of intermetallic precipitates, it can be suggested that the dissolving of intermetallic particles commences with melting of η precipitates after heating for 10 min through the reaction of α-Al + η → L. Following the increase of the heating time, dissolving of S and Mg2Si intermetallic particles also occurs through the phase transformation of α-Al + S + Mg2Si → L. These precipitates are fully dissolved after isothermal heating for 25 min.
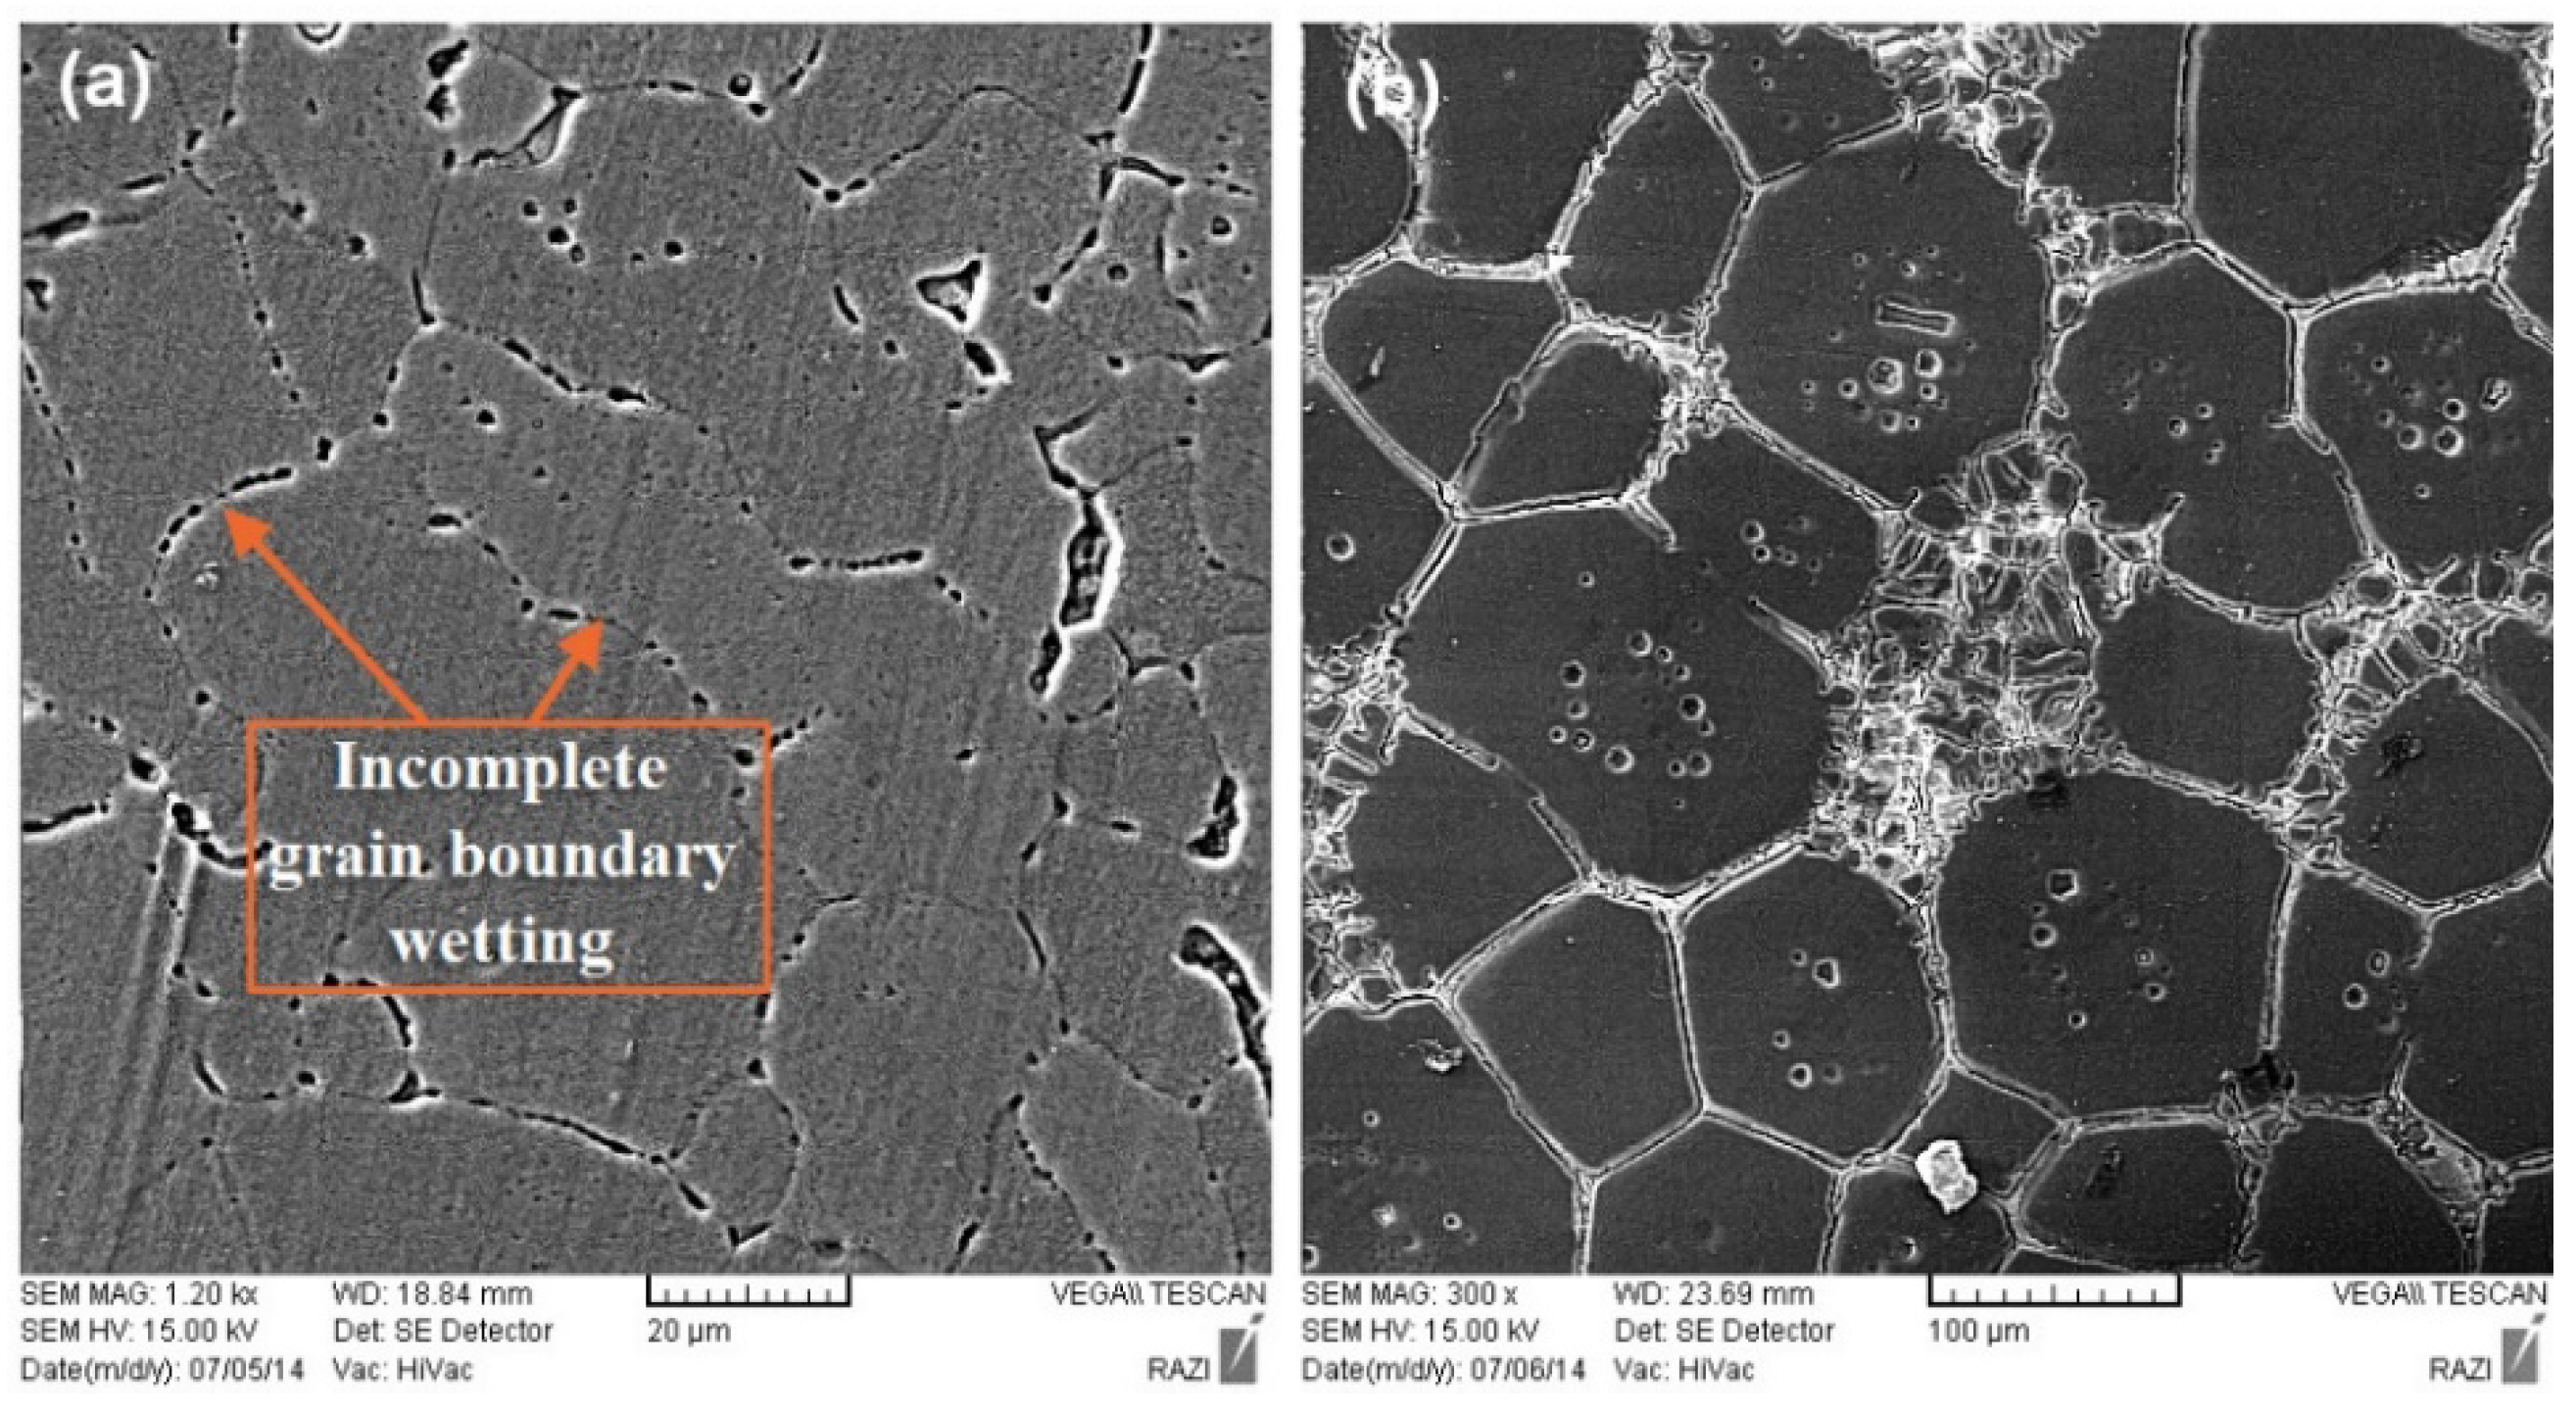
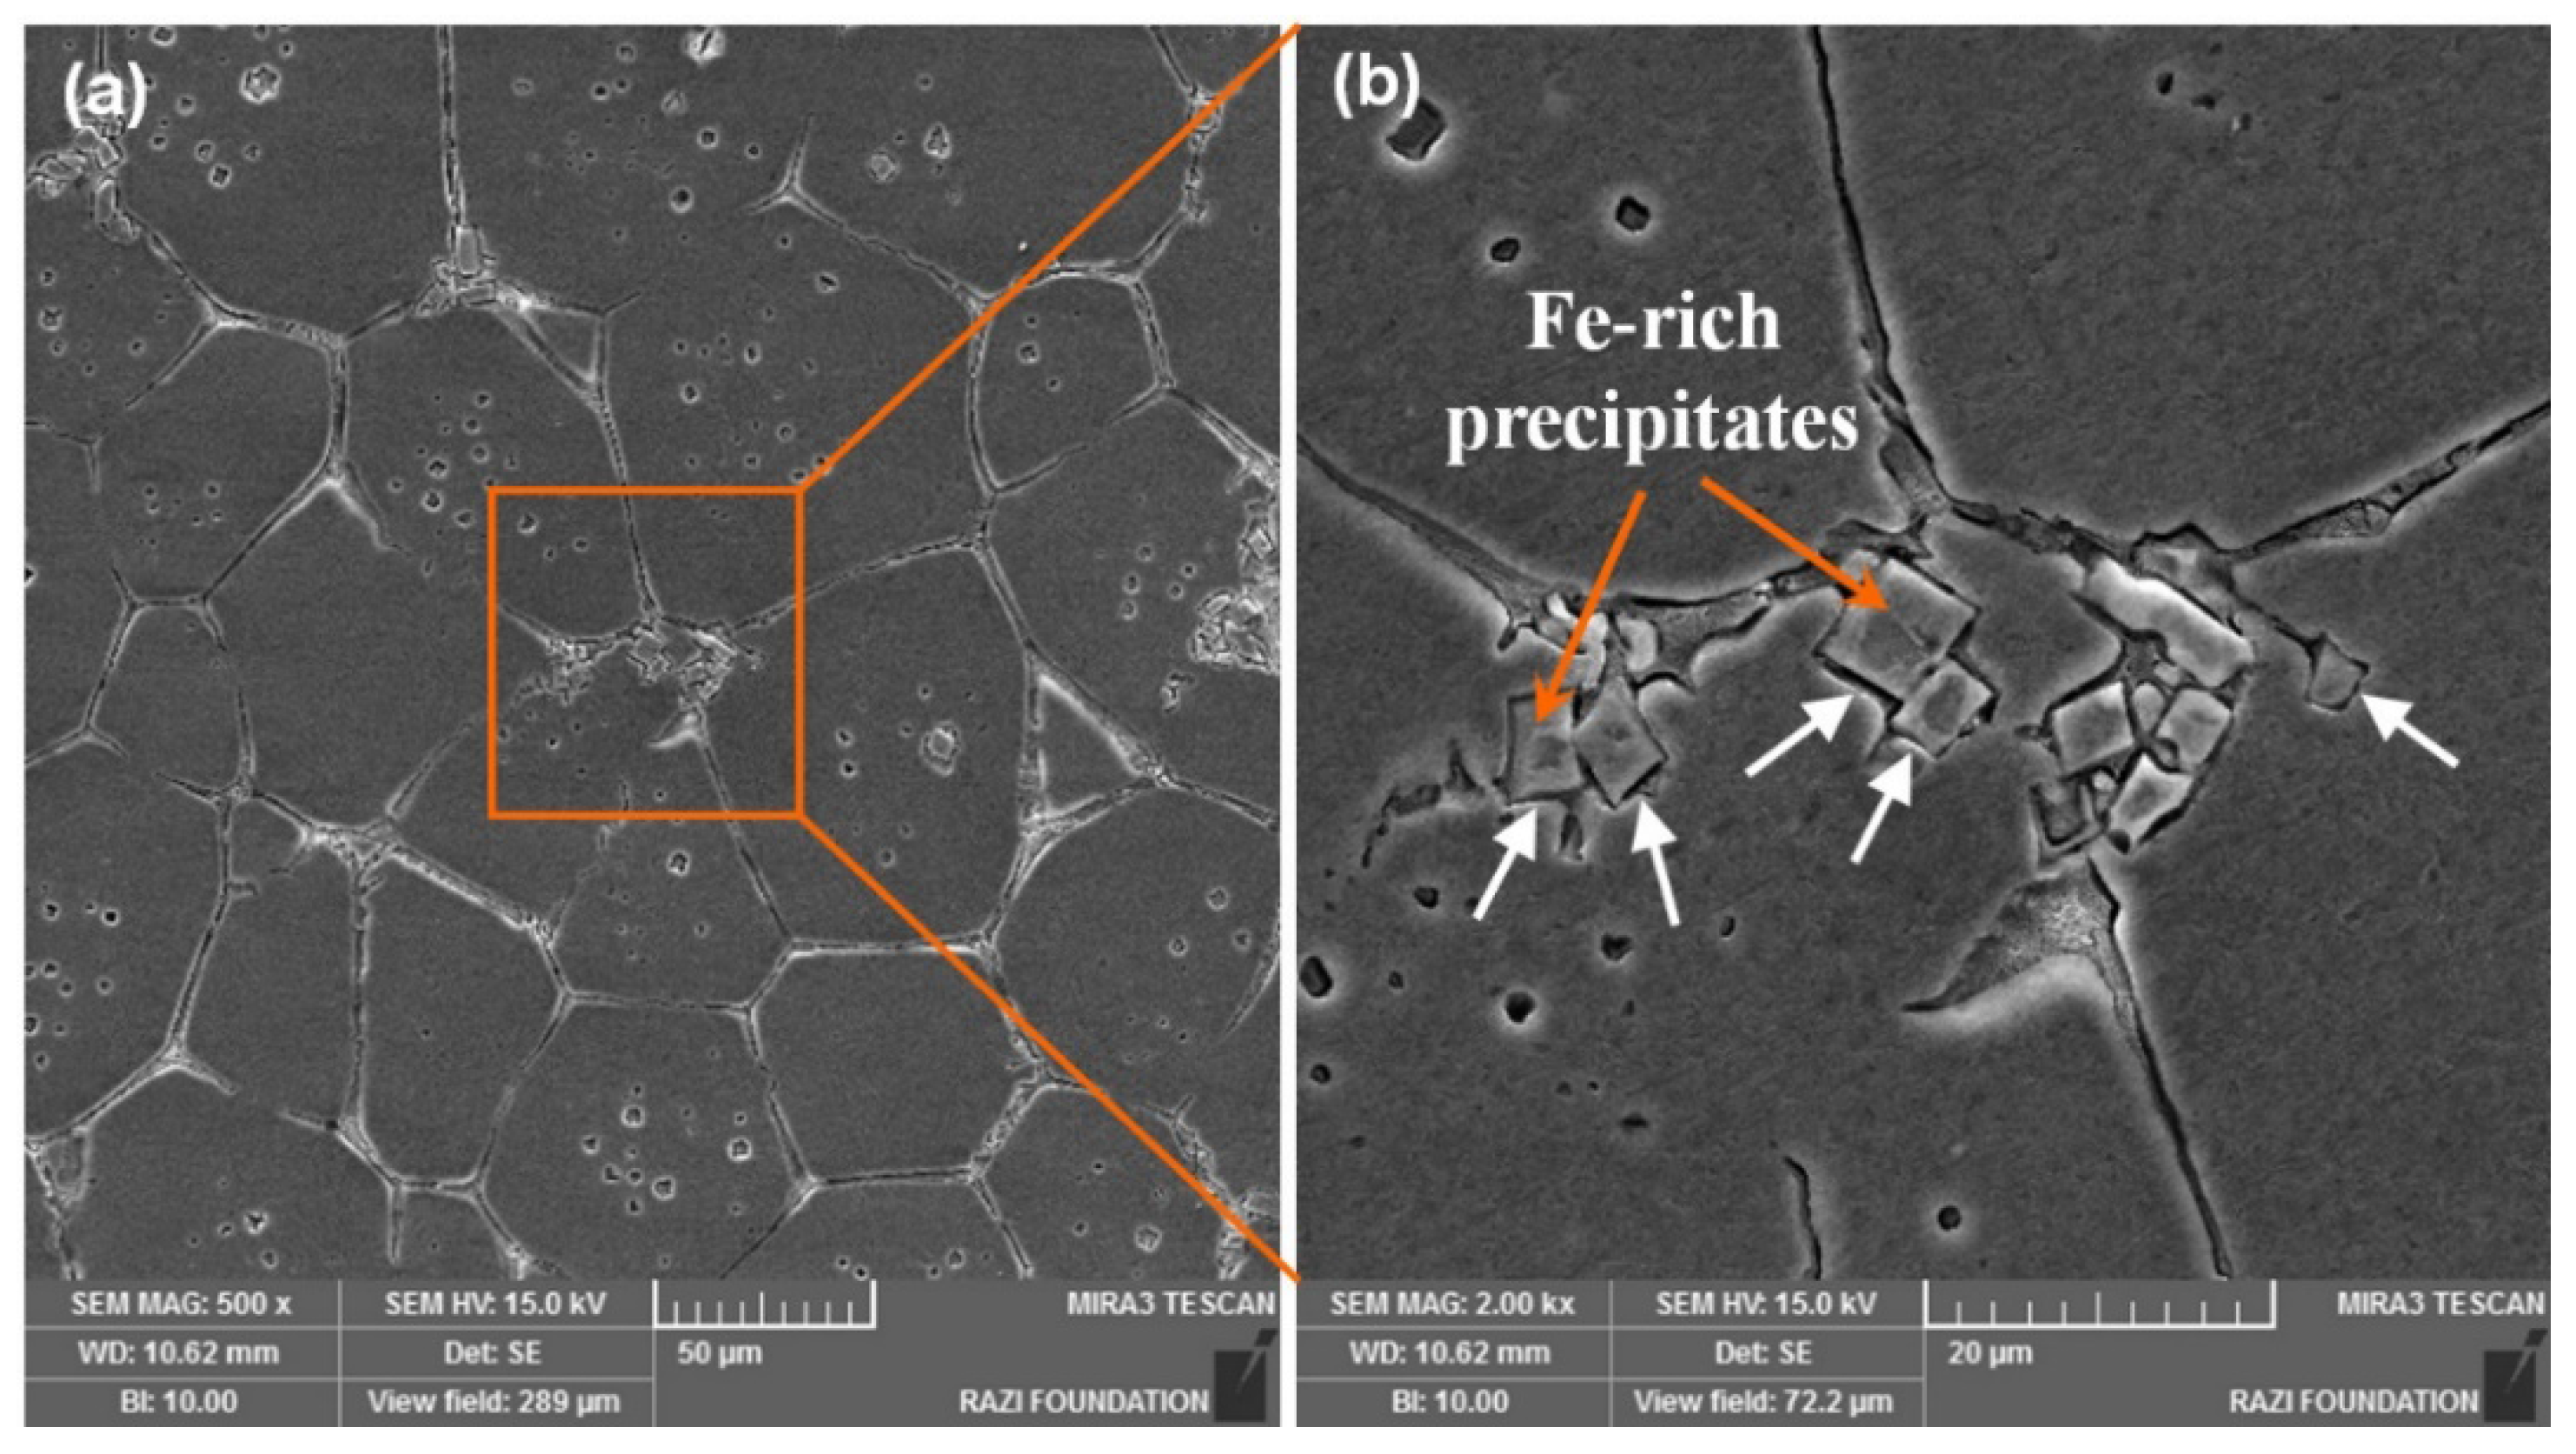
The Fe-rich intermetallic precipitates have higher solution temperatures and are usually stable over 600 °C [31]. Microstructural observations revealed that the Fe-rich intermetallic particles, shown in Figure 6, precipitate at grain boundaries during partial remelting. Precipitation of these particles at the grain boundaries has a great influence on pinning of the grain boundaries movement. Therefore, it may cause the retardation of the particle growth and coarsening during the isothermal treatment. This is discussed in more detail in Section 3.5.
It can be concluded from the above discussion that the distribution of alloying elements in the microstructure is significantly changed during the isothermal treatment and solution of the constituent particles. Segregation and distribution of the alloying elements has a great influence on the microstructural evolution during semi-solid treatment. Moreover, this affects the mechanical properties of the subsequent thixoformed parts [32,33,34]. 
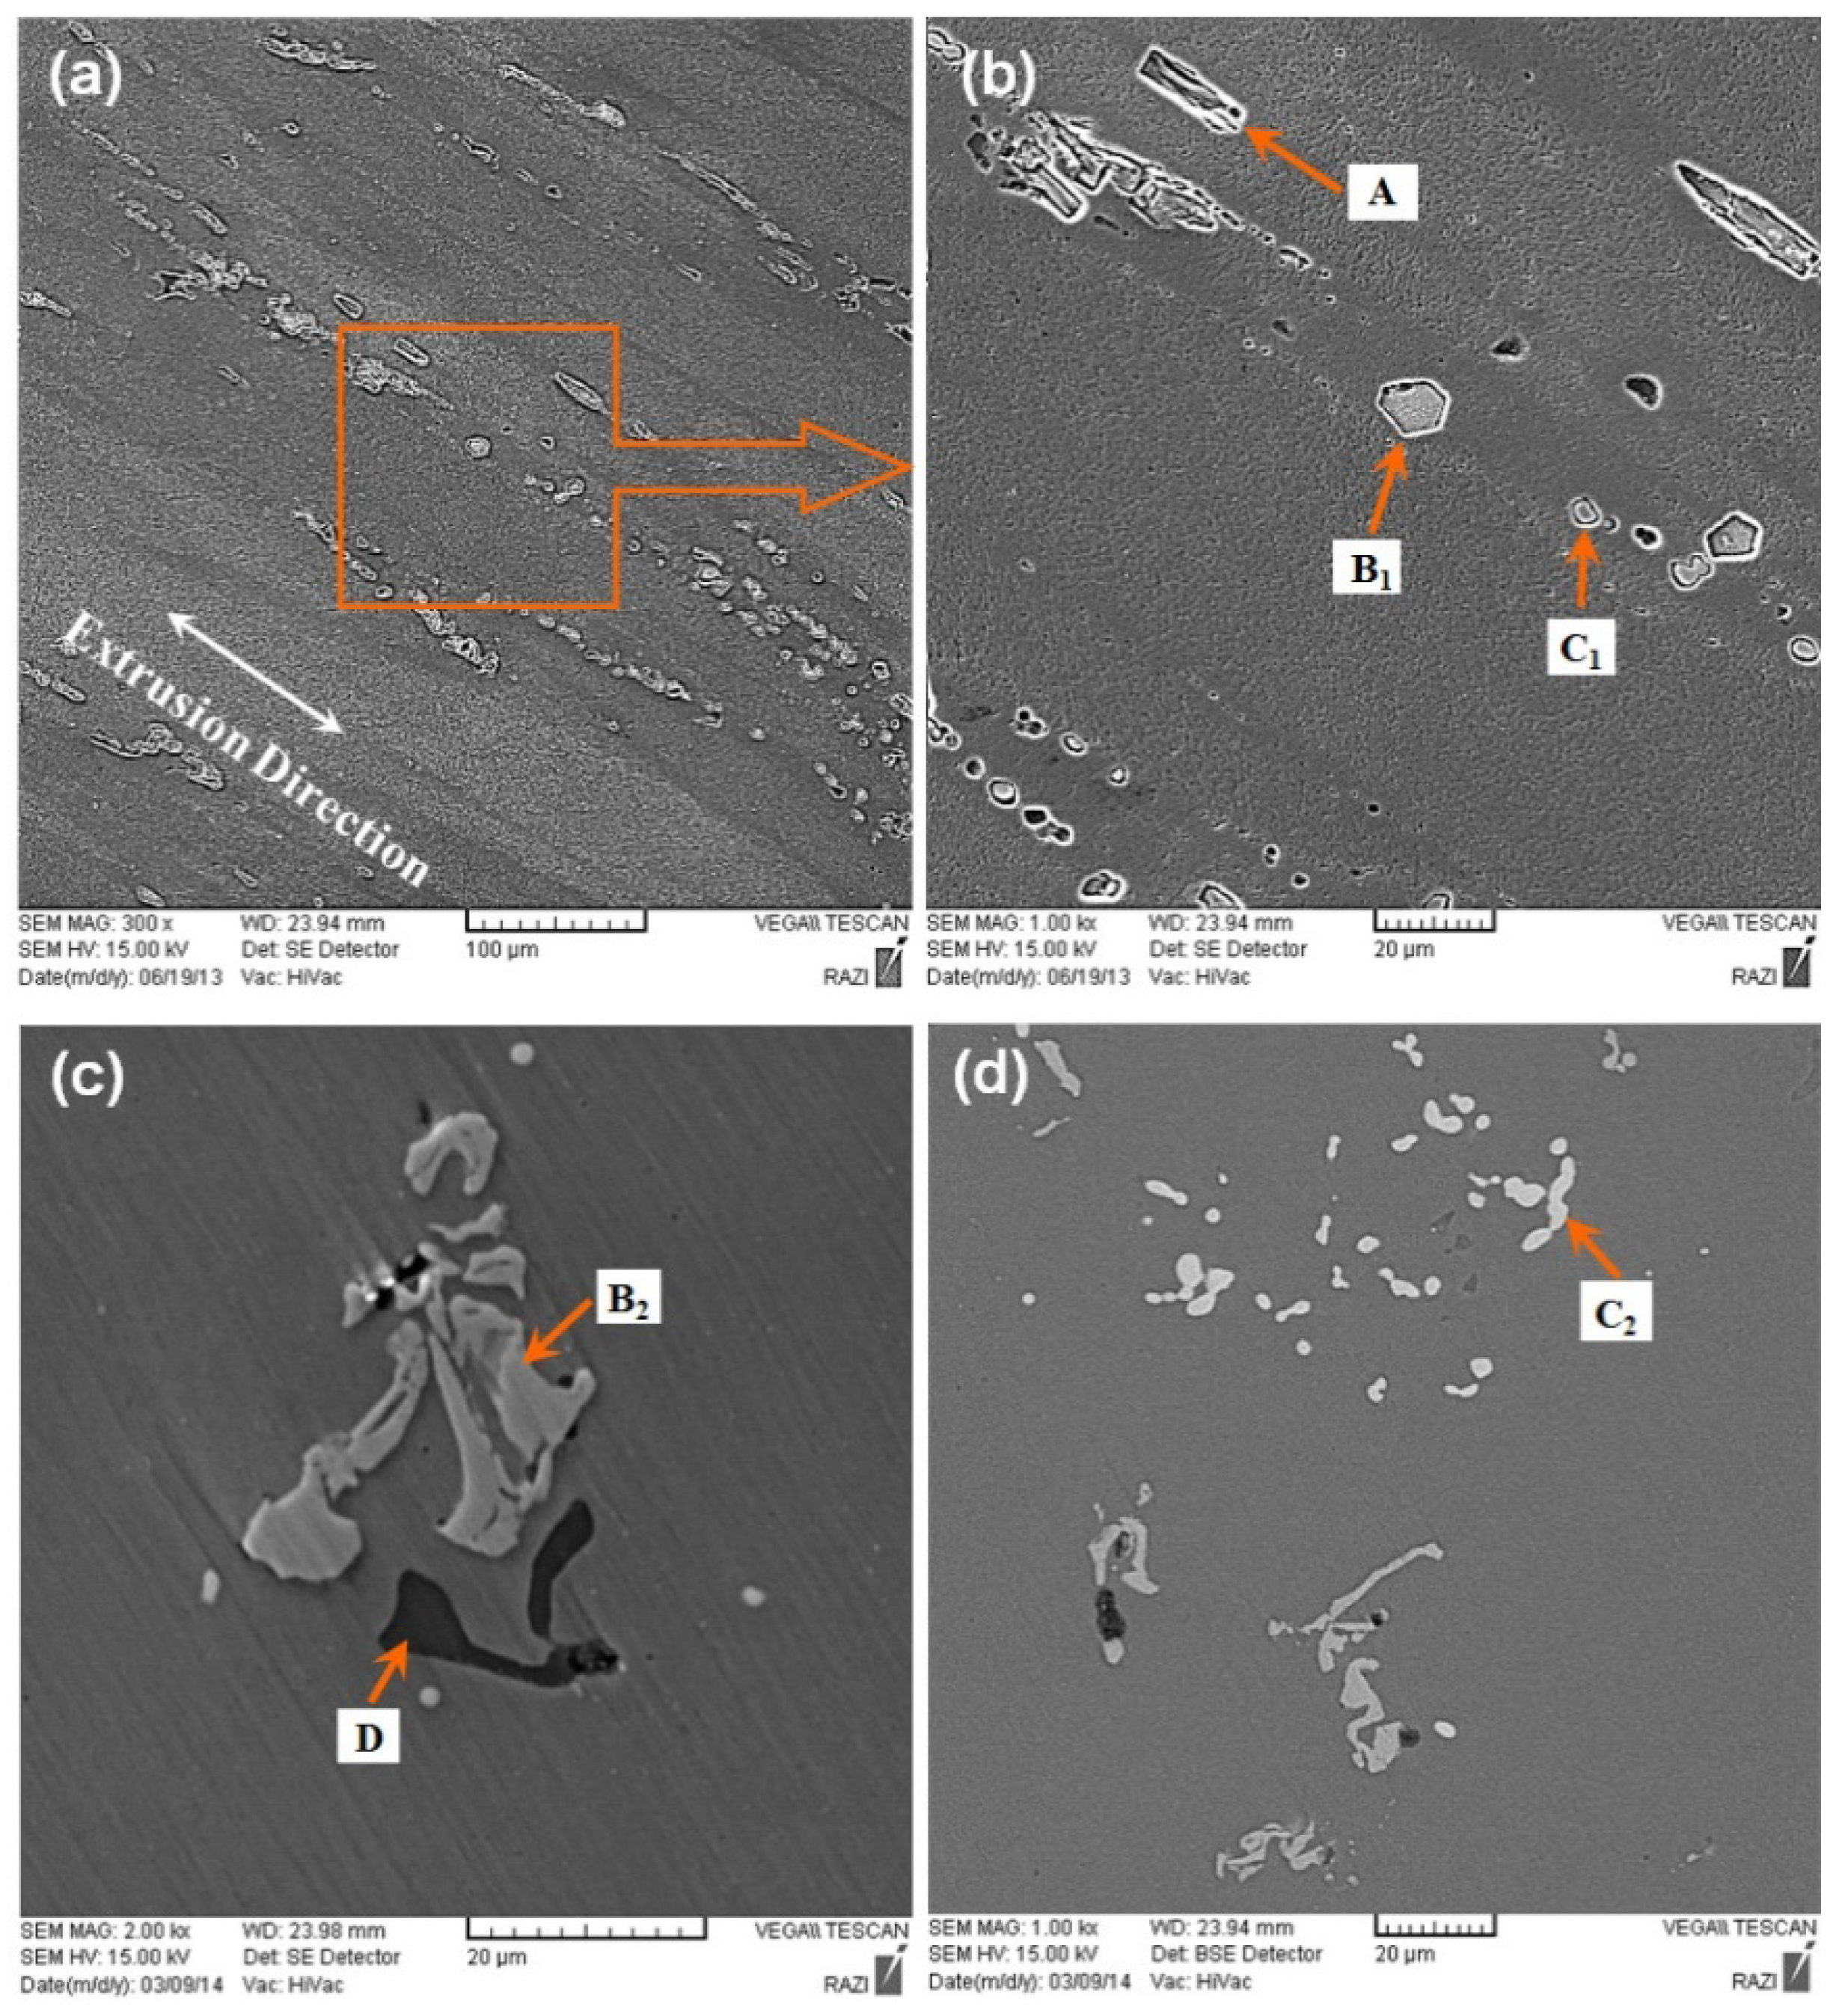
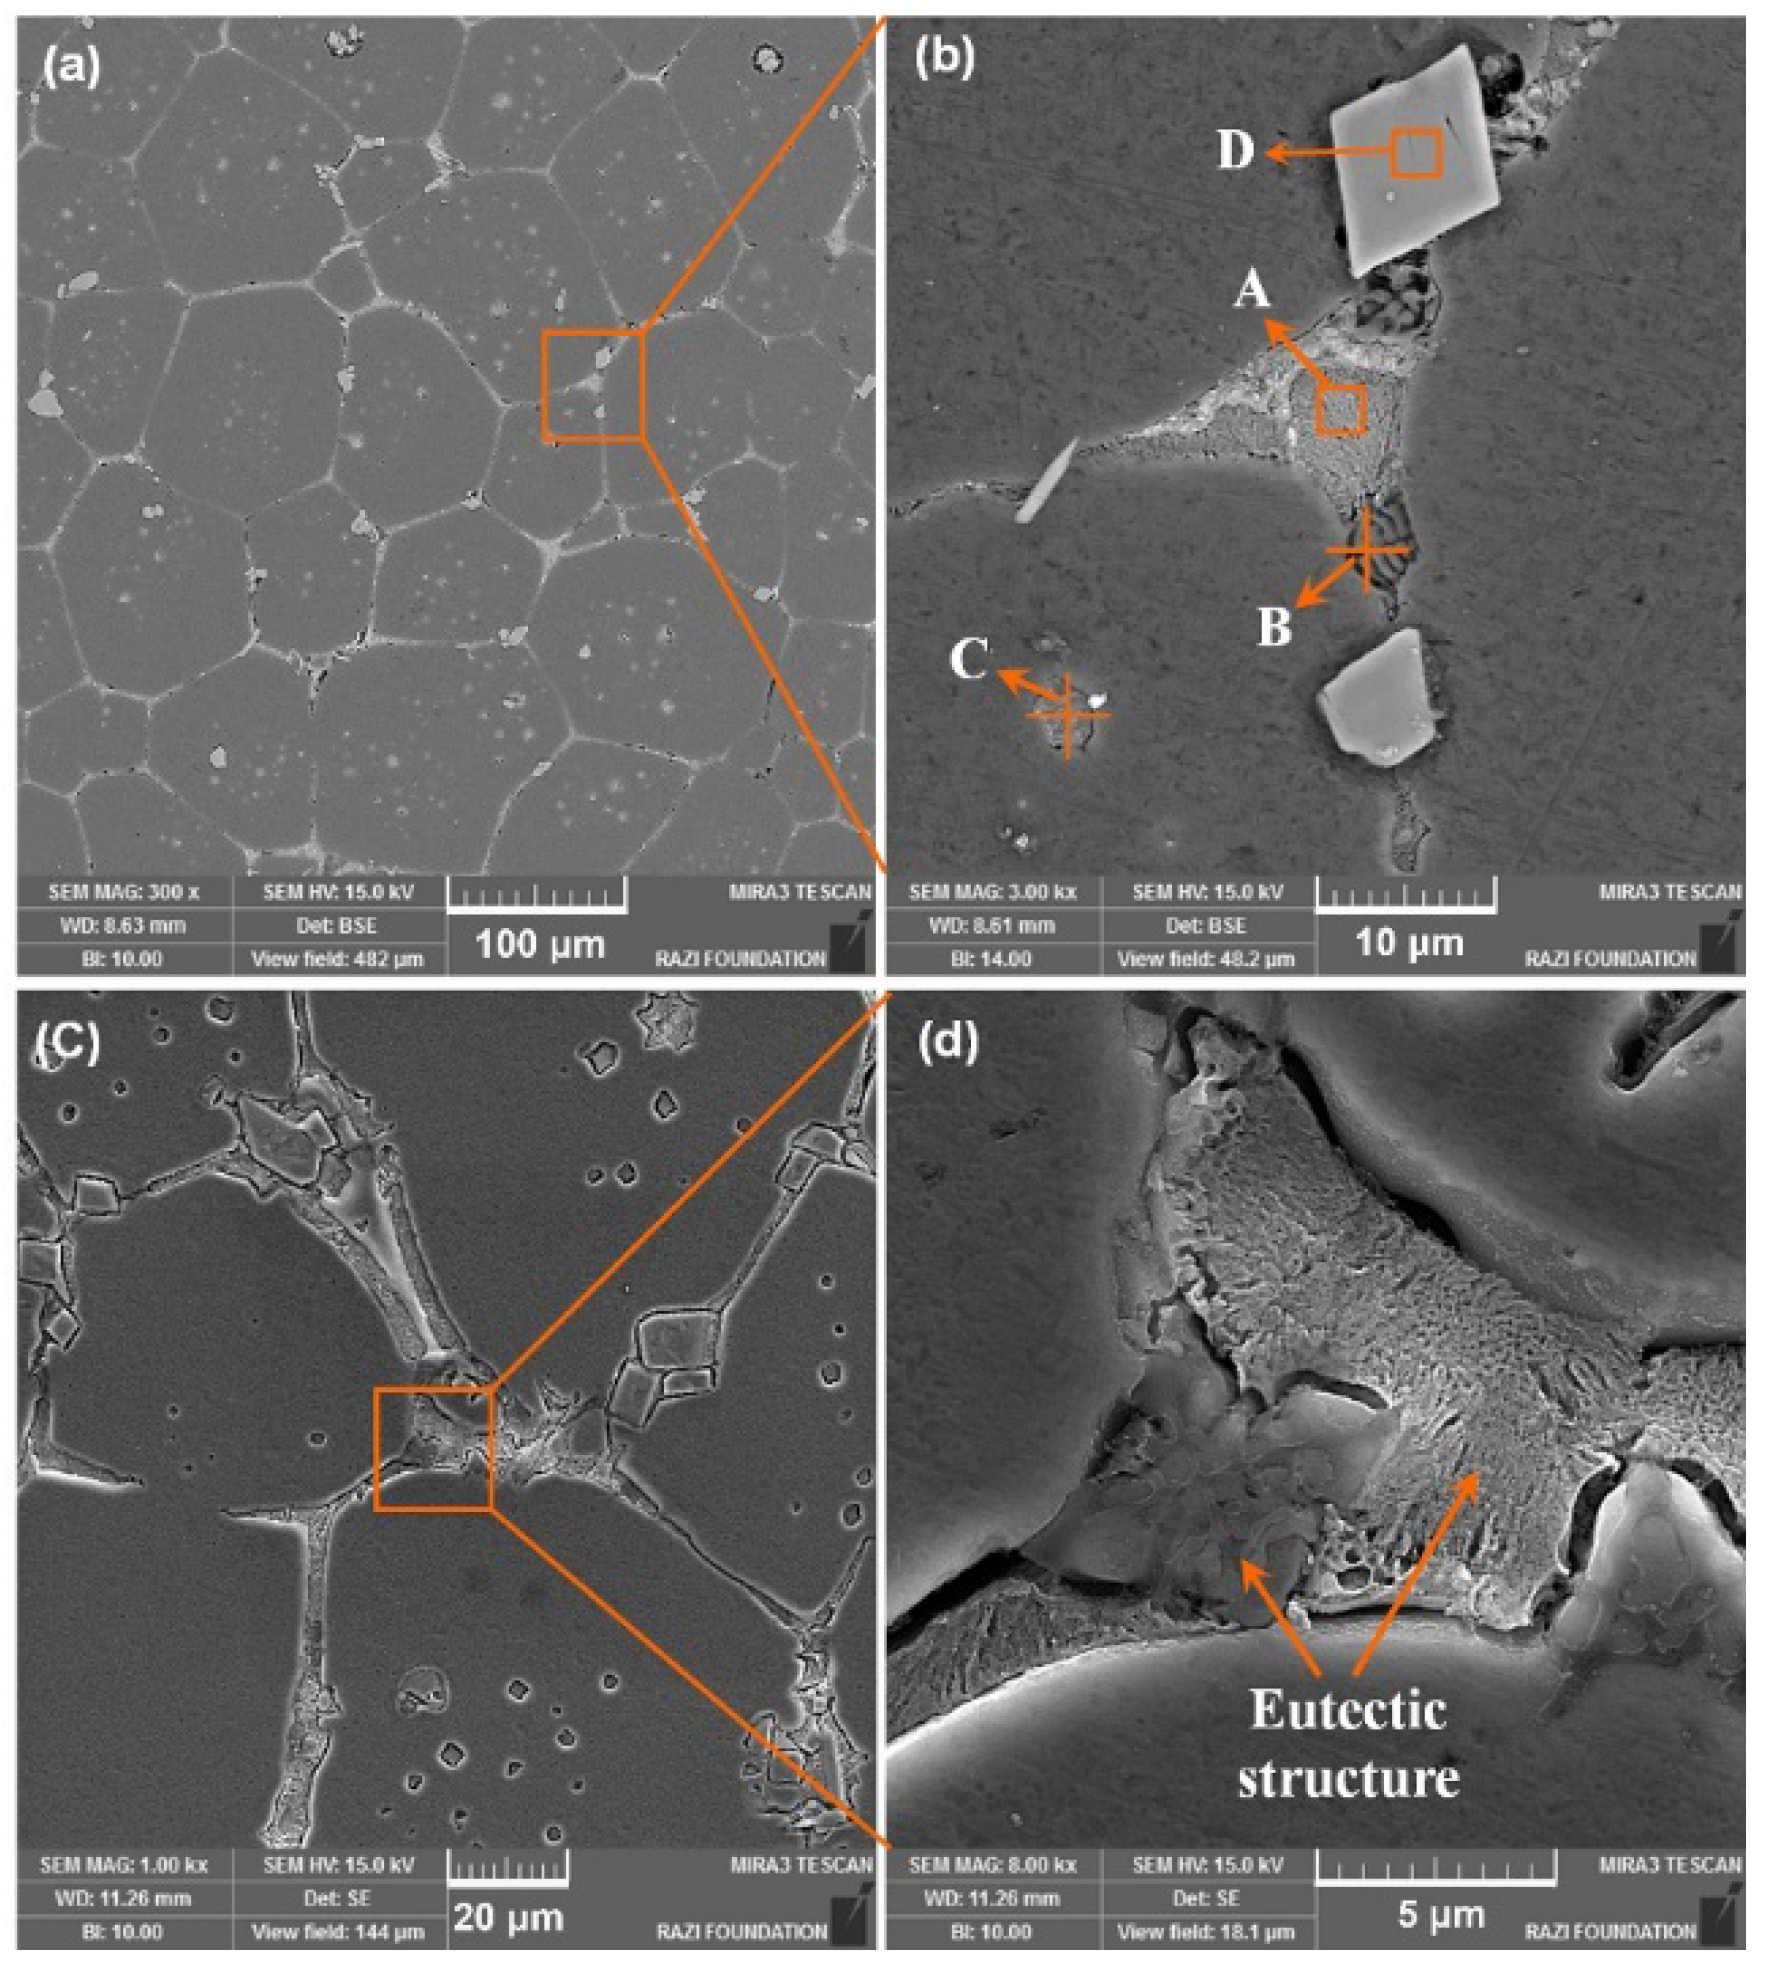
Figure 6 shows the SEM images of the compressed samples heat treated at 600 °C (Figure 6a,b) and 610 °C (
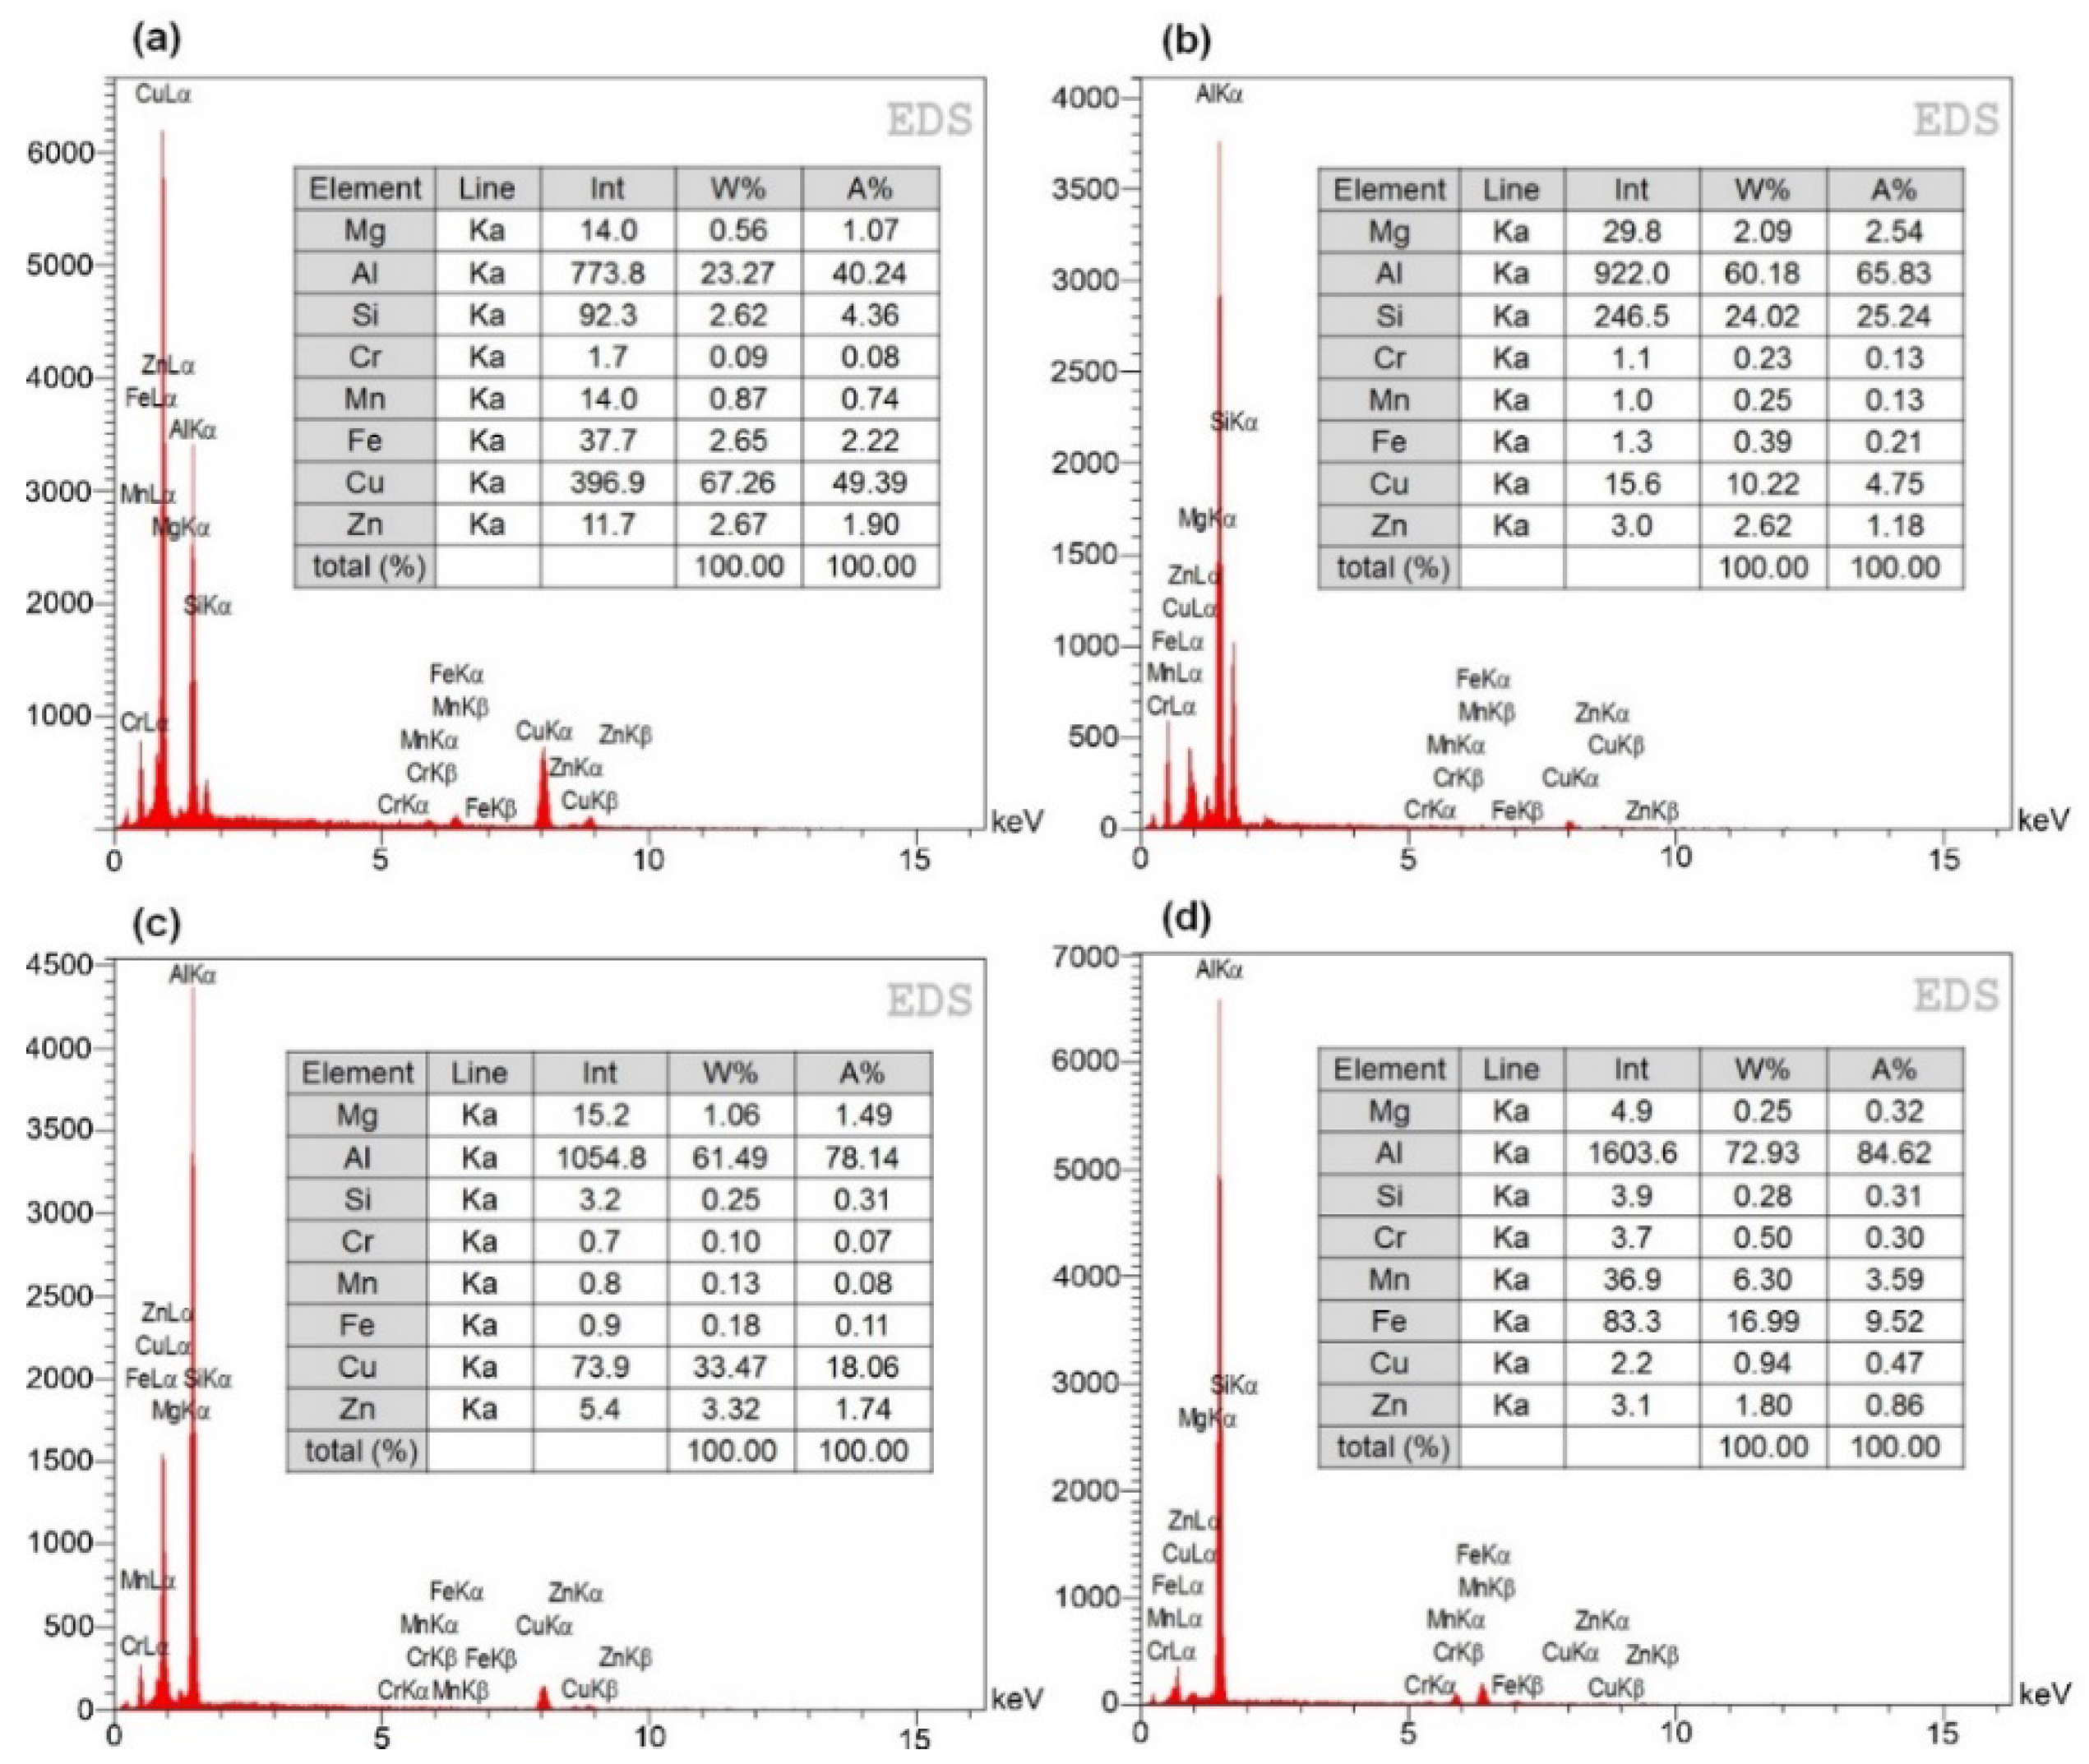
Figure 6c,d) for 25 min. The EDS analysis results of the marked areas (A to D) in Figure 6b are shown in Figure 7. Intense concentration of Cu at the grain boundaries (point A) was observed. In addition, Si intensely segregated at other regions of the grain boundaries (point B). The entrapped liquid droplets within the solid grains (point C) also showed high concentration of Cu. Although the segregation of Cu at the grain boundaries and within the liquid droplets has been reported in the literature [35,36], the segregation of Si is an unreported phenomenon in the semi-solid microstructure of 7075 Al alloy. Solid grains are depleted from Cu as a consequence of the segregation of Cu at the grain boundaries. This results in a rise in the solidus temperature in these regions and a decline of the temperature at the grain boundaries. Finally, chemical composition approaches Al-Cu eutectic composition which facilitates grain boundary melting. The segregation of Si at other regions of the grain boundaries derives grain boundary chemistry closer to Al-Si eutectic composition. Therefore, it can be concluded that the formation of low melting phases at grain boundaries is mainly influenced by the high content of Cu and Si.
Grain boundary regions with low solidus temperature remelt during the isothermal heating. Thus, a eutectic liquid film surrounds the solid grains. Melting of solid grains occurs on further increasing the heating temperature. However, it should be noted that the segregation of Cu and Si at the grain boundaries improves on raising the heating temperature due to more intense atomic diffusion. The EDS analysis of the precipitate particles at the grain boundaries (point D) in Figure 6 (Figure 7d) demonstrates Fe-rich intermetallic phases. This is also confirmed by XRD patterns in Figure 5. As discussed earlier, these particles cannot be dissolved at 600 °C and appear mainly as square particles at the grain boundaries in the semi-solid microstructure. The results of the microstructural investigations in this research showed that the amount of these particles reduce on increasing the isothermal heating temperature to 620 °C and isothermal heating for longer times (>15 min).
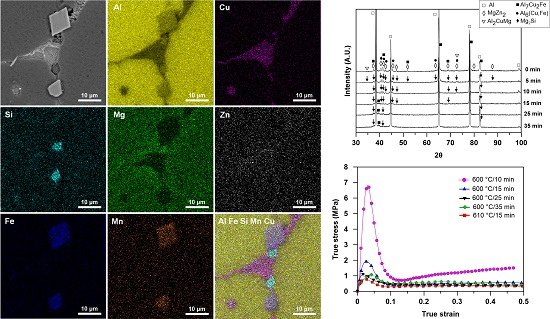
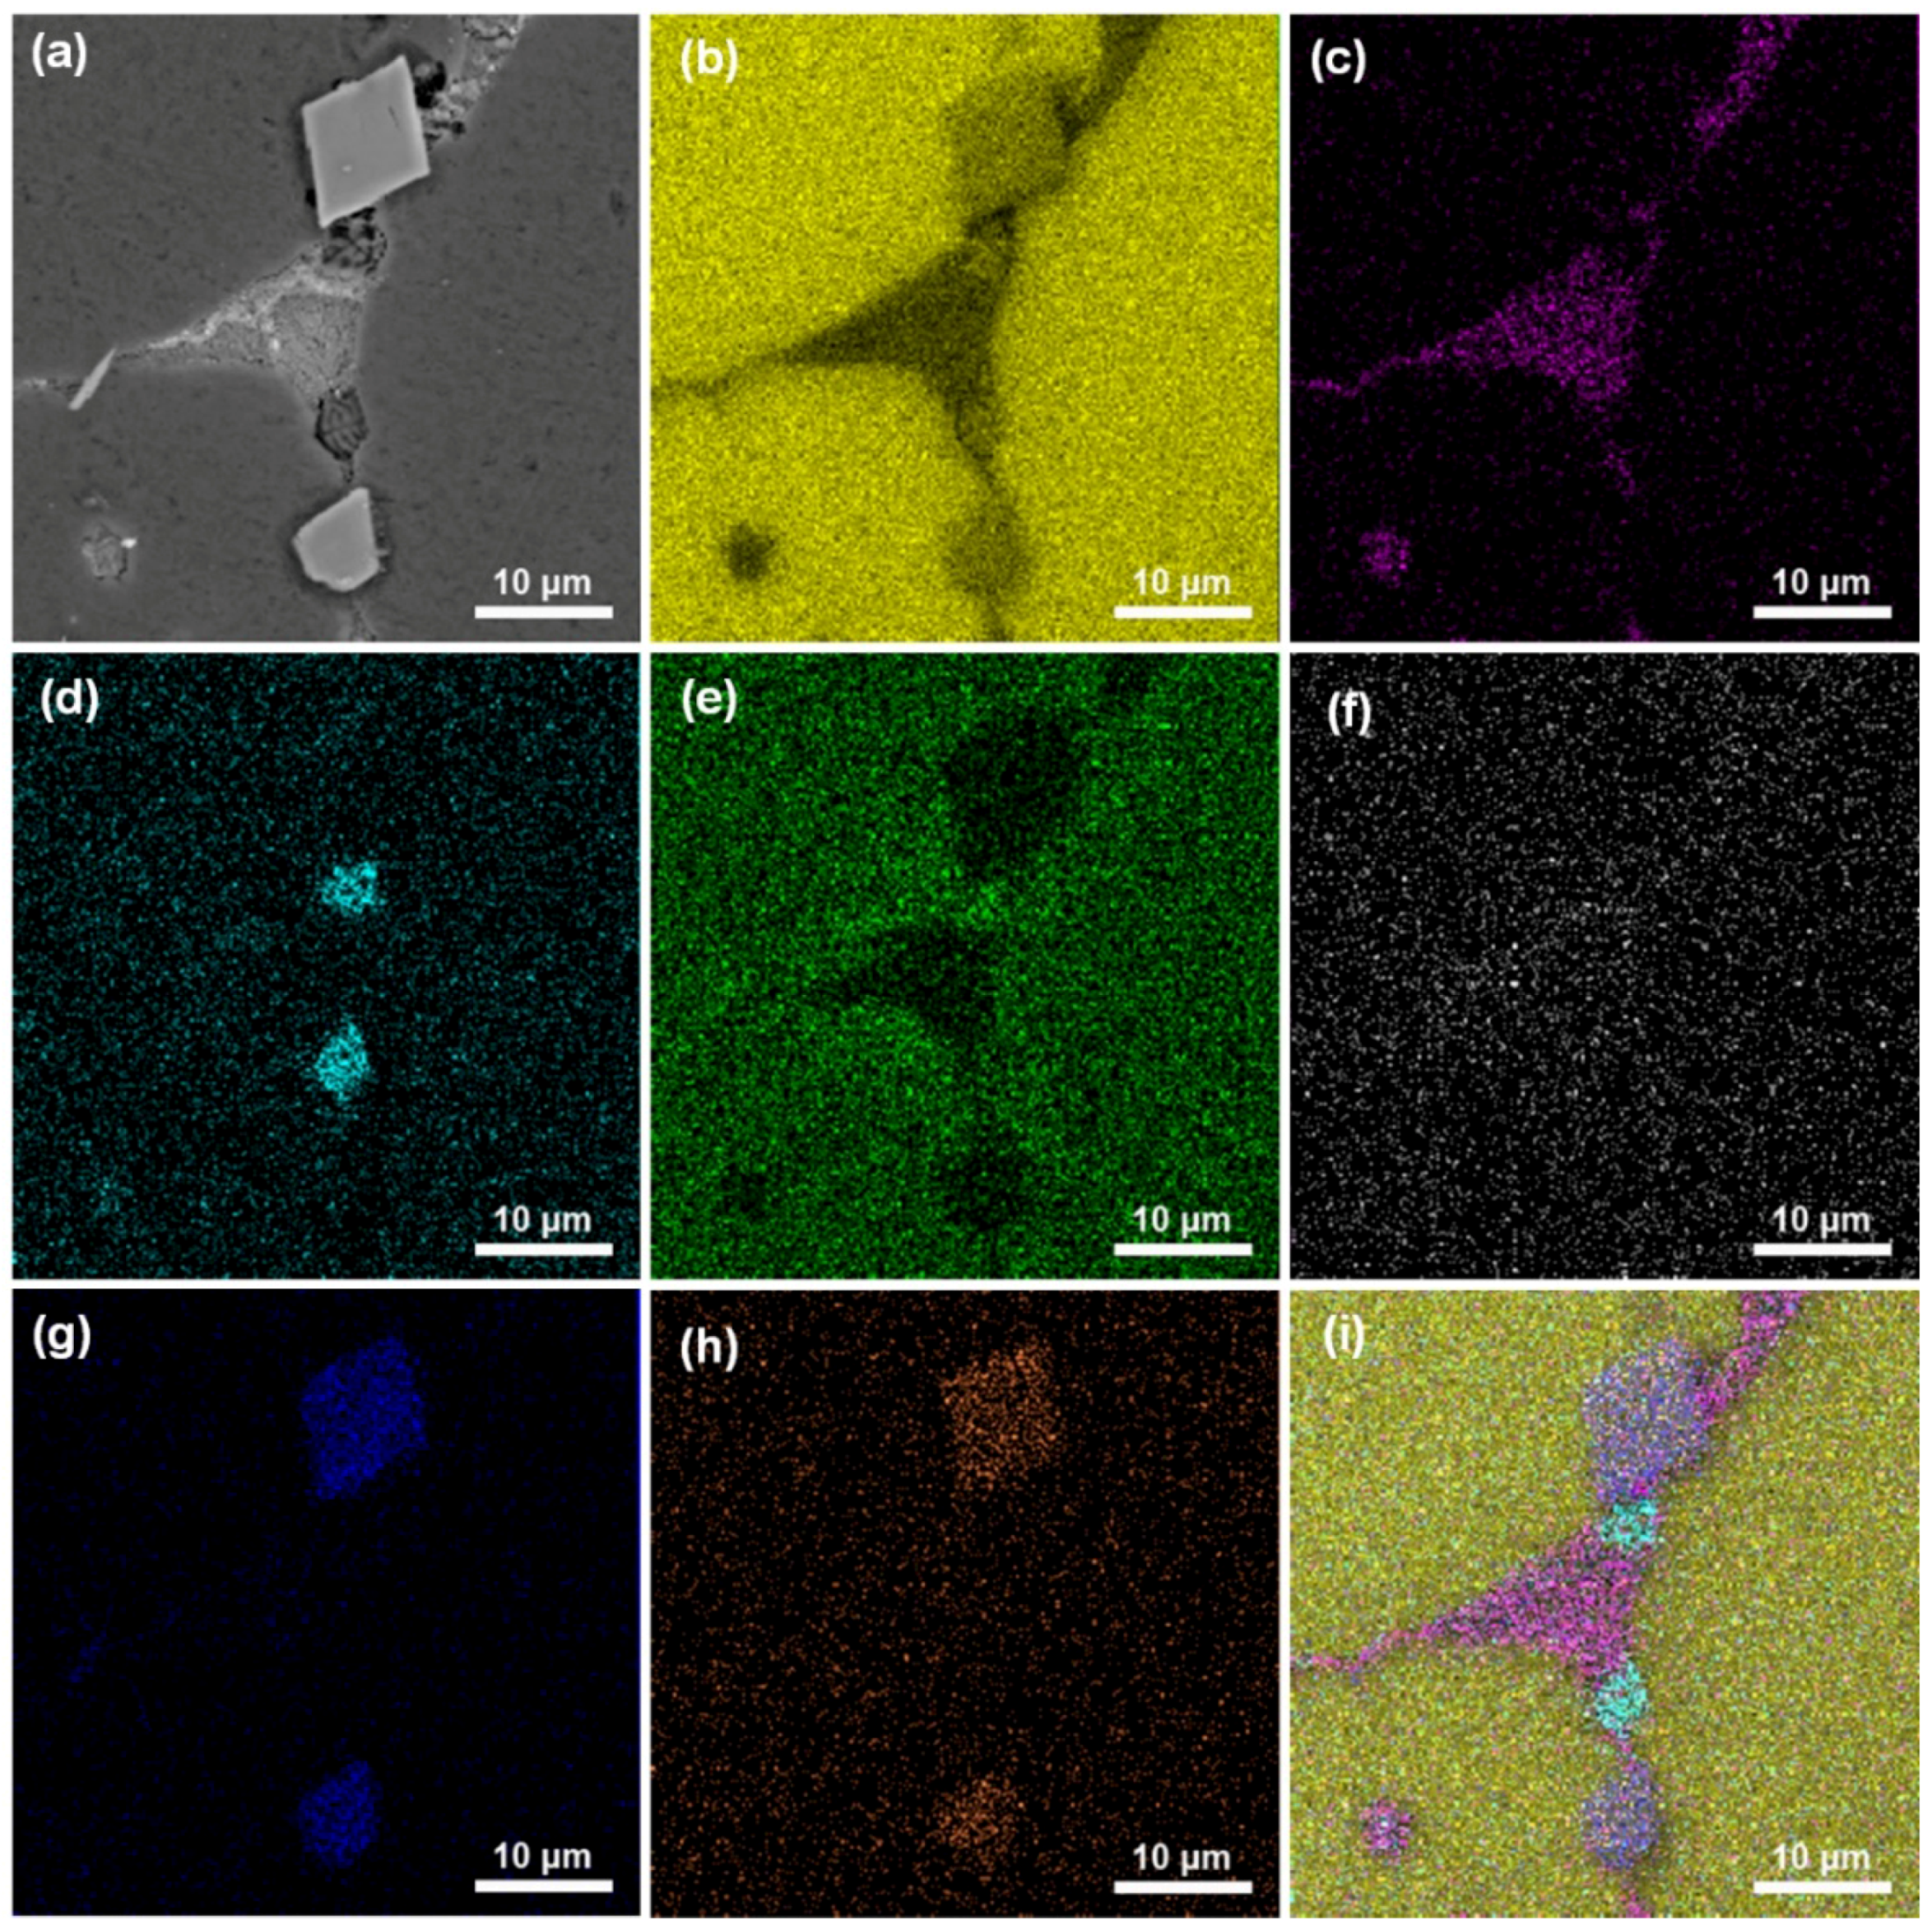
Figure 8 shows the EDS mapping of the main alloying elements of the strained samples heat treated at 600 °C for 25 min. Considerable segregation of Cu and Si at the grain boundaries was also confirmed by the EDS mapping analysis of Cu and Si (Figure 8c,d). In addition, an appreciable depletion of Mg was observed at the grain boundaries (Figure 8e). However, as it can be observed from the EDS analysis results in Figure 7 and the EDS mapping of Mg in Figure 8e, the Al-Si eutectics have a higher content of Mg compared with the Al-Cu eutectics. There was no appreciable change in Zn content at various point of the microstructure (Figure 8f). This is in contrast to the result of researches conducted by Bolouri et al. [35] and Shim et al. [37] who reported the segregation of Zn at the grain boundaries of a SIMA processed 7075 alloy and semi-solid Al-Zn-Mg alloy prepared by the cooling plate method, respectively. Atkinson et al. [18] also indicated that Zn and Mg are enriched at the grain boundaries of RAP processed 7075 alloy. Moreover, as it can be observed in Figure 8g,h, the grain boundary precipitates contain a high amount of Fe and Mn. As the EDS analysis revealed (Figure 7c,d), these precipitates are attributed to Fe-rich intermetallic particles. An overview of the alloying elements distribution in the semi-solid microstructure of 7075 Al alloy can be observed in Figure 8i.
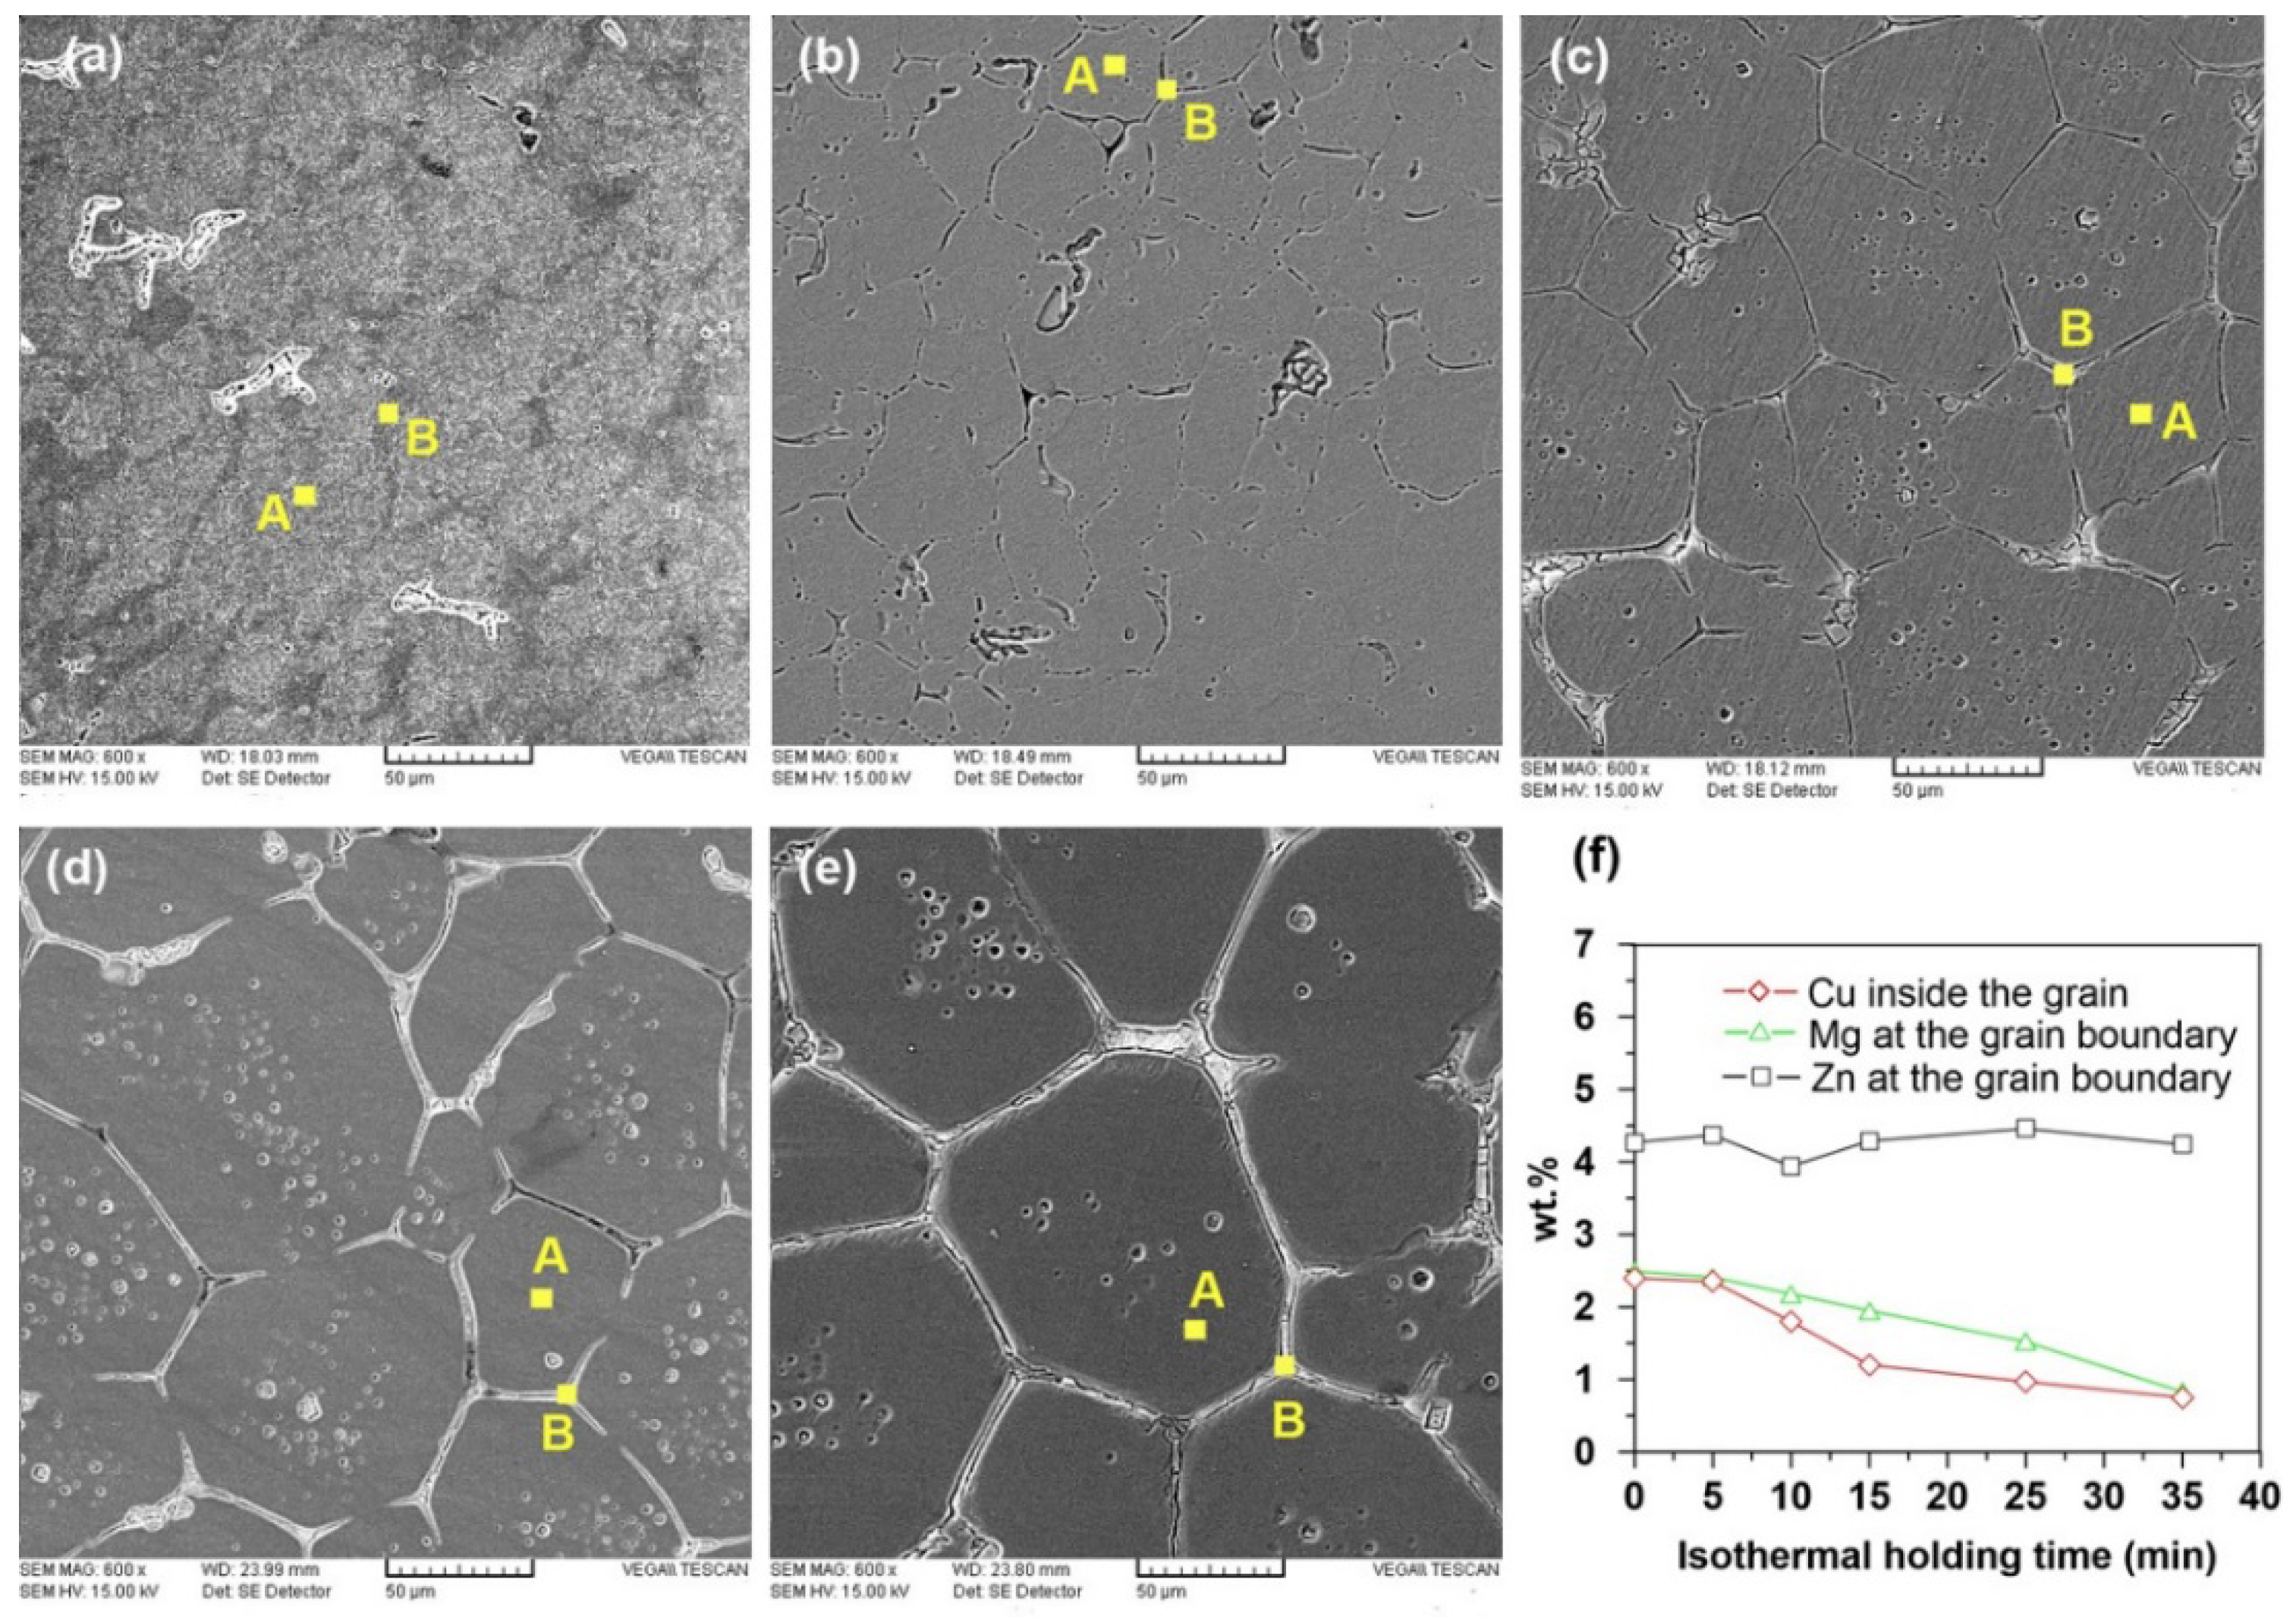
Figure 9a–e shows SEM images of compressed samples heat treated at 600 °C for 5–35 min. Variations of the main alloying elements of 7075 alloy (i.e. Cu, Zn, and Mg) at the grain boundaries and grain centers in these samples are also demonstrated in Figure 9f. The EDS analysis results of the grain centers and grain boundaries (Figure 9f), showed that the Cu concentration reduces within the solid grains on increasing the isothermal holding time at 600 °C. In other words, Cu segregation rises at grain boundaries with increasing holding time. Mg concentration declined at the grain boundaries on raising the holding time and no significant change was observed in Zn concentration at various parts of the microstructure.
Considering that (i) Zn, Mg, Si, and Cu-bearing intermetallic precipitates (η, S and Mg2Si) are dissolved gradually on prolonging the holding time according to XRD patterns of the SIMA processed samples (Figure 5), (ii) Zn and Mg have higher solubility in Al compared with Cu and Si according to the Al-Zn, Al-Mg, Al-Cu and Al-Si binary phase diagrams [38], and (iii) no distinct peak for these elements appeared in the XRD patterns (Figure 5), it can be concluded that Zn and Mg elements are easily dissolved in α-Al, while Cu and Si significantly segregate at the grain boundaries. Since, Zn has a smaller atomic radius relative to aluminum (0.133 nm compare to 0.143 nm) [
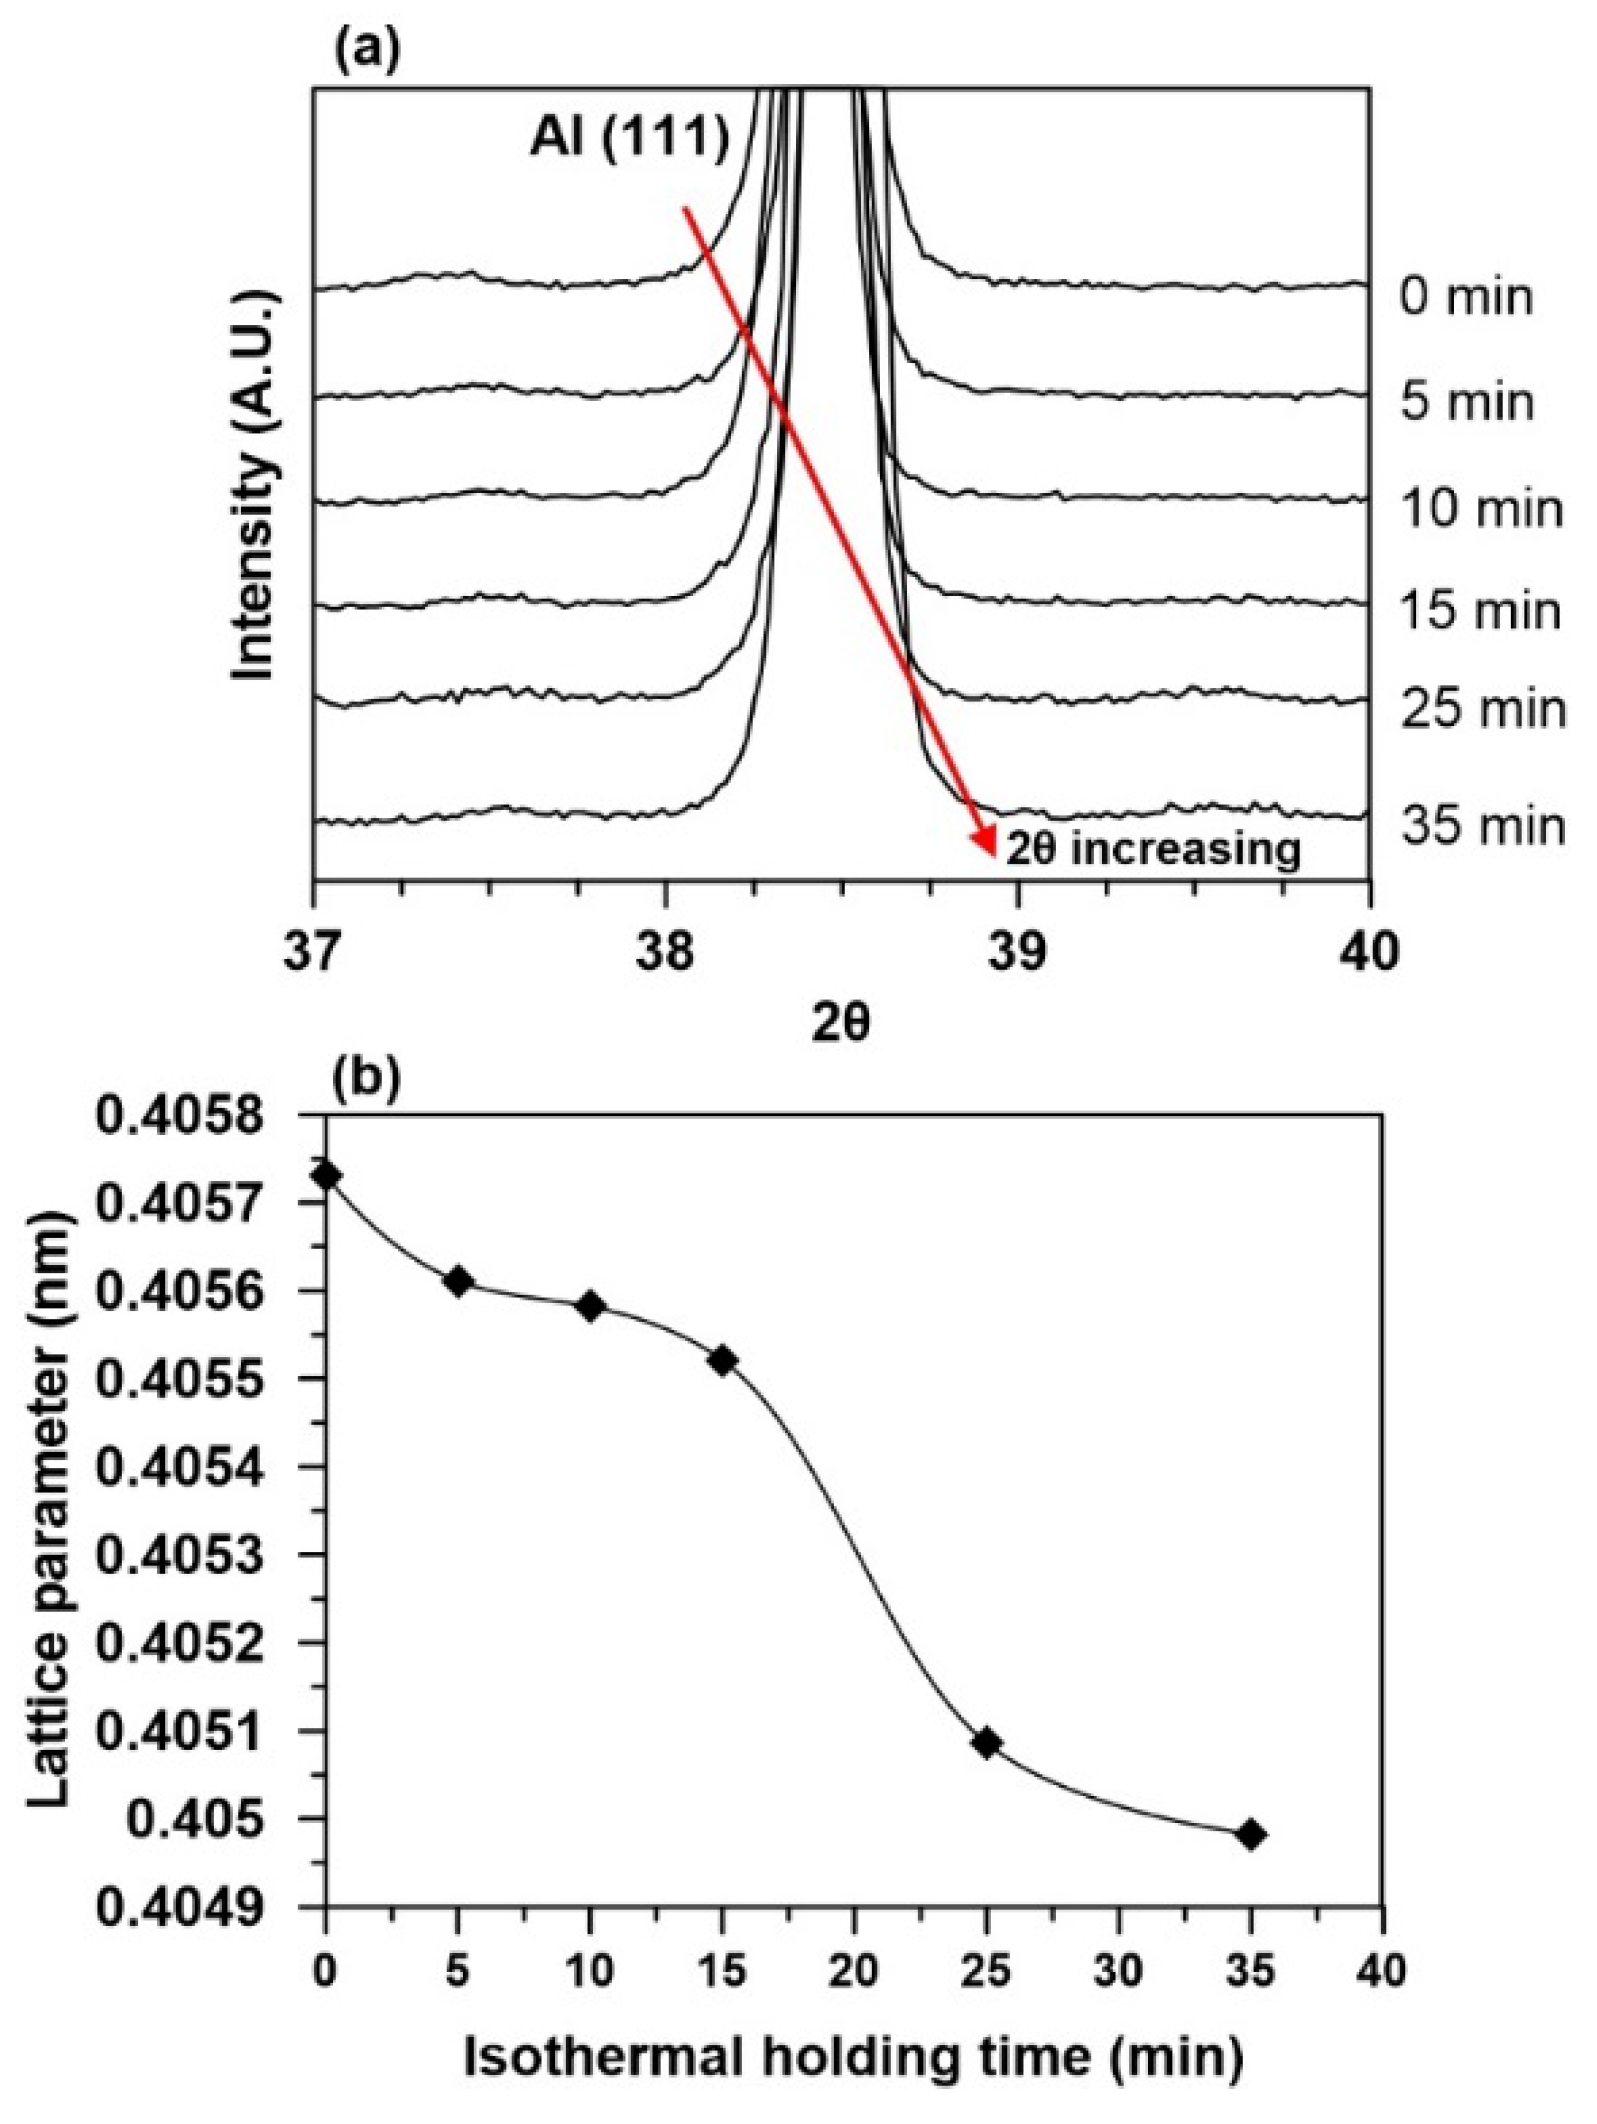
39], it can be concluded that dissolving Zn in the aluminum crystal lattice leads to reduction of the lattice parameter of aluminum. However, dissolving Mg in Al, as a result of its greater atomic radius, can result in increase of the lattice parameter of aluminum. The shifting of the Al main peaks in XRD patterns (Figure 5) to higher angles, as shown in Figure 10a for (111) reflection of the aluminum matrix, revealed that the lattice parameter of Al decreases on prolonging the heating time (Figure 10b) based on Bragg’s equation (nλ = 2dsinθ). It seems that dissolving Zn in Al is more effective than Mg. This may be as a result of the higher Zn content of 7075 alloy. According to Figure 10b, the lattice parameter is gently reduced with prolonging holding time to 15 min and then with further extension of the holding time to 25 min, the lattice parameter precipitously declines. Finally, further increasing of the heating time results in a gentle reduction of the lattice parameter. These observations clearly correlate with the XRD results in Figure 5. According to the XRD patterns, great amounts of η precipitates dissolve during the isothermal heating of the sample for 25 min. This results in dissolving of a higher amount of Zn atoms in the aluminum lattice and therefore leads to a significant decline of the lattice parameter.

3.5. Effects of Isothermal Holding Temperature and Time on the Semi-Solid Microstructure

Figure 11 shows the quenched microstructures of 7075 samples which compressed 20% and heated at 600, 610, and 620 °C for different times. A close examination of the micrographs in Figure 11 reveals that the liquid fraction and the sphericity of solid grains become greater on raising the isothermal holding temperature and time. Another fact that can be observed in the micrographs is the reduction of the number of entrapped liquid droplets within the grains and increase of their size on extending the heating temperature and time.
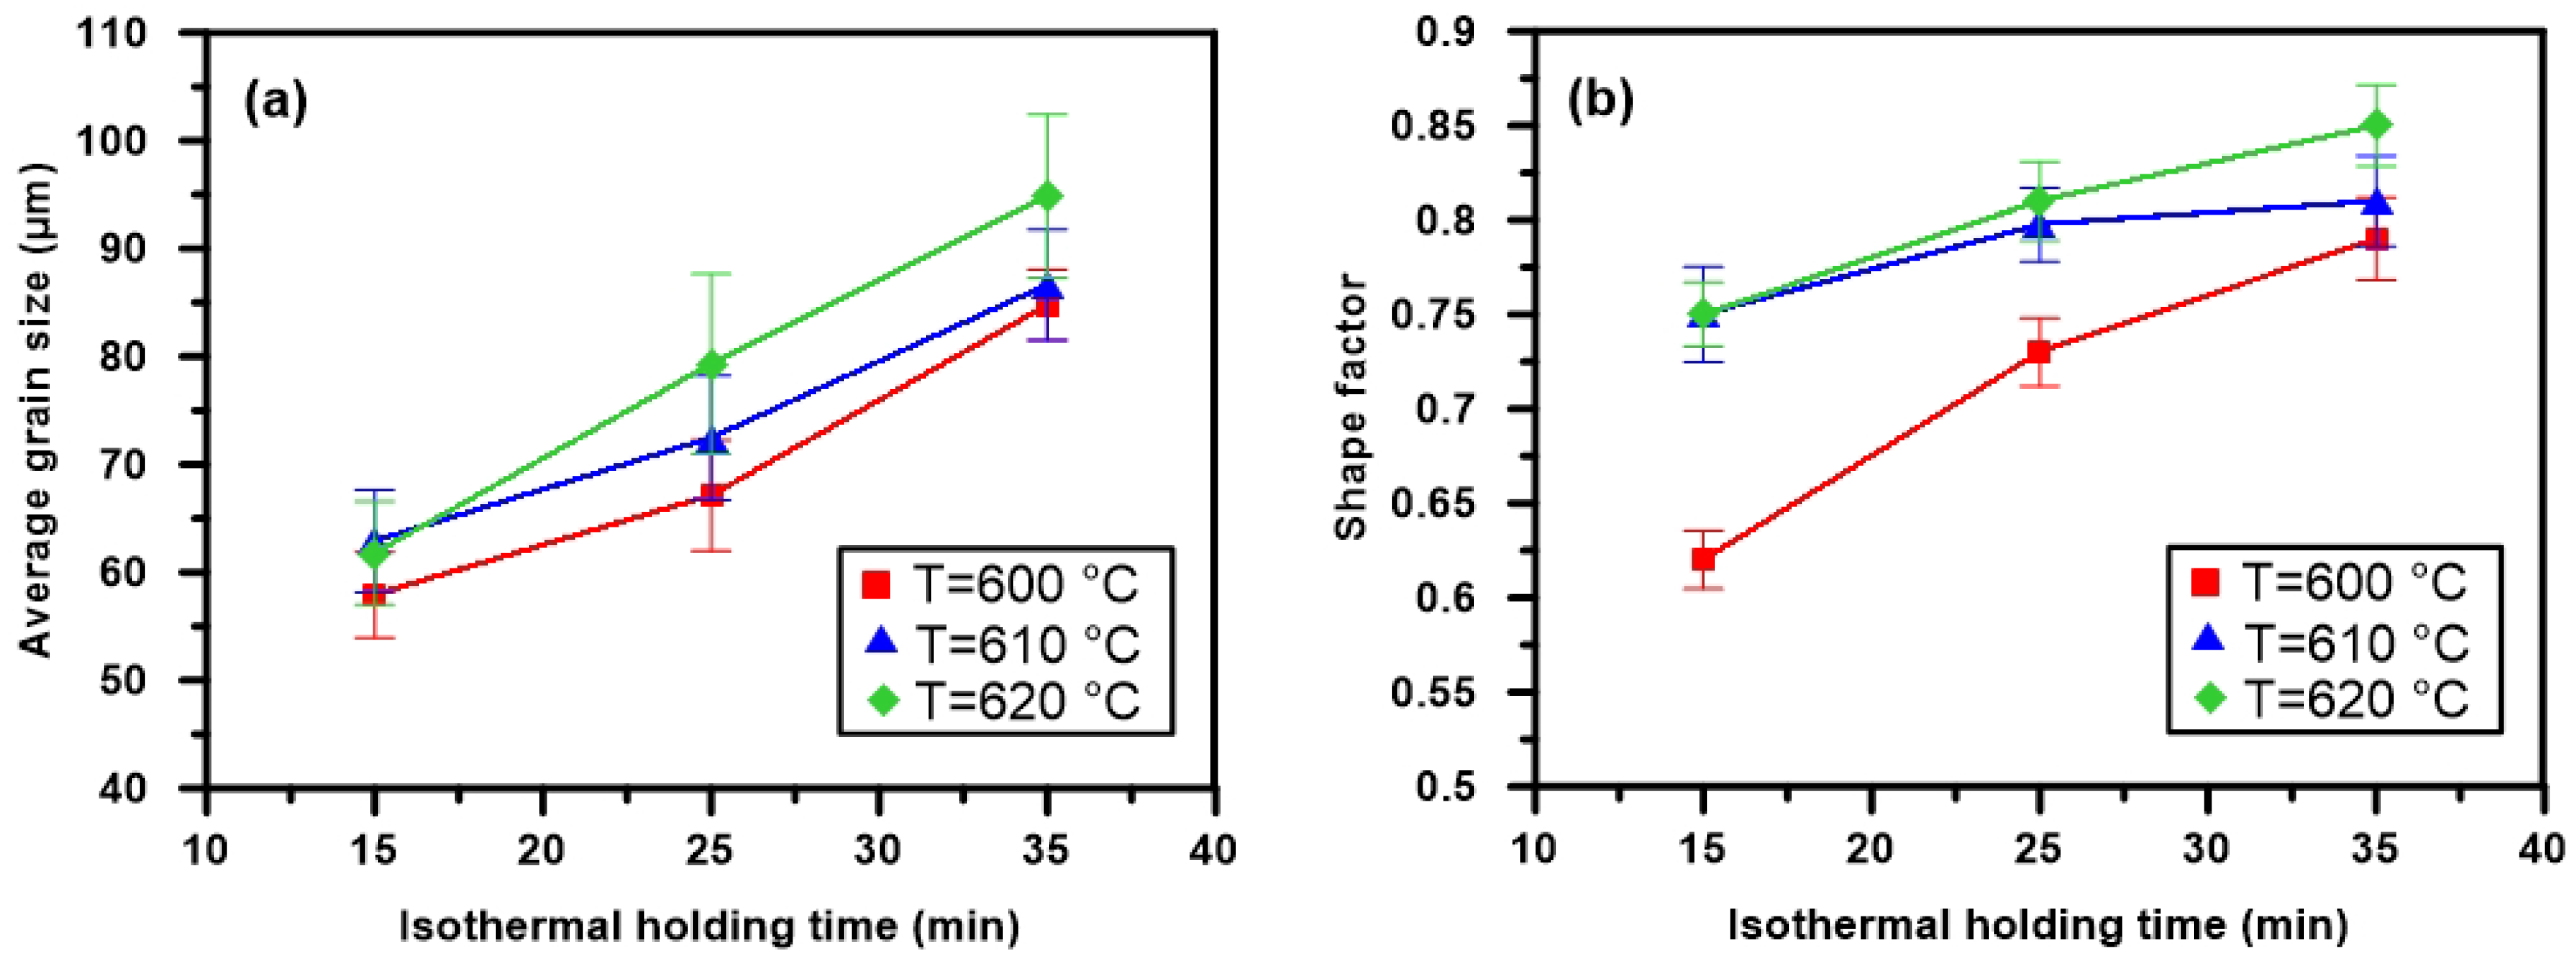
Variations of the average grain size and shape factor of strained samples heated at different temperatures and times are shown in Figure 12. As expected, the average grain size and shape factor become greater with increase of the holding temperature and time. However, it is worth noting that no significant variation of the average grain size of samples heated for 15 min on raising the holding temperatures from 600 to 620 °C is observed. Disintegration of solid particles owing to liquid phase penetration between the solid grains occurred during the primary heating time. This is due to the fact that a large number of solid grains with the same crystallographic orientations make contact with each other. It seems that the mechanism of particle disintegration is in equilibrium with the coalescence mechanism at longer heating times up to 15 min. Therefore, the solid grain sizes show no appreciable variation. In contrast, with further extension of holding times at various heating temperatures, the liquid film thickness between the solid grains and the liquid fraction becomes greater. Consequently, the Ostwald ripening mechanism can be considered as a dominant mechanism in the solid grain coarsening process. Figure 3e,f shows separated spherical grains with large entrapped liquid droplets which is a fact that supports the discussion above.
Results of research conducted by Vaneetveld et al. [40] showed that the semi-solid feedstock with high solid fraction (
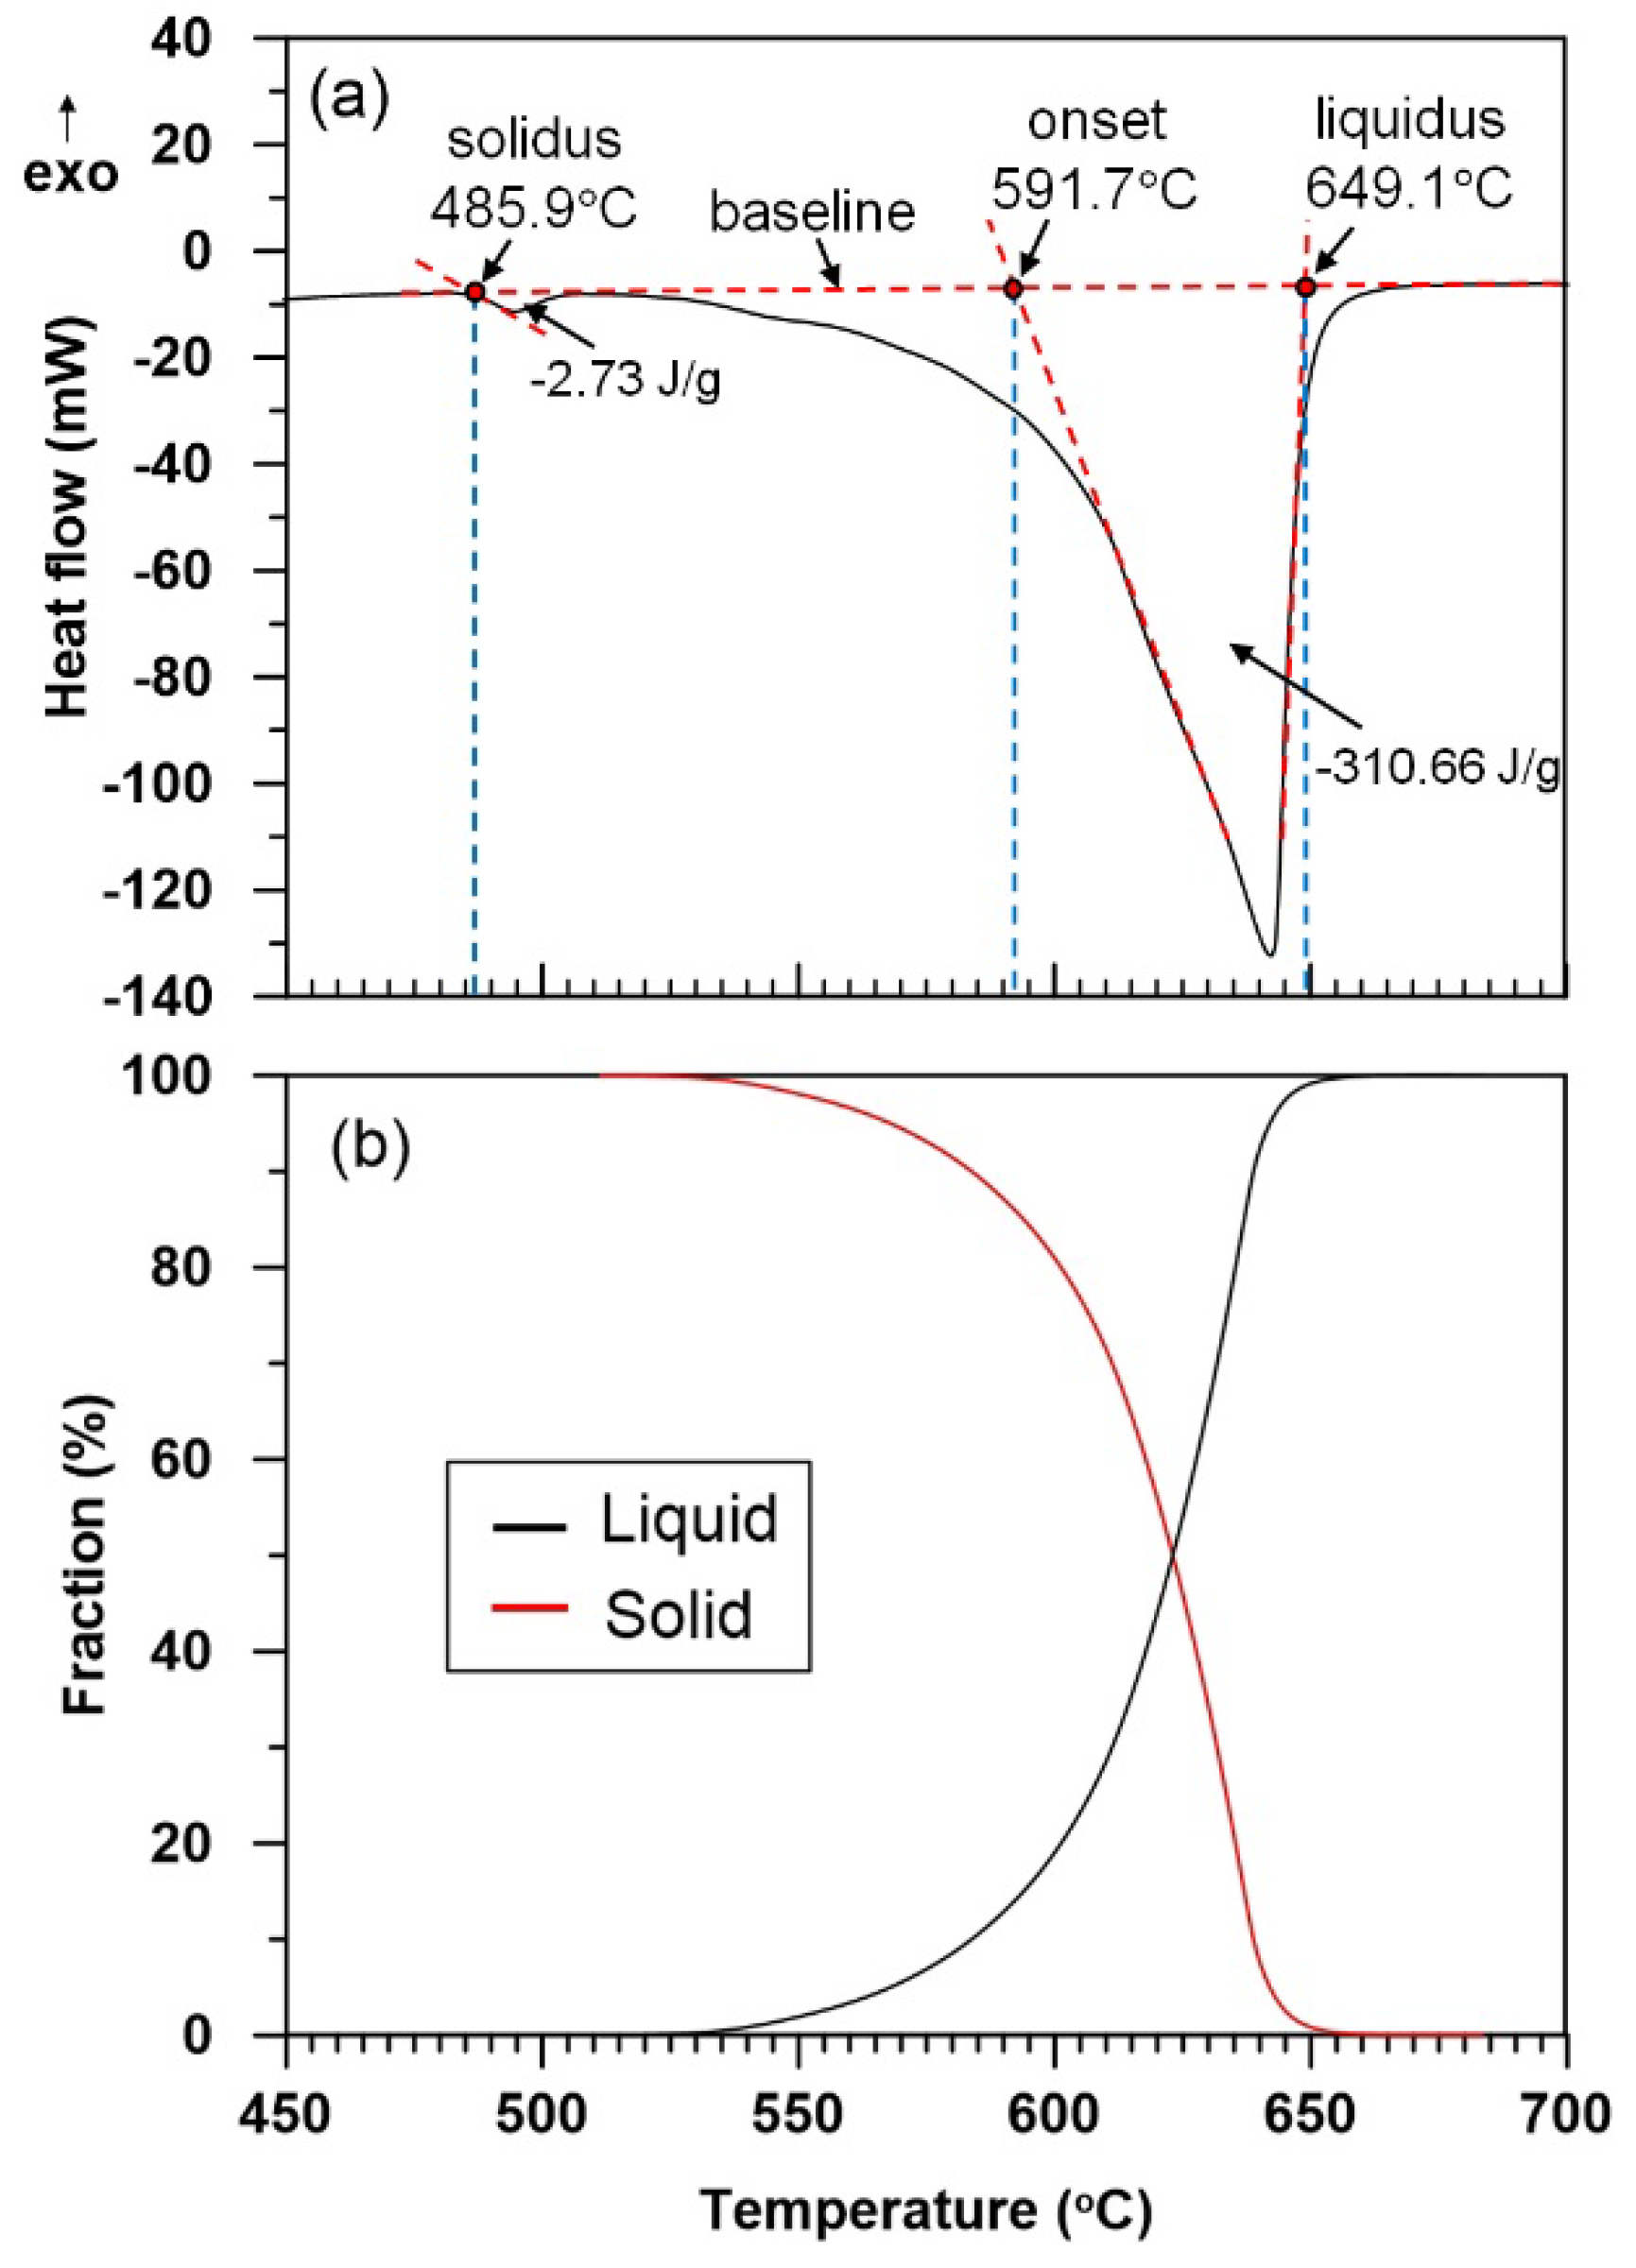
fs ≈ 0.84) shows better thixotropic behavior during semi-solid forming and also significantly prevents the formation of some defects such as porosity and shrinkage during the forming process. According to the solid fraction versus temperature curve in Figure 2b, the solid fraction is relatively low at 620 °C (fs ≈ 0.55). Thus, heating samples at such a temperature leads to undesirable coarsening of the solid grains. In addition, the solid fraction is more sensitive to temperature variations at 620 °C, when compared to the lower temperatures in which control of the semi-solid forming parameters is difficult. Consequently, the semi-solid microstructure obtained by isothermal heating at 620 °C is inappropriate for thixotropic applications. However, high solid fractions were observed following heating at temperatures of 600 and 610 °C. The solid volume fractions at 600 and 610 °C were 0.8 and 0.7, respectively (Figure 2b). Average grain size smaller than 75 μm and shape factor greater than 0.7 were obtained for strained samples heated at 600 and 610 °C for 25 min. Therefore, the isothermal heating temperature range of 600 to 610 °C and holding time of 25 min can be considered the optimum semi-solid treatment condition.
The coarsening kinetics can be expressed by the Lifshitz-Slyozov-Wagner (LSW) relationship [41,42]:
D n D 0 n = k t
where D and D0 are the final and initial grain sizes, respectively, t is the isothermal holding time, k is the coarsening rate constant and n is the power exponent. It has been found that n is 3 for volume diffusion controlled systems in the semi-solid state [12].
In the present research, the coarsening rate constant (k) was calculated by fitting a power relationship to the experimental results. 
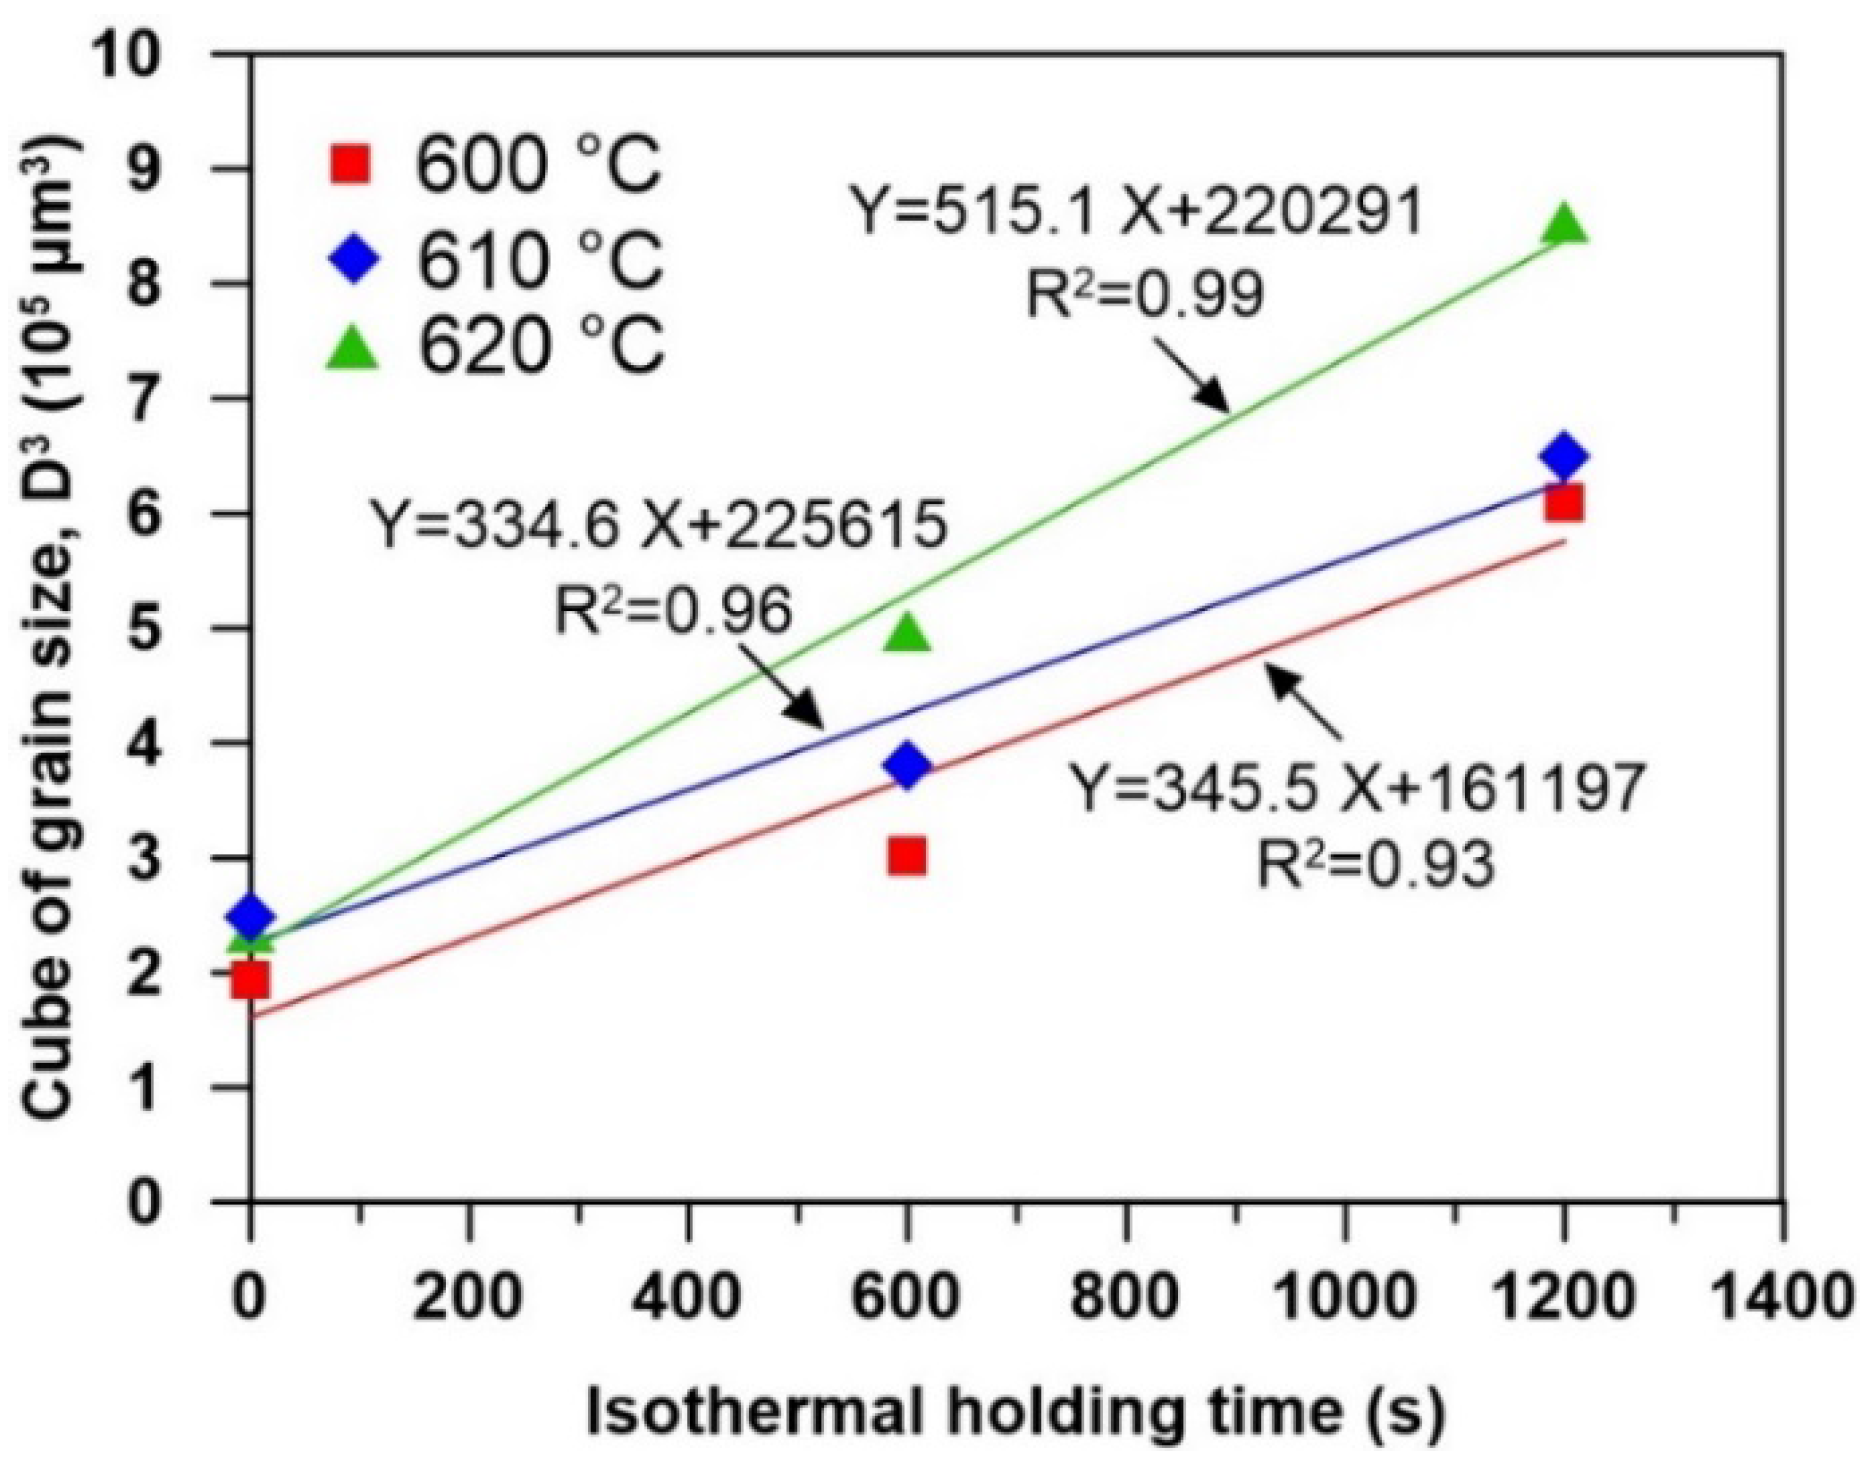
Figure 13 shows the cube of grain size variations versus isothermal holding time for compressed samples heated at 600, 610, and 620 °C, where D0 is the average grain size when the holding time is 15 min. The regression coefficients of the fitted equations are close to 1. Thus, it can be concluded that the coarsening kinetics of solid particles during the isothermal heating of deformed 7075 samples at the semi-solid temperature range are fairly well correlated with the LSW equation. The values of the coarsening rate constant k for the samples are summarized in Table 3. The main characteristics of the variation of k values when the temperature was decreased from 620 to 600 °C are as follows; (i) the k value significantly reduced on decreasing the temperature from 620 to 610 °C; (ii) this was followed by a slight increase at 600 °C.
According to the Doherty theorem [32], the coarsening rate accelerates with rising solid fraction (fs) for fs higher than 0.6. However, the research conducted by Manson-Whitton et al. [41] showed opposite results for higher solid fractions (fs ≥ 0.7) in the case of spray formed Al-4% Cu. Therefore, they proposed a modified model considering the solid-solid contacts effect during coarsening and a transition solid fraction (fs ≈ 0.7). For the solid fractions greater than the transition value, the k value decreased with an increase in the solid fraction. However, for the solid fraction lower than the transition value, the k value increased on increasing the solid fraction. Considering the holding temperatures that correspond to the calculated solid fractions (Figure 2b), for solid fractions greater than 0.7 (at 610 °C) and the transition value of 0.8 (at 600 °C), the coarsening process of solid grains is similar to the model proposed by Manson-Whitton et al. [41]. On the other hand, an unexpected increase in k values is observed for solid fractions lower than 0.7. This can be attributed to (i) further increase of the atomic diffusion and more effective Ostwald ripening mechanism and (ii) a less retarding effect of the precipitate particles (Fe-rich intermetallic particles) for a holding temperature up to 620 °C. These particles bring about convoluting grain boundaries as is marked by arrows in Figure 14, suggesting pinning and retardation of the grain boundary liquid film migration during the solid grains coarsening. The effect of the presence of intermetallic precipitates at the grain boundaries on the coarsening rate of aluminum alloys has also been reported by Manson-Whitton et al. [41] and de Freitas et al. [43]. The results obtained in the present research indicate that Fe-rich precipitates mainly dissolve or become smaller than the thickness of the liquid film on raising the heating temperature up to 620 °C. Thus, the movement of grain boundaries can easily occur and leads to greater values of the coarsening rate constant.

3.6. Semi-Solid Deformation Behavior

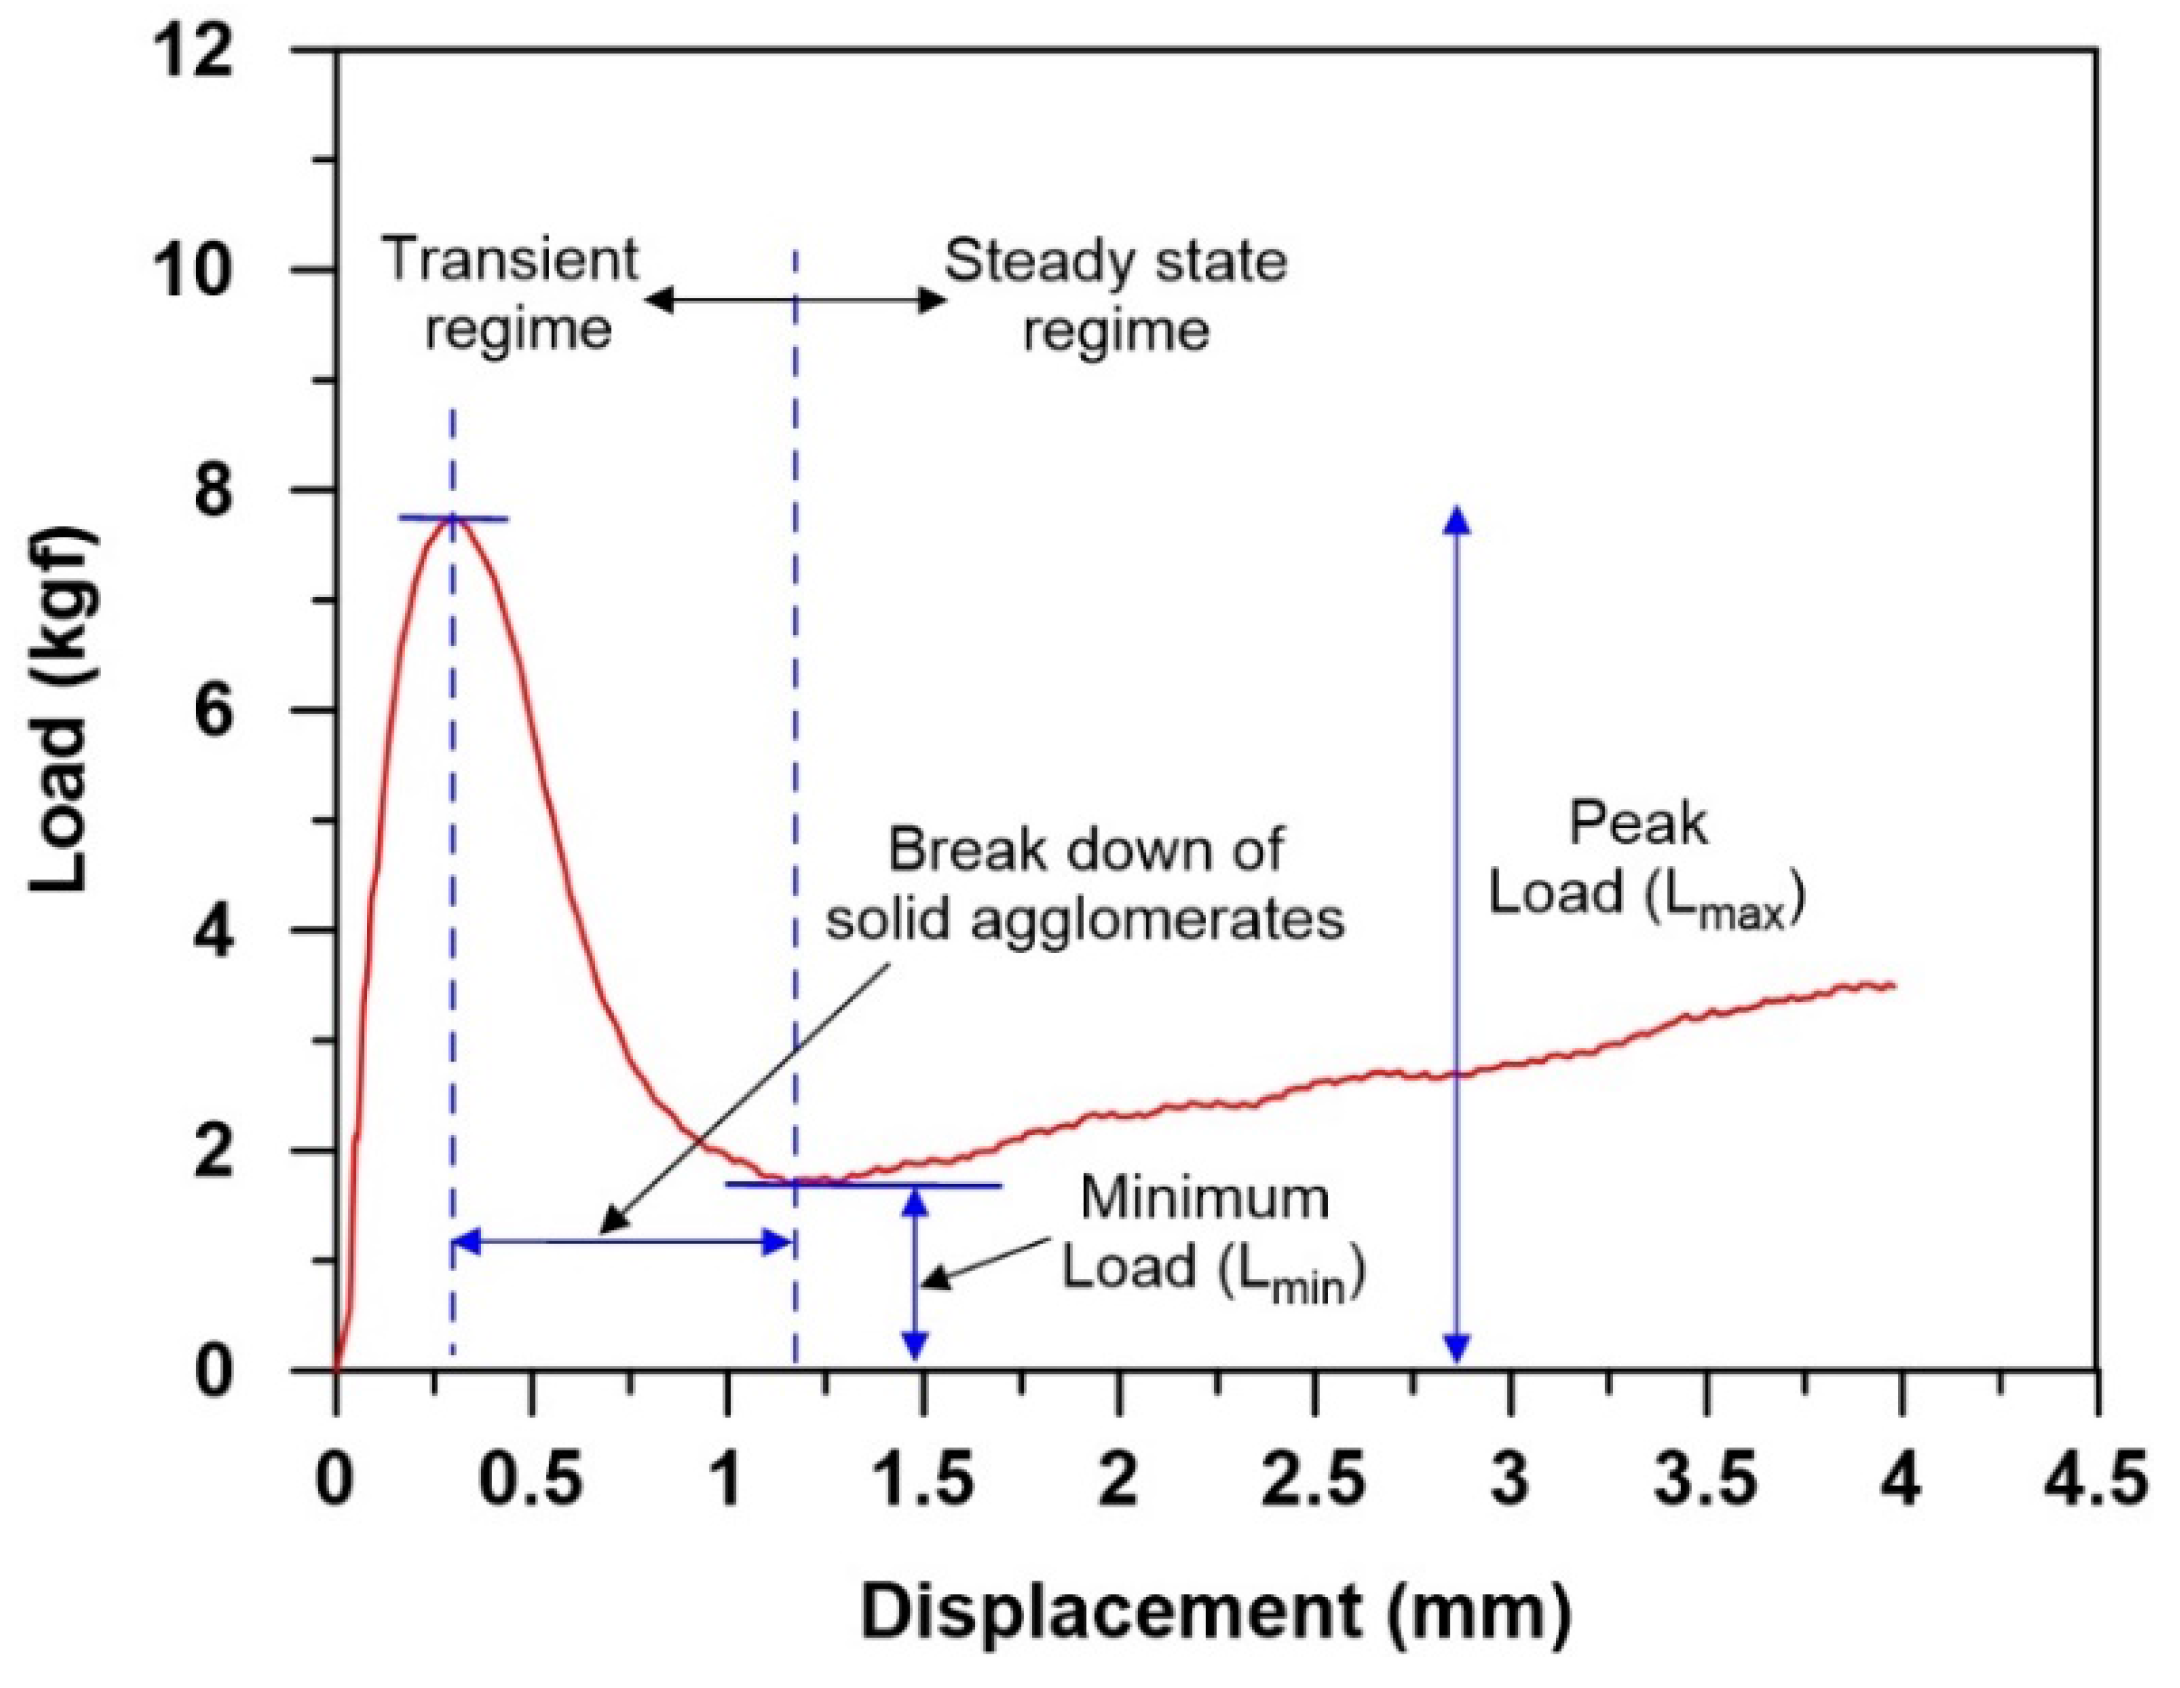
Figure 15 shows a typical load-displacement curve obtained from the hot compression experiment. As it can be observed, the load rises to a maximum (Lmax) and then decreases to a minimum value (Lmin). The thixotropic flow behavior consisted of a transient regime and a steady state regime, as shown in Figure 15. Semi-solid alloys with an equiaxed microstructure are considered as deformable semi-cohesive granular solids saturated with liquid [44]. The solid grains are partially interconnected by unwetted grain boundaries and liquid fills the interstitial spaces. Large deformation results in the destruction of some solid grain boundary bonds to allow grains to move freely and rearrange through sliding and rolling. The cohesion at the grain level reflects the strength of unwetted grain boundaries and results in a flow resistance. With further deformation breakdown the solid agglomerates, the load (stress) decreases to a steady state level.
Tzimas and Zavaliangos [44] suggested that the flow resistance of semi-solid alloys at high solid volume fraction is controlled by four mechanisms: (i) elastoplastic deformation at grain contacts, (ii) destruction of cohesive bonds between solid grains, (iii) resistance to the flow of liquid relative to the solid, and (iv) resistance to grain rearrangement. Mechanism (i) is dominant in the rising part of the flow curve and mechanism (ii) results in the breakdown of solid particles and a significant drop in the load value. Mechanisms (iii) and (iv) are dominant in the second stage, and their relative contribution to the overall resistance to flow depends on the volume fraction of solid.
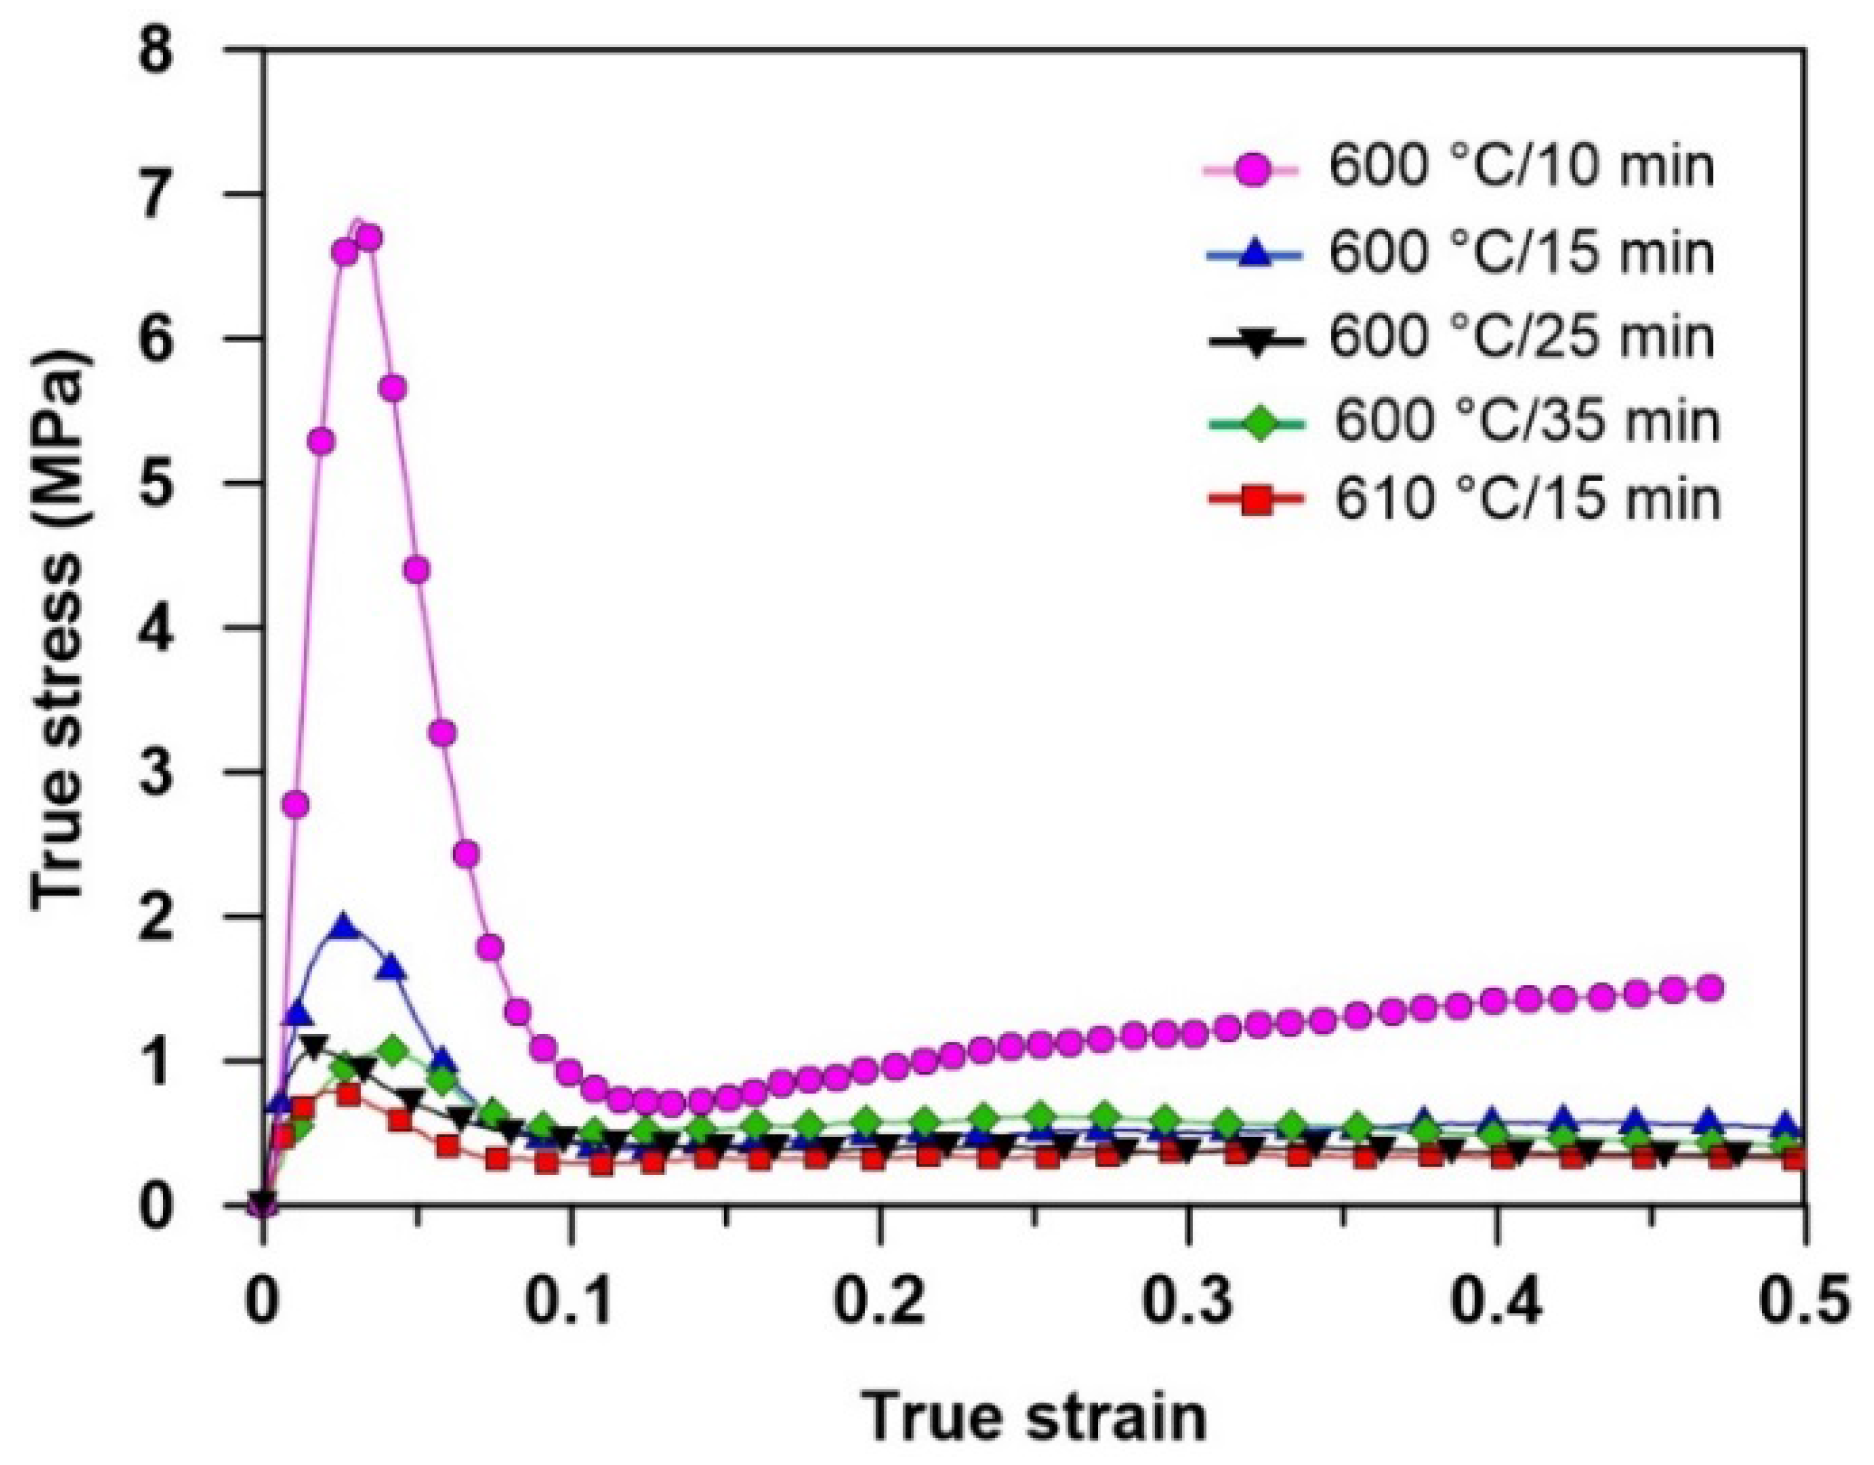
The stress-strain curves obtained from the SIMA processed 7075 samples with different initial microstructures after hot compression at 600 °C (for the SIMA samples isothermally treated at 600 °C for 10–35 min) and 610 °C (for the SIMA sample isothermally treated at 610 °C for 15 min) are shown in Figure 16. The stress exhibits a maximum value at a relatively low strain in all samples. The strain at the peak stress varies between 0.01 and 0.04. The peak stress then drops to a steady state value, typically at a strain of 0.1–0.18. The stress at the steady state shows no significant change with strain. 
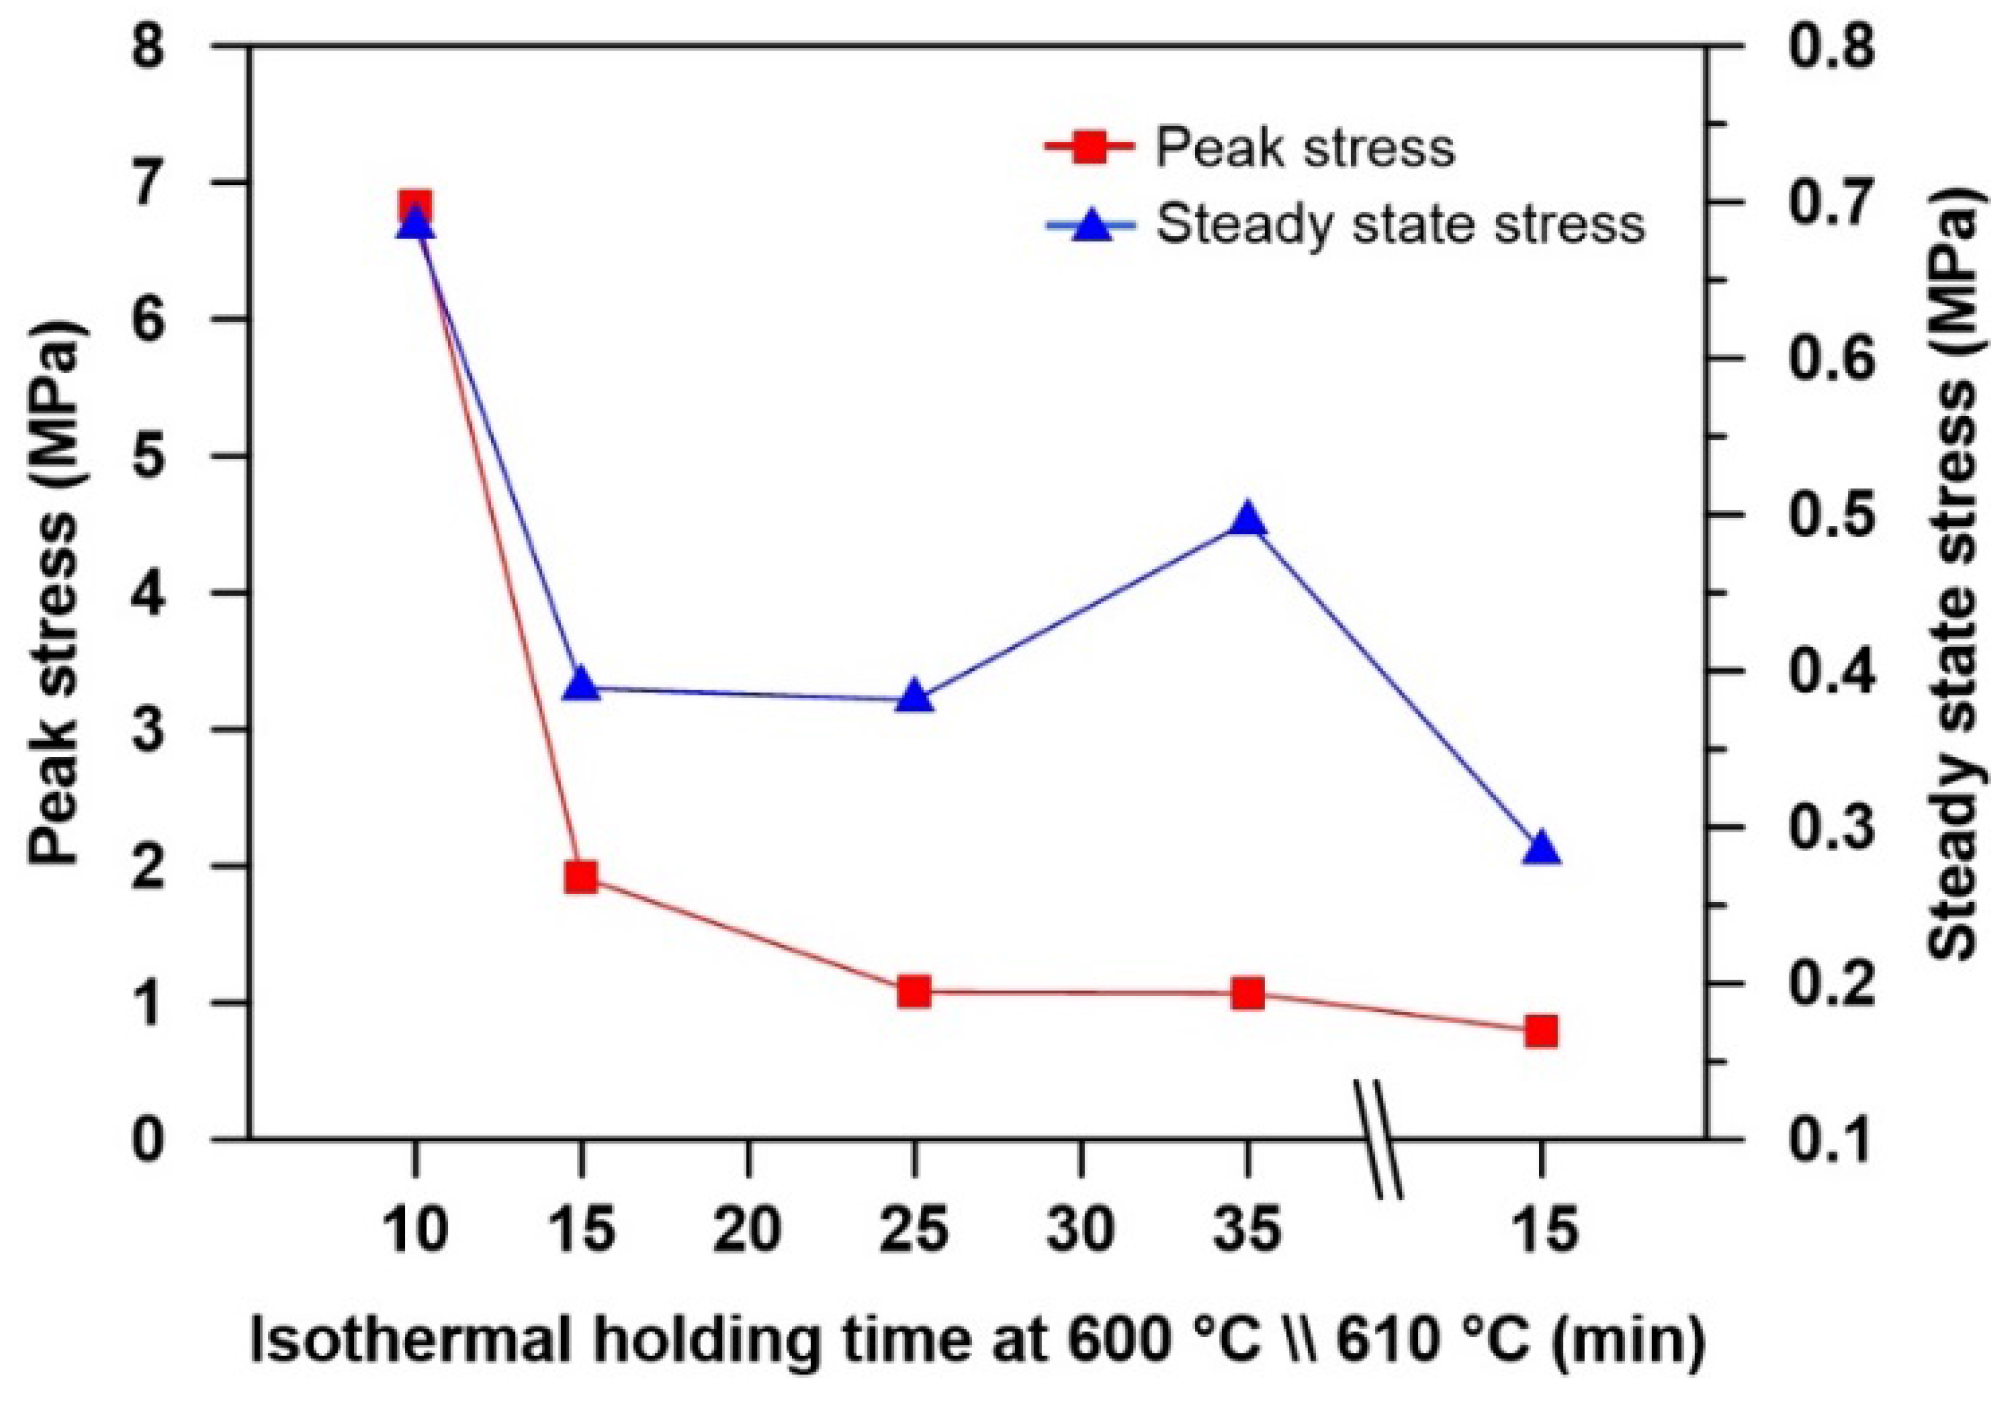
Figure 17 shows the variation of the peak and steady state stresses for the SIMA processed samples with different initial microstructures. As is evident from Figure 16 and Figure 17, the sample semi-solid treated at 600 °C for 10 min exhibits the highest peak and steady state stresses. On increasing the isothermal holding time to 25 min at 600 °C, which results in a coarser and more spherical solid grains in the initial microstructure (see Figure 12), both the peak and steady state stresses decreased significantly. The peak stress showed a slight increase while a considerable increase in the steady state stress was observed with further increase of the holding time to 35 min in the SIMA process. Moreover, the increase of the deformation temperature had a great influence on the stress-strain curve and resulted in a decrease of thixotropic strength, as is observed for the sample semi-solid treated at 610 °C for 15 min.
The descending trend of the thixotropic strength (decreasing of the peak stress) with increase of the isothermal holding time in the SIMA process can be attributed to the geometry of the solid grains. As was previously described, the deformation of samples with equiaxed microstructure mainly occurs by grain rearrangement through sliding and rolling. However, the microstructures consisting of non-equiaxed and elongated grains are deformed by plastic deformation due to which the relative movement among solid grains is constrained. 
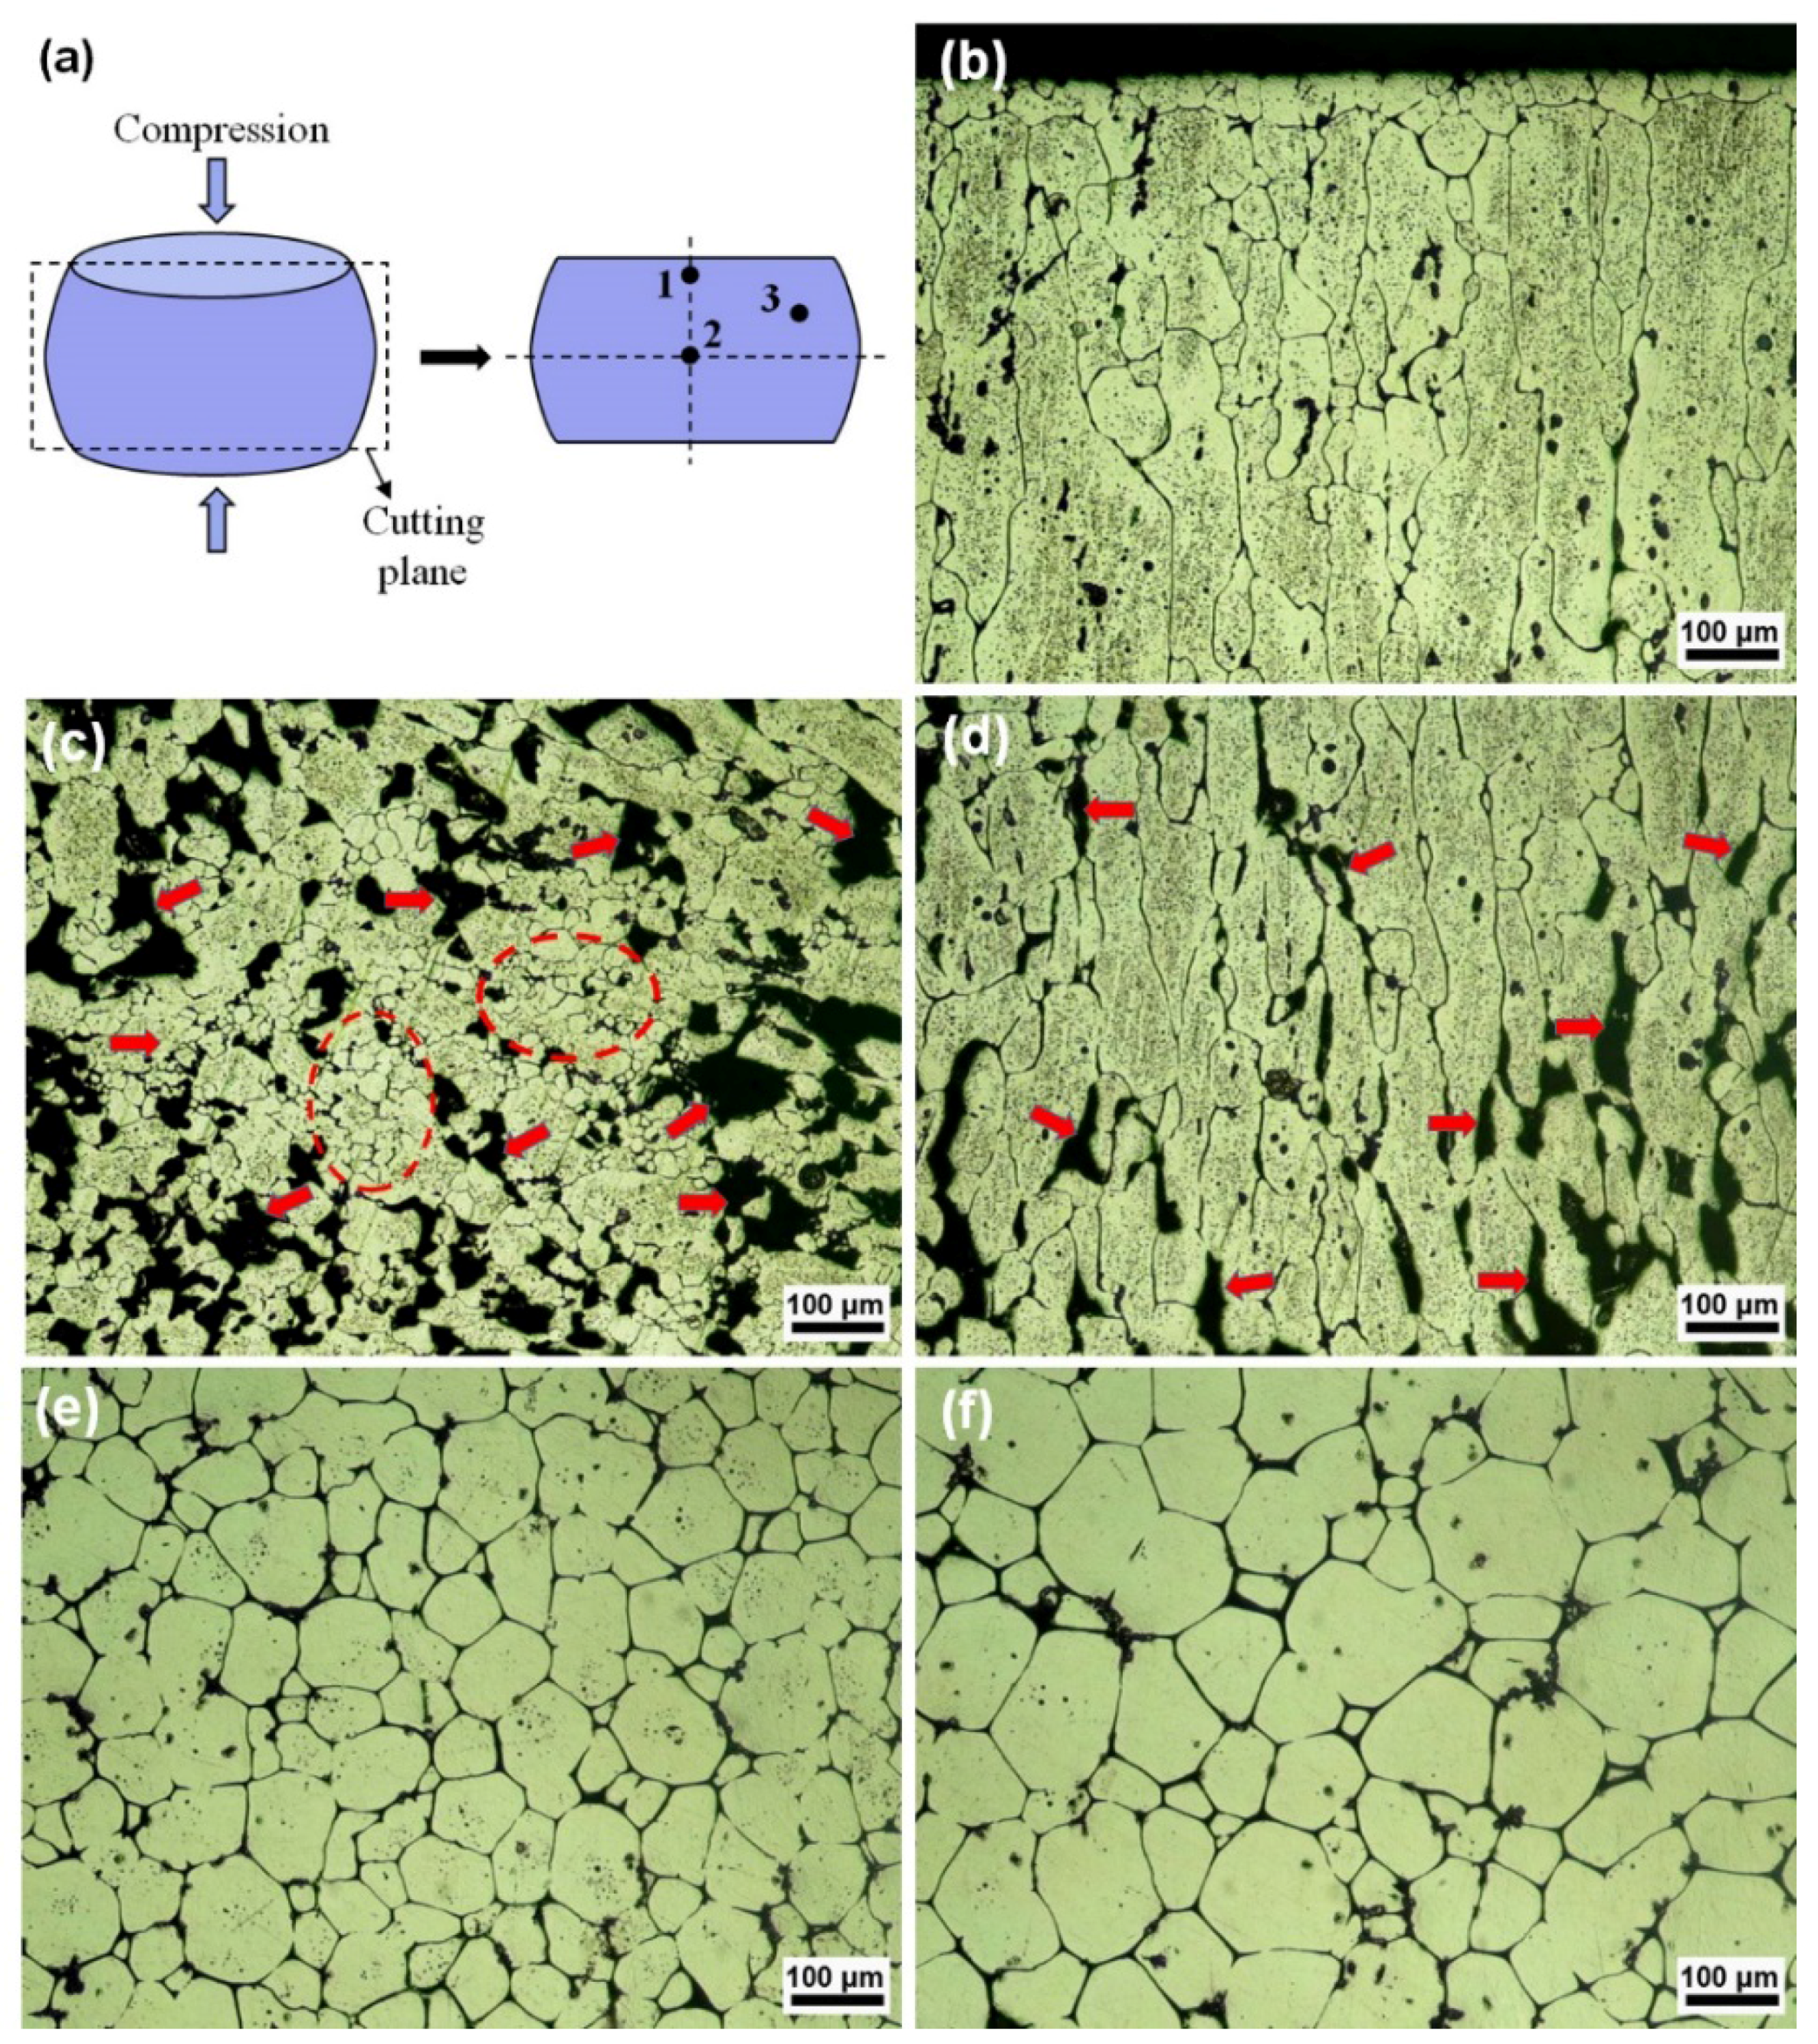
Figure 18 shows the hot compressed microstructure of SIMA processed samples with near equiaxed and globular initial microstructure. The microstructure of various regions (1 to 3 in Figure 18a) of the hot compressed SIMA sample processed at 600 °C for 10 min (see Figure 3c) revealed that this sample cannot be deformed by grain rearrangement due to the significant geometric interference of the solid grains which results in plastic deformation of the grains (Figure 18b–d). As is observed in Figure 18b–d, the solid grains are severely deformed and elongated in the direction of compression which results in a textured microstructure. This leads to a much higher resistance to flow compared to samples with a completely spheroidized microstructure. On prolonging the isothermal heating time, the sphericity of solid grains increases and the interconnection decreases (Figure 3) which results in easier movement and sliding during deformation and reduction of flow resistance. The high flow stress of the SIMA sample heated for 35 min can be ascribed to the coarsened initial microstructure with an average grain size of 85 μm. According to Clarke [45], an increase in the particle size leads to an increase in the apparent viscosity of the semi-solid slurry. Therefore, a sample with coarsened initial microstructure possesses a more viscous flow and requires higher loads for thixoforming.
Figure 18e,f shows the microstructure of the center region (region 2 in Figure 18a) of the hot compressed semi-solid samples prepared by heating at 600 °C for 25 and 35 min, respectively. After compression, no evidence of the plastic deformation of the solid grains was observed in the microstructure of the samples. There was no difference in the microstructure of the center regions and edge regions, which indicated that the solid and the liquid flowed together during the compression. However, it is worth mentioning that the liquid fraction in the edge regions was slightly high, which was due to the liquid phase being squeezed out during the deformation. The microstructural observations also revealed that the solid grains do not experience plastic deformation in the SIMA samples prepared by heating at 600 and 610 °C for 15 min. According to Chen and Tsao [46], the plastic deformation of solid particles (PDS), sliding between the solid particles (SS), liquid flow (LF), and the flow of liquid incorporating solid particles (FLS) are four dominant mechanisms controlling deformation of alloys in the semi-solid state. The two former mechanisms are active when the solid particles are in contact with each other and the other two mechanisms are dominant when the solid particles are surrounded by the liquid phase. Therefore, it can be deduced that the sample with near equiaxed initial microstructure deform through the mechanism of PDS. In the case of globular initial microstructures, the SS and FLS mechanisms are dominant, however, the effectiveness of the SS mechanism may dwindle and the FLS mechanism is reinforced on prolonging the isothermal holding temperature and time due to the decrease of the interconnection between the solid grains.
The close examination of the hot compressed microstructure of different samples (Figure 18) also reveals that the microstructure of the SIMA processed sample with near equiaxed and elongated initial grains contains a higher amount of porosity, especially in regions 2 and 3, (shown by arrows in Figure 18c,d) compared to the samples with globular microstructure. In the sample with near equiaxed initial microstructure, the low amount of liquid content leads to higher viscosity, which may prevent the homogenous flow of the liquid and solid particles during deformation. Therefore, this sample shows a high amount of porosity in the microstructure. In addition, as shown by dotted ovals in Figure 18c, recrystallization occurs in some parts of the center region in the sample with an incomplete spheroidized initial microstructure during hot compression. It is believed that this recrystallization may occur dynamically as a result of higher induced strain in the center regions compared to the edge regions during hot compression.

4. Conclusions

The SIMA process consisting of applying uniaxial compression strain at ambient temperature and subsequent semi-solid treatment in the range of 600–620 °C for 5–35 min was investigated. It has been found that using the cold compression process following by heating in the semi-solid range results in some phase evolution that is suitable for obtaining a semi-solid microstructure for subsequent thixoforming. The following results can be drawn from the analysis:
The results showed that the partial remelting kinetics during the SIMA process consist of four steps including recrystallization and structural separation, coarsening of polygonal solid particles, spheroidization of polygonal particles, and coarsening of spherical particles. The growth and coarsening of the solid particles in the SIMA process are controlled by two mechanisms of coalescence (for low liquid fractions) and Ostwald ripening (for high liquid fractions).
The XRD results of the compressed samples heated at 600 °C for different times showed that MgZn2 (η), Al2CuMg (S), and Mg2Si precipitates are dissolved gradually during isothermal heating through the phase transformations of α-Al + η → L and then α-Al + S + Mg2Si → L. However, Fe-rich precipitates aggregate as square particles at grain boundaries due to their higher melting points.
An intense segregation of Si and Cu was observed at the grain boundaries in the semi-solid microstructure which results in shifting of the grain boundary composition toward the Al-Si and Al-Cu eutectics. In contrast, a significant depletion of Mg was observed at the grain boundaries and Zn distribution showed no appreciable change during isothermal treatment.
Microstructural observations indicated that the isothermal heating temperature range of 600–610 °C for 25 min can be considered an optimum condition for the SIMA process. Coarsening kinetics of the solid particles is fairly well correlated to the LSW theory during isothermal heating. Despite the higher liquid fraction of samples heated at 610 °C, the coarsening rate at 610 °C was lower than 600 °C.
Samples with near equiaxed initial microstructure containing elongated and polygonal solid grains and samples with globular initial microstructure with average grain size of 61 μm show the greatest and the lowest flow resistance during the thixoforming process at 600 °C, respectively. The flow resistance decreases on raising the deformation temperature.

Author Contributions

Behzad Binesh performed the experiments and wrote the paper under Mehrdad Aghaie-Khafri’s guidance, and contributed to all activities.

Conflicts of Interest

The authors declare no conflict of interest.

References

  1. Kirkwood, D.H.; Suery, M.; Kapranos, P.; Atkinson, H.V. Semi-Solid Processing of Alloys; Springer: London, UK, 2009; pp. 109–112. [Google Scholar]
  2. Flemings, M.C. Behavior of metal alloys in the semisolid state. Metall. Trans. A 1991, 22, 957–981. [Google Scholar] [CrossRef]
  3. Jayaraj, J.; Fleury, E.; Kim, K.-B.; Lee, J.-C. Globulization mechanism of the primary Al of Al-15Cu alloy during slurry preparation for rheoforming. Met. Mater. Int. 2005, 11, 257–262. [Google Scholar] [CrossRef]
  4. Zhang, Q.Q.; Cao, Z.Y.; Zhang, Y.F.; Su, G.H.; Liu, Y.B. Effect of compression ratio on the microstructure evolution of semisolid AZ91D alloy. J. Mater. Process. Technol. 2007, 184, 195–200. [Google Scholar] [CrossRef]
  5. Saklakoglu, N.; Saklakoglu, I.E.; Tanoglu, M.; Oztas, O.; Cubukcuoglu, O. Mechanical properties and microstructural evaluation of AA5013 aluminum alloy treated in the semi-solid state by SIMA process. J. Mater. Process. Technol. 2004, 148, 103–107. [Google Scholar] [CrossRef]
  6. Chen, T.J.; Hao, Y.; Sun, J. Microstructural evolution of previously deformed ZA27 alloy during partial remelting. Mater. Sci. Eng. A 2002, 337, 73–81. [Google Scholar] [CrossRef]
  7. Tzimas, E.; Zavaliangos, A. A comparative characterization of near-equiaxed microstructures as produced by spray casting, magnetohydrodynamic casting and the stress induced melt activated process. Mater. Sci. Eng. A 2000, 289, 217–227. [Google Scholar] [CrossRef]
  8. Lin, H.Q.; Wang, J.G.; Wang, H.Y.; Jiang, Q.C. Effect of predeformation on the globular grains in AZ91D alloy during strain induced melt activation (SIMA) process. J. Alloys Compd. 2007, 431, 141–147. [Google Scholar] [CrossRef]
  9. Kang, B.K.; Hong, C.P.; Choi, B.H.; Jang, Y.S.; Sohn, I. Microstructural evolution in semisolid forging of A356 alloy. Met. Mater. Int. 2015, 21, 153–158. [Google Scholar] [CrossRef]
  10. Young, K.P.; Kyonka, C.P.; Kamado, S. Fine Grained Metal Composition. U.S. Patent 4415374, 30 March 1983. [Google Scholar]
  11. Jiang, J.; Wang, Y.; Atkinson, H.V. Microstructural coarsening of 7005 aluminum alloy semisolid billets with high solid fraction. Mater. Charact. 2014, 90, 52–61. [Google Scholar] [CrossRef]
  12. Yan, G.; Zhao, S.H.; Ma, S.H.; Shou, H. Microstructural evolution of A356.2 alloy prepared by the SIMA process. Mater. Charact. 2012, 69, 45–51. [Google Scholar] [CrossRef]
  13. Jung, H.K.; Seo, P.K.; Kang, C.G. Microstructural characteristics and mechanical properties of hypo-eutectic and hyper-eutectic Al-Si alloys in the semi-solid forming process. J. Mater. Process. Technol. 2001, 113, 568–573. [Google Scholar] [CrossRef]
  14. Curle, U.A.; Govender, G. Semi-solid rheocasting of grain refined aluminum alloy 7075. Trans. Nonferrous Met. Soc. China 2010, 20, s832–s836. [Google Scholar] [CrossRef]
  15. Yong, L.S.; Hwan, L.J.; Seon, L.Y. Characterization of Al 7075 alloys after cold working and heating in the semi-solid temperature range. J. Mater. Process. Technol. 2001, 111, 42–47. [Google Scholar] [CrossRef]
  16. Chayong, S.; Atkinson, H.V.; Kapranos, P. Thixoforming 7075 aluminum alloys. Mater. Sci. Eng. A 2005, 390, 3–12. [Google Scholar] [CrossRef]
  17. Chayong, S.; Atkinson, H.V.; Kapranos, P. Multistep induction heating regimes for thixoforming 7075 aluminum alloy. Mater. Sci. Technol. 2004, 20, 490–496. [Google Scholar] [CrossRef]
  18. Atkinson, H.V.; Burke, K.; Vaneetveld, G. Recrystallisation in the semi-solid state in 7075 aluminum alloy. Mater. Sci. Eng. A 2008, 490, 266–276. [Google Scholar] [CrossRef]
  19. Vaneetveld, G.; Rassili, A.; Atkinson, H.V. Influence of parameters during induction heating cycle of 7075 aluminum alloys with RAP process. Solid State Phenom. 2008, 141–143, 719–724. [Google Scholar] [CrossRef]
  20. Bolouri, A.; Shahmiri, M.; Kang, C.G. Study on the effects of the compression ratio and mushy zone heating on the thixotropic microstructure of AA 7075 aluminum alloy via SIMA process. J. Alloys Compd. 2011, 509, 402–408. [Google Scholar] [CrossRef]
  21. Mohammadi, H.; Ketabchi, M.; Kalaki, A. Microstructure evolution of semi-solid 7075 aluminum alloy during reheating process. J. Mater. Eng. Perform. 2011, 20, 1256–1263. [Google Scholar] [CrossRef]
  22. Seo, P.K.; Kang, C.G. The Effect of raw material fabrication process on microstructural characteristics in reheating process for semi-solid forming. J. Mater. Process. Technol. 2005, 162–163, 402–409. [Google Scholar] [CrossRef]
  23. Zhang, L.; Liu, Y.B.; Cao, Z.Y.; Zhang, Y.F.; Zhang, Q.Q. Effects of isothermal process parameters on the microstructure of semisolid AZ91D alloy produced by SIMA. J. Mater. Process. Technol. 2009, 209, 792–797. [Google Scholar] [CrossRef]
  24. Doherty, R.D.; Lee, H.-I.; Feest, E.A. Microstructure of stir-cast metals. Mater. Sci. Eng. 1984, 65, 181–189. [Google Scholar] [CrossRef]
  25. Tzimas, E.; Zavaliangos, A. Evolution of near-equiaxed microstructure in the semisolid state. Mater. Sci. Eng. A 2000, 289, 228–240. [Google Scholar] [CrossRef]
  26. Wang, T.; Yin, Z.-M.; Sun, Q. Effect of homogenization treatment on microstructure and hot workability of high strength 7B04 aluminum alloy. Trans. Nonferrous Met. Soc. China 2007, 17, 335–339. [Google Scholar] [CrossRef]
  27. Fan, X.-G.; Jiang, D.-M.; Meng, Q.-C.; Zhang, B.-Y.; Wang, T. Evolution of eutectic structures in Al-Zn-Mg-Cu alloys during heat treatment. Trans. Nonferrous Met. Soc. China 2006, 16, 577–581. [Google Scholar] [CrossRef]
  28. Lim, S.T.; Lee, Y.Y.; Eun, I.S. Microstructural evolution during ingot preheat in 7xxx aluminum alloys for thick semiproduct applications. Mater. Sci. Forum 2006, 519–521, 549–554. [Google Scholar] [CrossRef]
  29. Li, N.-K.; Cui, J.-Z. Microstructural evolution of high strength 7B04 ingot during homogenization treatment. Trans. Nonferrous Met. Soc. China 2008, 18, 769–773. [Google Scholar] [CrossRef]
  30. Jiang, L.-T.; Wu, G.-H.; Yang, W.-S.; Zhao, Y.-G.; Liu, S.-S. Effect of heat treatment on microstructure and dimensional stability of ZL114A aluminum alloy. Trans. Nonferrous Met. Soc. China 2010, 20, 2124–2128. [Google Scholar] [CrossRef]
  31. Boettinger, W.J.; Kattner, U.R.; Moon, K.W.; Perepezko, J.H. DTA and heat-flux DSC measurements of alloy melting and freezing. In Methods for Phase Diagram Determination, 1st ed.; Zhao, J.C., Ed.; Elsevier: Ames, IA, USA, 2007; pp. 194–200. [Google Scholar]
  32. Annavarapu, S.; Doherty, R.D. Inhibited coarsening of solid-liquid microstructures in spray casting at high volume fractions of solid. Acta Metall. Mater. 1995, 43, 3207–3230. [Google Scholar] [CrossRef]
  33. Liu, D.; Atkinson, H.V.; Kapranos, P.; Jones, H. Effect of heat treatment on properties of thixoformed high performance 2014 and 201 aluminum alloys. J. Mater. Sci. 2004, 39, 99–105. [Google Scholar] [CrossRef]
  34. Cavaliere, P.; Cerri, E.; Leo, P. Effect of heat treatments on mechanical properties and fracture behavior of a thixocast A356 aluminum alloy. J. Mater. Sci. 2004, 39, 1653–1658. [Google Scholar] [CrossRef]
  35. Bolouri, A.; Shahmiri, M.; Kang, C.G. Coarsening of equiaxed microstructure in the semisolid state of aluminum 7075 alloy through SIMA processing. J. Mater. Sci. 2012, 47, 3544–3553. [Google Scholar] [CrossRef]
  36. Jiang, H.; Li, M. Microscopic observation of cold-deformed Al-4Cu-Mg alloy samples after semi-solid heat treatments. Mater. Charact. 2005, 54, 451–457. [Google Scholar] [CrossRef]
  37. Shim, S.-Y.; Kim, D.-H.; Chio, S.-H.; Kim, Y.-H.; Bai, H.; Lim, S.-G. The analysis of variance on process parameters affecting the microstructures of semi-solid Al-Zn-Mg alloy billet by cooling plate method. Met. Mater. Int. 2010, 16, 1009–1017. [Google Scholar] [CrossRef]
  38. Baker, H. ASM Handbook, Alloy Phase Diagrams; ASM International: Materials Park, OH, USA, 2004; Volume 3, pp. 295–331. [Google Scholar]
  39. Shackelford, J.F.; Alexander, W. Materials Science and Engineering Handbook, 3rd ed.; CRC Press LLC: Boca Raton, FL, USA, 2001. [Google Scholar]
  40. Vaneetveld, G.; Rassili, A.; Pierret, J.C.; Beckers, J.L. Conception of tooling adapted to thixoforging of high solid fraction hot-crack-sensitive aluminum alloys. Trans. Nonferrous Met. Soc. China 2010, 20, 1712–1718. [Google Scholar] [CrossRef]
  41. Manson-Whitton, E.D.; Stone, I.C.; Jones, J.R.; Grant, P.S.; Cantor, B. Isothermal grain coarsening of spray formed alloys in the semi-solid state. Acta Mater. 2002, 50, 2517–2535. [Google Scholar] [CrossRef]
  42. Li, P.; Chen, T.; Zhang, S.; Guan, R. Research on semisolid microstructural evolution of 2024 aluminum alloy prepared by powder thixoforming. Metals 2015, 5, 547–564. [Google Scholar] [CrossRef]
  43. De Freitas, E.R.; Ferracini, E., Jr.; Ferrante, M. Microstructure and rheology of an AA2024 aluminum alloy in the semi-solid state, and mechanical properties of a back-extruded part. J. Mater. Process. Technol. 2004, 146, 241–249. [Google Scholar] [CrossRef]
  44. Tzimas, E.; Zavaliangos, A. Mechanical behavior of alloys with equiaxed microstructure in the semisolid state at high solid content. Acta Mater. 1999, 47, 517–528. [Google Scholar] [CrossRef]
  45. Clarke, B. Rheology of coarse settling suspensions. Trans. Inst. Chem. Eng. Chem. Eng. 1967, 45, 251–256. [Google Scholar]
  46. Chen, C.P.; Tsao, C.-Y.A. Semi-solid deformation of non-dendritic structures-phenomenological behavior. Acta Mater. 1997, 45, 1955–1968. [Google Scholar] [CrossRef]
Figure 1. (a) Scanning electron microscope (SEM) secondary electron image; (b) SEM secondary electron image of selected area in (a); (c) SEM secondary electron image; (d) SEM backscattered electron image of as-received 7075 sample.
Metals 06 00042 g001
Figure 2. (a) Differential scanning calorimeter (DSC) curve of 7075 Al alloy at a heating rate of 10 °C/min; (b) solid and liquid volume fraction versus temperature derived from the DSC curve.
Metals 06 00042 g002
Figure 3. Optical micrographs of samples compressed 20% and isothermally heat treated at 600 °C for (a) 0 min; (b) 5 min; (c) 10 min; (d) 15 min; (e) 25 min; (f) 35 min.
Metals 06 00042 g003
Figure 4. SEM images of 20% compressed 7075 alloy heat treated at 600 °C for (a) 10 min; (b) 35 min.
Metals 06 00042 g004
Figure 5. X-ray diffraction (XRD) patterns of 20% compressed 7075 alloys, heat treated at 600 °C for different times and then water quenched.
Metals 06 00042 g005
Figure 6. SEM electron images of the strained samples heat treated at (a) 600 °C for 25 min; (b) 600 °C for 25 min in higher magnification; (c) 610 °C for 25 min; (d) 610 °C for 25 min in higher magnification.
Metals 06 00042 g006
Figure 7. SEM/EDS analysis of various points in Figure 6: (a) A; (b) B; (c) C; (d) D.
Metals 06 00042 g007
Figure 8. (a) SEM image; (b) Al; (c) Cu; (d) Si; (e) Mg; (f) Zn; (g) Fe; (h) Mn; (i) Al Fe Si Mn Cu X-ray image analysis of a compressed sample isothermally heat treated at 600 °C for 25 min.
Metals 06 00042 g008
Figure 9. SEM images of sample compressed 20% , heat treated at 600 °C for (a) 5 min; (b) 10 min; (c) 15 min; (d) 25 min; (e) 35 min and then water quenched; (f) EDS analysis results of the grain centers (A point) and grain boundaries (B point).
Metals 06 00042 g009
Figure 10. (a) XRD peaks corresponding to the Al(111) plane in XRD patterns of Figure 5; (b) lattice parameter variations of aluminum in 20% compressed samples heated at 600 °C for different times.
Metals 06 00042 g010
Figure 11. Optical micrographs of 7075 samples with 20% compression ratio heat treated at (a) 600 °C/15 min; (b) 610 °C/15 min; (c) 620 °C/15 min; (d) 600 °C/25 min; (e) 610 °C/25 min; (f) 620 °C/25 min; (g) 600 °C/35 min; (h) 610 °C/35 min; (i) 620 °C/35 min.
Metals 06 00042 g011
Figure 12. Variations of (a) the average grain size; (b) shape factor versus isothermal holding time of compressed samples heated at 600, 610, and 620 °C.
Metals 06 00042 g012
Figure 13. Variations of the cube of average globule size versus isothermal holding time of compressed samples at heating temperatures of 600–620 °C where R2 is the regression coefficient.
Metals 06 00042 g013
Figure 14. (a) SEM image of a strained sample heat treated at 600 °C for 15 min; (b) SEM image of selected area in (a).
Metals 06 00042 g014
Figure 15. Typical load versus displacement curve of the hot compressed semi-solid 7075 sample (isothermally treated at 600 °C for 15 min) at 600 °C.
Metals 06 00042 g015
Figure 16. Stress-strain curves of strain induced melt activation (SIMA) processed samples with different initial microstructures.
Metals 06 00042 g016
Figure 17. Peak and steady state stresses of the SIMA processed samples with different initial microstructures.
Metals 06 00042 g017
Figure 18. (a) Schematic of a hot compressed SIMA sample showing compression direction; Optical micrographs of (b) region 1; (c) region 2; (d) region 3 of SIMA sample processed at 600 °C for 10 min; region 2 of SIMA sample processed at 600 °C for (e) 25 min; (f) 35 min after hot compression at 600 °C.
Metals 06 00042 g018
Table 1. Chemical composition of wrought 7075 Al alloy in wt. %.
ElementAlMnFeCrCuMgZnSi
wt. %Bal.0.280.280.131.582.415.310.14
Table 2. Scanning electron microscope (SEM)/energy dispersive spectroscopy (EDS) analysis results of selected constituent particles highlighted in Figure 1.
Content of ElementsConstituent Particles (at. %)
AB1B2C1C2D
Al61.3578.3982.2366.7257.59-
Zn0.310.201.190.170.05-
Cu20.005.302.6717.1618.64-
Mg0.030.020.8113.8323.3869.42
Fe13.7111.6110.640.520.02-
Si1.790.131.090.470.0330.58
Mn2.273.561.330.520.18-
Cr0.550.790.040.590.10-
Phase shapeIrregularpolygonalIrregularSphericalIrregular with round cornersDark-Irregular
Closest phaseAl7Cu2FeAl6(Cu,Fe)Al6(Cu,Fe)Al2CuMgAl2CuMgMg2Si
Table 3. Values of coarsening rate constants of compressed samples at various isothermal holding temperatures.
Compression ratio (%) Coarsening rate constant, k (μm3·s−1)
600 °C610 °C620 °C
20345334515

