Next Article in Journal
Effect of Heavy Ion Irradiation Dosage on the Hardness of SA508-IV Reactor Pressure Vessel Steel
Previous Article in Journal
Effect of Controlled Cooling on Microstructure and Tensile Properties of Low C Nb-Ti-Containing HSLA Steel for Construction
 
 
Erratum published on 8 March 2017, see Metals 2017, 7(3), 87.
Article

One-Dimensional Constitutive Model for Porous Titanium Alloy at Various Strain Rates and Temperatures

School of Mechanical Engineering, Jiangsu University of Science and Technology, Zhenjiang 212003, China
*
Author to whom correspondence should be addressed.
Metals 2017, 7(1), 24; https://doi.org/10.3390/met7010024
Submission received: 11 November 2016 / Revised: 19 December 2016 / Accepted: 26 December 2016 / Published: 12 January 2017

Abstract

:
In this paper, the accurate description of the relationship between flow stress and strain of porous titanium alloys at various strain rates and temperatures were investigated with dynamic and quasistatic uniaxial compression tests for a further study on the processing mechanism of porous titanium material. Changes in their plastic flows were described through the one-dimensional Drucker-Prager (DP) constitutive model. Porous titanium alloys were micromilled in a DP simulation. After all parameters had been obtained in the DP model, the experimental and simulated true stress-strain curves and flow stress levels of two porous titanium alloys were compared to estimate the precision of the model. The findings were as follows. First, porous titanium alloys show deformation patterns characterized by pore collapse-induced deformation and have strong stress-hardening effects, but the patterns did not include noticeable plastic-flow plateaus. Second, porosity strongly affects the mechanical strength, strain-rate sensitivity, and temperature sensitivity of both alloys. Third, the DP model sufficiently describes the mechanical properties of both alloys at 25–300 °C and at strain rates of 1000–3000 s−1, with a deviation of 10% or lower.

1. Introduction

Titanium alloys are increasingly used as structural material for aerospace, shipbuilding, petrochemical, power generation equipment, automotive industries and other fields because of their attractive properties such as high specific strength and high structural stiffness with excellent heat and corrosion resistance [1,2,3,4]. Compared with the dense titanium alloys, porous titanium alloys mainly obtained by spark plasma sintering, vacuum sintering and granulation loose sintering inherits general characteristics of titanium alloys [5,6,7,8]. In addition, low density, good adsorption as well as good biocompatibility are additional characteristics [9,10]. However, porous titanium alloys are recognized as difficult-to-cut materials due to their low thermal conductivity, high chemical activity and small elastic modulus [11,12,13]. The cutting process of porous titanium is that the shear slip of the workpiece occurs under the action of the cutting tool and the cutting chip flows out from the rack face of the cutter [14]. At the same time, the machining surface of the workpiece experienced the process of extrusion and friction, which occur in the flank face of the cutter [15,16]. During the process of machining, the material is subjected to strong elastic plastic deformation, which produces cutting resistance and a lot of cutting heat [17,18,19].
In order to further study the machining mechanism of porous titanium material, it is very important to obtain the accurate description of the relationship between the flow stress and strain of the material under high temperature and high strain rate. Constitutive model, which plays a vital role in the numerical simulation of material processing, is used to describe the flow stress varying with strain, temperature and strain rate [20,21]. Macroscopically, it reflects the relationship between material force and deformation. Nowadays, A number of constitutive equations were developed to predict constitutive behavior in a wide range of metals and alloys [22,23]. Particularly, two methods of phenomenological and physically-based constitutive models have been proposed widely [24]. Among them, Johnson-Cook (JC) constitutive model is the most popular due to its rich experience, simple form and availability of parameters. Drucker-Prager (DP) constitutive model, Zerilli-Armstrong (ZA) constitutive model, Artificial neural network (ANN) constitutive model and so on are also used [25,26].
Due to the influence of pore structure of the material, the mechanical properties of porous titanium alloys materials are more complicated than that of dense metal materials. It is mainly manifested in the density dispersion caused by the uneven microstructure. Furthermore, it also manifested in the uneven distribution of stress and discrete experimental results caused by uneven microstructure [27]. As a result, the relationship between the flow stress and strain of the material at various strain rates and temperatures can not be accurately described by the traditional constitutive model of titanium alloys.
Considering that the JC constitutive model is more suitable for the material with significant deformation, high strain rate and high temperature machining, but the description of the dynamic mechanical properties of porous titanium alloy material is limited [28]. It cannot describe the effect of temperature-strengthening. More seriously, the strain rate effect prediction enhancement is not accurate enough, and the deviation reaches about 10%–20%. Therefore, the DP constitutive model is proposed to describe the comprehensive mechanical properties of porous titanium alloys.
One-dimensional DP constitutive model proposed was based on the combination of quasistatic compression test, the SHPB tests, orthogonal experiment and micro-milling test in a DP simulation. A quasistatic compression test on the dynamic and static responses of porous titanium alloys with two porosity levels revealed their yield limits and elastic moduli and the effects of porosity on their static mechanical properties. The dynamic mechanical properties of the specimens were tested using a Split-Hopkinson pressure bar (SHPB). An orthogonal experiment was conducted to yield flow stress-strain curves at different strain rates and temperatures to analyze the strain-rate and temperature sensitivities of the specimens. Additionally, it can also determine the temperature and strain rate range for the DP constitutive model. Lastly, the parameters of the constitutive equation were determined by analyzing the experimental data and then micro-cutting simulation of DP constitutive model was carried out to compare with the experimental results in order to verify the rationality of the model.

2. Experimental Procedures

2.1. Testing Material

In this experiment, two kinds of porous titanium materials with different porosity were prepared by powder sintering. The particle sizes of two titanium powder raw materials are 500# and 200#. Besides that the diameter are less than 27 μm and 74 μm, respectively. The additive was 2 wt % polyvinyl alcohol aqueous solution during the sintering process and the titanium powder mixture was made into titanium body after compression molding whose forming pressure is 108 MPa. Taking into account the fact that the chemical properties of titanium is so active that can react with carbon, nitrogen, oxygen, hydrogen and other elements in the air, the vacuum sintering process was adopted and the vacuum degree was set at 10−4 Pa. Moreover, the sintering temperature of 200# titanium powder is 1100 °C, while the one of 500# titanium powder is 1200 °C. In addition, after sintering, do not have a natural cooling until the heat preservation for about 2 h have done. The specific parameters of the final porous titanium samples are shown in Table 1. In Table 1, it is easy to see that the porous titanium alloy samples not only have Ti elements, but also contain Fe, Cu, C, O, N and other elements. In addition, the porosities of preparations are mainly 26% and 36%, which is expressed as the ratio of the simple mass to volume [29].
Moreover, the samples with different porosity should be machined as cylinders with the size of φ 8 mm × 3 mm, φ 8 mm × 4 mm, φ 8 mm × 6 mm and φ 8 mm× 8 mm by wire-electrode cutting. Where φ 8 represents a cylinder radius of 8 mm, and 3 mm, 4 mm, 6 mm and 8 mm is the height of cylinders. When processing, it is necessary to ensure that the level of parallelism and perpendicularity error is less than 0.01 mm and to polish the end face to adjust the contact surface roughness with the experimental equipment. Lastly, screening the samples to meet the requirement that the density difference of the test samples is no more than 0.01 g/cm3 is also important. The final samples are listed in Figure 1.

2.2. Experimental Database

A uniaxial quasistatic compression test was performed with the parameters shown in Table 2. An electronic digital controller was switched to the PC-control mode for automated control, and the quasistatic compression test was conducted after the digital signal stabilized.
A set of SHPB experiments was designed on the basis of micromachining parameters, the mechanical properties of the porous titanium alloys, and the performance of the bar (Table 3). The experiments were conducted at a maximum temperature of 300 °C and a maximum strain rate of 4000 s−1.
The strut of SHPB with a diameter of 15 mm was used during the experiments. The impact velocity of the striker bar of the SHPB was adjusted to achieve different strain rates; each experiment was repeated two to three times to ensure sufficient reproducibility. The means of valid data from the experiments were calculated to reduce the experimental error.

3. Results and Discussion

3.1. Static Mechanical Response of Porous Titanium Alloys

Considerable deformation occurred on specimens during compression and induced crushing. By the law of constant volume, true stress-strain curves did not accurately reflect the mechanical properties of the specimens. Subsequently, engineering stress-strain curves were used to represent these mechanical properties. Figure 2 presents the engineering stress-strain curves of porous titanium alloys with porosities of 26% and 36% under quasistatic compression. These curves are classified into elastic, plastic, and densification stages. Generally, the interface between the elastic and plastic stages is defined as the yield limit, whereas the interface between the plastic and densification stages is defined as densification (crushing). The stress and strain values that correspond with the interface between the plastic and densification stages are termed as the densification stress and densification strain, respectively. Figure 3 shows that the stress-strain curves of the specimens exhibit an overall linear relationship in the elastic stage and that, in the plastic stage, stress values begin to level off as strain values increase, resulting in a plastic yield plateau. After crushing occurs at the end of the plastic stage, the curves begin to rise. These curves are highly reproducible before crushing, but separate after crushing because of internal defects in the specimens.
Table 4 tabulates the mechanical parameters of the porous titanium alloy specimens under quasistatic compression. These parameters were obtained from a quasistatic experiment. The yield limits of the specimens were estimated at a nonproportional compressive strain of 0.2%, and the elastic moduli were measured using the graphical method. As the table shows, the mechanical performance of the specimen with a higher porosity was lower than that of the specimen with a lower porosity.
Equation (1), which had been derived through a finite element analysis of a spherical cavity model to estimate elastic modulus and porosity, was used to measure the simulated elastic modulus values of the 26% and 36% porous titanium alloys; those values were 43.6 and 30.1 GPa, respectively. These elastic modulus values were larger than their corresponding experimental values because the porous structures of the specimens were not uniformly spherical; the majority of their pores were irregular; those irregular pores facilitated stress concentration, fissure induction, and mechanical performance reduction in these alloys.
E = E 0 [ 1 ε p 1 + 1.1 ε p ]
where E is the elastic modulus of the porous titanium alloy, εp is the porosity, E0 is the elastic modulus of the substrate (E0 of a pure titanium alloy is approximately 102.5), and the Poisson’s ratio of a pure titanium alloy is approximately 0.3.
The specimen with a porosity of 26% experienced a short densification stage (Figure 2). As loading continued to increase, the specimen absorbed enough energy to induce severe damage to its structure; it was crushed after the short densification stage (Figure 3a), indicating the brittleness of the specimen. By contrast, the specimen with a porosity of 36% experienced a longer densification stage, showing less stress variations and no signs of crushing (Figure 3b). This specimen exhibited a relatively high toughness, implying a high capability to absorb plastic energy. Clear gullies, cracks can be seen in the microstructure (Figure 3c) with small porosity while the large porosity has the fewer (Figure 3d).

3.2. Dynamic Mechanical Response of Porous Titanium Alloys

SHPB experiments were conducted to yield the true stress–strain curves of the porous titanium alloy specimens (porosity: 26% and 36%) at different strain rates and temperatures. These curves were grouped for the same temperatures and for different strain rates to examine the strain rate effects on alloys under dynamic loading. The true stress and strain values are translated from the engineering value by Equations (2) and (3).
σ T = σ E ( 1 + ε E )
ε T = ln ( 1 + ε E )
where σT is the true stress, εT is the true strain; σE is the engineering stress, and εE is the engineering strain.
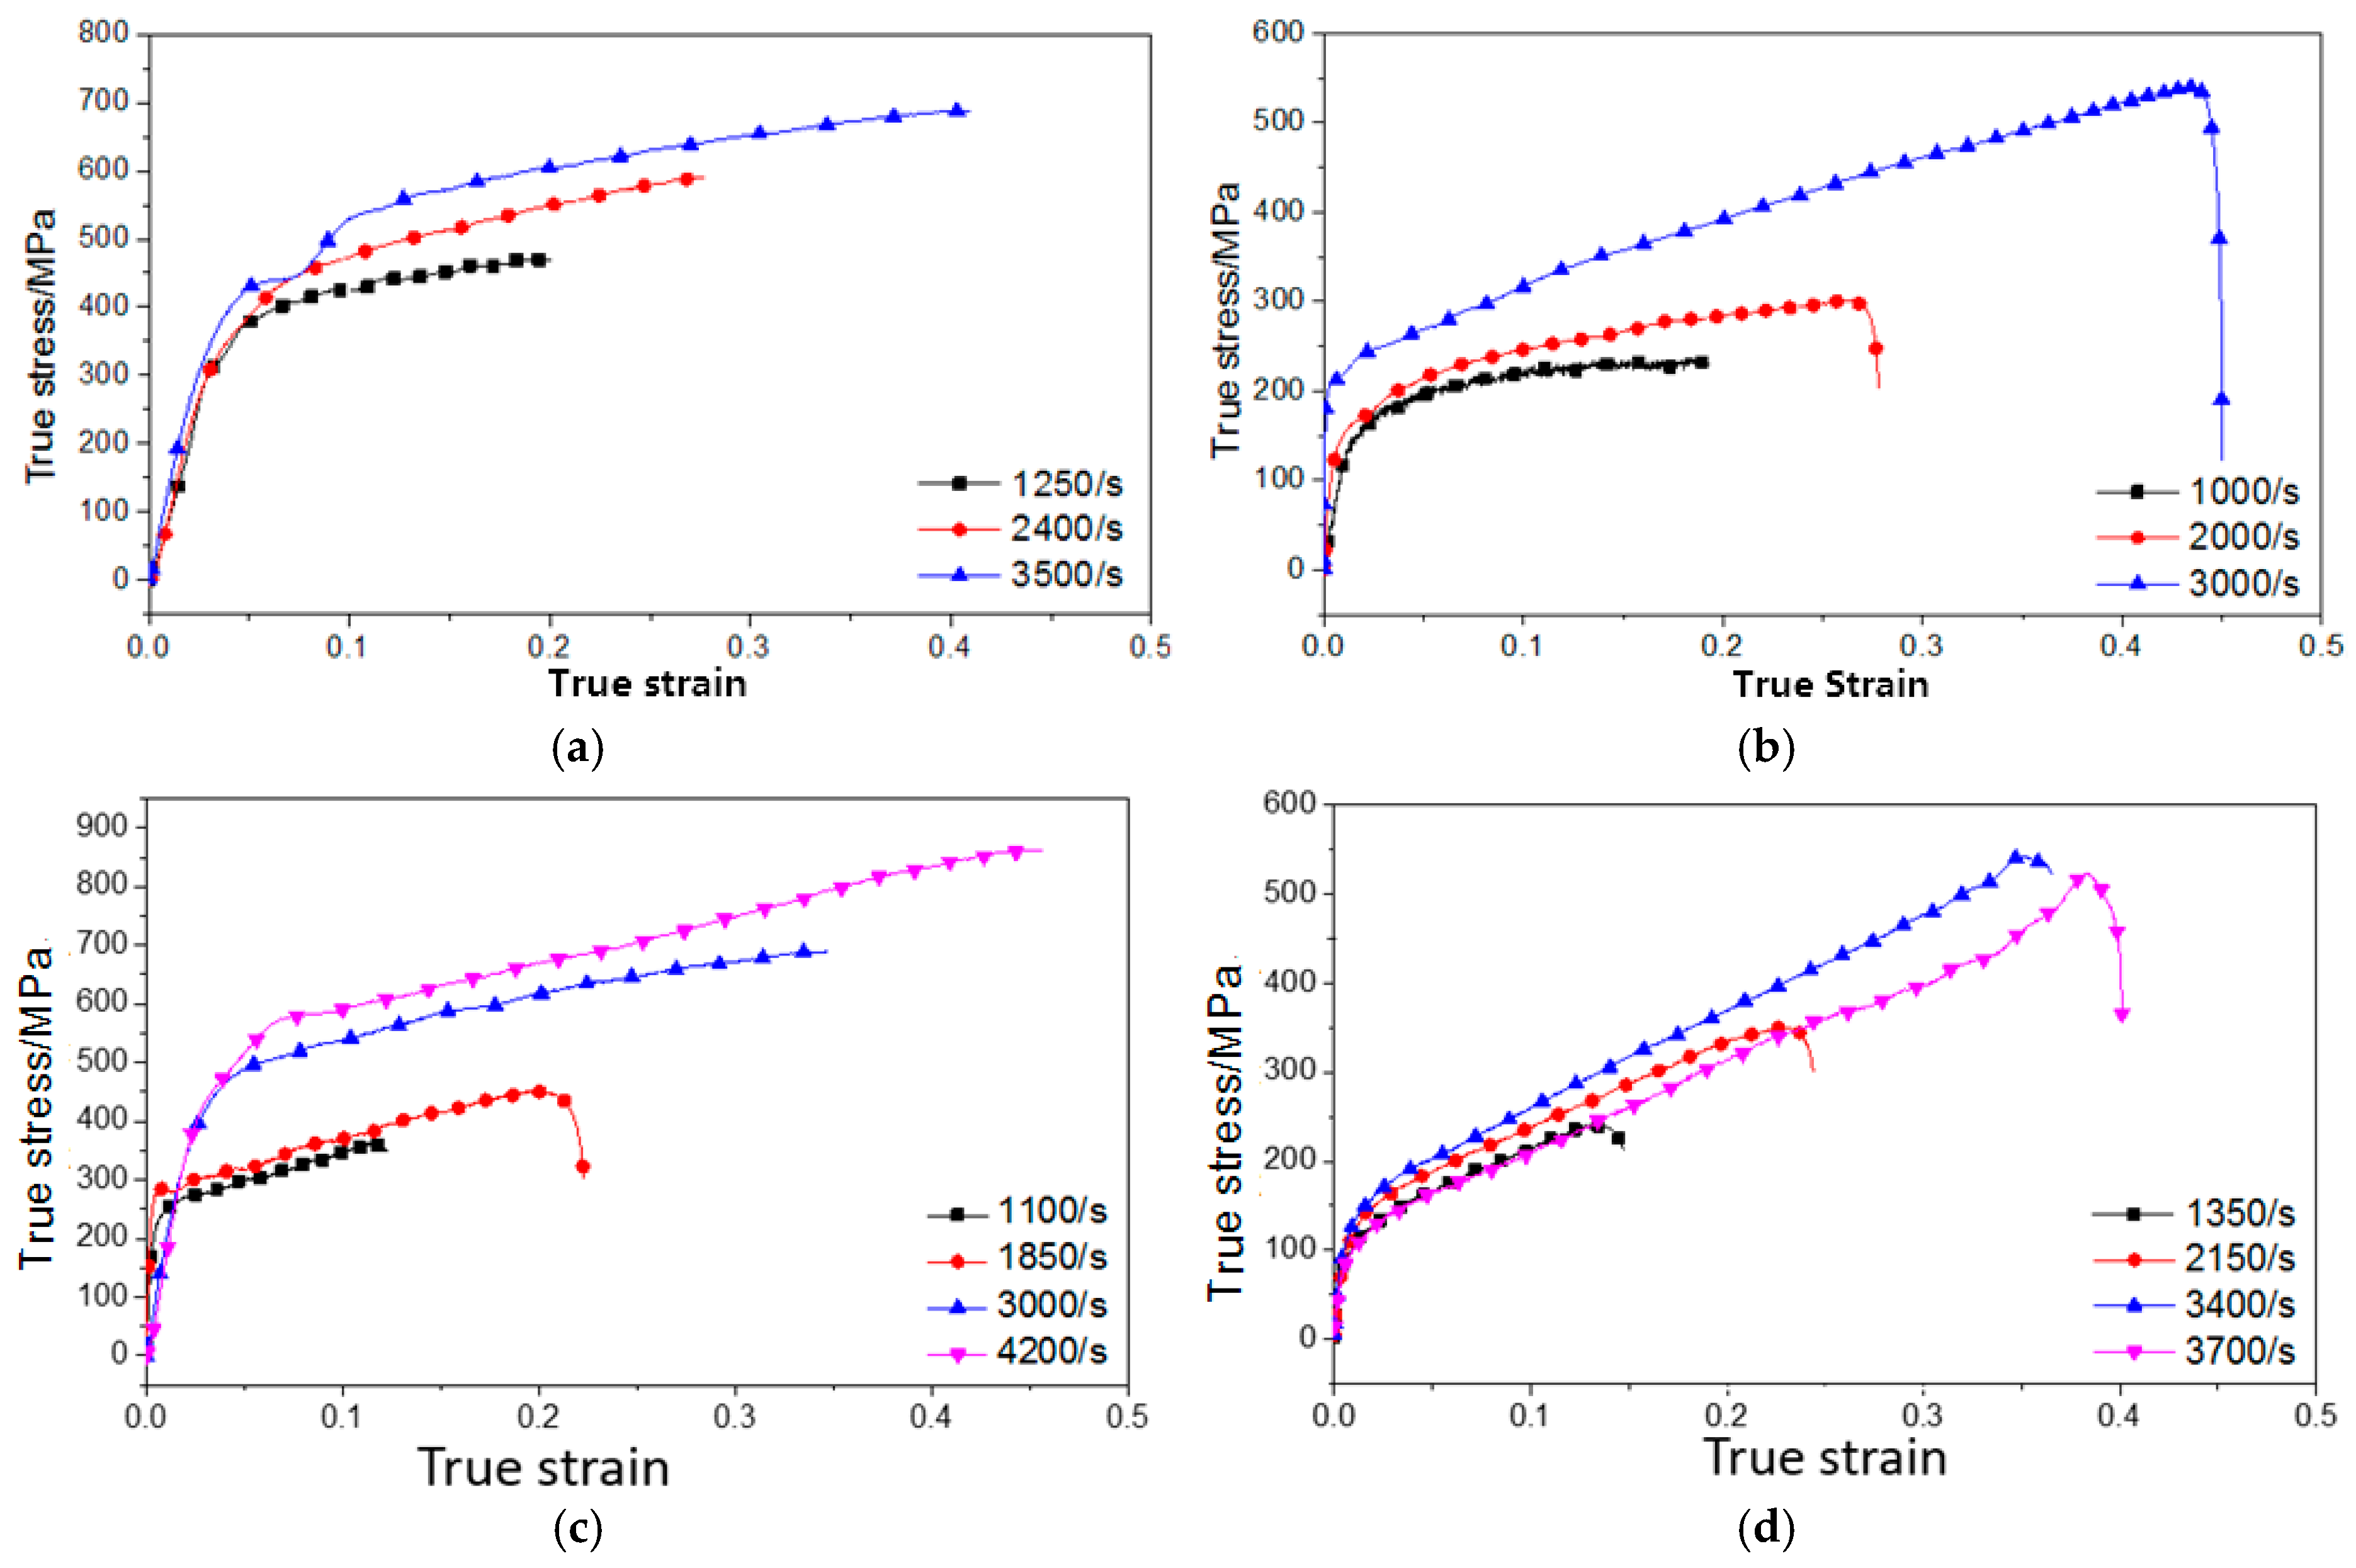
Figure 4 shows the true stress-strain curves of the specimens at T = 25 °C, T = 100 °C, T = 200 °C and T = 300 °C for various strain rates. Compared with the stress-strain curves obtained under quasistatic compression (Figure 2), the stress-strain curves under dynamic loading suggest that the yield limits and flow stress values of the alloys increased at high strain rates and their mechanical strength values were higher at high strain rates than at low strain rates. This indicates that the alloy specimens exhibit certain degrees of sensitivity to strain rates. Moreover, the true stress-strain data suggested that the higher the strain rate was, the more discrete the data were. As Figure 4 shows, when the strain rate reached 4000 s−1 or higher, the distributions of plastic flow stress were irregular at different temperatures. Thus, the data for both specimens were nonreproducible.
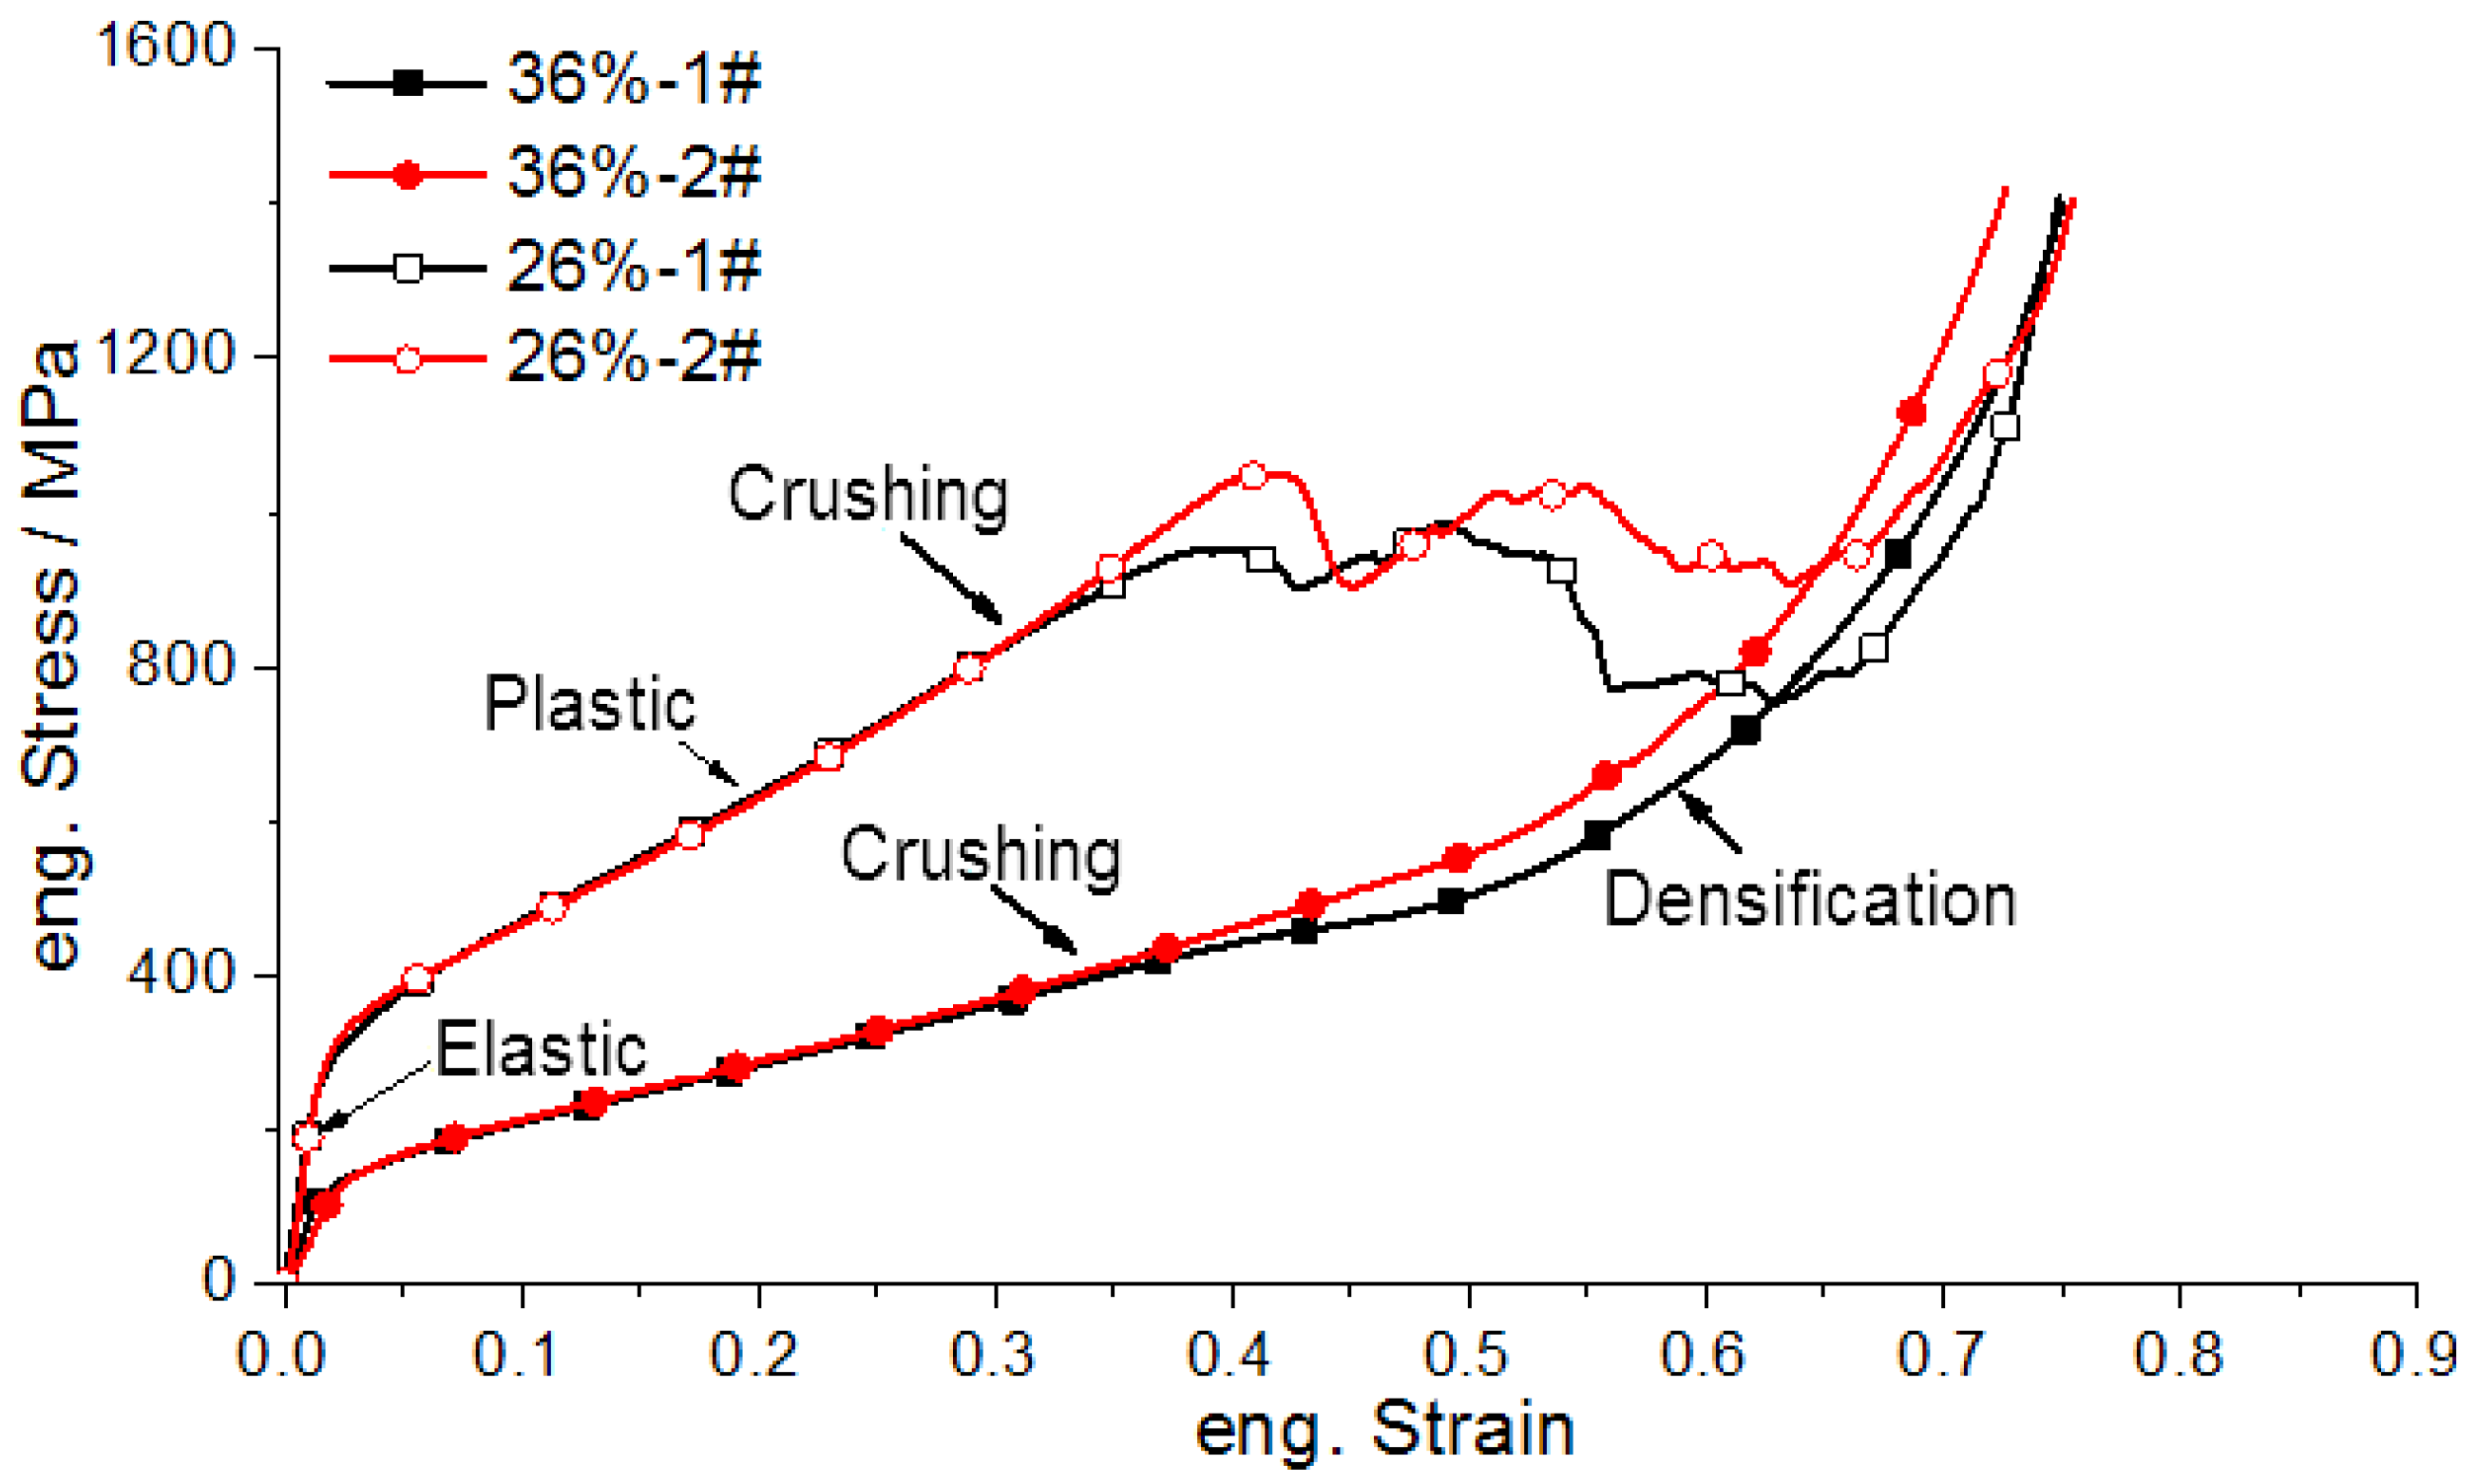
Figure 4 also depicts the deformation of both alloys under dynamic loading during elastic and plastic stages. Unlike compacted materials, these alloy specimens had no plastic flow plateaus in the plastic stage and their stress levels increased when strain levels rose, indicating that strain-hardening rates ( σ / ε ) did not converge to zero as strain levels increased. Moreover, under the same conditions, the strain-hardening rates increased at higher porosity levels and were slightly affected by strain rates, whereas the yield stress and flow stress levels decreased at higher porosity levels. This contrast indicated that high porosity levels led to poor mechanical performance, conforming to the mechanical properties obtained under quasistatic compression.
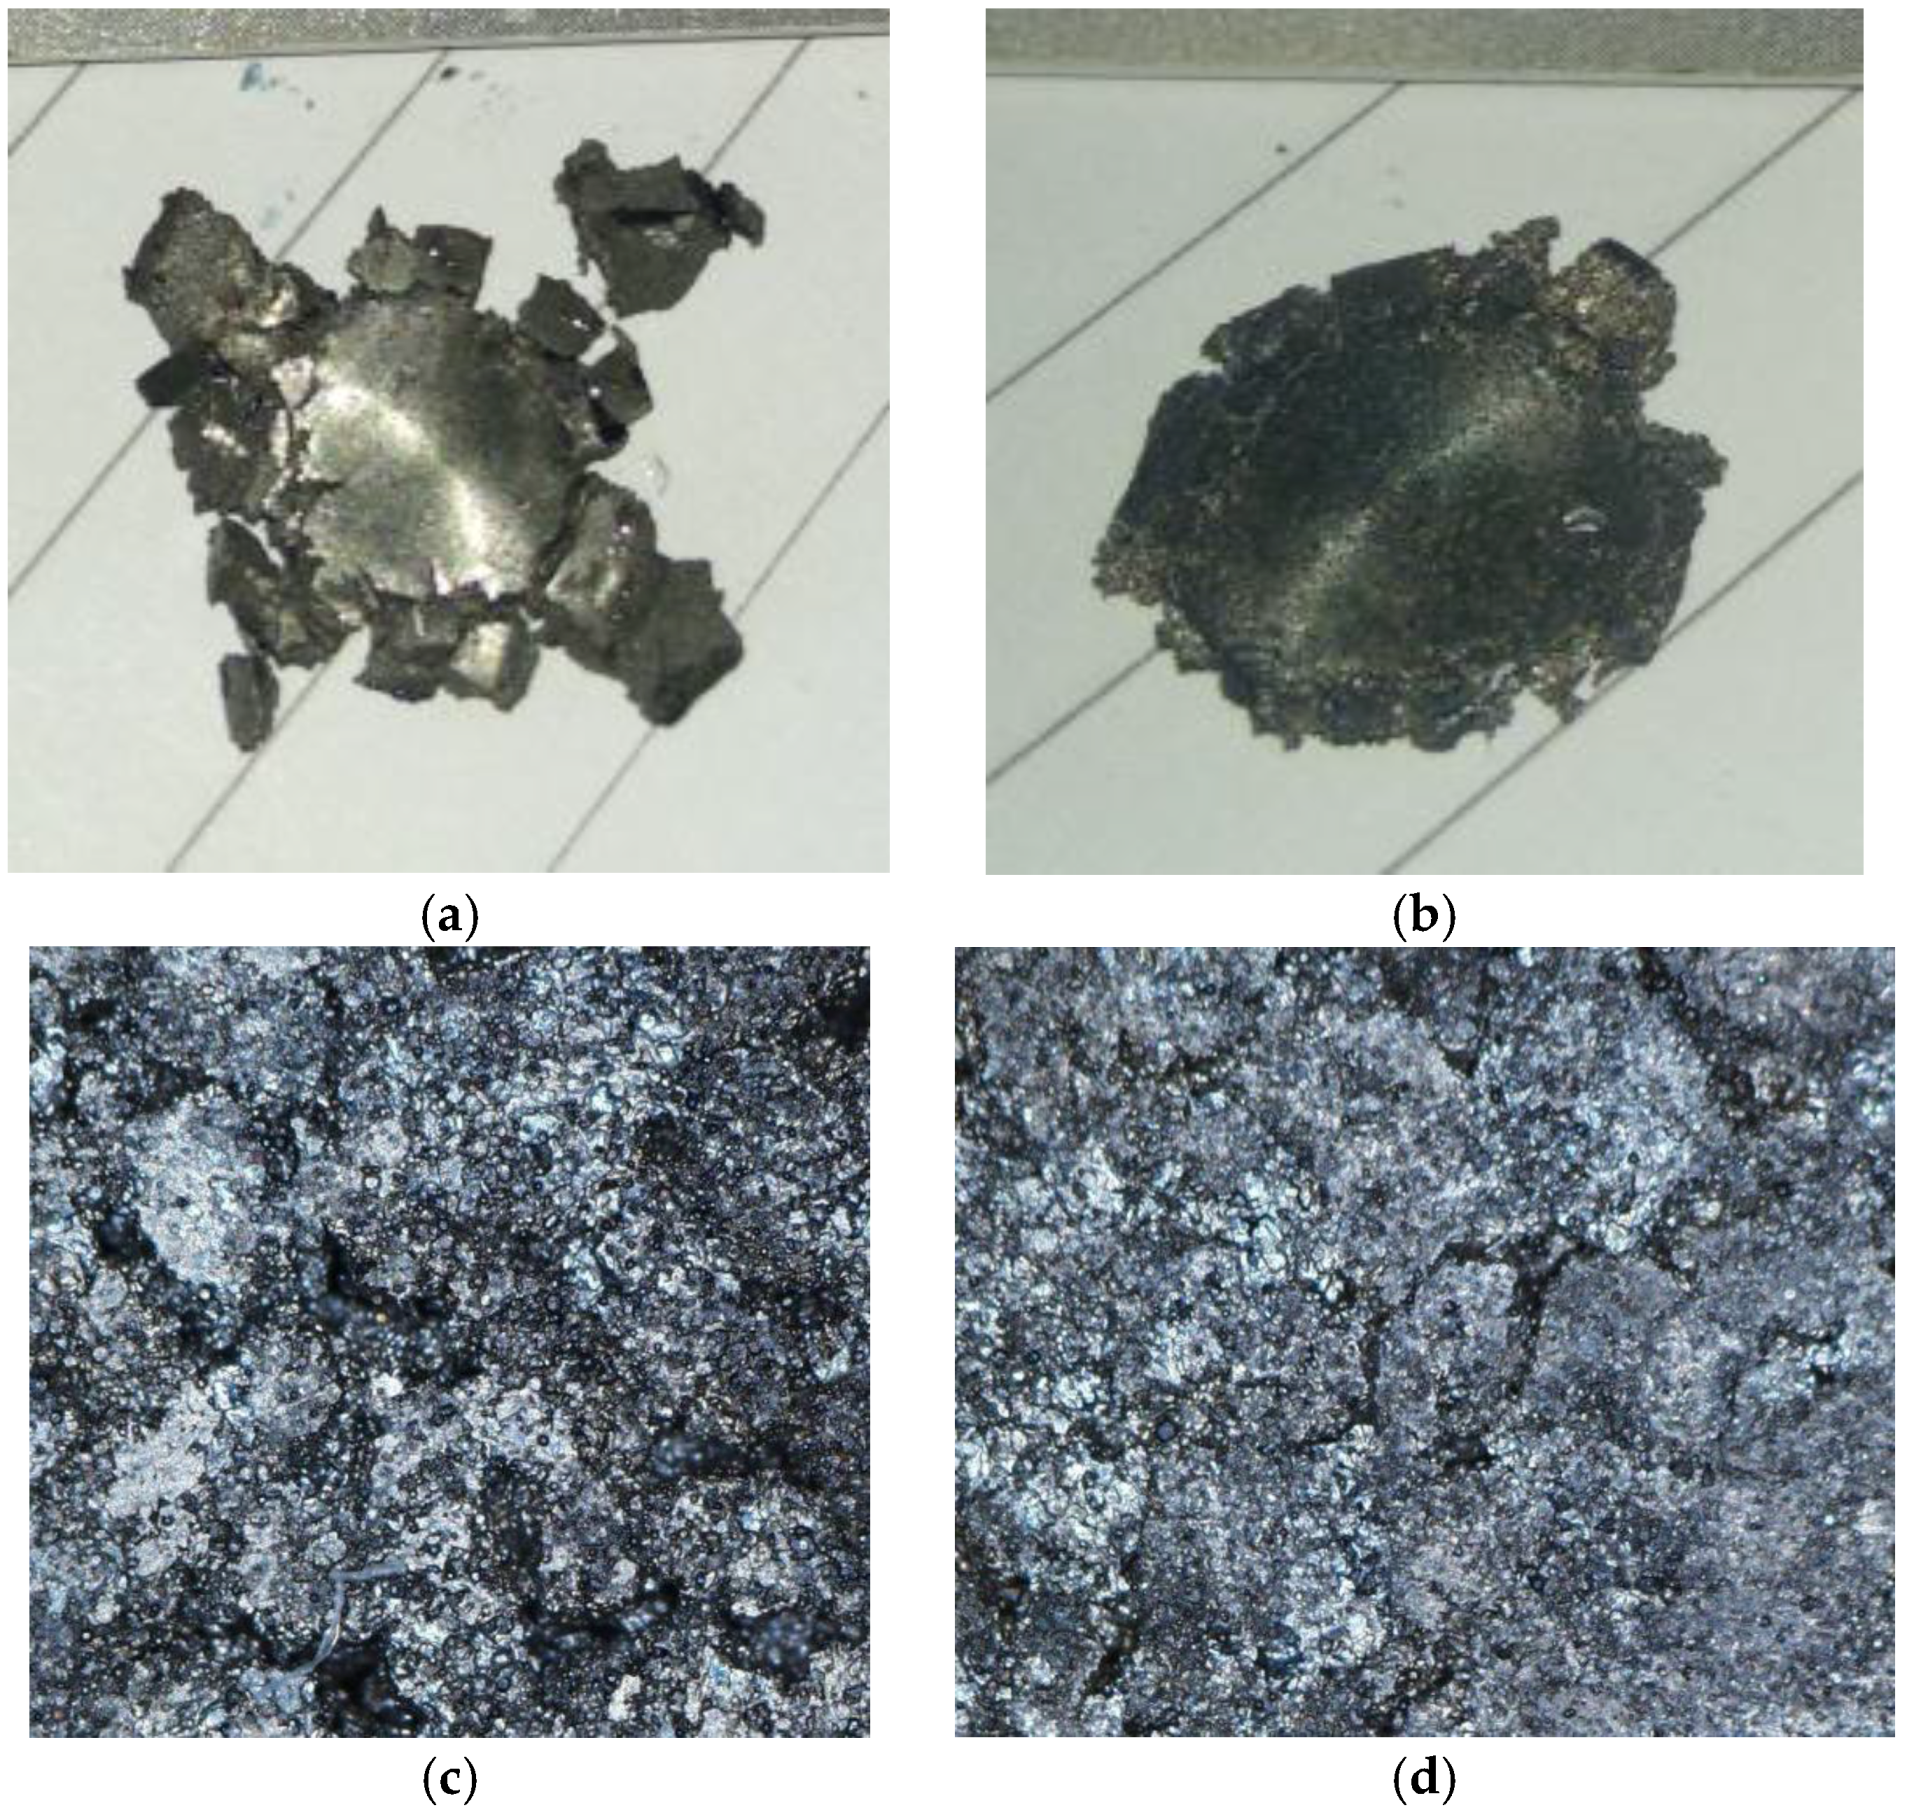
The strain-rate sensitivity of a porous titanium alloy is typically determined according to the strain-rate effect in the alloy’s microscopic structure and that in the alloy’s substrate. Plastic bending in a microscopic structure under loading leads to a strain-rate effect. Because specimens with open-textured structures were used in this study, plastic bending was likely to occur to pore walls and edges under loading. An analysis of the strain-effects in the specimens’ substrates using the dynamic mechanical properties of pure titanium (TA2) showed that these substrates were highly sensitive to strain rates. Therefore, because the specimens exhibited strain-rate effects, the effects of air in the pores were not considered.
Higher strain rates were achieved at higher impact velocities of the striker bar. However, a high impact velocity resulted in crushing in the pore structures, inducing irregular stress. As such, measurement results were subject to the axial-inertia effect of the specimens, and the axial-inertia effect and strain-rate effect were coupled to the extent that these effects were indistinguishable from one another. These results did not accurately reflect the dynamic mechanical properties of the specimens under strain-rate effects but indicated irregular stress-strain curve distributions at a strain rate of 4000 s−1.
That the strain-hardening rate ( σ / ε ) increases at high porosity levels can be elucidated by investigating the deformation of porous materials at high strain rates. Extrusions generally occur in a compacted material under impact loading, exposing high-density defects. Thus, such materials exhibit two impact-strengthening effects, i.e., strain-strengthening and strain rate-strengthening effects. A porous material under impact loading is prone to pore collapse-induced deformation, leading to compaction toward the support end. During compaction, this material increases rapidly in density, exhibiting pronounced strain-strengthening effects. Subsequently, substantial strain-strengthening effects can be observed from porous titanium alloys because of their low densities.
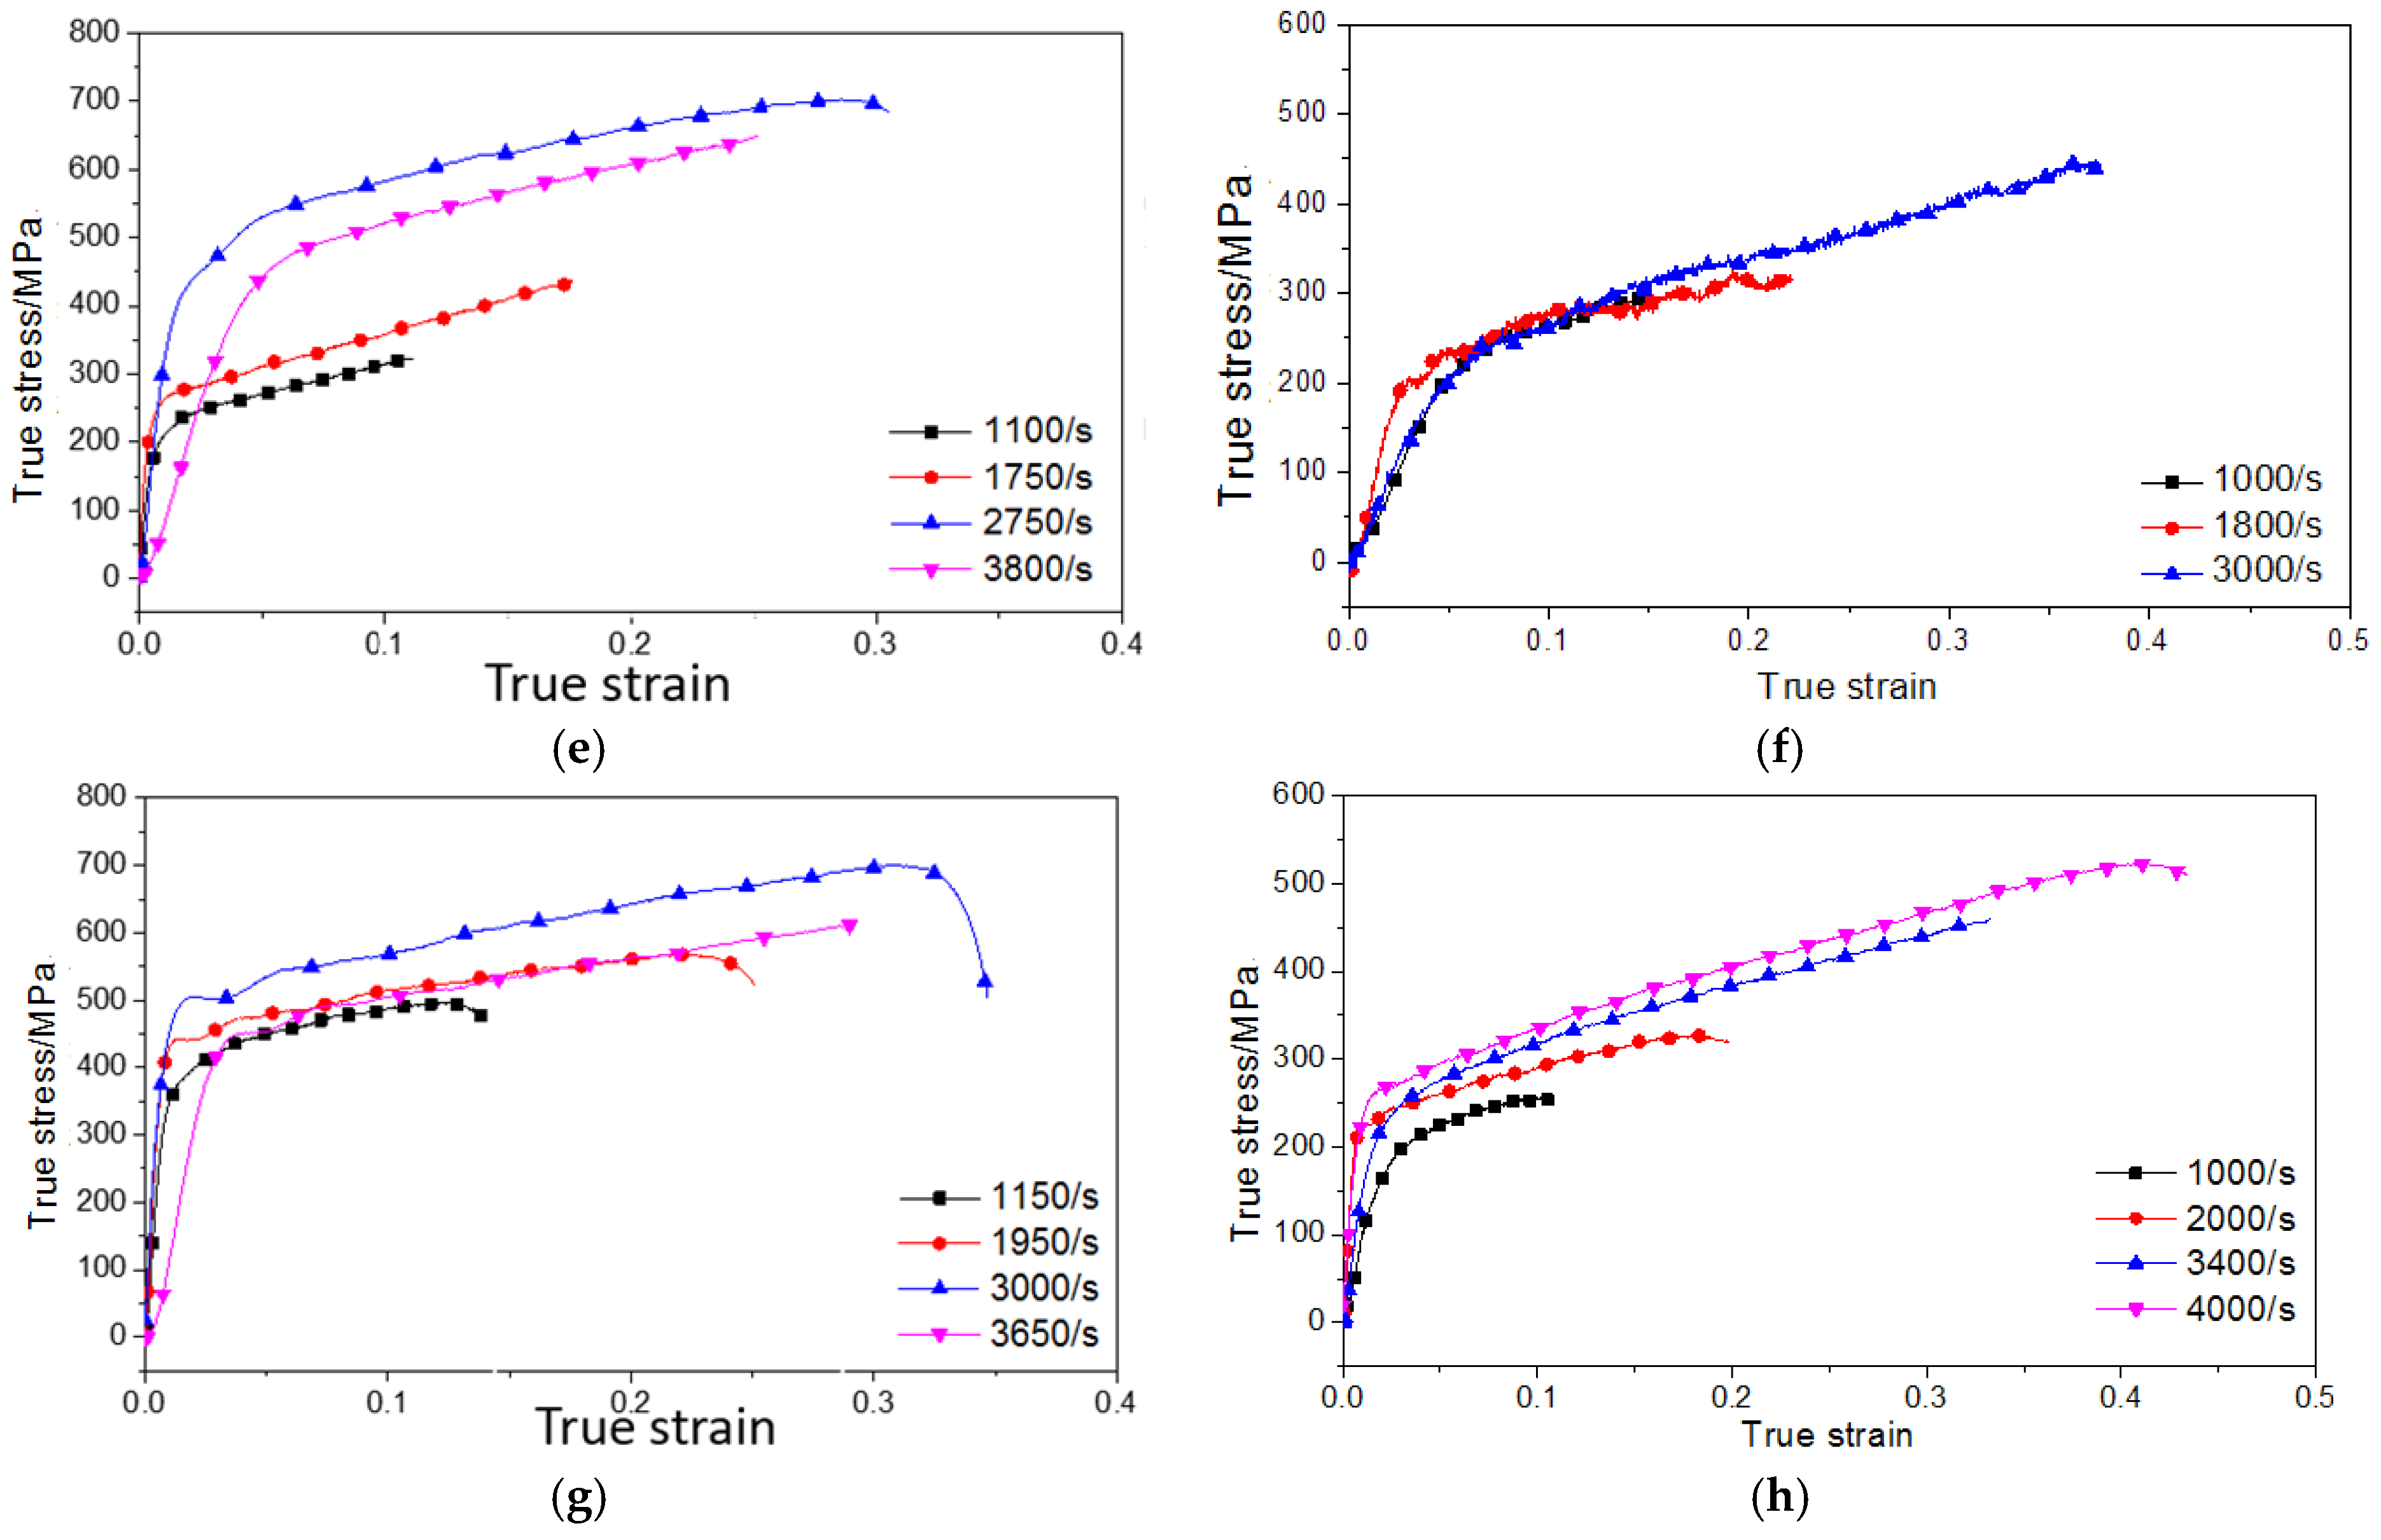
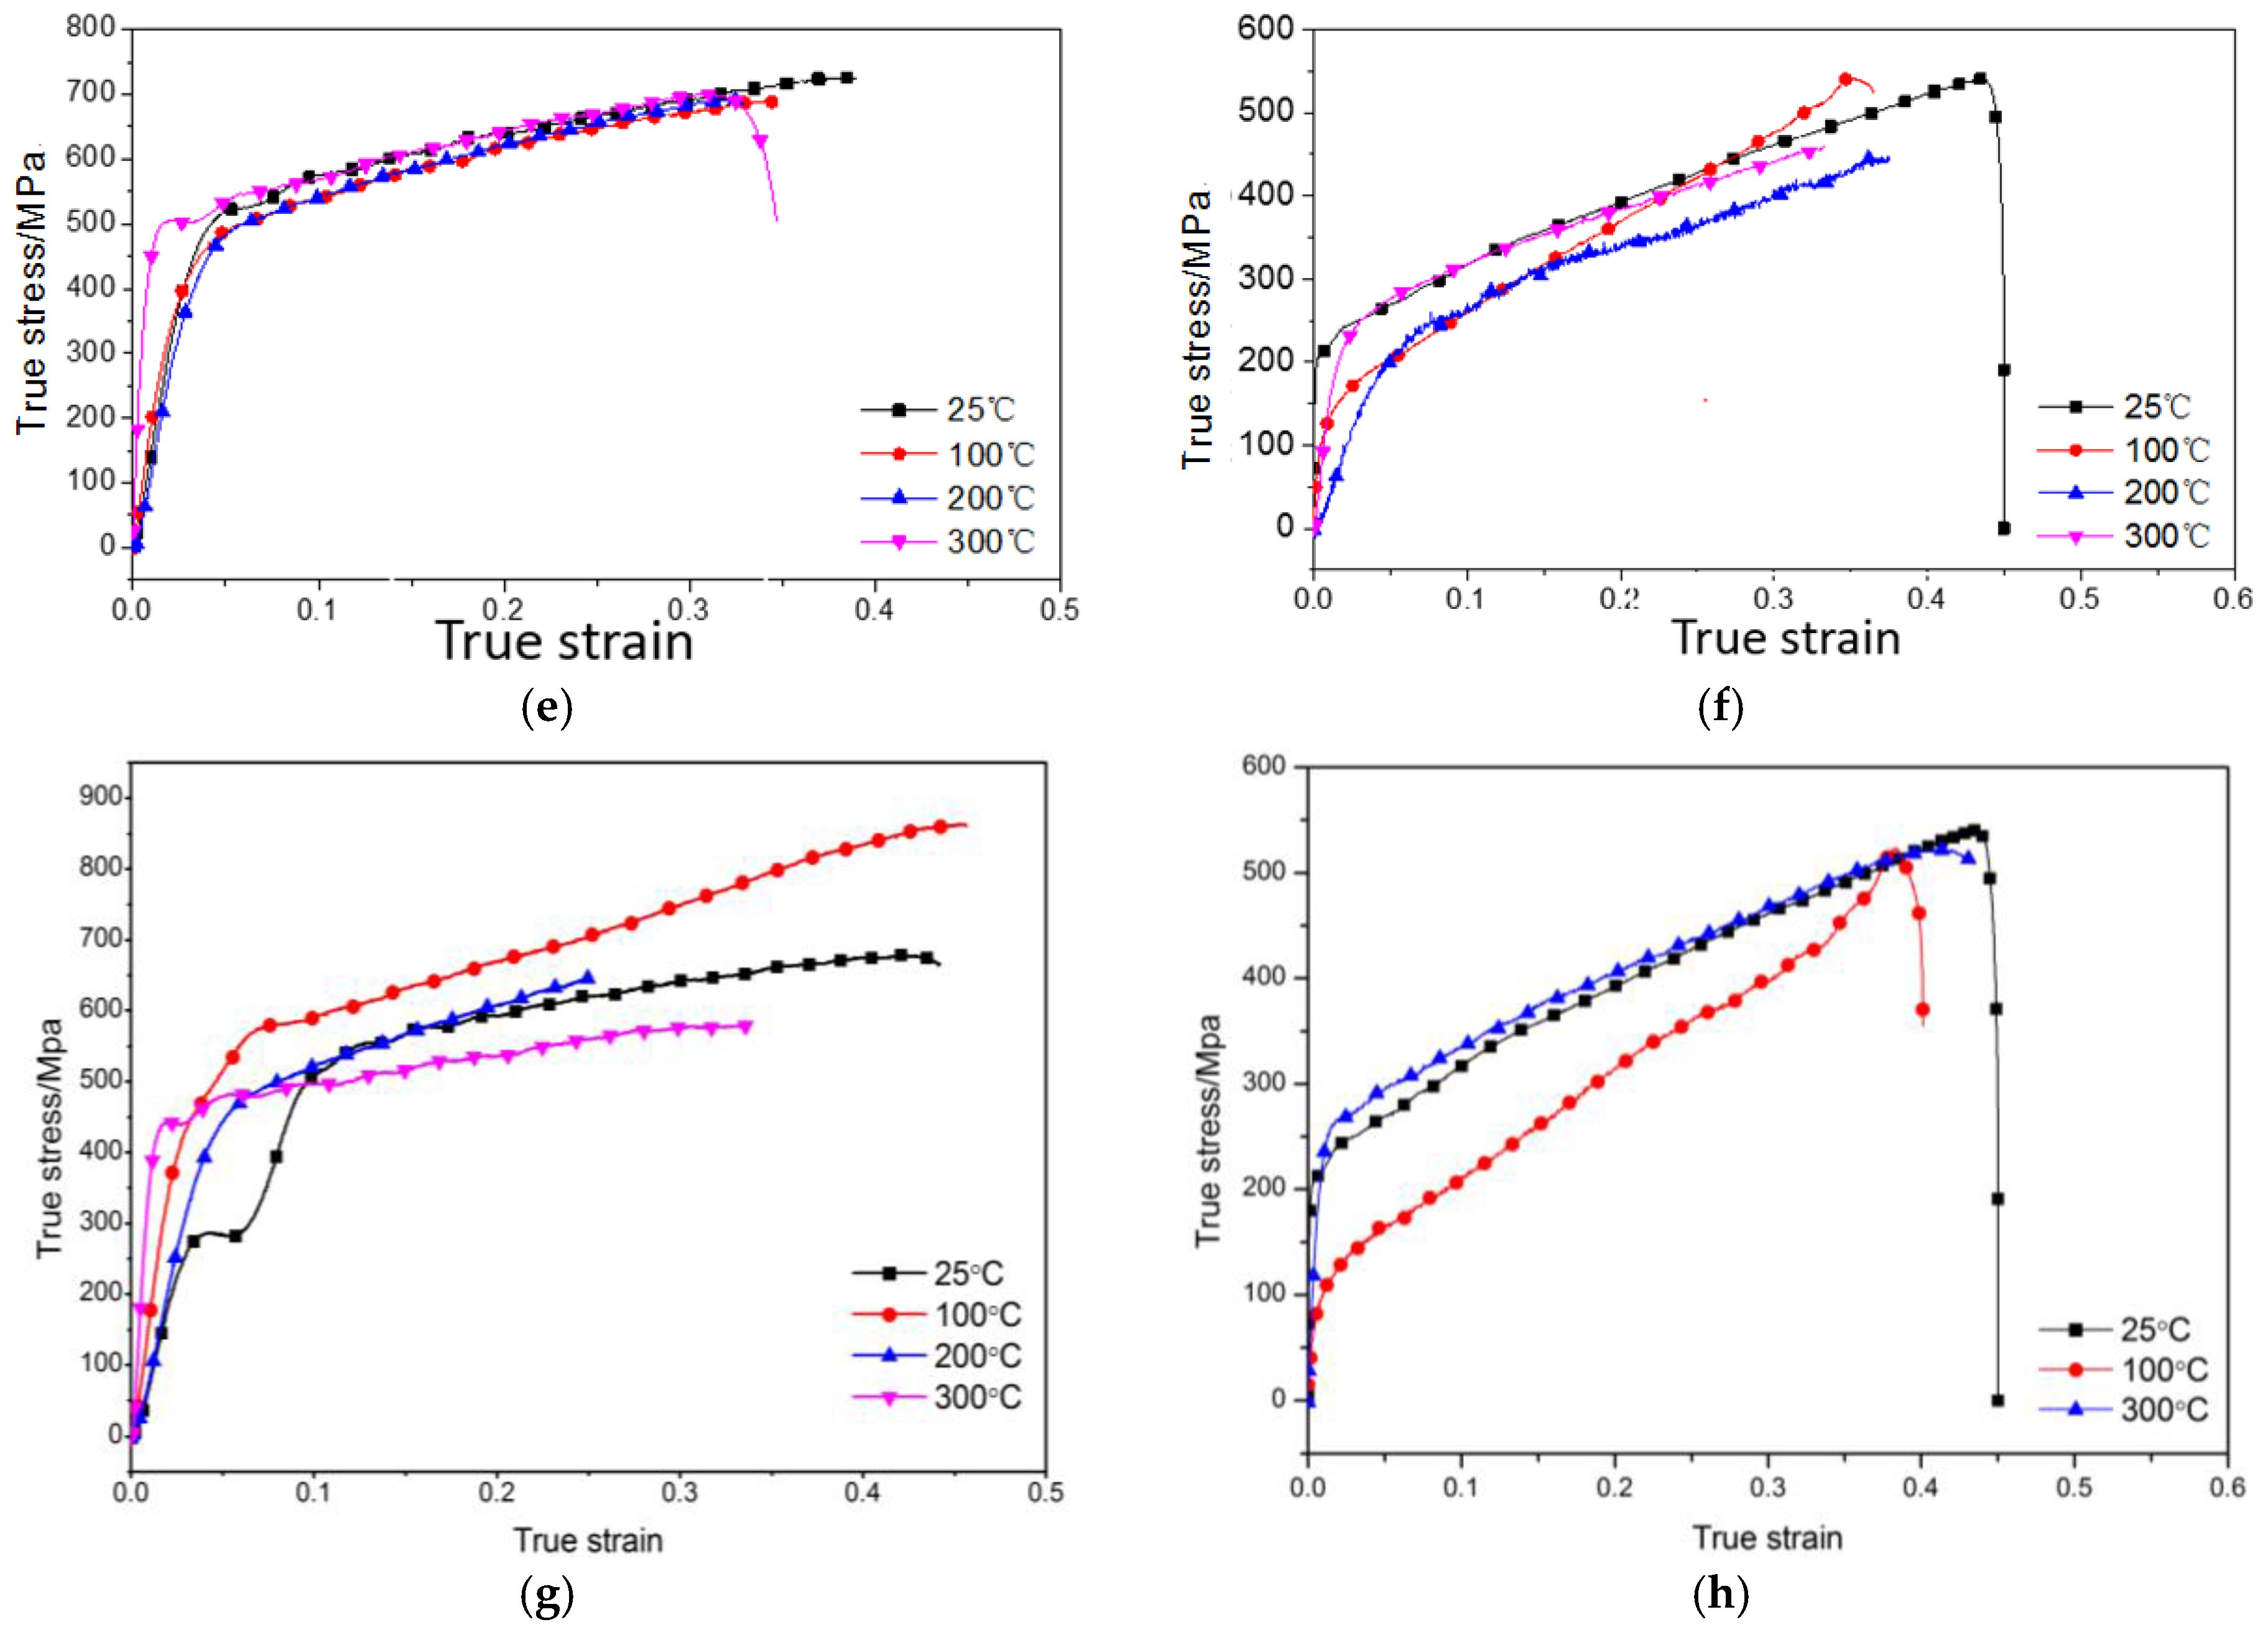
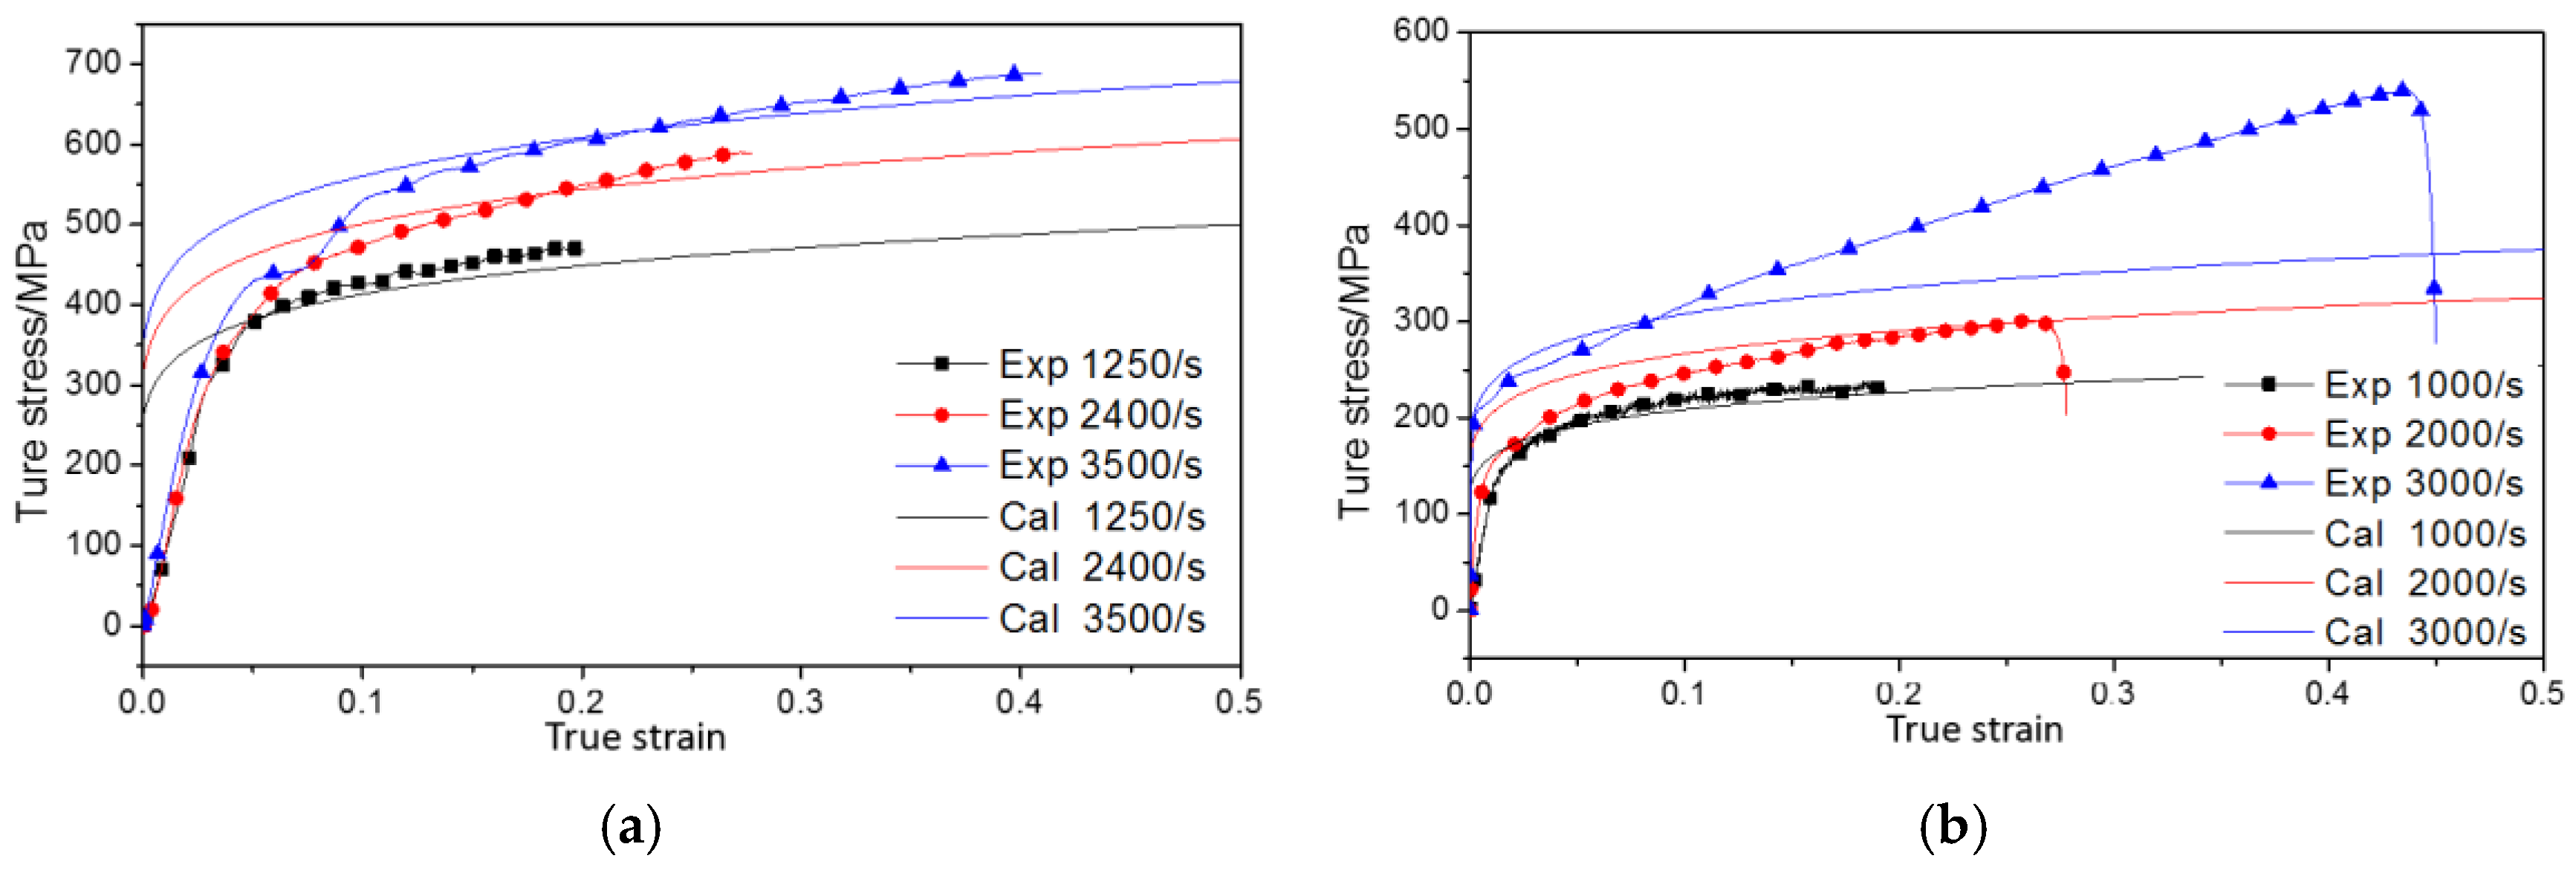
To examine the specimens’ temperature sensitivity, stress-strain curves obtained from the experiments were classified at the same strain rates but different temperatures. Figure 5 shows the true stress–strain curves obtained from the specimens (porosity: 26% and 36%) at different temperatures and at ε ˙ = 1000 s−1, ε ˙ = 2000 s−1, and ε ˙ = 3000 s−1. At temperatures of less than 200 °C, the yield limit and flow stress of the 26%-porosity specimen declined as the temperature increased, indicating that the presence of temperature-softening effects in the specimen. However, at 300 °C, the yield limit and flow stress increased to levels higher than their room-temperature levels, indicating changes in the specimen’s mechanical properties or microscopic structure at this temperature; these changes were unlikely to be caused by strain-rate effects or strain-hardening effects. In addition, the flow stress of the 36%-porosity specimen only fluctuated slightly as the temperature increased. Thus, its flow-stress variations at various temperatures could not be easily generalized. However, two features of stress-strain curves for the 36%-porosity specimen were observed: the specimen exhibited limited temperature sensitivity at temperatures under 300 °C, and it showed stronger strain-hardening effects at 100 °C than at other temperatures. By contrast, the strain-hardening effects of the 26%-porosity specimen at the same strain rates did not change much despite temperature variations.
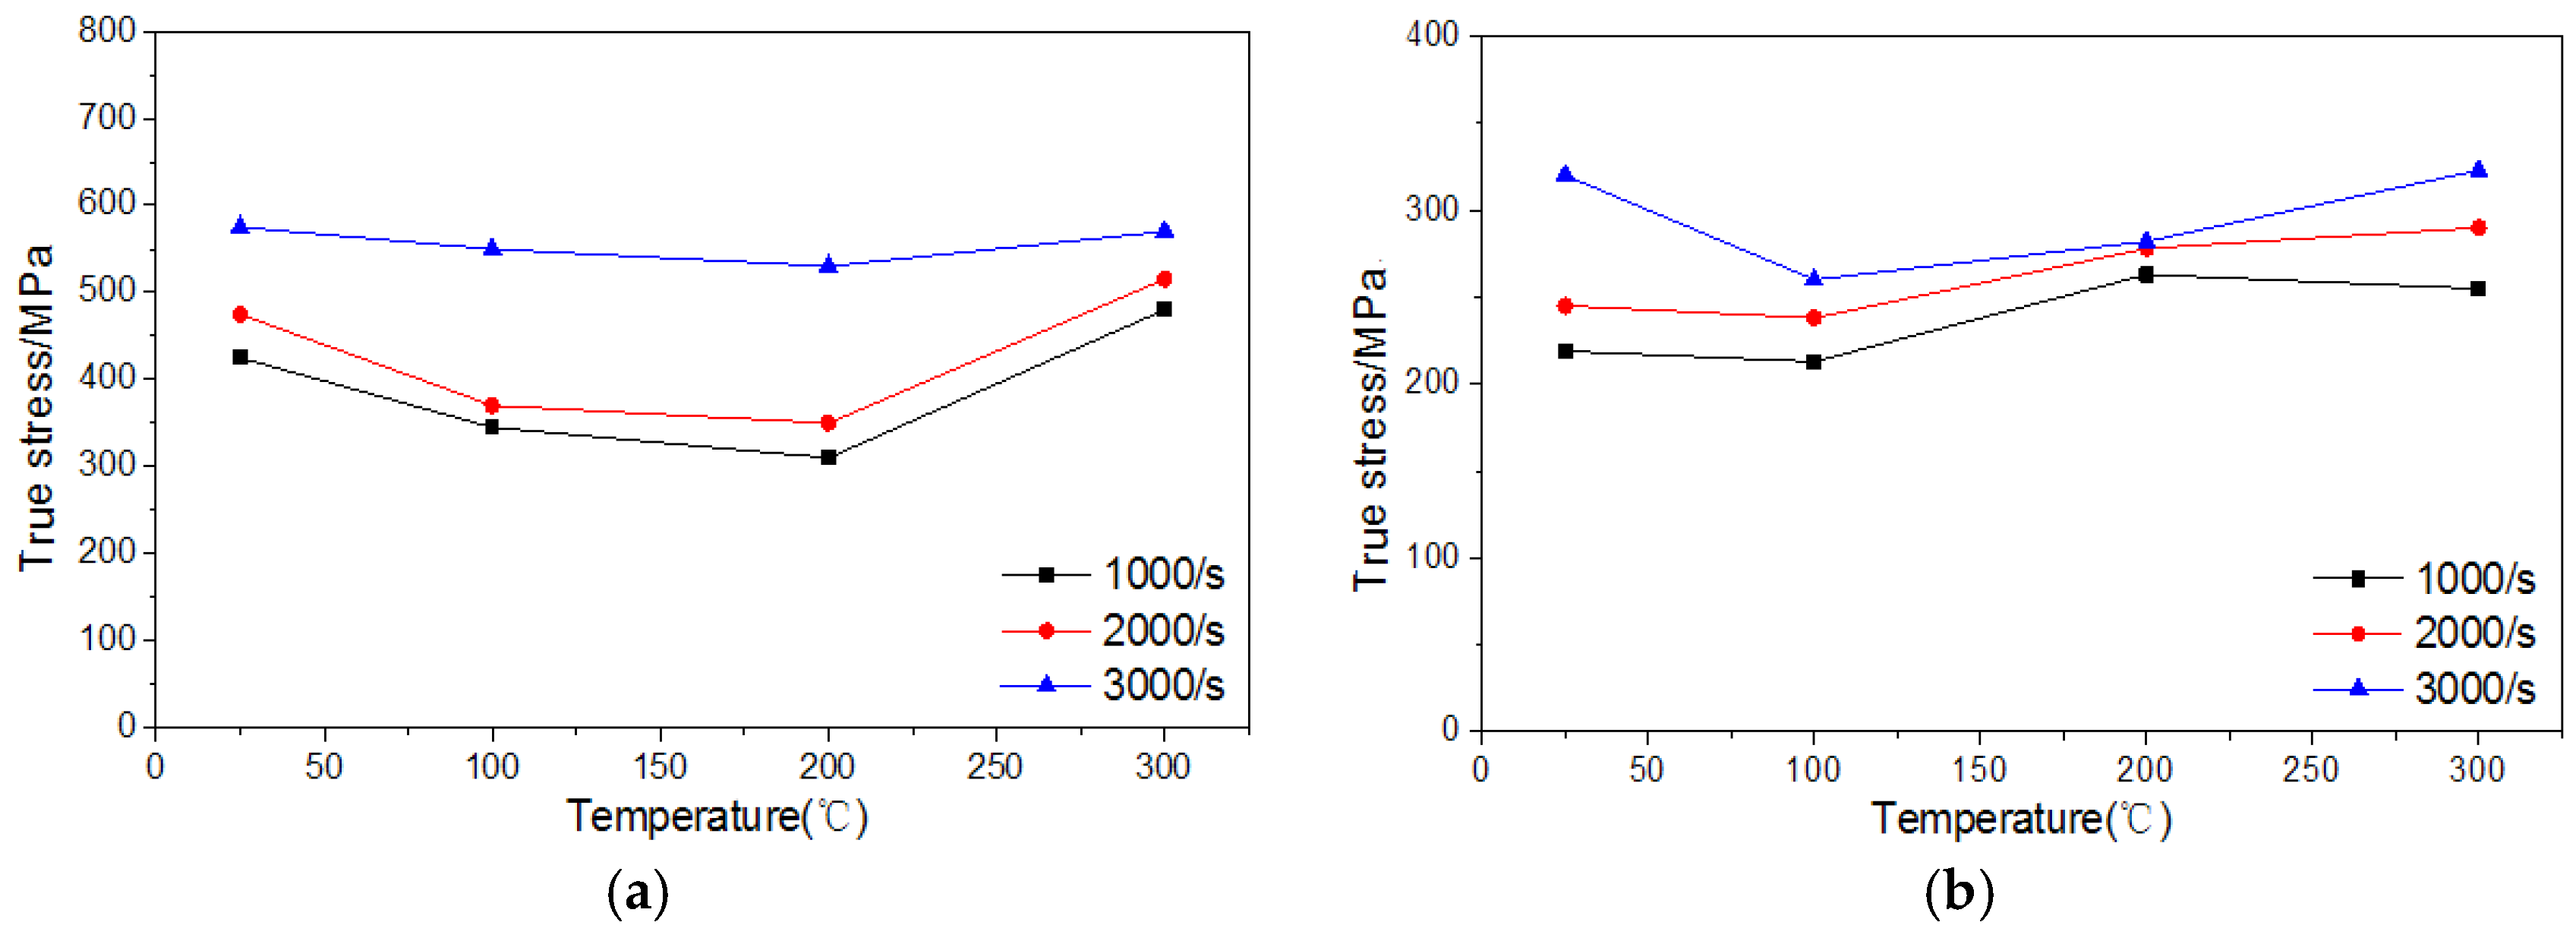
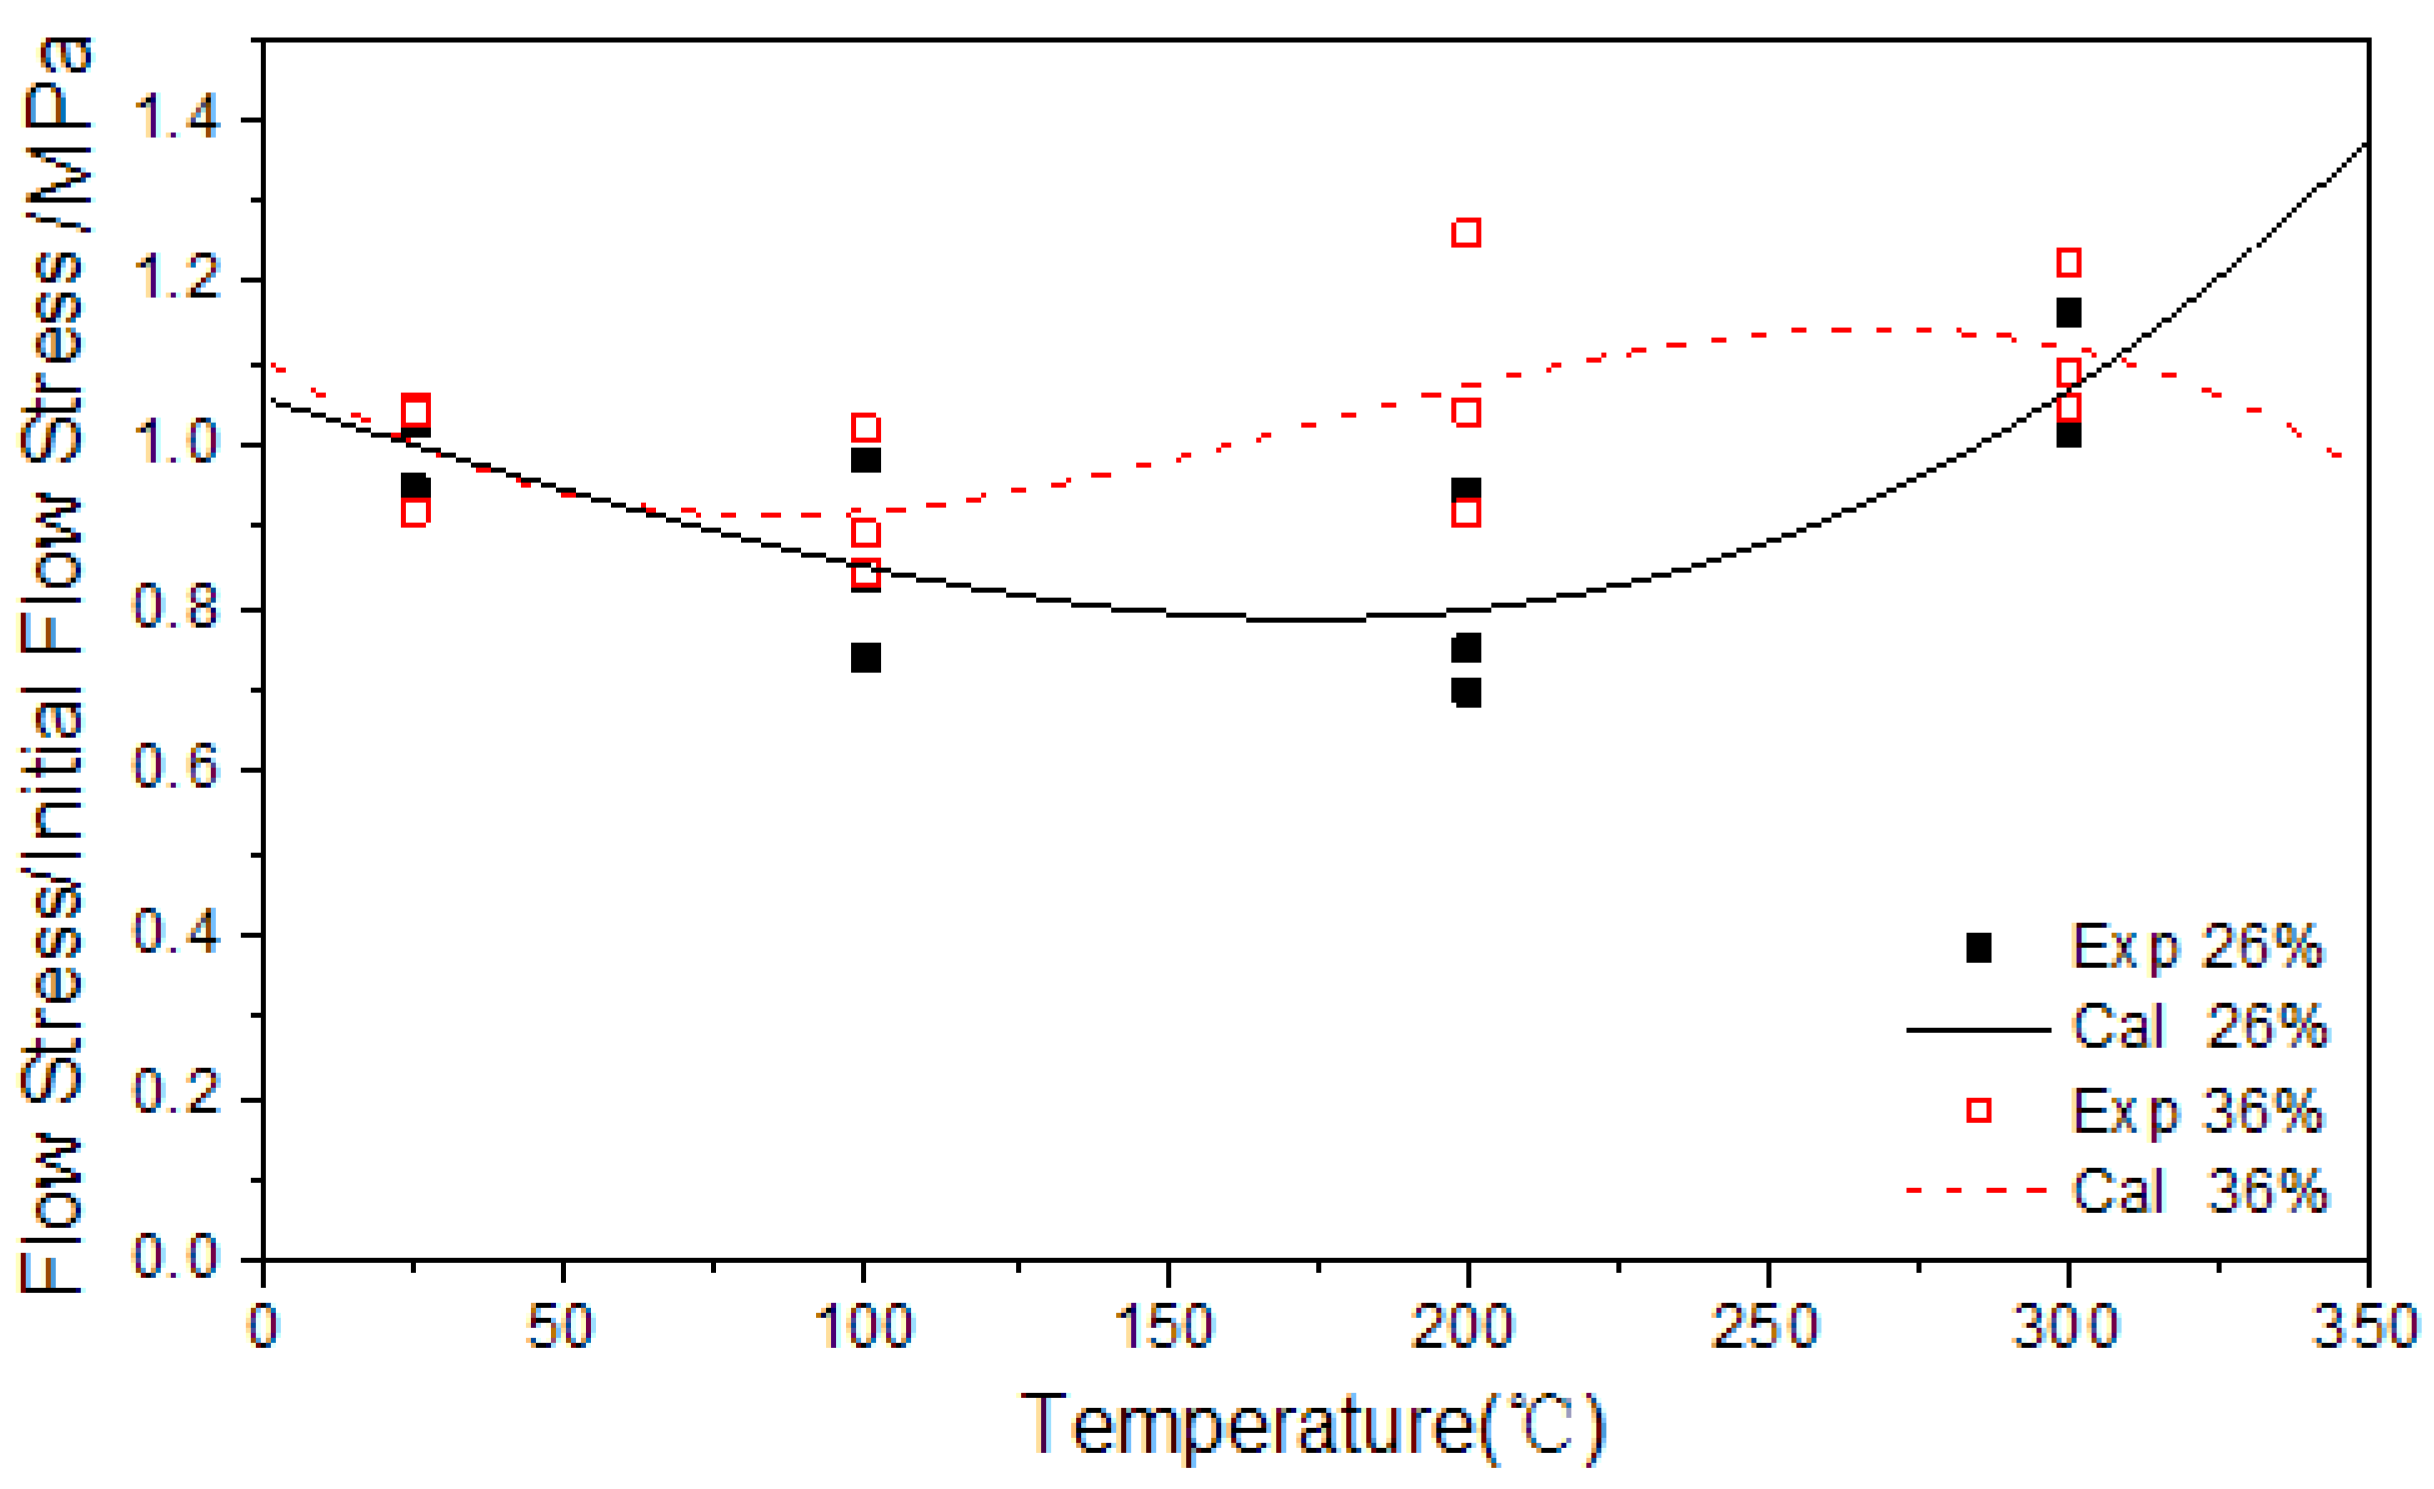
Figure 6 depicts the changes in flow stress in relation to temperature at a stress of 0.1 (ε = 0.1) and at consistent strain rates. This figure illustrates the temperature-softening effects of the 26%-porosity specimen under 200 °C and the substantial increases in these effects at 300 °C. However, the flow stress of the 36%-porosity specimen showed a downward trend at temperatures lower than 100 °C but an upward trend at temperatures higher than 100 °C. The stress-rate sensitivity of the 26%-porosity specimen increased with rising temperatures and decreased once the temperature reached 300 °C, whereas that of the 36%-porosity counterpart decreased with rising temperatures and increased once the temperature reached 300 °C.
Flow stress exhibited similar trends at strain rates of 1000 s−1 and 2000 s−1, but the discreteness of the strain-rate data collected from the specimens increased at a strain rate of 3000 s−1, at which these trends were less noticeable.
Different temperature effects were absorbed between the porous titanium alloy specimens used in this study and compact titanium alloys because the specimens’ mechanical strength levels increased, rather than monotonically decreased, with rising temperatures.

3.3. The Drucker-Prager (DP) Model

The DP model is a constitutive model applied to the finite element simulation of micromachining processes; it describes stress-strain relationships in detail. Each term in the model contains piecewise functions, thus corresponding closely with the specimens’ plastic mechanical properties and ensuring selectivity for fitting. The DP model was used to examine the patterns of plastic flow variations.
The DP model is expressed by
σ ( ε , ε ˙ , T ) = G ( ε ) × Γ ( ε ˙ ) × Θ ( T )
G ( ε ) = { σ 0 ( 1 + ε ε 0 ) 1 n , if   ε ε cut ; σ 0 ( 1 + ε cut ε 0 ) 1 n , if   ε > ε cut ;
Γ ( ε ˙ ) = { ( 1 + ε ˙ ε ˙ 0 ) 1 m 1 , if ε ˙ ε ˙ t ; ( 1 + ε ˙ ε ˙ 0 ) 1 m 2 ( 1 + ε t ˙ ε ˙ 0 ) ( 1 m 1 1 m 2 ) , if ε ˙ > ε ˙ t ;
Θ ( T ) = { c 0 + c 1 T + c 2 T 2 + c 3 T 3 + c 4 T 4 + c 5 T 5 , if   ε ˙ ε ˙ t ; Θ ( T cut ) T T cut T melt T cut , if   ε ˙ > ε ˙ t ;
where G ( ε ) is the strain-hardening term, Γ ( ε ˙ ) is the strain-rate strengthening term, Θ ( T ) is the temperature-softening term, σ 0 is the yield limit, ε is the plastic strain, ε 0 is the reference plastic strain, ε cut is the breaking strain, n is the hardening exponent, m1 and m2 are strain-rate effect exponents, ε ˙ is the strain rate, ε ˙ 0 is the reference strain rate, ε t ˙ is the critical strain rate, c 0 c 5 are polynomial coefficients, T is the temperature, T melt is the melting point of the material, and T cut is the critical temperature.
Fitting was conducted through the method of separating variables for each term in the DP model. Experimental data were fitted through linear regression and polynomial fitting to yield constitutive equation parameters.
Fitting was first performed on the strain-hardening term. A DP model with reference strain rates and under room-temperature conditions was used to describe the stress-strain relationship under quasistatic conditions. No noticeable plastic-flow plateaus were generated in the specimens because deformation and densification occurred simultaneously. Thus, the fitting was performed using equations with strain-hardening terms smaller than the breaking strain ( ε c u t ).
The strain-hardening term was converted into Equation (7). In a log–log graph, this equation is a straight line with an intercept of ln σ 0 and a slope of 1 / n , in which σ 0 is defined as the yield limit under quasistatic conditions and the reference plastic strain ( ε 0 ) is defined as the nonproportional compressive strain (which was set to be 0.2% in all experiments of the present study). The hardening exponent (n) was obtained through the fitting of quasistatic true stress-strain data.
ln σ = ln σ 0 + 1 n ln ( 1 + ε ε 0 )
This fitting yielded the strain-hardening parameters of the 26%- and 36%-porosity titanium alloy specimens (Table 5).
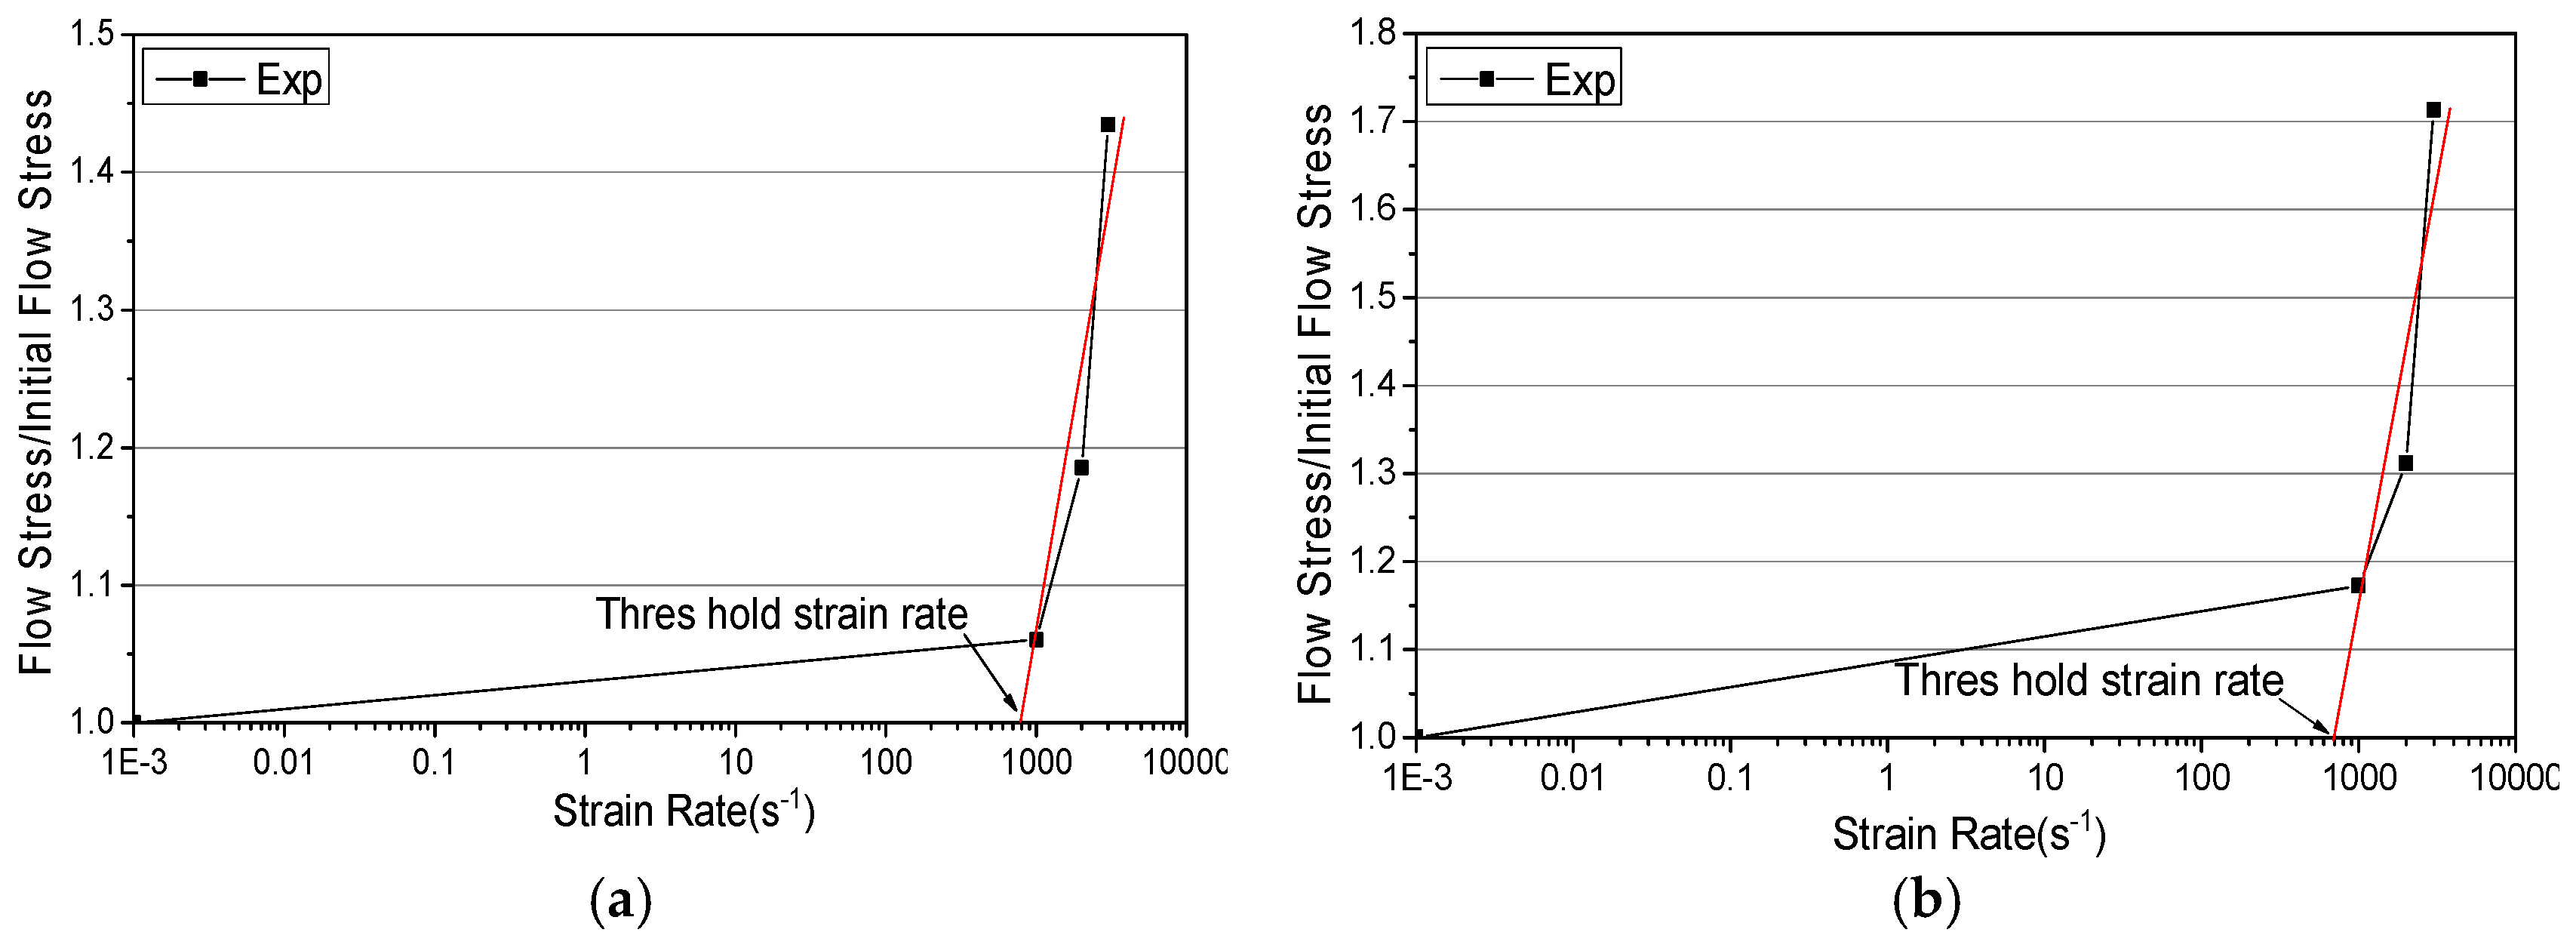
Second, fitting was performed on strain-rate strengthening terms. The DP model was employed under room-temperature conditions to describe the stress-strain relationship at different strain rates at room temperature. Comparing flow stress values at the same room temperature but various strain rates with flow stress values under quasistatic conditions (ε = 0.1) yielded strain-rate strengthening coefficients for different strain rates. In Figure 7, the straight line indicates changes in strain-rate strengthening coefficients under dynamic conditions; the intersection between the line and coordinate axis is the lower limit of the critical-strain-rate range (whereas its upper limit is 1000 s−1); and the critical-strain-rate ranges of the 26%- and 36%-porosity specimens are 800–1000 s−1 and 700–1000 s−1, respectively. From these ranges, adequate critical strain rates ( ε ˙ t ) were selected.
To conduct fitting using equations with strain-hardening terms larger than the selected threshold critical strain rates ( ε ˙ t ), the strain-rate strengthening term was converted into Equation (9). In a log–log graph, this equation is a straight line with a slope of ( 1 / m 1 1 / m 2 ) ln ( 1 + ε ˙ t / ε ˙ 0 ) and an intercept of 1 / m 2 , in which the reference strain rate ( ε ˙ 0 ) was set to be 0.001. The strain-rate strengthening coefficients of both alloys at the strain rates of 1000 s−1, 2000 s−1 and 3000 s−1 at room temperature were fitted to yield strain-rate sensitivity exponents m1 and m2.
ln [ Γ ( ε ˙ ) ] = { 1 m 1 ln ( 1 + ε ˙ ε 0 ˙ ) , if   ε ˙ ε ˙ t ; 1 m 2 ln ( 1 + ε ˙ ε 0 ˙ ) + ( 1 m 1 1 m 2 ) ln ( 1 + ε t ˙ ε 0 ˙ ) if   ε ˙ > ε ˙ t ;
This fitting yielded strain-rate strengthening term parameters from the DP model for both specimens (Table 6).
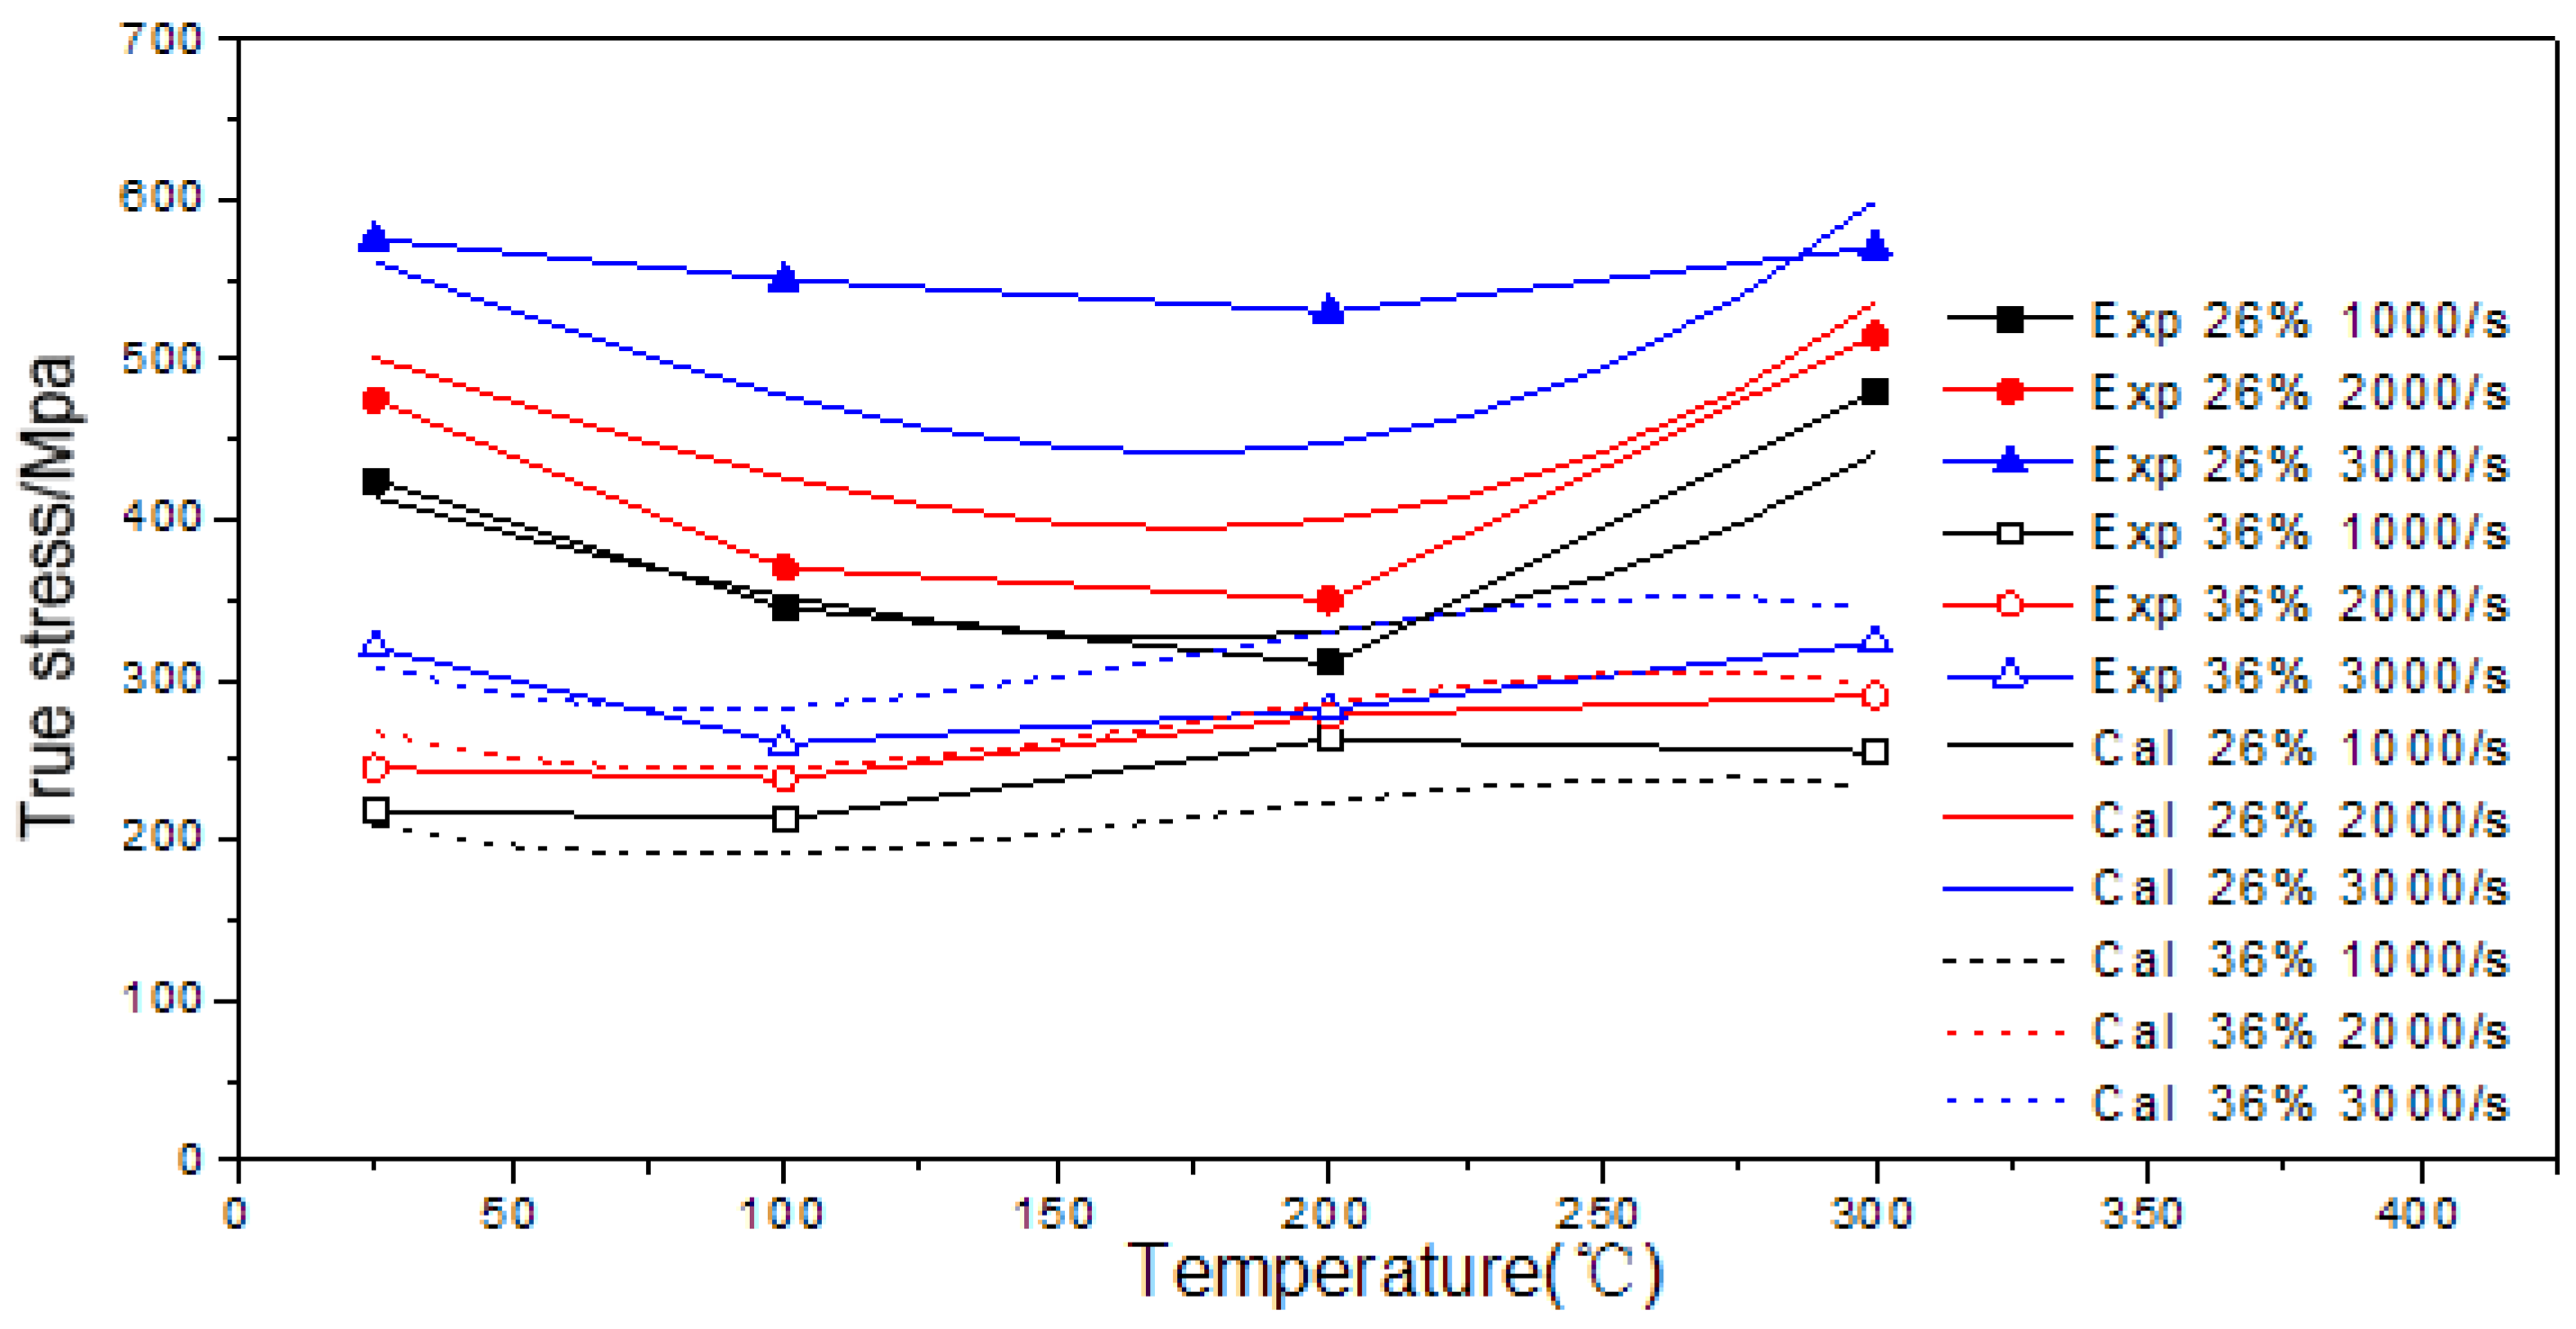
Fitting was performed on temperature-softening terms. The flow stress values of the alloy specimens changed nonlinearly with temperature; thus, linear decrease equations with temperature-softening terms greater than the critical temperature ( T c u t ) were not adequate for the fitting. Instead, polynomial equations obtained from the temperature-softening terms in the model were used to describe the temperature effects of the specimens.
During the fitting, flow stress (ε = 0.1) values for identical strain rates at 25 °C, 100 °C, 200 °C and 300 °C was divided by the initial flow stress and the corresponding strain-rate strengthening coefficients to derive temperature-effect coefficients for the alloys at these different temperatures (Figure 8). Polynomial fitting was subsequently performed on these temperature-effect coefficients to yield polynomial coefficients c 0 c 5 (Table 7).

3.4. True Stress-Strain Curves and Flow Stress: Comparing Experimental and Simulated Results

The 26%- and 36%-porosity specimens were micromilled in the DP simulation. Figure 9 shows true stress-strain curves under dynamic compression and DP simulation. The simulated true stress-strain curves at room temperatures exhibited favorable consistency with the experimental ones, indicating the ability of the DP model to sufficiently describe flow-stress changes from the specimens at room temperature. Moreover, for the 36%-porosity specimen, the simulated and experimental results of strain-rate strengthening effects were practically identical, indicating the ability of the DP model to sufficiently describe the strain-rate strengthening effects of the specimen. The DP model was also applied to describing the strain-rate strengthening effects of the 26%-porosity specimen, although the collected simulated and experimental data showed certain degrees of deviation at considerably high deformation levels.
Figure 10 compares the experimental and simulated results of the flow stress phenomena of both specimens at different strain rates and at a flow stress value of 0.1. The simulated and experimental results of flow stress were practically identical with a deviation of 10% or lower, indicating the ability of the DP model to sufficiently describe the dynamic mechanical properties of the specimens. The polynomial equations obtained using temperature-related terms in the model were able to characterize the temperature-softening and temperature-strengthening effects of both specimens.
Figure 11 provides a comparison between the simulated stress and experimental stress values. Eliminating the data at beginning, relatively stable data were selected for analysis. As can be seen, a good agreement has been obtained which shows the applicability of the DP constitutive model in describing the relationship between flow stress and strain of porous titanium alloys at various strain rates and temperatures. The error of the model was examined using average absolute relative error parameter (AARE) [30,31]. The AARE was found to be 5.36% and 4.609%, respectively.
A A R E = 1 N i = 1 n | E i S i E i | × 100
where Ei is the experimental value, Si is the simulated value, and N is the number of data.

4. Conclusions

Several conclusions can be drawn from the dynamic and quasistatic mechanical response testing of the 26%- and 36%-porosity titanium alloy specimens and the establishment and validation of the DP constitutive model:
(1)
As with a conventional porous material, the deformation patterns of porous titanium alloys under quasistatic loading can be divided into elastic, plastic, and densification stages.
(2)
The employed dynamic and quasistatic mechanical response tests showed that the presence of pores substantially reduced the mechanical strength levels of the alloy specimens. The compressive elastic moduli of compacted pure titanium and the 26%- and 36%-porosity titanium alloy specimens were 102.5 GPa, 20.13 GPa, and 7.67 GPa, respectively. The yield limits of compacted pure titanium and the 26%- and 36%-porosity specimens were 275 MPa, 250 MPa and 115 MPa, respectively.
(3)
Dissimilar to the deformation patterns of compacted titanium, the deformation patterns of porous titanium alloys are characterized by pore collapse-induced deformation. Thus, the alloy specimens show strong stress-hardening effects, although no noticeable plastic flow plateaus were observed.
(4)
Porous titanium alloys exhibit stress-rate effects at strain rates of 1000–3000 s−1. However, no statistical regularity was observed in the strain-rate data at a strain rate of 4000 s−1, indicating that the discreteness of these data increased with rising strain rates.
(5)
A 26%-porosity titanium has notable temperature sensitivity, whereas a 36%-porosity titanium has weak temperature sensitivity. Moreover, the strain-rate sensitivity levels of both alloys vary at different temperatures.
(6)
The DP model accurately describes the mechanical properties of both alloy specimens at 25–300 °C and at strain rates of 1000–3000 s−1, with a deviation of 10% or lower.

Acknowledgments

The work is supported by the National Natural Science Foundation of China (No. 51305174).

Author Contributions

Zhiqiang Liu and Tianyu Zhu conceived and designed the experiments; Tianyu Zhu performed the experiments; Feifei Ji and Tianyu Zhu analyzed the data; Zhiqiang Liu and Mingqiang Wang contributed analysis tools; Tianyu Zhu and FeiFei Ji wrote the paper.

Conflicts of Interest

The authors declare no conflict of interest.

References

  1. Ezugwu, E.O.; Wang, Z.M. Titanium alloys and their machinability—A review. J. Mater. Process. Technol. 1997, 68, 262–274. [Google Scholar] [CrossRef]
  2. Liu, Y.; Jiang, G.F.; He, G. Enhancement of entangled porous titanium by BisGMA for load-bearing biomedical applications. Mater. Sci. Eng. C 2016, 61, 37–41. [Google Scholar] [CrossRef] [PubMed]
  3. Yetim, A.F. Investigation of wear behavior of titanium oxide films, produced by anodic oxidation, on commercially pure titanium in vacuum conditions. Surf. Coat. Technol. 2010, 205, 1757–1763. [Google Scholar] [CrossRef]
  4. Ossama, M.B.; Frédéric, B.B.R.; Lee, M.G.; Peter, H.; Matthias, W. Constitutive modelling of high strength titanium alloy Ti-6Al-4 V for sheet forming applications at room temperature. Int. J. Solids Struct. 2016, 80, 334–347. [Google Scholar]
  5. Zhang, L.; He, Z.Y.; Zhang, Y.Q.; Jiang, Y.H.; Zhou, R. Enhanced in vitro bioactivity of porous NiTi–HA composites with interconnected pore characteristics prepared by spark plasma sintering. Mater. Des. 2016, 101, 170–180. [Google Scholar] [CrossRef]
  6. Wu, C.C.; Chang, T.P.; Peng, K.Y.; Chang, W.C. Study on the properties of WC-10Co alloys adding Cr3C2powder via various vacuum sintering temperatures. J. Alloy. Compd. 2016, 686, 810–815. [Google Scholar] [CrossRef]
  7. Yao, Y.C.; Qu, P.W.; Gan, X.K.; Huang, X.P.; Zhao, Q.F.; Liang, F. Preparation of porous-structured LiFePO4/C composite by vacuum sintering for lithium-ion battery. Ceram. Int. 2016, 42, 12726–12734. [Google Scholar] [CrossRef]
  8. Chen, H.; Wang, C.; Zhu, K.; Fan, Y.J.; Zhang, X.D. Fabrication of porous titanium scaffolds by stack sintering of microporous titanium spheres produced with centrifugal granulation technology. Mater. Sci. Eng. C 2014, 43, 182–188. [Google Scholar] [CrossRef] [PubMed]
  9. Taniguchi, N.; Fujibayashi, S.; Takemoto, M.; Sasaki, K.; Otsuki, B.; Nakamura, T.; Matsushita, T.; Kokubo, T.; Matsuda, S. Effect of pore size on bone ingrowth into porous titanium implants fabricated by additive manufacturing: An in vivo experiment. Mater. Sci. Eng. C 2016, 59, 690–701. [Google Scholar] [CrossRef] [PubMed]
  10. Quan, H.X.; Gao, S.S.; Zhu, M.H.; Yu, H.Y. Comparison of the torsional fretting behavior of three porous titanium coatings for biomedical applications. Tribol. Int. 2015, 92, 29–37. [Google Scholar] [CrossRef]
  11. Yang, Y.; Zhang, C.; Wang, Y.; Dai, Y.J.; Luo, J.B. Friction and wear performance of titanium alloy against tungsten carbide lubricated with phosphate ester. Tribol. Int. 2015, 95, 27–34. [Google Scholar] [CrossRef]
  12. Rahman, M.; Wang, Z.G.; Wong, Y.S. A review on high-speed machining of tita-nium alloys. JSME Int. J. Ser. C Mech. Syst. Mach. Elem. Manuf. 2006, 49, 11–20. [Google Scholar] [CrossRef]
  13. Budinski, K.G. Tribological properties of titanium alloys. Wear 1991, 151, 203–217. [Google Scholar] [CrossRef]
  14. Lauro, C.H.; Filhob, S.L.M.R.; Brandãob, L.C.; Davin, J.P. Analysis of behaviour biocompatible titanium alloy (Ti-6Al-7Nb) in the micro-cutting. Measurement 2016, 96, 529–540. [Google Scholar] [CrossRef]
  15. Schoop, J.; Jawahir, I.S.; Balk, T.J. Size effects in finish machining of porous powdered metal for engineered surface quality. Precis. Eng. 2015, 44, 180–191. [Google Scholar] [CrossRef]
  16. Wang, X.H.; Li, J.S.; Hu, R.; Kou, H.C. Mechanical properties and pore structure deformation behavior of biomedical porous titanium. Trans. Nonferr. Met. Soc. Chin. 2015, 25, 1543–1550. [Google Scholar] [CrossRef]
  17. Dai, J.; Chen, C.; Weng, F. High temperature oxidation behavior and research status of modifications on improving high temperature oxidation resistance of titanium alloys and titanium aluminides: A review. J. Alloy. Compd. 2016, 685, 784–798. [Google Scholar] [CrossRef]
  18. Revankar, G.D.; Shetty, R.; Rao, S.S.; Gaitonde, V.N. Wear resistance enhancement of titanium alloy (Ti–6Al–4V) by ball burnishing process. J. Mater. Res. Technol. 2016, 5, 190–197. [Google Scholar] [CrossRef]
  19. Yang, D.; Liu, Z. Surface topography analysis and cutting parameters optimization for peripheral milling titanium alloy Ti–6Al–4V. Int. J. Refract. Met. Hard Mater. 2015, 51, 192–200. [Google Scholar] [CrossRef]
  20. Lin, Y.C.; Chen, X.M. A critical review of experimental results and constitutive descriptions for metals and alloys in hot working. Mater. Des. 2011, 32, 1733–1759. [Google Scholar] [CrossRef]
  21. Zhang, C.; Zhang, L.; Shen, W.F.; Liu, C.R.; Xia, Y.N.; Li, R.Q. Study on constitutive modeling and processing maps for hot deformation of medium carbon Cr–Ni–Mo alloyed steel. Mater. Sci. Eng. A 2014, 590, 255–261. [Google Scholar] [CrossRef]
  22. Chen, L.; Zhao, G.; Yu, J. Hot deformation behavior and constitutive modeling of homogenized 6026 aluminum alloy. Mater. Des. 2015, 74, 25–35. [Google Scholar] [CrossRef]
  23. Roters, F.; Raabe, D.; Gottstein, G. Work hardening in heterogeneous alloys—A microstructural approach based on three internal state variables. Acta Mater. 2000, 48, 4181–4189. [Google Scholar] [CrossRef]
  24. Samantaray, D.; Mandal, S.; Bhaduri, A.K.; Venugopal, S.; Sivaprasad, P.V. Analysis and mathematical modelling of elevated temperature flow behaviour of austenitic stainless steels. Mater. Sci. Eng. A 2011, 528, 1937–1943. [Google Scholar] [CrossRef]
  25. Li, P.; Li, F.G.; Cao, J.; Ma, X.K.; Li, J.H. Constitutive equations of 1060 pure aluminum based on modified double multiple nonlinear regression model. Trans. Nonferr. Met. Soc. Chin. 2016, 26, 1079–1095. [Google Scholar] [CrossRef]
  26. Haghdadi, N.; Zarei-Hanzaki, A.; Khalesian, A.R.; Abedi, H.R. Artificial neural network modeling to predict the hot deformation behavior of an A356 aluminum alloy. Mater. Des. 2013, 49, 386–391. [Google Scholar] [CrossRef]
  27. Rubshtein, A.P.; Trakhtenberg, S.; Makarova, E.B.; Bliznets, D.G.; Yakovenkova, L.I.; Vladimirov, V.B. Porous material based on spongy titanium granules: Structure, mechanical properties, and osseointegration. Mater. Sci. Eng. C 2014, 35, 363–369. [Google Scholar] [CrossRef] [PubMed]
  28. Wang, F.; Zhao, J.; Zhu, N.; Li, Z. A comparative study on Johnson-Cook constitutive modeling for Ti–6Al–4V alloy using automated ball indentation (ABI) technique. J. Alloy. Compd. 2015, 633, 220–228. [Google Scholar] [CrossRef]
  29. Fakhri, M.A.; Bordatchev, E.V.; Tutunea-Fatan, O.R. An image-based methodology to establish correlations between porosity and cutting force in micromilling of porous titanium foams. Int. J. Adv. Manuf. Technol. 2012, 60, 841–851. [Google Scholar] [CrossRef]
  30. Haghdadi, N.; Zarei-Hanzaki, A.; Abedi, H.R. The flow behavior modeling of cast A356 aluminum alloy at elevated temperatures considering the effect of strain. Mater. Sci. Eng. A 2012, 535, 252–257. [Google Scholar] [CrossRef]
  31. Haghdadi, N.; Martin, D.; Hodgson, P. Physically-based constitutive modelling of hot deformation behavior in a LDX 2101 duplex stainless steel. Mater. Des. 2016, 106, 420–427. [Google Scholar] [CrossRef]
Figure 1. The final samples with the size of φ 8 mm × 3 mm, φ 8 mm × 4 mm, φ 8 mm × 6 mm and φ 8 mm × 8 mm.
Metals 07 00024 g001
Figure 2. Engineering stress-strain curves of porous titanium alloys with porosities of 26% and 30% under quasistatic compression.
Metals 07 00024 g002
Figure 3. The porous titanium alloy specimens experiencing various degrees of crushing: (a) εp = 26%; (b) εp = 36%; (c) εp = 26%, ×100; and (d) εp = 36%, ×100.
Metals 07 00024 g003
Figure 4. Stress–strain curves of the porous titanium alloy specimens (porosity: 26% and 36%) at the same temperatures but different strain rates: (a) εp = 26%, T = 25 °C; (b) εp = 36%, T = 25 °C; (c) εp = 26%, T = 100 °C; (d) εp = 36%, T = 100 °C; (e) εp = 26%, T = 200 °C; (f) εp = 36%, T = 200 °C; (g) εp = 26%, T = 300 °C; and (h) εp = 36%, T = 300 °C.
Metals 07 00024 g004aMetals 07 00024 g004b
Figure 5. Stress–strain curves obtained from the 26%- and 36%-porosity specimens at different temperatures but the same strain rates: (a) ε p = 26%, ε ˙ = 1000 s−1; (b) ε p = 36%, ε ˙ = 1000 s−1; (c) ε p = 26%, ε ˙ = 2000 s−1; (d) ε p = 36%, ε ˙ = 2000 s−1; (e) ε p = 26%, ε ˙ = 3000 s−1; (f) ε p = 36%, ε ˙ = 3000 s−1; (g) ε p = 26%, ε ˙ = 4000 s−1; and (h) ε p = 36%, ε ˙ = 4000 s−1.
Metals 07 00024 g005aMetals 07 00024 g005b
Figure 6. Flow stress of the 26%- and 36%-porosity specimens in response to temperature variations at different strain rates: (a) ε p = 26%; and (b) ε p = 36%.
Metals 07 00024 g006
Figure 7. Selection ranges of critical strain rates in the DP model: (a) ε p = 26%, T = 25 °C; and (b) ε p = 36%, T = 25 °C.
Metals 07 00024 g007
Figure 8. Polynomial fitting conducted using temperature-effect terms in the DP model.
Metals 07 00024 g008
Figure 9. True stress–strain curves (dynamic compression vs. DP simulation): (a) ε p = 26%, T = 25 °C; and (b) ε p = 36%, T = 25 °C.
Metals 07 00024 g009
Figure 10. Comparison of the simulated and experimental flow stress values of the DP model (ε = 0.1).
Metals 07 00024 g010
Figure 11. Error analysis between simulation stress and experimental stress: (a) ε p = 26%, T = 25 °C, ε . = 1200 s−1; and (b) ε p =36%, T = 25 °C, ε . = 3000 s−1.
Metals 07 00024 g011
Table 1. Chemical composition and structural properties of porous titanium alloy samples (wt %).
TypePorosity (%)Particle Size (µm)Aperture (µm)Ti (%)Fe (%)Cu (%)C (%)O (%)N (%)
200#26≤2715≥99.7≤0.15≤0.005≤0.05≤0.2≤0.03
500#36≤74250≥99.7≤0.25≤0.003≤0.06≤0.2≤0.03
Table 2. Parameters of the quasistatic compression test.
TemperatureStrain RateCrosshead SpeedNumber of Repetitions
25 °C0.0010.48 mm/min2
Table 3. Parameters of the employed Split-Hopkinson pressure bar experiments.
Temperature25 °C100 °C200 °C300 °CSpecimen Size/mm
Porosity/%2636263626362636
Strain rate/s−110001000100010001000100010001000φ 8 × 6
20002000200020002000200020002000φ 8 × 4
30003000300030003000300030003000φ 8 × 3
40004000400040004000φ 8 × 3
Table 4. Parameters of the porous titanium alloy specimens under quasistatic compression.
PorosityElastic ModulusYield LimitDensification StressDensification Strain
26%20.13 GPa250 MPa850 MPa0.31
36%7.67 GPa115 MPa375 MPa0.32
Table 5. Strain-hardening parameters of the DP model.
Porosity σ 0 /MPa ε 0 n
26%2500.0028.331
36%1150.0028.105
Table 6. Strain-rate strengthening term parameters of the DP model.
Porosity ε 0 ε t m 1 m 2
26%0.00190074023.611
36%0.001800427.52.821
Table 7. Temperature-softening parameters of the DP model.
Porosity c 0 c 1 c 2 c 3
26%1.057−2.241 × 10⁻³−9.996 × 10−72.867 × 10−8
36%1.105−5.048 × 10−33.933 × 10−5−7.447 × 10⁻⁸
Note: Polynomial coefficients excluded from this table were set as zero.

