Article

High Temperature Strength and Hot Working Technology for As-Cast Mg–1Zn–1Ca (ZX11) Alloy

by
Kamineni Pitcheswara Rao
1,*,
Kalidass Suresh
2,
Yellapregada Venkata Rama Krishna Prasad
3,
Chalasani Dharmendra
1,
Norbert Hort
4 and
Hajo Dieringa
4
1
Department of Mechanical and Biomedical Engineering, City University of Hong Kong, Tat Chee Avenue, Kowloon, Hong Kong
2
Department of Physics, Bharathiar University, Coimbatore 641046, India
3
Independent Researcher, Bengaluru 560024, India
4
Magnesium Innovation Centre, Helmholtz Zentrum Geesthacht, Max-Planck-Strasse 1, Geesthacht 21502, Germany
*
Author to whom correspondence should be addressed.
Metals 2017, 7(10), 405; https://doi.org/10.3390/met7100405
Submission received: 18 August 2017 / Revised: 14 September 2017 / Accepted: 20 September 2017 / Published: 1 October 2017

Abstract

:
Cast Mg–1Zn–1Ca alloy (ZX11) has been tested to evaluate its compressive strength between 25 °C and 250 °C, and workability in the range of 260–500 °C. The ultimate compressive strength of this alloy is about 30% higher than that of creep-resistant alloy Mg–3Sn–2Ca (TX32) between 25 °C and 200 °C, and exhibits a plateau between 100 °C and 175 °C, similar to TX32. This is attributed to Mg2Ca particles present at grain boundaries that reduce their sliding. The processing map, developed between 260 and 420 °C in the strain rate limits of 0.0003 s−1 to 1 s−1, exhibited two domains in the ranges: (1) 280–330 °C and 0.0003–0.01 s−1 and (2) 330–400 °C and 0.0003–0.1 s−1. In these domains, dynamic recrystallization occurs, with basal slip dominating in the first domain and prismatic slip in the second, while the recovery mechanism being climb of edge dislocations in both. The activation energy estimated using standard kinetic rate equation is 191 kJ/mol, which is higher than the value for lattice self-diffusion in magnesium indicating that a large back stress is created by the presence of Ca2Mg6Zn3 intermetallic particles in the matrix. It is recommended that the alloy be best processed at 380 °C and 0.1 s−1 at which prismatic slip is favored due to Zn addition. At higher strain rates, the alloy exhibits flow instability and adiabatic shear band formation at <340 °C while flow localization and cracking at grain boundaries occurs at temperatures >400 °C.

Graphical Abstract

1. Introduction

Owing to their biocompatibility and non-toxic nature, zinc and calcium are promising alloying elements to develop Mg alloys for orthopedic implants and other medical applications. Mg–Zn–Ca alloys (ZX) are being considered for biodegradable applications since they have a favorable combination of high strength and biocompatibility [1,2,3], and low cost of these alloying elements as compared to rare earth elements is also in favor of widespread utilization of these alloys. Zinc exhibits high solid solubility of about 6 wt % at 340 °C and causes solid solution strengthening in Mg [4,5,6,7] by increasing the critical resolved shear stress (CRSS) for basal slip but promotes the occurrence of prismatic slip by lowering its CRSS. With a view to produce low cost Mg–Zn–Ca alloys, the amount of alloying additions were kept at minimum levels while developing Mg–1Zn–1Ca alloy that contains only 1 wt % of Zn and 1 wt % of Ca. The microstructure, higher-temperature compressive strength, creep, and corrosion properties of as-cast ZX11 alloy have been evaluated recently [8] which showed that this alloy composition has a promise for the intended applications. When Ca is added to Mg–Zn alloys, a thermally stable intermetallic phase Ca2Mg6Zn3 forms that increases the higher temperature strength of the alloy [8]. However, the binary phase Mg2Ca forming at the grain boundaries is low melting and therefore causes reduced ductility at temperatures beyond 420 °C [8]. Mg–1Zn–1Ca (ZX11) system is precipitation hardenable [9,10,11] and the increase in hardness after peak aging in the ternary system is much higher than in the individual binary systems, which was attributed to the refined distribution of precipitates. Introducing Ca in Mg–Zn alloys promotes the occurrence of dynamic recrystallization, mostly due to the refining of intermetallic particles and precipitates [12]. High volume percentage of recrystallized grains was obtained in Mg–5.25Zn–0.6Ca alloy that was indirectly extruded at 300 °C using large extrusion ratios [13]. Mg–Zn–Ca alloys were also formed by equal-channel angular pressing (ECAP) and the resulting changes in the texture, microstructure, and other properties have been studied [14]. The higher temperature strength is lower in ECAP material compared with extruded alloy due to grain boundary sliding and grain boundary diffusion. Low speed extrusion of ZX40 alloy produced fine grains and strong basal texture, which gave better mechanical properties [15].
The present investigation is aimed to develop optimum hot working technology for achieving microstructure-property control in the product as well as to evaluate the high temperature strength of Mg–1Zn–1Ca alloy in its cast form. The study will ensure the product’s structural integrity, defect-free microstructure and product reliability, and reproducibility, which are all very critical if this alloy has to be a bio-implant material. The strength of the cast alloy will be measured in compression between 25 °C and 250 °C, which covers much more than the range of application. The hot working technology will be developed by establishing a processing map [16,17], which will reveal the hot workability window(s) and the limiting conditions for undesirable regimes like flow instabilities and cracking. Another objective has been to validate the developed technology by conducting forging experiments to produce a web-rib (cup) shaped component.

2. Processing Map Methodology

The principles and procedures involved in the development of processing maps and their application towards successful forming of a large number of engineering materials are given earlier [16,17]. The processing map is based on the principles of dynamic materials modeling that combine power dissipation map and instability map for a material, which are variation of power dissipation efficiency (η) and instability parameter (ξ), respectively, with respect to temperature and strain rate. In hot deformation, the specimen is considered to dissipate the applied power non-linearly in the form of producing deformation heat and causing microstructural changes. The factor that controls partition of power is strain rate sensitivity (m) of flow stress. The value of m is unity in the case of an ideal linear dissipator, and is compared with the power dissipation occurring instantaneously in a chosen material to derive the efficiency of power dissipation under the applied deformation condition using the equation:
η = 2m/(m + 1)
A power dissipation map is the variation of efficiency of power dissipation with temperature and strain rate and is generally presented in the form of iso-efficiency contours. The efficiency contours forming peaks are akin to hills that are termed as “domains” and they are separated by contours that form valleys in three-dimensional view. A valley is regarded as the change-over between two adjacent domains that have distinct dissipation efficiencies, characteristic of corresponding rate controlling deformation mechanisms. The microstructural examination of the deformed specimens could help to confirm the respective mechanisms involved in different domains.
As large plastic flow is irreversible, flow instabilities may occur when the material experiences non-uniform deformation under certain conditions. Such instabilities typically lead to flow localization, adiabatic shear bands, or cracks in the microstructure. Extremum principles of irreversible thermodynamics were applied to continuum mechanics of large plastic flow [18] to define an instability parameter ξ ( ε ˙ ) :
ξ ( ε ˙ ) = ln [ m / ( m + 1 ) ] ln ε ˙ + m 0
Flow instability occurs where ξ ( ε ˙ ) is negative and a flow instability map can be developed using the variation of the instability parameter (Equation (2)) with temperature and strain rate. As mentioned earlier, it may be superimposed on the power dissipation map to establish a processing map. Such a map is useful in identifying windows, in temperature-strain rate space, towards exploiting “safe” processes like dynamic recrystallization (DRX) that lead to uniform microstructures through large plastic deformation. At the same time, conditions that would lead to flow instabilities can be avoided, thereby the workability may be optimized.

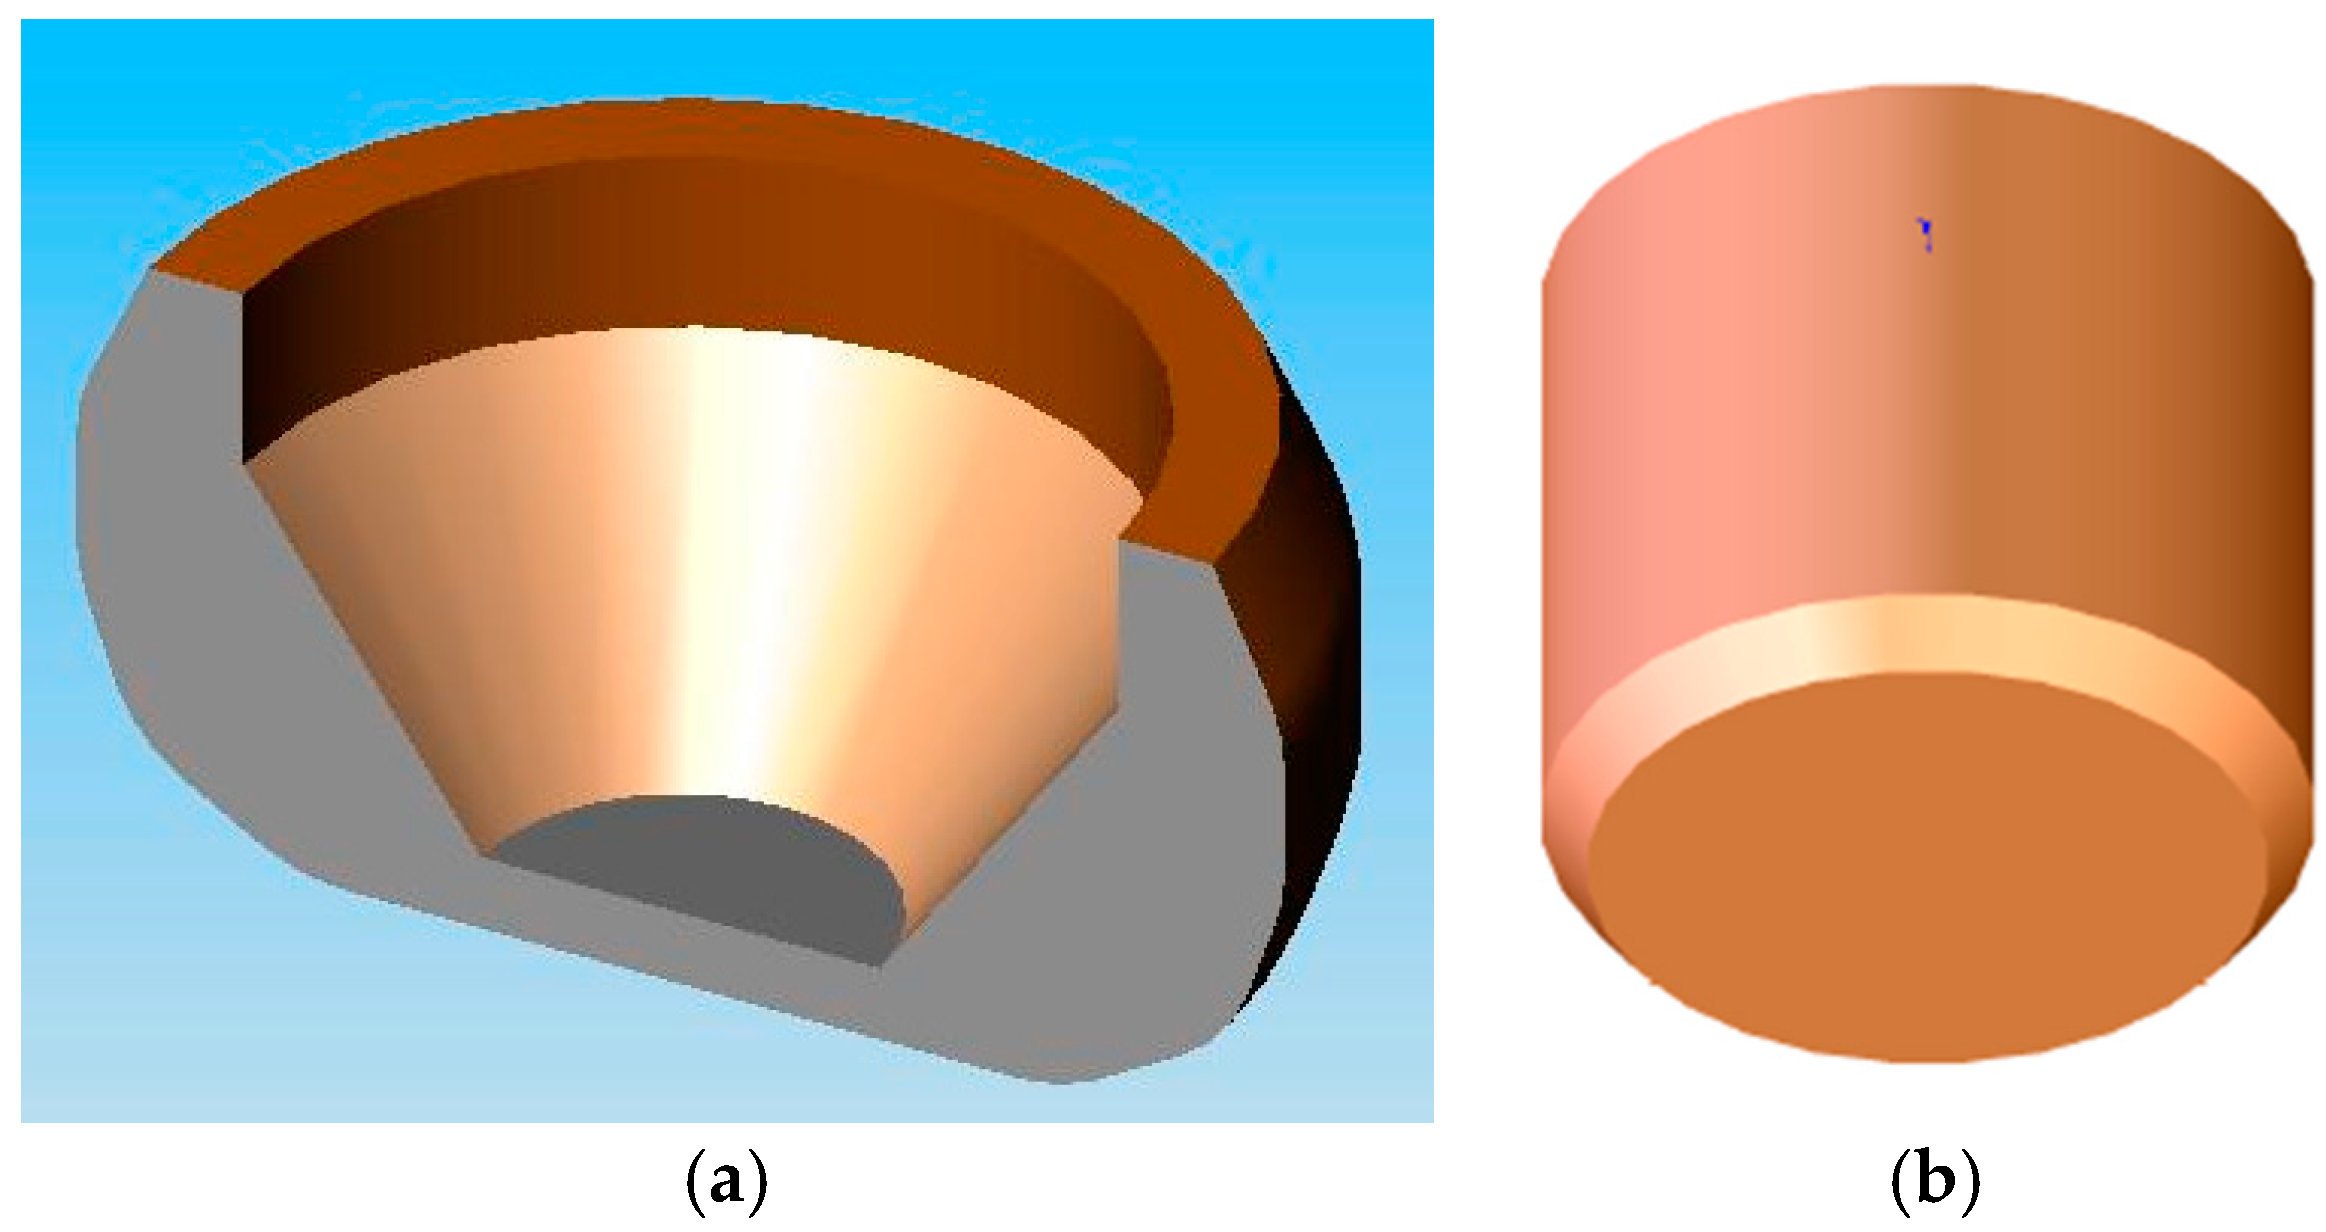
3. Experimental Section

Conventional permanent mold casting method was employed to cast Mg–1Zn–1Ca (ZX11) alloy using pure elemental metals. The melt was kept at 720 °C with a cover of SF6 (sulfur hexafluoride) and Argon gas mixture and poured into a preheated permanent mold. Cylindrical specimens of 10 mm diameter and 15 mm height were machined from the cast billet for compression testing. A hole of 1 mm in diameter was drilled at mid-height of the specimen to reach a depth of 5 mm. A chromel-alumel Pro-K type thermocouple (RS Components Ltd., Corby, UK) was inserted in the hole to reach the center for controlling and measuring the instantaneous specimen temperature during the compression test. The compression testing procedure was described in details earlier [19].
For ultimate compressive strength (UCS) measurement, the specimens were tested in the lower temperature range 25–250 °C at a nominal strain rate of 0.0001 s−1 until the specimen has undergone fragmentation/fracture or reached a strain of 1. The specimens were also subjected to uniaxial compression in the strain rate range of 0.0003–10 s−1 and temperature range of 260–500 °C for the purpose of developing processing maps. The actuator speed of the servo hydraulic machine (M1000/RK; Dartec Ltd., Bournemouth, UK) was controlled using an exponential decay function to achieve the desired constant true strain rate during the entire compression test. Grease was used as a carry medium for dry graphite powder that was used as the lubricant in all the compression tests. The tests were conducted until a true strain of about 1 was reached, followed by quenching of the deformed specimen in water. Standard equations were used to estimate the true stress and true strain values from the recorded load-stroke data. In addition, the measured adiabatic temperature rise was used to arrive at the flow stress values at the actual temperature. This was achieved by fitting smooth curves of flow stress data as a function of temperature for all the relevant strain rates at small intervals of strain. Using these corrected flow stress values at various temperatures and strain rates for the chosen strains, corresponding processing maps have been derived, as described earlier [16,17]. For examining the microstructures of the deformed specimens, they were cut in the center along the compression axis. The cut specimens were mounted for polishing to produce scratch-free surfaces before etching with an aqueous solution containing 3% picric acid.
Experimental details of the forging experiments designed for validating the various features revealed by the processing map were reported in an earlier publication [20] and a brief description was included later in the relevant section.

4. Results and Discussion

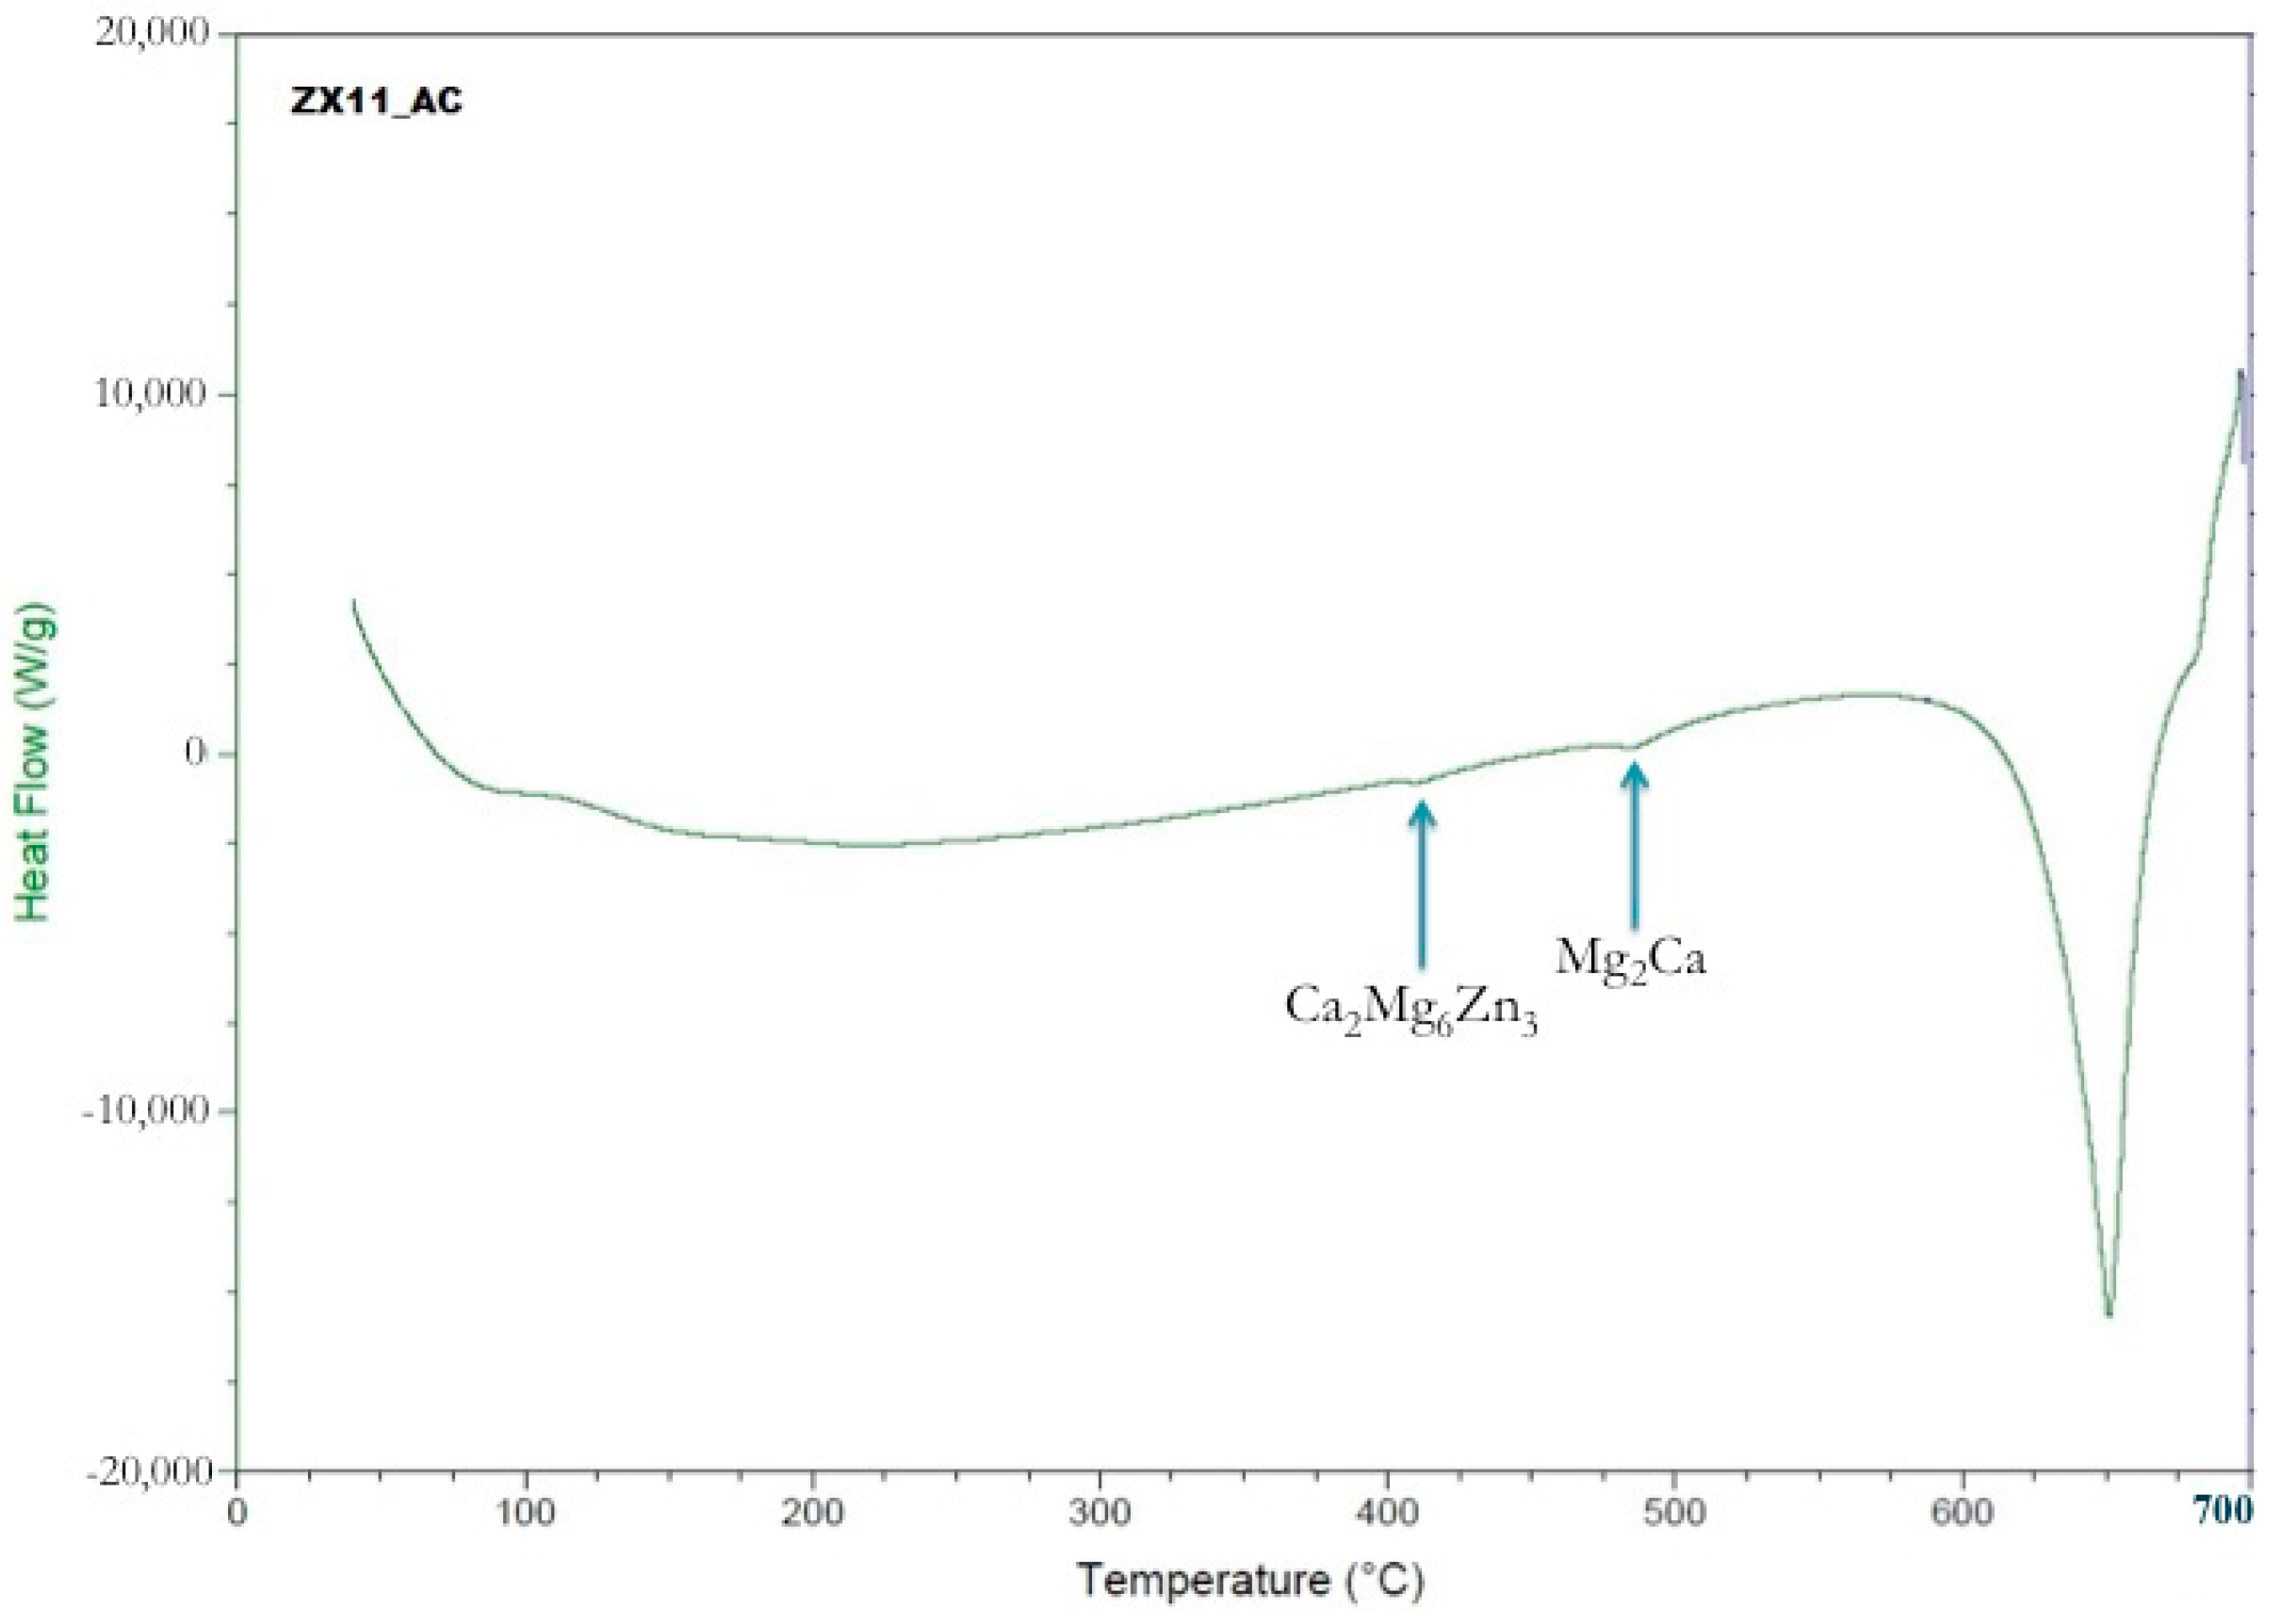
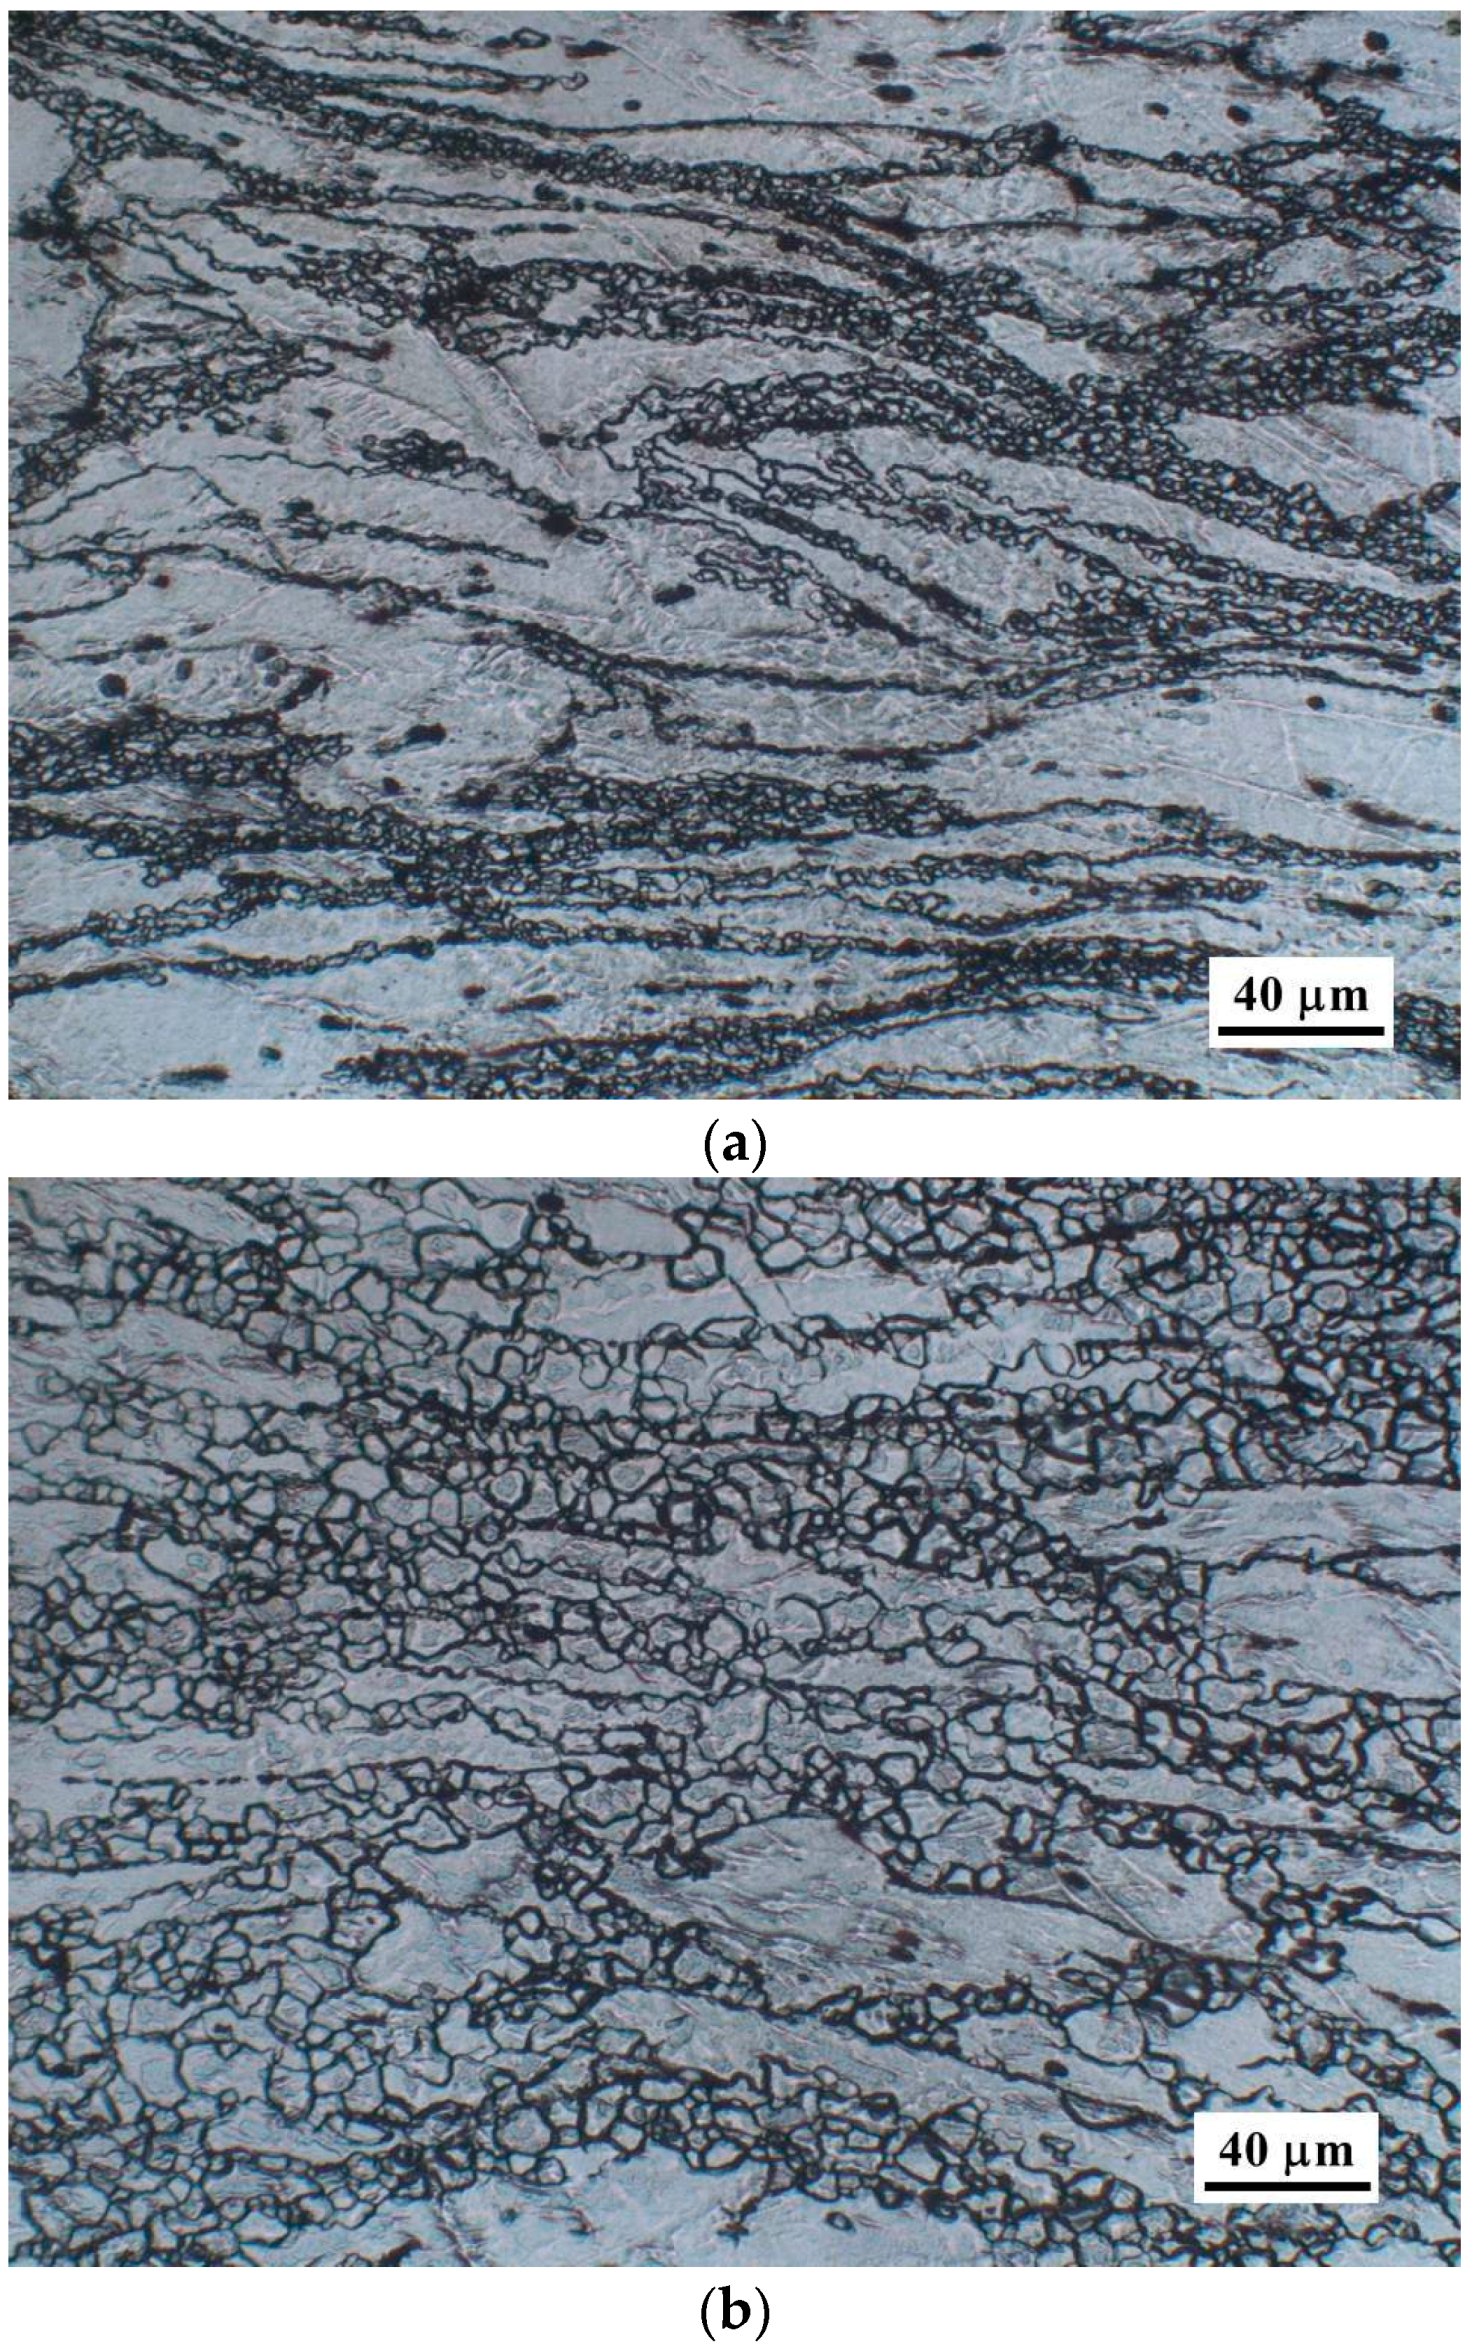
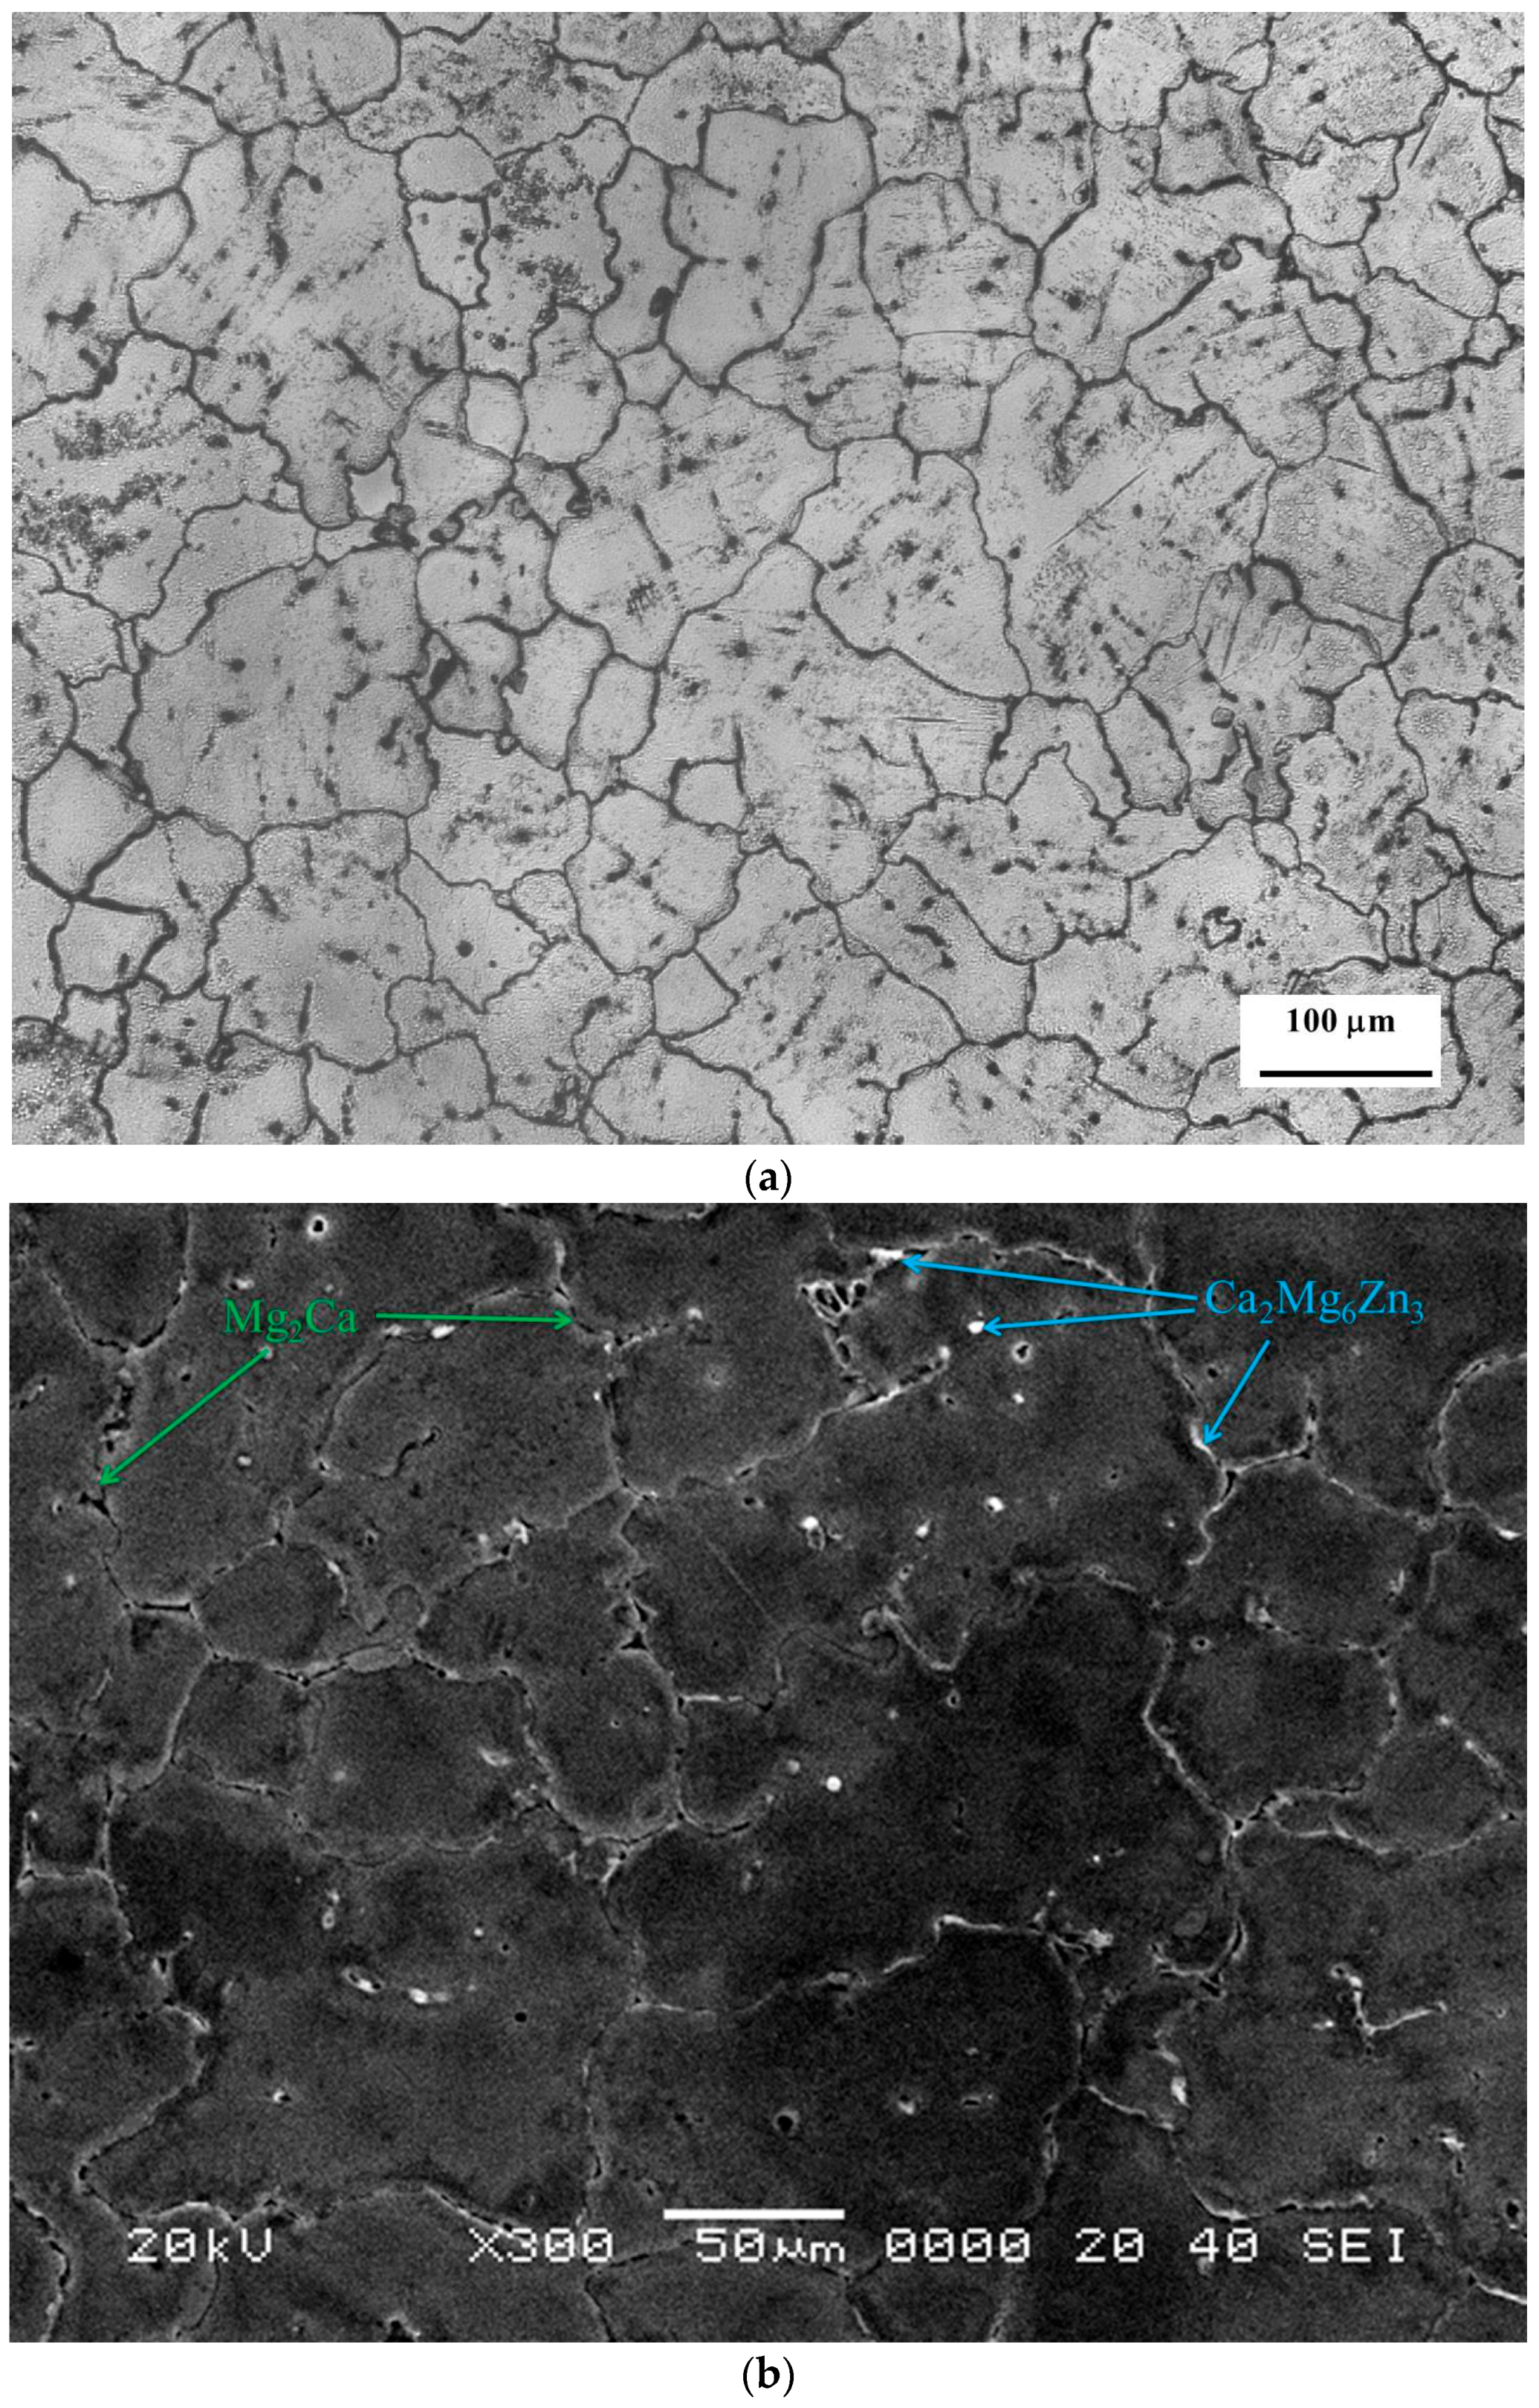
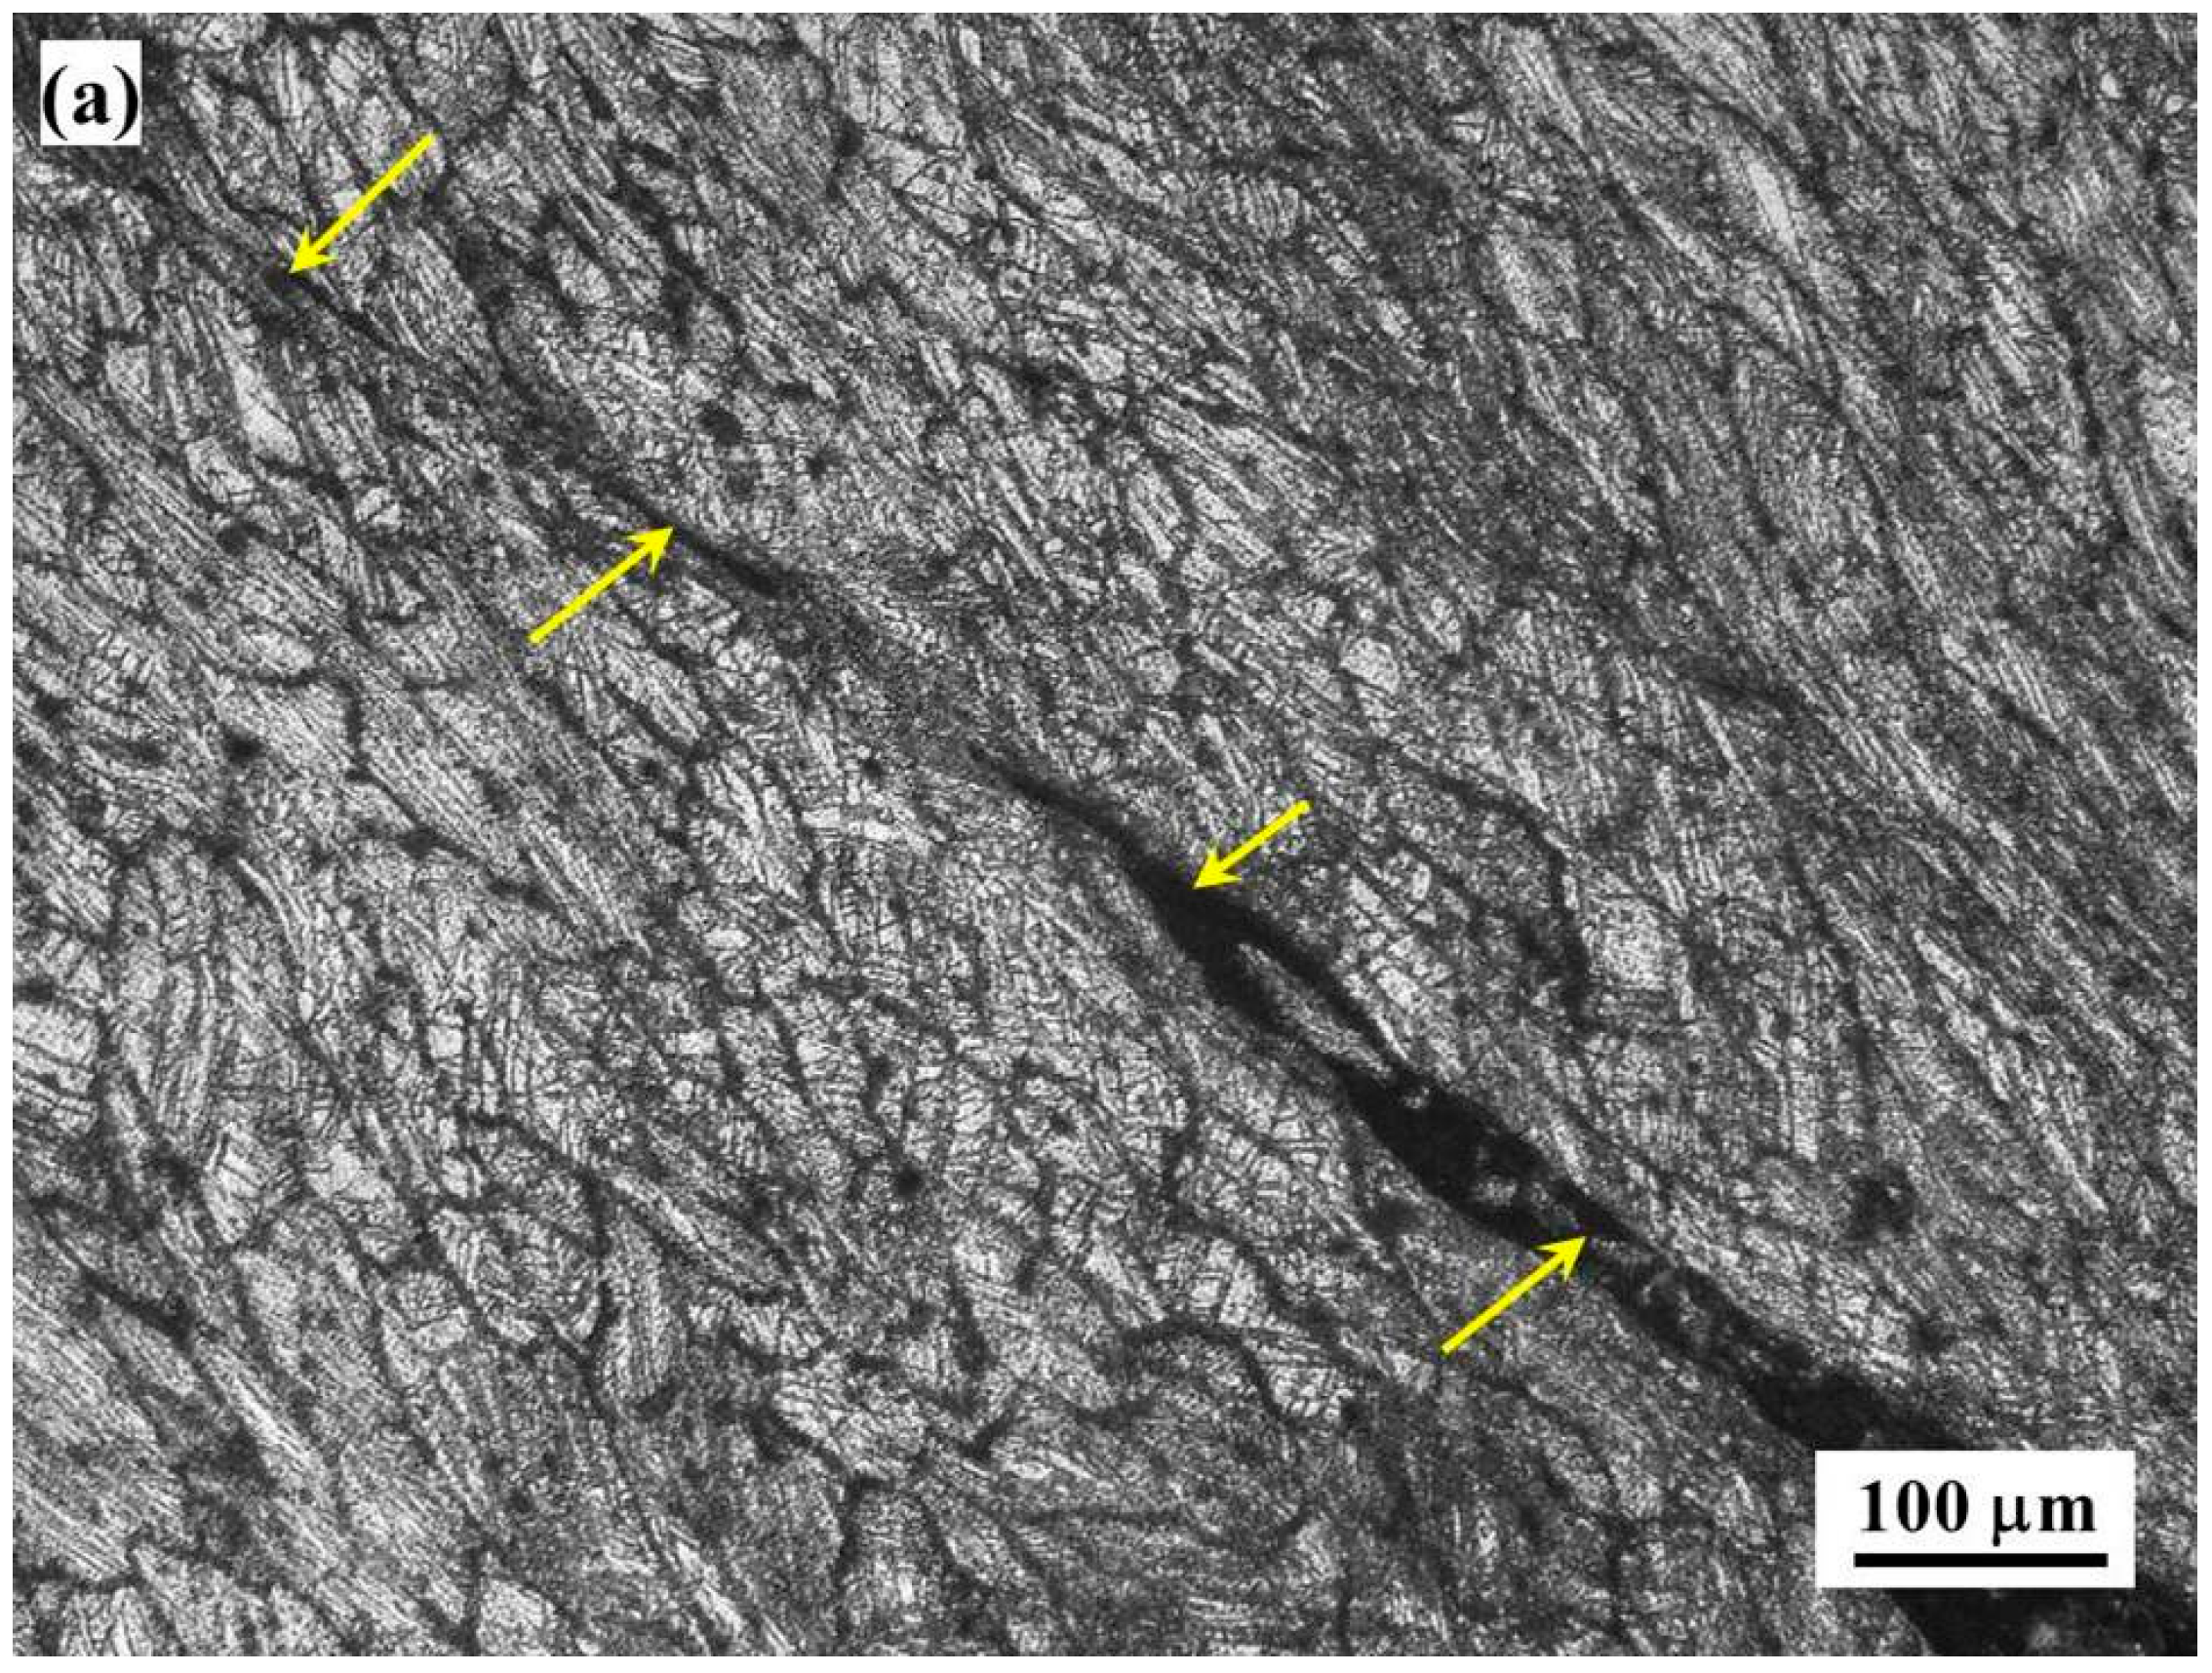
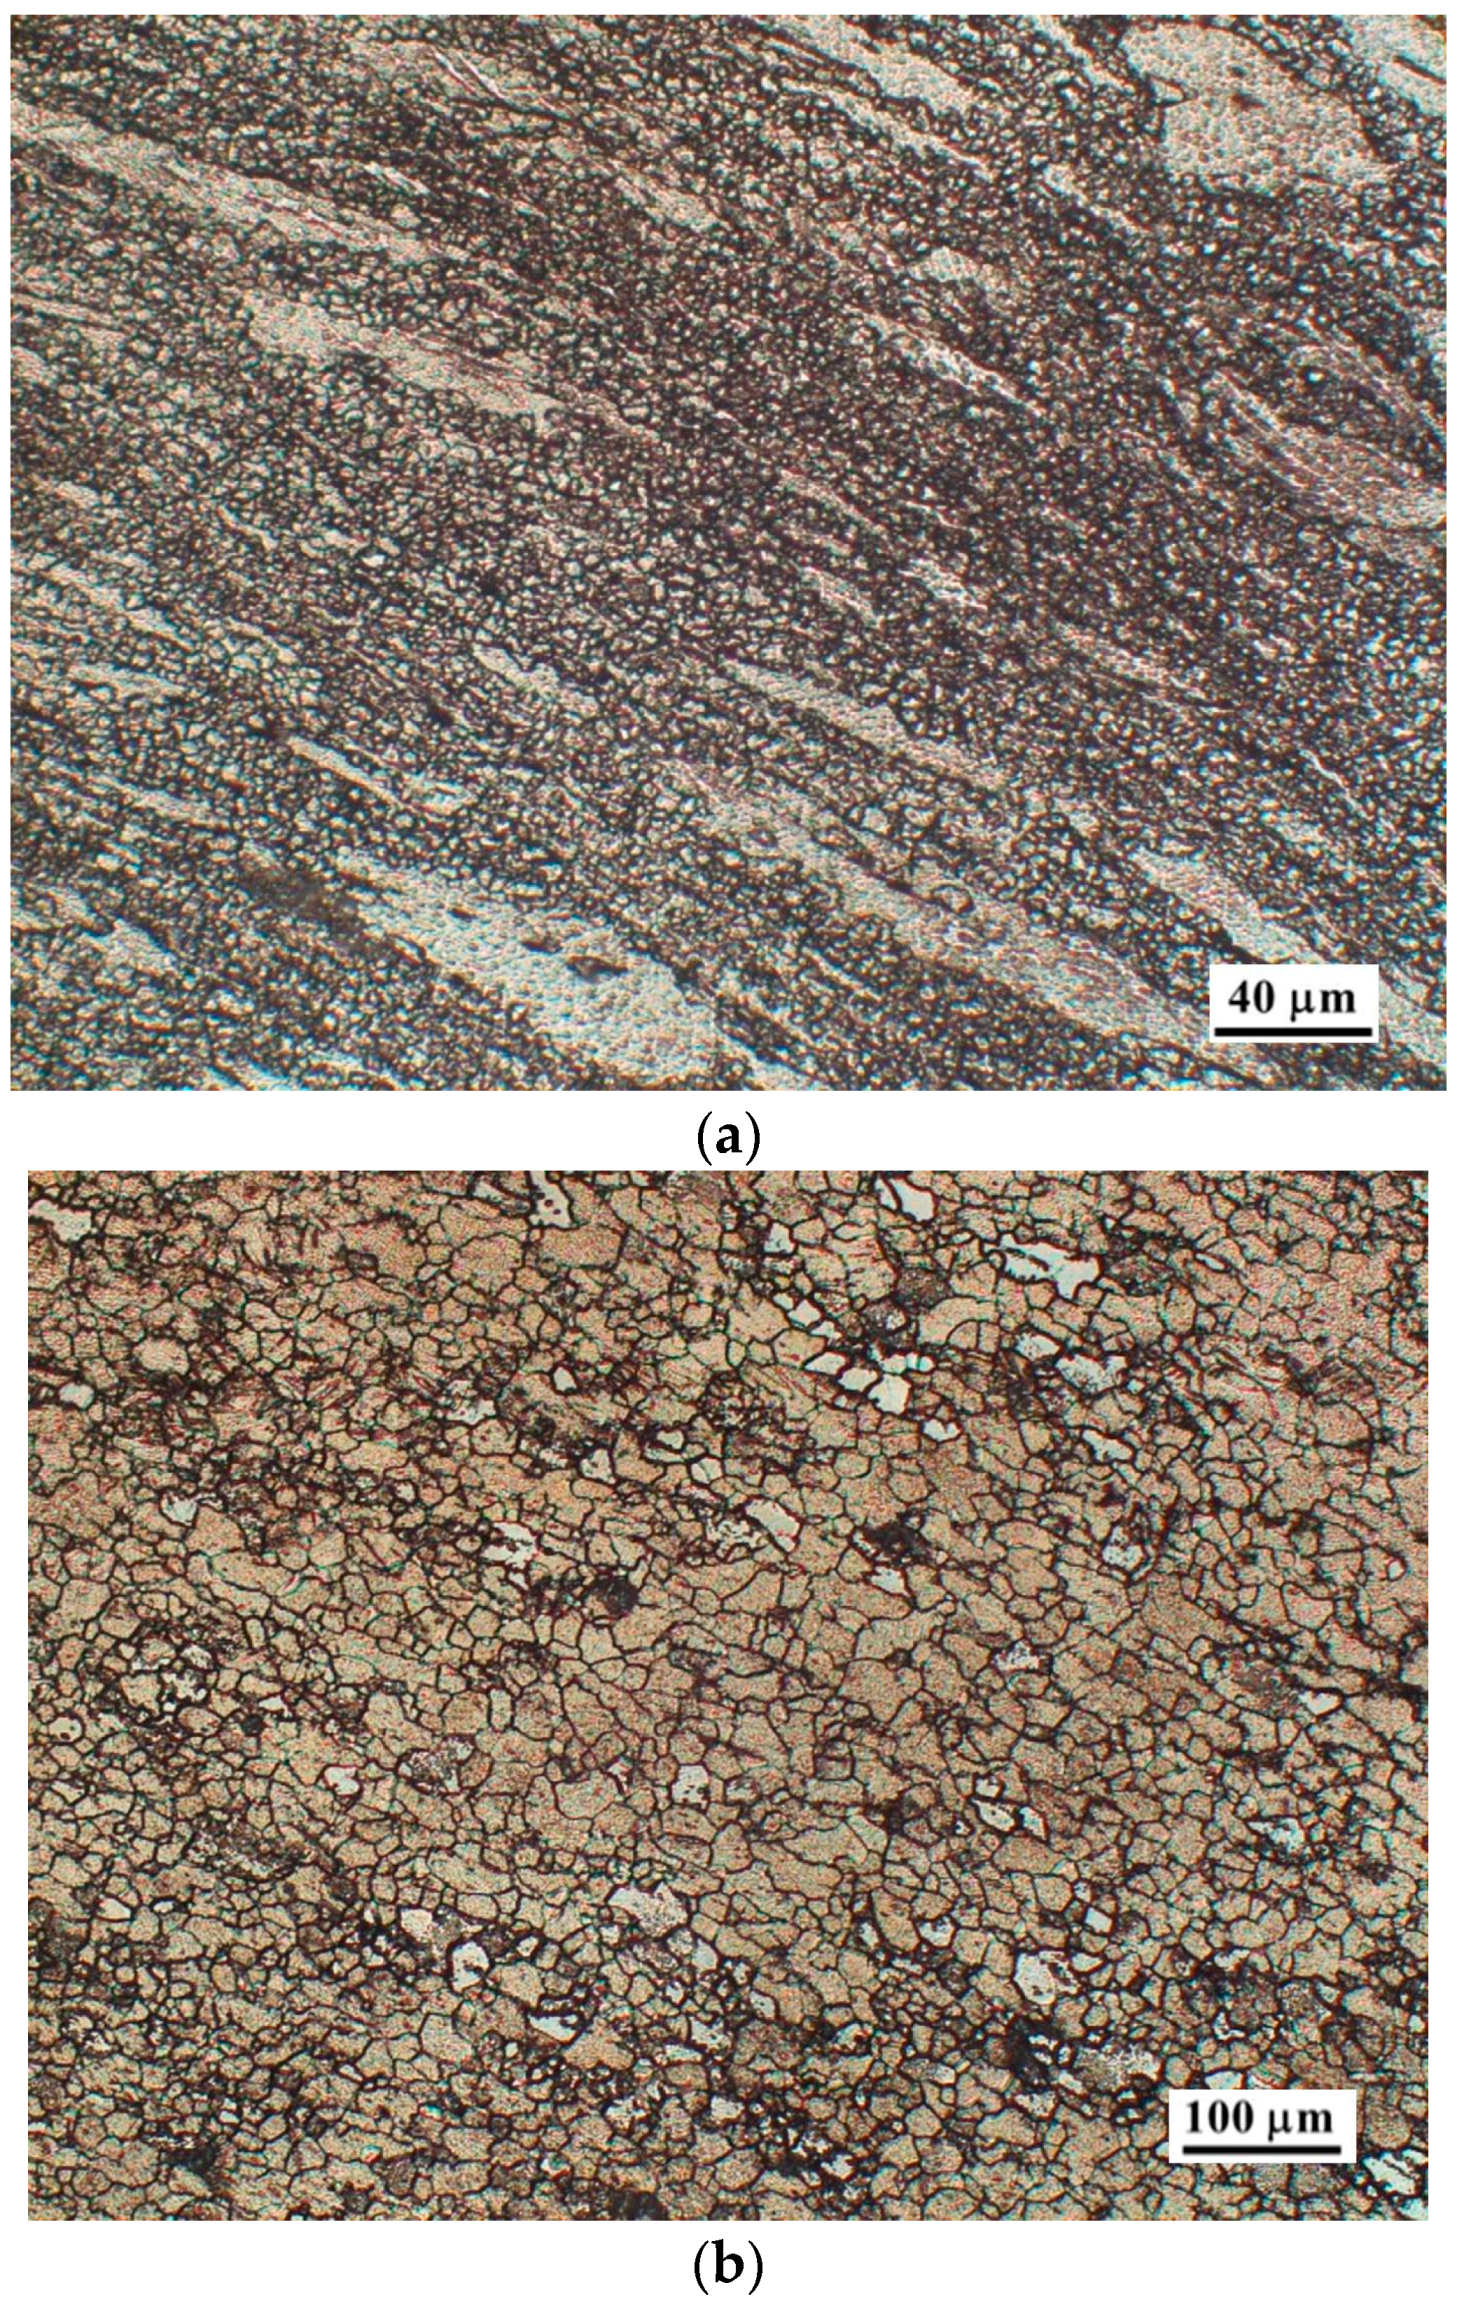
4.1. Microstructure of Cast Alloy

The optical and SEM (scanning electron microscope) micrographs of ZX11 alloy in the initial cast condition are shown in Figure 1a,b respectively. The average grain diameter is about 120 µm, which is much smaller than those usually observed in other cast Mg alloys (in the range of 500 µm). The microstructure exhibited two different phases present in the matrix which have been identified to be: (1) Ternary Ca2Mg6Zn3 present both at the grain boundary and grain interior and (2) Mg2Ca present mostly at the grain boundaries. These have been confirmed using energy dispersive spectroscopy (EDS; JEOL 5600 SEM, JEOL Ltd., Tokyo, Japan) analysis and have also been found in conformity with the characterization by Katsarou et al. [8]. Differential Scanning Calorimetry (DSC; TA Instruments, New Castle, DE, USA) trace obtained on as-cast ZX11alloy is shown in Figure 2, which exhibited small blimps at 420 °C and 490 °C indicating dissolution of phases. The first one was attributed to the ternary Ca2Mg6Zn3 phase and the second one to the binary Mg2Ca phase.

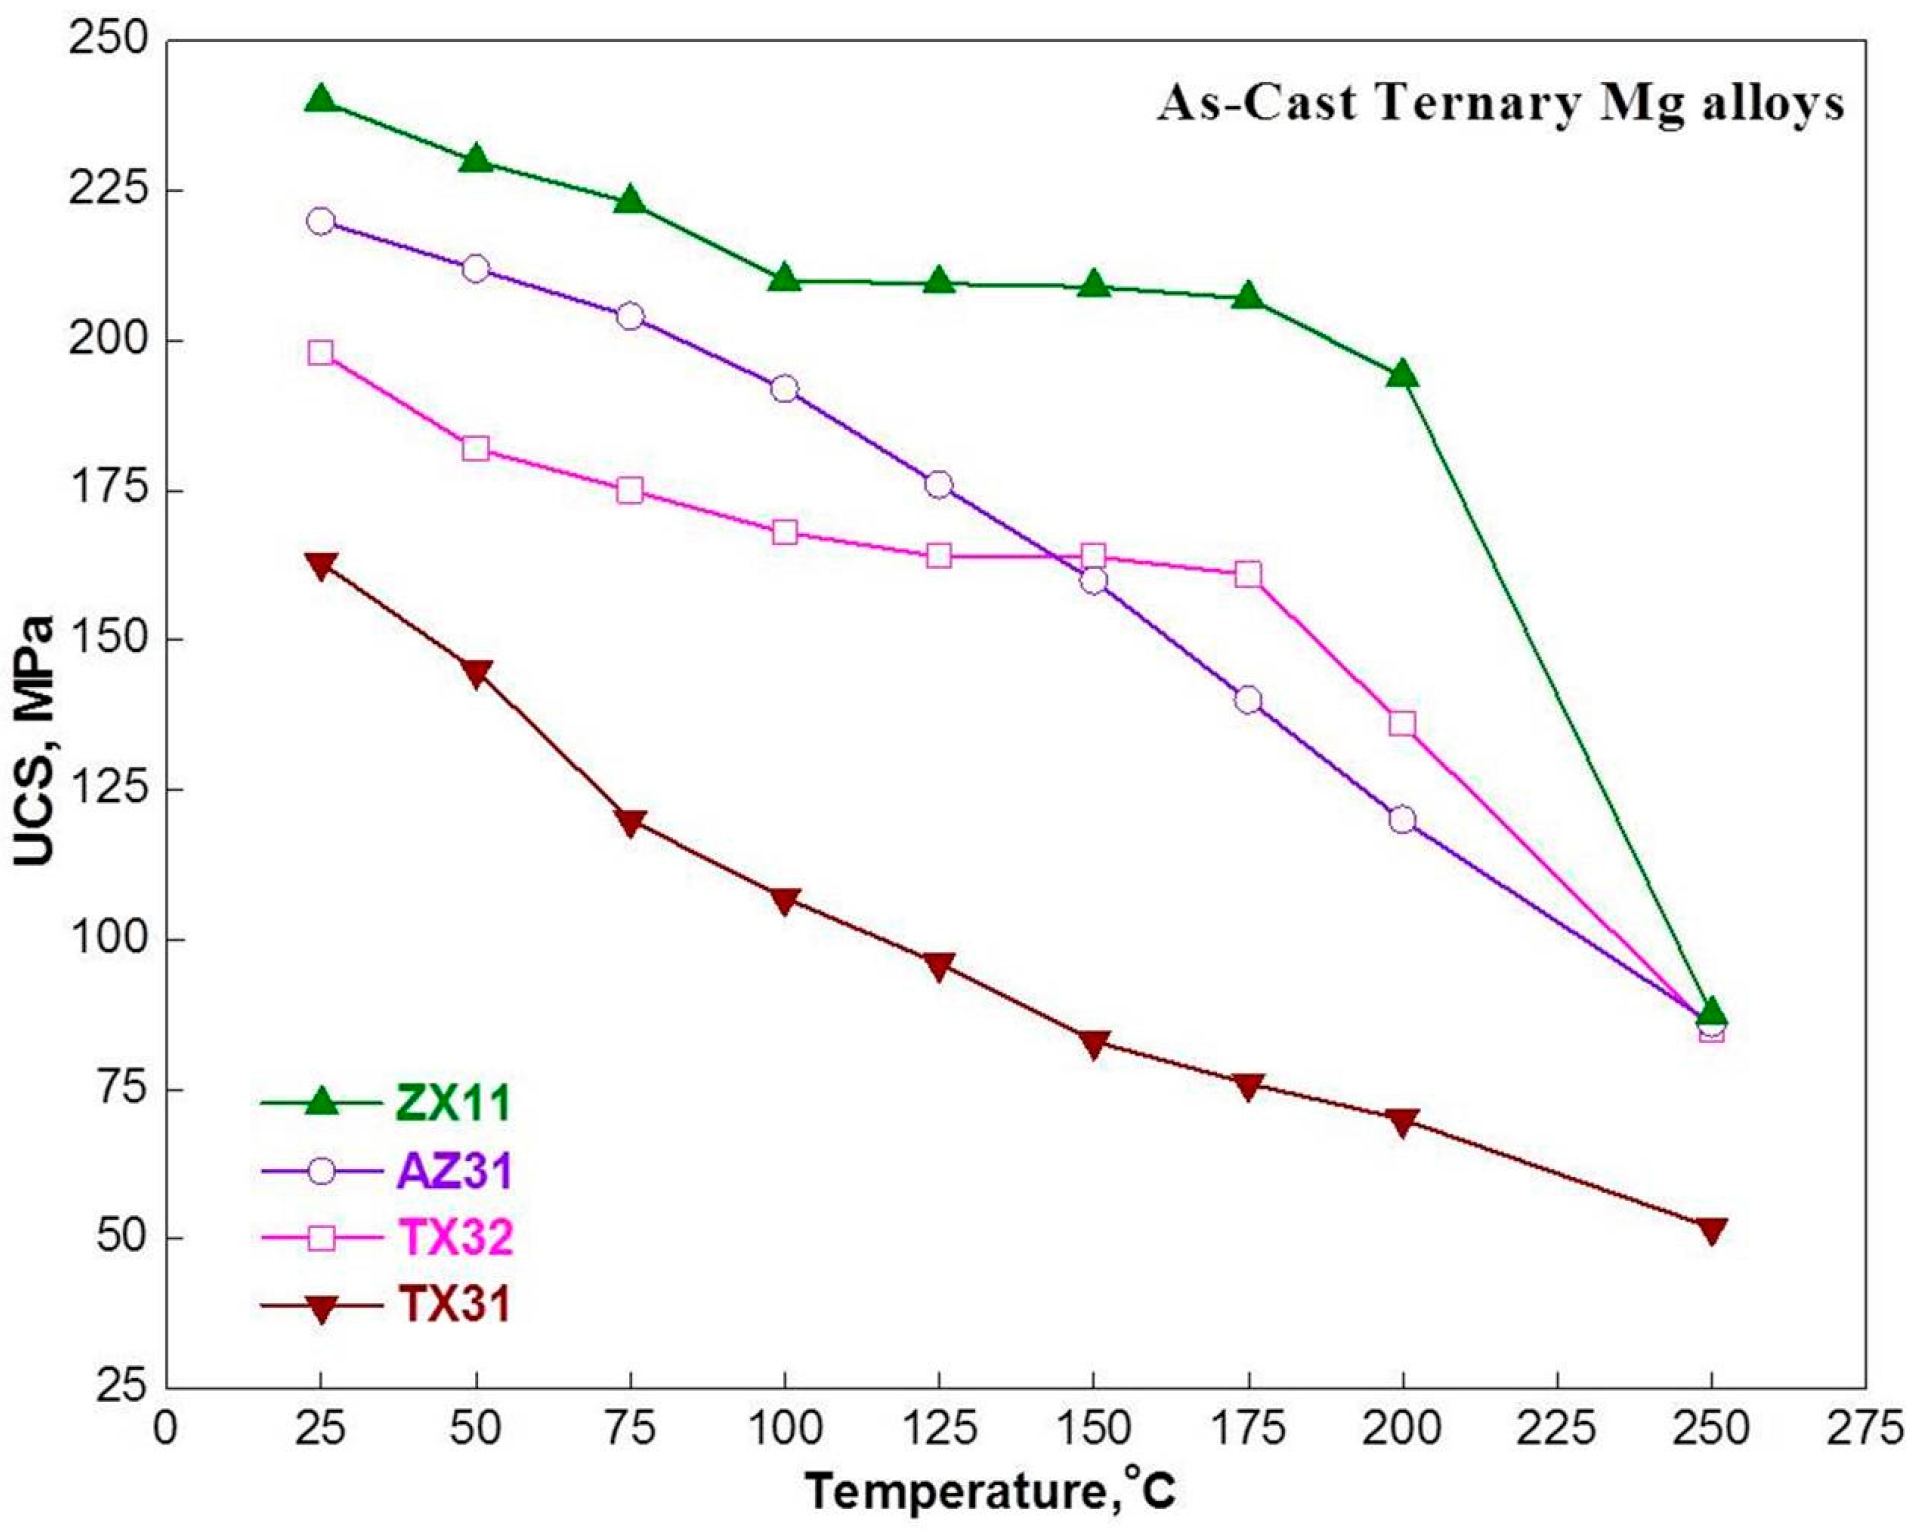
4.2. Ultimate Compressive Strength

The ultimate compressive strengths (UCS) obtained for the alloy at different temperatures are shown in Figure 3, along with those obtained on the popular wrought alloy AZ31 [21] and the newer alloys TX31 and TX32 [22] for comparison. First of all, it is clearly seen that as-cast ZX11 alloy has the highest strength among all the four alloys below 200 °C and this strength can further be improved by about 50% through precipitation hardening treatment [9,11]. Secondly, the strength variation with temperature exhibits a plateau in the temperature range 75–200 °C, which is similar to that shown by creep-resistant alloy TX32 [21]. The appearance of a plateau was attributed to the intermetallic phases present at the grain boundaries whose sliding is restricted, thereby reducing the creep rate. Thirdly, ZX11 alloy is much stronger than the popular commercial alloy AZ31 and the experimental alloy TX31. It is well known that prismatic slip get active in Mg alloys at temperatures above 225 °C, which increases the number of available independent slip systems that cause more slip activity. Also, Zn addition lowers CRSS for prismatic slip and promotes its extensive occurrence [5,6]. Due to the ease of prismatic slip with increase in temperature, drop in compressive strength is significant beyond 200 °C for ZX11 alloy.

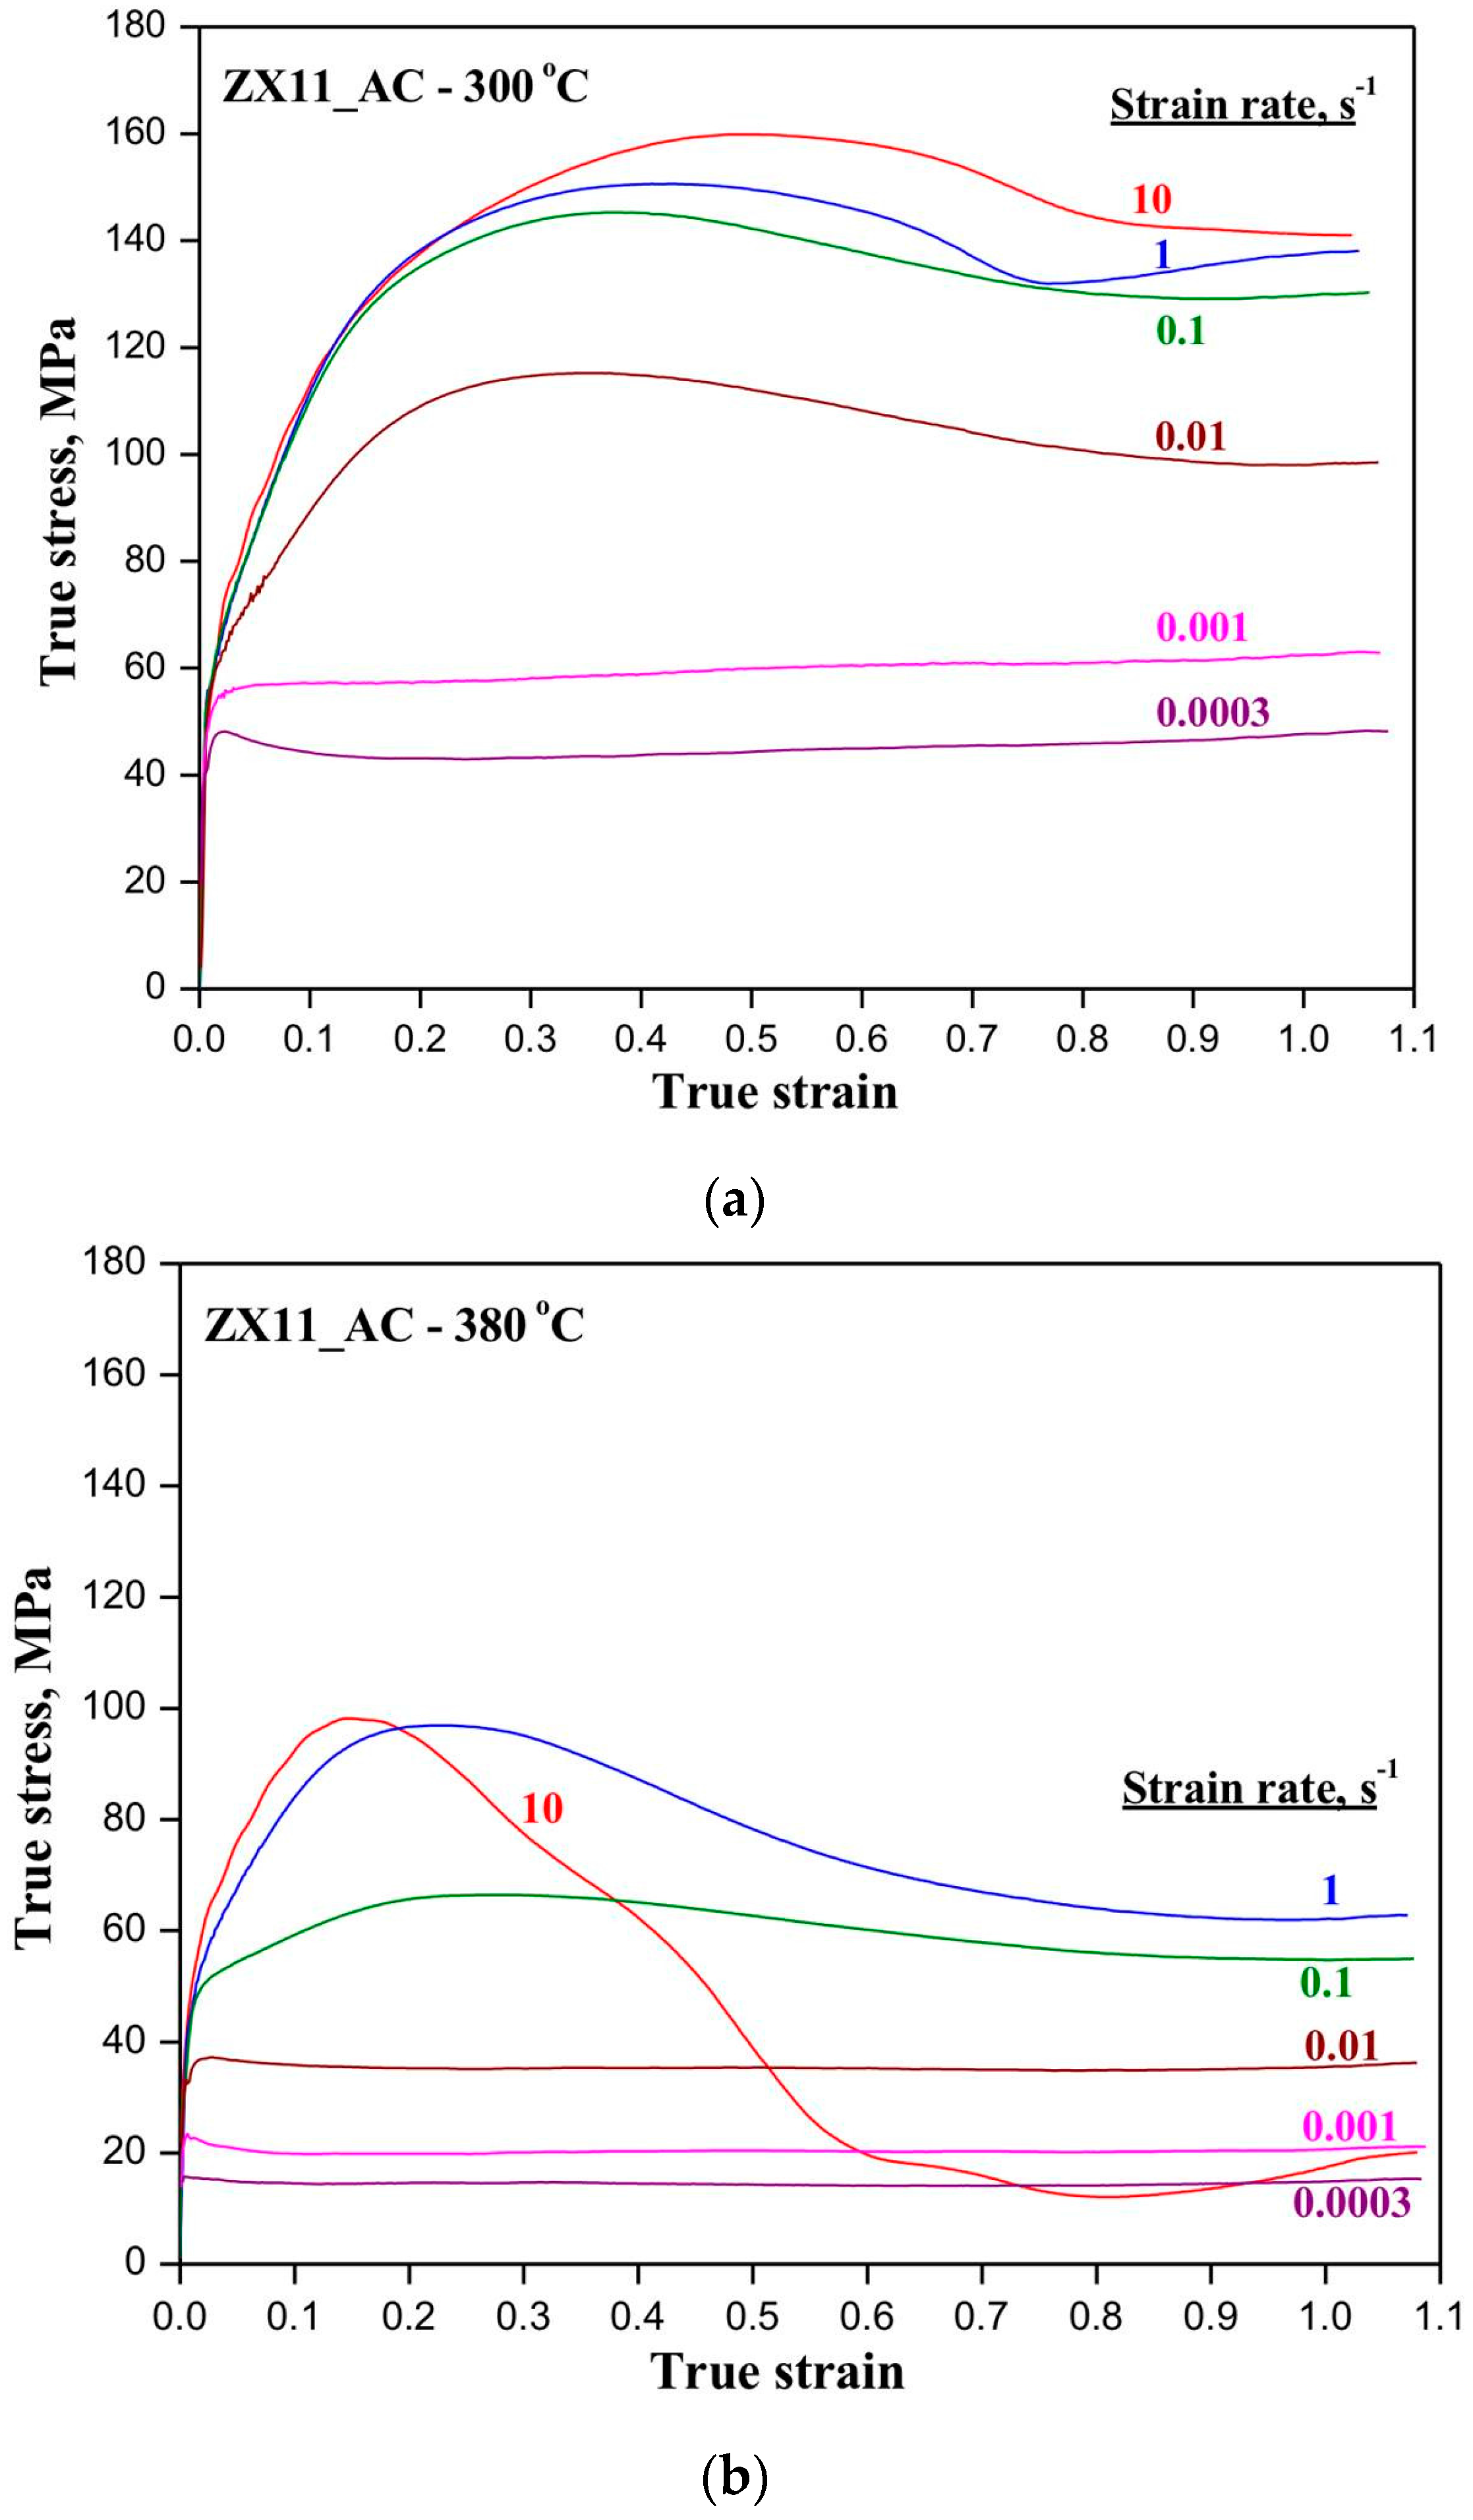
4.3. Stress-Strain Behavior
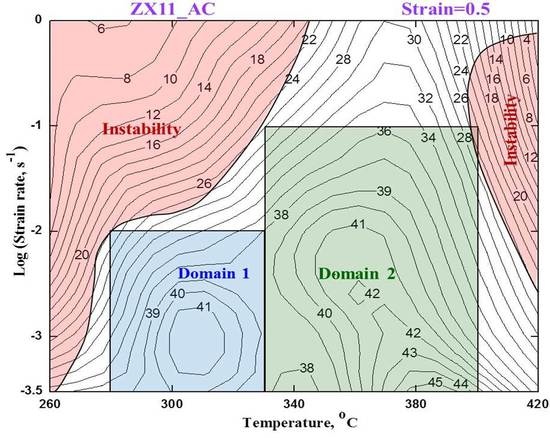
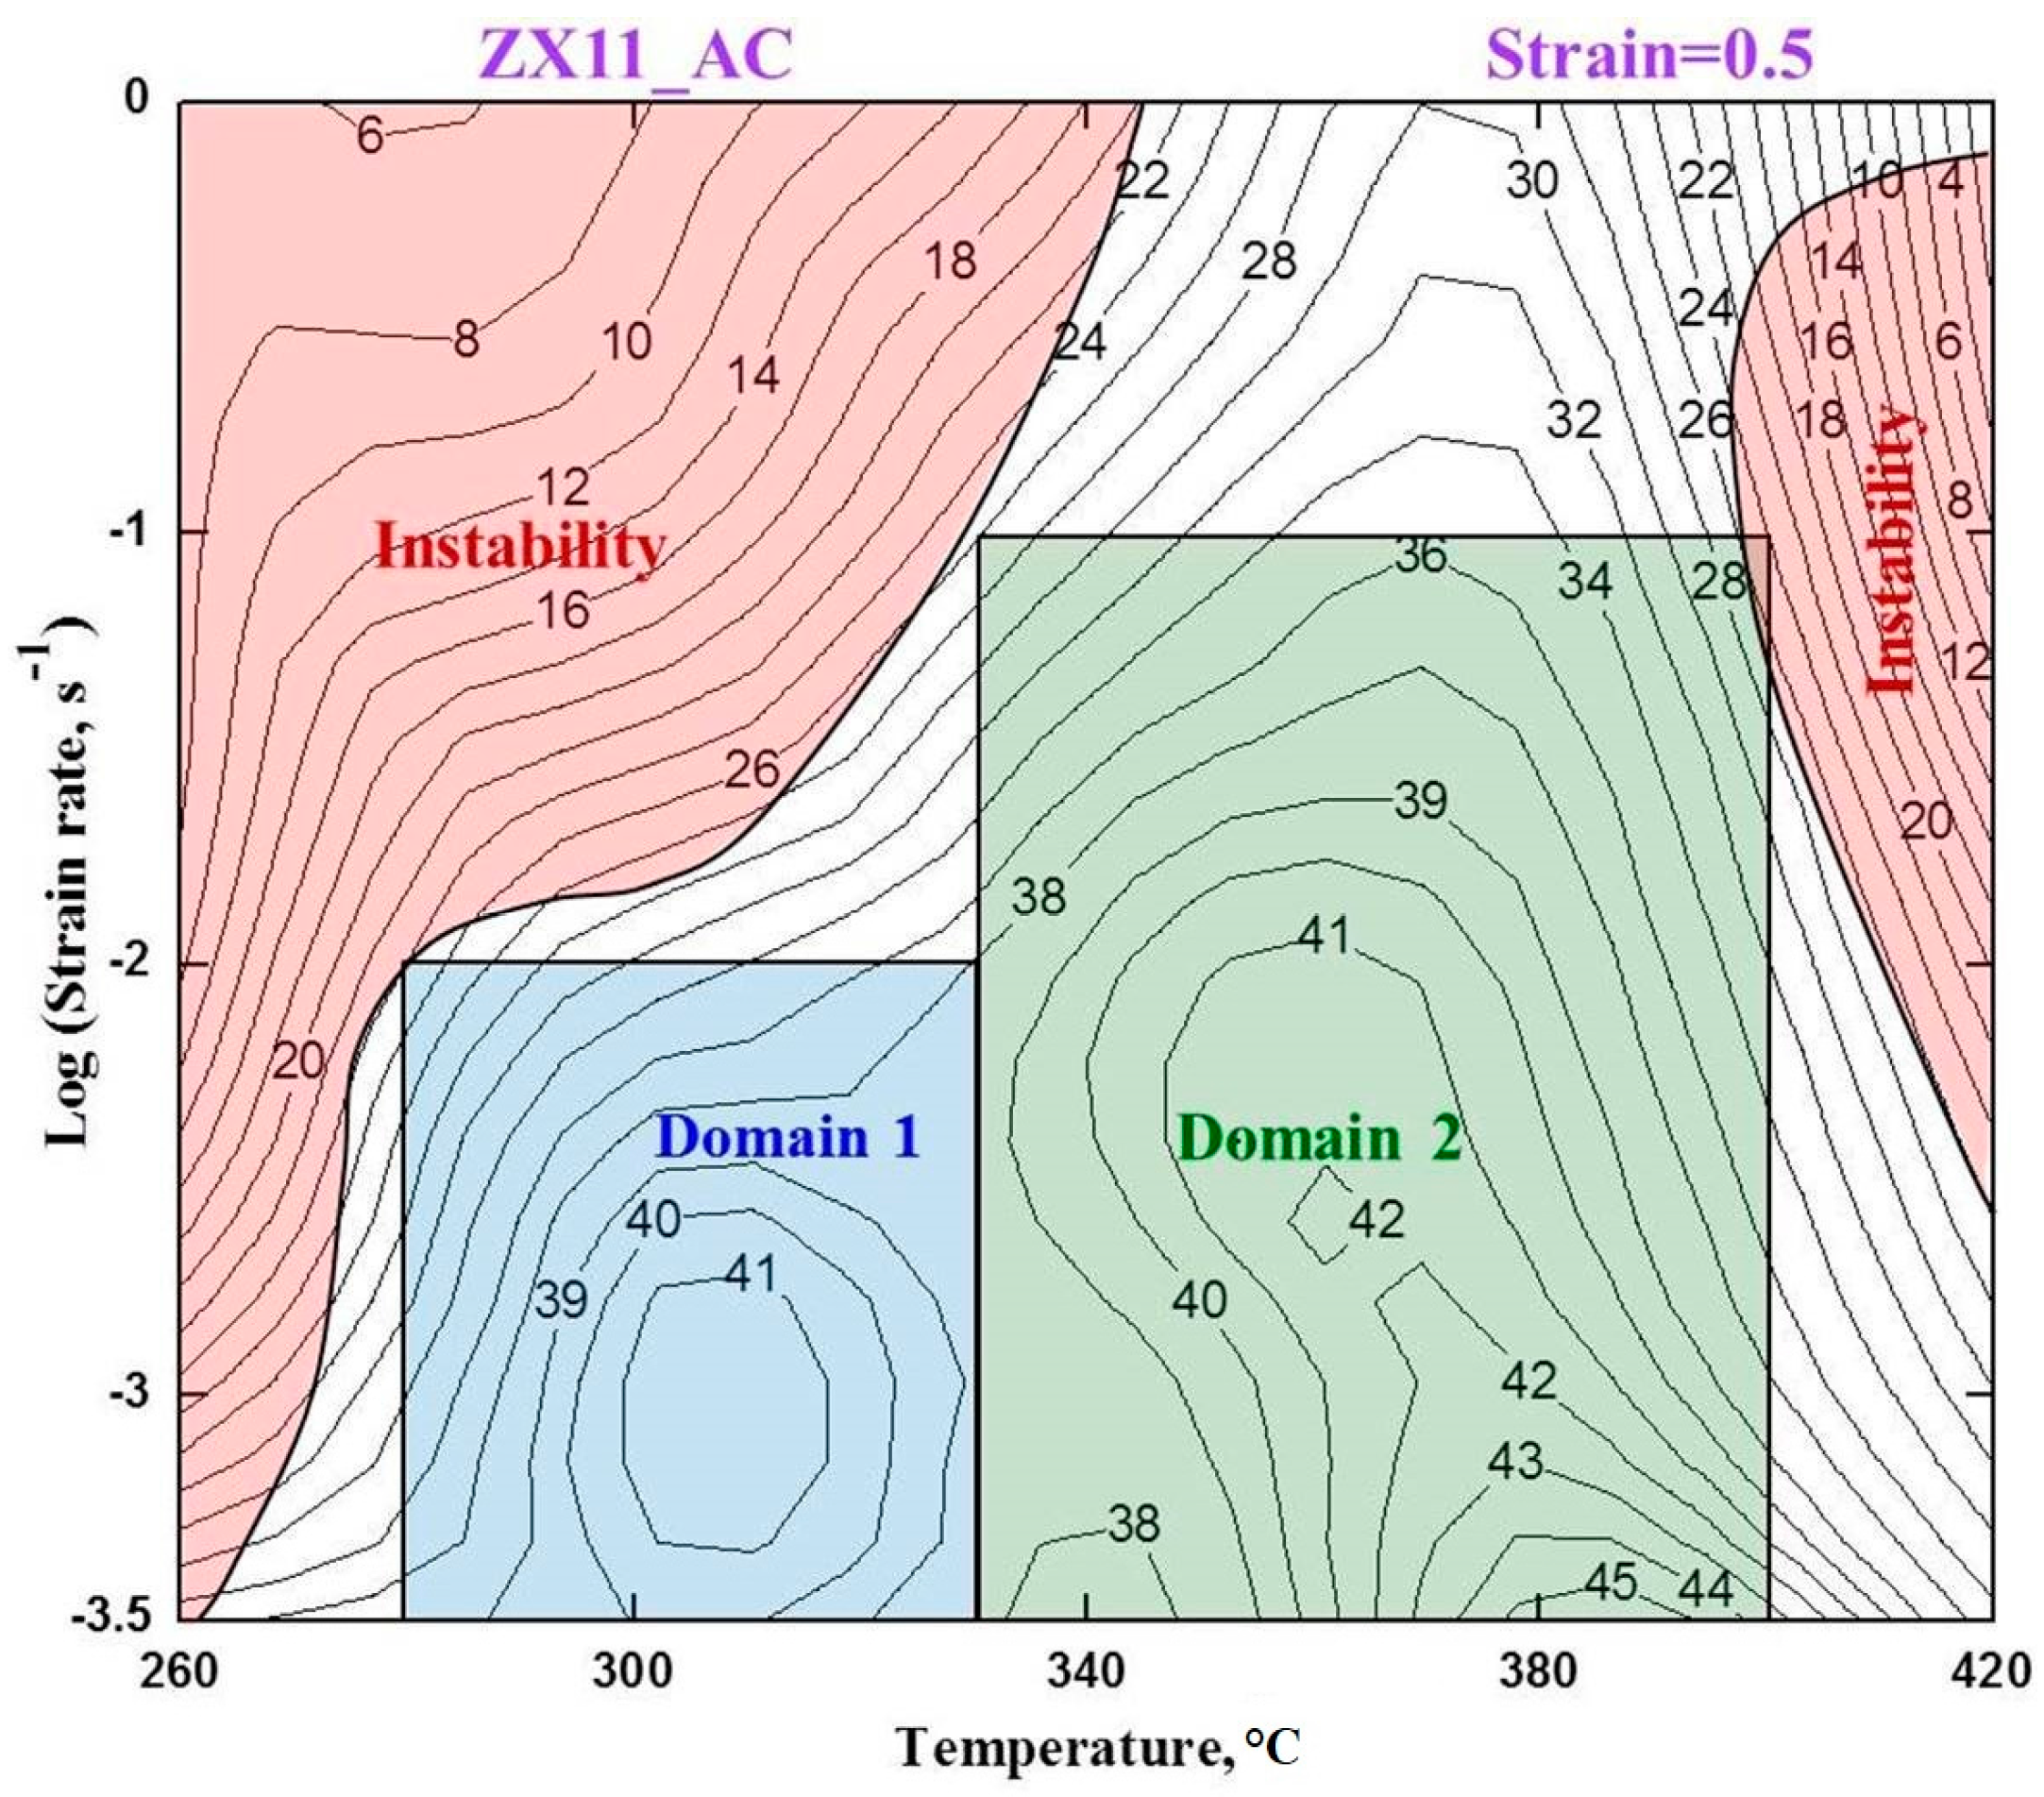
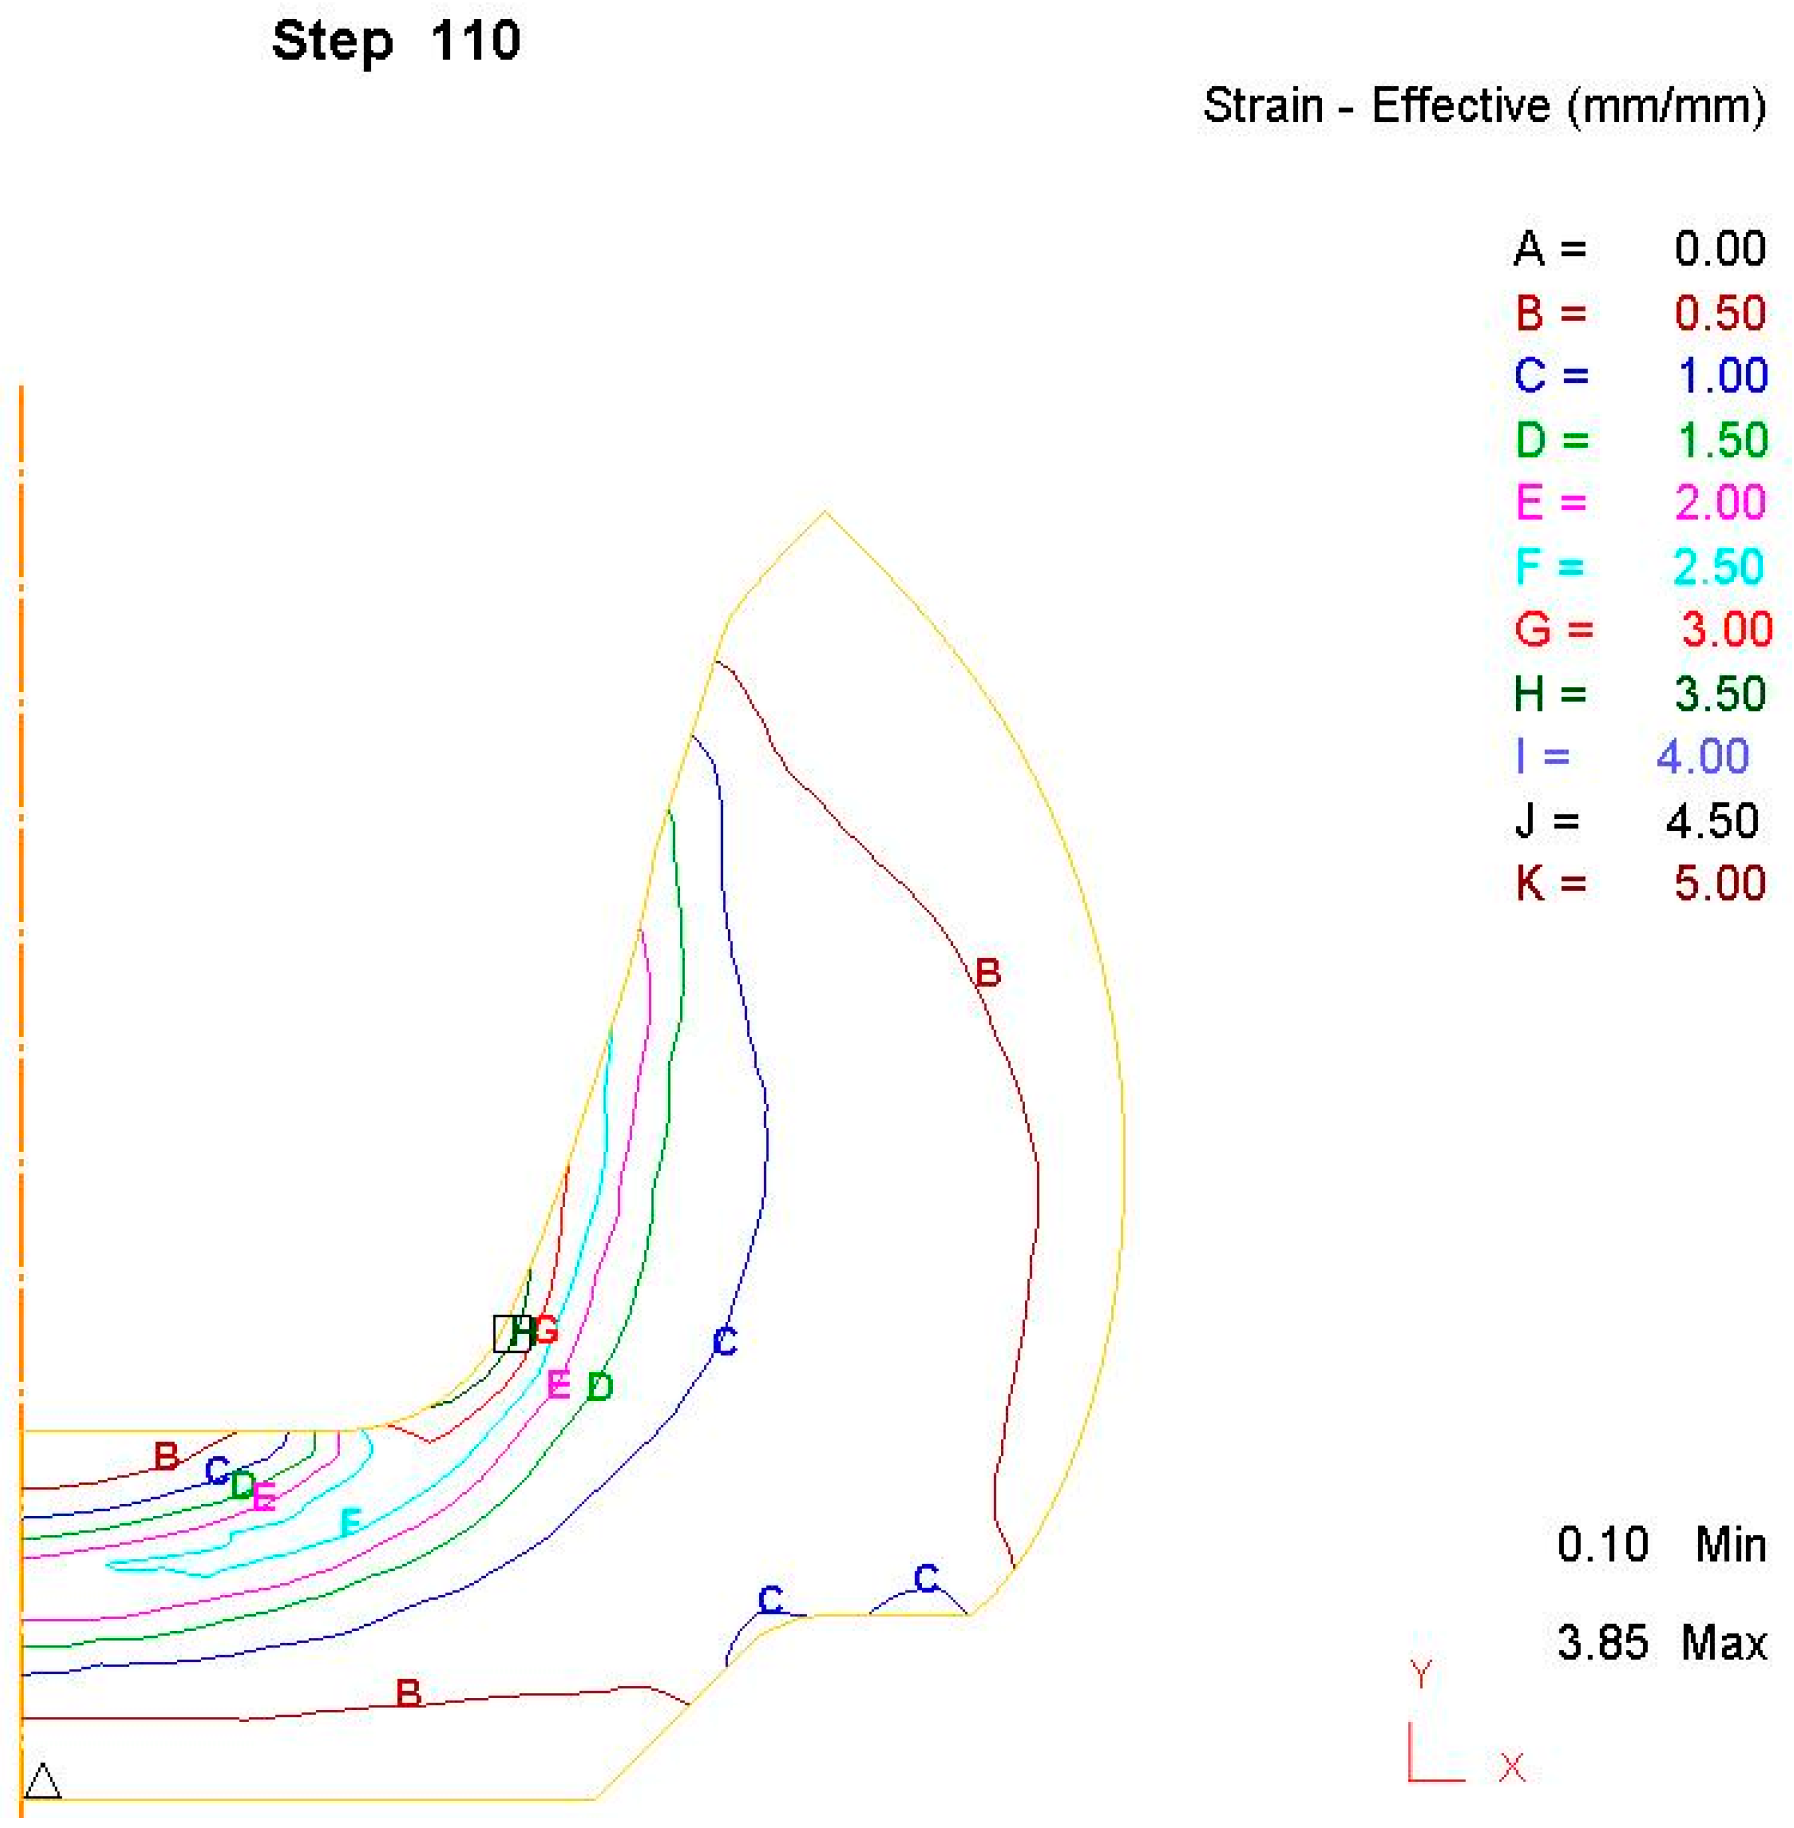
True stress–true strain values obtained through compression testing at 300 °C and 380 °C and at six strain rates are shown in Figure 4a,b respectively. Referring to Figure 4a, the curves exhibit flow-softening behavior at higher strain rates (≥0.01 s−1), while nearly steady-state behavior can be observed at lower strain rates. At higher temperatures, as shown in Figure 4b for 380 °C, this change-over has occurred at a strain rate of 0.01 s−1. The specimens compressed under conditions where flow softening has occurred were either heavily sheared or fragmented. The appearances of the deformed specimens at different test conditions are shown in Figure 5. The specimens tested at 460 °C and 500 °C have fragmented at strain rates ≥0.01 s−1 and hence no meaningful flow stress data could be recorded. Thus, the data obtained only in the temperature range 260–420 °C and strain rate range 0.0003–1 s−1 was used for developing a processing map for the alloy.

4.4. Processing Map

Figure 6 shows the processing map developed for ZX11 alloy corresponding to a strain value of 0.5. The power dissipation efficiency values in percent are marked on the contours. The map exhibits two windows of workability, which are denoted as Domain 1 (280–330 °C and 0.0003–0.01 s−1), and Domain 2 (330–400 °C and 0.0003–0.1 s−1). The corresponding peak efficiencies are ~41% at 310 °C/0.001 s−1, and ~45% at 380 °C/0.0003 s−1. The microstructures obtained on specimens compressed at 300 °C/0.001 s−1 (Domain 1) and 380 °C/0.01 s−1 (Domain 2) are shown in Figure 7a,b respectively. These exhibit fine dynamically recrystallized grains, the volume of which is higher at higher temperatures, suggesting that dynamic recrystallization occurs in these domains. At lower temperatures (Domain 1), basal slip {0001}<11 2 ¯ 0> is highly active due to its lower CRSS is highly favored, and some contribution from prismatic slip {10 1 ¯ 0}<11 2 ¯ 0> is also required to satisfy the necessity of five independent slip systems for continuity of deformation across the grains. With increase in temperature, CRSS for prismatic slip decreases, leading to increased contribution in Domain 2. It is reported that addition of Zn to Mg lowers the CRSS for prismatic slip [6,7], which further enhances its contribution for deformation in Domain 2. The climb process is the main recovery mechanism when plastic deformation is mainly due to basal slip and/or prismatic slip while cross-slip gets restricted due to lack of intersecting slip planes and lower stacking fault energy on the basal planes [23].

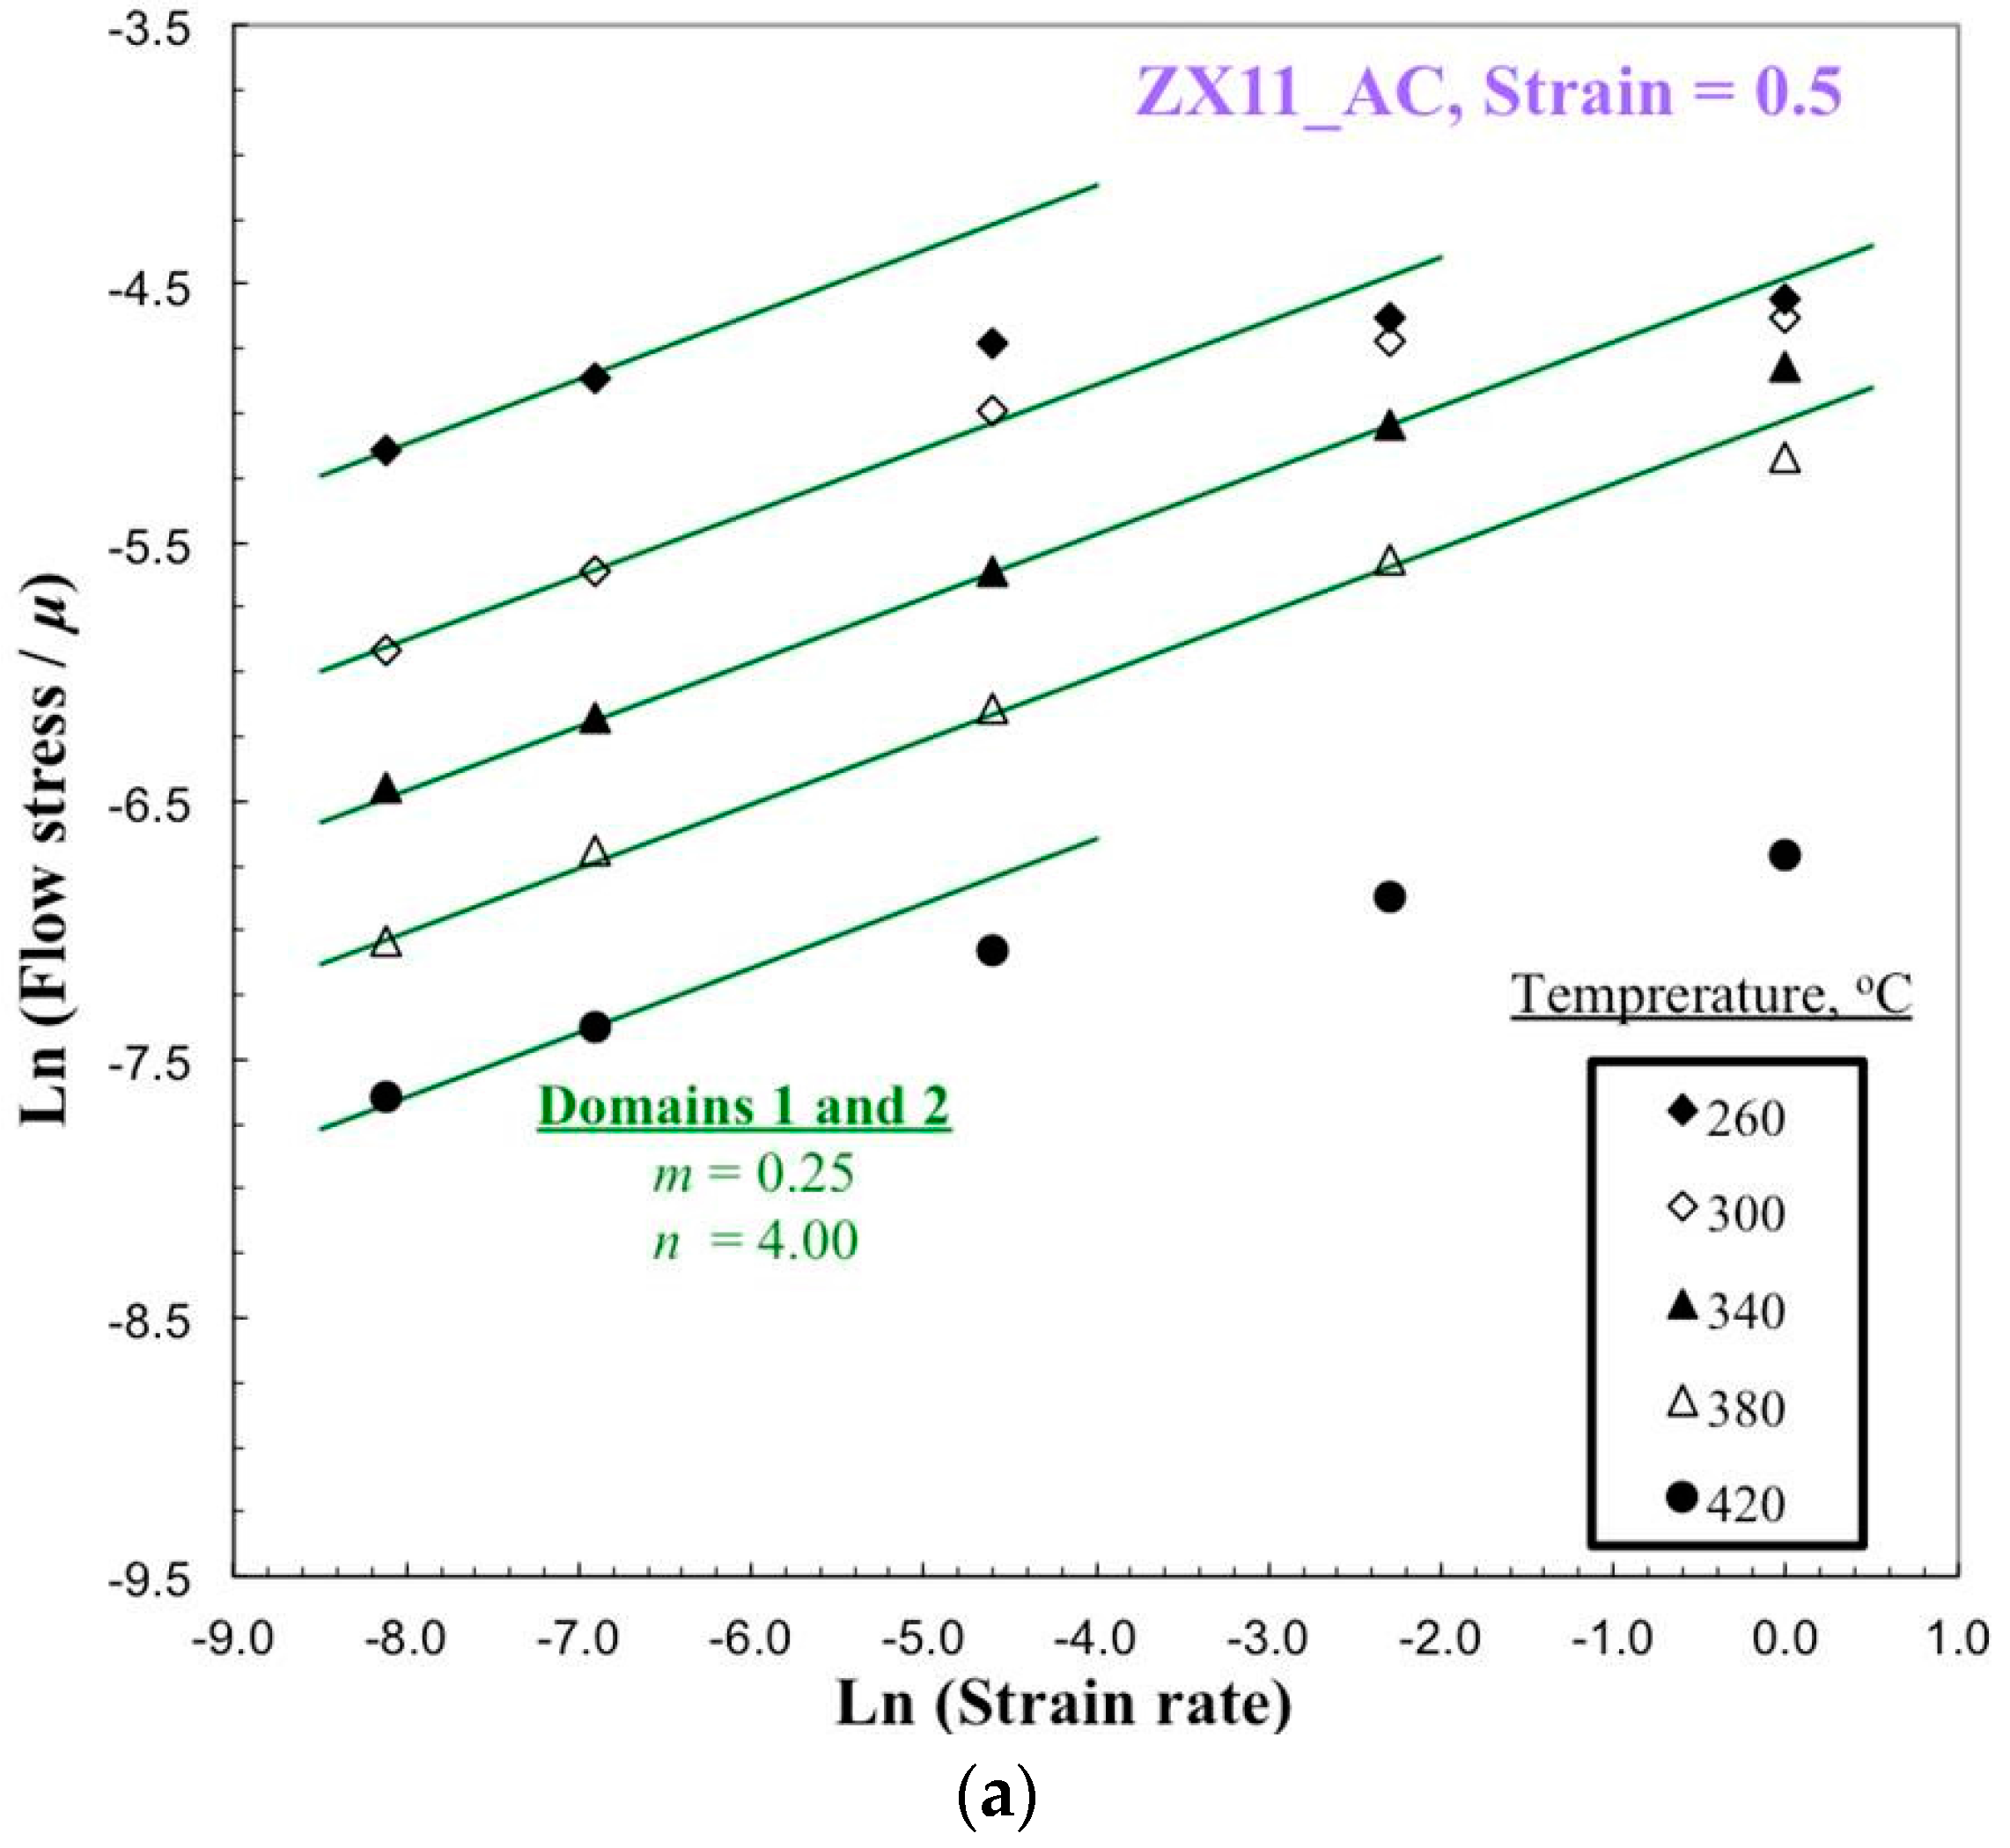
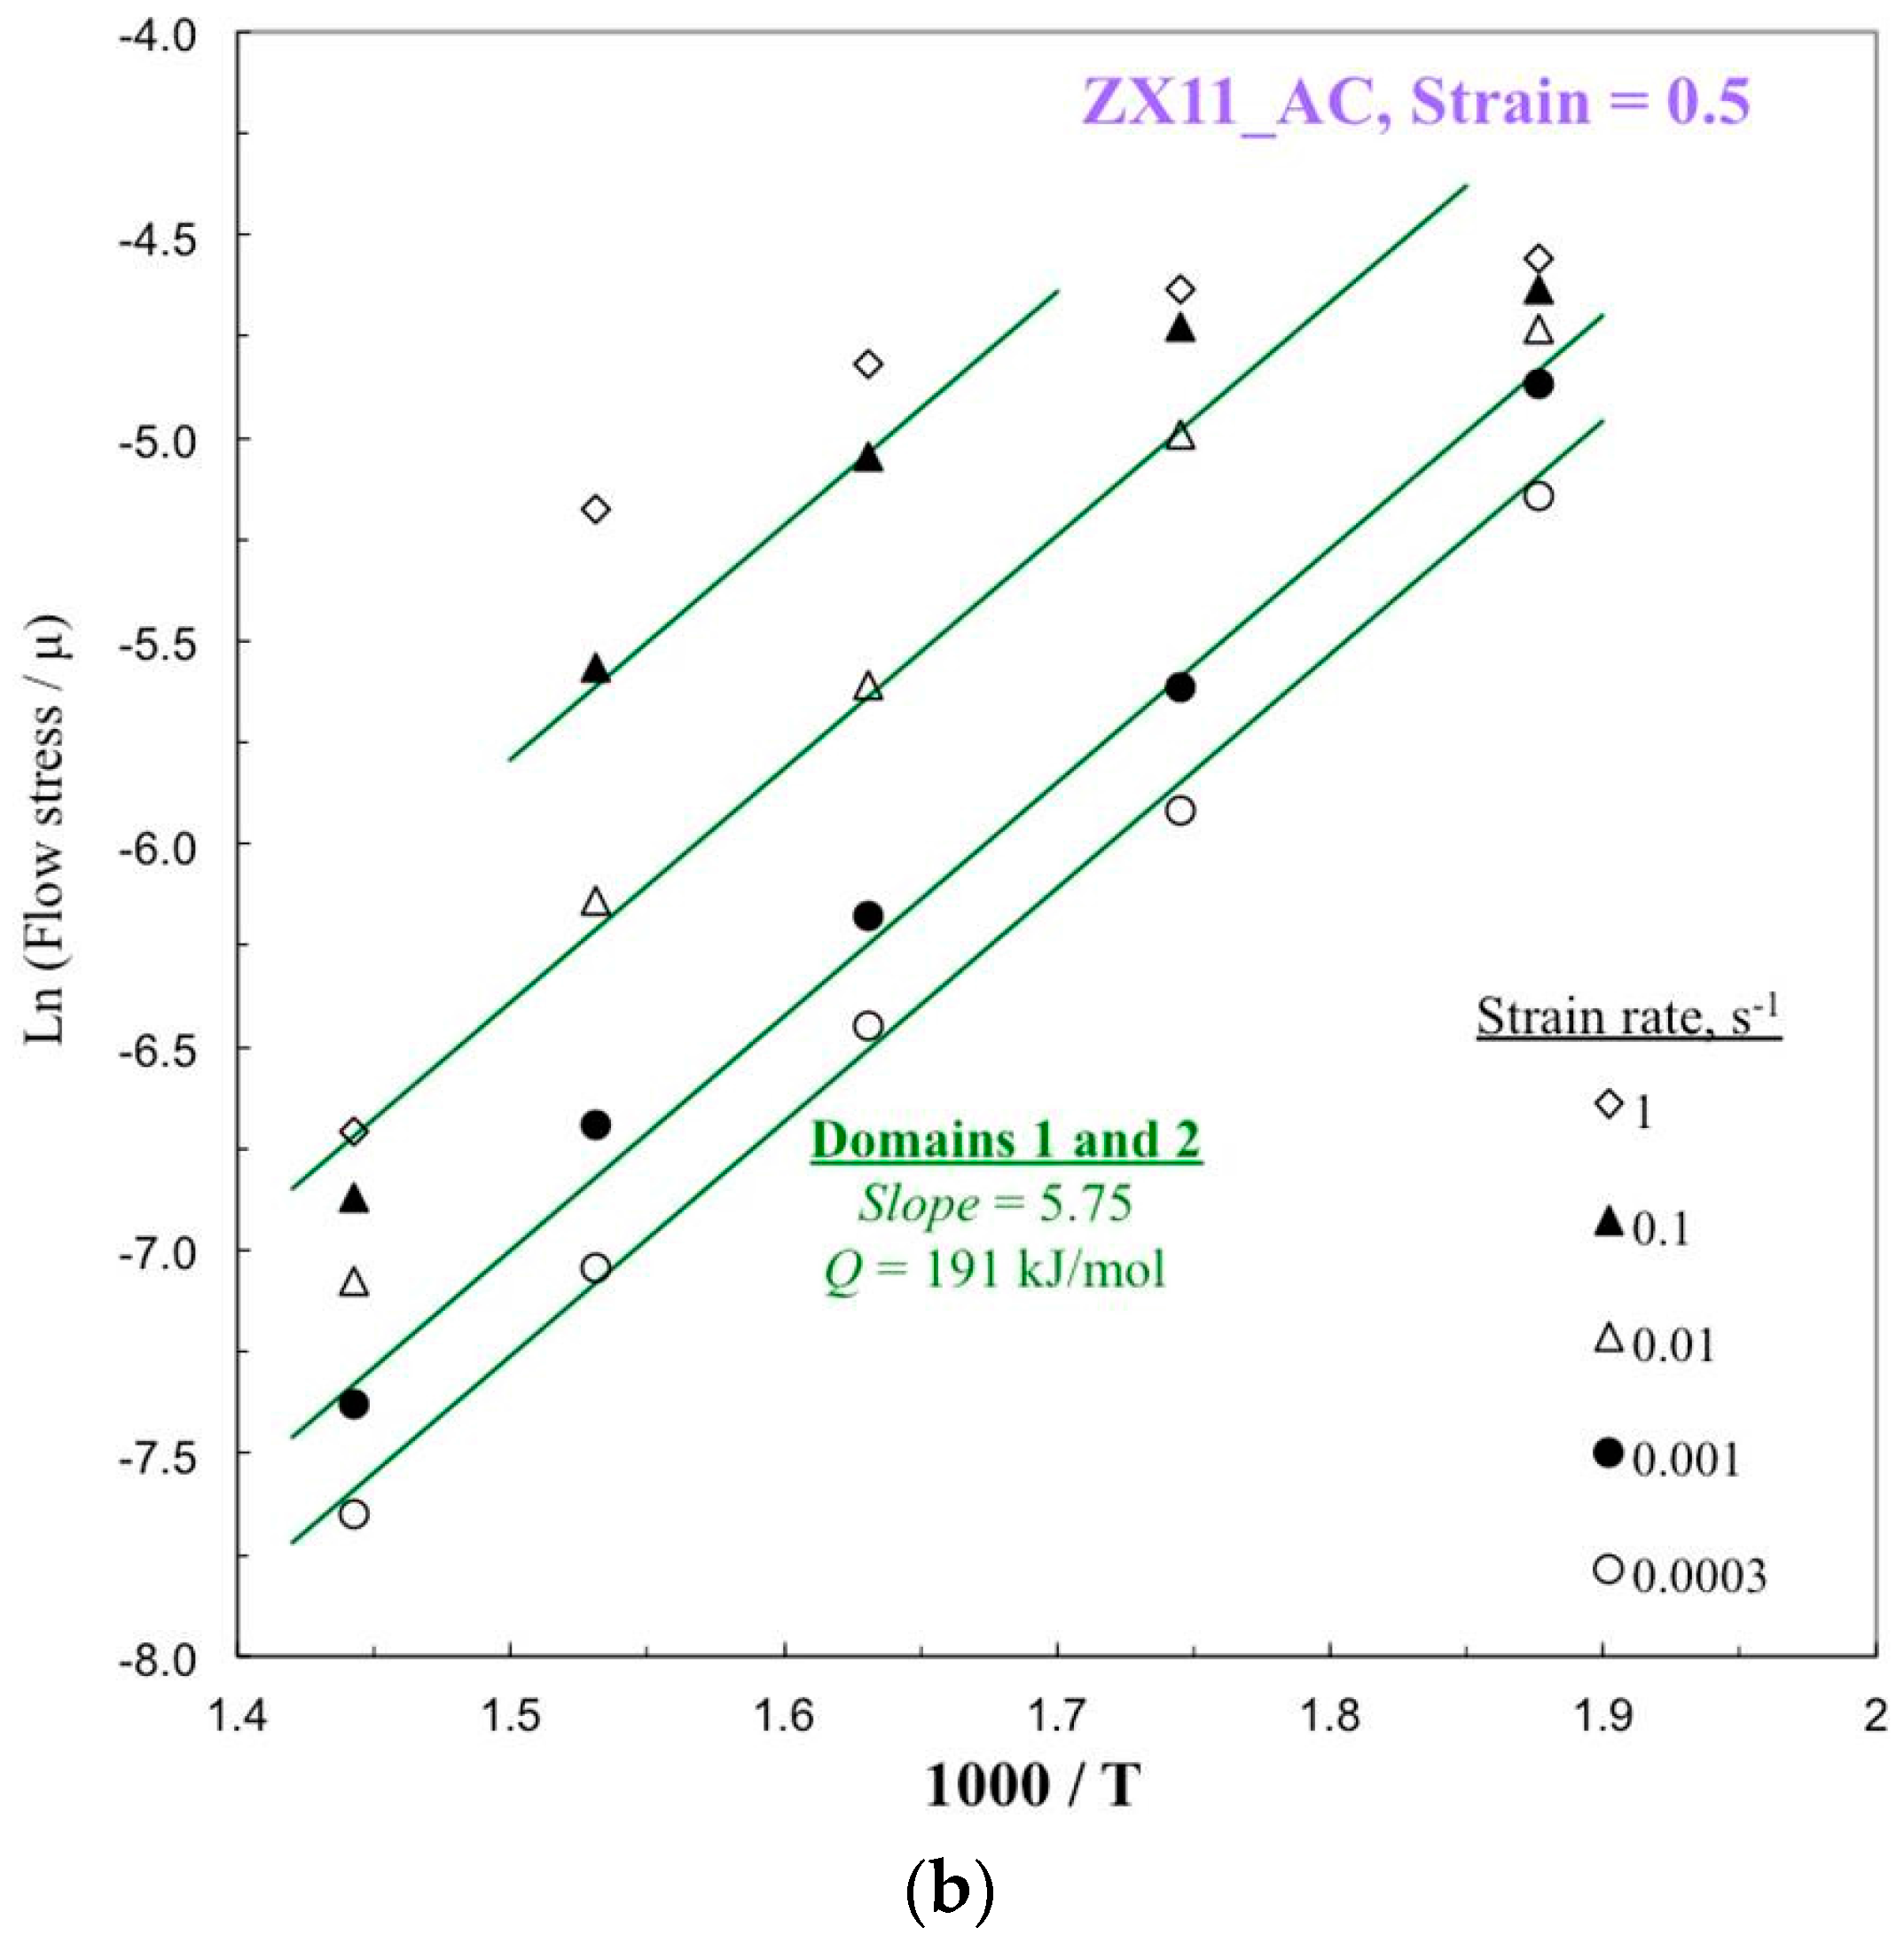
4.5. Activation Analysis

The dependence of flow stress (σ) on strain rate ( ε ˙ ) and temperature (T) may be represented by a standard Arrhenius type kinetic rate equation [24], as follows:
ε ˙ = A σ n exp ( Q / R T )
where A is a constant, n is a stress exponent, Q is the activation energy and R is the gas constant, is obeyed within the domain and can be applied to evaluate the apparent activation energy. The variation of flow stress with strain rate for different temperatures is shown in Figure 8a. It can be seen that all data points in both the domains fall on the parallel straight lines for each temperature. This indicates that the recovery mechanism is the same in both the domains. The flow stress values are normalized with respect to the shear modulus of magnesium and are plotted against reciprocal of absolute temperature, as shown in Figure 8b. The apparent activation energy for both the domains was estimated based on the slopes of straight lines in Figure 8a,b and was found to be same which is 191 kJ/mol. It may be noted that Q for lattice self-diffusion in magnesium is only 135 kJ/mol [25]. This significantly higher value of Q for the alloy may be attributed to the generation of considerable back stress to dislocation glide due to Ca2Mg6Zn3 particles in the matrix. The rate-controlling mechanism is dislocation climb that prefers slow strain rates since it occurrence requires lattice self-diffusion.

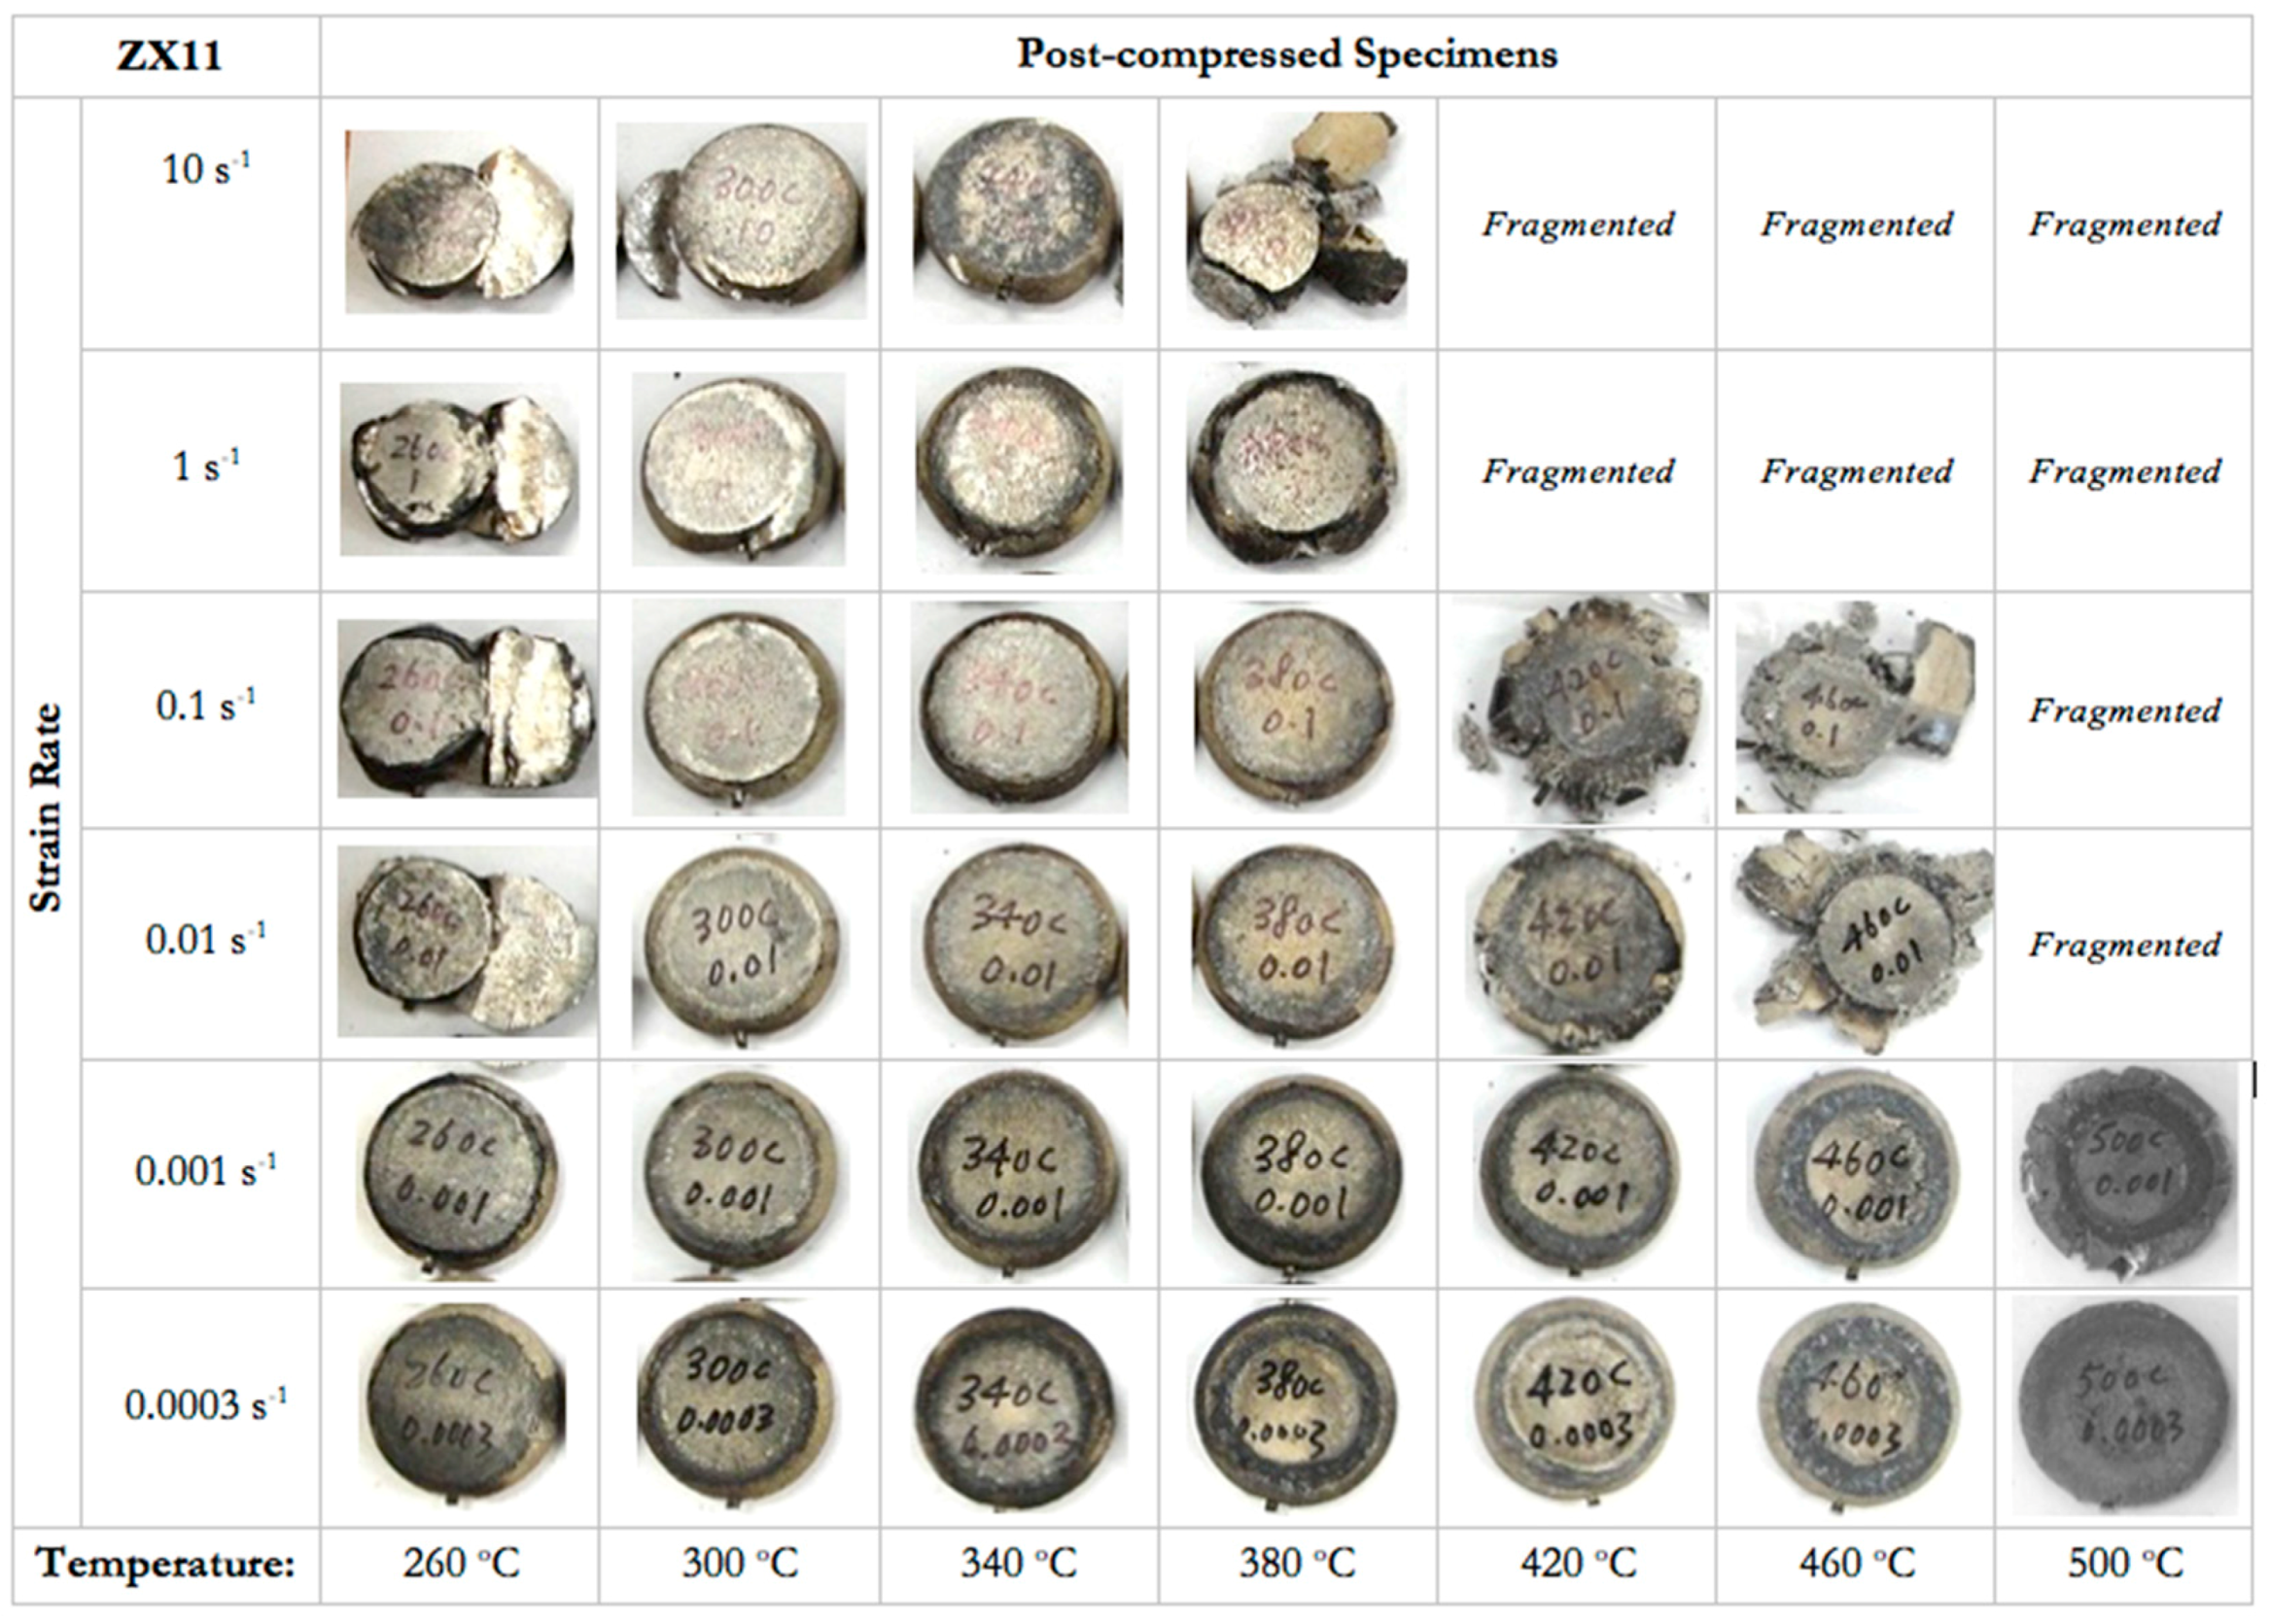
4.6. Flow Instability

Two regimes of flow instability have been estimated upon applying Equation (2) using the flow stress data, and they are marked as “instability” in the processing map (Figure 6). The lower temperature regime extended up to a temperature of 340 °C and the higher temperature regime commenced at 400 °C, both exist at higher strain rates. Microstructures of specimens deformed at (1) 260 °C/1 s−1; and (2) 420 °C/0.1 s−1, corresponding to these regimes are shown in Figure 9. The manifestation of instability in the lower temperature regime is adiabatic shear band (ASB) formation (seen at arrows in Figure 9a). The ASB occurred at nearly 45° with respect to the compression axis and contains cracks due to its high intensity of shear deformation. The instability in the higher temperature regime has flow localization (seen at arrows in Figure 9b) along with cracks at the grain boundary junctions due to the low melting phase Mg2Ca. Both the flow instability regimes give undesirable microstructures in the hot worked product and therefore will have to be avoided in processing ZX11 alloy.

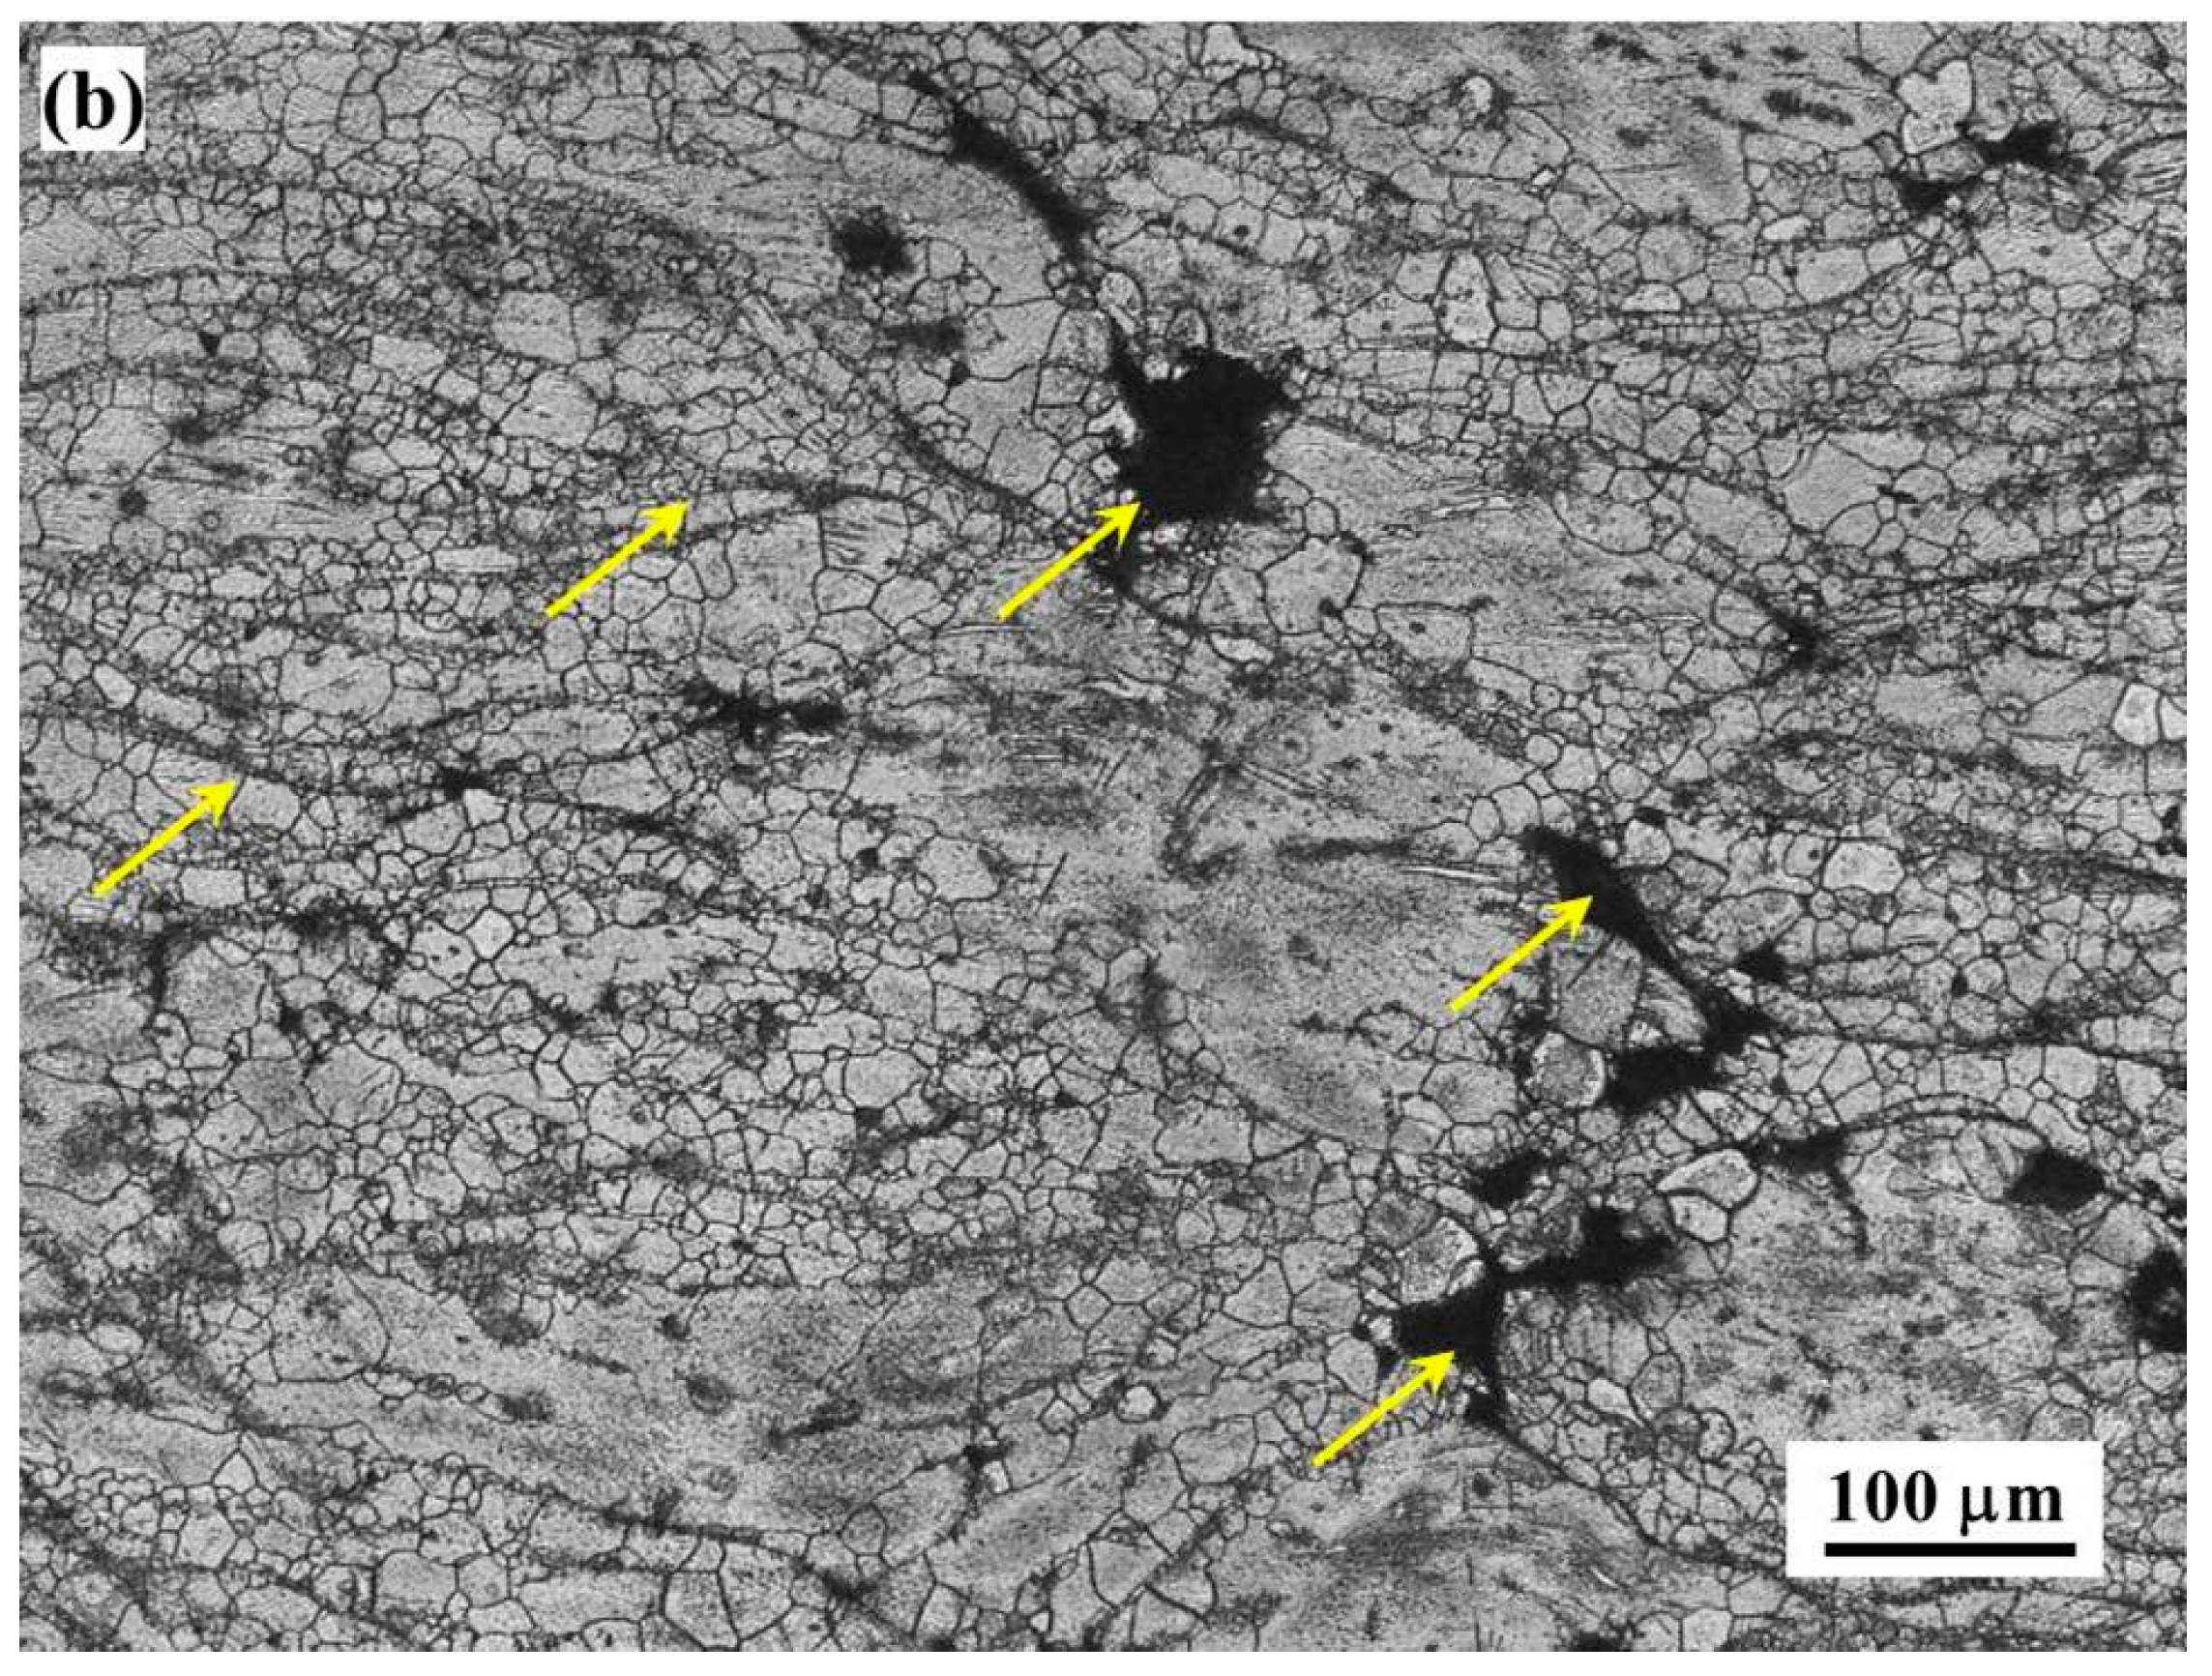
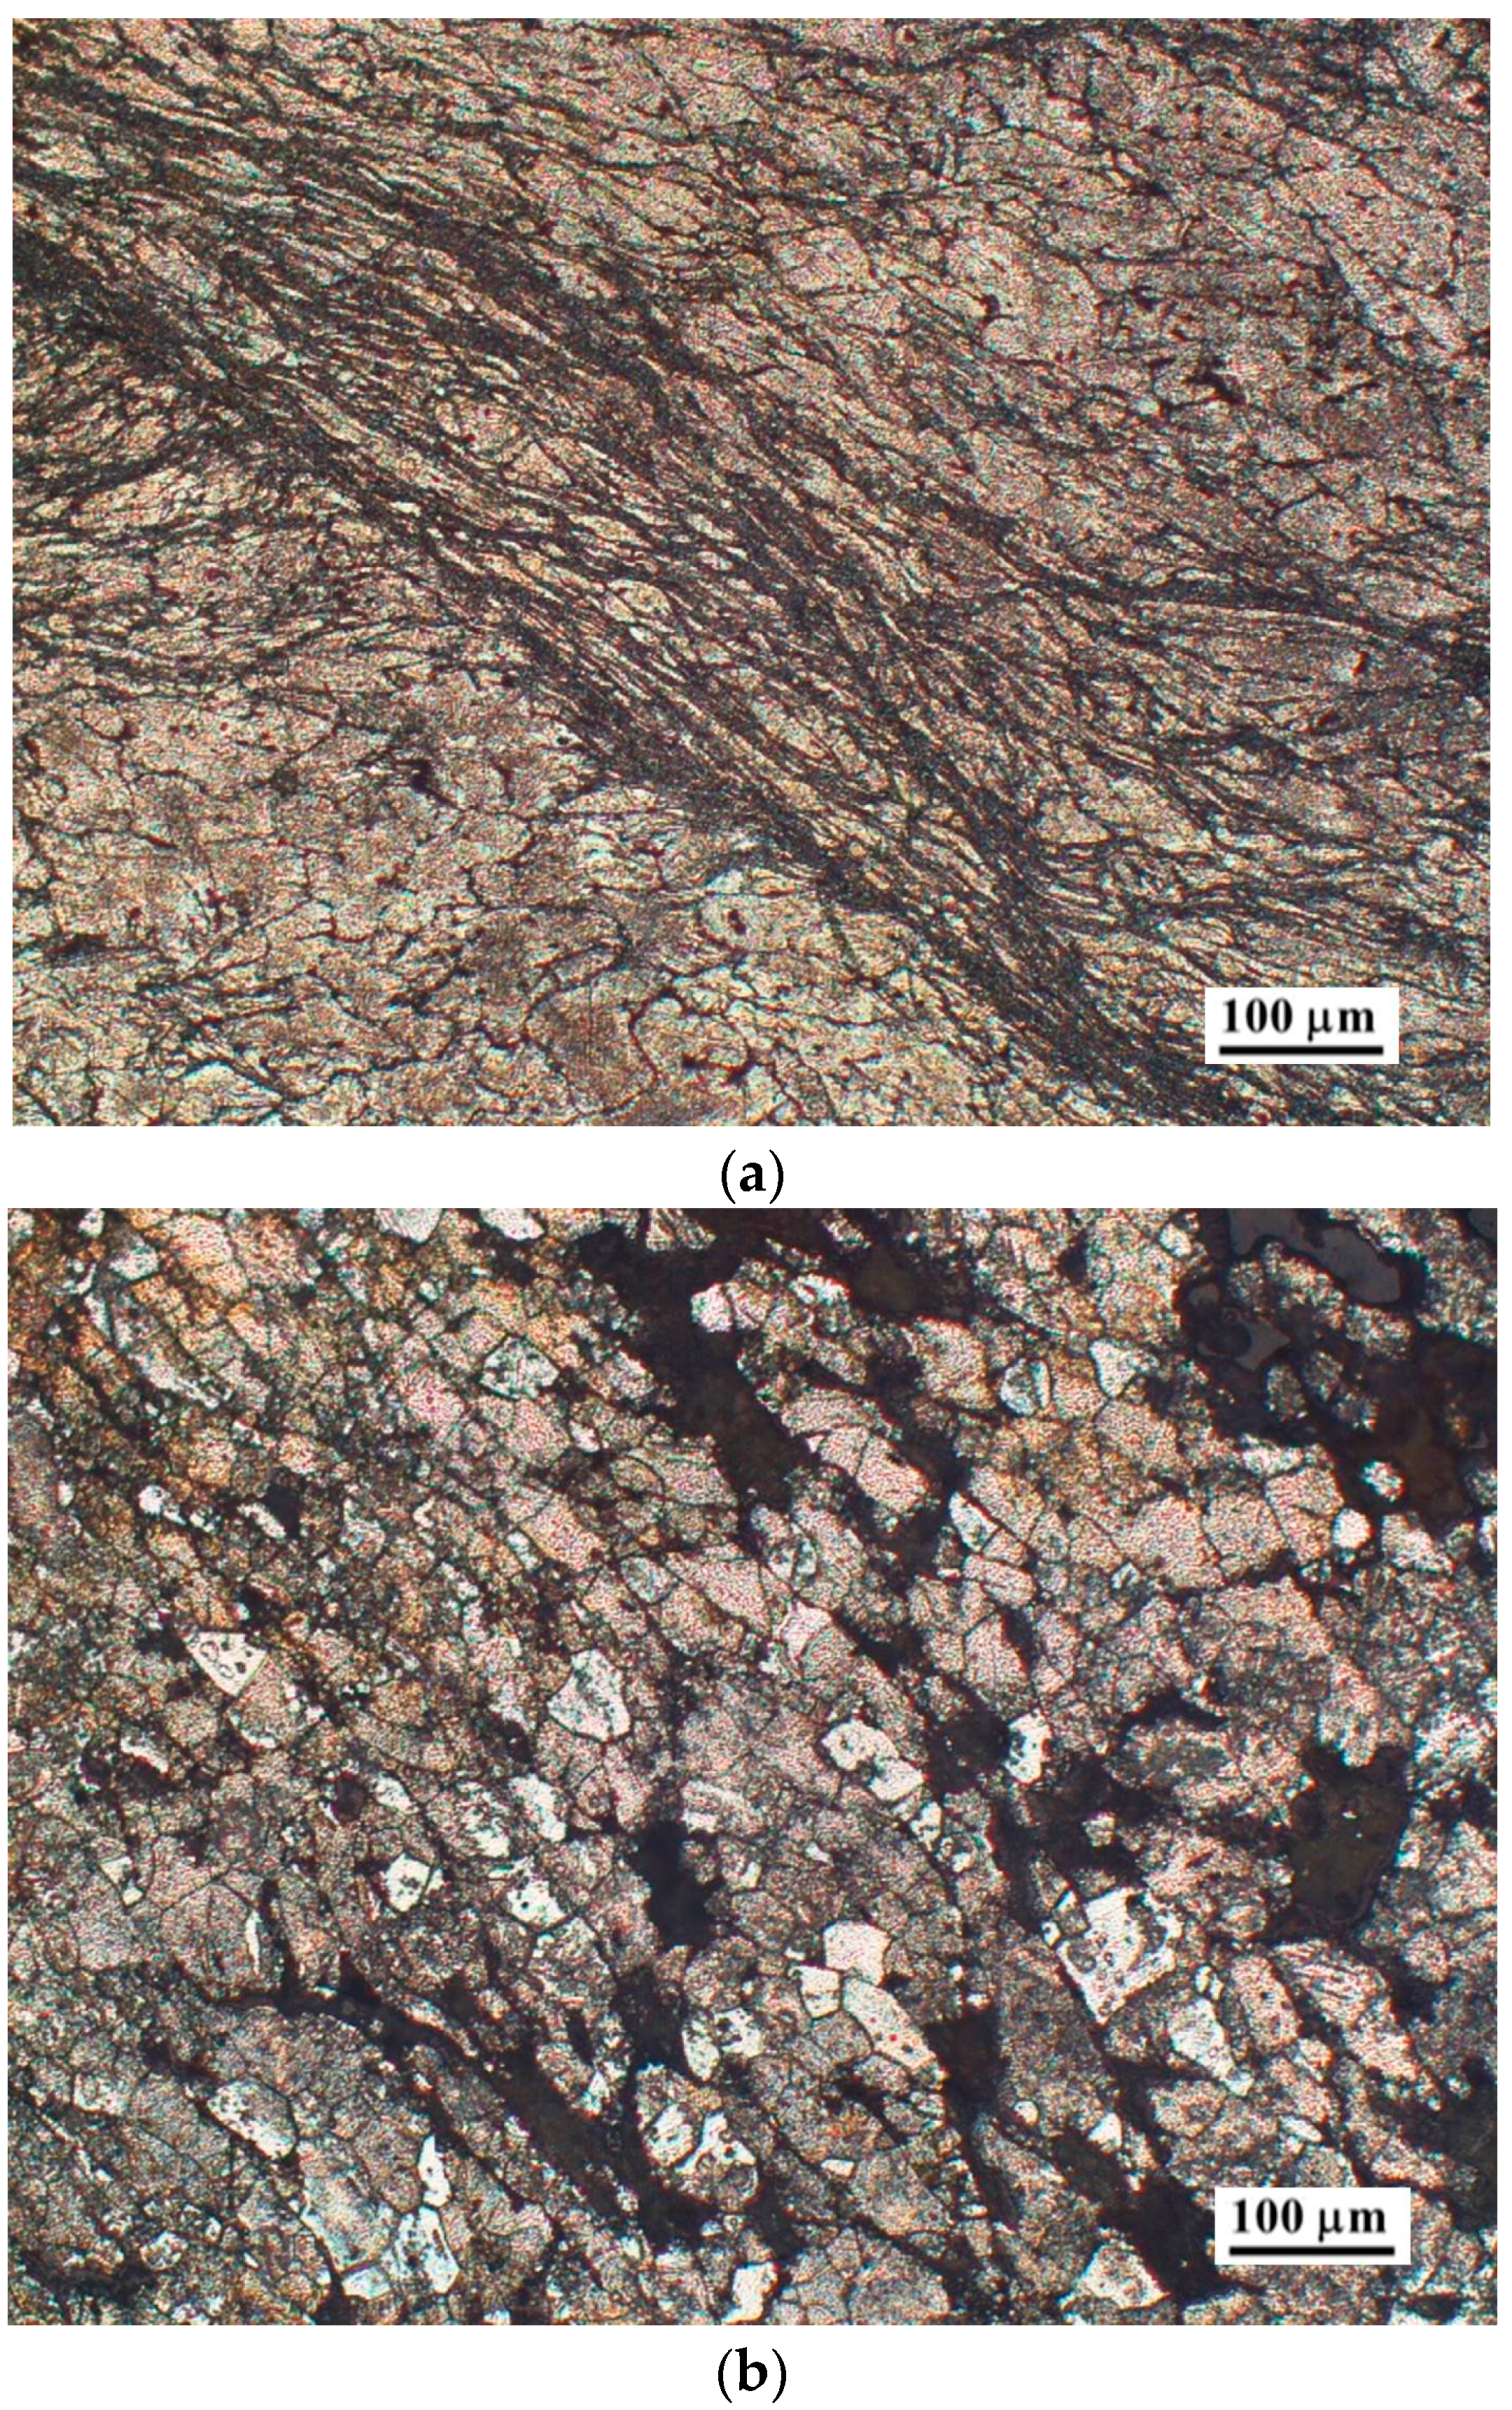
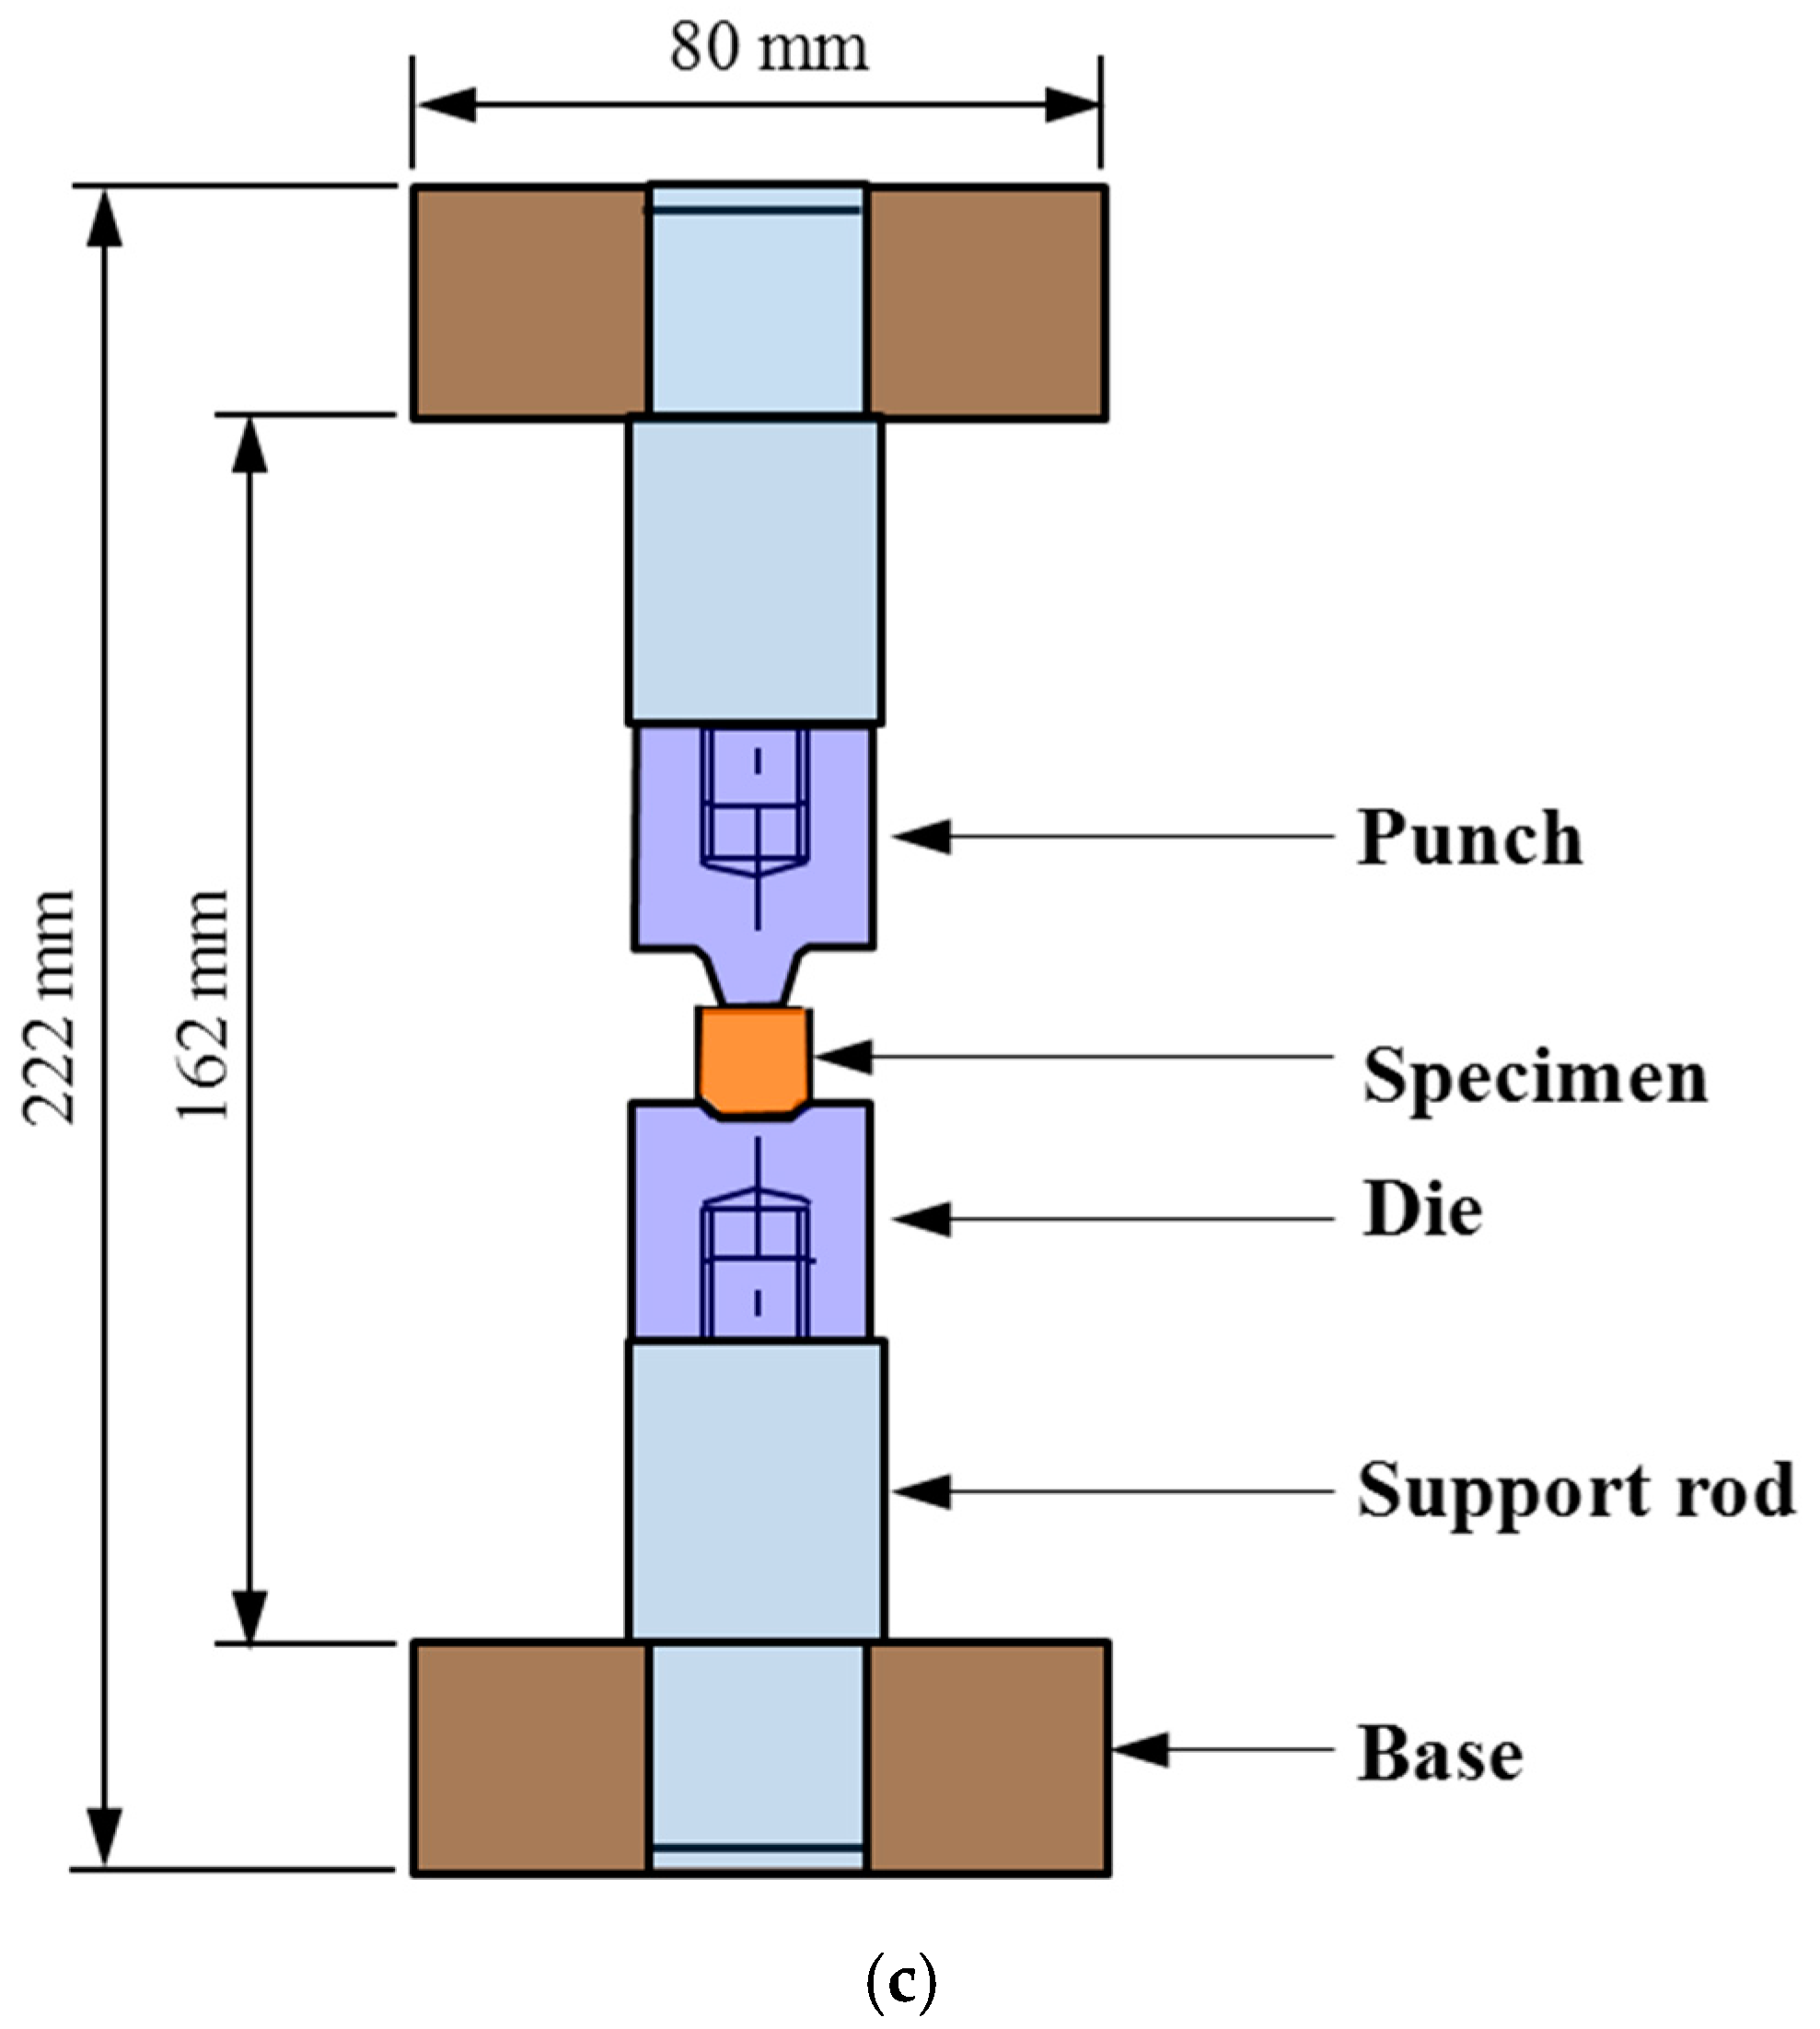
5. Validation Experiments Using Forging

The results obtained from processing maps on the optimum hot workability conditions and also the undesirable regimes of instability, are validated by forging a rib-web (cup) shaped component shown in Figure 10a, starting from a cylindrical shape (Figure 10b). The forging was conducted under precise and controlled conditions using a servo-hydraulic machine (MTS 810; MTS Systems Corporation, Eden Prairie, MN, USA) and a loading assembly shown in Figure 10c. Details of the set up for forging experiments and procedure were given in earlier publication [20]. The experiments were performed from 300 °C to 500 °C, at 40 °C intervals, and forging speeds of 0.01, 0.1, 1.0, and 10 mm·s−1. The specimen, the die assembly and the loading members were heated to the test temperature by surrounding them with a split furnace. It is necessary to estimate the strain rate variations within the forging envelope as well as the effective strain in order to locate the exact processing coordinates in the map. For this purpose, process simulation will have to be done using analytical modeling of the forging process. A finite element software DEFORM 2D (axisymmetric version used for isothermal conditions; version 11.0.1, Scientific Forming Technologies Corporation, Columbus, OH, USA) with a pre-processor to input material data such as flow stress under different processing conditions, interfacial conditions, and object definition, was used for simulation [26,27]. A post-processor was used for depicting the deformed geometry at different stages of forging, state-of-stress in the workpiece, effective strain, strain rate, etc.
Process simulations were conducted at the temperature range 260–420 °C at the forging speeds of 0.01, 0.1, 1, and 10 until the stroke reached 11 mm in 0.1 mm increments. Typical effective strain distribution in the diametral plane of the forged component at the end of the stroke is shown in Figure 11 for the forging corresponding to 380 °C at 0.01 mm·s−1 (Domain 1). From the simulations, the minimum and maximum effective strains varied between 0.1 and 3.85. The average strain rate corresponding to the forging speed of 0.01 mm·s−1 is approximately 0.001 s−1. Similar results were observed for other speeds 0.01, 0.1, and 1.0 mm·s−1, with an order of magnitude difference for the corresponding strain rates. The flow patterns are similar for all the forging conditions.
Figure 12a,b show the microstructures recorded at different locations in the specimens forged at 300 °C/0.01 mm·s−1 (Domain 1) and 380 °C/0.01 mm·s−1 (Domain 2), respectively. These microstructures were recorded in the bottom region of the cup, which has undergone maximum strain. However, the microstructure recorded in the outside rib region did not exhibit significant change when compared with the starting as-cast microstructure because the local strain is not large enough to cause DRX. The microstructures clearly showed the recrystallized grains, and the average grain size is fine in Domain 1 (5 µm) as compared to that obtained in Domain 2 (20 µm). The microstructures obtained in forged components conducted at conditions corresponding to the two flow instability regimes of the processing map (Figure 6), namely, 260 °C/1 mm·s−1 and 420 °C and 1 mm·s−1, are shown in Figure 13a,b respectively. The flow localization is clearly observed in the bottom, radius and inside-wall regions. In the lower temperature instability region, intense flow localization has occurred (Figure 13a), while in the higher temperature instability region, flow localization and intercrystalline cracking is observed (Figure 13b), both in line with the features revealed by the processing map. In the outside wall region, the microstructure did not exhibit much change due to low local strain values. Thus, the microstructural features of the forgings match with those obtained on compression specimens and completely validate the findings of the processing map both for workability domains as well as for the flow instability regimes.

6. Conclusions

Compression tests were conducted on Mg–1Zn–1Ca (ZX11) alloy with the aim of evaluating its strength and hot working characteristics. The results are validated by conducting hot forging tests producing a cup shaped (rib-web) component. The conclusions based on this study are as follows:
The ultimate compressive strength of the ZX11 alloy is about 30% higher than that of creep-resistant alloy Mg–3Sn–2Ca (TX32) and the commonly preferred wrought alloy Mg–3Al–1Zn (AZ31) in the temperature range 25–200 °C.
The alloy exhibits a plateau in the strength between 100 °C and 175 °C similar to TX32 alloy and is attributed to the presence of Mg2Ca particles at grain boundaries reducing their sliding.
ZX11 alloy is brittle above 420 °C, due to the presence of low melting compound Mg2Ca at the grain boundaries.
The processing map developed for the alloy exhibited two workability domains: (1) 280–330 °C and 0.0003–0.01 s−1 and (2) 330–400 °C and 0.0003–0.1 s−1.
Dynamic recrystallization occurs in both the domains although basal slip dominates in the first domain and prismatic slip dominates in the second, the recovery mechanism being climb of edge dislocations in both.
The activation energy estimated using the standard kinetic rate equation is 191 kJ/mol, which is higher than lattice self-diffusion of magnesium indicating that a large back stress is created by Ca2Mg6Zn3 intermetallic particles in the matrix.
It is recommended that the alloy be best processed at 380 °C and 0.1 s−1, where prismatic slip, favored by the addition of Zn to the alloy, occurs extensively to enhance the rate of dynamic recrystallization.
At higher strain rates, the alloy exhibits flow instability in the form of adiabatic shear band formation at lower temperatures while flow localization and cracking occurs at grain boundaries at higher temperatures.
Forging results on a rib-web (cup) shape under different forming conditions validated the predictions of the processing map with regard to the workability domains as well as the instability regimes.

Acknowledgements

This work was fully supported by a research grant (General Research Fund, Project #11259116) from the Research Grants Council of the Hong Kong Special Administrative Region.

Author Contributions

Kamineni Pitcheswara Rao, Kalidass Suresh and Chalasani Dharmendra have performed the experimental work, analysis of the data, and writing the paper; Yellapregada Venkata Rama Krishna Prasad has contributed on the aspects related to the processing map and writing the paper; Norbert Hort and Hajo Dieringa have developed the alloy and its initial characterization.

Conflicts of Interest

The authors declare no conflict of interest.

References

  1. Li, W.; Guan, S.; Chen, J.; Hu, J.; Chen, S.; Wang, L.; Zhu, S. Preparation and in vitro degradation of the composite coating with high adhesion strength on biodegradable Mg-Zn-Ca alloy. Mater. Charact. 2011, 62, 1158–1165. [Google Scholar] [CrossRef]
  2. Xu, Z.; Smith, C.; Chen, S.; Sankar, J. Development and microstructural characterization of Mg-Zn-Ca alloys for biomedical applications. Mater. Sci. Eng. B 2011, 176, 1660–1665. [Google Scholar] [CrossRef]
  3. Sun, Y.; Zhang, B.; Wang, Y.; Geng, L.; Jiao, X. Preparation and characterization of a new biomedical Mg-Zn-Ca alloy. Mater. Des. 2012, 34, 58–64. [Google Scholar] [CrossRef]
  4. Akhtar, A.; Teghtsoonian, E. Substitutional solution hardening of magnesium single crystals. Philos. Mag. 1972, 25, 897–916. [Google Scholar] [CrossRef]
  5. Akhtar, A.; Teghtsoonian, E. Solid solution strengthening of magnesium single crystals—I, Alloying behaviour in basal slip. Acta Metall. 1969, 17, 1339–1349. [Google Scholar] [CrossRef]
  6. Akhtar, A.; Teghtsoonian, E. Solid solution strengthening of magnesium single crystals—II, The effect of solute on the ease of prismatic slip. Acta Metall. 1969, 17, 1351–1356. [Google Scholar] [CrossRef]
  7. Blake, A.H.; Cáceres, C.H. Solid Solution Effects on the Tensile Behavior of Concentrated Mg-Zn Alloys. In Essential Readings in Magnesium Technology; Mathaudhu, S.N., Luo, A.A., Neelameggham, N.R., Nyberg, E.A., Sillekens, W.H., Eds.; John Wiley & Sons, Inc.: Hoboken, NJ, USA, 2014; pp. 263–267. [Google Scholar]
  8. Katsarou, L.; Suresh, K.; Rao, K.P.; Hort, N.; Blawert, C.; Mendis, C.L.; Dieringa, H. Microstructure and Properties of Magnesium Alloy Mg-1Zn-1Ca (ZX11). In Magnesium Technology 2015; Manuel, M.V., Singh, A., Alderman, M., Neelameggham, N.R., Eds.; TMS: Orlando, FL, USA, 2015; pp. 419–423. [Google Scholar]
  9. Nie, J.F.; Muddle, B.C. Precipitation hardening of Mg-Ca-(Zn) alloys. Scr. Mater. 1997, 37, 1475–1481. [Google Scholar] [CrossRef]
  10. Langelier, B.; Wang, X.; Esmaeili, S. Evolution of precipitation during non-isothermal ageing of an Mg-Ca-Zn alloy with high Ca content. Mater. Sci. Eng. A 2012, 538, 246–251. [Google Scholar] [CrossRef]
  11. Bamberger, M.; Levi, G.; Vander Sande, J.B. Precipitation hardening in Mg-Ca-Zn alloys. Metall. Mater. Trans. A 2006, 37, 481–487. [Google Scholar] [CrossRef]
  12. Hradilová, M.; Montheillet, F.; Fraczkiewicz, A.; Desrayaud, C.; Lejček, P. Effect of Ca-addition on dynamic recrystallization of Mg–Zn alloy during hot deformation. Mater. Sci. Eng. A 2013, 580, 217–226. [Google Scholar] [CrossRef]
  13. Tong, L.B.; Zheng, M.Y.; Cheng, L.R.; Kamado, S.; Zhang, H.J. Effect of extrusion ratio on microstructure, texture and mechanical properties of indirectly extruded Mg–Zn–Ca alloy. Mater. Sci. Eng. A 2013, 569, 48–53. [Google Scholar] [CrossRef]
  14. Tong, L.B.; Zheng, M.Y.; Zhang, D.P.; Gan, W.M.; Brokmeier, H.G.; Meng, J.; Zhang, H.J. Compressive deformation behavior of Mg–Zn–Ca alloy at elevated temperature. Mater. Sci. Eng. A 2013, 586, 71–77. [Google Scholar] [CrossRef]
  15. Li, W.J.; Deng, K.K.; Zhang, X.; Nie, K.B.; Xu, F.J. Effect of ultra-slow extrusion speed on the microstructure and mechanical properties of Mg-4Zn-0.5Ca alloy. Mater. Sci. Eng. A 2016, 677, 367–375. [Google Scholar] [CrossRef]
  16. Prasad, Y.V.R.K.; Rao, K.P.; Sasidhara, S. Hot Working Guide: A Compendium of Processing Maps, 2nd ed.; ASM International: Materials Park, OH, USA, 2015. [Google Scholar]
  17. Prasad, Y.V.R.K.; Seshacharyulu, T. Modelling of hot deformation for microstructural control. Inter. Mater. Rev. 1998, 43, 243–258. [Google Scholar] [CrossRef]
  18. Sneddon, I.N.; Hill, R.; Naghdi, P.M.; Ziegler, H. Progress in Solid Mechanics; Sneddon, I.N., Hill, R., Eds.; John Wiley: New York, NY, USA, 1965; Volume 4, pp. 91–193. [Google Scholar]
  19. Prasad, Y.V.R.K.; Rao, K.P. Processing maps and rate controlling mechanisms of hot deformation of electrolytic tough pitch copper in the temperature range 300–950 °C. Mater. Sci. Eng. A 2005, 391, 141–150. [Google Scholar] [CrossRef]
  20. Rao, K.P.; Prasad, Y.V.R.K. Materials modeling and finite element simulation of isothermal forging of electrolytic copper. Mater. Des. 2011, 32, 1851–1858. [Google Scholar]
  21. Suresh, K.; Rao, K.P.; Prasad, Y.V.R.K.; Hort, N.; Kainer, K.U. Effect of calcium addition on the hot working behavior of as-cast AZ31 magnesium alloy. Mater. Sci. Eng. A 2013, 588, 272–279. [Google Scholar] [CrossRef]
  22. Suresh, K.; Rao, K.P.; Prasad, Y.V.R.K.; Hort, N.; Kainer, K.U. Microstructure and mechanical properties of as-cast Mg-Sn-Ca alloys and effect of alloying elements. Trans. Nonferr. Met. Soc. China 2013, 23, 3604–3610. [Google Scholar] [CrossRef]
  23. Sastry, D.H.; Prasad, Y.V.R.K.; Vasu, K.I. On the stacking fault energies of some close-packed hexagonal metals. Scr. Metall. 1969, 3, 927–929. [Google Scholar] [CrossRef]
  24. Jonas, J.J.; Sellars, C.M.; Tegart, W.J.M. Strength and structure under hot working conditions. Metall. Rev. 1969, 14, 1–24. [Google Scholar]
  25. Frost, H.J.; Ashby, M.F. Deformation-Mechanism Maps; Pergamon Press: Oxford, UK, 1982; p. 44. [Google Scholar]
  26. Kobayashi, S.; Oh, S.I.; Altan, T. Metal Forming and the Finite-Element Method; Oxford University Press: Oxford, UK, 1989; pp. 1–41. [Google Scholar]
  27. Oh, S.I. Finite element analysis of metal forming processes with arbitrarily shaped dies. Int. J. Mech. Sci. 1982, 24, 479–493. [Google Scholar] [CrossRef]
Figure 1. Initial microstructure of ZX11 (Mg–1Zn–1Ca) alloy in the cast condition: (a) Optical and (b) SEM (scanning electron microscope).
Metals 07 00405 g001
Figure 2. Differential Scanning Calorimetry (DSC) trace of ZX11 alloy showing blimps at 420 °C and 490 °C (shown by arrows) that correspond to the melting of minor phases.
Metals 07 00405 g002
Figure 3. Ultimate compressive stress (UCS) of ZX11 alloy compared with common ternary Mg alloys [21,22].
Metals 07 00405 g003
Figure 4. Flow curves obtained in compression at six strain rates: (a) 300 °C and (b) 380 °C.
Metals 07 00405 g004
Figure 5. Specimen shapes after compression of ZX11 alloy at different test conditions.
Metals 07 00405 g005
Figure 6. Processing map for ZX11 alloy developed for a strain value of 0.5. The dissipation efficiency values in percent are shown with the contours and the two instability regimes are also superimposed.
Metals 07 00405 g006
Figure 7. Microstructures of specimens deformed in (a) Domain 1 (300 °C/0.001 s−1), and (b) Domain 2 (380 °C/0.01 s−1). The compression axis is vertical.
Metals 07 00405 g007
Figure 8. (a) Flow stress vs. strain rate, and (b) normalized flow stress vs. reciprocal of absolute temperature for ZX11 alloy.
Metals 07 00405 g008aMetals 07 00405 g008b
Figure 9. Optical micrographs of deformed specimens at: (a) 260 °C/1 s−1 exhibiting extensive shear band and (b) 420 °C/0.1 s−1 exhibiting flow localization. The compression axis is vertical.
Metals 07 00405 g009aMetals 07 00405 g009b
Figure 10. Sketches of (a) final cup shape (rib-web) of the component, (b) starting cylindrical specimen and (c) load train assembly for forging using servo-hydraulic machine [20].
Metals 07 00405 g010aMetals 07 00405 g010b
Figure 11. Contours of effective strain obtained at a stroke of 11 mm in finite element simulation for 380 °C/0.01 mms−1 (Corresponding to Domain 1). The contours are shown from central axis on half portion of the forged specimen corresponding to the diametral plane.
Metals 07 00405 g011
Figure 12. Optical micrographs taken on the specimens forged at conditions (a) 300 °C/0.01 mm/s (Corresponding to Domain 1 in the map) and (b) at 380 °C/0.01 mm/s (Corresponding to Domain 2). The forging axis is vertical.
Metals 07 00405 g012
Figure 13. Optical microstructures of the specimens forged at conditions (a) 260 °C/1 mm/s and (b) at 420 °C/1 mm/s (Corresponding to flow instability). The forging axis is vertical.
Metals 07 00405 g013

