Magnetostriction of Ni2Mn1−xCrxGa Heusler Alloys

1
Department of Mechanical and System Engineering, Faculty of Science and Technology, Ryukoku University, Otsu 520-2194, Shiga, Japan
2
Research Institute for Engineering and Technology, Tohoku Gakuin University, Tagajo 985-8537, Miyagi, Japan
3
Graduate School of Science and Engineering, Yamagata University, Yonezawa 992-8510, Yamagata, Japan
*
Author to whom correspondence should be addressed.
Metals 2017, 7(10), 410; https://doi.org/10.3390/met7100410
Submission received: 12 August 2017
/
Revised: 25 September 2017
/
Accepted: 28 September 2017
/
Published: 1 October 2017
Abstract
:Among the functionalities of magnetic Heusler alloys, magnetostriction is attracting considerable attention. The alloy Ni2MnGa has a premartensite phase, which is a precursor state to the martensitic transition. Some researchers have observed magnetostriction in this alloy in the premartensite phase. We performed magnetostriction studies on the premartensite phase of related Cr-substituted Ni2Mn1−xCrxGa alloys and measured the thermal strain, permeability, magnetisation, and magnetostriction of polycrystals. Our thermal expansion measurements show an anomaly that indicates the occurrence of lattice deformation below the premartensitic transition temperature TP. Our permeability measurements also showed an anomaly at the premartensitic transition. From our magnetisation results, we obtained the magnetic-anisotropy constant K1. In the martensite phase, we found that the magnetic-anisotropy constant of the x = 0.00 alloy is larger than that of the x = 0.15 alloy. At 0.24 MA/m, we obtained a magnetostriction of −120 ppm for the x = 0.15 alloy. Magnetostriction in the premartensite phase is larger than that in the austenite and martensite phases at low magnetic-field strength, thus indicating that it is related to lattice softening in the premartensite phase. The e/a is proportional to the magnetostriction and TP, which indicates that the electron energy, the magnetostriction, and the Tp are correlative each other.
1. Introduction
1.1. Magnetostriction and Magnetic Field-Induced Strain of Ferroagnetic Shape Memory Alloys
Recently, ferromagnetic shape-memory alloys (FSMAs) have been studied extensively as candidates for highly functional magnetostriction materials for use as actuators, tremblers, and magnetic sensors. Among FSMAs, the alloy Ni2MnGa is the most well-known [1]. It has a cubic L21 type Heusler structure (space group Fmm) and a ferromagnetic transition that occurs at the Curie temperature TC = 365 K [2,3]. During cooling from ambient temperature, a martensitic transition occurs at the martensite transition temperature TM = 200 K. Below TM, a superstructure state develops as a result of lattice modulation [4,5]. Conventional magnetostriction is the distortion of crystal lattice caused by the rotation of the magnetic moment. FSMAs can induce large strain through martensitic transition or rearrangements of variants induced by external magnetic fields. This is called “twinning magnetostriction”, which was discovered by Ullakko and colleagues [1,6]. They discovered 1.5 × 10³ ppm magnetostriction for a single crystal of Ni-Mn-Ga. This value is comparable to the magnetostriction of 3d/rare-earth intermetallic compounds TbFe2, DyFe2 [7] and Tb0.3Dy0.7Fe2 (terfenol-D) [8]. The reverse transition from martensite phase to parent phase in magnetic fields—which is called magnetic-field-induced strain (MFIS)—can be observed for FSMAs. The large MFIS was mainly caused by the reorientation of variants and was highly sensitive to the temperature.
The MFIS of a single crystal of Ni52Mn23Ga25 exhibited a martensitic transition at room temperature [9]. A large MFIS of −2700 ppm was obtained at 303 K and under atmospheric pressure. A net MFIS of 5400 ppm was induced when a 0.8 MA/m applied field was rotated from the [100] to the [001] directions of the sample. Furthermore, MFISs of 6–10 × 103 ppm have been reported in single crystals of Ni2MnGa near or below room temperature [10]. Some studies have also been conducted on the influence of Fe addition into Ni-Mn-Ga alloys around room temperature [11,12]. A 5.5 × 10⁴ ppm MFIS of single-crystal Ni49.9Mn28.3Ga20.1Fe1.7 appeared at 293 K [11]. The MFIS of Ni52Mn16Fe8Ga24 single-crystal was 1.15 × 10⁴ ppm at 293 K [12]. These MFIS were observed in the martensite phase.
The magnetostriction in polycrystalline Ni50Mn23.1Ga24.6 was studied, which shows a martensitic transition at the martensite starting temperature TMs = 250 K [13]. The number of valence electrons per atom, e/a, for this alloy is 7.57, which is higher than that for Ni2MnGa (e/a = 7.50). A 540 ppm magnetostriction was observed at TMs.
Near TM, lattice softening was observed. Therefore, the physical relation between the magnetostriction and the lattice softening around TM is interesting. The elastic constants of a Ni0.50Mn0.284Ga0.216 single crystal were studied by using the ultrasonic continuous-wave method [14]. They investigated the C11, C33, C66, and C44 modes, and found that every mode exhibited abrupt softening around TM. This lattice softening appears to be affected by the abrupt expansion that occurs just above TM when cooling from the austenite phase.
1.2. Magnetostriction in Premartensite Phase
The temperature of the martensitic transition is very sensitive to the ratio of constitutive elements for ordered compounds close to stoichiometry, Ni2MnGa. Between a martensitic transition from a cubic phase (austenite) to a low symmetry phase (martensite), an intermediate phase appears. This intermediate phase is preceded by a so-called “premartensite phase”. The premartensitic transition between austenite phase and premartensite phase is weakly first-order and originates from softening of the shear elastic coefficient C’ = (C11 − C12)/2 [15,16,17] corresponding to a minimum on the slowest transversal phonon branch [3,18,19]. Lattice softening is the physical reason for the large variation observed at the martensitic transformation temperature [20]. At the transition, the material exhibits some kind of anomaly in the elastic [16,21], thermal [15], electric [22], and magnetic properties [20,23]. As for Ni2+xMn1−xGa polycrystal, the resistivity demonstrates either a peak (x = 0.00−0.04 samples) or a two-step-like behaviour (x = 0.06−0.08 samples) at the premartensitic transition temperature, TP [22]. The permeability demonstrates a dip at TP [23]. Singh et al. [24] have suggested that a 3M-like incommensurate premartensite phase exists in Ni2MnGa.
The feature of the premartensite phase is that magnetostriction occurs. Clear magnetostrictions were observed around Tp in Ni2MnGa alloys. A minimum was found in both the magnetostriction and the elastic modulus at Tp and at the martensitic transition temperature TM in single crystalline Ni2MnGa [17,25]. Matsui et al. [26] investigated magnetostriction in polycrystalline Ni-Mn-Ga alloys and found a magnetostriction of −190 ppm in the premartensite phase—more than three times the amount in the austenite phase. Magnetostriction measurements were performed on polycrystalline Ni2MnGa [20]. It was found that the saturation magnetostriction was negative, took on moderate values of approximately −100 ppm, and increased greatly in absolute value at both the premartensitic and martensitic transition temperatures, which arise from lattice softening at the transitions. In this study, we performed the measurements of the thermal strain, permeability, magnetisation, and magnetostriction of Cr-substituted Ni2Mn1−xCrxGa alloys.
1.3. Purpose of This Study
We chose Ni2Mn1−xCrxGa because the physical properties of Ni2MnGa undergo sudden changes with heat treatment. Therefore, we studied the physical properties of doped systems that could predict high thermal stability. The values of TC and TM for the Ni2MnGa alloys change drastically when they are doped by replacing Mn with a fourth element, such as Fe, Co, Ni, or Cu [27,28,29,30]. For example, replacing Mn by Co, Ni, or Cu increases TM, but the value of TM for Ni2Mn1−xFexGa decreases with increasing Fe concentration x. Several authors have shown that the number of e/a is closely related to the value of TM for Ni-Mn-based FSMAs: a large e/a value indicates a high TM [31,32,33]. However, a larger e/a corresponds to a lower TM for Ni2Mn1−xFexGa as mentioned above. For Ni2Mn1−xCrxGa alloys, e/a decreases with Cr concentration x (7.50 for x = 0.00 and 7.46 for x = 0.15). Therefore, it would be interesting to know whether the relationship between Tp or magnetostriction and e/a applies to Ni2Mn1−xCrxGa. The e/a becomes smaller when Mn (3d54s2) is replaced by Cr (3d54s). We are interested to investigate a correlation of magnetostriction and e/a which is larger and smaller than 7.50 with a result of the magnetostriction measurements of other Ni-Mn-Ga alloys.
Now we will discuss the physical properties of Ni2Mn1−xCrxGa alloys. As for x ≤ 0.25, two anomalies were observed on the ρ-T curves for each sample, corresponding to the magnetic and structural phase transitions at the Curie temperature TC and the martensitic transition temperature TM [34]. Kinks corresponding to the premartensitic transition at the critical temperature TP also appeared. A clear variation was observed below the premartensitic transition temperature TP, thus indicating that lattice deformation occurs below TP. The martensite-austenite phase transition was investigated for a series of 0 ≤ x ≤ 0.7 Heusler alloys by using X-ray diffraction, DC magnetisation, and electrical resistivity measurements [35]. For x < 0.20, a ferromagnetic premartensite state appeared below TP. As the Cr concentration x increased, the martensitic phase transition shifted to higher temperatures, whereas the ferromagnetic transition shifted to lower temperatures. For x < 0.5, the martensitic transition occurred in a ferromagnetic state; however, for x > 0.5, the transition occurred in a paramagnetic state. Doping with Cr results in a rearrangement of the electronic structure, particularly near the Fermi level. This phenomenon is clearly shown by the resistivity data, where a systematic jump-like anomaly was observed in the vicinity of the martensite–austenite phase transition.
The purpose of this study is to investigate the magnetic properties of Ni2Mn1−xCrxGa alloys more deeply than former studies. From the permeability and magnetization results, the magnetic-anisotropy constants in the three phases (austenite, premartensite, martensite) were obtained. The magnetostriction of the polycrystals of Ni2MnGa (x = 0.00) and Ni2Mn0.85Cr0.15Ga (x = 0.15)—both of which have austenite, premartensite, and martensite phases—were performed. We compared them with each other and with Ni2Mn0.75Cr0.25Ga (x = 0.25), which also has austenite and martensite phases. The relation between the magnetic anisotropy and the magnetostriction was investigated. The relations between the e/a and magnetostriction and Tp were also investigated, and proportional relations were obtained.
2. Materials and Methods
We prepared polycrystalline Ni2Mn1−xCrxGa alloys by the repeated arc-melting of appropriate quantities of the constituent elements—namely, 3N Ni, 4N Mn, 4N Cr and 6N Ga—in an argon atmosphere. The reaction products were sealed in evacuated silica tubes, heated at 1073 K for three days and at 773 K for two more days, and then quenched in water. We employed strain gauges (KFL-02-120-C1-16, size: sensor grid 0.2 mm length × 1.0 mm width, film base 2.5 mm length × 2.2 mm width. Kyowa Dengyo Co. Ltd., Yamagata, Japan) to measure the thermal strain and magnetostriction of bulk samples with sizes of 3.0 mm × 3.0 mm × 4.0 mm. The zero point of the linear thermal strain ∆L/L was set at 273.15 K, and the rate of temperature change rate was 2 K/min. For the magnetostriction measurements, we applied magnetic fields by using a water-cooled magnet. We employed two gauges, and we applied the magnetic field parallel to (strain λ//) and, separately, perpendicular to (strain λ⊥) the gauges. The magnetic-field change rate was 8.8 kA/(ms). We calculated the magnetostriction λ from the equation λ = 2(λ// − λ⊥)/3 (see [36]). Magnetostriction measurements were also performed during cooling. We performed the permeability measurements in alternating magnetic fields with a frequency of 73 Hz and a maximum field of ±0.8 kA/m (±10 Oe), which we verified using an magnetometer. We also employed a 3611 filter amp (NF Co. Ltd., Yokohama, Japan) and a 2000/J digital voltmeter (Keithley Co. Ltd, Salem, OR, USA). The measured temperature ranged between 150 K and 400 K. The rate of temperature change was 2 K/min, the same as we used for the linear-strain measurements. We performed the magnetisation measurements by using a pulsed-field magnet with the time constant of 6.3 ms. The absolute value was calibrated against a sample of pure Ni. The bulk samples used in other measurements were also used to compare the results with each other.
3. Results and Discussion
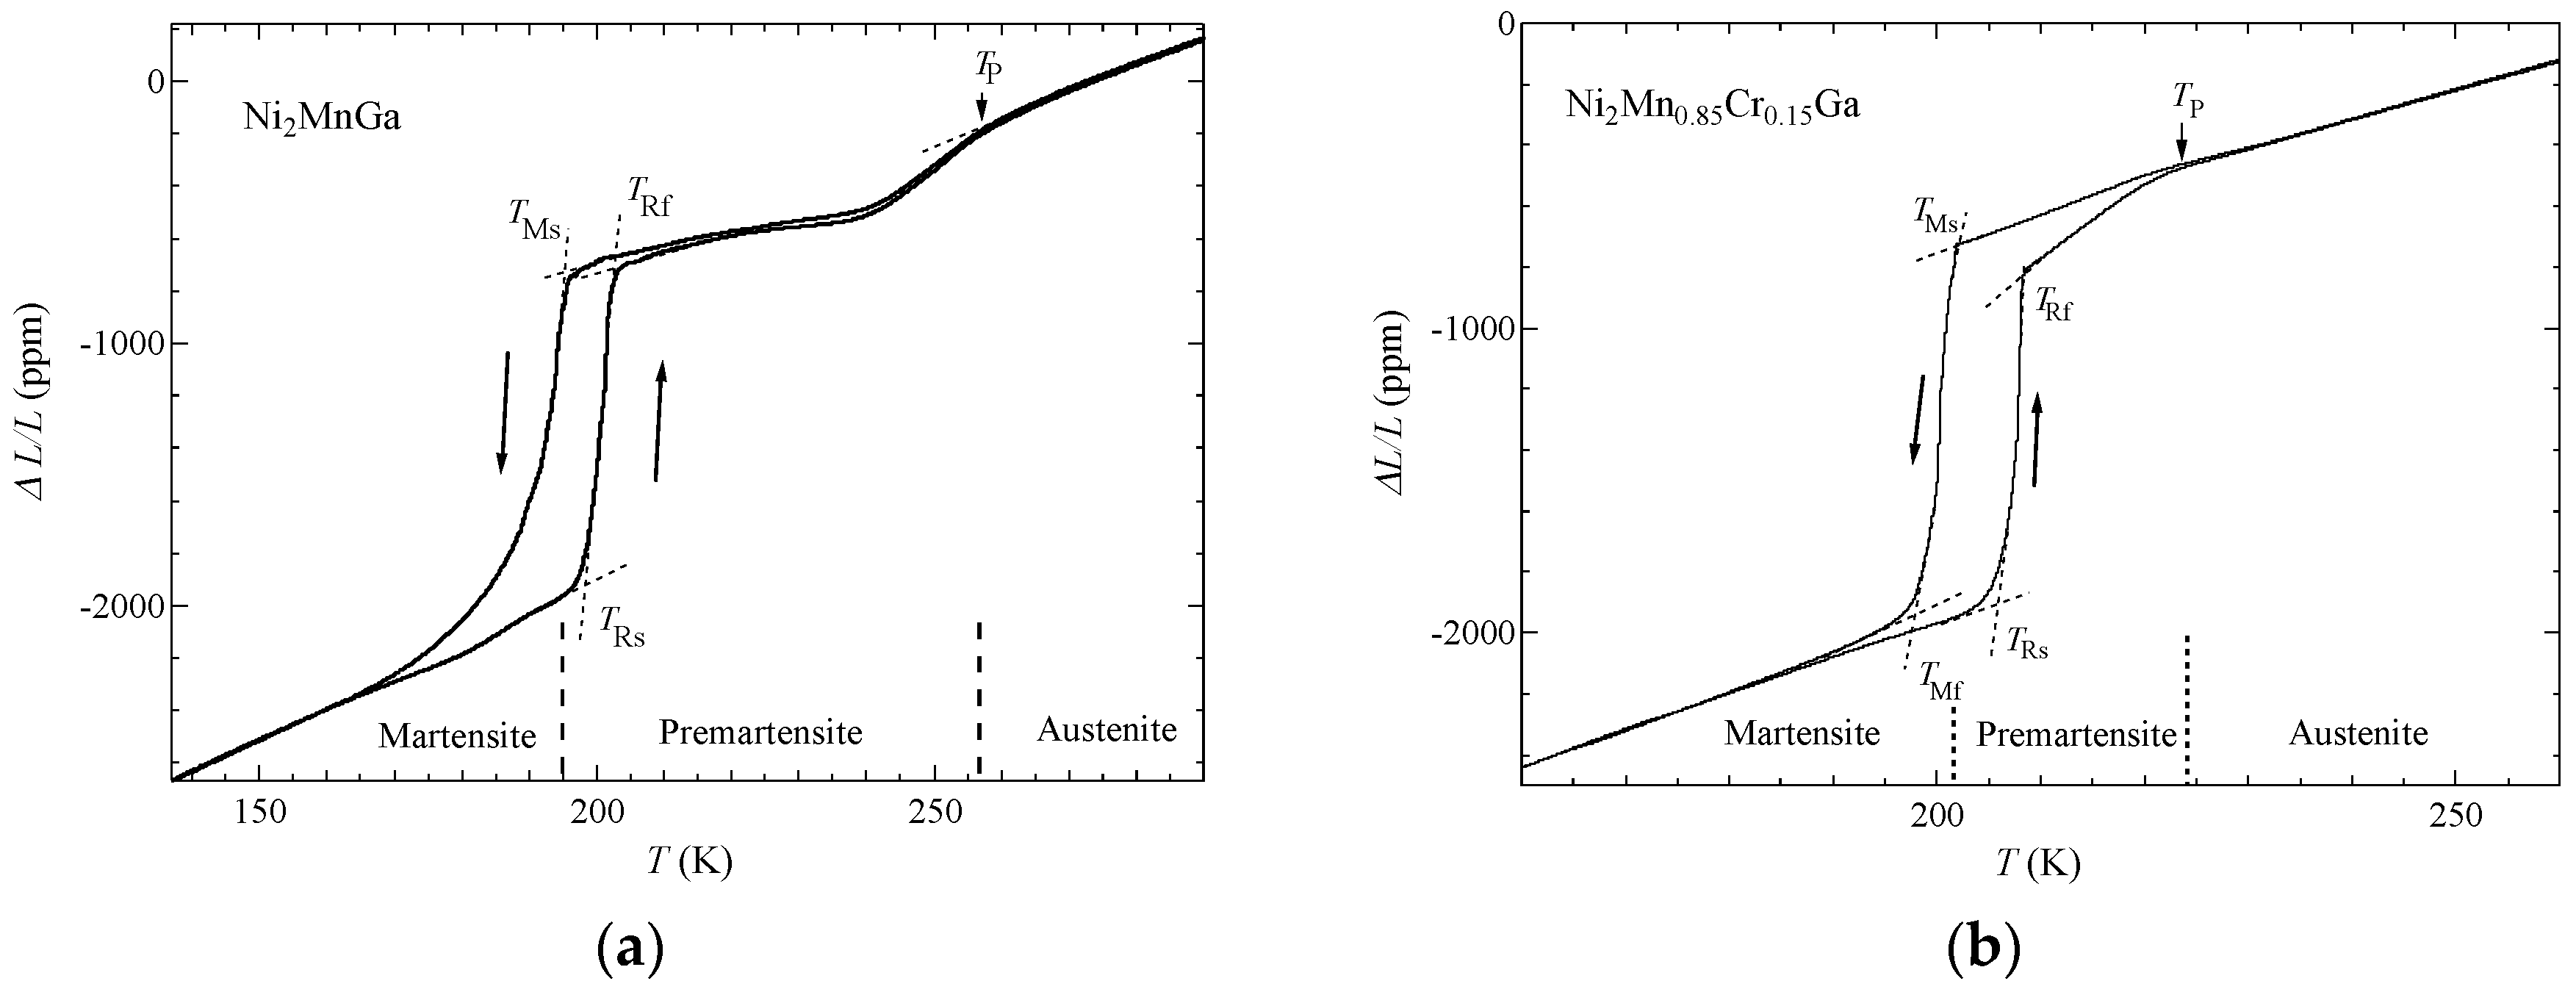
Figure 1 shows the temperature dependence of the linear strain ∆L/L in the (a) x = 0.00 alloy; (b) x = 0.15 alloy in zero field during cooling and heating. A jump is clearly seen between 195 K and 175 K in x = 0.00 alloy, and between 205 K and 195 K in x = 0.15 alloy, because of the martensitic transition during cooling and the reverse-martensitic transition during heating. In each alloy, approximately 1000 ppm shrinkage was observed during the martensitic transition in the cooling process. Linear strain measurements of single crystalline Ni2MnGa [1] and polycrystalline Ni49.6Mn27.3Ga23.1 [37] were performed. The strain values were practically the same as our result. Those results were less sensitive than our measurement. Therefore, our measurements are of higher resolution. Our result is comparable to the thermal strain observed by Albertini et al. [38] in polycrystalline Ni2MnGa.
Hysteresis is clearly seen between the martensitic and reverse-martensitic transitions, thus indicating that the martensitic transition is a first-order phase transition. Identical TP values were obtained for the cooling and heating processes; the difference was at most 0.2 K. Singh et al. [24] suggested from their high-resolution X-ray spectroscopy of single-crystal Ni2MnGa that a 3M-like structure develops in the premartensite phase. Considering this X-ray spectroscopy result, the linear thermal expansion results of polycrystalline sample in this study indicate that lattice deformation occurred below TP.
Figure 2 shows the permeability μ of the (a) x = 0.00 alloy; and (b) x = 0.15 alloy during heating and cooling in zero magnetic fields. For x = 0.00, the anomalies or jumps appeared at the martensitic transition at approximately 195 K, the premartensitic transition at approximately 255 K (at which the temperature shows a dip, which was as same as single crystal [23]), and the ferromagnetic transition at approximately TC = 375 K. When cooling from 400 K through the austenite paramagnetic phase, the value of μ increases at approximately 375 K, thus indicating a ferromagnetic transition in the austenite phase. The μ value dips slightly below 255 K and decreases strongly below 195 K. The permeability curve indicates that the magnetic anisotropy is small in the ferromagnetic austenite and premartensite phases. By contrast, the value of the permeability decreased drastically at the martensite phase transition. This result indicates that the magnetic anisotropy is large in the martensite phase. Considering that the thermal strain (as shown in Figure 1) decreases steeply with cooling between 260 K and 240 K and that the permeability shows a dip in this temperature range, we conclude that lattice deformation occurred because of the premartensitic transition. As a result, lattice deformation increases magnetic anisotropy.
As for x = 0.15, the anomalies (jumps) are due to the martensitic transition at approximately 200 K, the premartensitic transition at approximately Tp = 225 K, and the ferromagnetic transition at approximately TC = 340 K. The μ value dips slightly below 225 K and decreases strongly below 200 K. The magnetisation displays ferromagnetic properties at 5 K, with values of 83 Am2/kg for the x = 0.15 alloy at 4 MA/m [35]. Therefore, the martensite phase is a ferromagnetic phase. The permeability decrease in the ferromagnetic phase below 225 K is believed to be due to magnetic anisotropy. The permeability of Ni50.9Mn24.6Ga24.5 exhibited a dip around Tp, whereas Ni48.3Mn24.6Ga24.5Co2.6 showed a gradual decrease below Tp. Ni50.9Mn24.6Ga24.5 and Ni48.3Mn24.6Ga24.5Co2.6 have the same properties at x = 0.00 and x = 0.15, respectively [39]. The hysteresis (difference in cooling and heating process) of μ of x = 0.15 in the premartensite phase is presumed to be due to the difference of the nucleation in the premartensite phase in cooling and heating process. The permeability of No. 3 (Ni51.7Mn24.3Ga24.0 polycrystal, TMs = 265 K, TRf = 273 K, Tp = 285 K) shows clear hysteresis in the premartensite phase [40]. The difference between TMs and Tp, ∆T = Tp − TMs = 20 K. This is smaller than ∆T = 63 K for x = 0.00 in this work. As for x = 0.15, ∆T = 25 K. Therefore, it is supposed that the hysteresis of the permeability appears when ∆T is small.
When the magnetic anisotropy is small, the magnetic moments are easily directed along the applied alternative magnetic fields in permeability measurements. By contrast, large magnetic anisotropies mean that the magnetic moments are less easily directed along the applied AC magnetic fields. In the ferromagnetic martensite phase (tetragonal symmetry), the magnetic anisotropy is larger than in the austenite phase (cubic symmetry), thus indicating that the permeability is small [41]. Taken together, the permeability decreased below 225 K as shown in Figure 2b and the linear-strain anomaly below TP shown in Figure 1b imply that lattice deformation and the change of magnetic anisotropy have occurred because of the premartensitic transition. The TC values for cooling and heating are almost the same, consistent with the linear-strain results. The TP values found for cooling and heating are also the same. Soto et al. [42] studied Fe-doped NiMnGa (Ni52.5−xMn23Ga24.5Fex) alloys, finding that the premartensitic transition temperature was 186 K for the x = 4.4 alloy. No significant thermal hysteresis was detected at the premartensitic transition, and no appreciable features were observed in the calorimetric curves at the premartensitic transition. By contrast, our permeability measurements showed a small dip at the premartensitic transition, and the linear strain and permeability exhibited clear variations for the x = 0.15 alloy. Uijttewaal et al. [43] state that the contributions of both magnons and phonons to the free energy of premartensite and austenite only “slightly differ” and that the existence of the premartensitic transition results from a delicate interplay between the vibrational and magnetic excitation mechanisms. We considered that the clear variation in the linear strain indicates lattice deformation and a softening of the lattice. Therefore, changes in the magnetic state are ultimately reflected in the permeability changes.
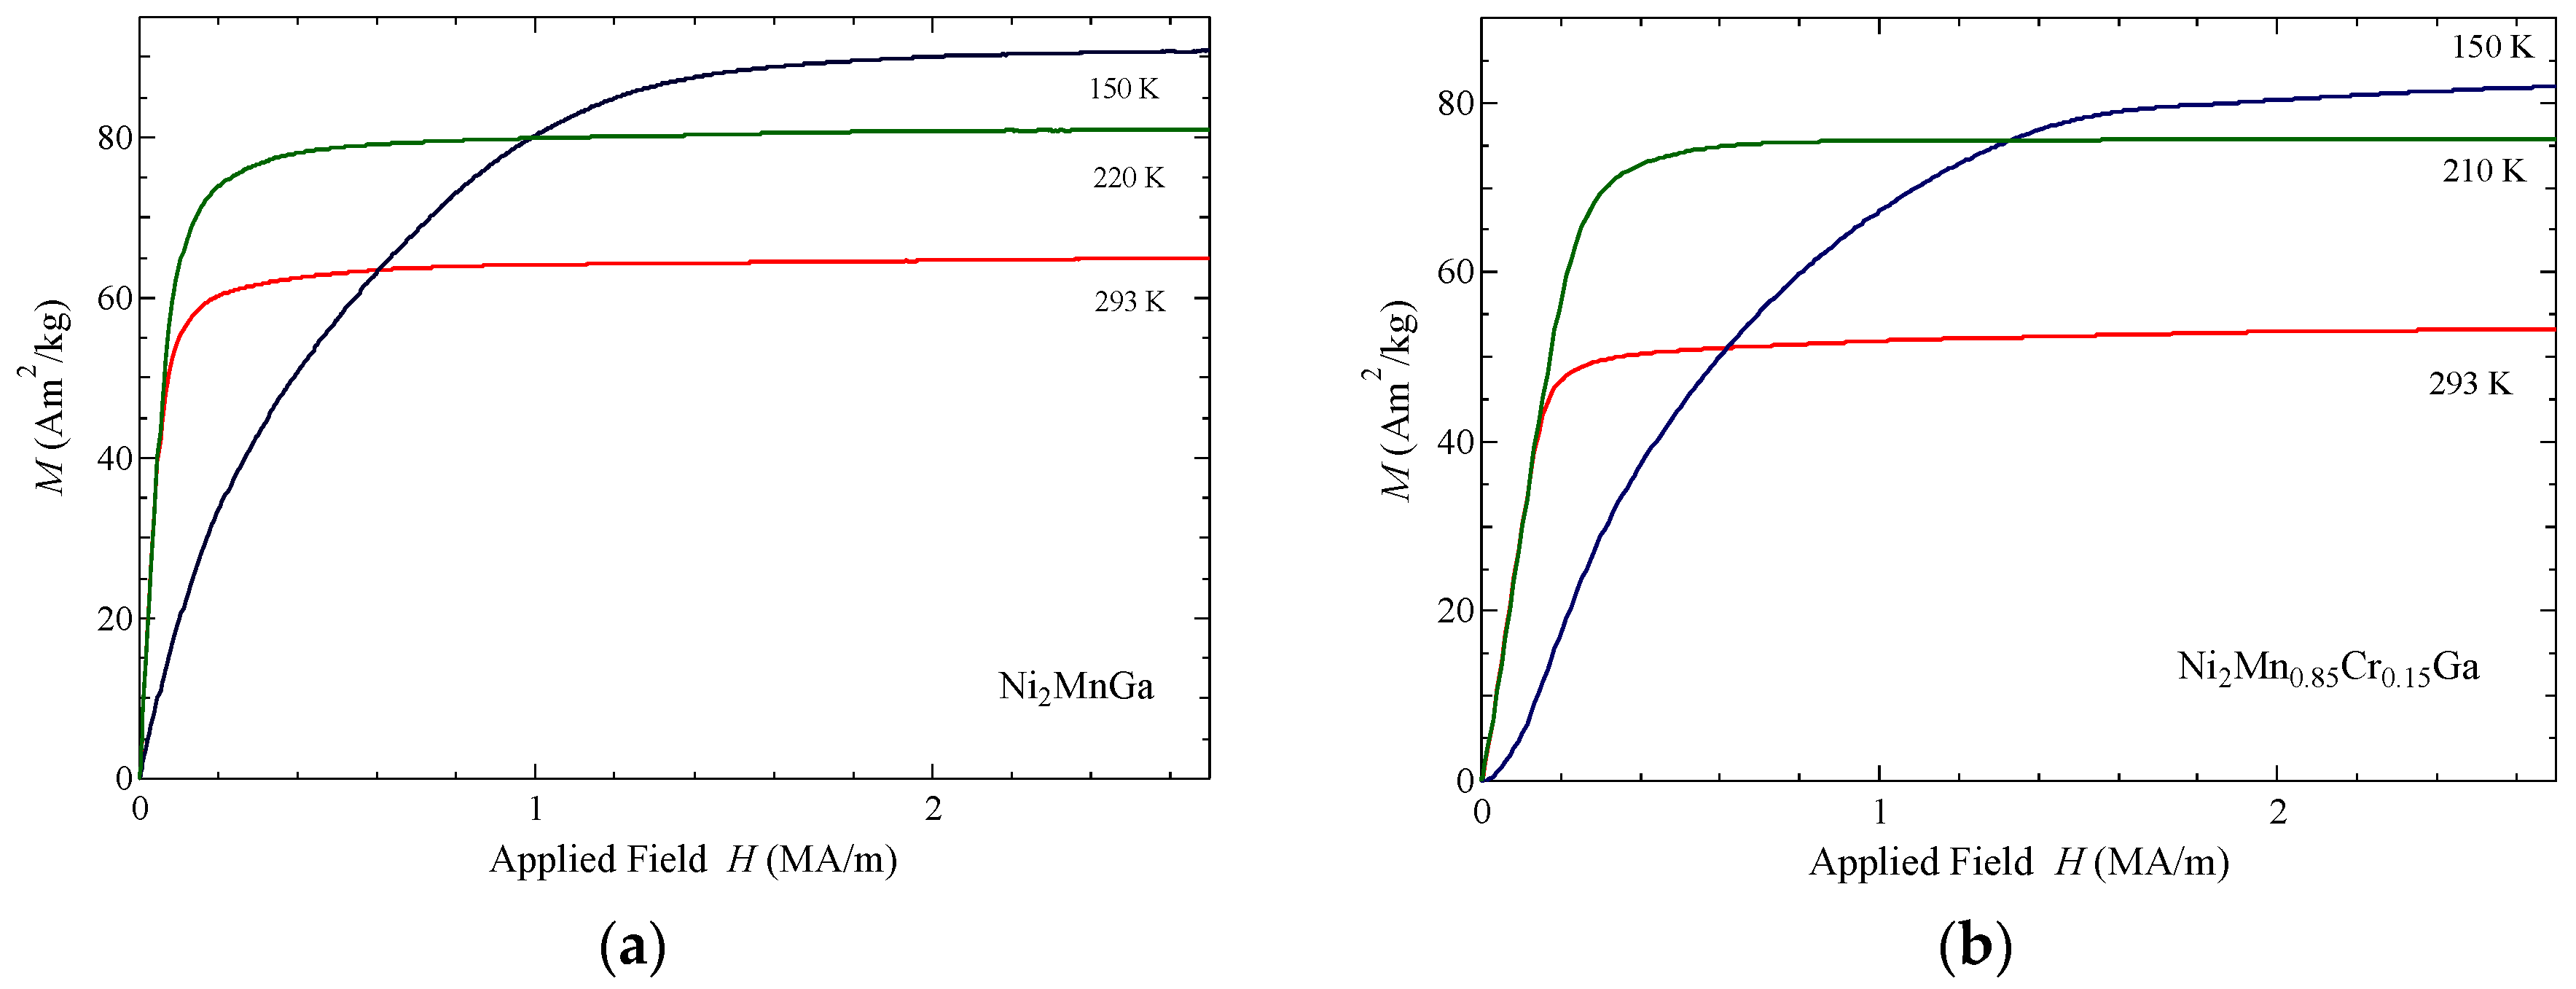
Figure 3 shows the magnetisation curve for the (a) x = 0.00 alloy and (b) x = 0.15 alloy measured during cooling process. As for x = 0.00, the magnetisation becomes almost saturated around 0.24 MA/m above 220 K, thus indicating that the magnetic anisotropy is small. At 200 K, which is slightly higher than TMs, the magnetisation increases steeply from 0 MA/m. This value is comparable to the results for the permeability at 200 K because the gradient of the magnetisation is proportional to the permeability. In the martensite phase at 150 K, the magnetisation increases gradually with increasing magnetic-field strength because of large magnetic anisotropy. The properties of magnetisation curves for x = 0.15 are almost the same as those for the x = 0.00 alloy.
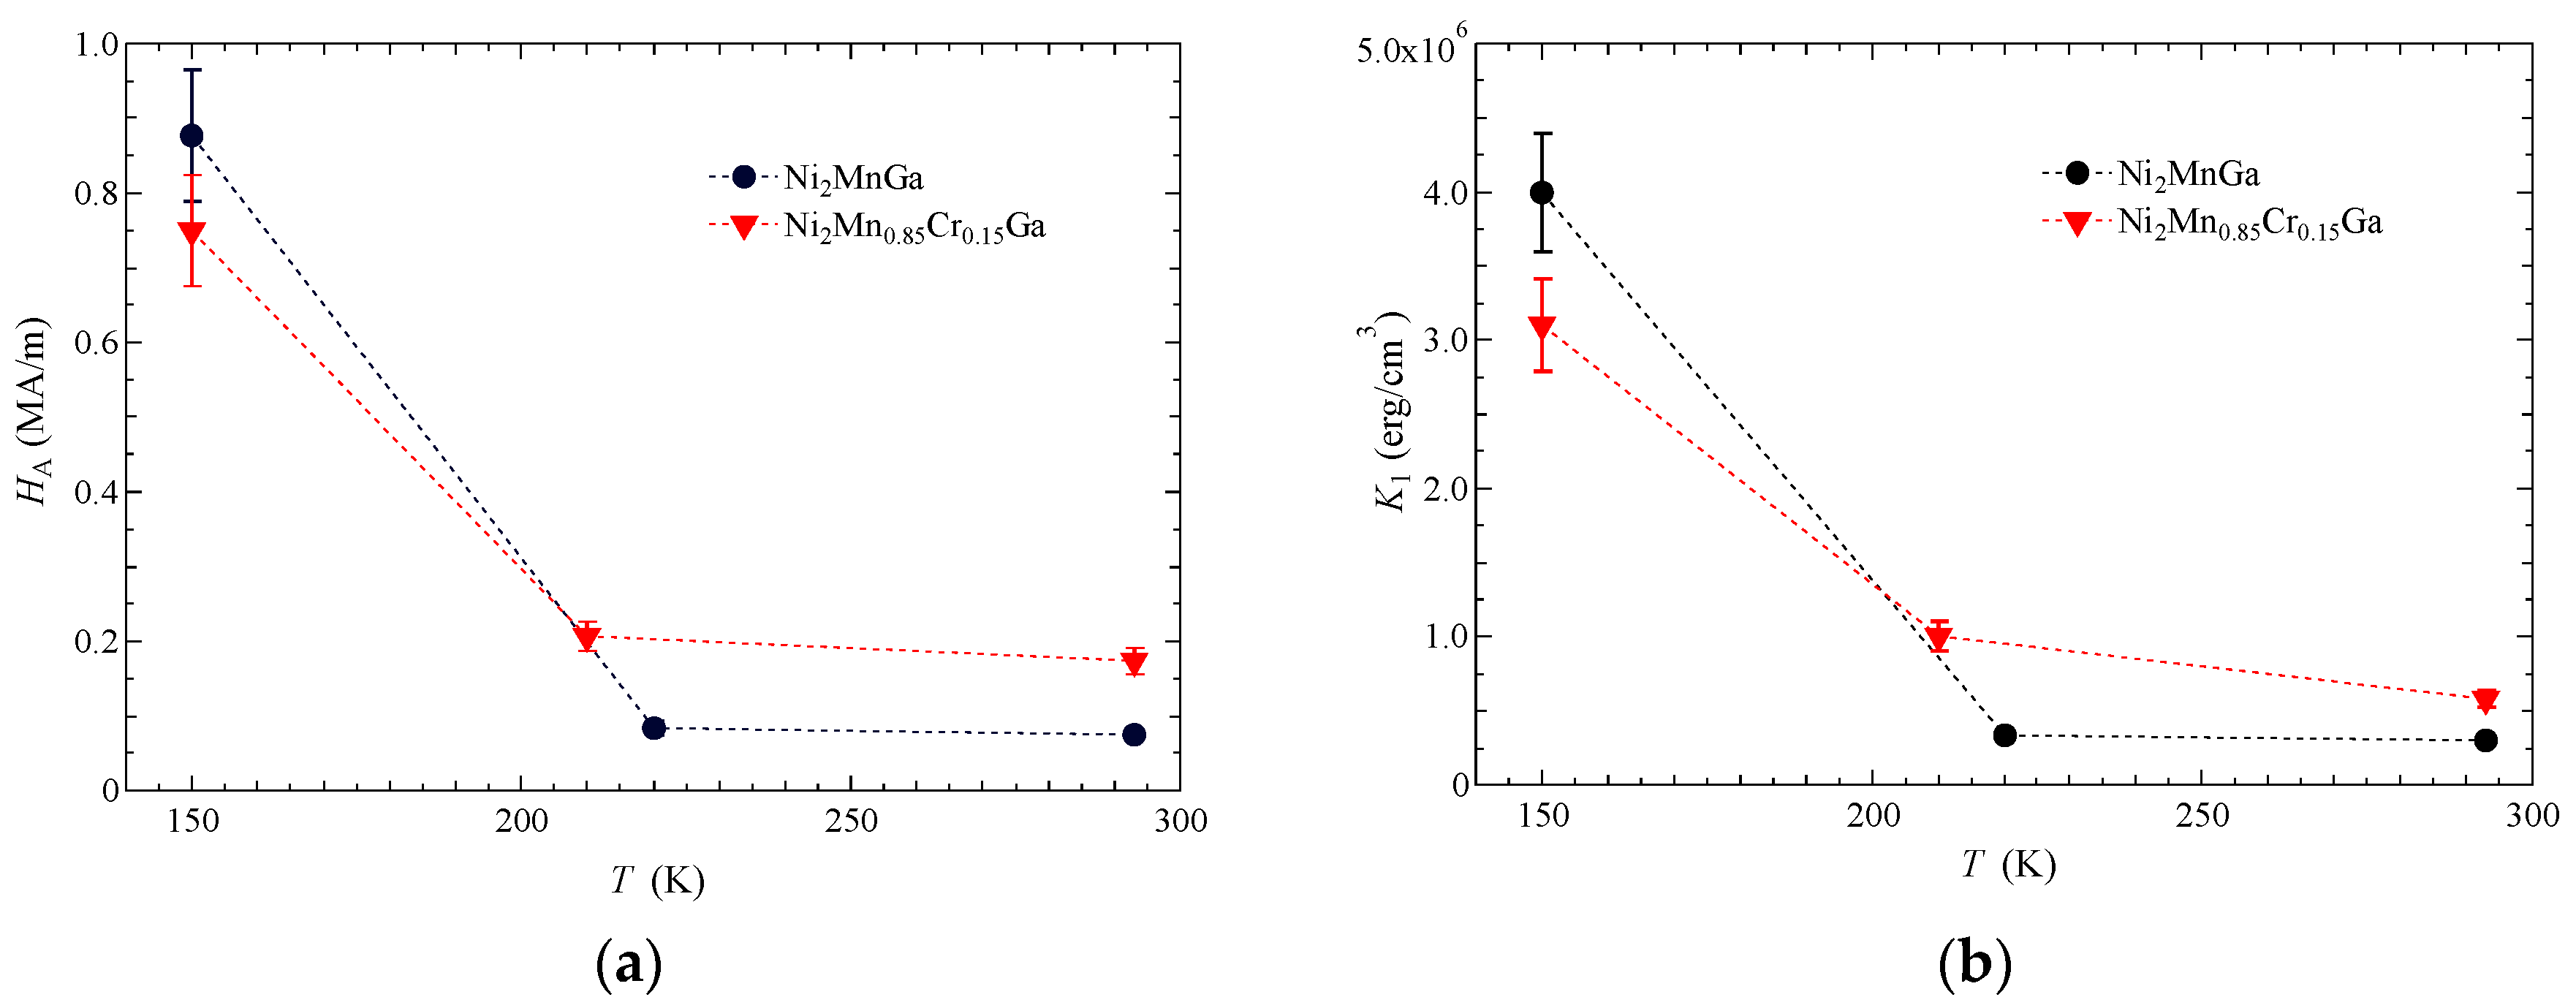
To determine the amount of magnetic anisotropy, we determined the magnetic-anisotropy field HA from the magnetisation results. This quantity was obtained by the peak of the twice-differentiated magnetisation curve, d2M/d (μ0H)2, by means of the derivation method of HA by the analysis of the magnetization of Ni2MnGa by Chu et al. [44]. The magnetic-anisotropy constant K1 is then provided by the equation K1 = μ0MSHA/2 [38,44], where MS is the saturation value of the magnetisation. This approach is not the actual way to properly determine the magnetic anisotropy, and might be an approximation. Therefore, error bars are indicated in Figure 4a,b. The resulting values of HA and K1 are shown in Figure 4a,b, respectively. From the saturated magnetisation Ms obtained from the magnetisation curves in Figure 3 and from these values of HA, we found the value of K1 at 150 K in the martensite phase to be K1 = 4.0 × 10⁶ erg/cm3 in cgs-emu unit. This value is comparable to other results for K1 [38,44]. The values of K1 at 220 K in the premartensite phase and at 293 K in the austenite phase are similarly found to be K1 = 0.34 × 10⁶ erg/cm3 and K1 = 0.30 × 10⁶ erg/cm3, respectively, approximately one-tenth of the value at 150 K. Albertini [38] also suggested that the value of K1 above the martensitic transition temperature is smaller than that in the martensite phase.
As for x = 0.15, the HA at 150 K in the martensite phase is smaller than that for the x = 0.00 alloy at 150 K. Above TMs, the HA is considerably smaller than at 150 K in the martensite phase. Conversely, the values of HA in the premartensite and austenite phases are larger than those for the x = 0.00 alloy. The resulting value of K1 at 150 K in the martensite phase is K1 = 3.1 × 10⁶ erg/cm3, whereas the values at 210 K in the premartensite phase and at 293 K in the austenite phase are K1 = 1.0 × 10⁶ erg/cm3 and K1 = 0.58 × 10⁶ erg/cm3, respectively. Similar to the case for the x = 0.00 alloy, the permeability exhibits a small dip around Tp. By contrast, we found a large decrease below Tp for the x = 0.15 alloy. This result indicates that both the magnetic anisotropy and the value of K1 in the premartensite phase for x = 0.15 are larger than those for x = 0.00.
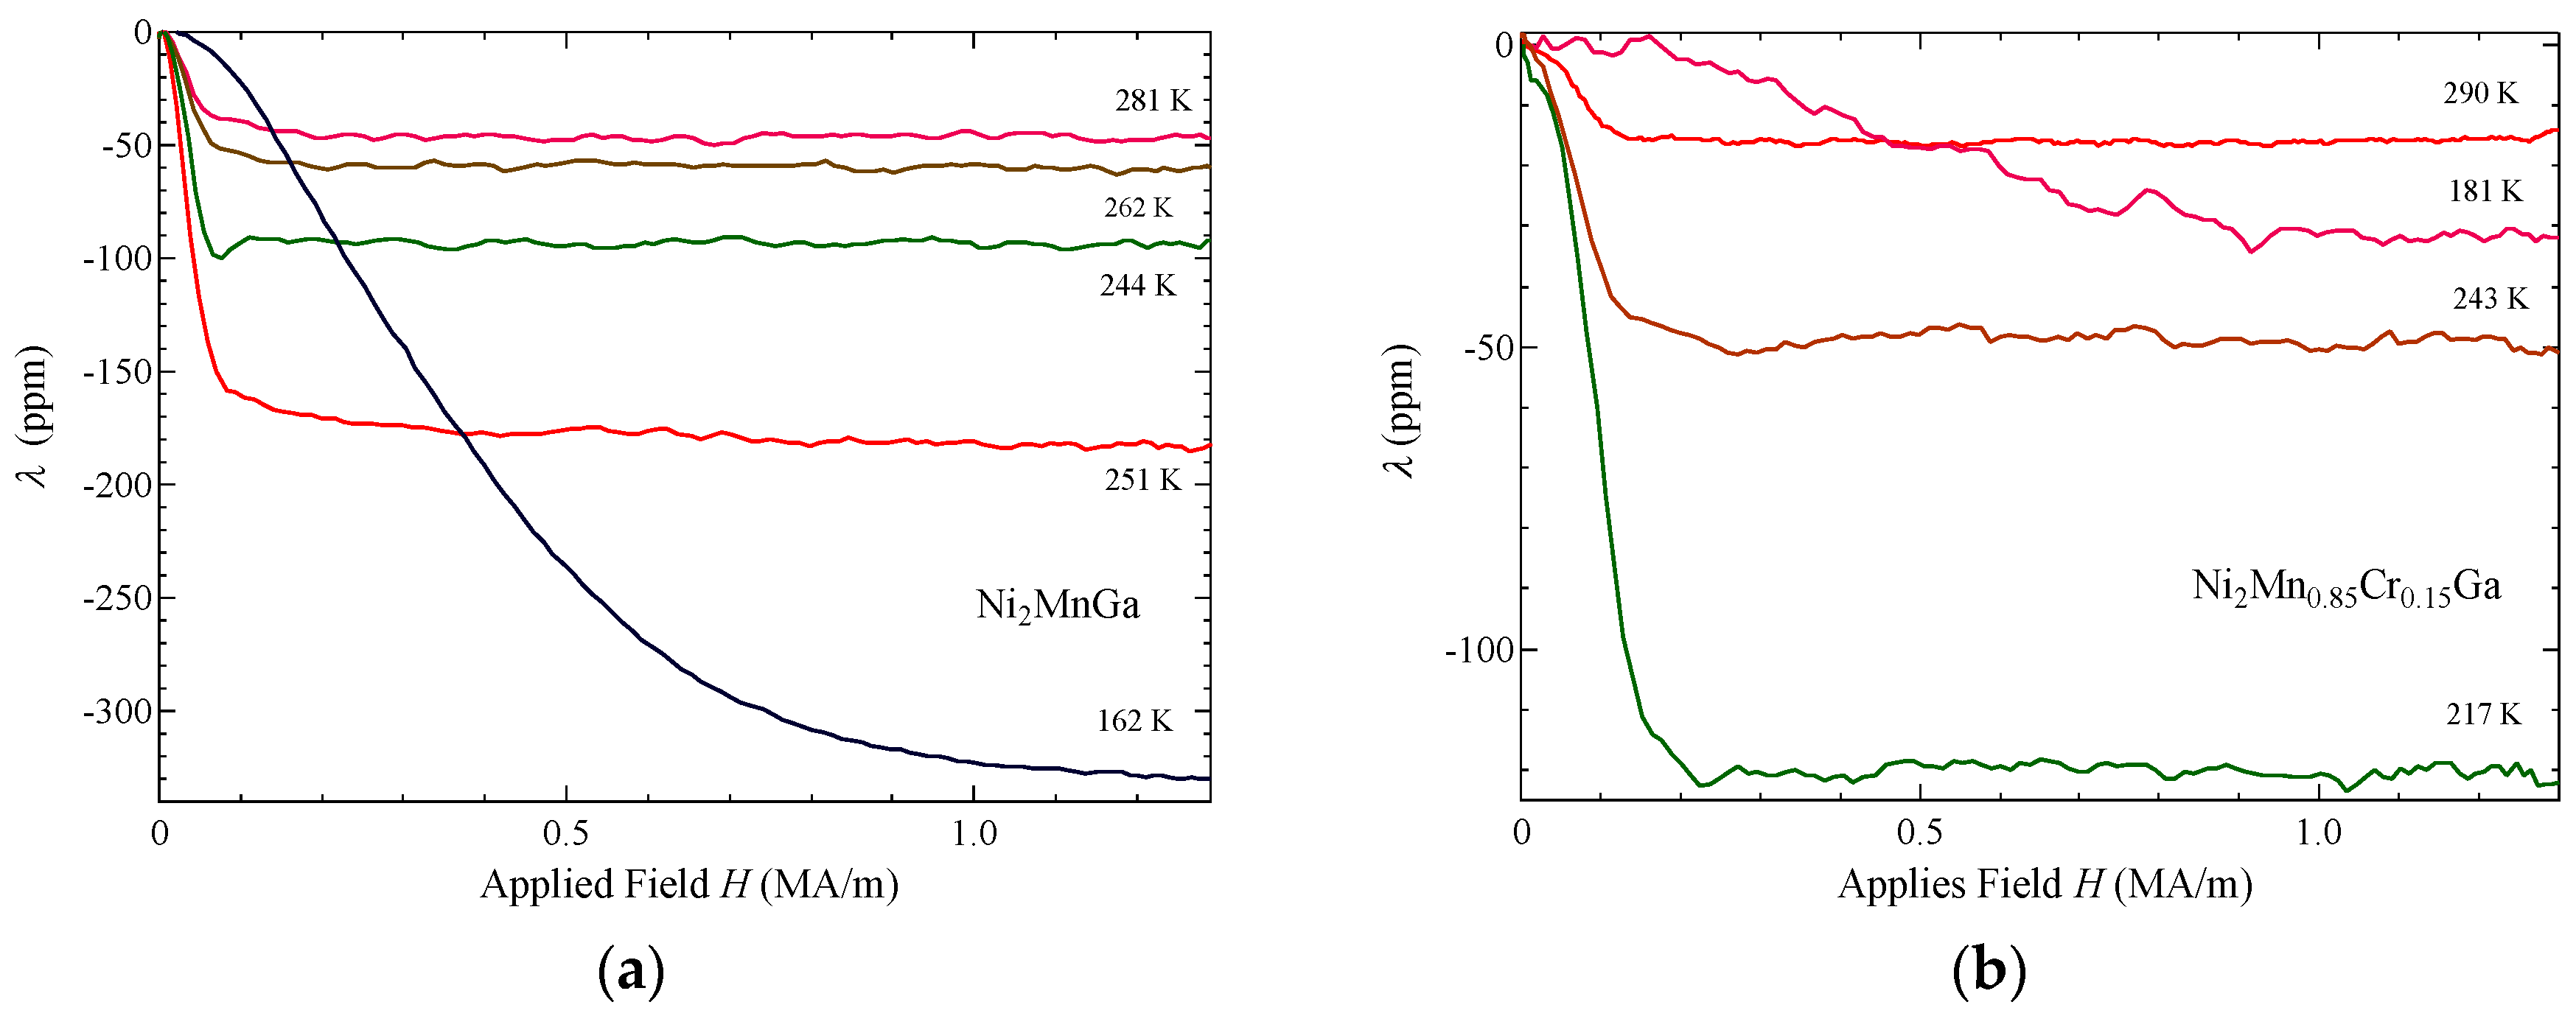
We measured the magnetostriction by using the two-gauge method described in Section 2. Figure 5 shows the magnetostriction for the (a) x = 0.00 alloy; and (b) x = 0.15 alloy. As for x = 0.00, the magnetostriction saturated above 0.08 MA/m in the austenite and premartensite phases. This finding is consistent with the value of the magnetic-anisotropy field HA = 0.083 MA/m at 220 K (premartensite). By contrast, at 162 K in the martensite phase, the magnetostriction increased with increasing field strength, although it showed indications of saturation at 1.27 MA/m. In other words, in order to generate a high driving force for the magnetic domains variants, highly anisotropic and highly saturated magnetisation values are needed [9]. In the austenite and premartensite phases, the magnetic anisotropy was small; therefore, the motive force acts only below 0.083 MA/m. However, in the martensite phase, the anisotropy field and the magnetic-anisotropy constant K1 were large (as mentioned above, the value of K1 in the martensite phase was more than 10 times larger than that in the premartensite phase). Therefore, under weak magnetic fields, the variants cannot move because of the high magnetic anisotropy. The motive force then acts until 1.27 MA/m, and large magnetostriction was observed. Regarding x = 0.15, a magnetostriction of −120 ppm was observed in the premartensite phase. In the austenite and premartensite phases, the magnetostriction saturated above 0.24 MA/m, which corresponds to the anisotropic field HA = 0.21 MA/m obtained from the magnetisation curves at 210 K. The magnetostriction in the martensite phase (181 K in Figure 5b) saturated at 0.95 MA/m, which is comparable to the value of HA = 0.75 MA/m at 150 K. Considering the permeability shown in Figure 2b and the magnetisation plotted in Figure 3b, we conclude that this result is due to the large magnetic anisotropy in the martensite phase.
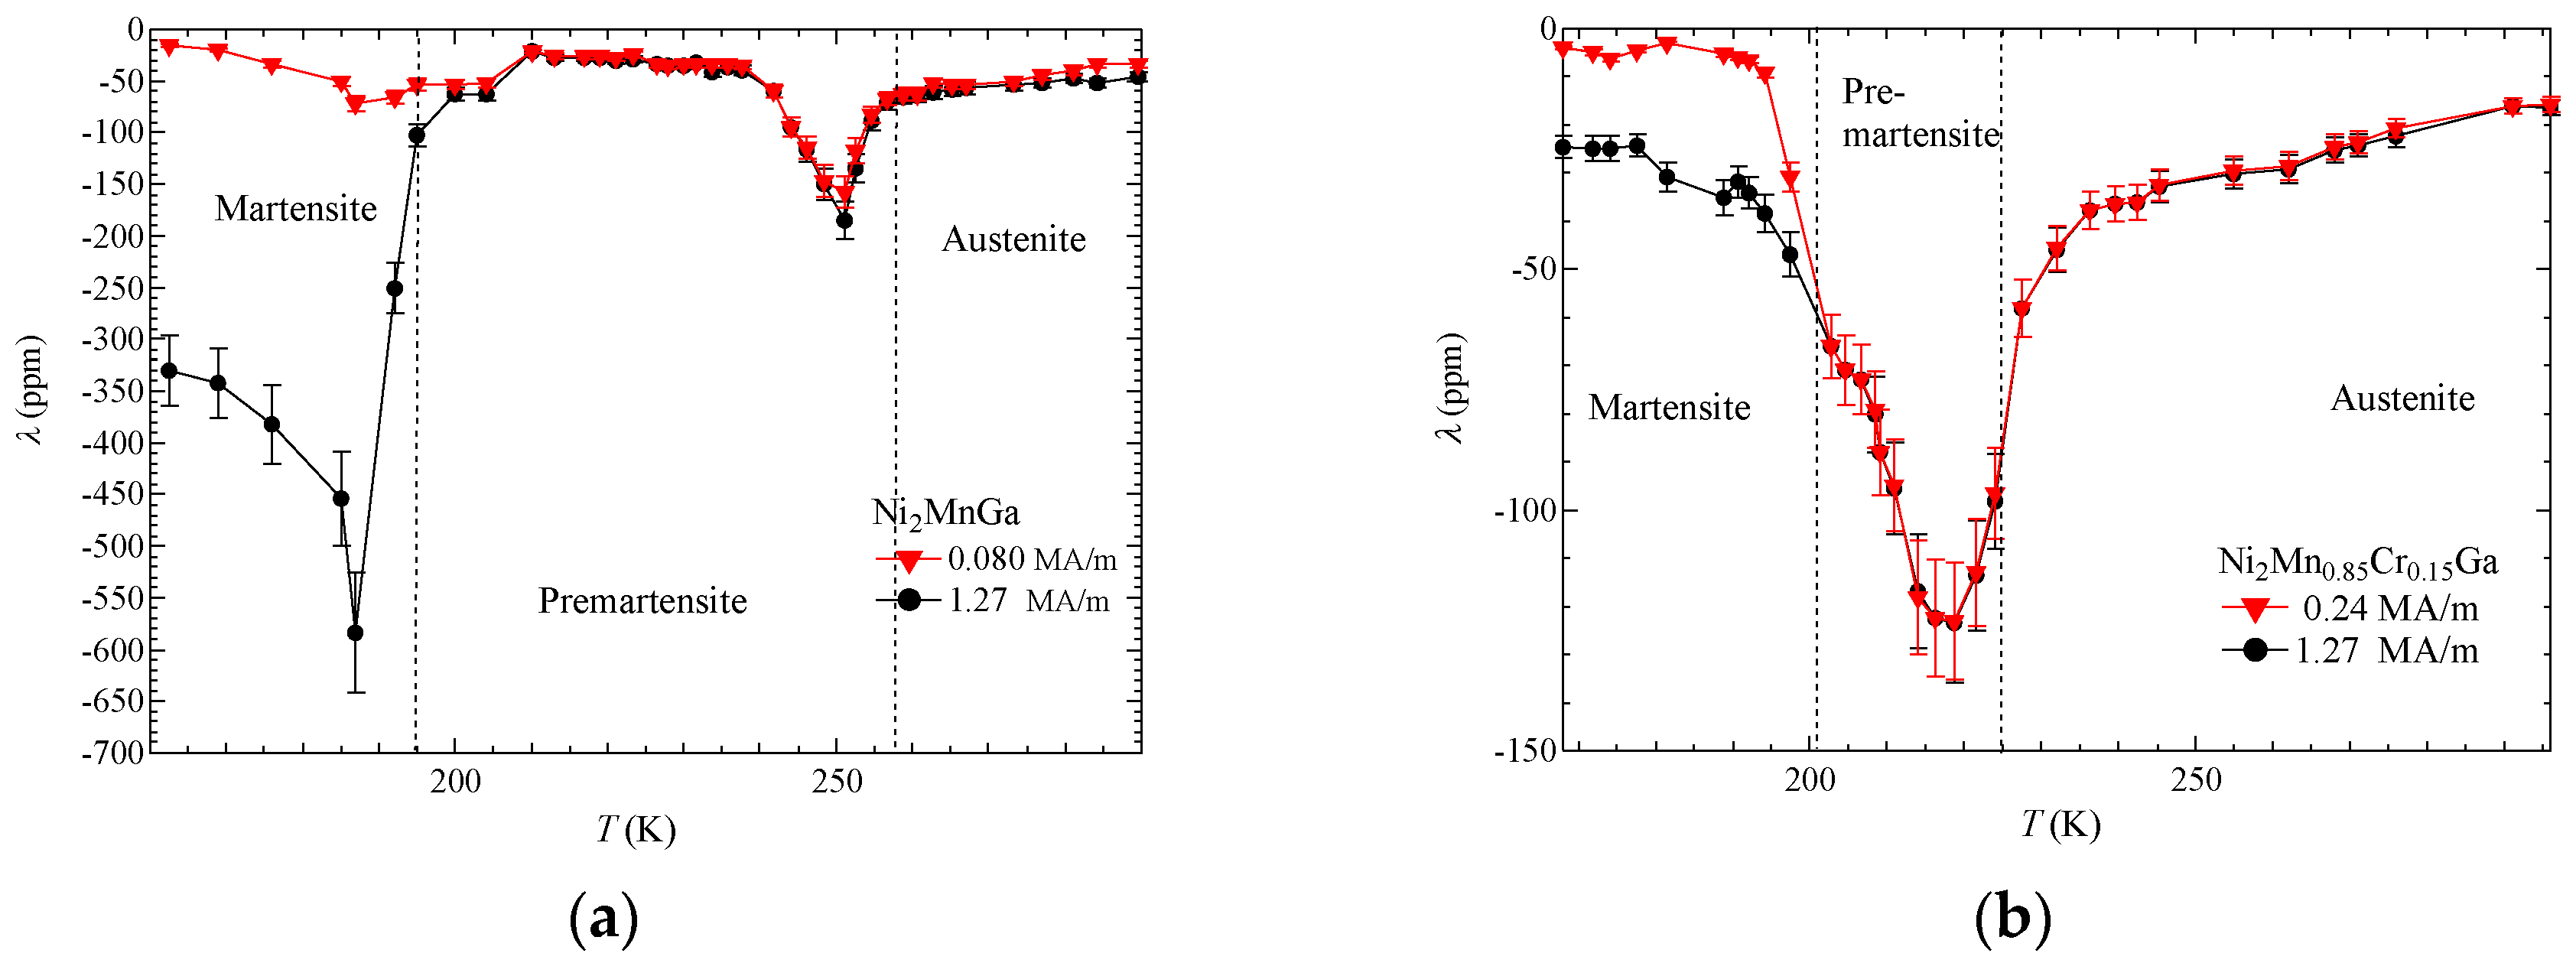
Figure 6 shows the temperature dependence of the magnetostriction values for the (a) x = 0.00 alloy and (b) x = 0.15 alloy. As for x = 0.00, in the austenite phase, the magnetostriction value was approximately −60 ppm at 290 K, and the absolute magnetostriction value increased slightly with cooling. In the premartensite phase, the absolute magnetostriction value increased drastically, reaching a magnetostriction value of −180 ppm at 250 K. The sudden decrease between 260 K and 240 K in Figure 6a corresponds to the temperature range in which the dip in permeability is seen (Figure 2a). Singh et al. [24] suggested that a 3M premartensite phase appears below TP; therefore, the magnetostriction is correlated with lattice deformation and magnetic anisotropy. Ultrasonic measurements indicate that the shear elastic C’ coefficient, C’ = (C11 − C12)/2, decreases around TP [17], indicating that lattice softening occurred around TP. The magnetostriction at 1.27 MA/m increased drastically around the martensitic transition temperature TM. At 162 K, we observed a magnetostriction of −330 ppm. This temperature dependence of the magnetostriction has the same shape as the magnetostrain of Ni2MnGa single crystals measured at 0.4 MA/m [25]. Figure 6a also shows the temperature dependence of the magnetostriction at 0.080 MA/m, as indicated by the triangle symbols. The value of the magnetic-anisotropy field HA in the austenite and premartensite phases is approximately 0.083 MA/m; we also show the magnetostriction values at 0.080 MA/m near HA in Figure 6a. A sharp peak can be observed just below the premartensitic transition temperature Tp (which was defined by the thermal strain measurement in Figure 1a). In the martensite phase, the magnetic anisotropy is larger than in the premartensite phase, thus indicating that the variants cannot move in low magnetic fields. As for x = 0.15, the temperature dependence of the saturated magnetostriction values at 0.24 MA/m is equal to the anisotropic field in the austenite and premartensite phases. The full width at half maximum (FWHM) of the peak in the premartensite phase is 20 K. By contrast, the FWHM for the x = 0.00 alloy (Figure 6a) is only 10 K, thus indicating that the anomaly (dip) in the permeability of the x = 0.15 alloy is larger than that of the x = 0.00 alloy.
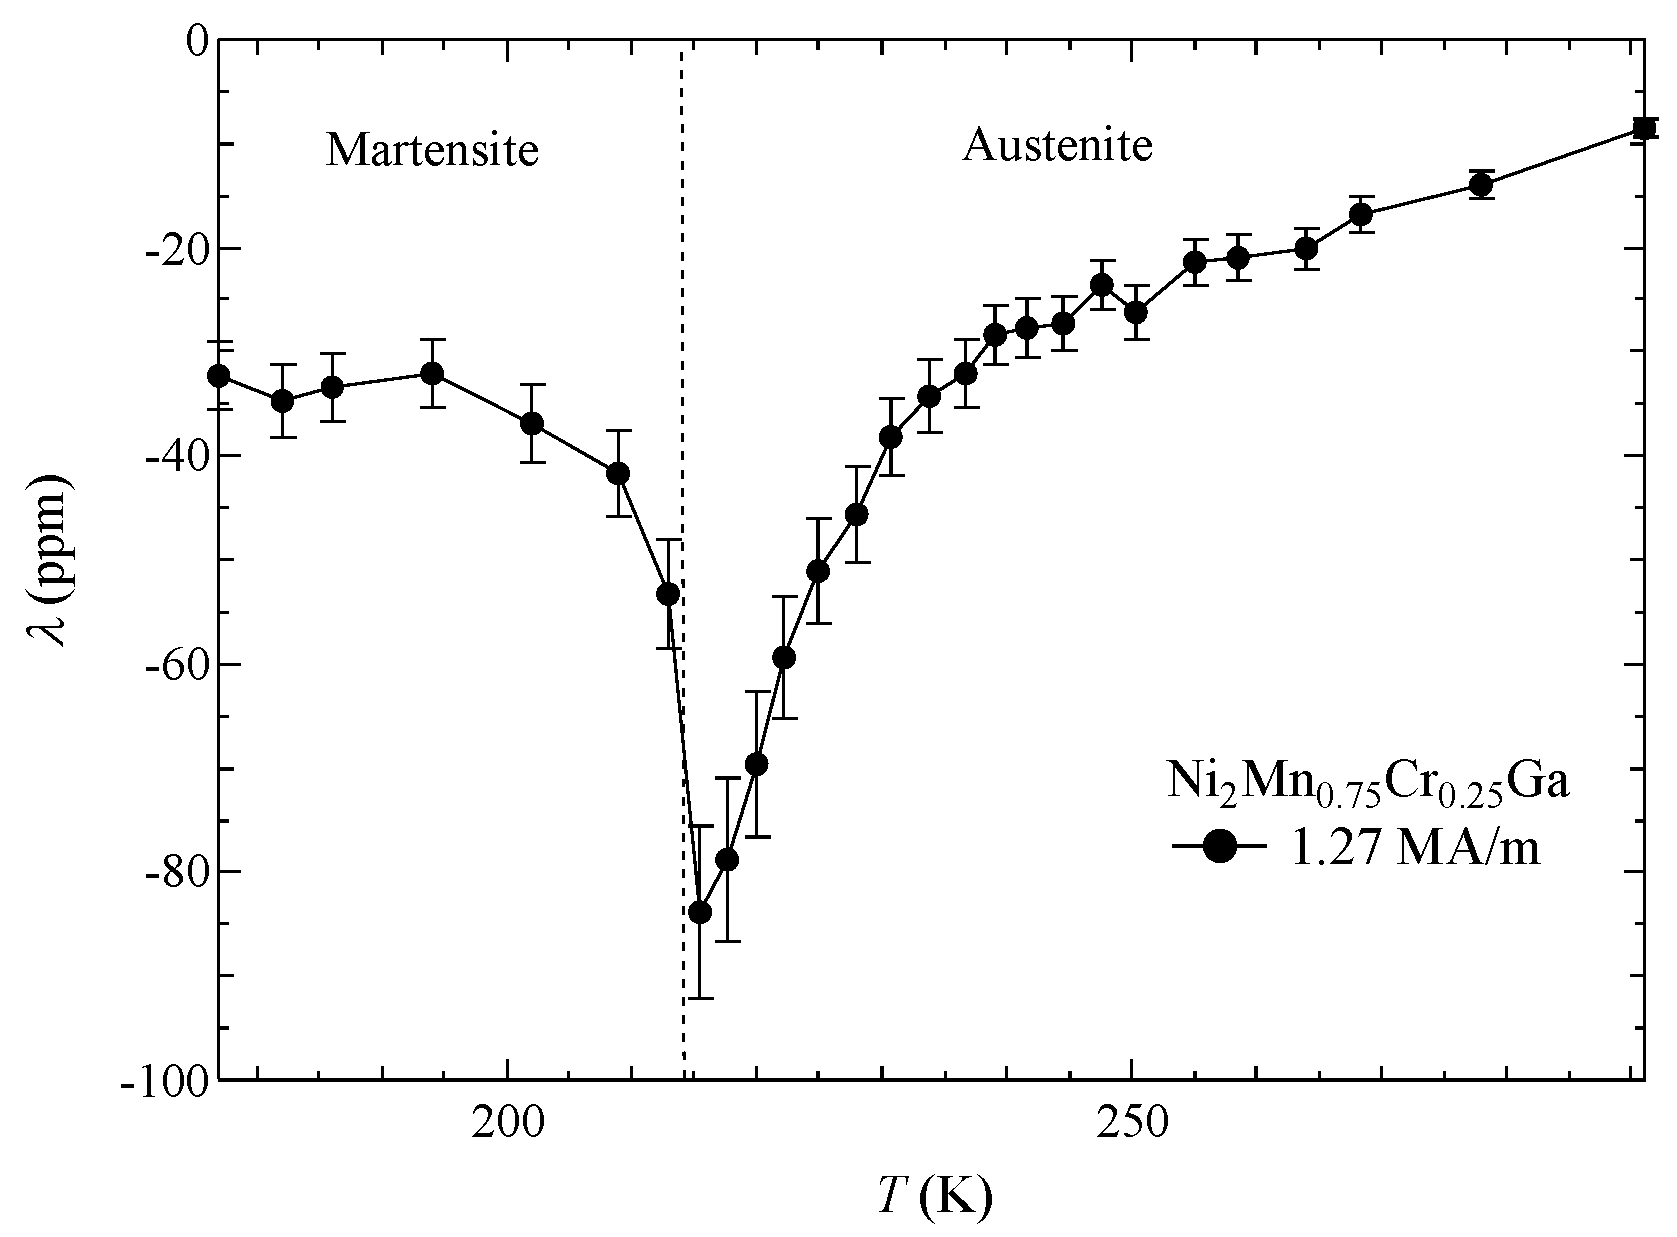
In the martensite phase, the magnetostriction for the x = 0.15 alloy at 1.27 MA/m and 180 K (−35 ppm) was noticeably smaller than that of the x = 0.00 alloy at 1.27 MA/m and 163 K (−330 ppm); the temperature was approximately 35 K lower than TMs. This finding suggests that the amount of magnetostriction decreased with increasing Cr concentration. We also measured the magnetostriction for an x = 0.25 alloy, which had a martensitic transition starting temperature TMs = 214 K.
Figure 7 shows the temperature dependence of the magnetostriction for the x = 0.25 alloy at 1.27 MA/m, which peaks around TMs. This property is the same as for the Ni52.3Mn23.1Ga24.6 and Ni2MnGa alloys [13,26]. The magnetostriction of the x = 0.25 alloy at 1.27 MA/m in the martensite phase is between −30 ppm and −35 ppm, which is equal to that of the x = 0.15 alloy. These results confirm that the magnetostriction decreases with increasing Cr concentration. For the x = 0.00 alloy, the magnetic-anisotropy constant (K1 = 4.0 × 10⁶ erg/cm3) was larger than that for the x = 0.15 alloy (K1 = 3.1 × 10⁶ erg/cm3). The magnetisation value for the x = 0.00 alloy was also larger than that for x = 0.15. We conclude that larger magnetic anisotropy and larger magnetisation generate larger magnetostriction. However, the change in the amount of magnetostriction is considerably larger than the changes in magnetisation or magnetic anisotropy. Matsui et al. [40] measured the magnetostriction of a Si-doped Ni2MnGa polycrystal and found that the amount of magnetostriction in the martensite phase was considerably smaller than that of a Ni2MnGa polycrystal. Conversely, the MFIS for an Fe-doped Ni52Mn16Fe8Ga24 single crystal is 7.5 × 10³ ppm, which is twice as large as that of a Ni52Mn24Ga24 single crystal (3.5 × 10³ ppm) [12]. They mentioned that Fe substitution for Mn improves the temperature dependence of MFIS.
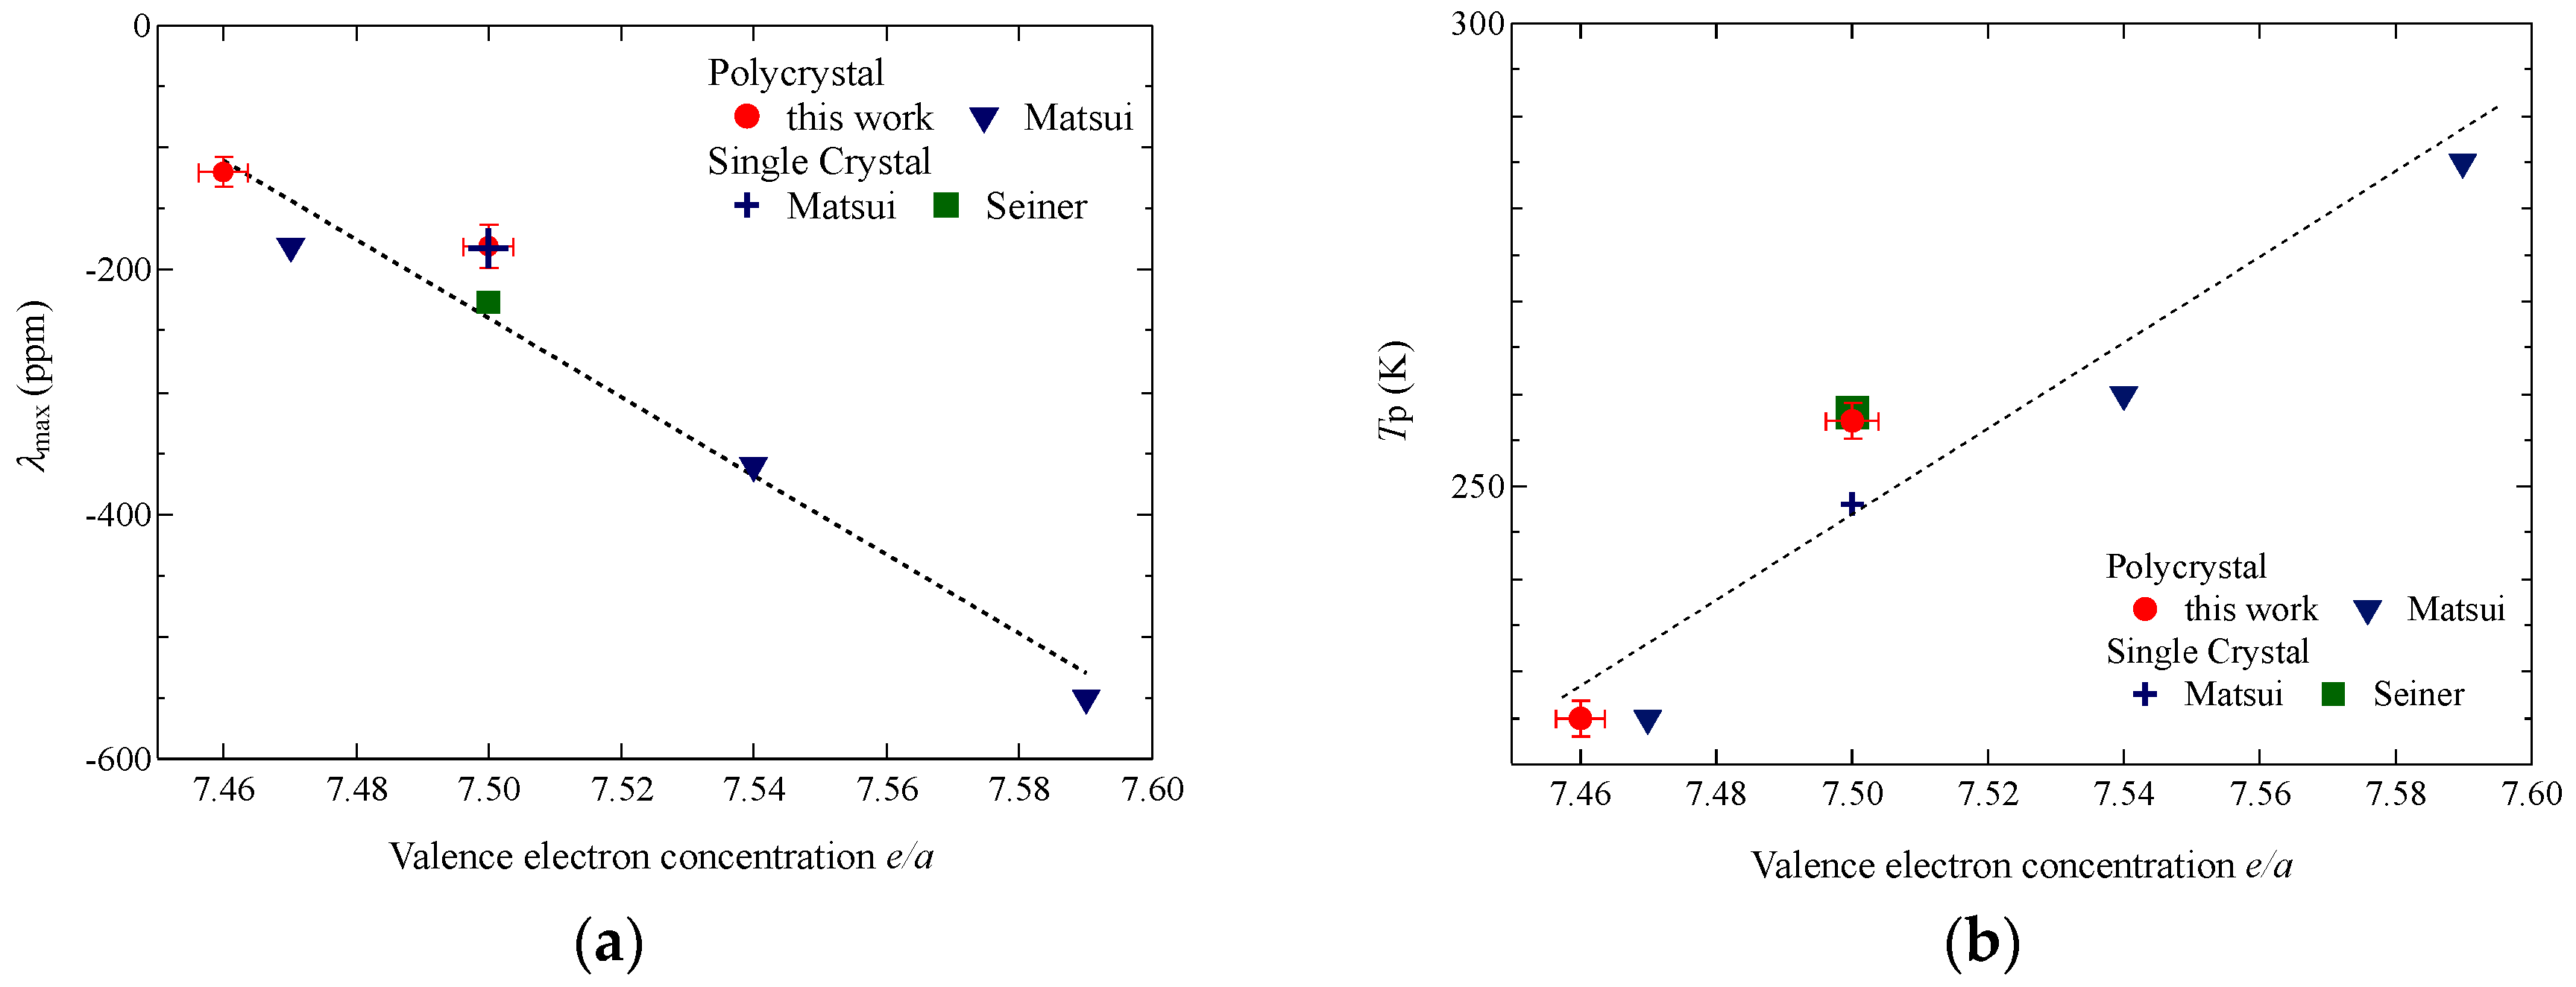
In order to investigate the relation between valence electron e/a and the magnetostriction value around the premartensitic transition, Figure 8 (a) demonstrates the relationship between e/a and the magnetostriction value around TP. Figure 8 (b) demonstrates the e/a dependence of the TP. Table 1 shows the valence electron e/a, the premartensite temperature TP, and peak value of the magnetostriction around the TP for each composition. Three Ni-Mn-Ga polycrystals [26,40], two Ni2MnGa single crystals [17,26], x =0.00, and x = 0.15 were used for this figure. To compare between the polycrystal and single crystal, the magnetostriction λ of the single crystal was calculated as λ ≈ 2λ100/3, where λ100 is the magnetostriction parallel to the [100] axis. The magnetostriction is almost proportional to the e/a. As shown in Figure 8b, the Tp is also almost proportional to the e/a. It was reported earlier that Tp is proportional to the e/a [45]. From these results, it is considered that the electron energy, the magnetostriction, and the Tp are correlated each other. In doped Ni2MnGa alloys, the e/a values change; therefore, it is considered that the itinerant electric and magnetic states also vary. As a result, the magneto-structural strain (magnetostriction or MFIS) can be changed.
Further research is needed both for the kinetic physics and for the itinerant magnetism for Ni2MnGa-related alloys. The martensitic transformation in stoichiometric Ni2MnGa alloys is preceded by a weakly first-order transformation from a high-temperature cubic phase to a near-cubic, modulated, intermediate (premartensite) phase related to the presence of a soft phonon mode [46]. The appearance of this transformation has been proposed as a consequence of magneto-elastic coupling. An inelastic neutron-scattering experiment performed in an external magnetic field also indicated a strong magneto-elastic interaction at the premartensitic transition. We conclude that the large magnetostriction of the x = 0.15 alloy is related to lattice softening in the premartensite phase, similar to that with the x = 0.00 alloy. We expect that magnetostriction can be observed in the premartensite phase because of the softening caused by a perturbing magnetic field. Further studies (acoustic measurements, etc.) are needed to clarify these issues.
4. Conclusions
We have measured the thermal strain, permeability, magnetisation, and magnetostriction of novel magnetic Heusler Ni2Mn1 − xCrxGa polycrystals. The thermal expansion measurements show an anomaly, thus indicating that lattice deformation occurs below the premartensitic transition temperature TP. The permeability measurements also show an anomaly at the premartensitic transition. From the magnetisation results, we obtained the magnetic-anisotropy constant K1. In the martensite phase, we found the magnetic-anisotropy constant for the x = 0.00 alloy (K1 = 4.0 × 10⁶ erg/cm3) to be larger than that for the x = 0.15 alloy (K1 = 3.1 × 10⁶ erg/cm3). Magnetostriction in the premartensite phase is larger than that in the austenite and martensite phases at low magnetic fields, thus indicating that they are related to lattice softening in the premartensite phase. The magnetostriction and TP are proportional to the e/a, which indicates that the electron energy, the magnetostriction, and the Tp are correlated each other.
Acknowledgments
The authors would like to express our sincere thanks to Toetsu Shishido and Kazuo Obara in Institute for Materials Research, Tohoku University, and Ryuji Kouta in Facuty of Engineering, Yamagata University for their help on the sample preparation. The authors also thank to Mitsuo Okamoto in Ryukoku University for helping to make the apparatus. This project is partly supported by the Ryukoku Extension Center (REC) at Ryukoku University.
Author Contributions
Yoshiya Adachi prepared the samples; Takuo Sakon and Takeshi Kanomata conceived and designed the experiments; Naoki Fujimoto and Takuo Sakon performed the experiments; Naoki Fujimoto and Takuo Sakon analysed the data; Takuo Sakon and Takeshi Kanomata wrote the paper.
Conflicts of Interest
The authors declare no conflict of interest.
References
- Ullakko, K.; Huang, J.K.; Kantner, C.; O’Handley, R.C.; Kokorin, V.V. Large magnetic-field-induced strains in Ni2MnGa single crystals. Appl. Phys. Lett. 1996, 69, 1966–1968. [Google Scholar] [CrossRef]
- Webster, P.J.; Ziebeck, K.R.A.; Town, S.L.; Peak, M.S. Magnetic order and phase transformation in Ni2MnGa. Philos. Mag. B 1984, 49, 295–310. [Google Scholar] [CrossRef]
- Brown, P.J.; Crangle, J.; Kanomata, T.; Matsumoto, M.; Neumann, K.-U.; Ouladdiaf, B.; Ziebeck, K.R.A. The crystal structure and phase transitions of the magnetic shape memory compound Ni2MnGa. J. Phys. Condens. Matter 2002, 14, 10159–10171. [Google Scholar] [CrossRef]
- Pons, J.; Santamarta, R.; Chernenko, V.A.; Cesari, E. Long-Period martensitic structures of Ni-Mn-Ga alloys studied by high-resolution transmission electron microscopy. J. Appl. Phys. 2005. [Google Scholar] [CrossRef]
- Ranjan, R.; Banik, S.; Barman, S.R.; Kumar, U.; Mukhopadhyay, P.K.; Pandey, D. Powder X-ray diffraction study of the thermoelastic martensite transition in Ni2Mn1.05Ga0.95. Phys. Rev. B 2006. [Google Scholar] [CrossRef]
- Ullakko, K.; Huang, J.K.; Kokorin, V.V.; O’Handley, R.C. Magnetically controlled shape memory effect in Ni2MnGa intermetallics. Scr. Mater. 1997, 36, 1133–1138. [Google Scholar] [CrossRef]
- Clark, A.E.; Belson, H.E. Giant Room-Temperature Magnetostrictions in TbFe2 and DyFe2. Phys. Rev. B 1972, 5. [Google Scholar] [CrossRef]
- Lindgren, E.A.; Haroush, S.; Poret, J.C.; Mazzatesta, A.D.; Rosen, M.; Wun-Fogle, M.; Restorff, J.B.; Clark, A.E.; Lindberg, J.F. Development of Terfenol-D transducer material. J. Appl. Phys. 1998, 83, 7282–7284. [Google Scholar] [CrossRef]
- Yu, C.H.; Wang, W.H.; Chen, J.L.; Wu, G.H.; Yang, F.M.; Tang, N.; Qi, S.R.; Zhan, Z.; Wang, Z.; Zheng, Y.F.; et al. Magnetic-field-induced strains and magnetic properties of Heusler alloy Ni52Mn23Ga25. J. Appl. Phys. 2000, 87, 6292–6294. [Google Scholar] [CrossRef]
- Pons, J.; Cesari, E.; Seguí, C.; Masdeu, F.; Santamarta, R. Ferromagnetic shape memory alloys: Alternatives to Ni-Mn-Ga. Mater. Sci. Eng. A 2008, 481–482, 57–65. [Google Scholar] [CrossRef]
- Koho, K.; Söderberg, O.; Lanska, N.; Gea, Y.; Liua, X.; Straka, X.; Vimpari, J.; Heczko, O.; Lindroos, V.K. Effect of the chemical composition to martensitic transformation in Ni-Mn-Ga-Fe alloys. Mater. Sci. Eng. A 2004, 378, 384–388. [Google Scholar] [CrossRef]
- Liu, Z.H.; Zhang, M.; Wang, W.Q.; Wang, W.H.; Chen, J.L.; Wua, G.H.; Meng, F.B.; Liu, H.Y.; Liu, B.D.; Qu, J.P.; et al. Magnetic properties and martensitic transformation in quaternary Heusler alloy of NiMnFeGa. J. Appl. Phys. 2002, 92, 5006–5010. [Google Scholar] [CrossRef]
- Tsuchiya, K.; Ohashi, A.; Ohtoyo, D.; Nakayama, H.; Umemoto, M.; McCormick, P.G. Phase transformation and magnetostriction in Ni-Mn-Ga Ferromagnetic Shape Memory Alloys. Mater. Trans. JIM 2000, 8, 938–942. [Google Scholar] [CrossRef]
- Dai, L.; Cullen, J.; Wuttig, M. Intermartensitic transformation in a NiMnGa alloy. J. Appl. Phys. 2004, 95, 6957–6959. [Google Scholar] [CrossRef]
- Kokorin, V.V.; Chernenko, V.A.; Cesari, E.; Pons, J.; Segui, C. Pre-martensitic state in Ni-Mn-Ga alloys. J. Phys. Condens. Matter 1996, 8, 6457–6464. [Google Scholar] [CrossRef]
- Manosa, L.; Gonzalez-Comas, A.; Obrado, E.; Planes, A.; Chernenko, V.A.; Kokorin, V.V.; Cesari, E. Anomalies related to the TA2-phonon-mode condensation in the Heusler Ni2MnGa alloy. Phys. Rev. B 1997, 55, 11068–11071. [Google Scholar] [CrossRef] [Green Version]
- Seiner, H.; Kopeck´y, V.; Landa, M.; Heczko, O. Elasticity and magnetism of Ni2MnGa premartensitic tweed. Phys. Status Solidi B 2014, 251, 2097–2103. [Google Scholar] [CrossRef]
- Zheludev, A.; Shapiro, S.M.; Wochner, P.; Schwartz, A.; Wall, M.; Tanner, L.E. Phonon anomaly, central peak, and microstructures in Ni2MnGa. Phys. Rev. B 1995, 51, 11310–11314. [Google Scholar] [CrossRef]
- Stuhr, U.; Vorderwisch, P.; Kokorin, V.V.; Lindgard, P.-A. Premartensitic phenomena in the ferro- and paramagnetic phases of Ni2MnGa. Phys. Rev. B 1997, 56, 14360–14365. [Google Scholar] [CrossRef]
- Barandiarán, J.M.; Chernenko, V.A.; Gutiérrez, J.; Orúe, I.; Lázpita, P. Magnetostriction in the vicinity of structural transitions in Ni2MnGa. Appl. Phys. Lett. 2012. [Google Scholar] [CrossRef]
- Heczko, O.; Landa, M.; Seiner, H. Anomalous lattice softening of Ni2MnGa austenite due to magnetoelastic coupling. J. Appl. Phys. 2012. [Google Scholar] [CrossRef]
- Khovailo, V.V.; Takagi, T.; Bozhko, A.D.; Matsumoto, M.; Tani, J.; Shavrov, V.G. Premartensitic Transition in Ni2 + xMn1 − xGa Heusler Alloys. J. Phys. Condens. Matter 2001, 13, 9655–9662. [Google Scholar] [CrossRef]
- Chernenko, V.A.; Besseghini, S.; Kanomata, T.; Yoshida, H.; Kakeshita, T. Effect of high hydrostatic pressure on premartensitic transition in Ni2MnGa. Scr. Mater. 2006, 55, 303–306. [Google Scholar] [CrossRef]
- Singh, S.; Bednarcik, J.; Barman, S.R.; Felsher, S.R.; Pandey, D. Premartensite to martensite transition and its implications for the origin of modulation in Ni2MnGa ferromagnetic shape-memory alloy. Phys. Rev. B 2015. [Google Scholar] [CrossRef]
- Chernenko, V.A.; L’vov, V.A. Magnetoelastic nature of ferromagnetic shape memory effect. Mater. Sci. Forum 2008, 583, 1–20. [Google Scholar] [CrossRef]
- Matsui, M.; Nakakura, T.; Murakami, D.; Asano, H. Super magnetostriction with mesophase transition of Ni2MnGa. Toyota Sci. Rep. 2010, 63, 27–36. [Google Scholar]
- Kikuchi, D.; Kanomata, T.; Yamaguchi, Y.; Nishimura, H.; Koyama, K.; Watanabe, K. Magnetic properties of ferromagnetic shape memory alloys Ni2Mn1 − xFexGa. J. Alloys Compd. 2004, 383, 184–188. [Google Scholar] [CrossRef]
- Khan, M.; Dubenko, I.; Stadler, S.; Ali, N. The Structural and Magnetic Properties of Ni2Mn1−xMxGa (M = Co, Cu). J. Appl. Phys. 2005, 97. [Google Scholar] [CrossRef]
- Khovaylo, V.V.; Buchelnikov, V.D.; Kainuma, R.; Koledov, V.V.; Ohtsuka, M.; Shavrov, V.G.; Takagi, T.; Taskaev, S.V.; Vasiliev, A.N. Phase transitions in Ni2+xMn1−xGa with a high Ni excess. Phys. Rev. B 2005, 72. [Google Scholar] [CrossRef]
- Kataoka, M.; Endo, K.; Kudo, N.; Kanomata, T.; Nishihara, H.; Shishido, T.; Umetsu, R.Y.; Nagasako, M.; Kainuma, R. Martensitic transition, ferromagnetic transition, and their interplay in the shape memory alloys Ni2Mn1−xCuxGa. Phys. Rev. B 2010. [Google Scholar] [CrossRef]
- Chernenko, V.A. Compositional Ionsability of β-phase in Ni-Mn-Ga Alloys. Scr. Mater. 1999, 40, 523–527. [Google Scholar] [CrossRef]
- Khovailo, V.V.; Abe, T.; Koledov, V.V.; Matsumoto, M.; Nakamura, H.; Note, R.; Ohtsuka, M.; Shavrov, V.G.; Takagi, T. Influence of Fe and Co on Phase Transitions in Ni-Mn-Ga Alloys. Mater. Trans. 2003, 44, 2509–2512. [Google Scholar] [CrossRef]
- Jin, X.; Marinori, M.; Bono, D.; Allen, S.M.; O’Handley, R.C.; Hsu, T.Y. Empirical mapping of Ni-Mn-Ga properties with composition and valence electron concentration. J. Appl. Phys. 2002, 91, 8222–8224. [Google Scholar] [CrossRef]
- Adachi, Y.; Kouta, R.; Fujii, M.; Kanomata, T.; Umetsu, R.Y.; Kainuma, R. Magnetic Phase Diagram of Heusler alloy system Ni2Mn1−xCrxGa. Phys. Procedia 2015, 75, 1187–1191. [Google Scholar] [CrossRef]
- Khan, M.; Brock, J.; Sugerman, I. Anomalous transport properties of Ni2Mn1−xCrxGa Heusler alloys at the martensite-austenite phase transition. Phys. Rev. B 2016. [Google Scholar] [CrossRef]
- Mori, K.; Harthway, K.; Clark, A.E. Magnetostriction in polycrystal Pr2(Co1−xFex)17 compounds and their easy directions of magnetization. J. Appl. Phys. 1982, 53, 8110–8112. [Google Scholar] [CrossRef]
- Aksoy, S.; Krenke, T.; Acet, M.; Wassermann, E.F.; Moya, X.; Mañosa, L.; Planes, A. Magnetization easy axis in martensitic Heusler alloys estimated by strain measurements under magnetic field. Appl. Phys. Lett. 2007. [Google Scholar] [CrossRef]
- Albertini, F.; Morellon, L.; Algarabel, P.A.; Ibara, M.R.; Pareti, L.; Arnold, Z.; Calestani, G. Magnetoelastic effects and magnetic anisotropy in Ni2MnGa polycrystals. J. Appl. Phys. 2001. [Google Scholar] [CrossRef] [Green Version]
- Soto-Parra, D.E.; Moya, X.; Mañosa, L.; Planes, A.; Flores-Zúñiga, H.; Alvarado-Hernández, F.; Ochoa-Gamboa, R.A.; Matutes-Aquino, J.A.; Ríos-Jara, D. Fe and Co selective substitution in Ni2MnGa: Effect of magnetism on relative phase stability. Philos. Mag. 2010, 90, 2771–2792. [Google Scholar] [CrossRef]
- Matsui, M.; Nakamura, T.; Murakami, D.; Yoshimura, S.; Asano, H. Effect of Super Magnetostriction on Magnetic Anisotropy of Ni2MnGa. Toyota Sci. Rep. 2011, 64, 1–11. [Google Scholar]
- Kikuchi, D.; Kanomata, T.; Yamaguchi, Y.; Nishihara, H. Magnetic properties of ferromagnetic shape memory alloys Ni50+xMn12.5Fe12.5Ga25−x. J. Alloys Compd. 2006, 426, 223–227. [Google Scholar] [CrossRef]
- Soto, D.; Alvarado Hernández, F.; Flores-Zúñiga, H.; Moya, X.; Mañosa, L.; Planes, A.; Aksoy, S.; Acet, M.; Krenke, T. Phase diagram of Fe-doped Ni-Mn-Ga ferromagneic shape-memory alloys. Phys. Rev. B 2008. [Google Scholar] [CrossRef]
- Uijttewaal, M.A.; Hickel, T.; Neugebauer, J.; Gruner, M.E.; Entel, P. Understanding the Phase Transitions of the Ni2MnGa Magnetic Shape Memory System from First Principles. Phys. Rev. Lett. 2009. [Google Scholar] [CrossRef] [PubMed]
- Chu, S.-Y.; Cramb, A.; De Graef, M.; Laughlin, D.; McHenry, M.E. The effect of field cooling and field orientation on the martensitic phase transformation in a single crystal. J. Appl. Phys. 2000, 87, 5777–5779. [Google Scholar] [CrossRef]
- Wu, S.K.; Yang, S.T. Effect of composition on transformation temperatures of Ni-Mn-Ga shape memory alloys. Mater. Lett. 2003, 57, 4291–4296. [Google Scholar] [CrossRef]
- Recarte, V.; Perez-Landazabal, J.I.; Sanchez-Alarcos, V.; Cesari, E.; Jimenez-Ruiz, M.; Schmalzl, K.; Chernenko, V.A. Direct evidence of the magnetoelastic interaction in Ni2MnGa magnetic shape memory system. Appl. Phys. Lett. 2013. [Google Scholar] [CrossRef]
Figure 1.
Temperature dependence of the linear strain ∆L/L in the (a) x = 0.00 alloy; and (b) x = 0.15 alloy. The quantity TRs is the temperature where the reverse-martensitic transition starts; TRf is the temperature where the reverse-martensitic transition ends; TMs is the temperature where the martensitic transition starts; and TMf is the temperature where the martensitic transition ends. The dotted lines are intended to guide the eye.

Figure 2.
The permeability of the (a) x = 0.00 alloy; and (b) x = 0.15 alloy during heating and cooling in zero magnetic fields. The quantity TP is the premartensitic transition temperature.
Figure 2.
The permeability of the (a) x = 0.00 alloy; and (b) x = 0.15 alloy during heating and cooling in zero magnetic fields. The quantity TP is the premartensitic transition temperature.
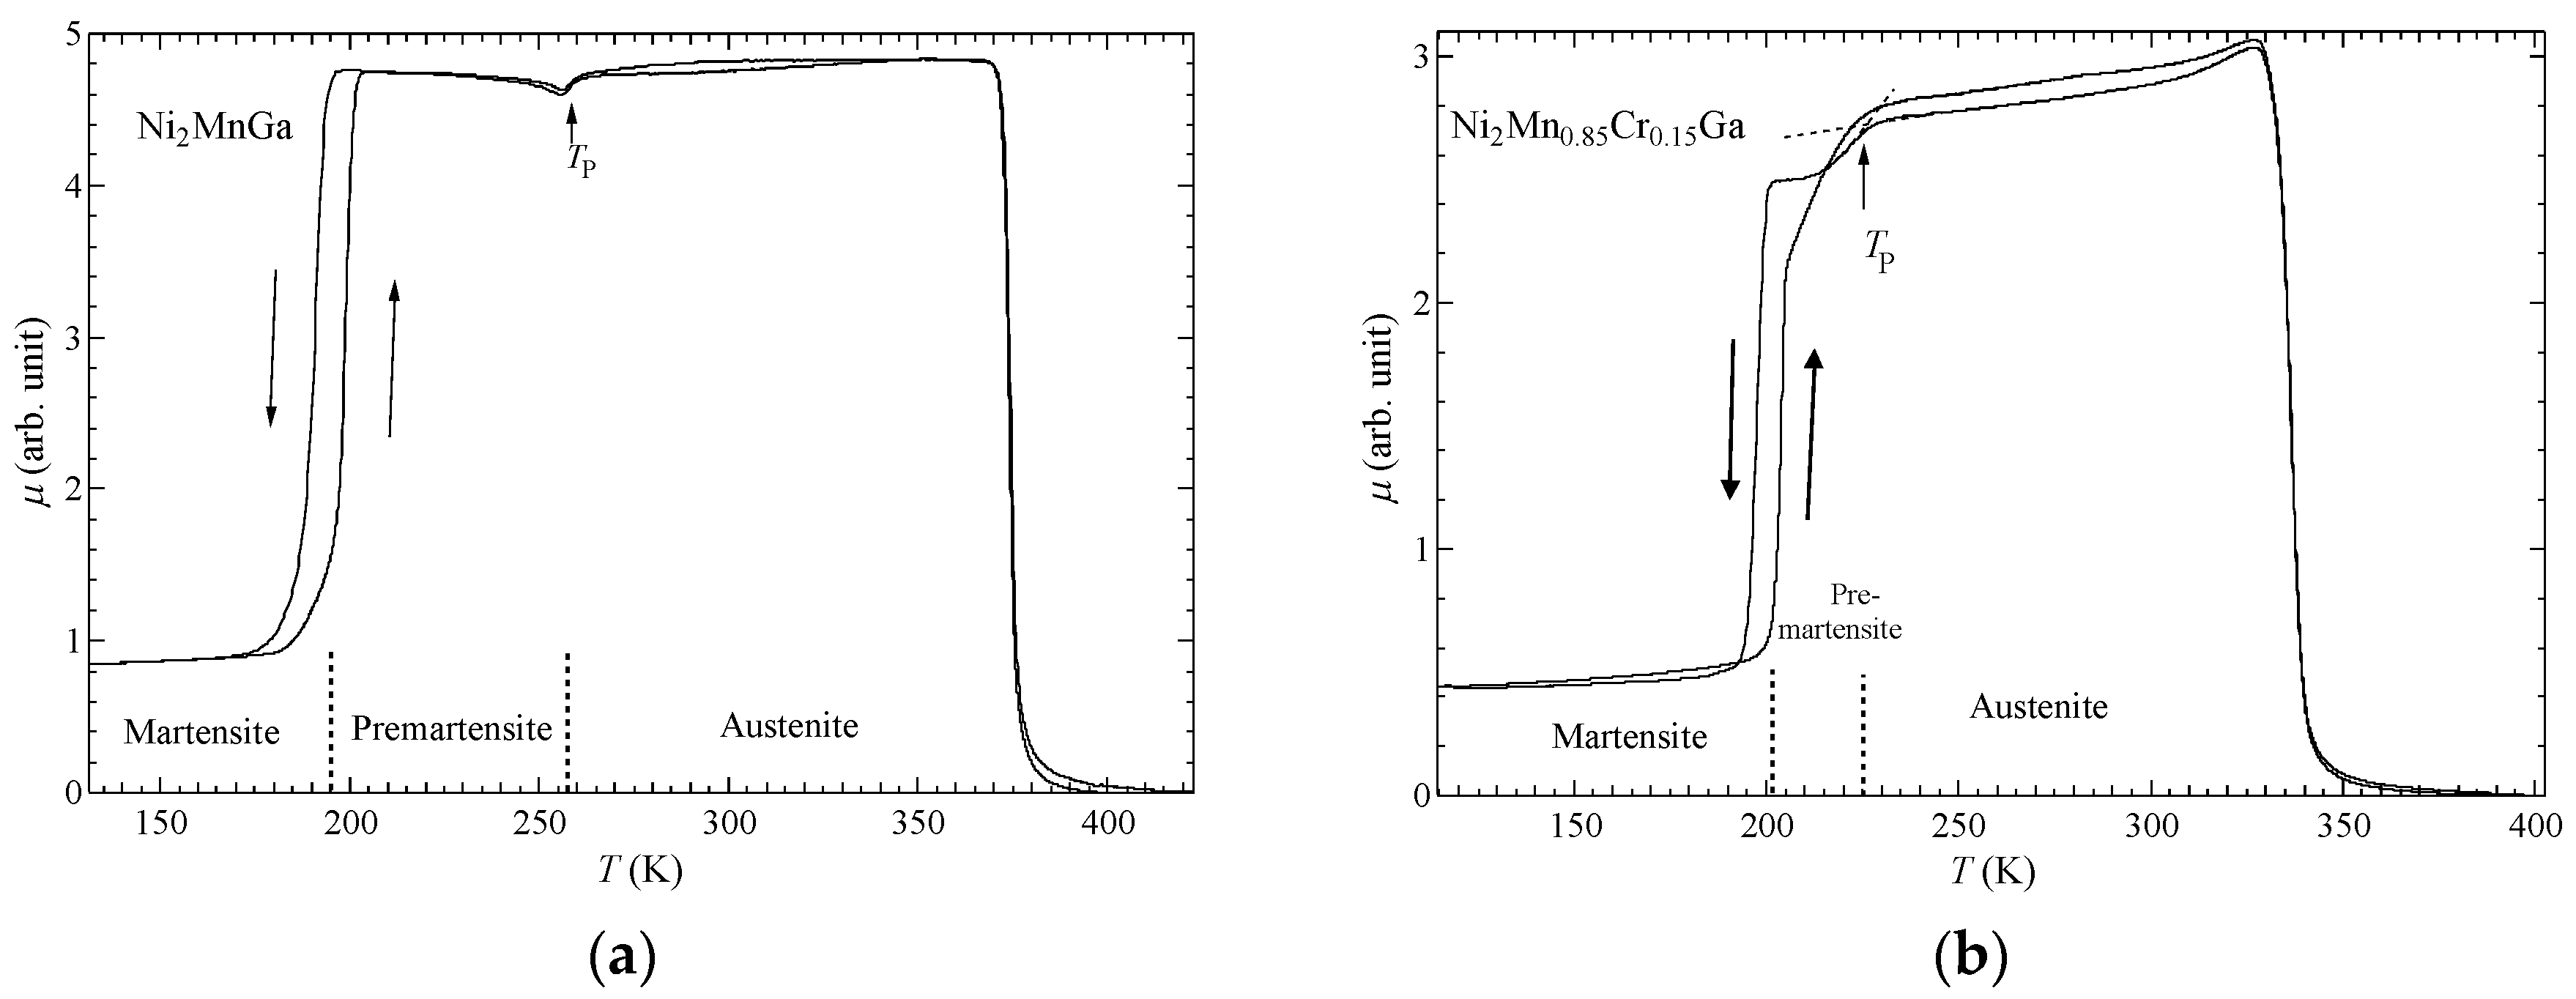
Figure 3.
The magnetisation M of the (a) x = 0.00 alloy; and (b) x = 0.15 alloy. Blue: martensite phase, Green: premartensite phase, Red: austenite phase.
Figure 3.
The magnetisation M of the (a) x = 0.00 alloy; and (b) x = 0.15 alloy. Blue: martensite phase, Green: premartensite phase, Red: austenite phase.

Figure 4.
(a) The temperature dependence of the magnetic-anisotropy field HA; (b) The temperature dependence of the magnetic-anisotropy energy K1. The error bars were indicated.
Figure 4.
(a) The temperature dependence of the magnetic-anisotropy field HA; (b) The temperature dependence of the magnetic-anisotropy energy K1. The error bars were indicated.
Figure 5.
The magnetostriction λ for the (a) x = 0.00 alloy; and (b) x = 0.15 alloy, measured during cooling. The horizontal axis shows the applied magnetic field H.
Figure 5.
The magnetostriction λ for the (a) x = 0.00 alloy; and (b) x = 0.15 alloy, measured during cooling. The horizontal axis shows the applied magnetic field H.

Figure 6.
Temperature dependence of the magnetostriction λ for the (a) x = 0.00 alloy; and (b) x = 0.15 alloy.
Figure 6.
Temperature dependence of the magnetostriction λ for the (a) x = 0.00 alloy; and (b) x = 0.15 alloy.

Figure 7.
Temperature dependence of the magnetostriction λ for the x = 0.25 alloy.

Figure 8.
(a) The valence electron e/a dependence of peak value of the magnetostriction around the premartensite temperature TP; (b) The valence electron e/a dependence of the TP. Filled circles: this work. Filled triangles: polycrystal, Matsui et al. [26,40]. Cross: single, Matsui et al. [40]. Filled square: single, Seiner et al. [17]. Dotted lines are fitting lines. The error bars in this work were indicated.


Table 1.
The valence electron e/a, the premartensite temperature TP, and peak value of the magnetostriction around the TP for each composition. PC: polycrystal; SC: single crystal.
Table 1.
The valence electron e/a, the premartensite temperature TP, and peak value of the magnetostriction around the TP for each composition. PC: polycrystal; SC: single crystal.
| Composition | e/a | TP (K) | λ (ppm) | References |
|---|---|---|---|---|
| Ni51.7Mn24.3Ga24.0 | 7.59 | 285 | −550 | PC Matsui [26,40] |
| Ni49.9Mn26.2Ga23.9 | 7.54 | 259 | −360 | PC Matsui [26,40] |
| Ni2MnGa | 7.50 | 259 | −227 | SC Seiner [17] |
| Ni2MnGa | 7.50 | 258 | −180 | PC This work |
| Ni49.2Mn26.5Ga24.3 | 7.50 | 248 | −182 | SC Matsui [40] |
| Ni47.9Mn28.0Ga24.1 | 7.47 | 225 | −180 | PC Matsui [26,40] |
| Ni2Mn0.85Cr0.15Ga | 7.46 | 225 | −120 | PC This work |
© 2017 by the authors. Licensee MDPI, Basel, Switzerland. This article is an open access article distributed under the terms and conditions of the Creative Commons Attribution (CC BY) license (http://creativecommons.org/licenses/by/4.0/).
Share and Cite
MDPI and ACS Style
Sakon, T.; Fujimoto, N.; Kanomata, T.; Adachi, Y. Magnetostriction of Ni2Mn1−xCrxGa Heusler Alloys. Metals 2017, 7, 410. https://doi.org/10.3390/met7100410
AMA Style
Sakon T, Fujimoto N, Kanomata T, Adachi Y. Magnetostriction of Ni2Mn1−xCrxGa Heusler Alloys. Metals. 2017; 7(10):410. https://doi.org/10.3390/met7100410
Chicago/Turabian StyleSakon, Takuo, Naoki Fujimoto, Takeshi Kanomata, and Yoshiya Adachi. 2017. "Magnetostriction of Ni2Mn1−xCrxGa Heusler Alloys" Metals 7, no. 10: 410. https://doi.org/10.3390/met7100410
Note that from the first issue of 2016, this journal uses article numbers instead of page numbers. See further details here.