
Experimental Analysis of the Behaviour of Aluminium Alloy EN 6082AW T6 at High Temperature


.JPG)

1
Faculty of Civil Engineering, Architecture and Geodesy, University of Split, Matice Hrvatske 15, 21000 Split, Croatia
2
Faculty of Engineering, University of Rijeka, Vukovarska 58, 51000 Rijeka, Croatia
3
Department of Civil and Structural Engineering, University of Sheffield, Sir Frederick Mappin Building, Mappin Street, Sheffield S1 3JD, UK
*
Author to whom correspondence should be addressed.
Metals 2017, 7(4), 126; https://doi.org/10.3390/met7040126
Submission received: 13 February 2017
/
Revised: 13 March 2017
/
Accepted: 1 April 2017
/
Published: 4 April 2017
Abstract
:The paper presents test results for the mechanical and creep properties of European aluminium alloy EN 6082AW T6 at high temperatures. Mechanical properties of the aluminium alloy were determined by means of two types of test: constant stress-rate and stationary creep tests. Mechanical properties were determined up to a temperature of 350 °C, while the creep tests were conducted within the temperature interval 150–300 °C. The creep tests conducted identified the critical temperature interval for creep development, which represents an important factor when analysing creep behaviour of aluminium structures. This temperature interval was found to be within the range 200–300 °C. Test results for stress at 0.2% strain and modulus of elasticity at different temperatures showed good agreement with the codified values from Eurocode 9 and with other comparable studies.
1. Introduction
1.1. Research Motivation
The application of aluminium in the modern construction industry can be attributed to its low density, high corrosion resistance, and the ease with which complex shapes of cross-section can be extruded [1,2]. Furthermore, the proof strength of structural aluminium alloys such as the 6xxx series at normal temperatures is comparable to the yield strength of traditional structural steel grades such as S235, S275, and S355. One of the strongest alloys from the 6xxx series is designated 6082-T6 (solution heat-treated and artificially aged). The 6082-T6 alloy can be considered as a structural alloy, since its proof strength at normal temperature is above 260 MPa [3], which is comparable to the yield strength of steel grade S275. Generally, this alloy has very good corrosion resistance and weldability. These properties can justify the application of this aluminium alloy in the construction industry, where the requirements and economics of a particular structure are favourable.
Since the fire limit state is currently considered as normal design case for structural design, it is becoming important to generate some basic knowledge about the mechanical properties of aluminium in fire conditions. Generally, aluminium is considered to have distinct disadvantages when it comes to fire resistance. Its need for fire protection is more pronounced in comparison to steel, due to its higher thermal conductivity (>100 W/m2·K) and lower melting point (560–660 °C) [4]. Aluminium heats up more rapidly than steel and its lower melting point suggest that aluminium is more susceptible to creep strain activation [5]. The overall thermal capacitance of aluminium can be considered lower than steels’ because of the lower density of aluminium (about 40% of the density of steel), which represents an additional reason why aluminium heats more rapidly than steel [6]. Because of this, it can be expected that during fire exposure a common aluminium section carrying a slab will experience a more uniform temperature distribution than a steel beam, which will minimize the influence of thermal bowing of single members as a structural response.
It is imperative to consider application of passive fire protection as the norm when using aluminium members. The main role of passive fire protection is to reduce the rate of temperature increase in the protected section in order to slow the reduction of the member’s mechanical properties. This is important since aluminium loses most of its load bearing capacity in the range 200–350 °C [7]. It is clear that the mechanical properties of aluminium are the key parameter in quantifying the response of aluminium structures in fire conditions. It is particularly important to be able to define an alloy’s creep properties and their effects on the structural response. This represents the main motivation for exploring the mechanical and creep properties of alloy 6082AW-T6 within this study. At present, very little data regarding creep development for this alloy is available to the scientific community. The research programme of which this study forms a part is currently being conducted by Universities of Split and Sheffield, with the aim of exploring the influence of creep on the behaviour of steel and aluminium columns in fire conditions.
1.2. Previous Research
Some previous fire-related research has been conducted on the 6xxx alloy series. A test study conducted by Maljaars et al. [8,9] was focused on the mechanical and creep properties of aluminium alloys 5083-H111 and 6060-T66, and included a study of local buckling in compression members exposed to high temperatures. This investigation was very comprehensive, including various stationary and transient coupon tests in order to determine a constitutive material model at high temperatures. Strain rates used by Maljaars et al. in tests for determining mechanical properties varied depending on the temperature level, and for alloy 6060-T66 [7] strain rates varied in the range 0.001–0.004/min up to the attainment of 0.2% proof stress, and in the range 0.003–0.028/min up to rupture. The research results showed that high-temperature creep affects aluminium’s compressive strength, especially when a transient testing methodology is used. Additionally, new creep material parameters suitable for the alloys studied were proposed.
Some recent research has also been done [10] in China on the high-temperature behaviour of aluminium beams (of alloys 5083-H112 and 6060-T66). The main contributions of this study were in proposing practical formulas for calculating temperature increase in unprotected and protected aluminium beams, and in suggesting that the critical temperature approach from Eurocode 9 provides conservative predictions when analysing the load bearing capacity at high temperature.
Further studies by Langhelle [11] and Eberg et al. [12] focused on the buckling behaviour of aluminium columns (of alloys 6082-T4 and 6082-T6) exposed to high temperatures. It was reported that the influence of creep was more pronounced in the constant-temperature column tests. This study also showed that the load-bearing capacity calculated using Eurocode 9 material parameters gave conservative predictions of the column test results. The displacement rates reported as being used in this study to determine mechanical properties were 2 mm/min and 5 mm/min.
Fogle et al. [13] investigated the failure of 5083-H116 and 6082-T6 aluminium plates exposed to constant heat flux. The main conclusion of this study was that the use of a single temperature criterion for fire resistance, without taking account of load levels, is not sufficient for predicting the structural response during fire. Other research data on the mechanical properties of various aluminium alloys, including the 6xxx series, has been published by Kaufman [14] and Voorhees and Freeman [15]. Strain rates reported by Kaufman were maintained at about 0.005/min up to yielding and then 0.05/min up to rupture. This strain-rate regime was also applied in the tests conducted by Voorhes and Freeman. On inspection of these previous studies it can be seen that studies [11,12] are closest to the current work.
2. Test Study and Comparison of Results
2.1. Test Setup
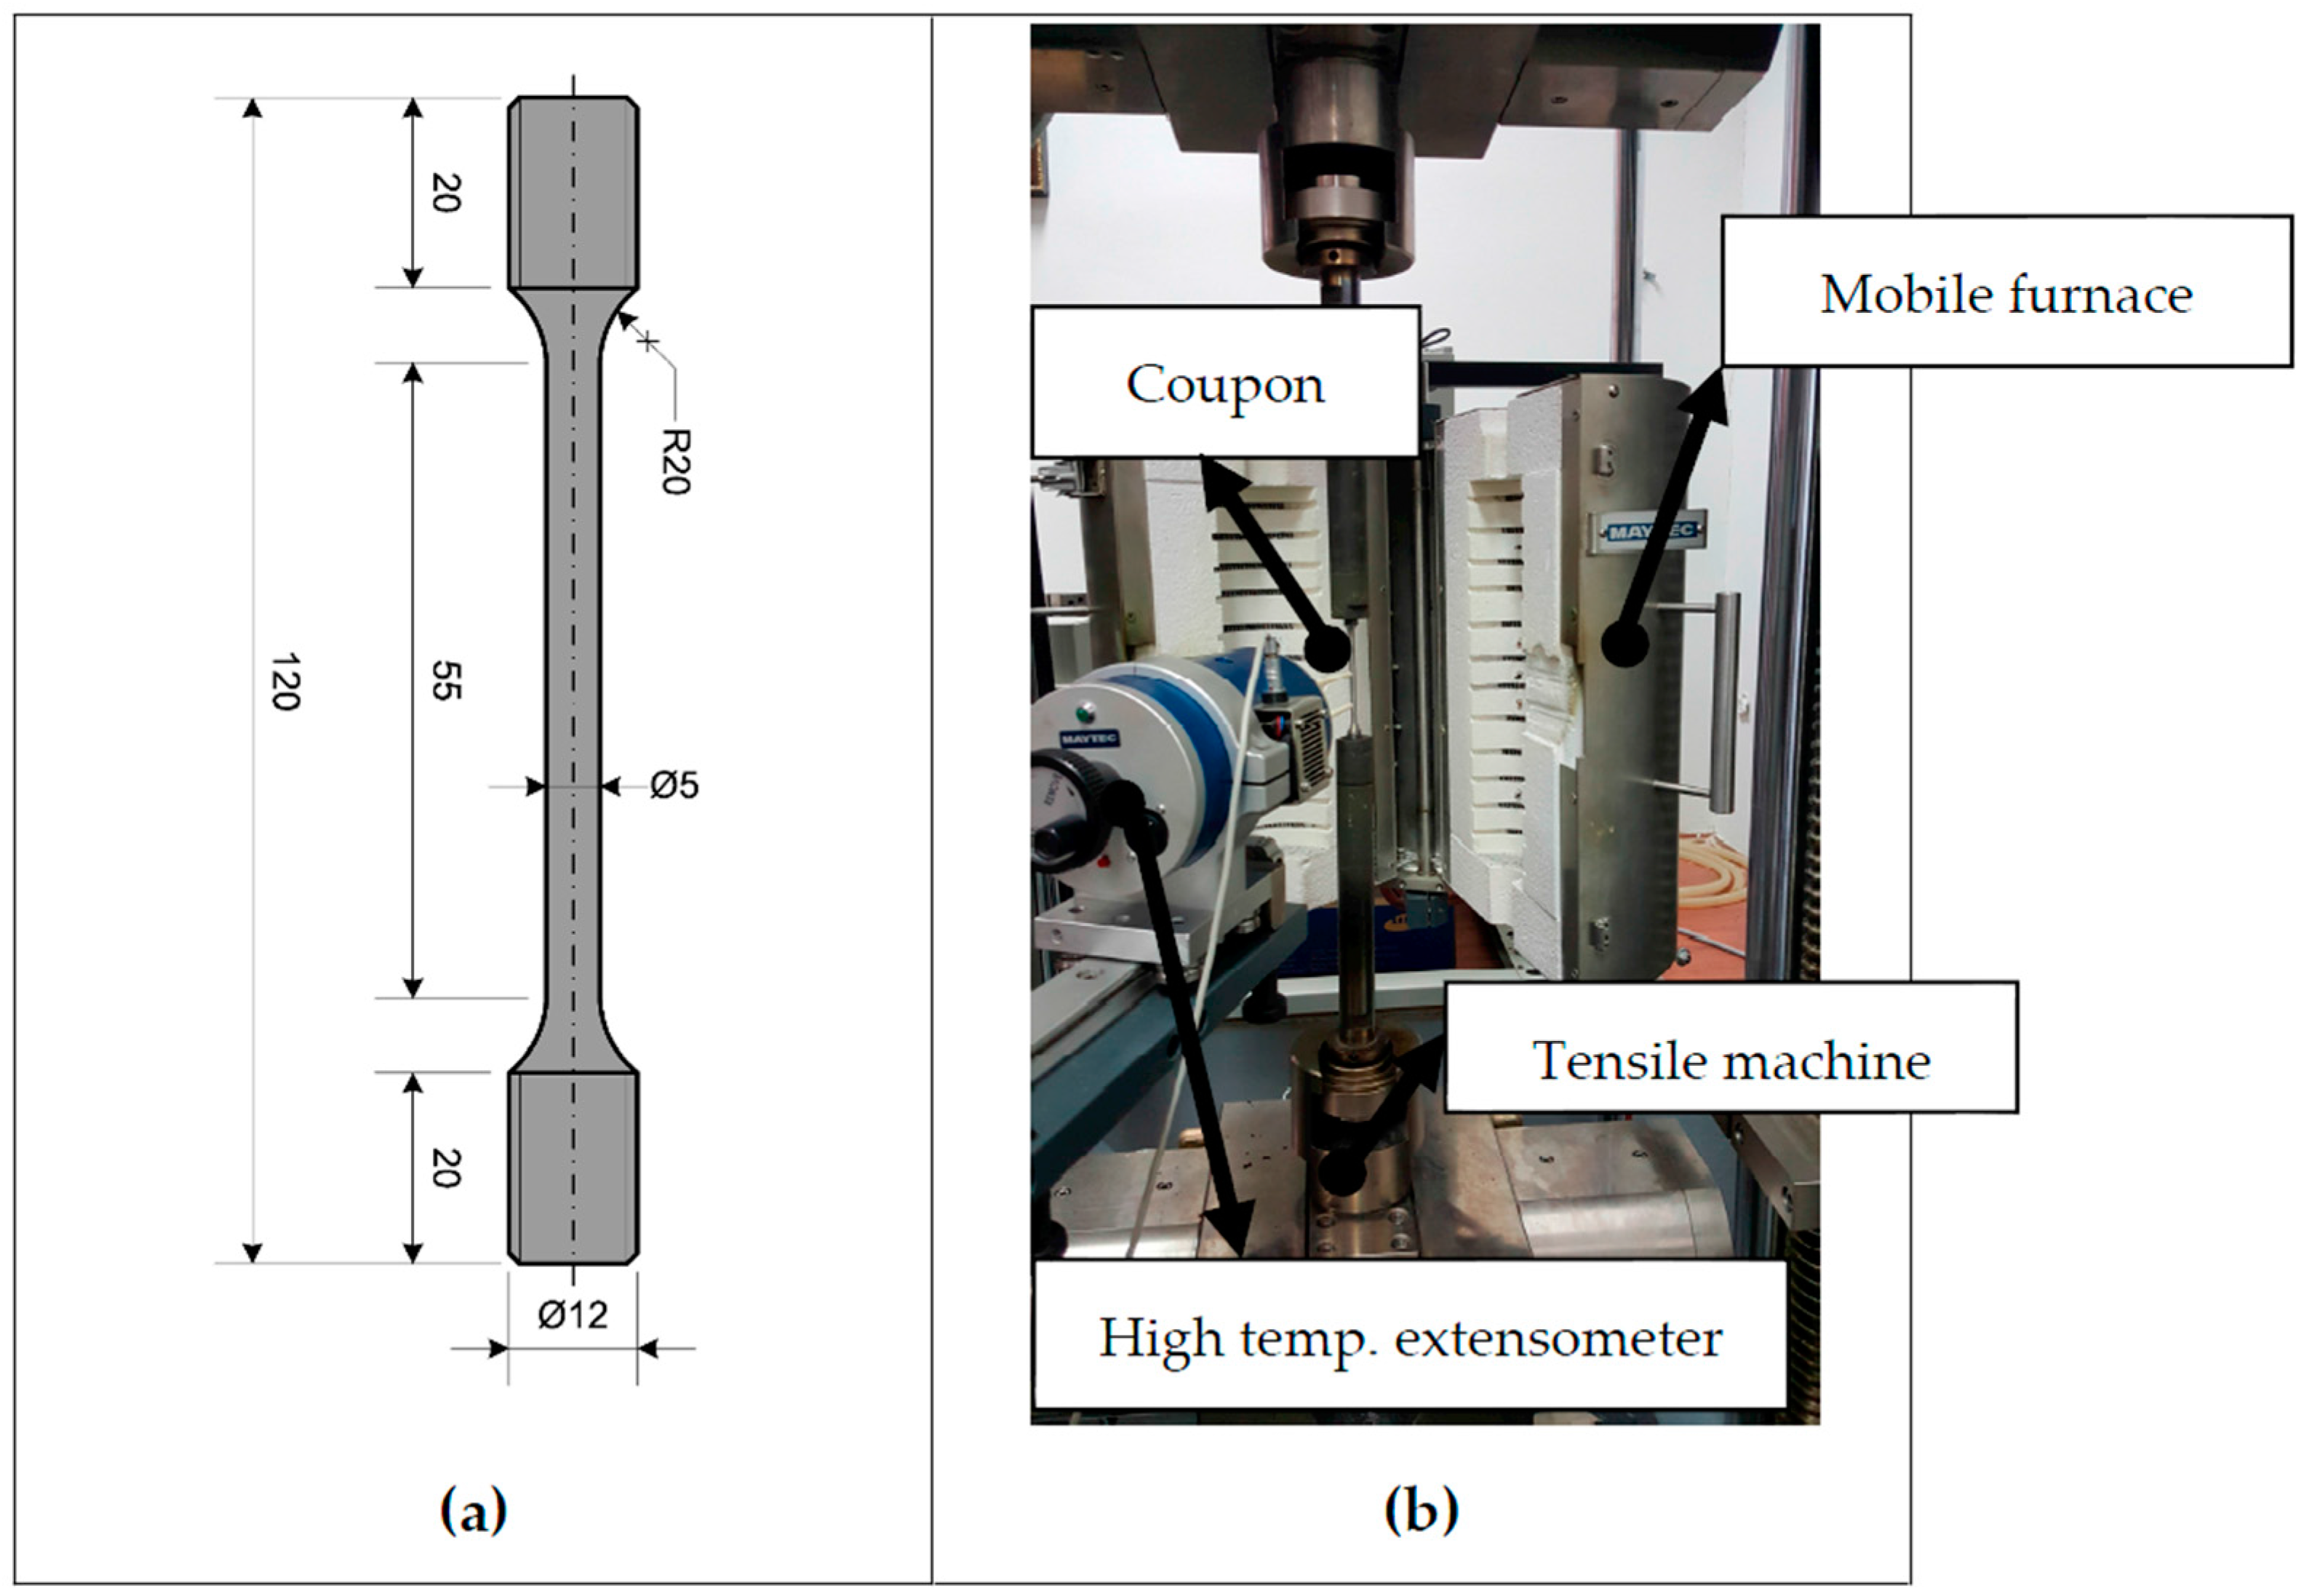
The test setup for determining mechanical properties consists essentially of a 400 kN Zwick Roell tensile testing machine (Zwick Roell, Ulm, Germany), a mobile furnace capable of heating to 900 °C, and a high-temperature extensometer. The test setup and the coupon dimensions are shown in Figure 1. The test equipment is located at the University of Rijeka.
Coupon specimens were manufactured from the upper and lower flanges of an aluminium H-section of Grade EN 6082AW T6, of height 220 mm and width 170 mm, with flange and web thicknesses of 15 mm and 9 mm, respectively. The coupon ends were threaded to attach to the platens of the tensile machine. Testing was carried out in such a way as to obtain the stress-related strain and creep strain separately at different temperatures, according to the total temperature-dependent strain relationship [16]:
Two different types of tests were conducted in order to obtain stress-related and creep strains. The first type is a constant stress-rate test, which was used to determine the stress-related strain. The following procedure is used: in the pre-loading phase, the coupon is heated at a heating rate of 15 °C/min; there is then a soaking phase at constant furnace temperature, lasting 30 min, during which the coupon achieves almost uniform temperature; finally, in the loading phase the coupon is loaded at a uniform stress rate of 10 MPa/s. The second test type, used mainly to determine creep strain evolution, is based on the stationary creep test, and uses the following procedure: a pre-loading phase at a heating rate of 15 °C/min; a soaking phase for 60 min; the loaded phase lasting up to 20 h during which the coupon is exposed to a constant stress level at the constant target temperature. The standards used for definition of coupon geometry, heating, and loading were ASTM:E8M-11 for the ambient-temperature tests [17], and ASTM:E21-09 for the high-temperature tests [18].
The material’s modulus of elasticity was determined in the initial phase of the constant stress-rate test, in which the modulus of elasticity was calculated automatically by the computer with the help of 5–10 loading-unloading cycles within the elastic domain of the aluminium coupon. The measured modulus of elasticity represents an average value from these cyclic tests. The parameters used in both tests are given in Table 1 and Table 2.
Table 3 presents a comparison of the reduction factors for stress at 0.2% strain and modulus of elasticity with the values given in Eurocode 9 [3]. The temperature range for the creep tests was selected to be within 150–300 °C, which is consistent with the range in which aluminium’s mechanical properties experience reduction, as shown in Table 3.
2.2. Comparison with EC9 and Other Studies
A suitable reference base for comparison with the tested mechanical and creep properties of alloy EN 6082AW T6 is presented in the following subsection. The reduction factors for stress at 0.2% strain and modulus of elasticity from Eurocode 9 are chosen for comparison, since it provides the most regularly-used set of temperature-dependent reduction factors for alloy 6082-T6.
Test results from previous studies [9,11,12,13,14,15,19] are also compared with the proof strength and modulus of elasticity obtained in this study. These studies relate to alloys from the 6xxx series (6060-T66, 6063-T6, and 6082-T6), which represent the closest match in terms of strength value and tempering conditions compared to the studied alloy. For the creep tests conducted, two suitable test studies have been chosen for comparison. These are the analytical creep model provided by Langhelle et al. [11,12] for 6082-T6 alloy and the creep model provided by Maljaars et al. [9] for 6060-T66 alloy.
2.3. Test Results and Comparison
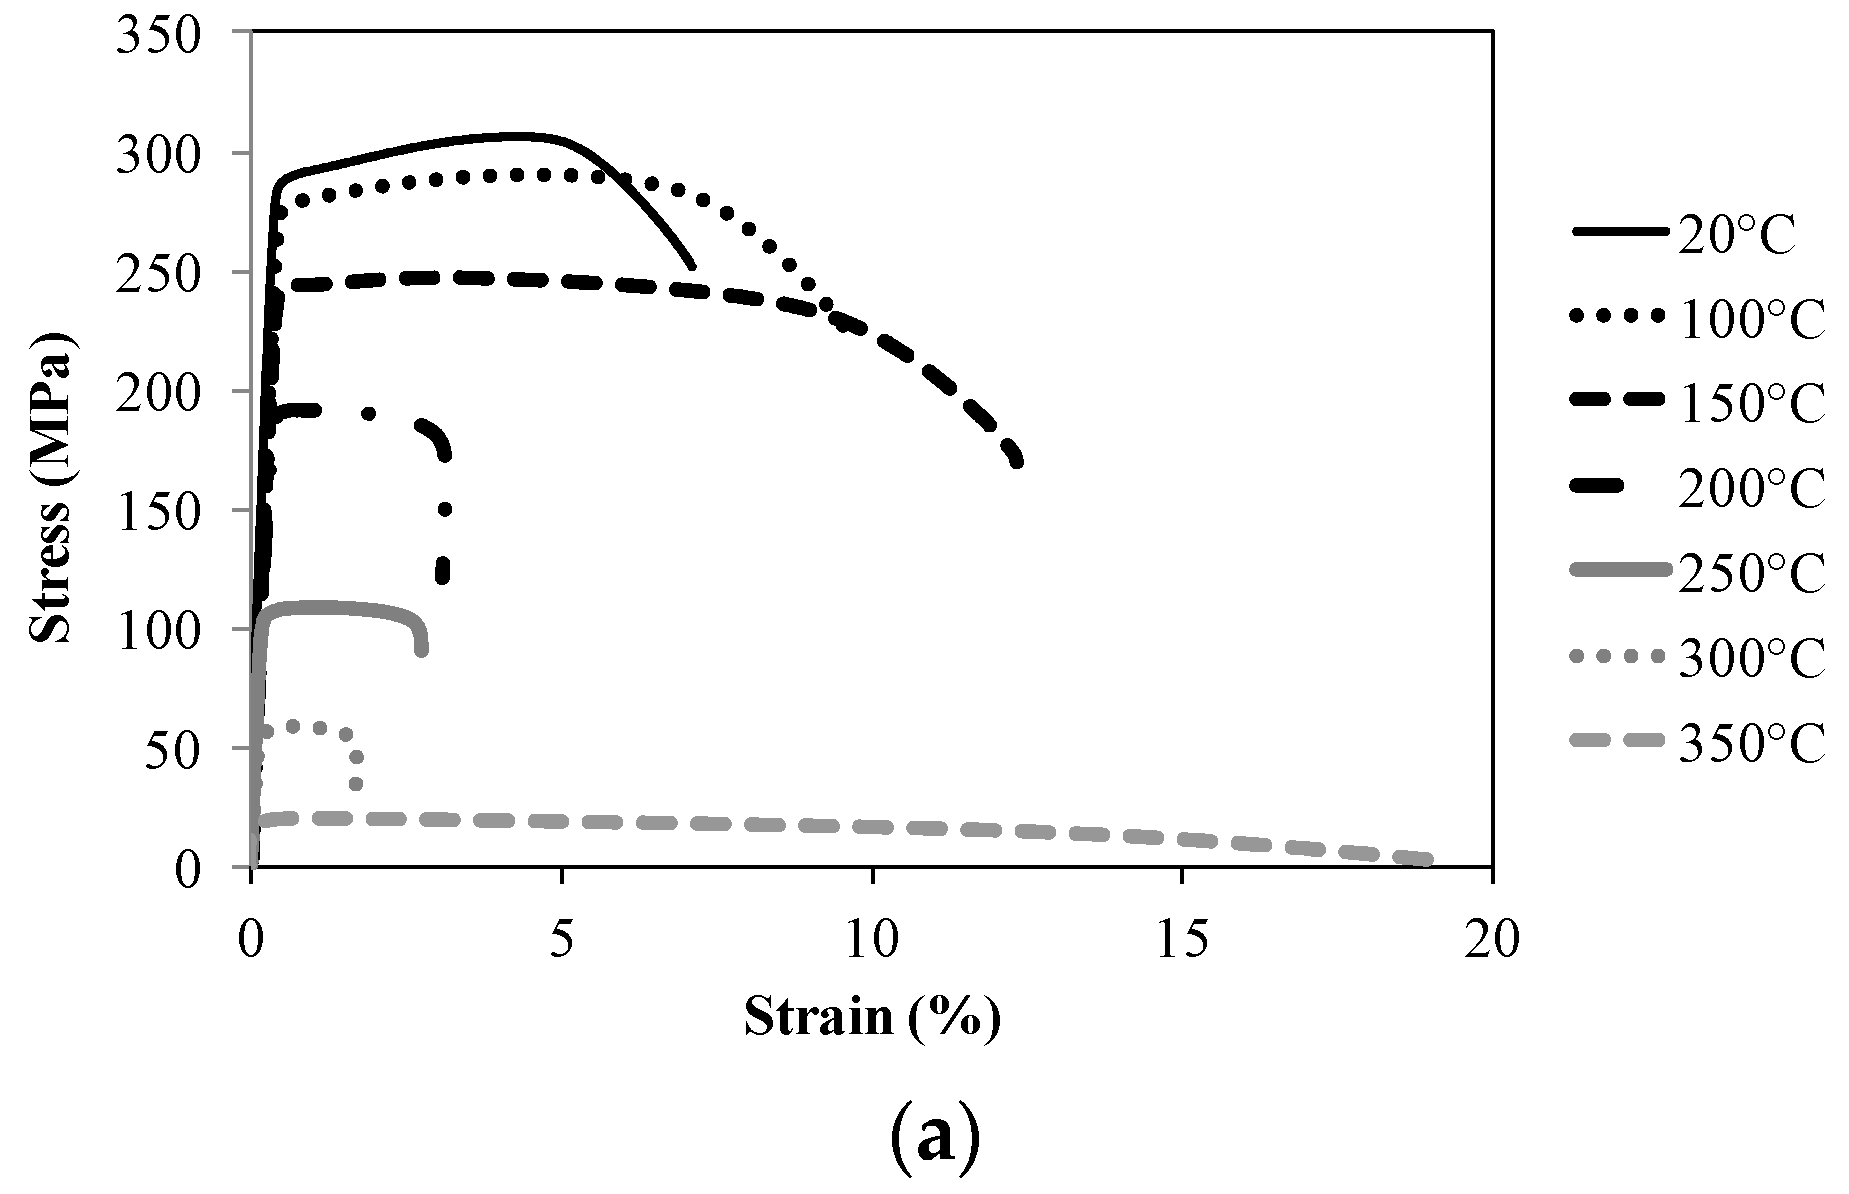
Figure 2a presents the engineering stress-strain curves obtained from the constant stress-rate tests up to 350 °C. A comparison of test results between constant stress-rate tests and the analytical Ramberg-Osgood [20,21] model is given in Figure 2b. This model is defined in the well-known form:
where n is an exponent which characterizes the degree of hardening of the curve. Within the range of plastic deformation this parameter is determined as:
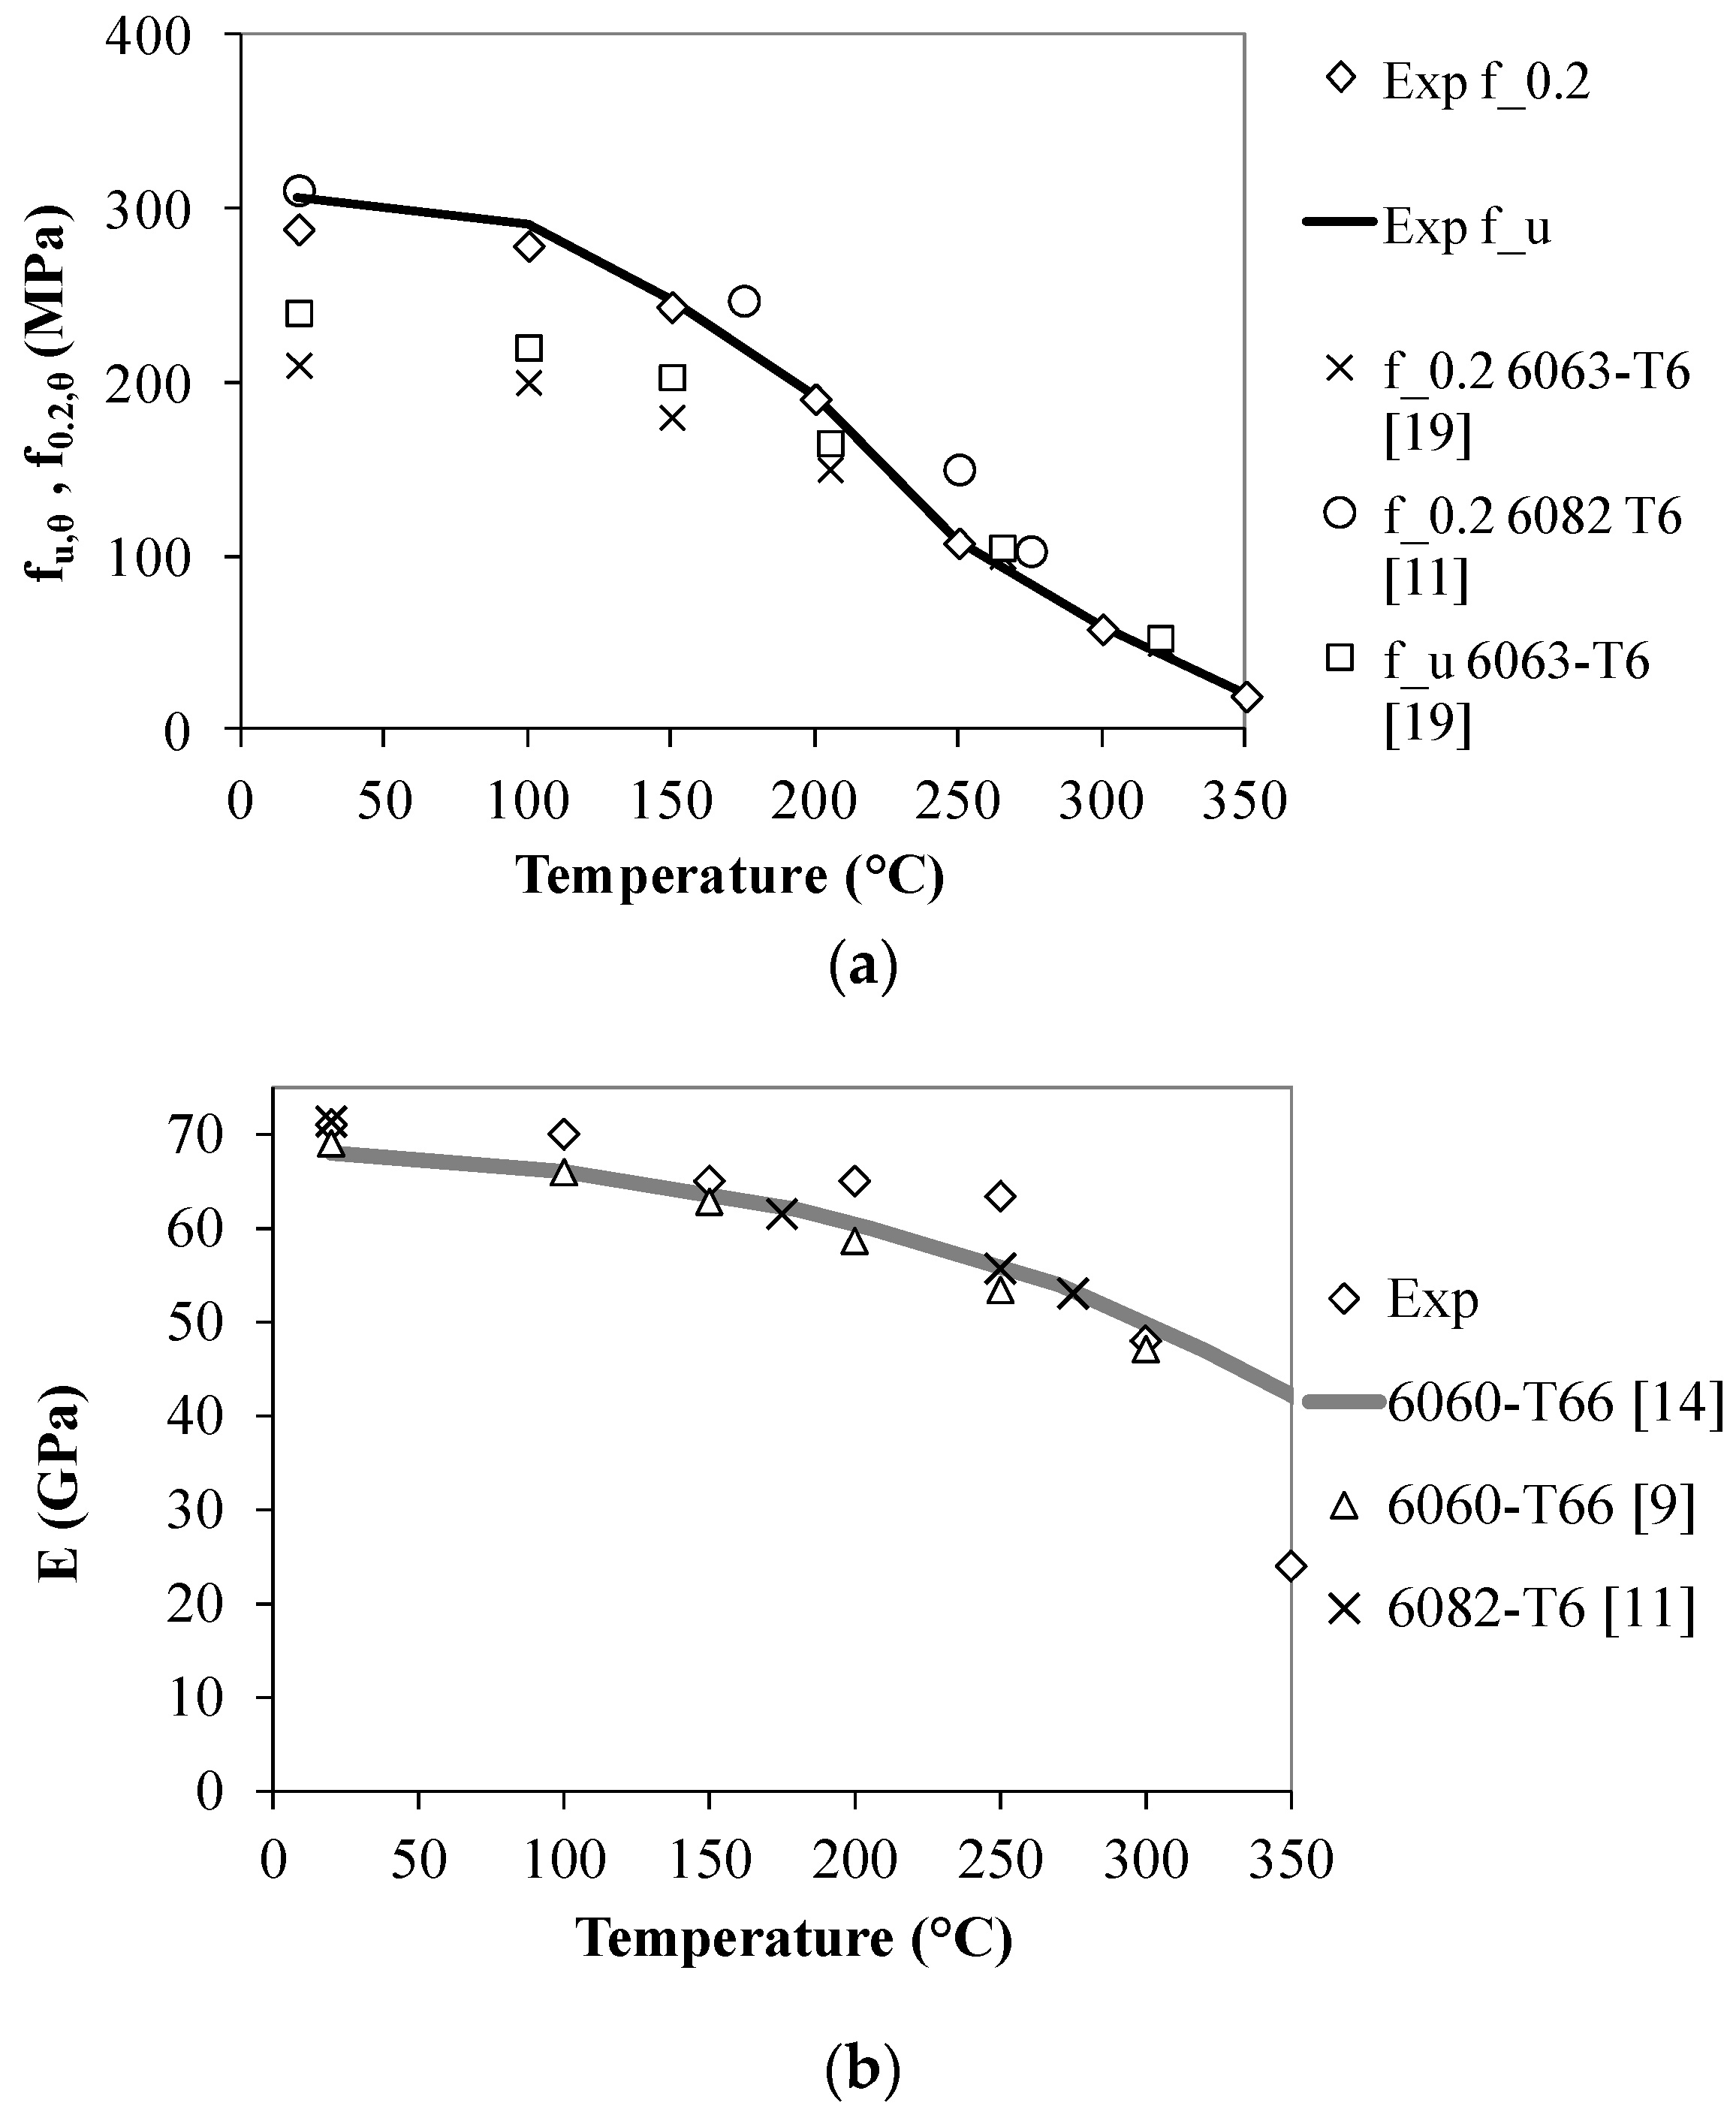
The values of the exponent n for each temperature level are given in Figure 2c and in Table 4. A similar representation of various temperature-dependent stress-related material models for aluminium alloys can be found in [21]. Figure 3a presents a comparison between the tested alloy and the comparable test studies for proof strength at 0.2% and the ultimate strength. Figure 3b presents a comparison between the tests and comparable studies for modulus of elasticity at various temperatures. Figure 3c,d present the reduction factors obtained by tests and comparable studies for the proof-stress at 0.2% strain and modulus of elasticity. Values of proof and ultimate strength from studies [14] and [15] were chosen, and 30 min thermal exposure (the soaking phase) of coupons prior to heating was applied, in order to match the exposure period which was used in these studies. The study by Langhelle [11] reported a soaking period of 20 min, which can be considered as close enough to this thermal exposure period (the soaking period of this length was also reported in a study conducted by Maljaars et al. [8,9]). For a previous study [19], the values of mechanical properties relate to a soaking time of 30 min. It has been reported in literature [6] that soaking has a high influence on strength values for temper T6; hence, it is important for comparisons that soaking times should be similar.
2.4. Analytical Creep Model
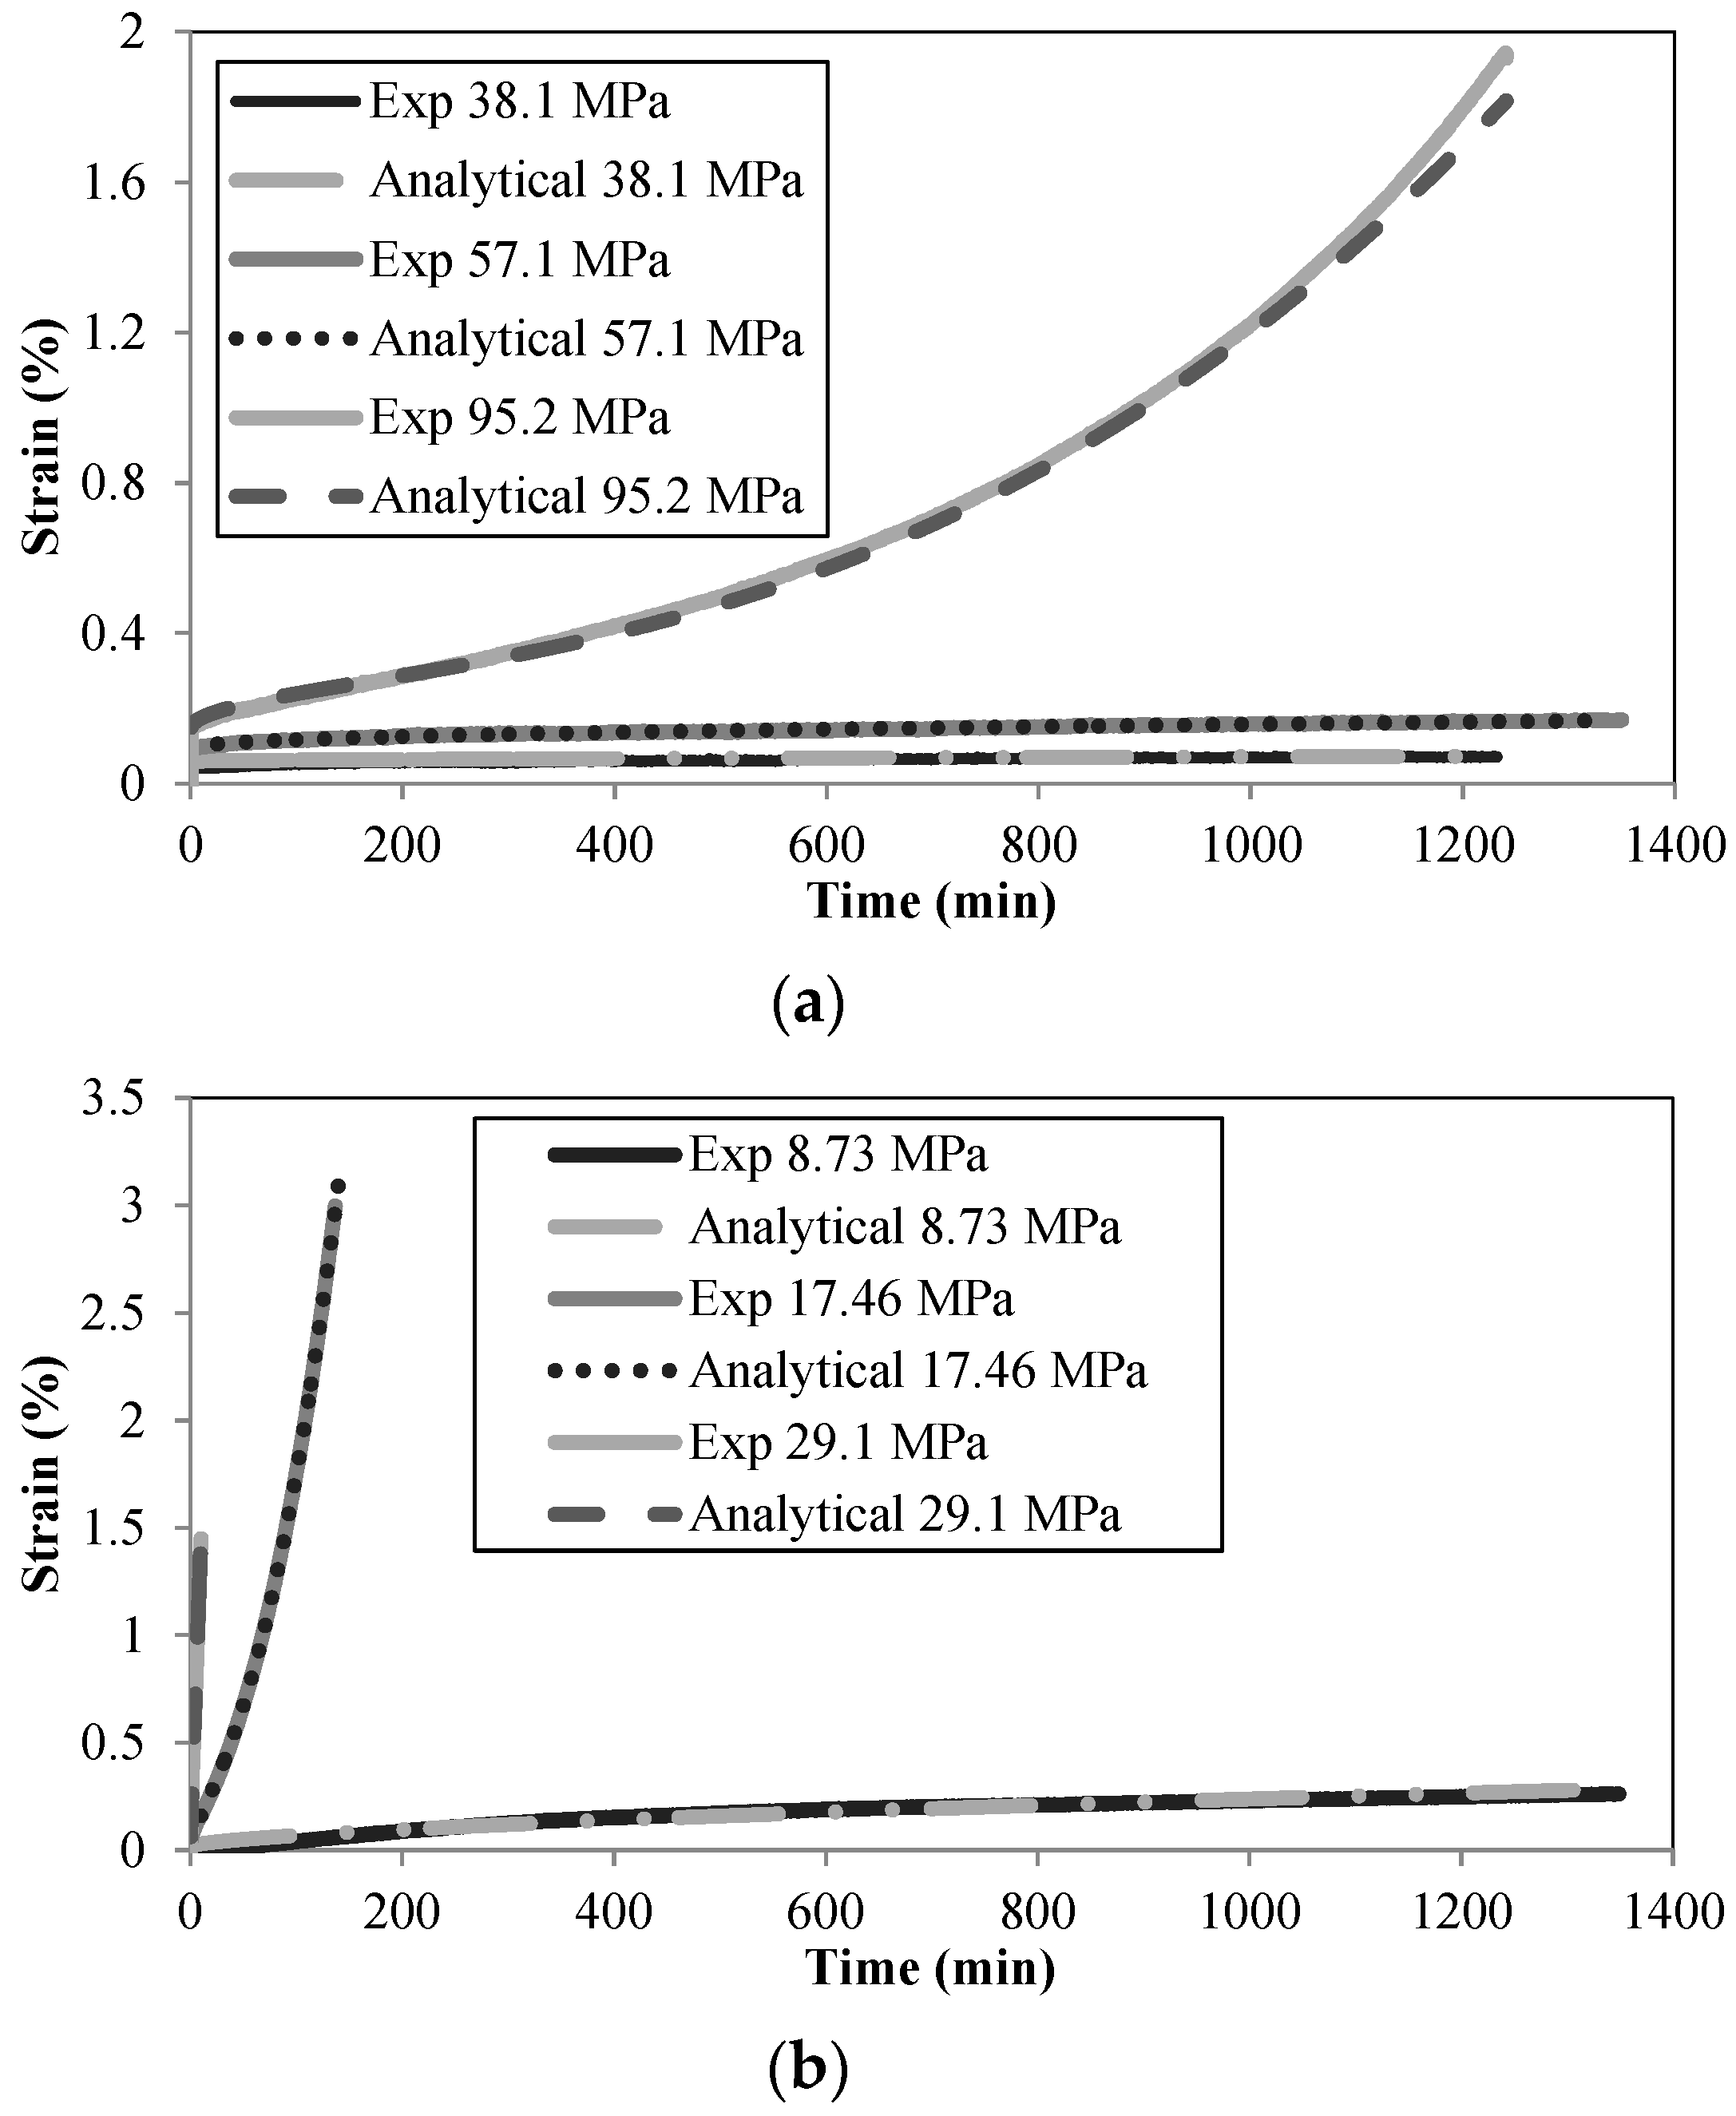
The test results presented in Figure 4 were used as a background for creating an analytical creep model suitable for implementation in structural modelling using the Finite Element Method. The proposed analytical model is designed so that it can represent all three distinctive creep phases: primary, secondary, and tertiary. The proposed model can be stated in the following form (including elastic strain):
in which: εcr is creep strain (%), t is time (min), and . Coefficients a, b, e, and f are determined by curve-fitting the creep test results for various stress levels (Figure 4), while the value of coefficient c represents an elastic strain. This coefficient can be obtained by dividing the initial stress level by the temperature-dependent modulus of elasticity Ey,θ. The coefficients used in Equation (4) are presented in Table 5. The analytical model can easily be used to interpolate a creep curve for intermediate stress levels in the temperature ranges which were used in the tests. It is important to note that the model given in Equation (4) does not contain a thermal strain component at the prescribed temperature level. The main strength of this type of model is that it can easily be implemented in a structural analysis research code, since it only requires the values of current stress, temperature, and time in order to obtain the projected creep value. Another advantage is that it can take into account all three phases of creep.
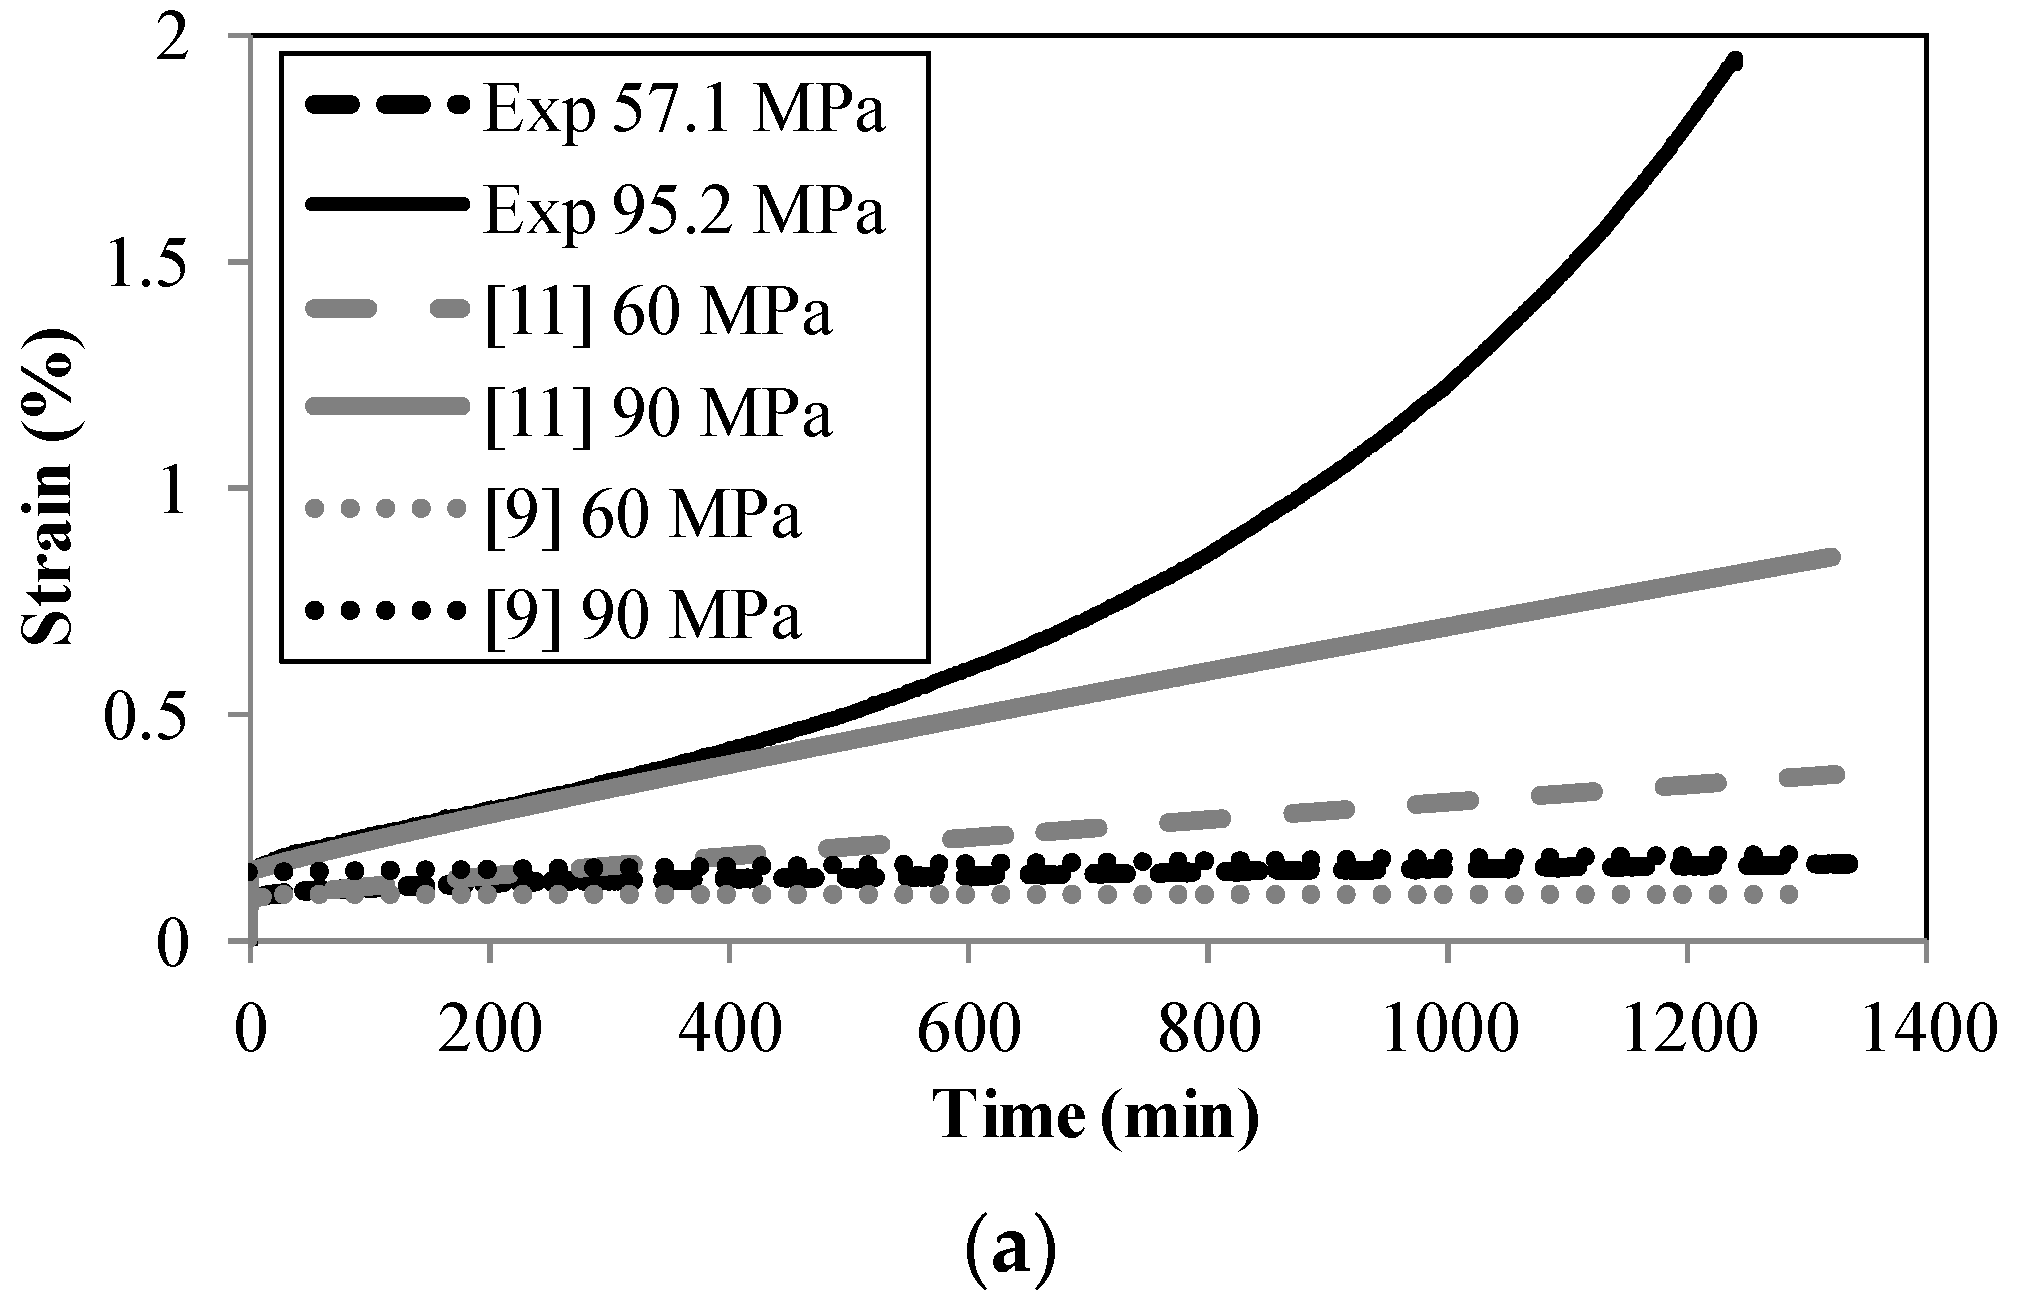
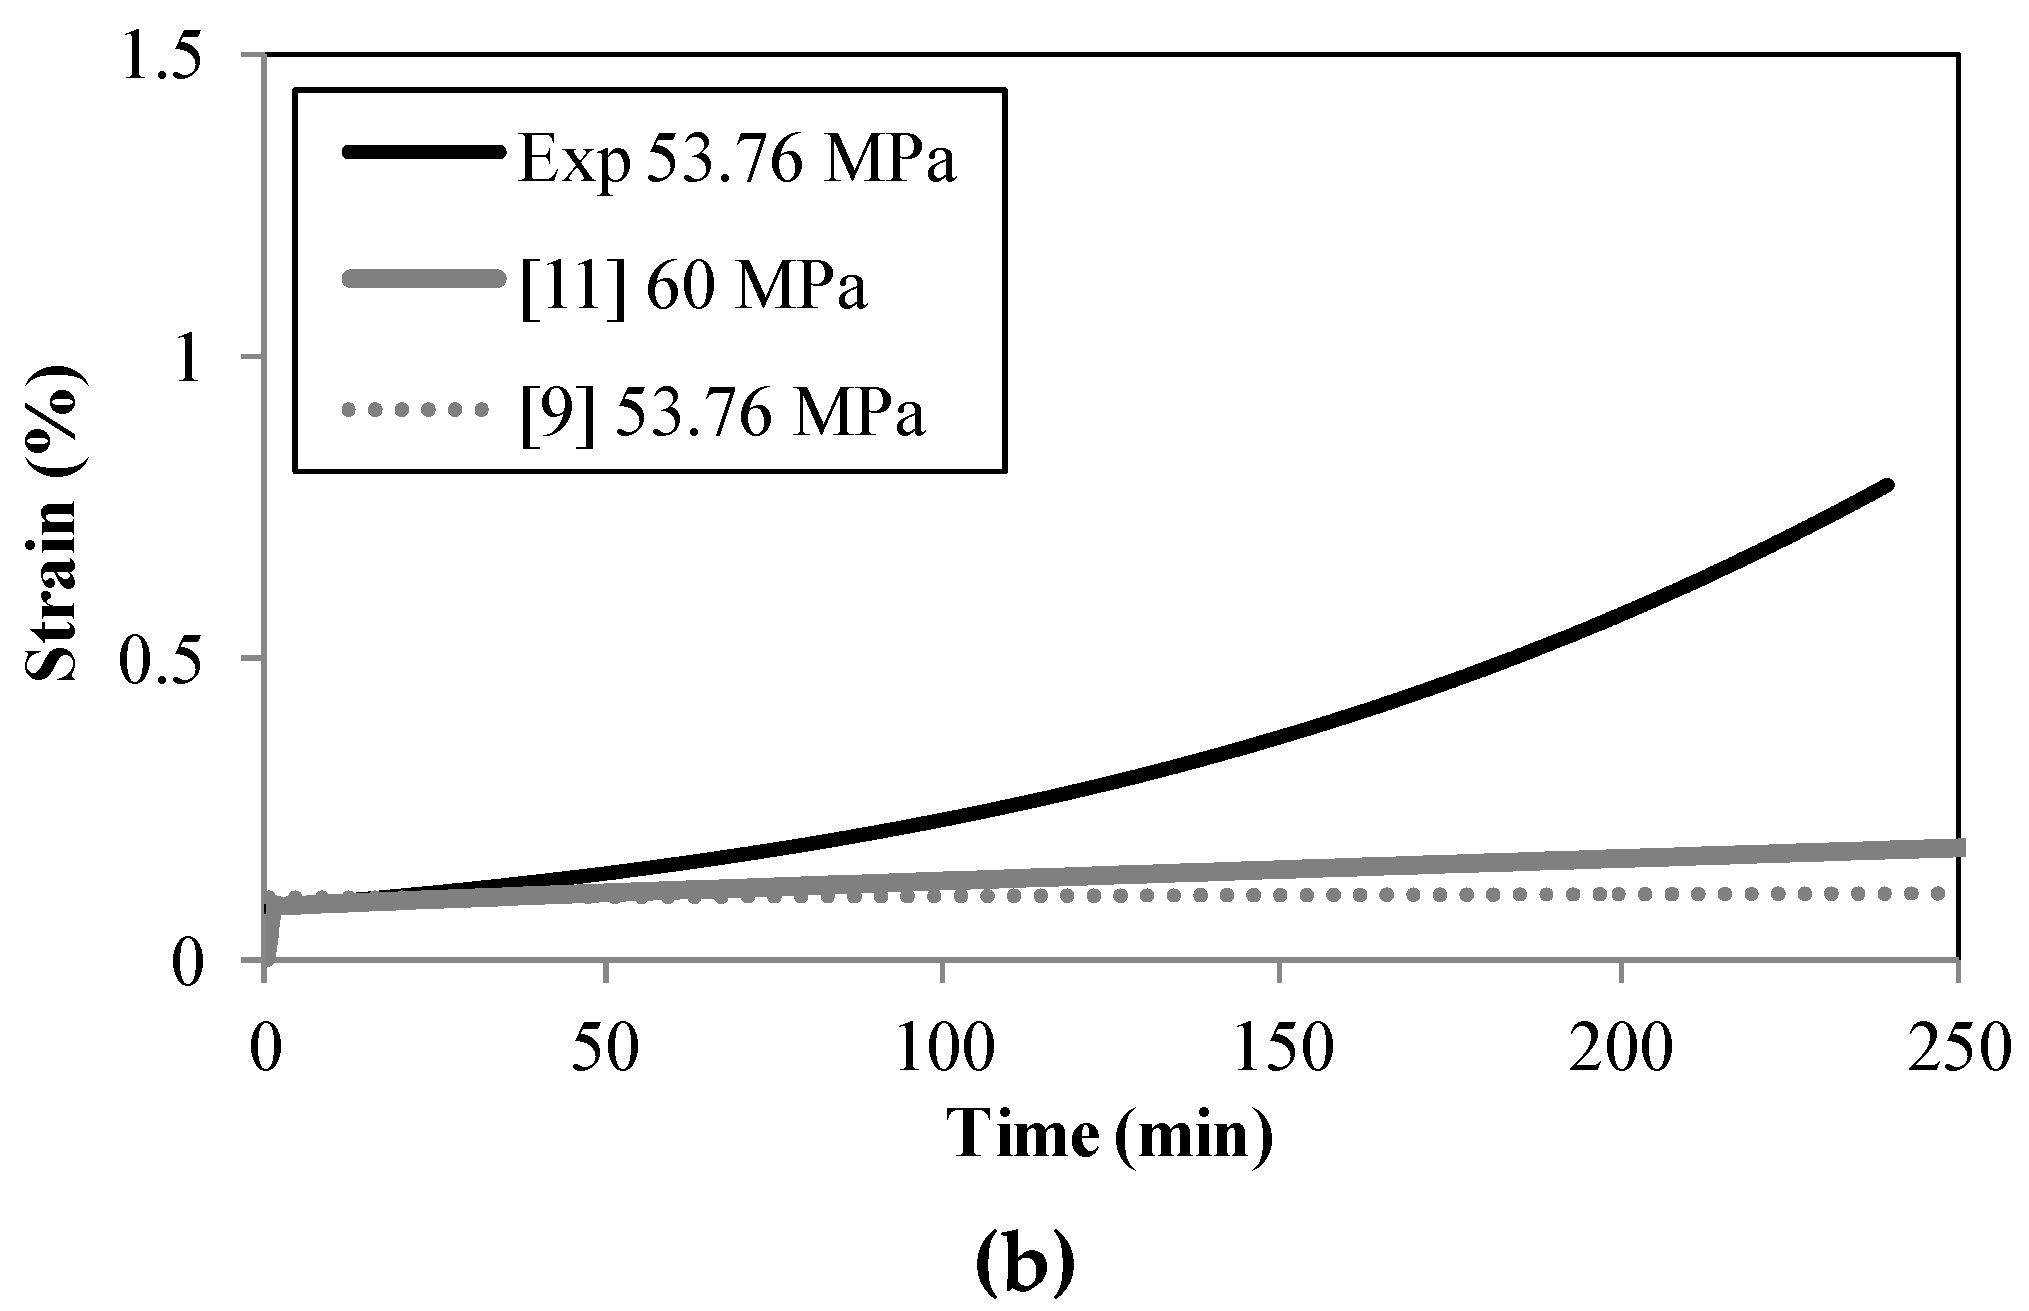
Figure 5a,b presents a comparison between the proposed analytical creep model and the results obtained from the creep tests at 200 °C and 300 °C. It can be seen that Equation (4) is in a very good agreement with the experimental results for the tested alloy for all combinations of stress and temperature levels. A comparison is given in Figure 6 between the creep output of the developed analytical model and the creep models published by Maljaars et al. [9] and Langhelle [11]. The creep model used by Langhelle [11] for 6082 alloys is based on a Norton-Bailey equation:
where represents the creep strain-rate. The coefficient A, and the indices o and p represent the temperature- and stress-dependent constants which are determined by experiment. This kind of model takes into account the primary and secondary creep phases. The creep model used by Maljaars et al. [9] for alloy 6060-T66 is based on a modification of Harmathy’s strain-hardening creep model [22]:
where TR is the temperature (°K), R is the universal gas constant (J/mol°K), ΔH is the creep activation energy (J/mol), Z is the Zener-Hollomon parameter (h−1), εcr,0 is a dimensionless creep parameter, εcr,c is the previously accumulated creep strain, and Δt (h) is the time increment.
2.5. Microstructure of Aluminium
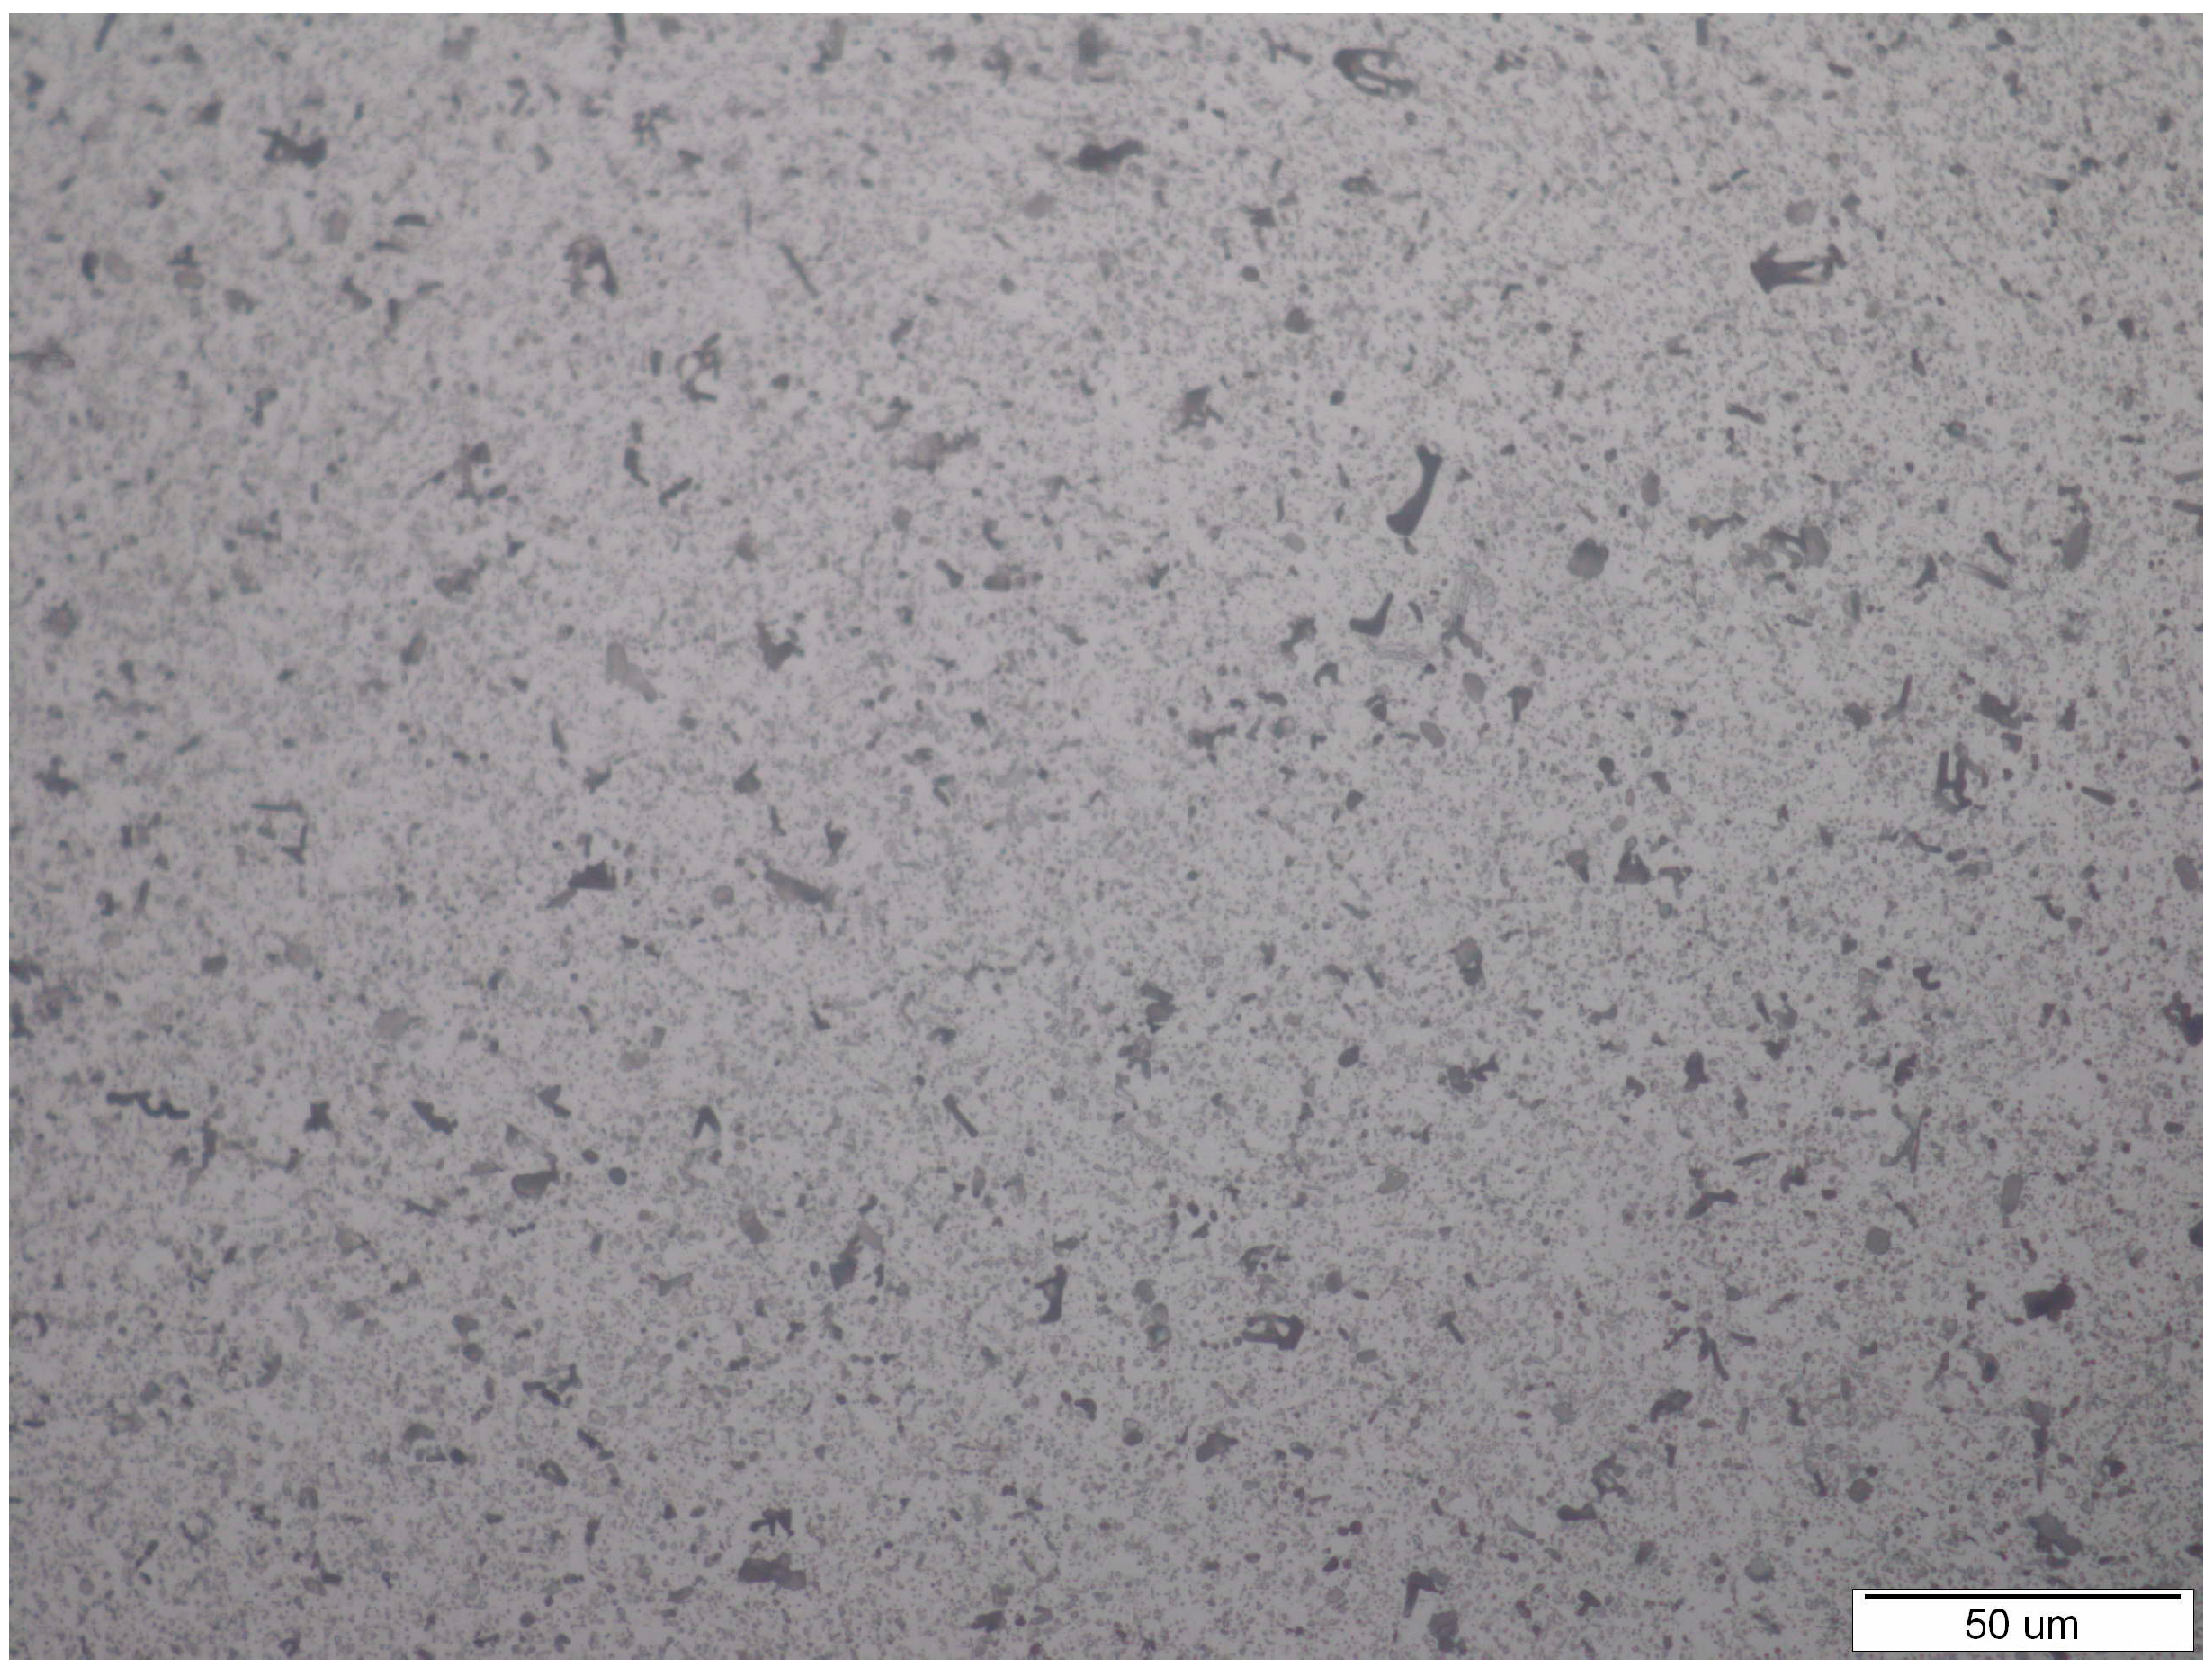
Figure 7 presents a photograph of the microstructure of a virgin specimen of aluminium obtained by optical microscope at 500× normal magnification. The structure consists mostly of aluminium together with visible large rounded particles of Mg2Si and angular particles of (Fe,Mn)3SiAl12. Vickers hardness testing was conducted after cooling for specimens which had been heated to 20 °C and 300 °C; this showed a reduction in hardness value from 68.1 to 39.9. The chemical composition of the tested alloy is presented in Table 6.
3. Discussion of Results
3.1. Constant Stress-Rate Tests
As expected, the shapes of stress-strain curves show a gradual decrease of modulus of elasticity, stress at 0.2% strain, and ultimate strength with increase of temperature. As can be observed from Figure 2a, the ultimate strain at failure increases from 7.1% at 20 °C to 12.3% at 150 °C. In the temperature range 200 °C–300 °C the ultimate strain reduces below 12.3%, and at 350 °C the ultimate strain is increased up to 19.3%. This kind of variation in ultimate strain sometimes occurs when conducting constant stress-rate tests. This phenomenon can be attributed to dynamic strain aging, which is treated as a hardening phenomenon. It is sometimes observed as serrations in the stress-strain curve, which represent the most visible effect of dynamic strain aging. However, when these serrations are not present, dynamic strain aging can be expressed by other types of effect, for example, by lower strain rate sensitivity or by minimum variation of ductility with temperature.
Additionally, this variation in ultimate strain (including the temperature-related hardening parameter n presented in Figure 2c) is highly dependent on the grade of alloy that is being studied [14,21]. The analytical model based on the Ramberg-Osgood relationship (Equation (2)) is capable of adequately reproducing the experimental results as shown in Figure 2b.
3.2. Stress at 0.2% Strain and Modulus of Elasticity
The reduction factors presented in Figure 3a–c indicate a very good match between the factors proposed by Eurocode 9 (for 6082 alloy) and the stress at 0.2% strain obtained by the current tests (f0.2,θ). This observation is also evident when comparing the test results for f0.2,θ with the test results from the study by Langhelle [11]. The comparison with the previous study [19] in Figure 3a also indicates a good match up to 350 °C for reduction factors regarding f0.2,θ. A similar observation can be made with respect to the test results for ultimate strength fu,θ. This indicates that the results correlate well with at least one different reference originating from the same alloy type. Comparison of modulus of elasticity (Figure 3b–d) also shows a good match with the selected studies of alloy 6082 up to 300 °C. By analysing the comparisons from Figure 3, it appears that the tests of mechanical properties correlate well with other comparable high-temperature studies of 6082-T6 alloy.
3.3. Creep Development
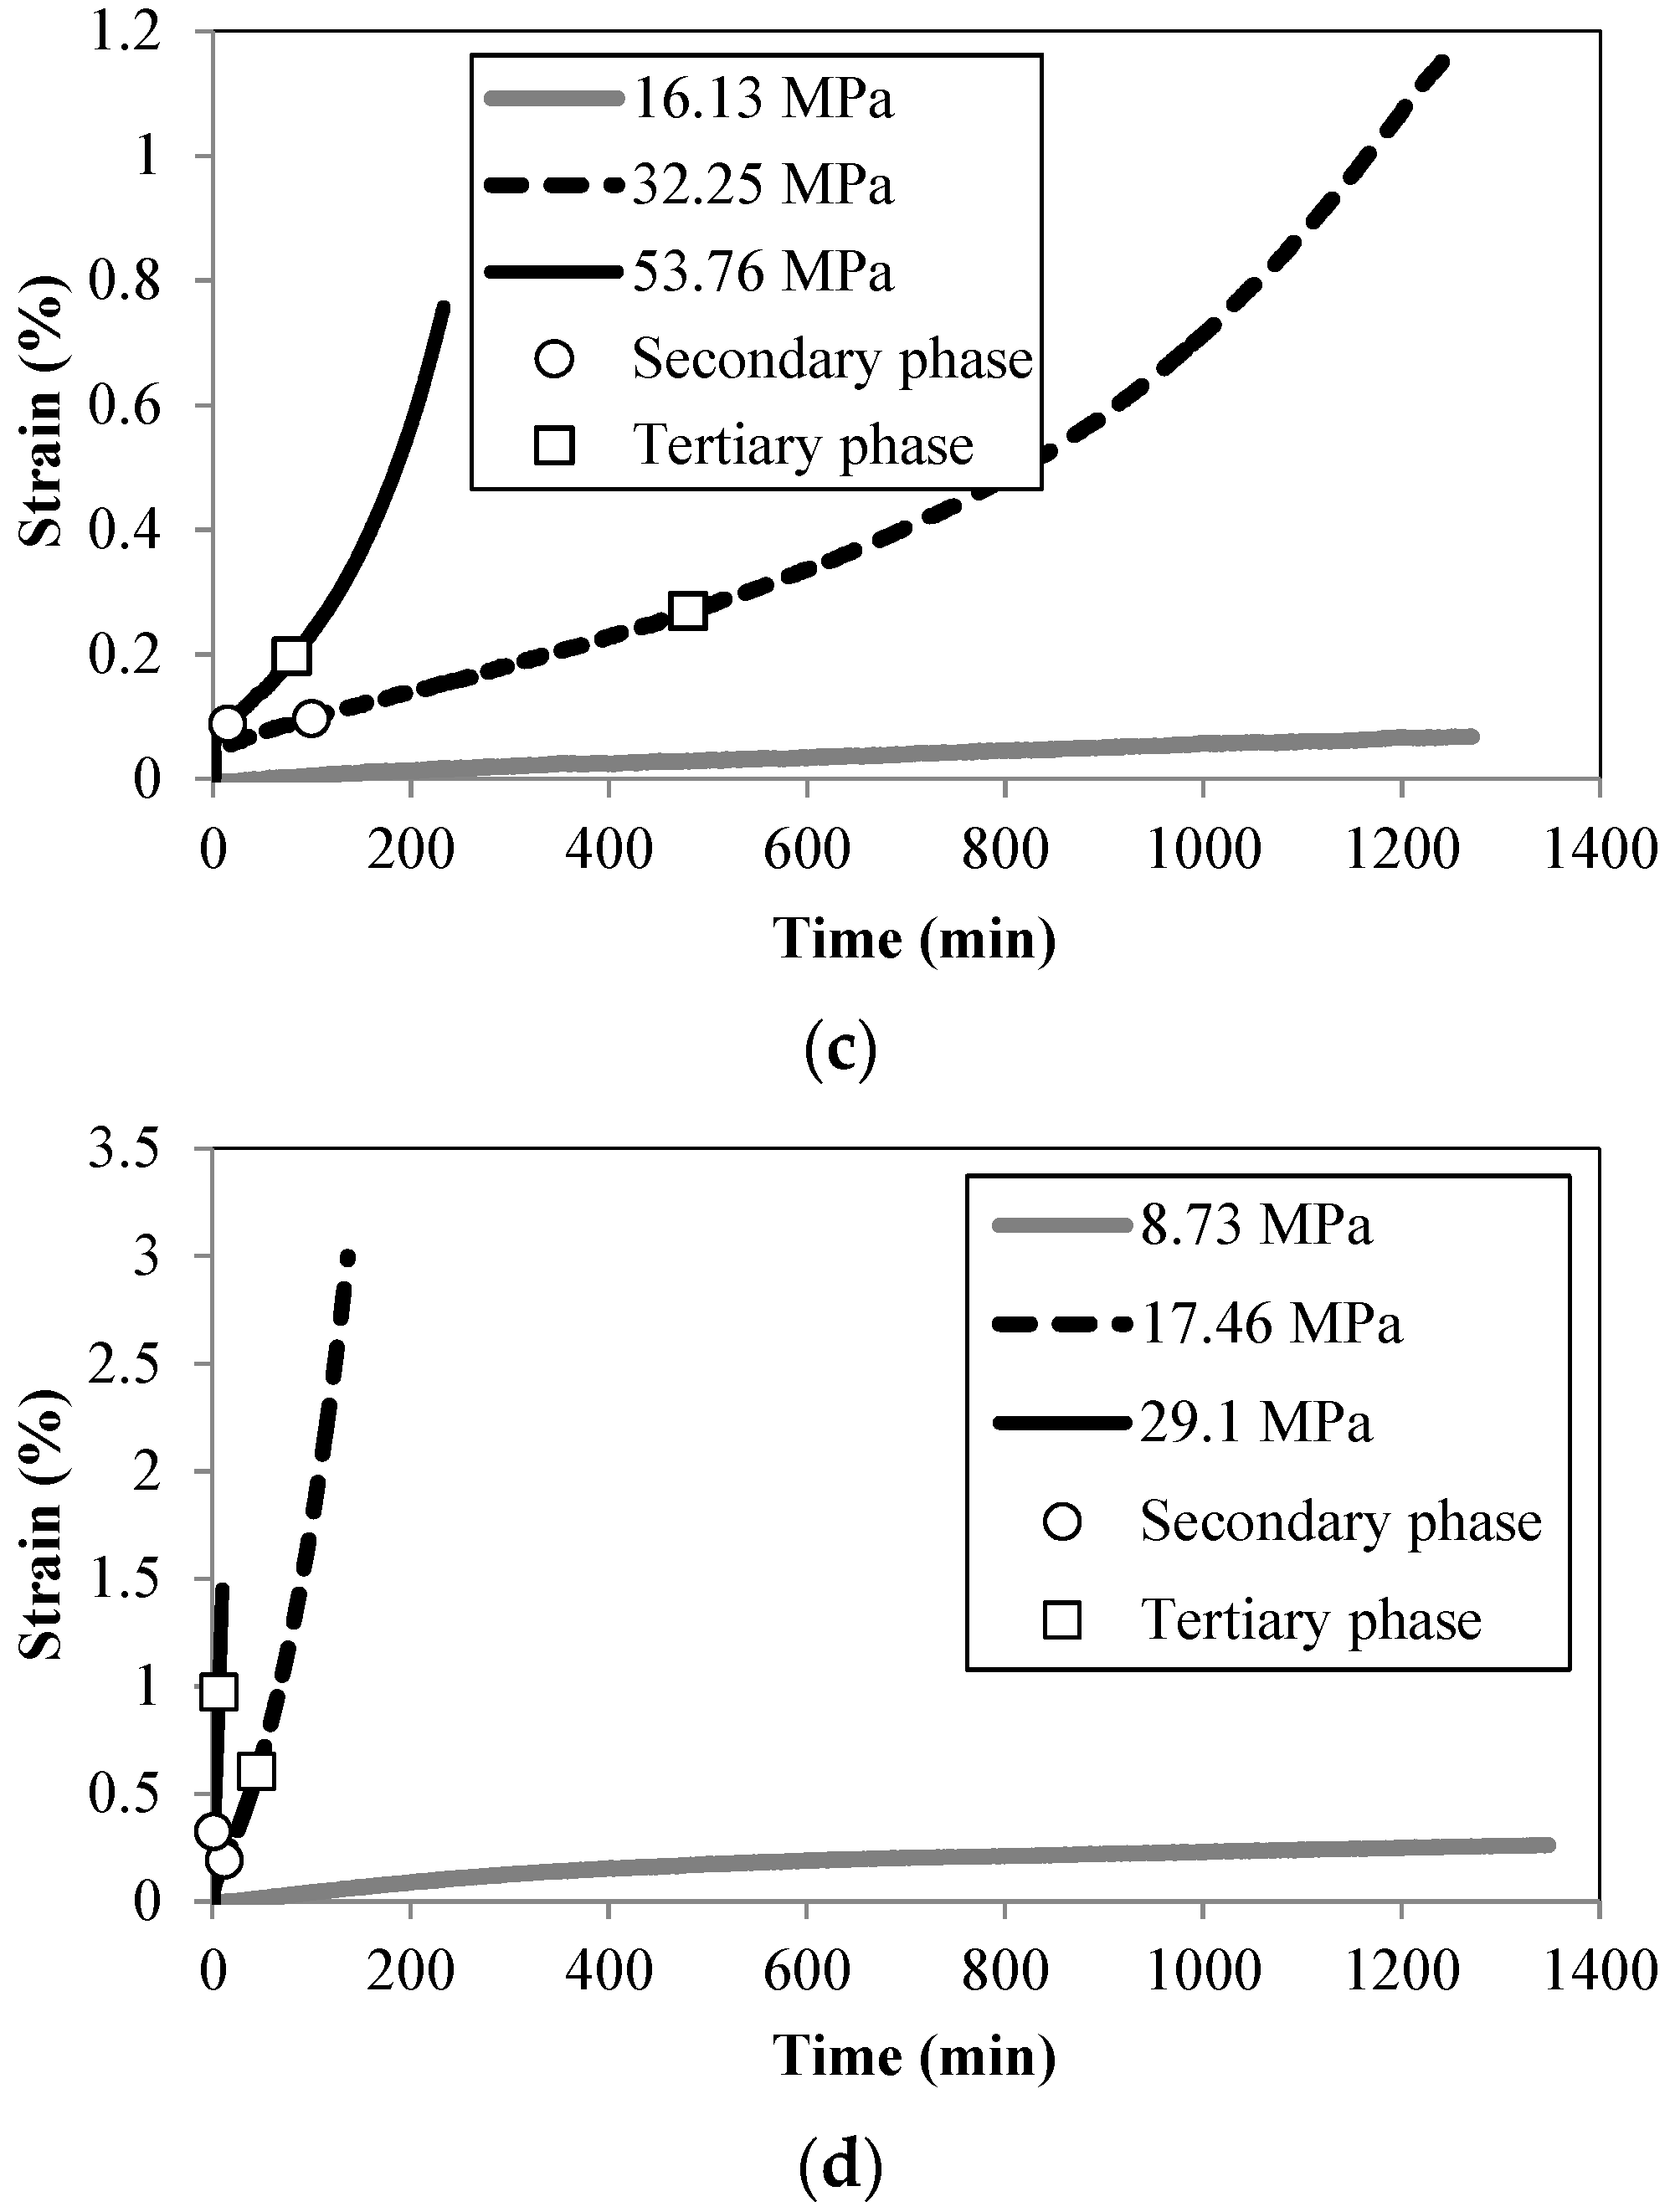
The creep test results presented in Figure 4a indicate that creep development starts at a very high stress level (0.7f0.2,θ), indicating that at a temperature of approximately 150 °C creep development cannot be considered important. At 200 °C, for stresses between 0.3f0.2, θ and 0.5f0.2,θ, significant creep development can be observed in Figure 4b. Similar observations can be made from Figure 4c–d for temperatures of 250 °C and 300 °C. It is important to note that at 300 °C creep development starts at a very low stress level, which suggests that this temperature can be considered as ultimate for creep development. It can be seen that alloy 6082-T6 has a relatively high creep resistance at 200 °C and minimal creep resistance at 300 °C. Hence, the critical temperature interval within which creep should be taken into account for alloy 6082-T6 is between 200 and 300 °C. This temperature interval is relatively narrow, and is within the critical temperature interval in which rapid reduction of the mechanical properties of aluminium is expected to occur. Generally, the latter occurs for temperatures less than 350 °C (Figure 3c).
3.4. Time of Occurrence of Creep Phases
The times at which the distinct creep phases occur can be important in the context of structural fire engineering. There is a general assumption in the engineering community that the occurrence of the tertiary phase can be neglected, since most structural sections used in construction practice do not heat to high enough temperatures for long enough to achieve rupture during a normal building fire. Therefore, the onset of the primary and secondary creep phases can be considered as highly probable events. However, the tertiary creep phase may be important, particularly for T6 tempers rather than the annealed material. The important contextual factor which needs to be defined for a thermo-structural analysis is the duration of a general fire event; this is often assumed to be not greater than four hours.
By analysing the times (from Table 2) at which the primary and secondary creep phases were initiated in the conducted tests, it is evident that the secondary creep phase manifests itself at almost all stress levels in the temperature range 150 °C–300 °C. This fact may be used to identify the critical temperature interval for the analysed alloy.
3.5. Accuracy of the Analytical Creep Model
Figure 5a,b indicates that the developed analytical creep model can be used to reproduce the creep test results for all three distinct creep phases, and that the discrepancy between the model and the creep test results can be considered negligible. The analytical creep model, in its present form, can easily be implemented in Finite Element research code, using independent values of stress, temperature, and time variables to calculate the creep strain. The main weakness of the model is that its precision depends mainly on the frequency of temperature intervals which are used when analysing the creep output at intermediate temperature levels. Refining the temperature intervals can increase the precision of the proposed analytical model.
3.6. Comparison with Existing Creep Models
Comparisons presented in Figure 6a,b between the creep test results at temperatures of 200 °C and 250 °C and the selected creep models indicate a good match between the creep model from a previous study by Langhelle [11] for the primary and secondary creep phases. The stress values of 60 MPa and 90 MPa from study [11] in Figure 6a represent values which most closely approach the stress level used in this study (57.1 and 95.2 MPa at 200 °C). It is important to note that the creep model used in studies by Maljaars et al. [9] and Langhelle [11] takes into account only the primary and secondary creep phases. Thus, there is a discrepancy in the region where the tertiary creep phase manifests itself. The good correlation with the study by Langhelle [11] can be attributed to the fact that both studies are based on the same alloy type. This match increases confidence in the proposed creep model for alloy 6082-T6.
4. Conclusions
Mechanical and creep properties of aluminium alloy EN 6082AW T6 at high temperatures have been presented in this study. A reliable prediction of the critical temperature interval for creep manifestation using the analytical creep model presented represents its main scientific contribution. Analysing the test data and the comparisons with existing research data, the following conclusions can be drawn:
- Mechanical properties of the analysed alloy correlate well with the proposal from Eurocode 9 and study [11] which is based on the same alloy type;
- The critical temperature interval for creep manifestation of the analysed alloy lies within the range 200 °C–300 °C;
- The analytical creep model proposed is sufficiently accurate to represent the creep test results;
- Creep test results correlate well with results from the study by Langhelle [11] for the primary and secondary phases.
Acknowledgements
This work has been fully supported by The Croatian Science Foundation as part of the project Influence of creep strain on the load capacity of steel and aluminium columns exposed to fire (UIP-2014-09-5711).
Author Contributions
Neno Torić, Josip Brnić, Ivica Boko, Marino Brčić and Ivana Uzelac designed the research, conducted the experiments and prepared the draft manuscript. Ian W. Burgess supervised the project and participated in the discussions.
Conflicts of Interest
The authors declare no conflict of interest.
Nomenclature
| total strain in fire conditions | |
| temperature dependent thermal strain | |
| stress-related strain | |
| stress-, temperature-, and time-dependent creep strain | |
| strain value at fu,θ | |
| εt | ultimate strain |
| f0.2 | stress at 0.2% strain at normal temperature |
| f0.2,θ | stress at 0.2% strain at temperature θ |
| fu | ultimate strength at normal temperature |
| fu, θ | ultimate strength at temperature θ |
| Ey,20 | modulus of elasticity at normal temperature |
| Ey,θ | modulus of elasticity at temperature θ |
| kE,θ | reduction factor for modulus of elasticity at temperature θ |
| k0,θ | reduction factor for stress at 0.2% strain at temperature θ |
References
- Mazzolani, F.M. Aluminium Alloy Structures, 2nd ed.; E & FN SPON, Chapman & Hall: London, UK, 1994. [Google Scholar]
- Skejić, D.; Boko, I.; Torić, N. Aluminium as a modern material for structures. Građevinar 2015, 67, 1075–1085. [Google Scholar]
- European Committee for Standardization. EN 1999-1-1:2007, Eurocode 9—Design of Aluminium Structures—Part 1-1: General Structural Rules; European Committee for Standardization: Brussels, Belgium, 2007. [Google Scholar]
- Purkiss, J.A. Fire Safety Engineering Design of Structures, 2nd ed.; Butterworth-Heinemann: Oxford, UK, 2007. [Google Scholar]
- Maljaars, J.; Soetens, F.; Katgerman, L. Constitutive model for aluminium alloys exposed to fire conditions. Metall. Mater. Trans. A 2008, 39, 778–789. [Google Scholar] [CrossRef]
- Maljaars, J. Literature Study on Aluminium Structures Exposed to Fire, Report 1; Netherlands Institute for Metals Research, Technical University of Eindhoven, TNO Built Environment and Geosciences: Eindhoven, The Netherlands, 2005. [Google Scholar]
- Maljaars, J.; Twilt, L.; Fellinger, J.H.H.; Snijder, H.H.; Soetens, F. Aluminium structures exposed to fire conditions—An overview. Heron 2010, 55, 85–122. [Google Scholar]
- Maljaars, J.; Soetens, F.; Snijder, H.H. Local buckling of aluminium structures exposed to fire Part 1: Tests. Thin Walled Struct. 2009, 47, 1404–1417. [Google Scholar] [CrossRef]
- Maljaars, J.; Soetens, F.; Snijder, H.H. Local buckling of aluminium structures exposed to fire Part 2: Finite element models. Thin Walled Struct. 2009, 47, 1418–1428. [Google Scholar] [CrossRef]
- Zheng, Y.Q.; Zhang, Z. The fire performance and fire-resistance design of aluminium alloy I-beams. Fire Mater. 2016, 40, 141–157. [Google Scholar] [CrossRef]
- Langhelle, N.K. Experimental Validation and Calibration of Nonlinear Finite Element Models for Use in Design of Aluminium Structures Exposed to Fire. Ph.D. Thesis, Norwegian University of Science and Technology, Trondheim, Norway, April 1999. [Google Scholar]
- Eberg, E.; Amdahl, J.; Langhelle, N.K. Experimental Investigation of Creep Behaviour of Aluminium at Elevated Temperatures, SINTEF Report No. STF22 F96713; SINTEF: Trondheim, Norway, 1996.
- Fogle, E.J.; Lattimer, B.Y.; Feih, S.; Kandare, E.; Mouritz, A.P.; Case, S.W. Compression load failure of aluminium plates due to fire. Eng. Struct. 2012, 34, 155–162. [Google Scholar] [CrossRef]
- Kaufman, J.G. Properties of Aluminium Alloys—Tensile, Creep and Fatigue Data at High and Low Temperatures; ASM International: Materials Park, OH, USA, 1999. [Google Scholar]
- Voorhees, H.R.; Freeman, J.W. Report on the Elevated-Temperature Properties of Aluminium and Magnesioum Alloys; STP No. 291; American Society of Testing Materials: West Conshohocken, PA, USA, 1960. [Google Scholar]
- Anderberg, Y. Modelling Steel Behaviour. Fire Saf. J. 1988, 13, 17–26. [Google Scholar] [CrossRef]
- American Society for Testing and Materials (ASTM). ASTM E8/E8M-11, Standard Test Methods for Tension Testing of Metallic Materials; ASTM International: West Conshohocken, PA, USA, 2011. [Google Scholar]
- American Society for Testing and Materials (ASTM). ASTM E21–09, Standard Test Methods for Elevated Temperature Tension Tests of Metallic Materials; ASTM International: West Conshohocken, PA, USA, 2009. [Google Scholar]
- Metallnormcentralen (MNC). Aluminium Konstruksjonsbock Materiallaera; MNC Handbook 12; MNC: Stockholm, Sweden, 1983. [Google Scholar]
- Shepherd, P. The Performance in Fire of Restrained Columns in Steel-Framed Construction. Ph.D. Thesis, University of Sheffield, Sheffield, UK, July 1999. [Google Scholar]
- Faggiano, B.; De Matteis, G.; Landolfo, R.; Mazzolani, F. Behaviour of aluminium alloy structures under fire. J. Civ. Eng. Manag. 2004, 10, 183–190. [Google Scholar] [CrossRef]
- Harmathy, T.Z. Creep Deflections of Metal Beams in Transient Heating Processes, with Particular Reference to Fire. Can. J. Civ. Eng. 1976, 3, 219–228. [Google Scholar] [CrossRef]
Figure 1.
Coupon geometry and test setup; (a) Coupon geometry (mm); (b) Test equipment.
Figure 2.
Stationary stress-strain curves—test results and comparison with the analytical model; (a) Stress-strain test results; (b) Comparison with the analytical Ramberg-Osgood model; (c) Temperature dependent parameter n for the EN 6082AW T6 alloy.
Figure 2.
Stationary stress-strain curves—test results and comparison with the analytical model; (a) Stress-strain test results; (b) Comparison with the analytical Ramberg-Osgood model; (c) Temperature dependent parameter n for the EN 6082AW T6 alloy.

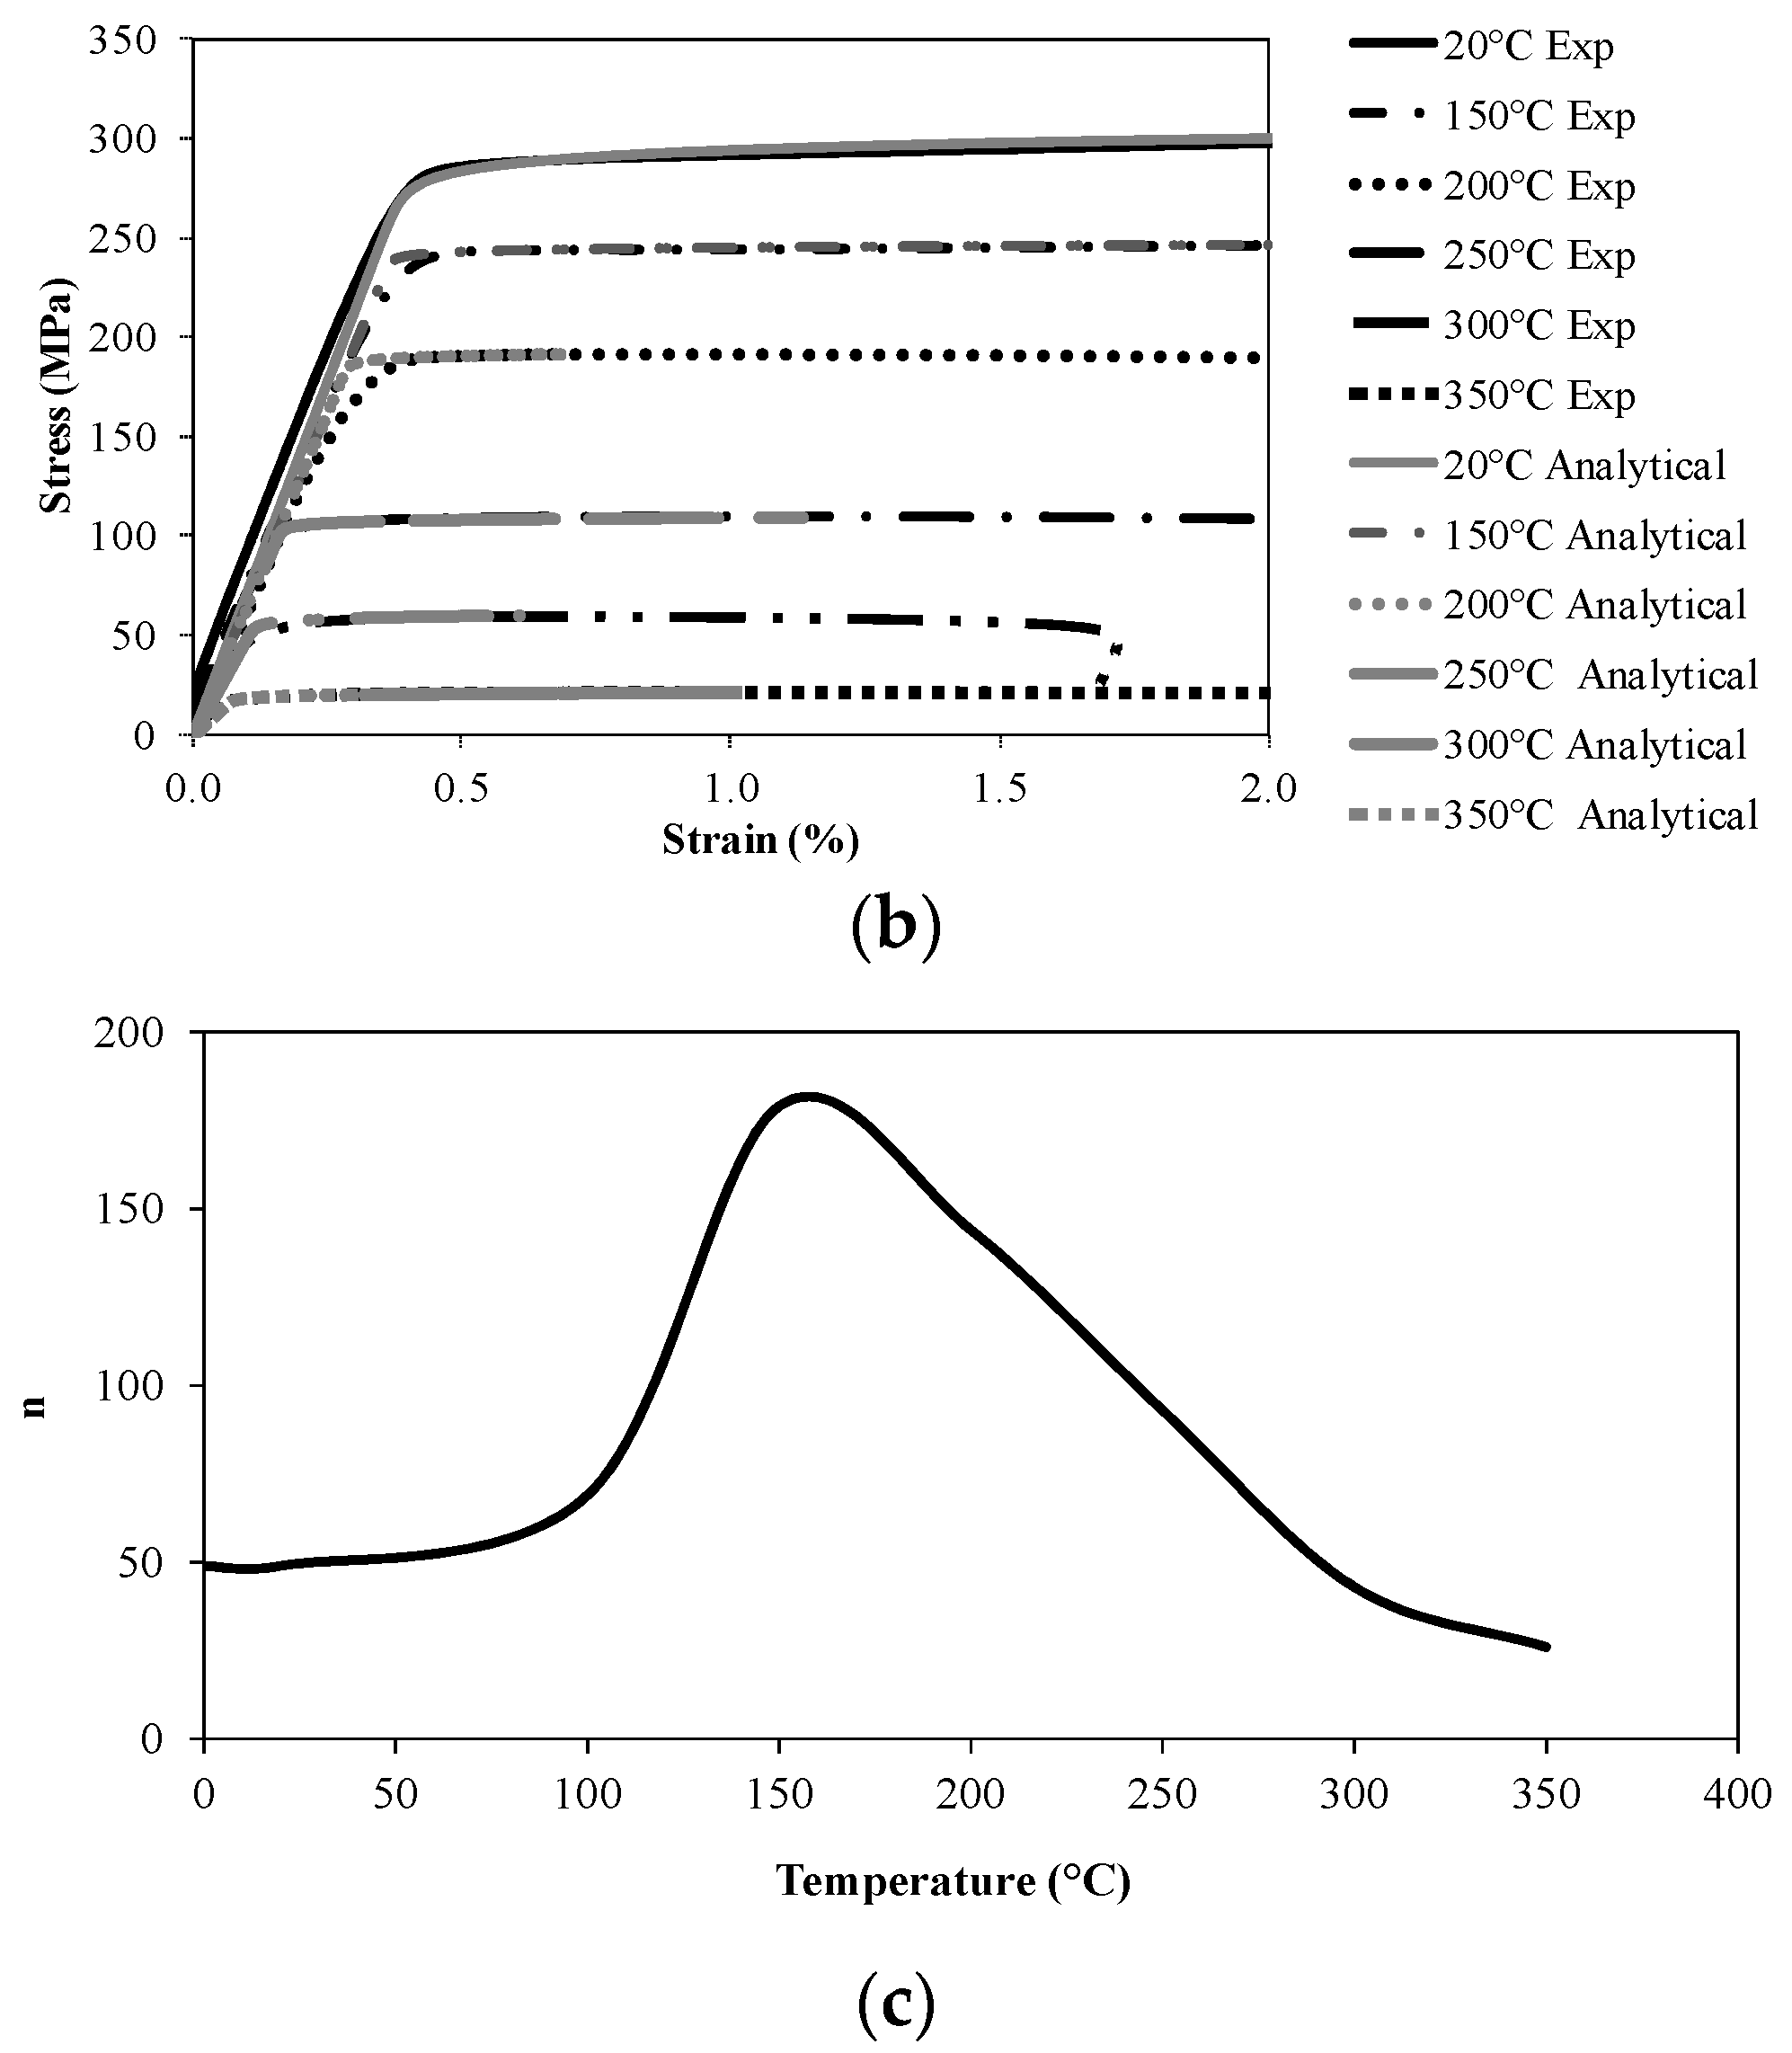
Figure 3.
Stress at 0.2% strain and modulus of elasticity—comparison with other studies; (a) Reduction of 0.2% stress and ultimate strength and comparison with other test studies; (b) Reduction of modulus of elasticity; (c) Comparison of reduction factors for proof strength with Eurocode 9 and other studies; (d) Comparison of reduction factors for modulus of elasticity with Eurocode 9 and other studies.

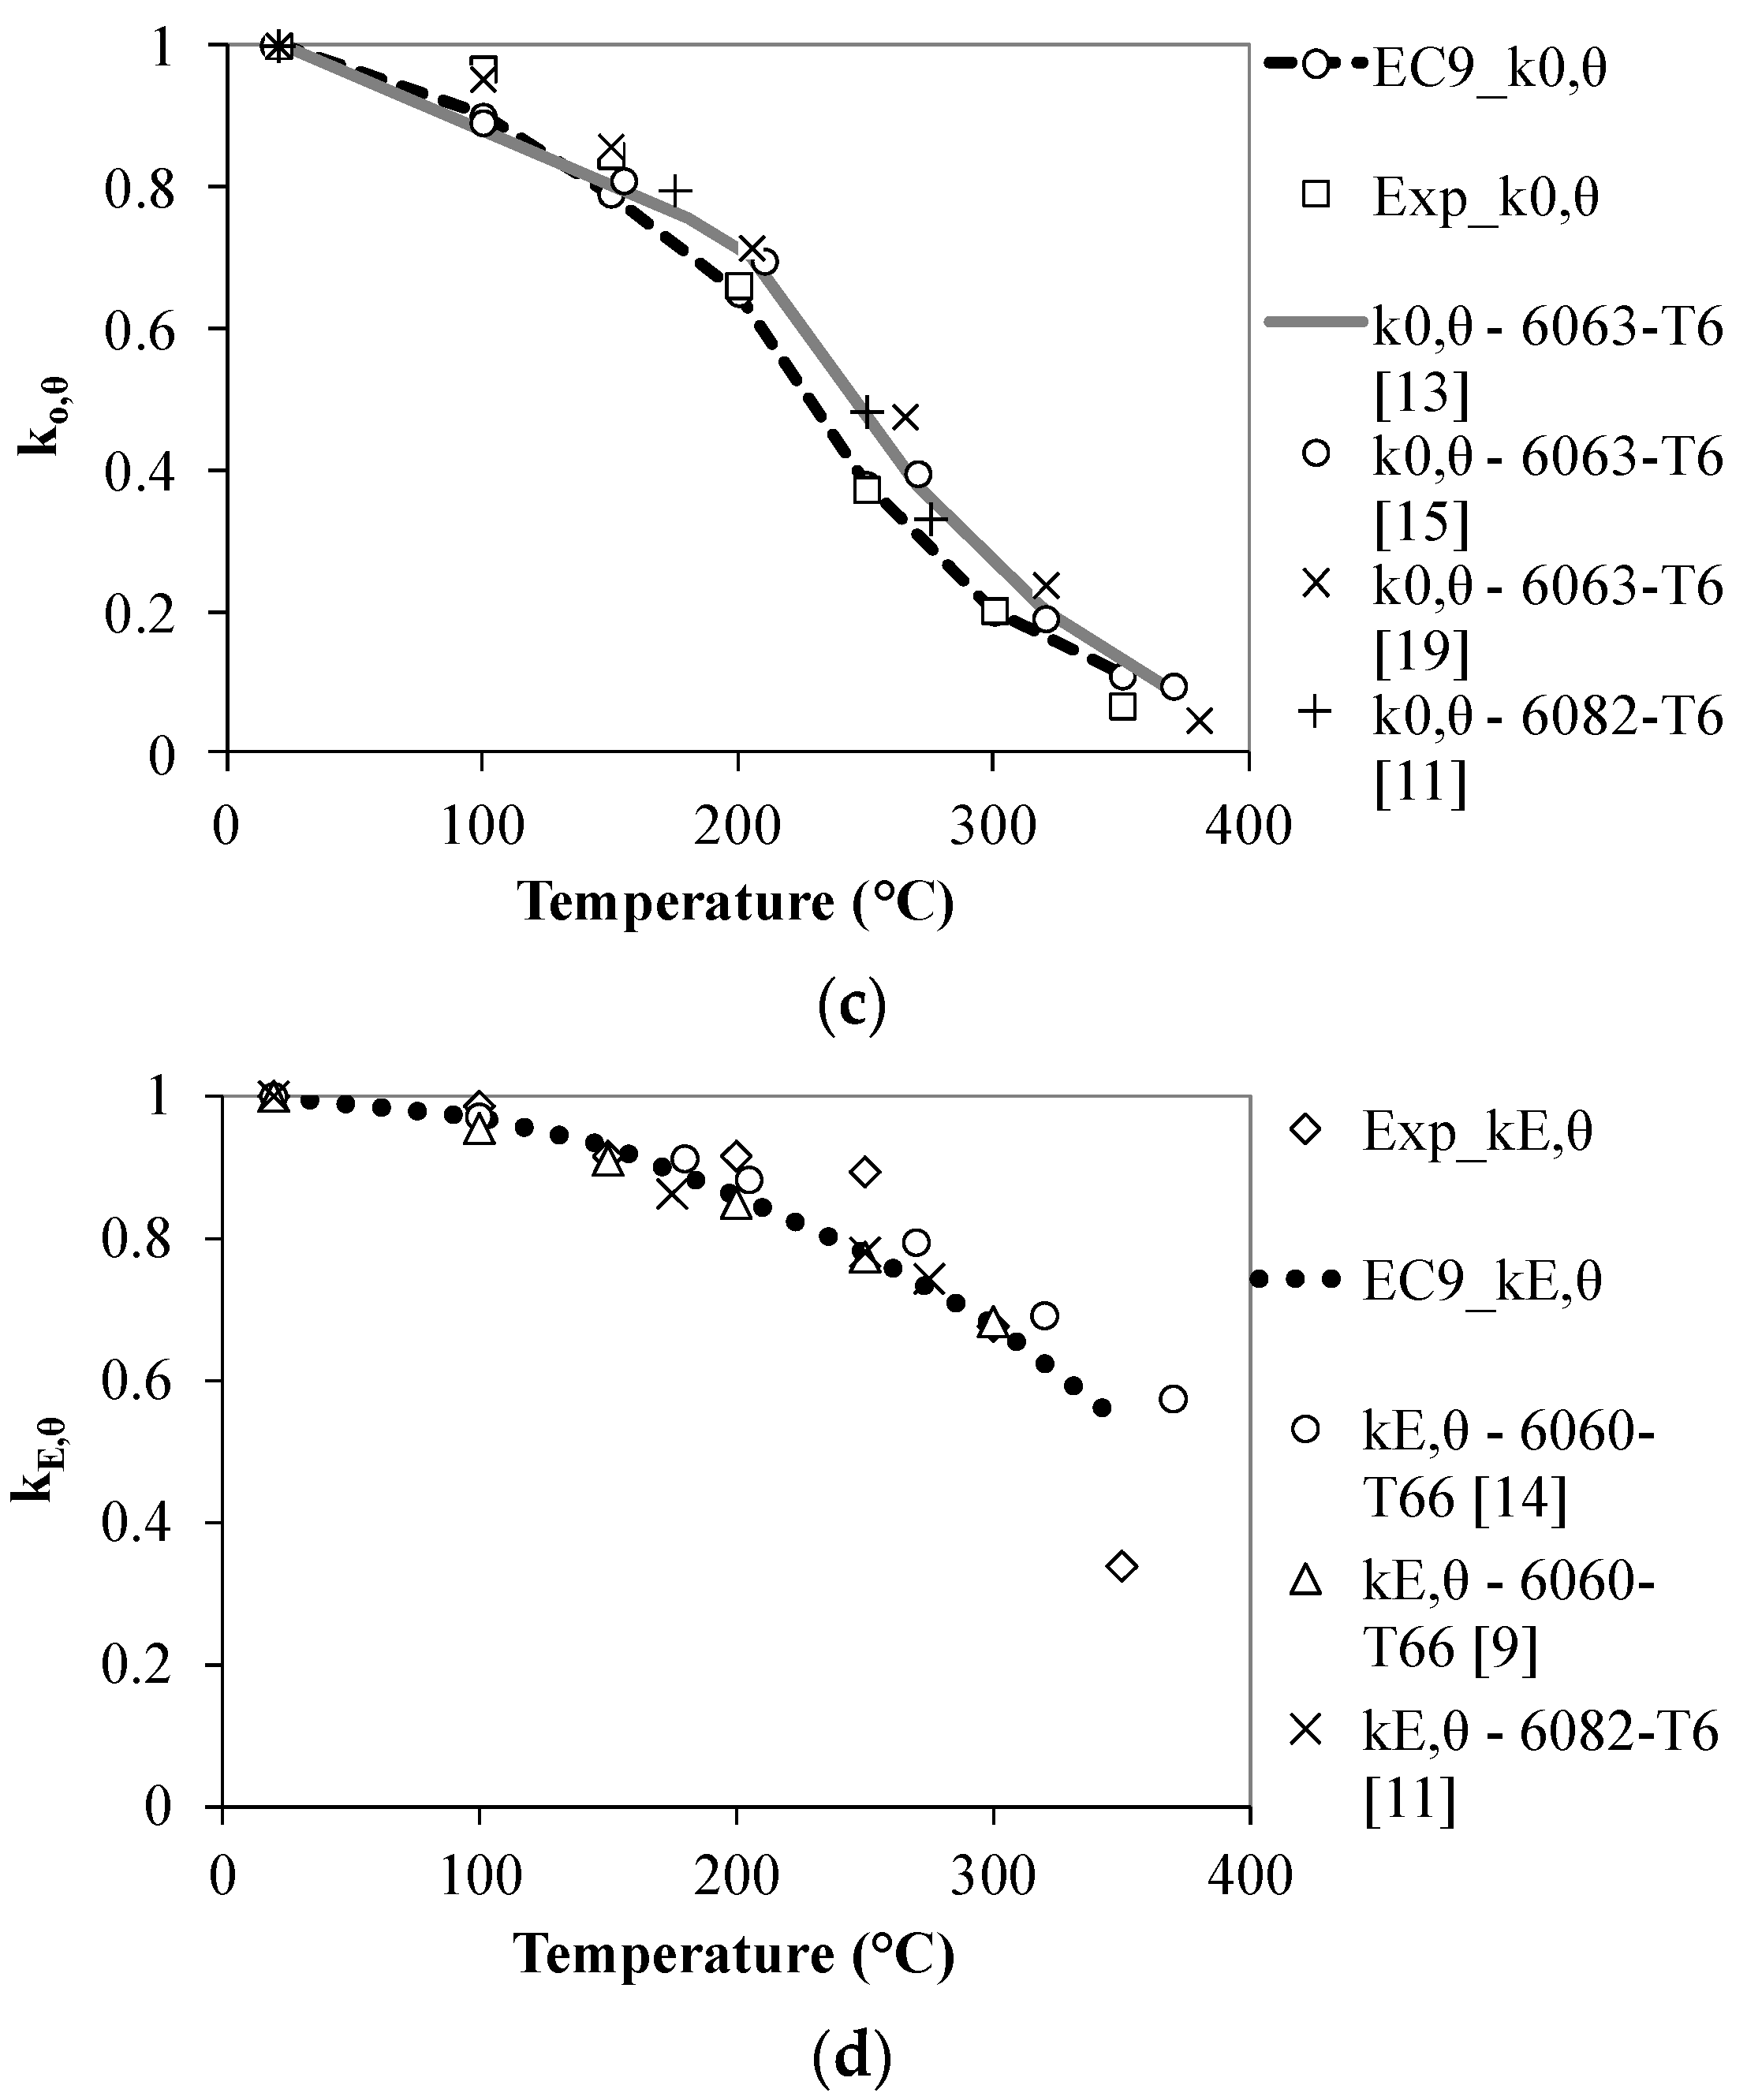
Figure 4.
Test results of stationary creep tests in the temperature range 150–300 °C; (a) Creep tests at 150 °C; (b) Creep tests at 200 °C; (c) Creep tests at 250 °C; (d) Creep tests at 300 °C.
Figure 4.
Test results of stationary creep tests in the temperature range 150–300 °C; (a) Creep tests at 150 °C; (b) Creep tests at 200 °C; (c) Creep tests at 250 °C; (d) Creep tests at 300 °C.
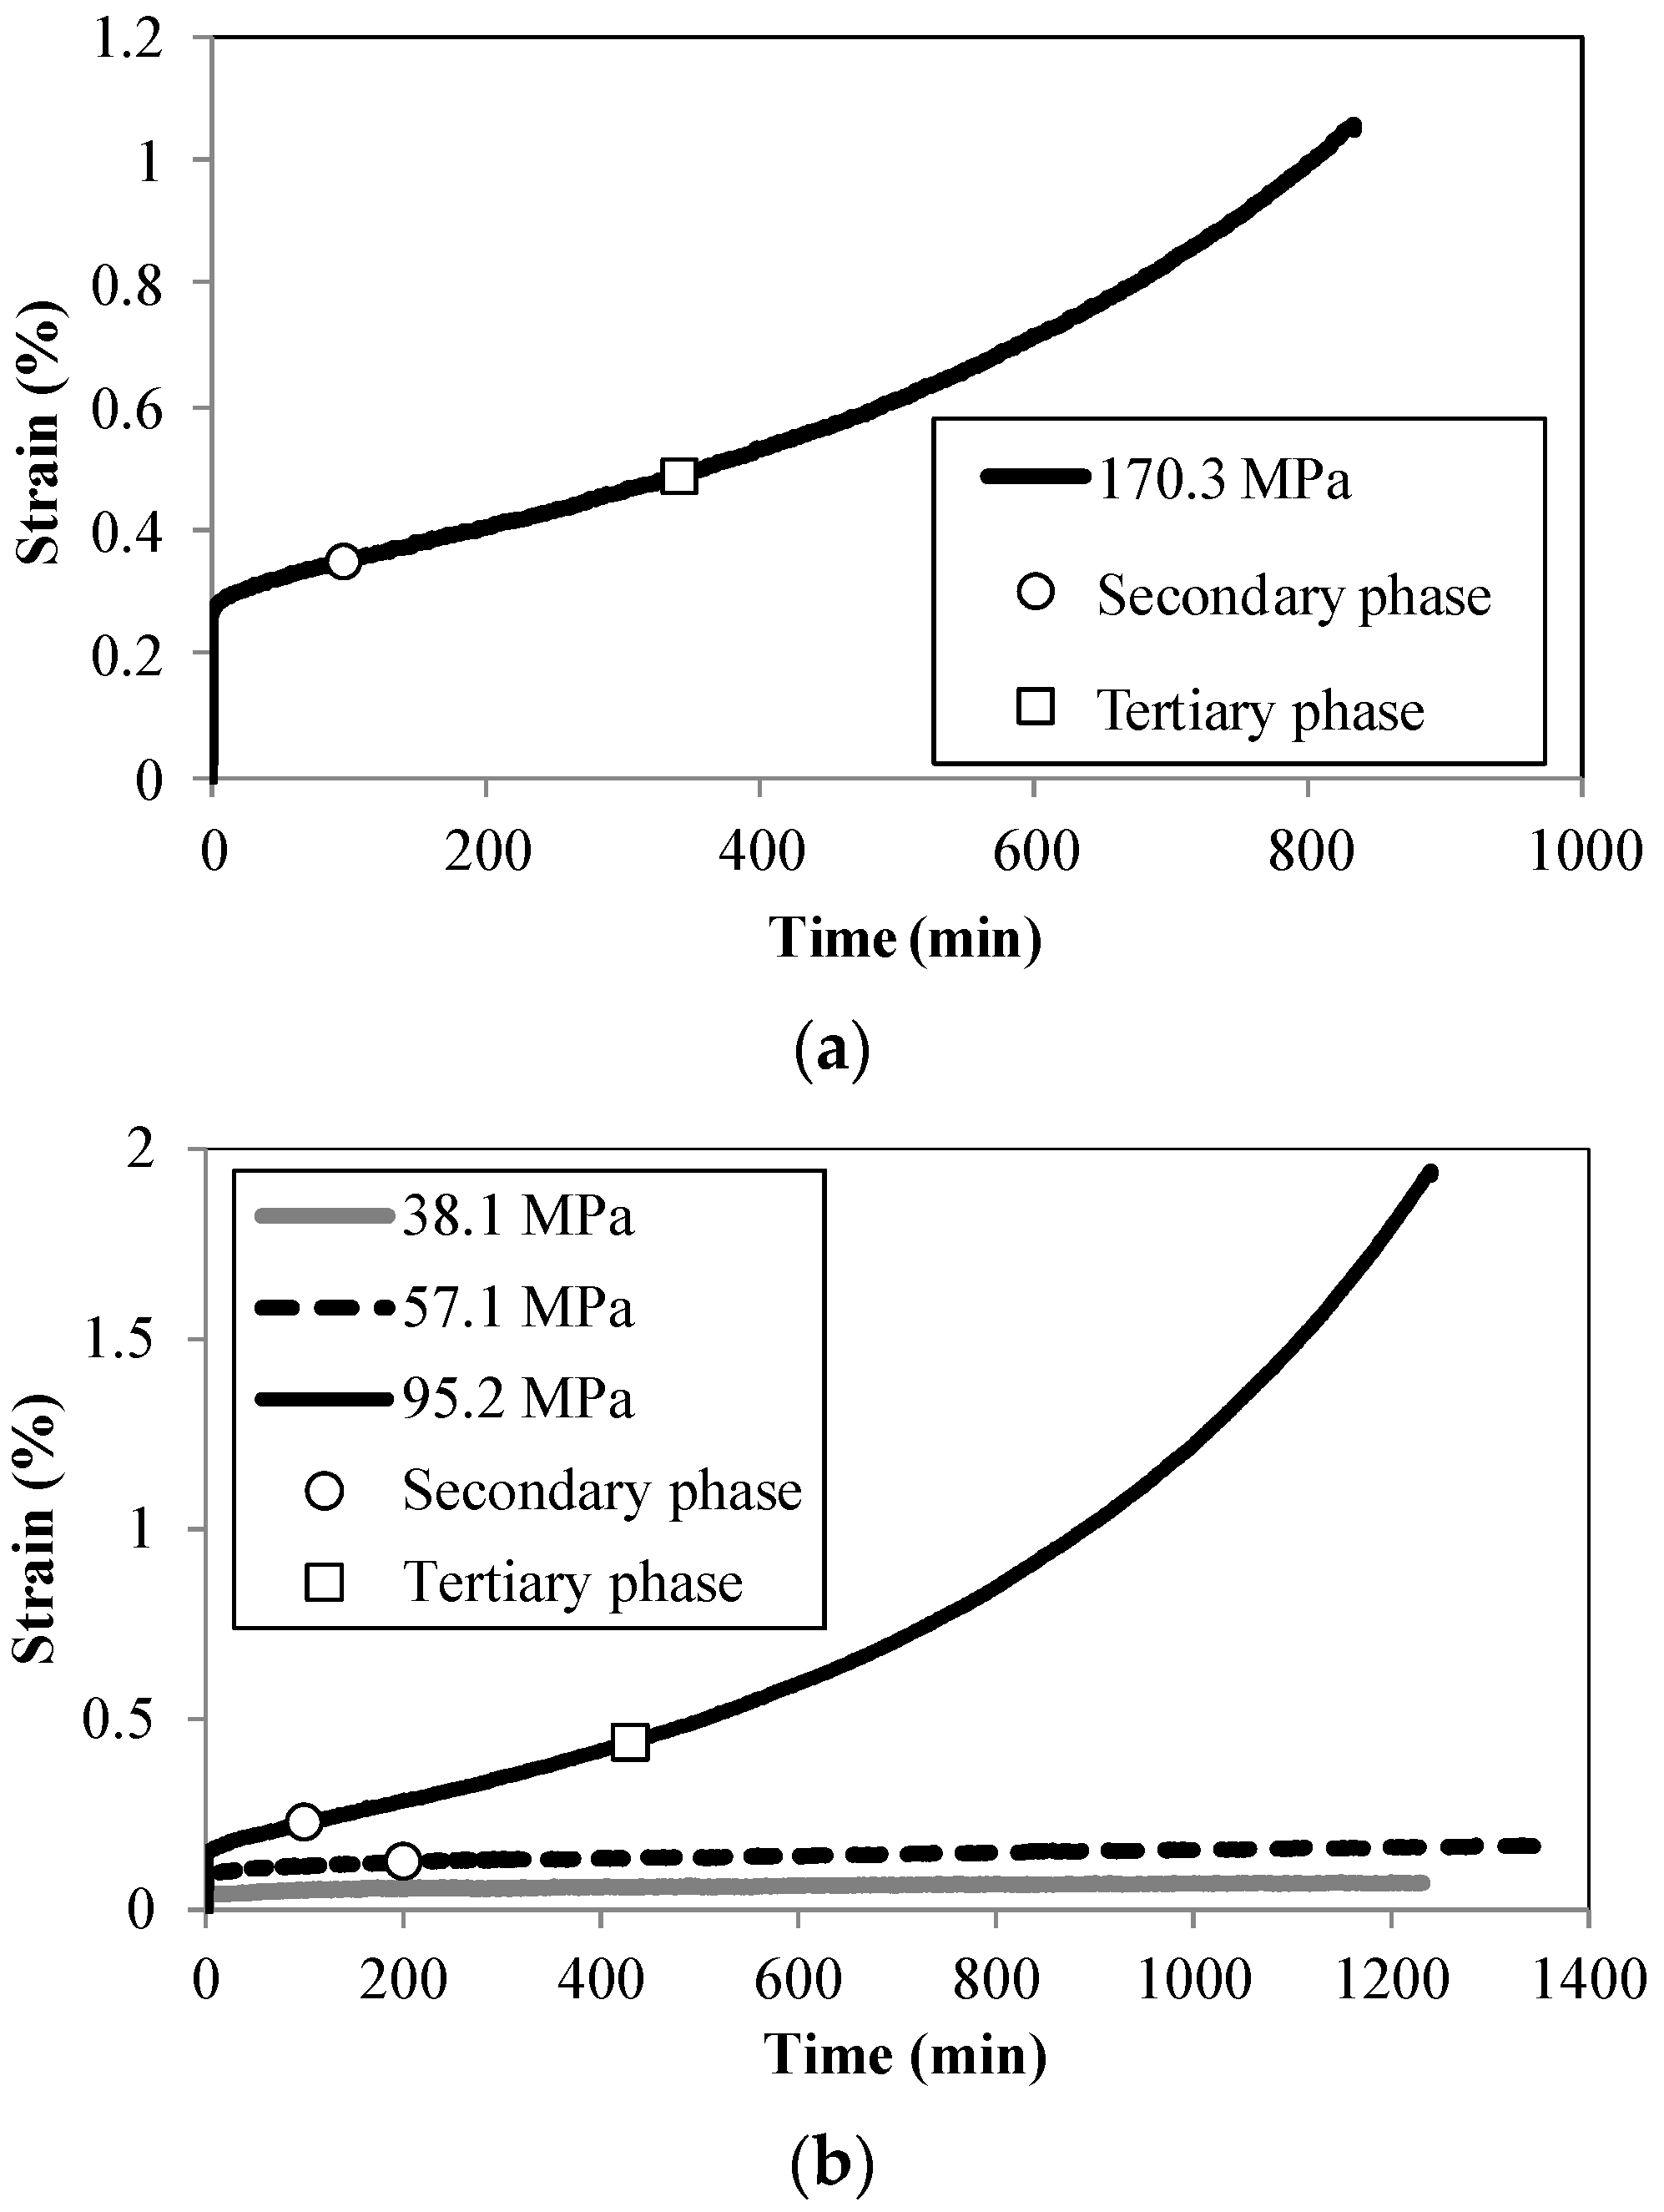

Figure 5.
Comparison between the proposed analytical model and experimental creep results at 200–300 °C; (a) Comparison between the analytical model and creep test results at 200 °C; (b) Comparison between the analytical model and the creep test results at 300 °C.
Figure 5.
Comparison between the proposed analytical model and experimental creep results at 200–300 °C; (a) Comparison between the analytical model and creep test results at 200 °C; (b) Comparison between the analytical model and the creep test results at 300 °C.

Figure 6.
Comparison between the creep test results and comparable creep models at 200–250 °C; (a) Comparison of different creep models at 200 °C; (b) Comparison of different creep models at 250 °C.
Figure 6.
Comparison between the creep test results and comparable creep models at 200–250 °C; (a) Comparison of different creep models at 200 °C; (b) Comparison of different creep models at 250 °C.


Figure 7.
Aluminium microstructure at 200× magnification (virgin specimen exposed to temperature of 300 °C).
Figure 7.
Aluminium microstructure at 200× magnification (virgin specimen exposed to temperature of 300 °C).


Table 1.
Summary of test results for constant stress-rate tests (engineering values).
| Temperature (°C) | Modulus of Elasticity Ey,θ (GPa) | Yield Strength f0.2,θ (MPa) | Ultimate Strength fu,θ (MPa) | εt (%) |
|---|---|---|---|---|
| 20 | 71.0 | 288.0 | 306.2 | 7.1 |
| 100 | 70.0 | 278.4 | 290.8 | 9.7 |
| 150 | 65.0 | 243.3 | 246.9 | 12.3 |
| 200 | 65.0 | 190.4 | 191.3 | 3.1 |
| 250 | 63.4 | 107.5 | 109.4 | 2.8 |
| 300 | 48.0 | 58.2 | 59.4 | 1.7 |
| 350 | 24.0 | 19.5 | 20.7 | 19.3 |
Table 2.
Summary of test results for stationary creep tests.
| Temperature (°C) | Stationary Creep Test Parameters | |||
|---|---|---|---|---|
| Stress σ (MPa) | σ/f0.2,θ | Time of the Occurrence of Secondary Phase (min) | Time of the Occurrence of Tertiary Phase (min) | |
| 150 | 170.3 | 0.7 | 95 | 340 |
| 200 | 38.10 57.10 95.20 | 0.20 0.30 0.50 | - 200 100 | - - 430 |
| 250 | 16.13 32.25 53.76 | 0.15 0.30 0.50 | - 100 15 | - 480 80 |
| 300 | 8.73 17.46 29.10 | 0.15 0.30 0.50 | - 12 1.4 | - 45 6.4 |
Table 3.
Comparison between the test results of mechanical properties with Eurocode 9.
| Temperature (°C) | Reduction Factors | |||
|---|---|---|---|---|
| Exp f0.2,θ/f0.2 | EC9 [3] f0.2,θ/f0.2 | Exp Ey,θ/Ey,20 | EC9 [3] Ey,θ/Ey,20 | |
| 100 | 0.97 | 0.90 | 0.99 | 0.97 |
| 150 | 0.84 | 0.79 | 0.92 | 0.93 |
| 200 | 0.66 | 0.65 | 0.92 | 0.86 |
| 250 | 0.37 | 0.38 | 0.89 | 0.78 |
| 300 | 0.20 | 0.20 | 0.68 | 0.68 |
| 350 | 0.07 | 0.11 | 0.34 | 0.54 |
Table 4.
Values for parameter n in the analytical stress-strain model.
| Temperature (°C) | n |
|---|---|
| 20 | 49 |
| 100 | 69 |
| 150 | 179 |
| 200 | 144 |
| 250 | 93 |
| 300 | 43 |
| 350 | 26 |
Table 5.
Parameters for the developed analytical creep model.
| Temperature (°C) | Coefficient | Stress Level (MPa) | ||
|---|---|---|---|---|
| 38.10 (0.20f0.2,θ) | 57.10 (0.30f0.2,θ) | 95.20 (0.50f0.2,θ) | ||
| 200 | a | 3.378 × 10⁻⁴ | 5.133 × 10⁻³ | 8.619 × 10⁻³ |
| b | 0.5200 | 0.3729 | 0.5115 | |
| c | 0.0586 | 0.0879 | 0.1465 | |
| e | - | 6.650 × 10⁻¹⁰ | 1.000 × 10⁻⁸ | |
| f | - | 2.1770 | 2.6270 | |
| 16.13 (0.15f0.2,θ) | 32.25 (0.30f0.2,θ) | 53.76 (0.50f0.2,θ) | ||
| 250 | a | 2.187 × 10⁻⁴ | 1.742 × 10⁻³ | 5.641 × 10⁻⁴ |
| b | 0.7468 | 0.7377 | 1.1460 | |
| c | 2.544 × 10⁻² | 5.087 × 10⁻² | 0.0848 | |
| e | - | 5.523 × 10⁻¹⁰ | 7.583 × 10⁻⁸ | |
| f | - | 2.9500 | 2.8270 | |
| 8.73 (0.15f0.2,θ) | 17.46 (0.30f0.2,θ) | 29.10 (0.50f0.2,θ) | ||
| 300 | a | 2.513 × 10⁻³ | 0.0183 | 0.1697 |
| b | 0.6470 | 0.8291 | 0.9000 | |
| c | 0.0182 | 0.0364 | 0.0606 | |
| e | - | 1.633 × 10⁻⁵ | 5.861 × 10⁻⁵ | |
| f | - | 2.3690 | 3.1200 | |
Table 6.
Chemical composition of the studied alloy.
| Study | Al | Cu | Si | Fe | Mn | Mg | Zn2 | Cr | Ca | Pb | Ti2 | Sn2 |
|---|---|---|---|---|---|---|---|---|---|---|---|---|
| 6082-T6–Exp | 96.49 | 0.099 | 1.281 | 0.708 | 0.523 | 0.767 | 0.0615 | 0.0141 | 0.0011 | 0.0034 | 0.0108 | 0.0173 |
© 2017 by the authors. Licensee MDPI, Basel, Switzerland. This article is an open access article distributed under the terms and conditions of the Creative Commons Attribution (CC BY) license (http://creativecommons.org/licenses/by/4.0/).
Share and Cite
MDPI and ACS Style
Torić, N.; Brnić, J.; Boko, I.; Brčić, M.; Burgess, I.W.; Uzelac, I. Experimental Analysis of the Behaviour of Aluminium Alloy EN 6082AW T6 at High Temperature. Metals 2017, 7, 126. https://doi.org/10.3390/met7040126
AMA Style
Torić N, Brnić J, Boko I, Brčić M, Burgess IW, Uzelac I. Experimental Analysis of the Behaviour of Aluminium Alloy EN 6082AW T6 at High Temperature. Metals. 2017; 7(4):126. https://doi.org/10.3390/met7040126
Chicago/Turabian StyleTorić, Neno, Josip Brnić, Ivica Boko, Marino Brčić, Ian W. Burgess, and Ivana Uzelac. 2017. "Experimental Analysis of the Behaviour of Aluminium Alloy EN 6082AW T6 at High Temperature" Metals 7, no. 4: 126. https://doi.org/10.3390/met7040126
Note that from the first issue of 2016, this journal uses article numbers instead of page numbers. See further details here.