
Discrete Element Method Investigation of Bulk Density and Electrical Resistivity of Calcined Coke Mixes
by
Behzad Majidi
1,2, 
Geoffroy Rouget
1,2,
Mario Fafard
2,
Donald Ziegler
3 and
Houshang Alamdari
1,2,* 1
Department of Mining, Metallurgical and Materials Engineering, Laval University, Quebec, QC G1V 0A6, Canada
2
NSERC/Alcoa Industrial Research Chair MACE and Aluminum Research Center, Laval University, Quebec, QC G1V 0A6, Canada
3
Alcoa Primary Metals, Alcoa Technical Center, 859 White Cloud Road, New Kensington, PA 15068, USA
*
Author to whom correspondence should be addressed.
Metals 2017, 7(5), 154; https://doi.org/10.3390/met7050154
Submission received: 17 January 2017
/
Revised: 21 April 2017
/
Accepted: 24 April 2017
/
Published: 26 April 2017
(This article belongs to the Special Issue Selected Papers from the International Committee for Study of Bauxite, Alumina & Aluminium 2016)
Abstract
:Packing density and electrical resistivity of particles assemblies are important factors for a variety of applications of granular materials. In the present work, a three-dimensional imaging technique is coupled with the discrete element method (DEM) to model anode grade calcined coke particles. Three-dimensional DEM models of samples with different size distribution of particles were studied to obtain the inter-particle contact information. As the content of fine particles increased, a higher inter-particle contact density and smaller average contact radius was observed in the samples. Confronting the DEM data and experimental measurements of electrical resistivity showed the simultaneous effects of packing density and contact density. Samples with higher contact density and smaller contact radius in general held high electrical resistivities. However, if increasing the contact density does not modify contacts between large particles, this will have a positive effect on packing density, so a lower electrical resistivity was obtained.
1. Introduction
Particle packing is an old problem [1] that exists in different applications and industries such as construction, pharmaceuticals, food processing, and agriculture [2]. Packing problems become even more complex when dealing with irregular shape particles. Electrical current transfer in granular media has also considerable importance in a variety of applications such as electronics, metallurgical processes, railway transportation, and geology [3].
Packing density and electrical resistivity of particles are both of interest for aluminum production. Pre-baked carbon anodes for the aluminum smelting process are made with granulated calcined coke mixed with a binder pitch. Coke particles make up around 65 wt. % of an anode, so the physical, chemical, and mechanical properties of coke have a considerable impact on the quality of carbon anodes. The effects of the bulk density of coke aggregates on the air permeability of baked anodes [4] and the shape of coke particles on the compaction behavior of green anode paste [5] have already been investigated and evaluated. Homogeneity, high density, low air permeability, and low electrical resistivity are important quality factors that anodes are expected to hold.
An industrial dry mix recipe of the anode paste is given in Table 1. The coke particles make up the skeleton for the anode, and the pitch binds the particles together and provides the integrity of the mixture. A part of the binder pitch is vaporized during the baking process, creating pores and shrinkage cracks. Furthermore, a binder matrix (pitch + fine coke particles) is the most reactive part of a baked anode to air and CO2 attacks [6,7]. Therefore, a lower pitch content is favorable for chemical reactivity and thus the service life of anodes.
However, underpitched anodes, on the other hand, have low apparent density and poor mechanical properties [8]. Therefore, if the coke aggregate recipe can be modified to have a higher amount of coarse particles without compromising the density, the pitch demand for this recipe could be reduced, resulting in positive effects on the final properties of the anodes.
The discrete element method (DEM) has a proven capability [9,10,11,12] of investigating the packing behavior of irregular-shape particles. For example, in [9], the authors have reported the performance of DEM simulations in predicting the vibrated bulk density of coke aggregates.
In 2015, the authors used DEM with a technique so-called void tracking [12] to study and modify the industrial recipe for aggregates in anode paste.
In the present work, void tracking was engaged to study the dry aggregate recipe used in aluminum industry to make anodes, and the modified recipe was investigated for its density and electrical resistivity. Then, the DEM was used to understand the variations in electrical resistivity for different samples.
2. Numerical Model
In the DEM, the complex behavior of a material is simulated by assigning an appropriate force-displacement law to the contacts between the discrete elements of the model. Newton’s law of motion is then applied to all elements to determine the acceleration and thus the new position of the elements at the next time-step. This concept is shown in Figure 1.
Simple elastic contact is a common model in DEM simulations to define force-displacement behavior of elastic materials. This model is equivalent to mechanical springs in normal and shear directions. Stiffness of the springs is a consequence of the material’s properties and is related to the elastic modulus. Details of this model can be found in [13].
Coke particles have irregular shapes, but the basic elements of the DEM are spheres in 3D. Thus, rigid clusters of overlapping spheres are used to model the real shape of coke aggregates. The sliding motion between the clusters is characterized by an inter-particle friction coefficient, which was determined using the angle of repose of a pile of powder with a given particle size. Details of this method have been described in [9].
3. Experimental Procedure
The method proposed in [14] was adapted to measure the apparent density of coke particles in the size fractions present in the industrial dry mix recipe (Table 1). Table 2 shows the apparent density for each size fraction, obtained experimentally.
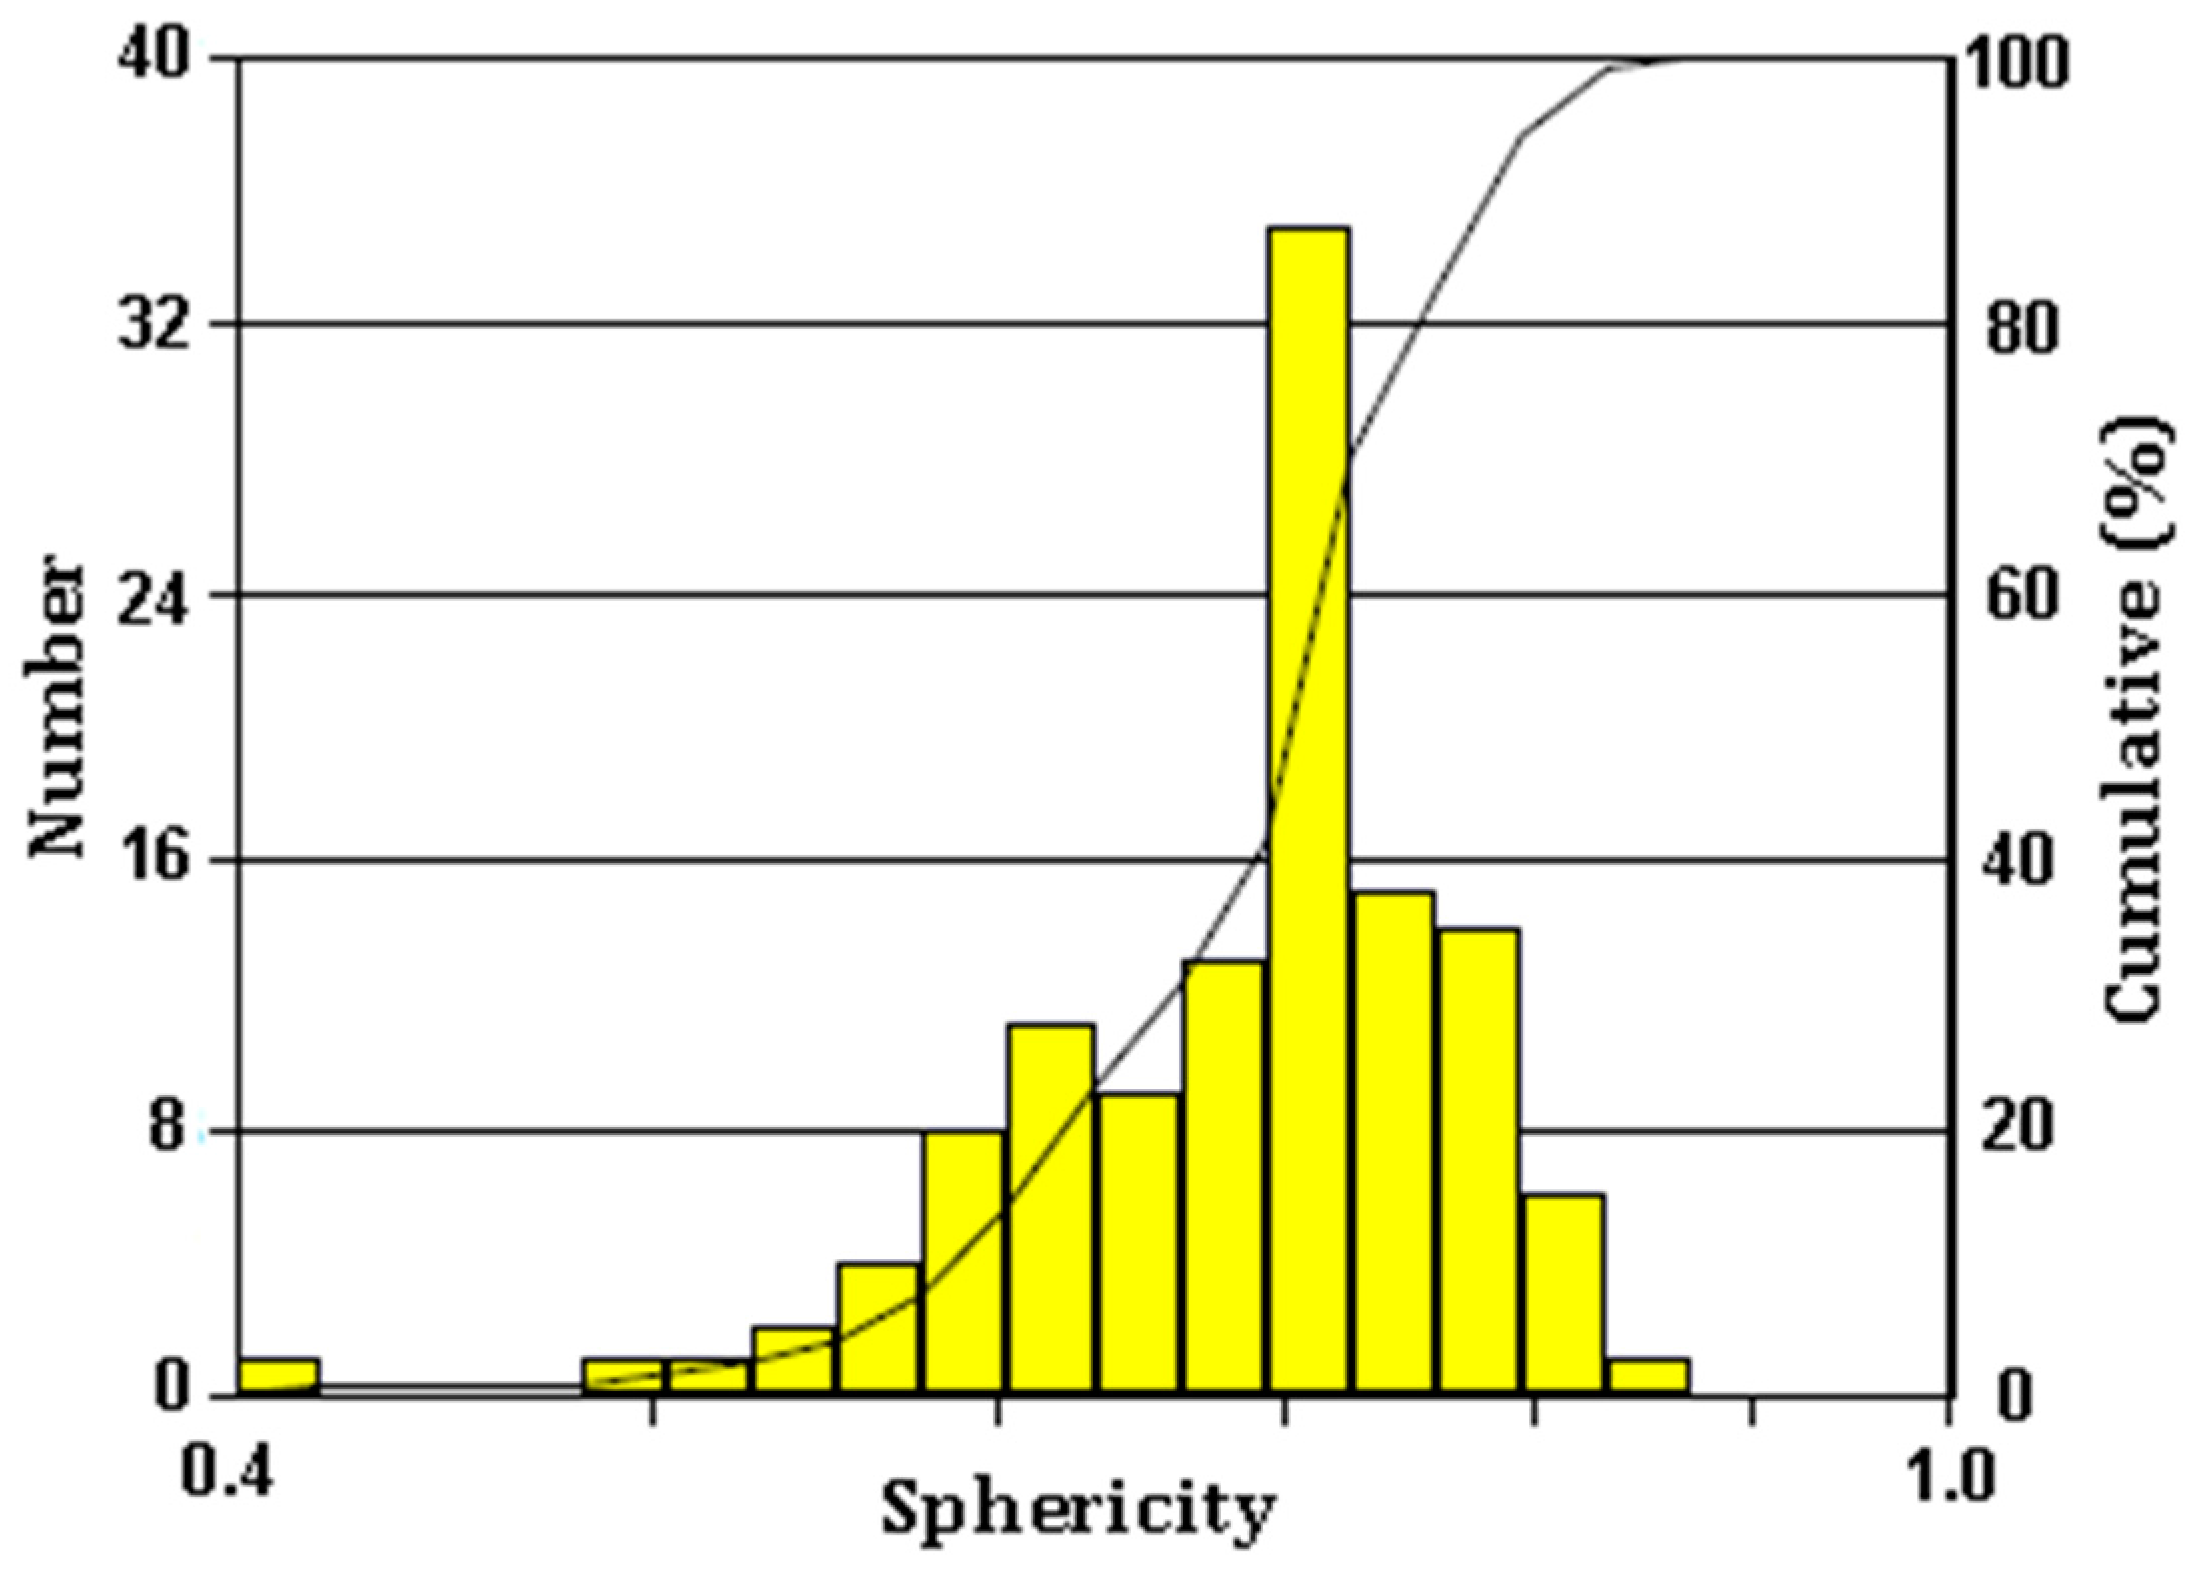
Shape parameters such as sphericity and size distribution for each size fraction of particles were obtained by means of an optical microscope integrated with Clemex software (Longueuil, QC, Canada). Sphericity of the particles of each size fraction was also analyzed by means of image analysis. As an instance, the distribution of sphericity for the particles of a −4+8 mesh has been shown in Figure 2. All of these variables were considered in creating numerical models.
Cogency Co.’s 3D micro-particle imaging system (Salt River, South Africa) was then used to obtain the three-dimensional shape of the particles. Automatic Sphere-Clump Generator (ASG) software, developed by Cogency Co. (Salt River, South Africa), was then used to model the particles by overlapping spheres. The various individual particle models obtained in this way were then mixed and in some cases resized to have numerical particles of each of the size ranges in Table 2, thus matching the size distribution of the real particles. Average sphericity was also monitored and matched the experimental value.
Packing density of coke samples was studied by means of a vibrated bulk density (VBD) test. In the VBD test, the occupied volume of a mass of 100 g of particles vibrated in a 250 mL graduated cylinder is measured to obtain the vibrated packing density. Frequency and amplitude of vibration are, respectively, 60 Hz and 0.2 mm for a duration of 2 min.
4. Results and Discussion
The verification of the DEM models of the coke particles and the simulation of the packing density of the coke mixtures have been already presented in the author’s article in 2014 [9]. The void tracking technique and its results have also already been presented in the authors’ previous work [12]. The present work takes the advantage of those results to study and provide in in-depth understanding of electrical current transfer in the beds of coke particles. Therefore, the main findings of void tracking and the proposed recipes are repeated here in Section 4.1 to help readers in following the main message of the article.
4.1. Vibrated Bulk Density
In the DEM simulations, a simple elastic model was used as the contact model. A calibration work as described in [9] was used to estimate the normal and shear stiffness of the contacts. In this work, Kn = Ks = 10,000 N/m and the fiction coefficient of 0.27 were used as inputs.
A numerical sample composed of only the largest size fraction of particles (2.38–4.76 mm) was created. The bulk density of this sample was 0.786 g/cm3, thus with 42.9% inter-particle porosity. This is henceforth called a skeleton sample, as it is believed that it makes the backbone of the particle bed of all fractions.
Void tracking was performed on this numerical sample to obtain its void size distribution. The details of void size measurement have been given in [12]. The results of the void tracking are presented in Table 3, which shows the mass of the spheres of different sizes, which can fill the voids of the skeleton sample. It can be seen that, in the skeleton sample, there are voids for only 0.078 g of the spheres belonging to the −8+14 mesh range, representing less than 1% of the entire recipe. However, as given in Table 1, the reference sample has 15.3 wt. % of particles in this size range.
Based on the void tracking results, new recipes of coke aggregates were defined as shown in Table 4. These recipes were defined with the aim of increasing the large fraction of particles at the expense of the smaller ones, without compromising the packing density. This, as mentioned above, is expected to have positive effects on the final properties of the baked anodes.
VBD tests were conducted on the samples. As given in Table 4, due to the absence of fine particles, the skeleton sample (S5) has an expected low VBD of 0.786 g/cm3. The standard recipe sample, however, has a quite high density of 0.955 g/cm3. In S1, the entire −8+14 mesh fraction has been removed and the content of large particles has been almost doubled. This change has resulted in a gain in VBD, which experimentally confirms the results of void tracking on the negative effect of the −8+14 fraction on the packing density.
4.2. Electrical Resistivity
The electrical resistivity of the coke aggregate mixes was investigated in the second step of the work. Electrical resistivity of the particle bed was measured using a four-point probe set up in which the electrical current is provided by a Laboratory DC Power Supply GW GPR-1810HD. The current was injected through the aluminum plungers, and voltage was measured using two gold-plated electrodes, insulated from the plungers. An external load is applied to the top of the sample, creating an applied stress of 3 MPa.
A standard industrial aggregate mix has an electrical resistivity of 350 μΩ·m. As presented in Figure 3, all other samples have electrical resistivities that are lower than the standard sample. The sample with the lowest electrical resistivity is S3 with 301.8 μΩ·m. This represents a 13.8% reduction in electrical resistivity. Eidem et al. [15] have already shown that, in mono-size mixes, as the size of particles increases, the bulk electrical resistivity decreases. It is believed that the electrical resistance of a bed of particles is the sum of the resistance of the material and the resistance of contacts. Thus, when the particles are coarse, the number of contacts as well as the resistance of each contact is much lower compared to a bed of fine particles. However, the case of particle assemblies with irregular shapes and multi-size fractions is complicated. The DEM is used in this work as a powerful tool to evaluate the contact information in different samples and to reveal its effects on the electrical resistivity of the particle bed. It is, however, worth emphasizing that particle–particle contacts in DEM models are influenced by size distribution and the shape of particles, the mechanical properties used in the models, the number of spherical elements used to model each particle, and finally the precision of the imaging technique. The contact information of real-world particles cannot be measured. Thus, inter-particle contact data presented here, which comes from numerical models, cannot be verified directly. However, all efforts have been attempted to obtain the best particle modeling and thus the most realistic contacts.
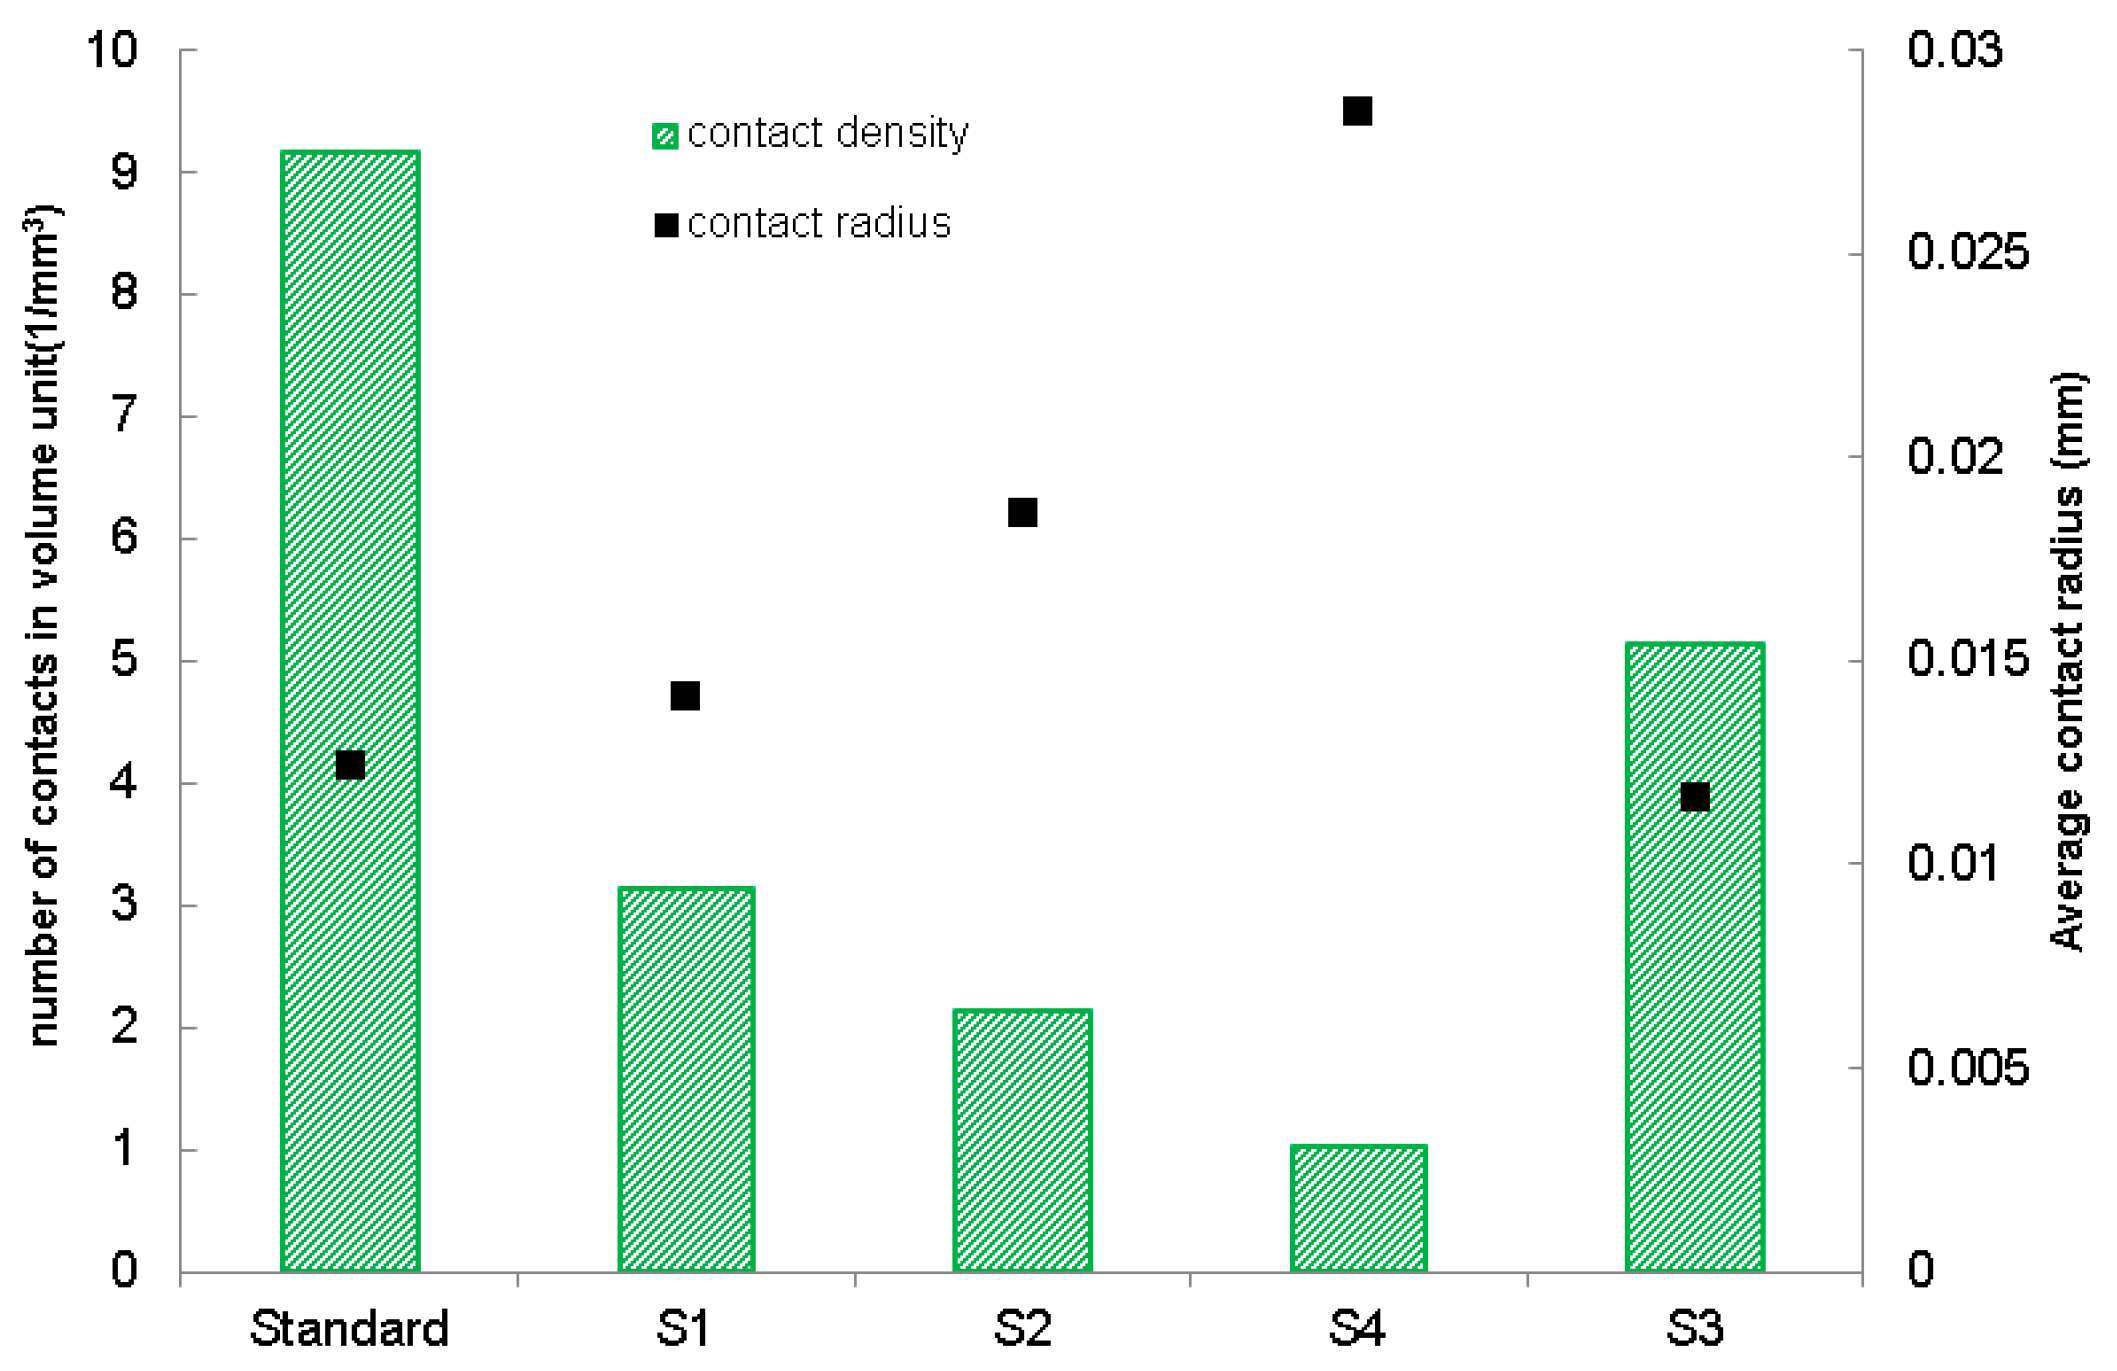
In Figure 4, the average contact radius and the number of contacts in the volume unit (mm3) of aggregate mixes are compared. As the content of coarse particles (the −4+8 mesh) in the standard sample is 33.6% and, in all other samples, 60% or more, there is a remarkable distinction between the standard sample and the modified ones. The standard sample has a very high contact density of 9.16 mm−3.
If only Samples S1, S2, and S4 and the standard are considered, there is a clear relation between electrical resistivity, contact density, and average contact radius. The high density of contacts is associated with a small contact radius and a high electrical resistivity. Comparing these four samples can lead us to the conclusion that, using the void tracking technique, a better compaction of coke aggregates can be obtained in which the percentage of coarse particles is almost twice the standard recipe. The recipe modification also alters the inter-particle contacts and with almost the same bulk density, and a packing with far fewer particle interfaces is realized. Reducing the particle interfaces without a compromise in the bulk density has a positive effect on electrical conductivity (by reducing the resistivity as shown in Figure 3).
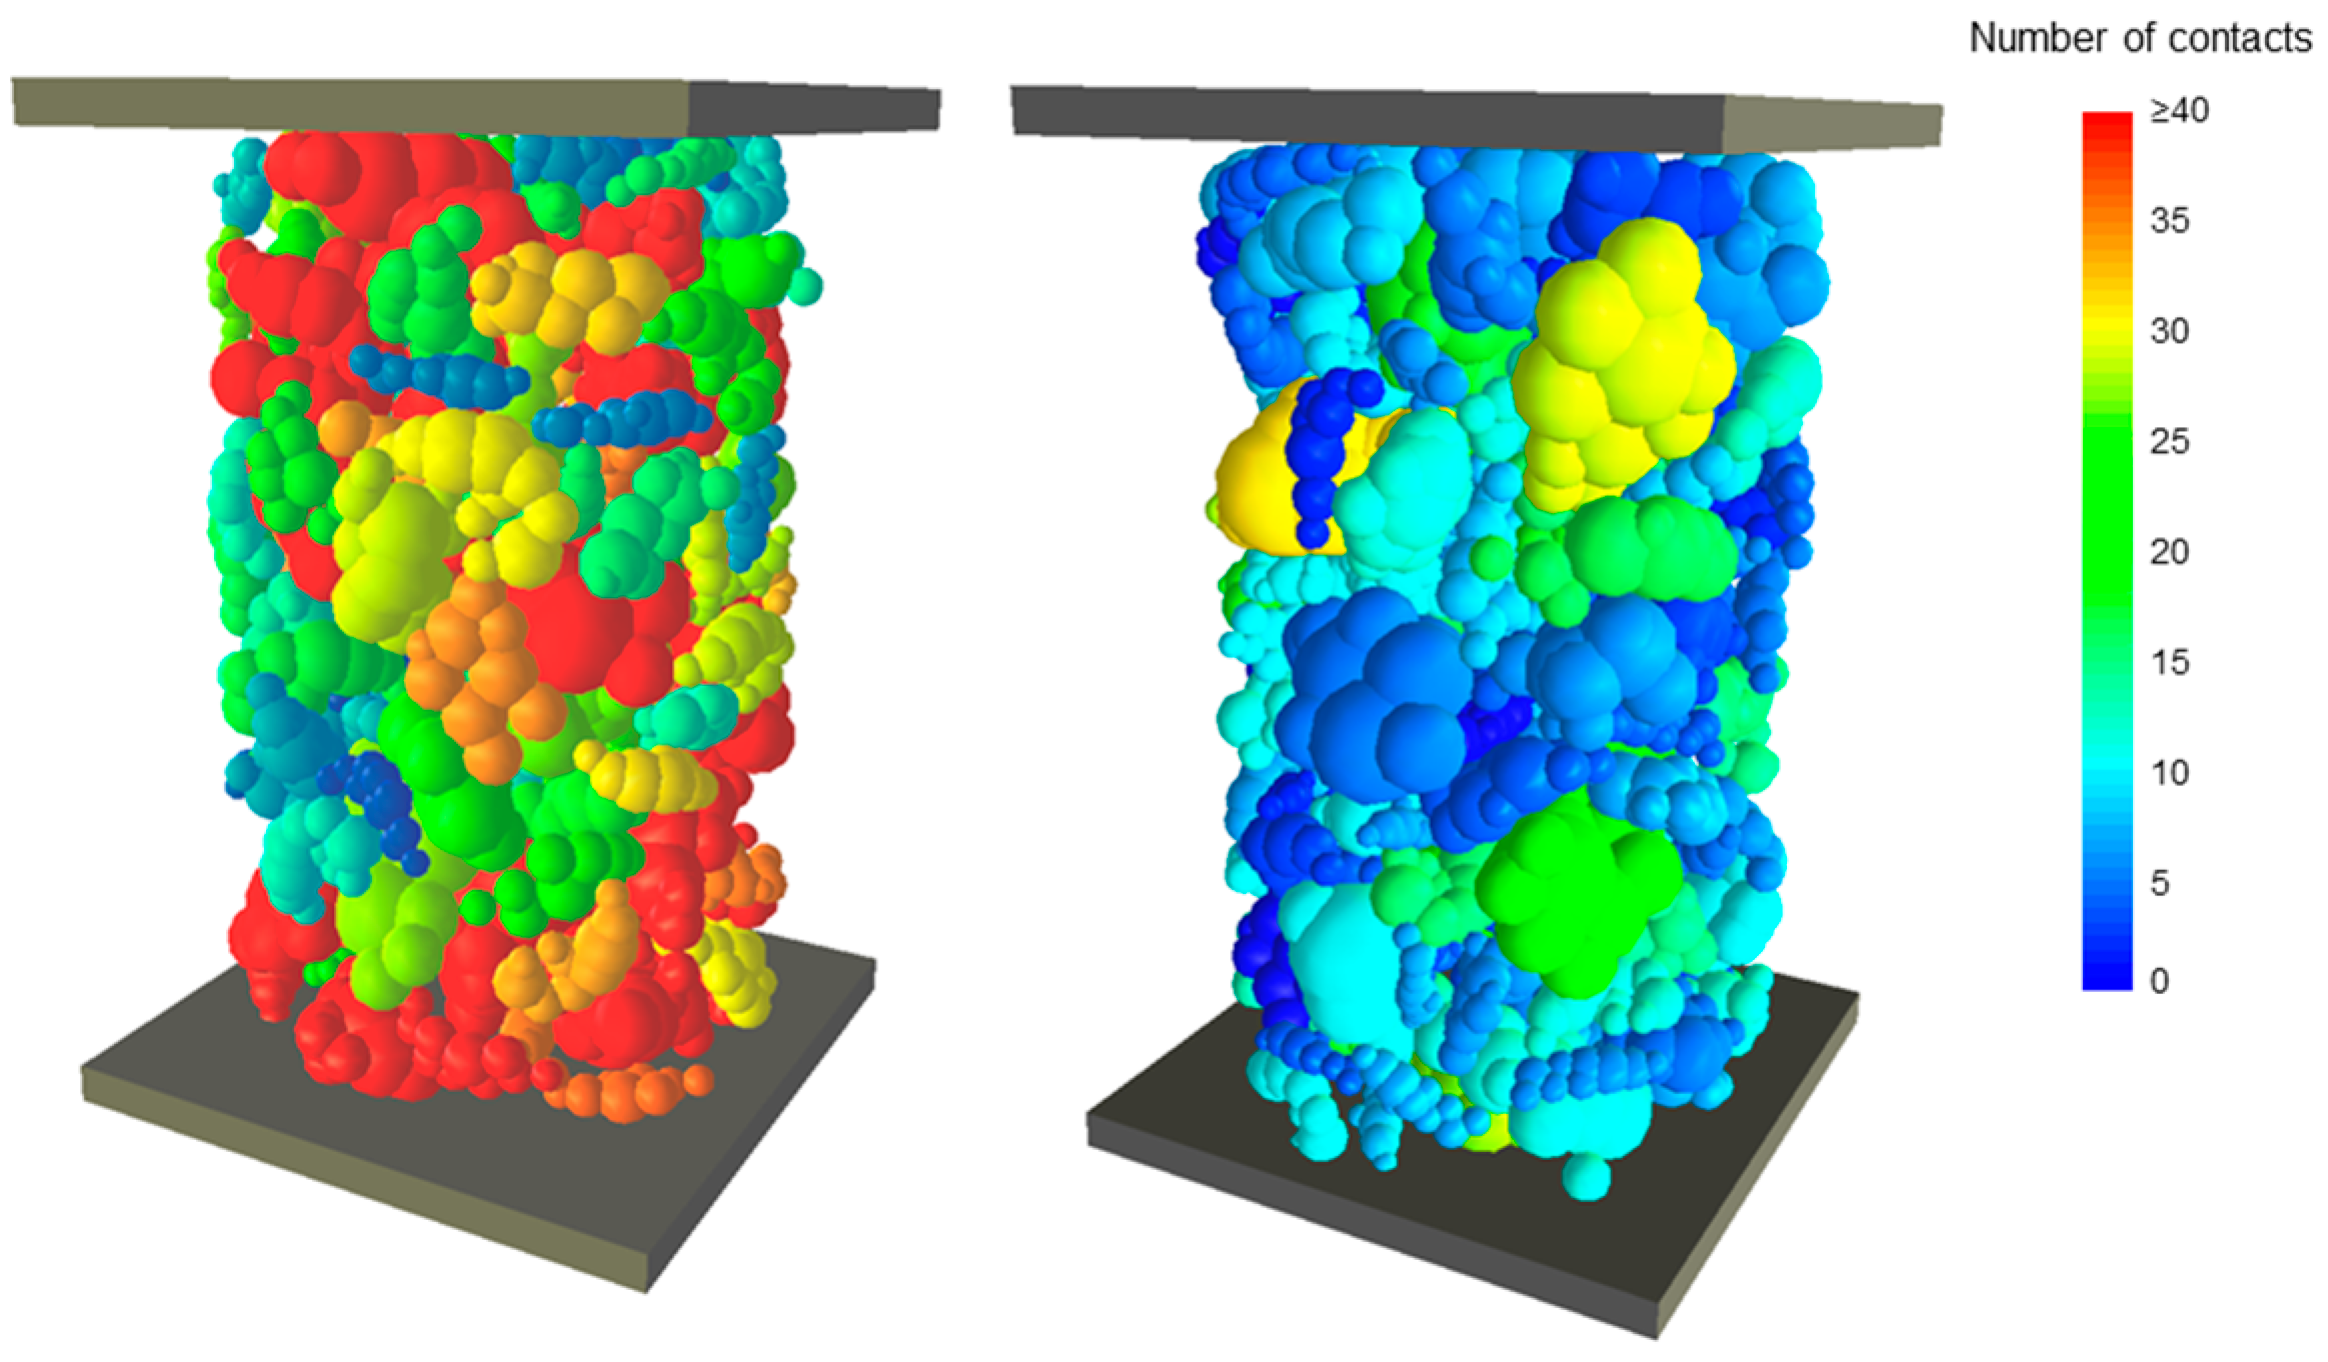
The observed difference between the electrical resistivity of S3 and S4, however, does not follow the same logic of other samples. The content of fine (−50+100 mesh) particles in S3 is three times greater than S4. This results in, as expected, a higher contact density as shown in Figure 4. Similar to the other samples, this means a smaller average contact radius. These all are supposed to contribute to an increase in the electrical resistivity. However, S3 has the lowest electrical resistivity among the samples. To explain this, the DEM models of S3 and S4 are exploited to attain information that cannot experimentally be measured. Figure 5 shows the contact information of coarse (−4+8 mesh) particles with only fine (−50+100) particles. Non-coarse particles have been omitted from view for a clearer illustration. The percentage of fine particles in S3 is three times of that of S4. Thus, as expected, the number of coarse–fine contacts in S3 (Figure 5; left) is greater than S4 (Figure 5; right). The number of coarse particles with more than 40 contacts with fines in S3 is clearly higher. This explains the higher contact density in S3 as shown in Figure 4.
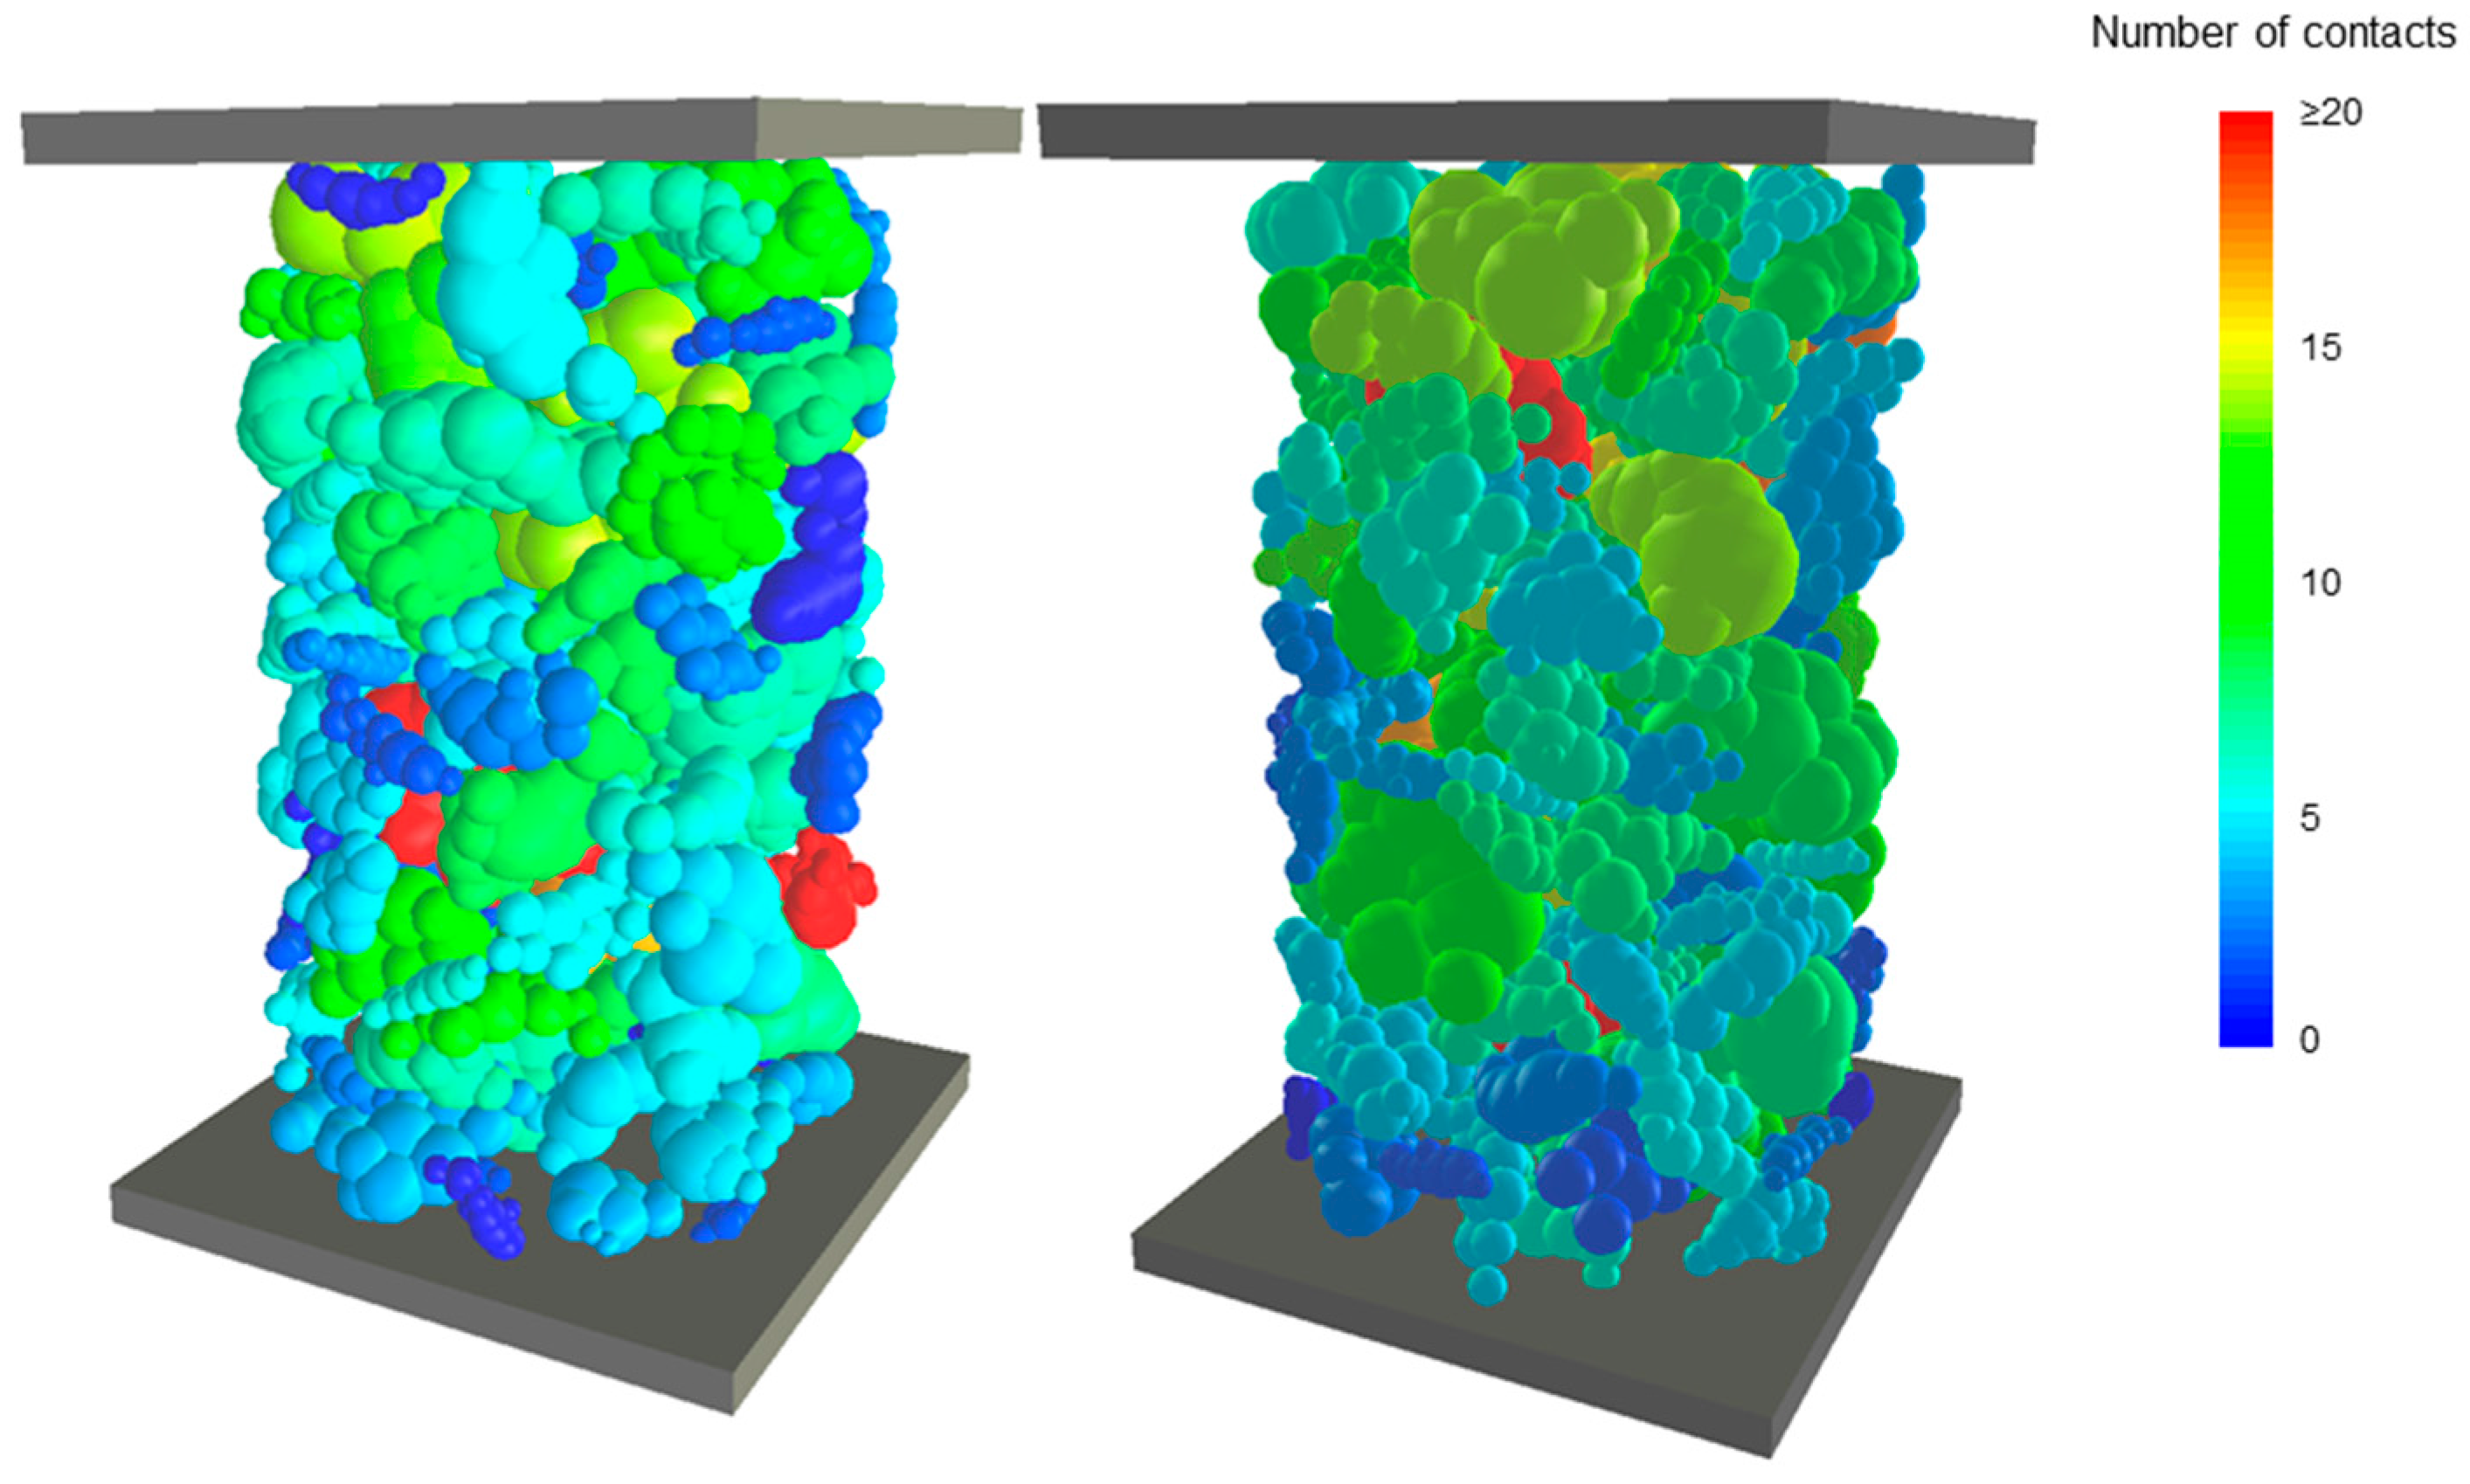
However, if contacts between only the coarse particles in these samples are plotted, the difference is not considerable. This has been presented in Figure 6, where again only coarse particles are shown and where the color index shows the number of contacts between −4+8 particles.
Comparing Figure 5 and Figure 6 allows us to conclude that fines in S3 do not break the contacts between coarse particles, but actually fill the voids between large particles. This can also be verified by looking at the density of contacts between coarse particles in S3 and S4. This value for S3 is 0.0717 and for S4 is 0.0768, and it should be noted that S3 has 5% less coarse particles.
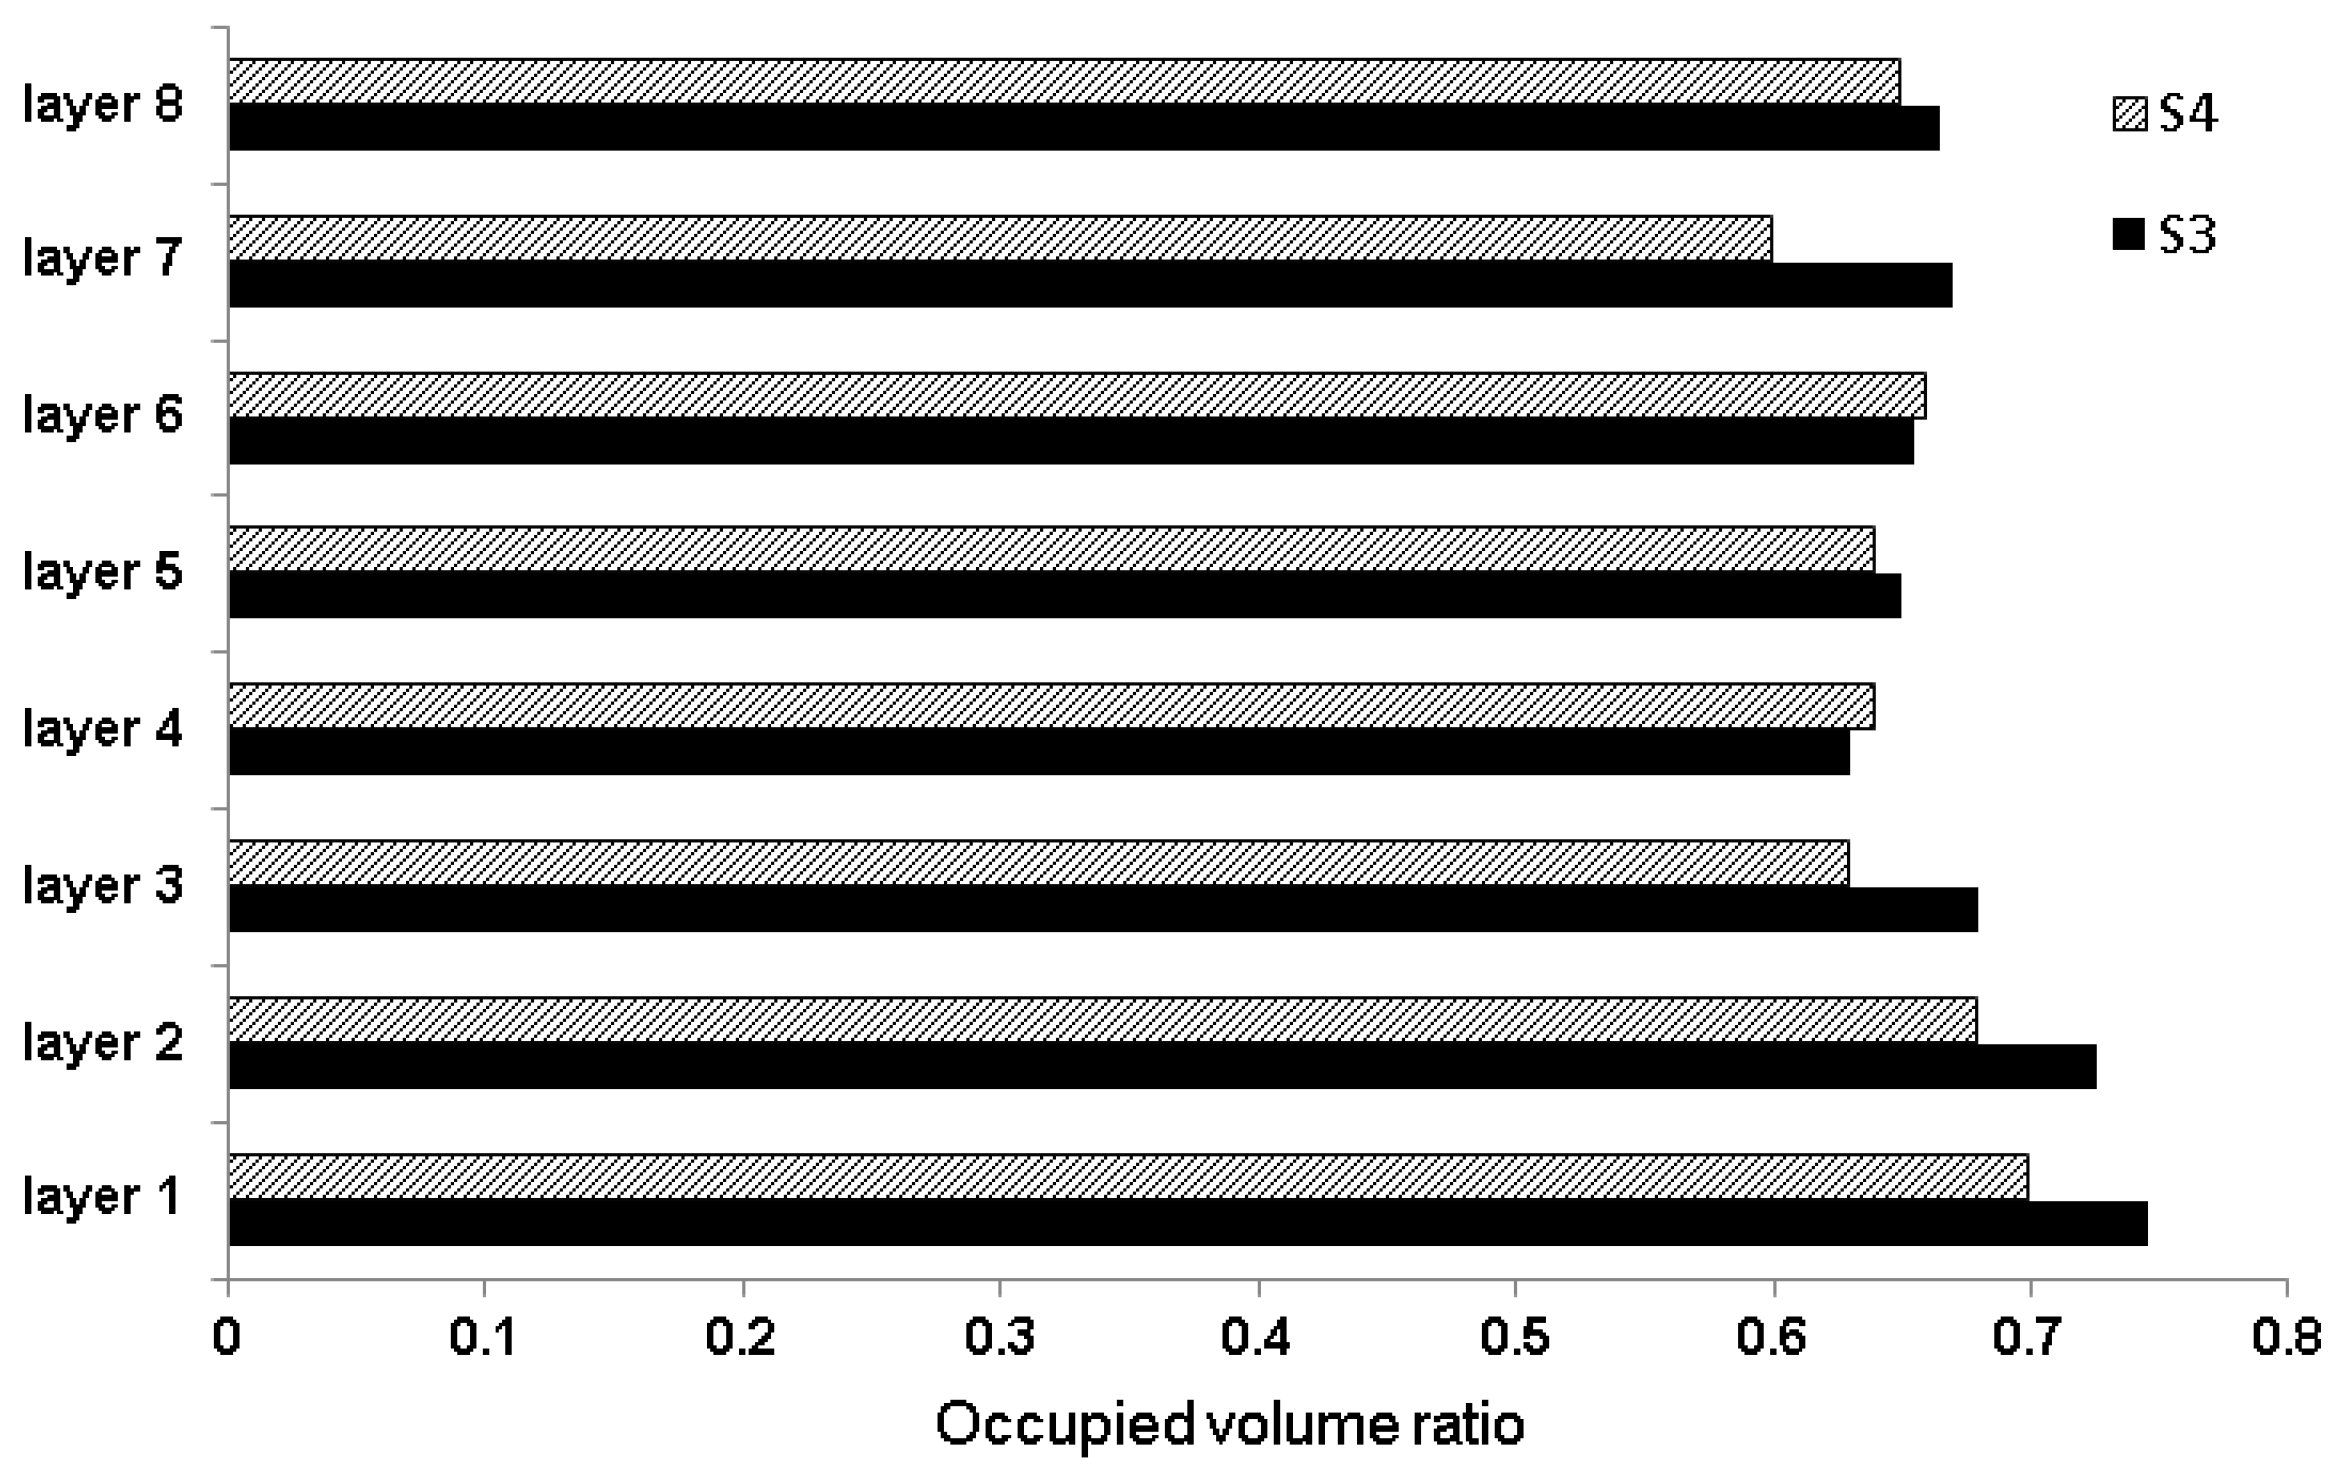
To illustrate the effect of fine particles in S3 on its electrical resistivity, the bulk density of S3 and S4 were numerically studied. The samples were divided into eight 3-mm-thick layers in the vertical direction. Then, the VoxelPorosity function of YADE was used to measure the packing density in each layer. Results are shown in Figure 7 in the form of the occupied volume ratio for each layer in S3 and S4. As the graph suggests, the presence of more fine particles in S3 leads to a higher packing density, and this means that it provides additional paths for electrical current transfer. In each layer in Sample S3, the equivalent available area for the current transfer is higher than that of S4, and this is the key to the low electrical resistivity in S3.
5. Conclusions
- Three-dimensional imaging was used to capture the shape and size distribution of coke aggregates. Modeled coke aggregates were used to investigate the packing density and electrical resistivity of coke particle mixes by means of the DEM.
- Determining the pore size distribution in the sample with only coarse particles was performed by void tracking on the numerical model of S5.
- An industrial aggregate recipe of coke aggregates for making anode paste was then modified according to the results of the void tracking. The modified recipes have a higher concentration of coarse particles and fewer fine particles, but their VBD is comparable to the standard sample.
- The electrical resistivities of the samples were also measured. Results showed that modified recipes not only provide a comparable or better bulk density, but they have a smaller electrical resistivity as well. DEM investigations on inter-particle contacts show that reducing the amount of fine particles decreases the contact density and increases the average contact radius within the sample. These two effects, if the bulk density is not compromised, result in a lower electrical resistivity.
- Since inter-particle contacts act as resistors, to obtain the minimum electrical resistivity in a granular system, one would need to decrease the contact density. On the other hand, having a higher packing density in a sample provides a greater area for current transfer in a given sample. This, as Ohm’s equation suggests, results in lower electrical resistivity. A single-piece chunk of material (with no contacts inside) would have the lowest electrical resistivity. However, if the material is in granular form, keeping the packing density as high as possible while minimizing the contact density contributes to having the lowest electrical resistivity.
Acknowledgments
The authors gratefully acknowledge the financial support provided by Alcoa Inc., the Natural Sciences and Engineering Research Council of Canada, and the Centre Québécois de Recherche et de Développement de l’Aluminium. A part of the research presented in this article was financed by the Fonds de recherche du Québec-Nature et Technologies by the intermediary of the Aluminium Research Centre—REGAL.
Author Contributions
Behzad Majidi and Houshang Alamdari conceived and designed the experiments; Behzad Majidi and Geoffroy Rouget performed the experiments; Mario Fafard and Donald P. Ziegler contributed in data analysis; Behzad Majidi wrote the paper and all co-authors commented/corrected it.
Conflicts of Interest
The authors declare no conflict of interest.
References
- Bernal, J.D. The Geometry of the Structure of Liquids. In Liquids: Structure, Properties, Solid Interactions; Hughel, T.J., Ed.; Elsevier: New York, NY, USA, 1965. [Google Scholar]
- Torquato, S.; Stillinger, F.H. Jammed hard-particle packings: From Kepler to Bernal and beyond. Rev. Mod. Phys. 2010, 82, 2633–2672. [Google Scholar] [CrossRef]
- Bourbatache, K.; Guessasma, M.; Bellenger, E.; Bourny, V.; Tekaya, A. Discrete modelling of electrical transfer in multi-contact systems. Granul. Matter 2012, 14, 1–10. [Google Scholar] [CrossRef]
- Mannweiler, U. Influence of raw materials on the properties of prebaked anodes and their behavior in Hall-Heroult cells. In Proceedings of the International Conference of Scientific and Technological Progress in Metallurgy of Light Metals, Leningrad, Soviet Socialist Republics, 17–19 September 1991. [Google Scholar]
- Azari, K.; Alamdari, H.; Ziegler, D.; Fafard, M. Influence of coke particle characteristics on the compaction properties of carbon paste material. Powder Technol. 2014, 257, 132–140. [Google Scholar] [CrossRef]
- Chevarin, F. Relation entre les Propriétés Physico-Chimiques de l’Anode en Carbone et sa Vitesse de Réaction sous CO2. Ph.D. Thesis, Université Laval, Ville de Québec, QC, Canada, 2016. [Google Scholar]
- Coste, B.; Schneider, J.P. Influence of Coke Real Density on Anode Reactivity Consequence on Anode Baking. Essent. Read. Light Met. 2013, 84–92. [Google Scholar]
- Hulse, K.L. Anode Manufacture Raw Materials Formulation and Processing Parameters, 1st ed.; R&D Carbon Ltd.: Sierre, Switzerland, 2000. [Google Scholar]
- Majidi, B.; Azari, K.; Alamdari, H.; Fafard, M.; Ziegler, D. Simulation of vibrated bulk density of anode-grade coke particles using discrete element method. Powder Technol. 2014, 261, 154–160. [Google Scholar] [CrossRef]
- Majidi, B.; Azari, K.; Alamdari, H.; Fafard, M.; Ziegler, D. Discrete Element Method Applied to the Vibration Process of Coke Particles. In Light Metals 2012; John Wiley & Sons: Hoboken, NJ, USA, 2012; pp. 1273–1277. [Google Scholar]
- Langston, P.; Kennedy, A.R.; Constantin, H. Discrete element modelling of flexible fibre packing. Comput. Mater. Sci. 2015, 96, 108–116. [Google Scholar] [CrossRef]
- Majidi, B.; Melo, J.; Fafard, M.; Ziegler, D.; Alamdari, H. Packing density of irregular shape particles: DEM simulations applied to anode-grade coke aggregates. Adv. Powder Technol. 2015, 26, 1256–1262. [Google Scholar] [CrossRef]
- O’Sullivan, C. Particulate Discrete Element Modelling: A Geomechanics Perspective; Applied Geotechnics; Spon Press/Taylor & Francis: Abingdon, UK, 2011; Volume 4, p. 103. [Google Scholar]
- Azari, K.; Majidi, B.; Alamdari, H.; Ziegler, D.; Fafard, M. Characterization of Homogeneity of Green Anodes through X-ray Tomography and Image Analysis. In Light Metals 2014; John Wiley & Sons: Hoboken, NJ, USA, 2014; pp. 1141–1146. [Google Scholar]
- Eidem, P.A.; Runde, M.; Tangstad, M.; Bakken, J.A.; Zhou, Z.Y.; Yu, A.B. Effect of contact resistance on bulk resistivity of dry coke beds. Metall. Mater. Trans. B 2009, 40, 388–396. [Google Scholar] [CrossRef]
Figure 1.
Calculation cycle in discrete element simulations.
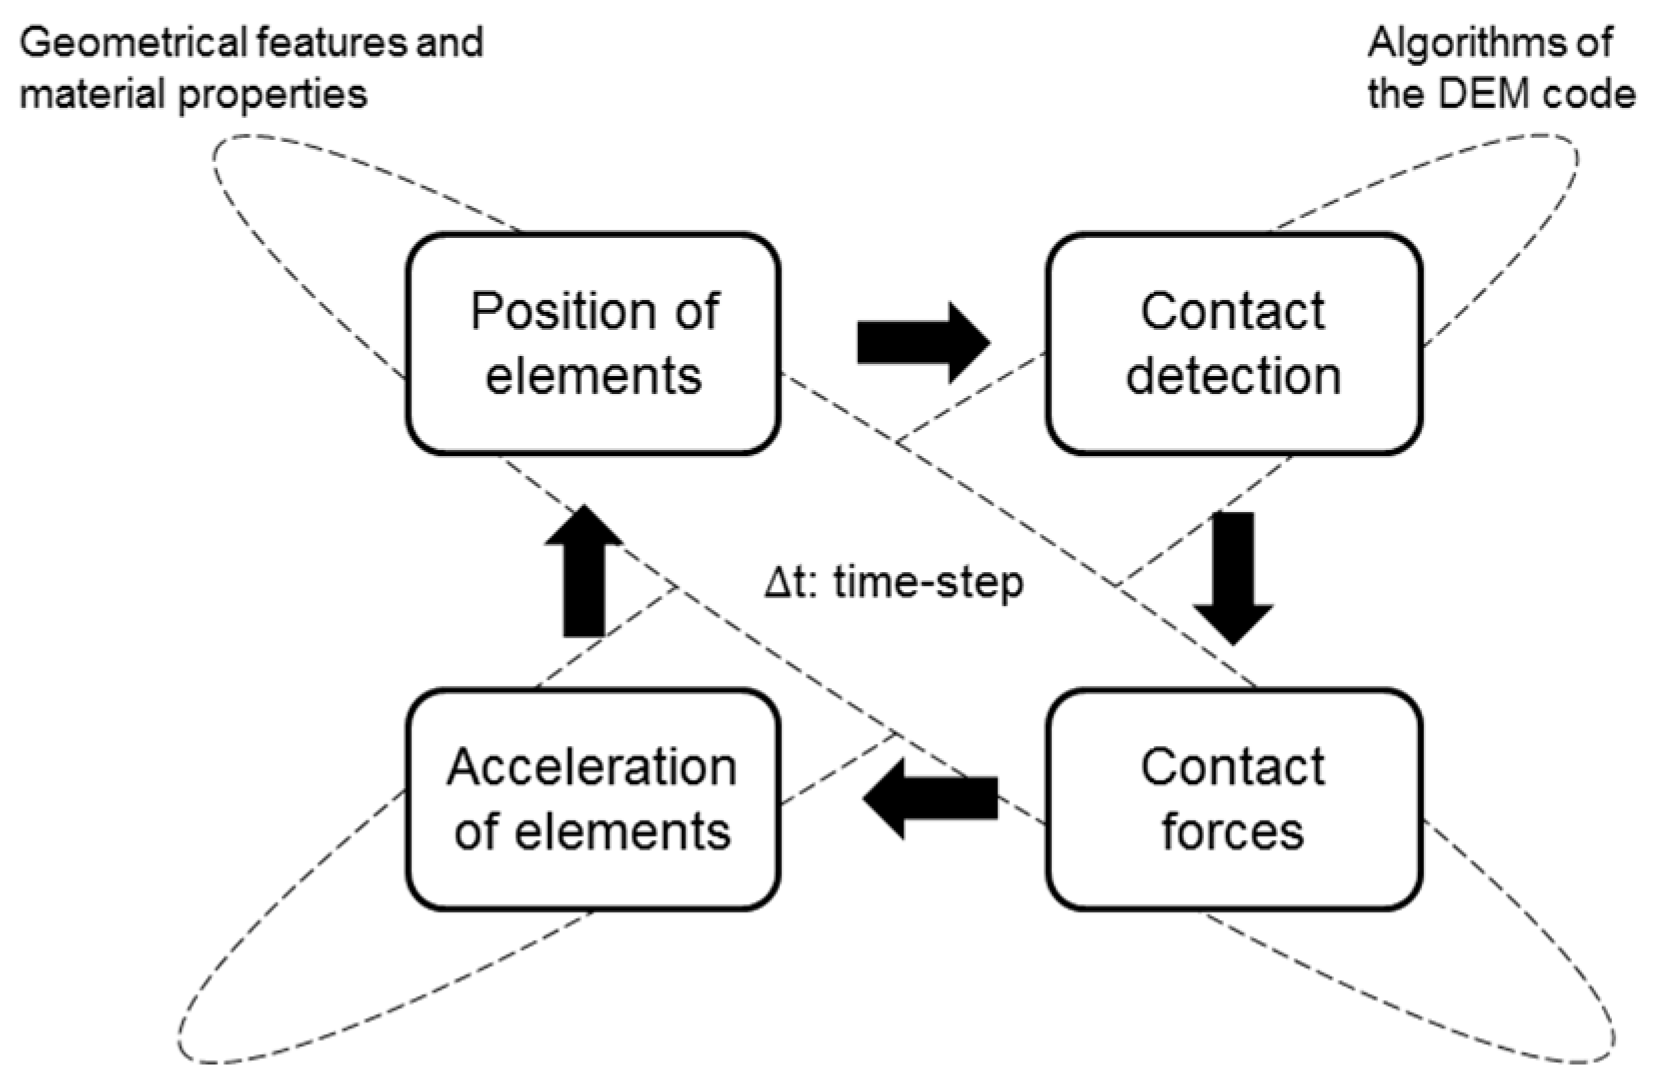
Figure 2.
Distribution of sphericity for the particles of the −4+8 mesh fraction.

Figure 3.
Electrical resistivity of different samples measured by the four-probe method.
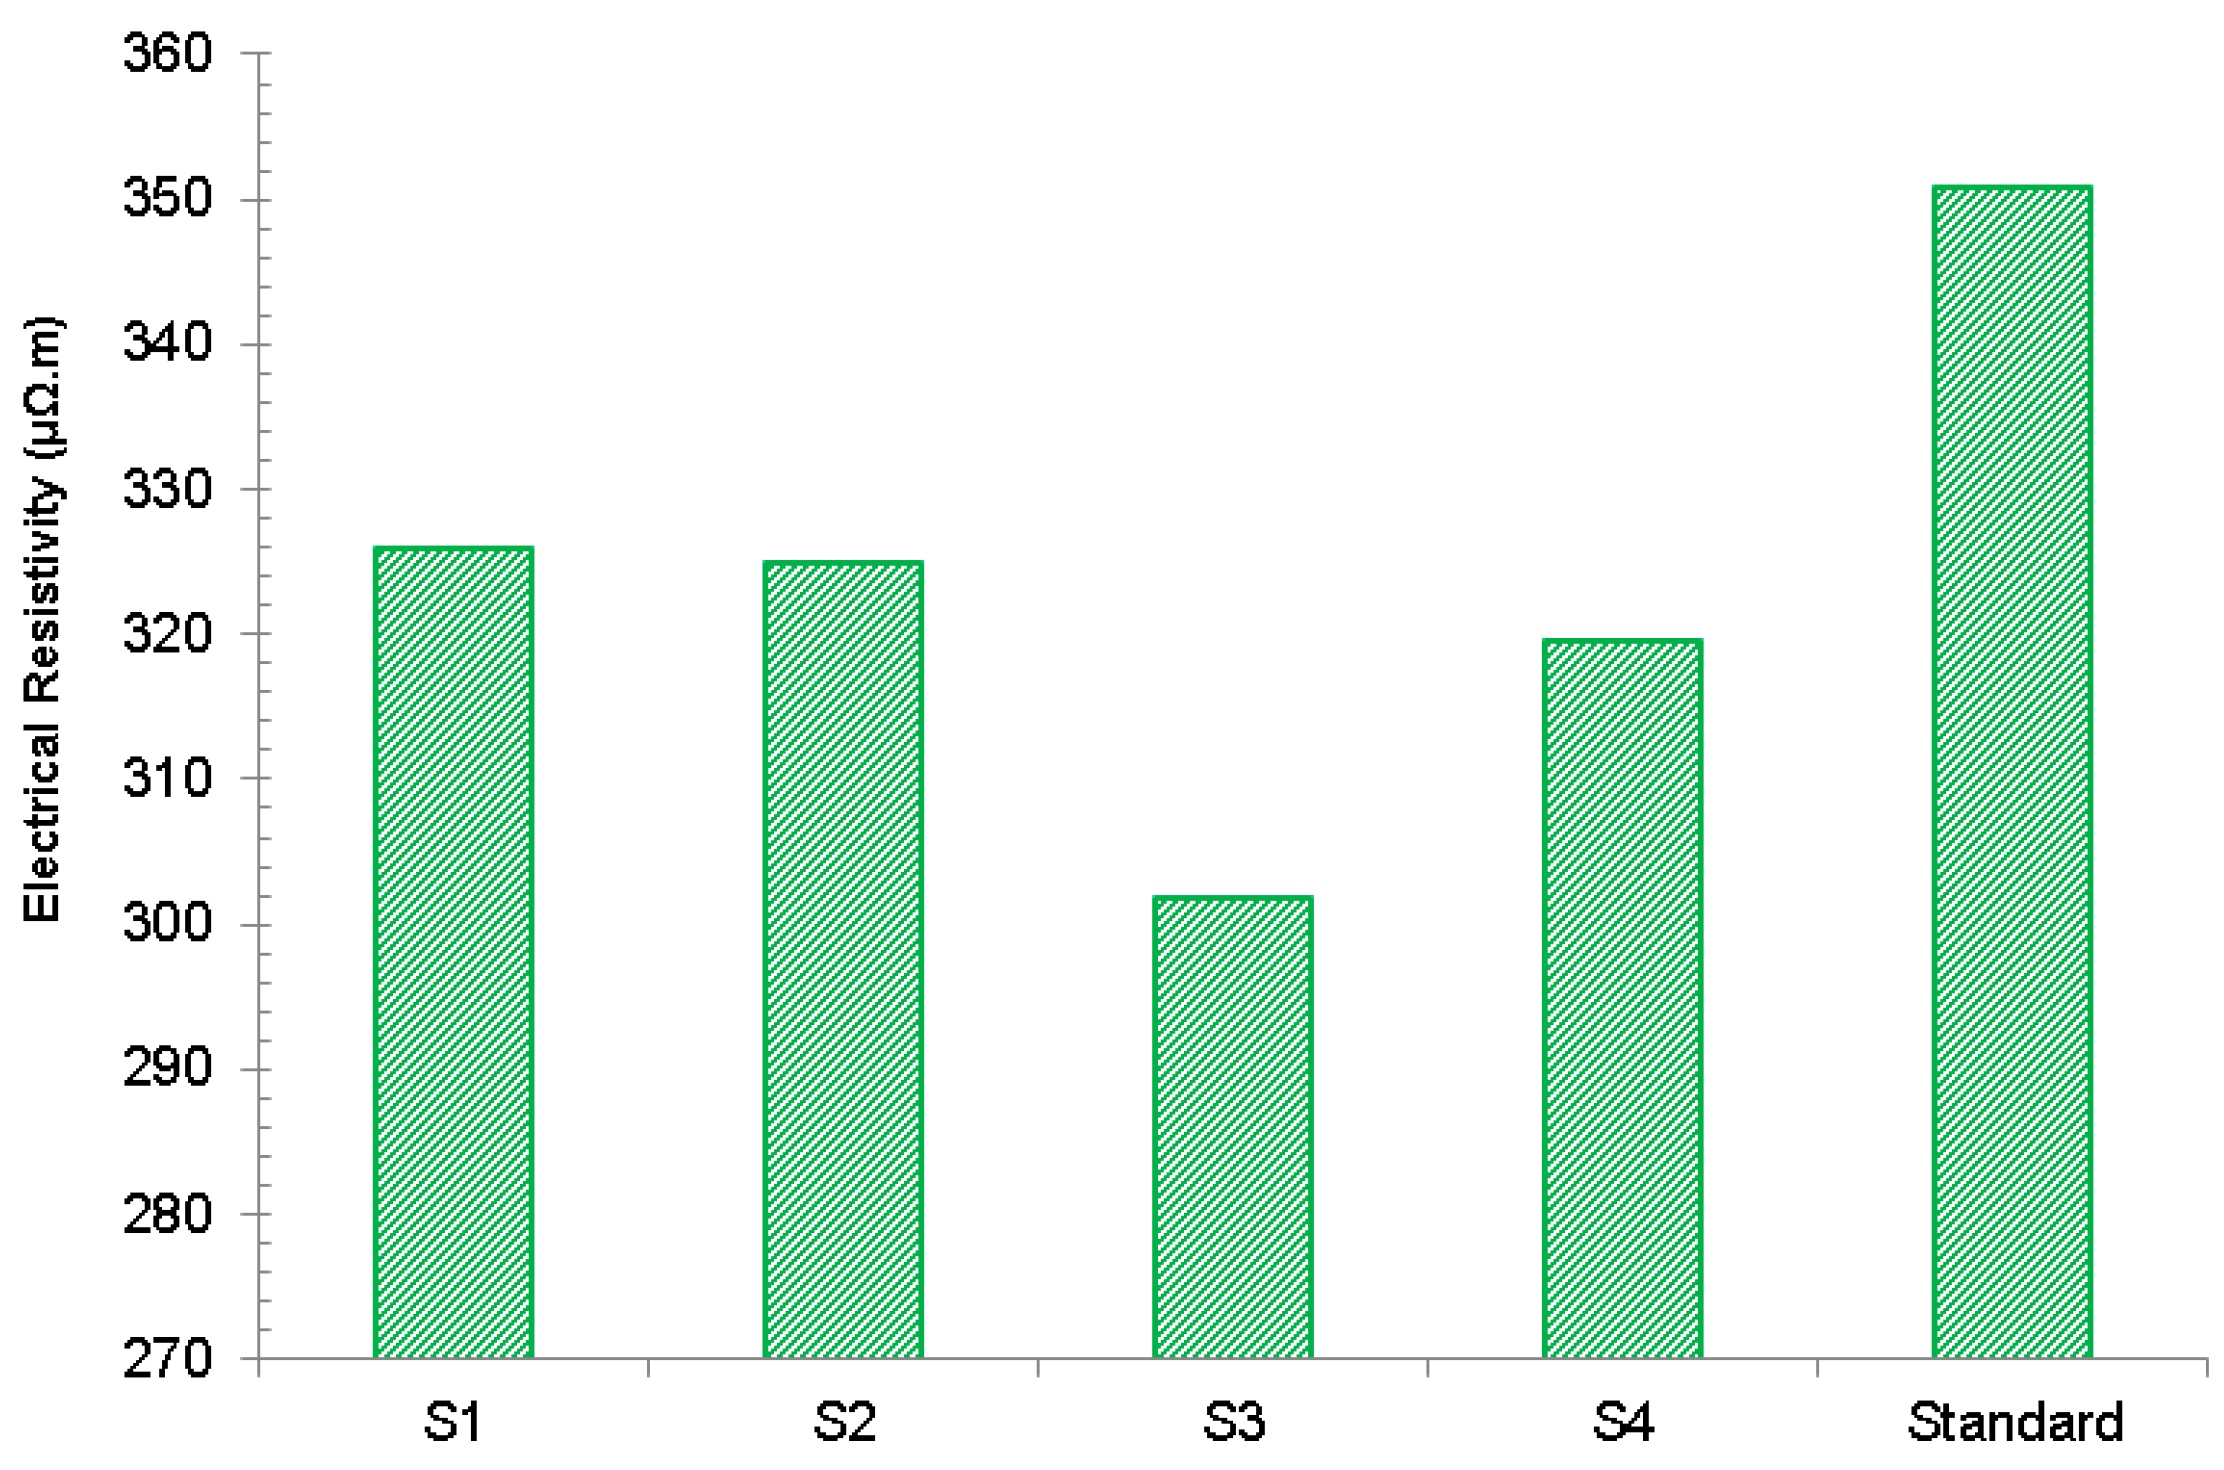
Figure 4.
Contacts data for different samples obtained from the discrete element method (DEM) models.
Figure 4.
Contacts data for different samples obtained from the discrete element method (DEM) models.

Figure 5.
The number of contacts with fine particles plotted for each coarse particle in S3 (left) and S4 (right).
Figure 5.
The number of contacts with fine particles plotted for each coarse particle in S3 (left) and S4 (right).

Figure 6.
The number of contacts with coarse particles plotted for each coarse particle in S3 (left) and S4 (right).
Figure 6.
The number of contacts with coarse particles plotted for each coarse particle in S3 (left) and S4 (right).

Figure 7.
The packing density in eight horizontal layers in Samples S3 and S4. A higher occupied volume means a greater area for current transfer.
Figure 7.
The packing density in eight horizontal layers in Samples S3 and S4. A higher occupied volume means a greater area for current transfer.


Table 1.
Typical coke particle recipe, used as a reference.
| Size Range (Mesh) | Size Range (mm) | Content (wt. %) |
|---|---|---|
| −4+8 | 2.38–4.76 | 33.6 |
| −8+14 | 1.41–2.38 | 15.3 |
| −14+30 | 0.595–1.14 | 17.7 |
| −30+50 | 0.297–0.595 | 19.4 |
| −50+100 | 0.149–0.297 | 13.9 |
Table 2.
Apparent density of different size ranges of coke [14].
Table 2.
Apparent density of different size ranges of coke [14].
| Size Range (Mesh) | Apparent Density (g/cm3) |
|---|---|
| −4+8 | 1.377 |
| −8+14 | 1.532 |
| −14+30 | 1.524 |
| −30+50 | 1.586 |
| −50+100 | 1.586 |
Table 3.
Results of the void tracking test: the distribution of the mass of the filling spheres within various size ranges [12].
Table 3.
Results of the void tracking test: the distribution of the mass of the filling spheres within various size ranges [12].
| Size Range of Filling Spheres (Mesh) | Mass of Filling Spheres (g) |
|---|---|
| −8+14 | 0.07887 |
| −14+30 | 1.448 |
| −30+50 | 1.413 |
| −50+100 | 1.288 |
Table 4.
Coke aggregates size distribution of new samples based on the results of the void tracking method. The values show the weight percentage of each size range in the sample. The vibrated bulk density (VBD) for each sample has been also given [12].
Table 4.
Coke aggregates size distribution of new samples based on the results of the void tracking method. The values show the weight percentage of each size range in the sample. The vibrated bulk density (VBD) for each sample has been also given [12].
| Size Range (Mesh) | Size Range (mm) | Sample | |||||
|---|---|---|---|---|---|---|---|
| S1 | S2 | S3 | S4 | S5 | Standard | ||
| −4+8 Mesh | 2.38–4.76 | 60 | 60 | 60 | 65 | 100 | 33.6 |
| −8+14 Mesh | 1.41–2.38 | 0 | 0 | 0 | 0 | 0 | 15.3 |
| −14+30 Mesh | 0.595–1.14 | 15 | 20 | 15 | 15 | 0 | 17.7 |
| −30+50 Mesh | 0.297–0.595 | 15 | 10 | 10 | 15 | 0 | 19.4 |
| −50+100 Mesh | 0.149–0.297 | 10 | 10 | 15 | 5 | 0 | 13.9 |
| VBD (g/cm3) | 0.956 | 0.952 | 0.985 | 0.926 | 0.786 | 0.955 | |
© 2017 by the authors. Licensee MDPI, Basel, Switzerland. This article is an open access article distributed under the terms and conditions of the Creative Commons Attribution (CC BY) license (http://creativecommons.org/licenses/by/4.0/).
Share and Cite
MDPI and ACS Style
Majidi, B.; Rouget, G.; Fafard, M.; Ziegler, D.; Alamdari, H. Discrete Element Method Investigation of Bulk Density and Electrical Resistivity of Calcined Coke Mixes. Metals 2017, 7, 154. https://doi.org/10.3390/met7050154
AMA Style
Majidi B, Rouget G, Fafard M, Ziegler D, Alamdari H. Discrete Element Method Investigation of Bulk Density and Electrical Resistivity of Calcined Coke Mixes. Metals. 2017; 7(5):154. https://doi.org/10.3390/met7050154
Chicago/Turabian StyleMajidi, Behzad, Geoffroy Rouget, Mario Fafard, Donald Ziegler, and Houshang Alamdari. 2017. "Discrete Element Method Investigation of Bulk Density and Electrical Resistivity of Calcined Coke Mixes" Metals 7, no. 5: 154. https://doi.org/10.3390/met7050154
Note that from the first issue of 2016, this journal uses article numbers instead of page numbers. See further details here.