Article

Critical Condition of Dynamic Recrystallization in 35CrMo Steel

1
College of Mechanical and Electrical Engineering, Central South University, Changsha 410083, China
2
Light Alloy Research Institute, Central South University, Changsha 410012, China
3
State Key Laboratory of High Performance Complex Manufacturing, Central South University, Changsha 410083, China
*
Author to whom correspondence should be addressed.
Metals 2017, 7(5), 161; https://doi.org/10.3390/met7050161
Submission received: 15 April 2017 / Revised: 1 May 2017 / Accepted: 4 May 2017 / Published: 9 May 2017
(This article belongs to the Special Issue Alloy Steels)

Abstract

:
The compression deformation behaviors of 35CrMo steel at different conditions was studied by using Gleeble-3810 thermo-simulation machine under large strain. The results indicate that the flow stress curves of 35CrMo steel is affected by strain rate and deformation temperature, showing the characteristics of dynamic recovery (DRV) and dynamic recrystallization (DRX), which is the main softening mechanism of 35CrMo steel. The activation energy (Q) and Zener–Hollomon parameter (Z parameter) expression for thermal deformation of this steel was calculated by linear regression. The inflection point on the curve of strain hardening rate and flow stress (θ-σ curve) corresponds to the beginning of DRX, and the critical strain of DRX increases with the decrease of deformation temperature and the increase of strain rate. Based on the inflection point criterion, the constitutive equation of the critical strain of DRX of 35CrMo steel was established: εc = 0.000232Z0.1673, which reflects the variation of the critical strain of DRX with the Z parameter. In addition, through metallographic observation, the rationality of the inflection point criterion in determining the critical strain of DRX of 35CrMo steel was verified, and the DRX state diagram was established.

1. Introduction

Microstructure control of metals and alloys during thermal processing is an important key because it allows control of the final microstructure of the alloy as well as the required mechanical properties. One of the most important mechanisms of microstructure control in thermal deformation is dynamic recrystallization (DRX), which occurs in several metals and alloys [1,2,3]. The traditional view is that the emergence of the peak stress of the rheological curve represents the occurrence of DRX, but for some materials with strain hardening properties the rheological curve does not show significant peak characteristics, even if the presence of DRX is confirmed by metallographic observation. Although the critical strain of DRX can be determined by the metallographic method, this technique requires many samples before and after the critical stress. In addition, the phase change during the cooling process from the thermal deformation temperature also changes the deformation structure, which makes the metallographic analysis difficult. Therefore, it is very important to find a method to obtain the critical strain of DRX without using metallographic analysis. Poliak and Jonas [4,5,6] believed that once the DRX occurs, regardless of whether there is a stress peak on the stress–strain curve, the inflection point is shown on the θ-σ curve, and the critical condition is considered to be the maximum on the dθ/dσ-σ curve and the inflection point of the θ-σ curve corresponding. Najafizadeh and Mirzadeh [7,8] proposed to describe the θ-σ curve with a cubic polynomial, which makes it easy and quantifiable to determine the inflection point. Many scholars [9,10,11] applied this theory and method, in the metals and alloys to determine the DRX critical strain to achieve better results.
Due to its good wear, impact, corrosion, and fatigue resistances—and its price being much lower than that of chromium-nickel alloy steel with the same mechanical properties—35CrMo steel is widely used in processing of mechanical products, vehicle assembly, mining, and other industries. It is heavily used in the manufacturing of various small and medium-sized parts such as driveshafts, crankshafts, and fasteners [12,13,14,15]. In 2003, Zhang [12] on the ordinary casting 35CrMo steel hot compression test, and build the corresponding dynamic recrystallization model. In 2010, SV Sajadi et al. [13] studied the dynamic recovery (DRV) behavior of 34CrMo4 (domestic 35CrMo grade) steel at 900–1100 °C/0.001–0.1 s−1, and constructed the rheological stress of steel under the deformation parameters prediction equation, and achieved good application effect. Xu et al. [14] studied the effect of rheological forming parameters on the rheological resistance of 34CrMo4 steel, and constructed the high-temperature rheological constitutive equation of steel based on macroscopic phenomenology. Furthermore, Xiao et al. [15] found that the DRX behavior of 35CrMo steel can not only refine the grain in the process of thermal deformation, but also can effectively inhibit the crack. Unfortunately, the DRX critical condition of 35CrMo steel is not given.
In this paper, the reason of the inflection point on the θ-σ curve of 35CrMo steel is analyzed by work hardening theory, and the softening mechanism of the stress–strain curves was studied. The DRX inflection point criterion, focused on the critical strain calculation for the initiation of the DRX of 35CrMo steel under various deformation conditions and verifies its rationality in combination with microstructure analysis.

2. Experimental Materials and Procedures

35CrMo steel is widely used as the bearing part and rotary shaft material of the marine positioning system. The chemical composition is shown in Table 1, and the original microstructure grains are coarse and irregular, as shown in Figure 1. Before the experiment, the steel was processed into a cylindrical sample of 10 mm and a height of 12 mm by wire cutting. The graphite sheet is padded between the ends of the specimen and the contact surface of the indenter and the lubricant is applied at both ends of the sample to keep the temperature and deformation more uniform during heating and compression.
The thermal simulation compression test was carried out on a Gleeble-3810 thermo-simulation machine (Central South University, Changsha, China) in the temperatures range of 850–1150 °C at an interval of 100 °C and at strain rates ranging from 0.01 to 10 s−1. All specimens were heated up to 1200 °C at 10 °C/s, soaked for 120 s to eliminate the thermal gradient, and then cooled to the deformation temperature at 10 °C/s. Before the compression tests, samples were maintained at deformation temperature for 120 s. The reduction in height was 60% (true strain 0.85) at the end of the compression tests, and each sample after compression was quenched in water immediately to retain the deformed microstructure. In order to observe the DRX under different strains, four sets of experiments were carried out at the deformation temperature of 1050 °C and the strain rate of 0.1 s−1, and the strain was the critical strain (0.115), the maximum strain (0.22), the softening strain (0.31) and the steady strain (0.62), respectively. The sample was subjected to grinding and polishing, and was etched at 60 to 80 °C in a self-formulated etchant (2.5 g of picric acid, 50 mL of distilled water and 1 mL of hydrochloric acid) bath for 4 to 10 min, with an Olympus DSX500 optical microscope (Olympus Corporation, Tokyo, Japan) to observe the microstructure.

3. Results and Discussion

3.1. Work Hardening Phenomenon

The flow stress of metals is affected by the change of internal dislocation density. According to the theory of work hardening [16,17,18,19,20], the work hardening rate with stress changes can be divided into five stages: І—easy slip phase, П—linear hardening stage, Ш—DRV hardening stage, IV—large strain hardening stage, and Ѵ—DRX softening stage, as shown in Figure 2.
DRX occurs in the transition zone of IV stage to the Ѵ stage. With the increase in strain accumulated to a certain amount, the material hardening will enter the IV stage. The dislocation cell wall in the cellular structure absorbs the dislocation of the active dislocation and increases the dislocation density of the cell wall, forming the subgrain boundary, and the cellular structure becomes the substructure. Sub-structure formation, due to its strength on the material has a certain contribution, leading to a decline in the work hardening rate of slowing down, however, without a point of inflection on the θ-σ curve. Obtaining this point of inflection requires introduction of a stage V which can only be brought about by a change in microstructural mechanisms. Gottstein [17] proposes to associate this change with the mobility of sub-boundaries.
When the boundaries move they incorporate and annihilate the dislocations of the swept cell interior. This introduces a new dynamic recovery mechanism and, compared to stage IV behavior, speeds up attainment of a steady-state with a dynamically stable and equiaxed sub grain structure. Also, it generates a stage V of the hardening behavior as a rapid transition to steady-state [17,21]. In this stage, the deformation to a certain extent, the deformation of the dislocation density within the organization reached a certain critical value, microstructural heterogeneity or boundary kinetics may play a role in rendering microstructure behavior stable or unstable at the critical point. Consequently, there will be a point of inflection at the transition from stages IV to V, as shown in Figure 2. The corresponding stress at the inflection point is the DRX critical stress σc, and the lnθ-lnσ curve and the lnθ-ε curve show inflection point characteristics [5,7], Thus, by analyzing the strain hardening rate θ and the inflection point on the flow stress σ curve or the maximum value on the dθ/dσ-σ curve, the critical condition of DRX can be obtained.

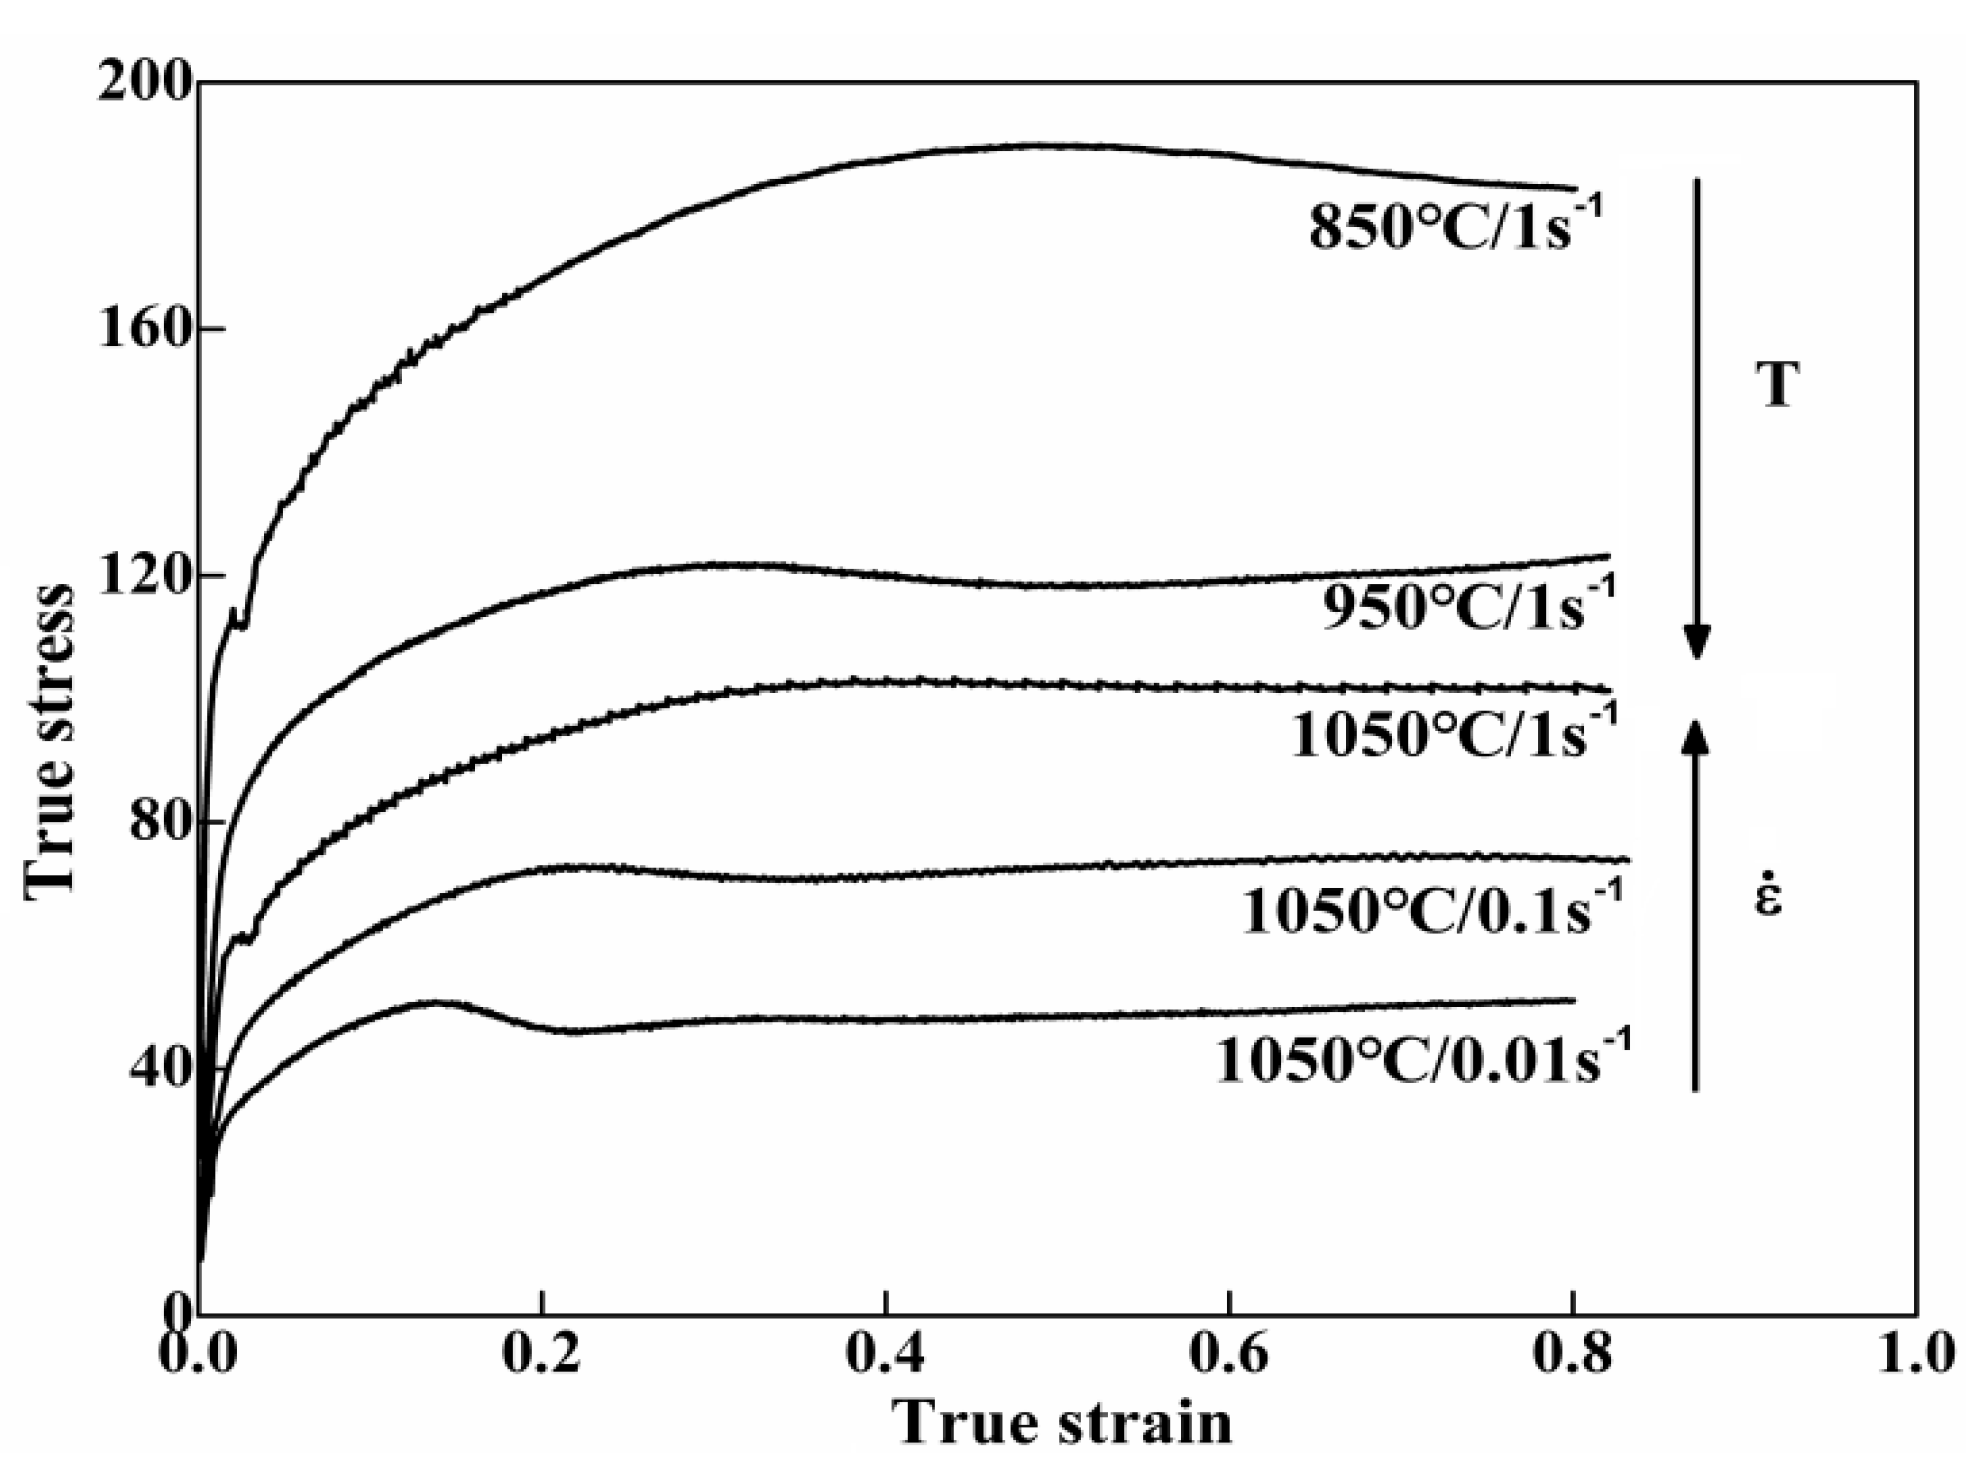
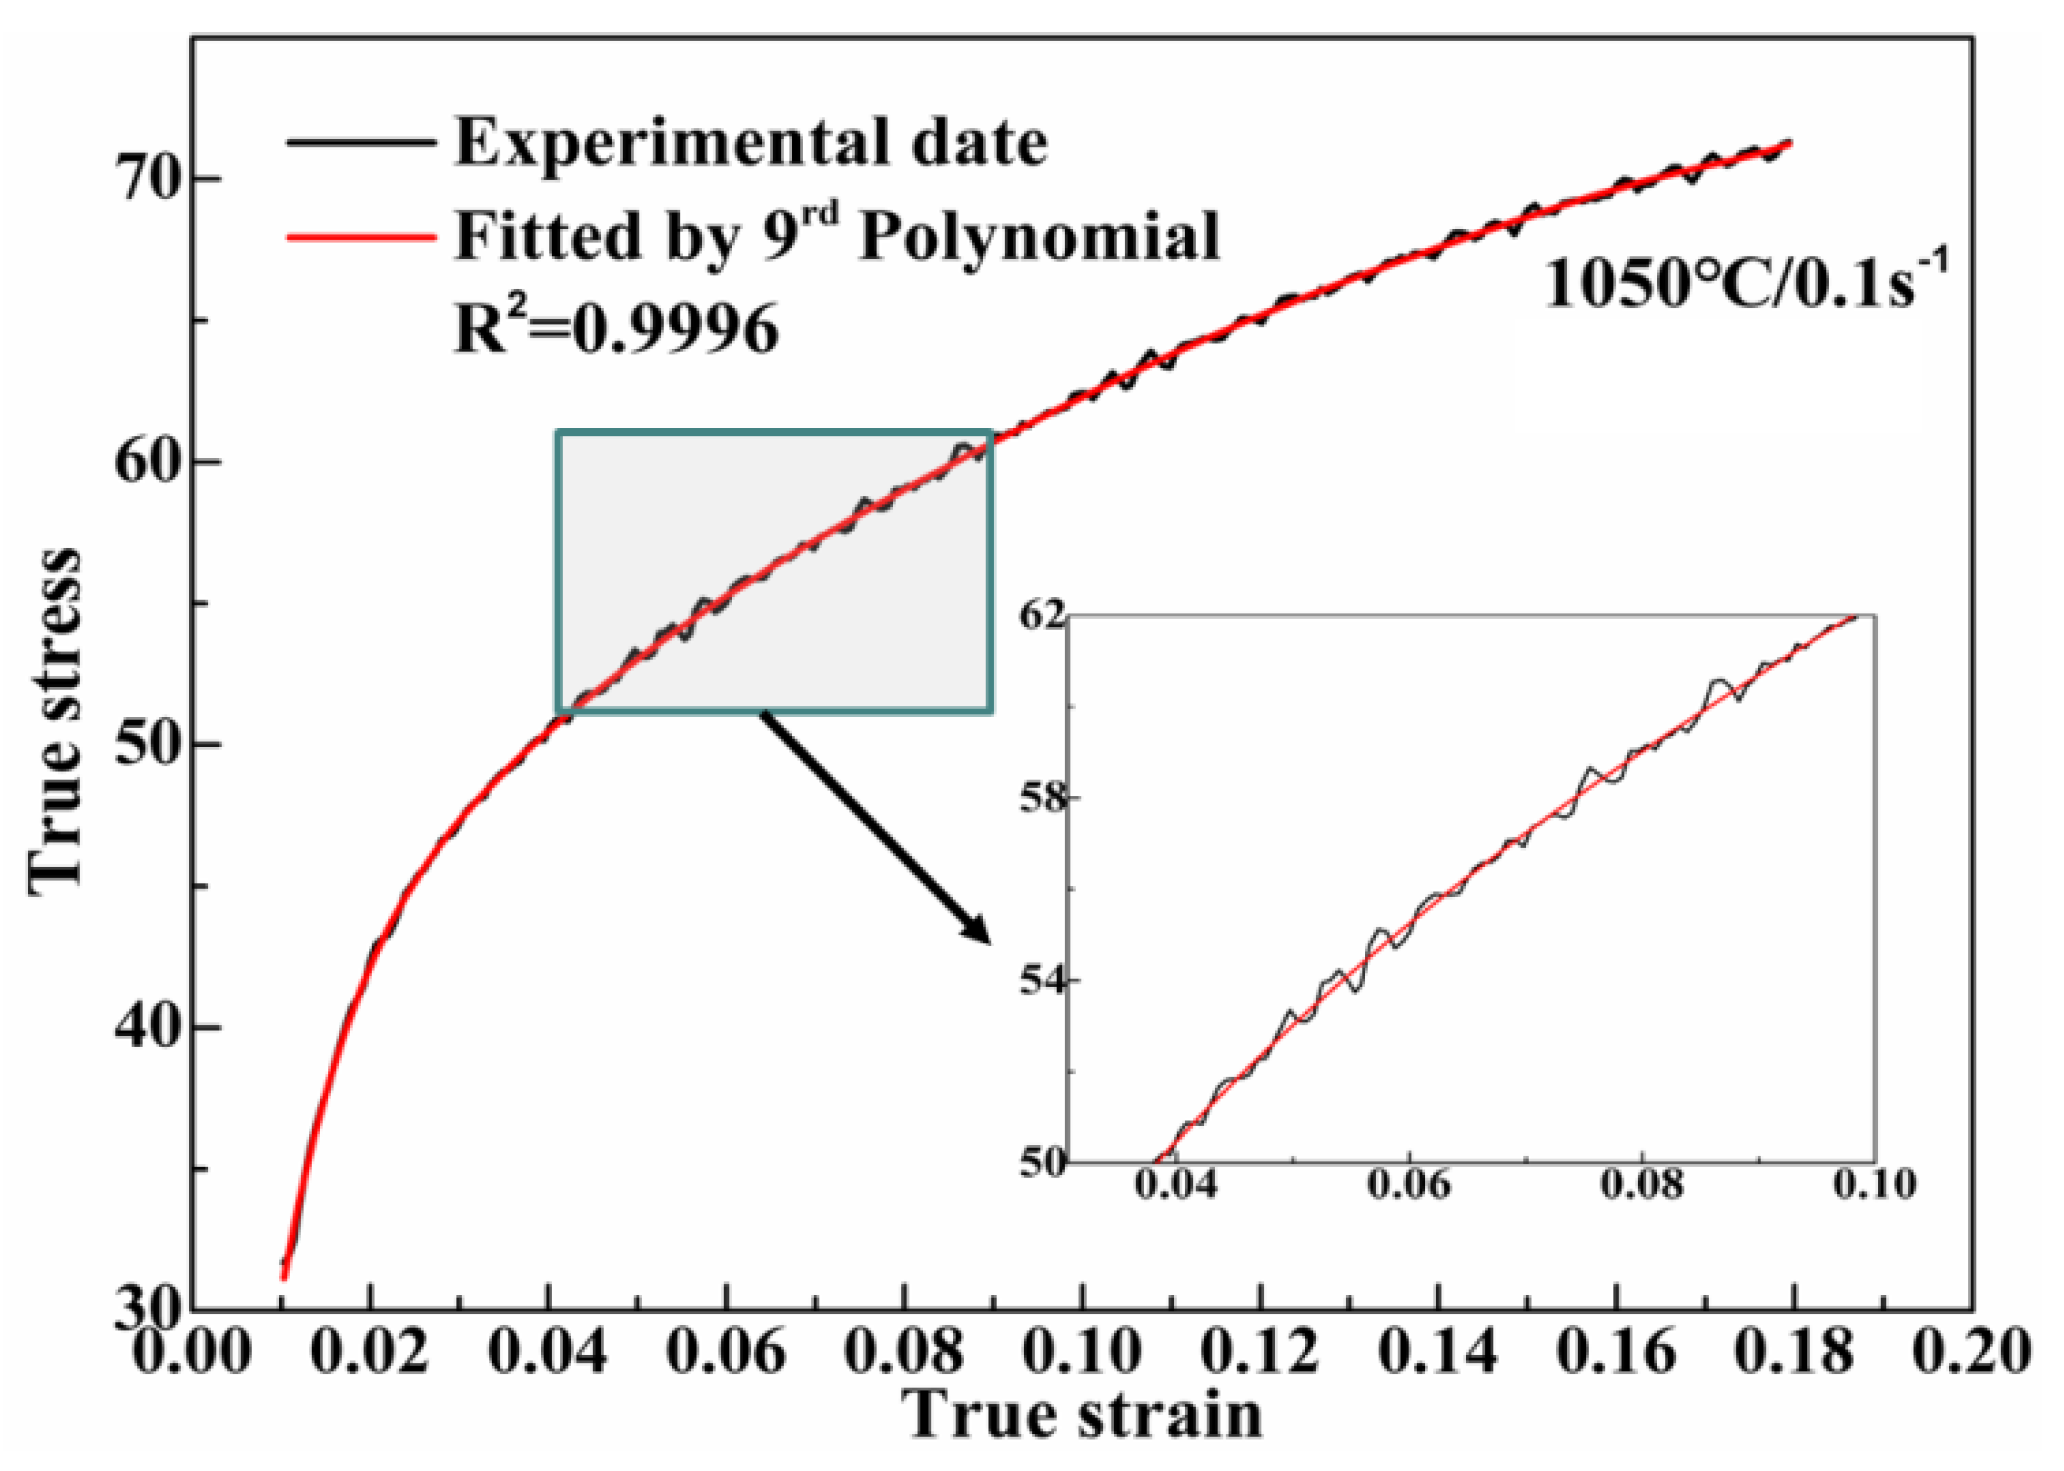
3.2. Characteristics of Stress–Strain Curves

Flow stress and dislocation density are closely linked [22,23]. The austenite phase in 35CrMo steel has low stacking fault energy, and its recovery process is slow. The DRV cannot be synchronized to offset the accumulation of dislocation during hot deformation, so DRX occurs under a certain critical deformation condition. During the DRX process, a large number of dislocations are eliminated by the large angle interface of the recrystallization core, which also acts as a softening effect on the alloy during hot working. Therefore, DRV and DRX reduce the dislocation density of the steel in the hot working process, which is an effective softening mechanism in the hot deformation.
Figure 3 shows the typical flow curves of 35CrMo steel under different deformation conditions, with similar rheological characteristics: at the beginning of deformation, flow stress increases rapidly due to the strong effect of work hardening. Subsequently, the dynamic softening effect increases with the increase of the strain, resulting in a slow increase in flow stress, which remains stable after a peak or a slight decrease, showing DRV and DRX characteristics, respectively. At higher strain rate (10 s−1) and lower temperatures (850 °C), the flow stress is almost constant after reaching a peak (peak point is not obvious), so the test steel did not occur DRX before the peak stress, the corresponding softening mechanism for DRV. On the contrary, at lower strain rates (0.01 s−1) and higher temperature (1050 °C), DRX has occurred before peak stress appears (peak point is obvious) when the strain exceeds critical strain. The driving force of DRX is the removal of dislocations [24]. The increase in work hardening and dislocation density leads to critical microstructural changes that are conditional for new grain nucleation and new high-angle boundary growth. The lower the strain rate and the higher the deformation temperature, the more obvious the effect of DRX on the stress–strain curves [25], so the higher the plasticity.

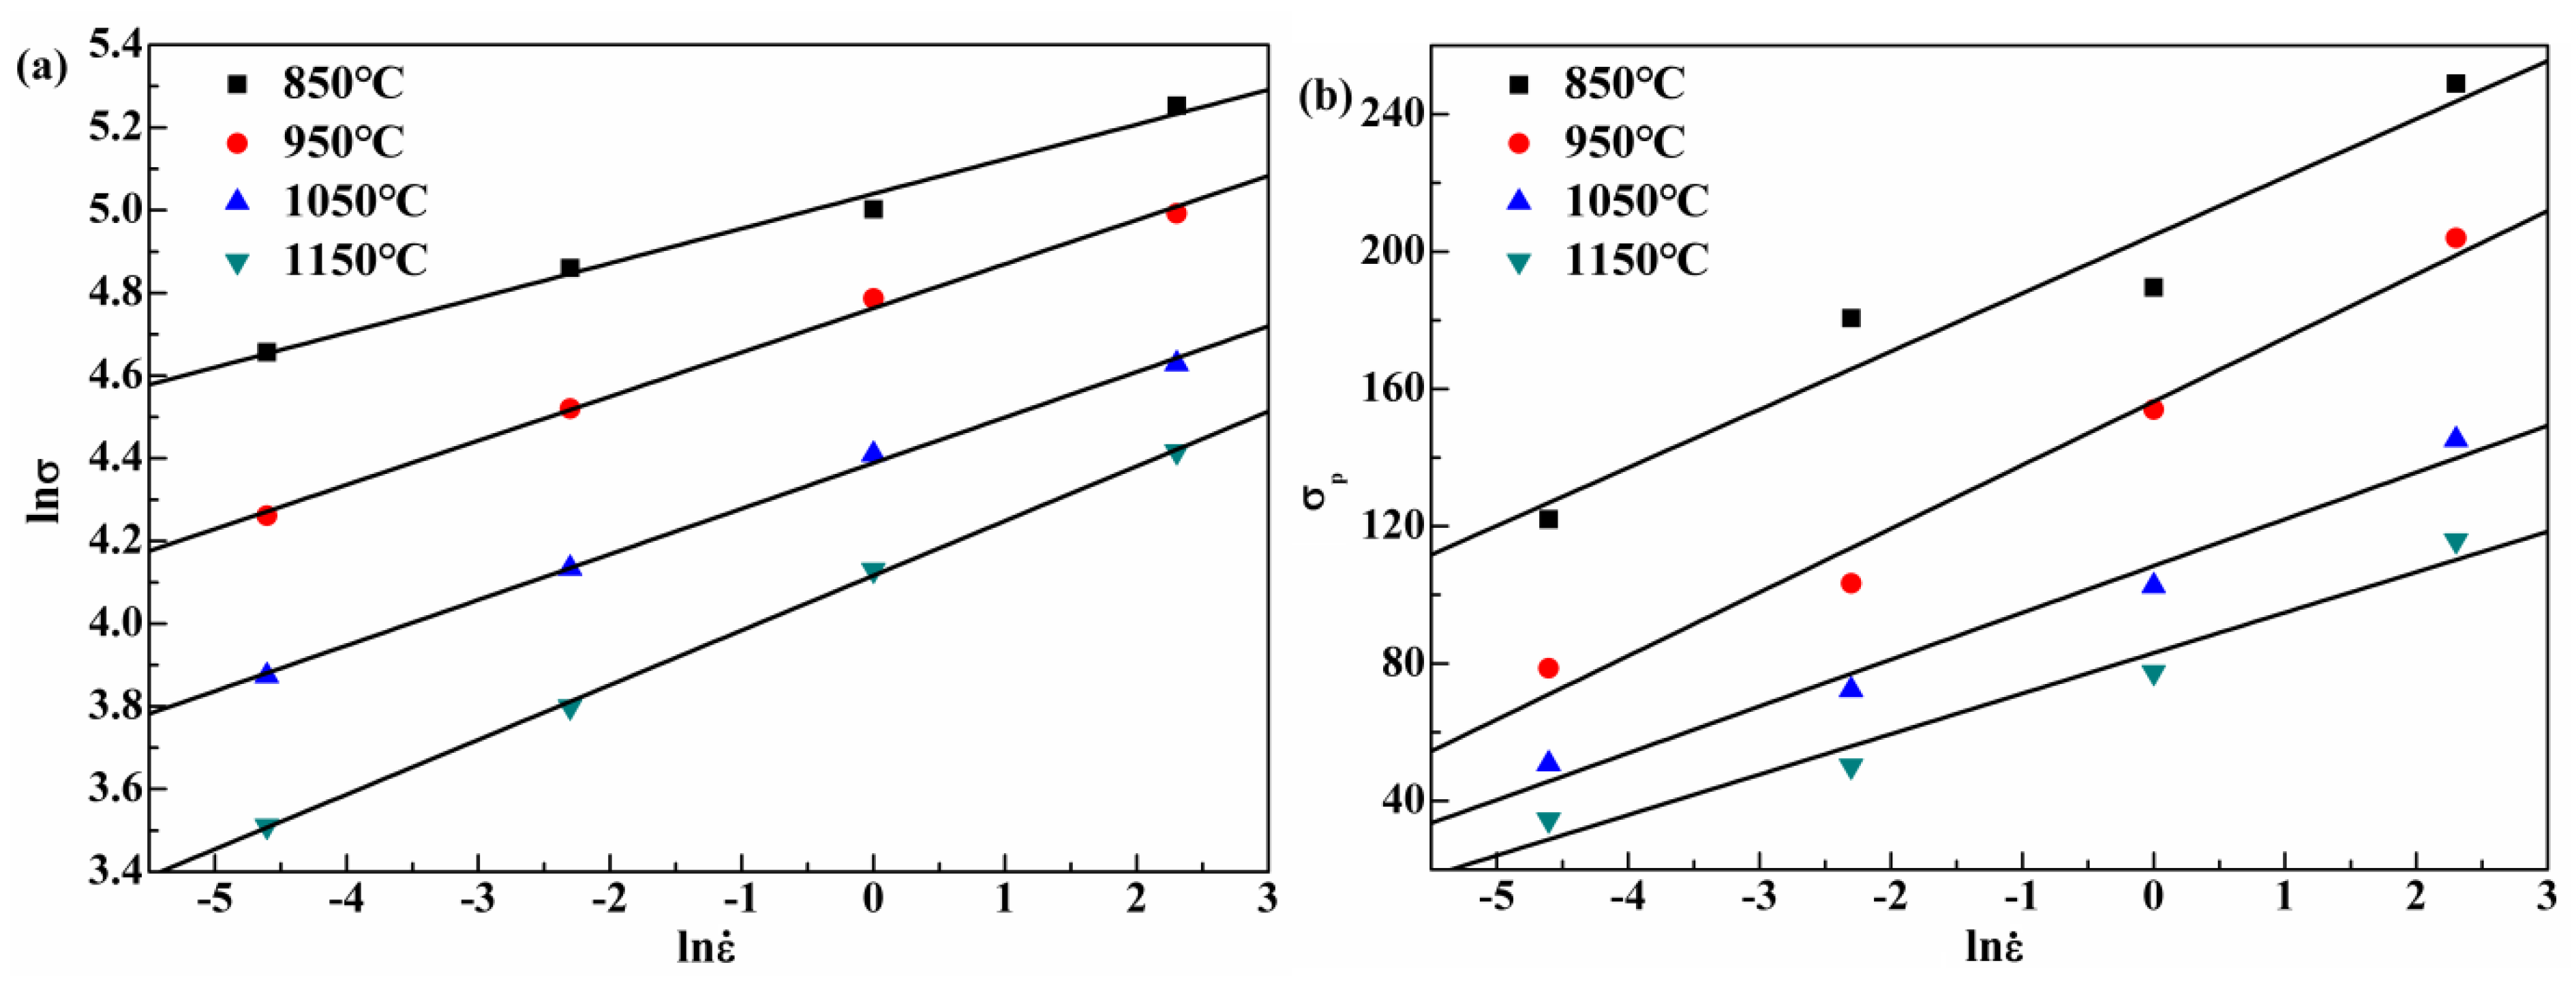
3.3. The Activation Energy of 35CrMo Steel

Arrhenius type equation is widely used to obtain the activation energy of the metals and alloys, and the influence of strain rate and temperature on the deformation behavior can be expressed by the Zener–Hollomon parameter in the exponential equation. It can be expressed as follows [26,27,28,29]:
ε ˙ = A F ( σ ) exp [ Q / ( R T ) ]
Z = ε ˙ exp ( Q R T )
Here,
{ F ( σ ) = σ N ,    ( α σ < 0.8 ) F ( σ ) = exp ( β σ ) ,    ( α σ > 1.2 ) F ( σ ) = [ sinh ( α σ ) ] n ,    For   all   σ
where ε ˙ is the strain rate (s−1), A, α, β, N, and n, are material constants, and α = β/N, Q is the apparent activation energy for deformation, R is the gas constant (8.3145 J·mol−1·K−1), T is the absolute temperature (K), σ is the true stress (MPa).
Substituting Equation (3) into Equation (1) and taking the logarithm on both sides, gives
{ ln ε ˙ = ln A + N ln σ Q R T ( α σ < 0.8 ) ln ε ˙ ln A + β σ Q R T ( α σ > 1.2 ) ln ε ˙ = ln A + n ln [ sinh ( α σ ) ] Q R T For   all   σ
In the case of lower stress (i.e., ασ < 0.8), the first equation can be used to calculate the value of N, under higher stress conditions (i.e., ασ > 1.2), using the second equation to calculate β value. Figure 4a,b shows the plots of ln σ ln ε ˙ and σ p ln ε ˙ when ε = 0.1, σ = σ p , respectively, the linear regression was used to fit the slope, and the average slope was N = 9.473307, β = 0.067817. Then α = β/N = 7.159 × 10⁻³.
Substituting the value of α into Equation (4), the plots of ln [ sinh ( α σ ) ] ln ε ˙ can be obtained as shown in Figure 5a, and the value of n can be computed as 8.074677 by linear fitting method.
For a given strain rate ε ˙ , the activation energy Q can be obtained from the following equation,
Q = R n [ ln sinh ( α σ ) ln ( 1 / T ) ]
The plots of ln [ sinh ( α σ ) ] 1000 / T as shown in Figure 5b, and the average value of slope is 6.084558. With the combination of R and n, the activation energy Q = 408.498 kJ/mol. Then the Z parameter can be expressed as,
Z = ε ˙ exp ( 408.498 × 10 3 R T )

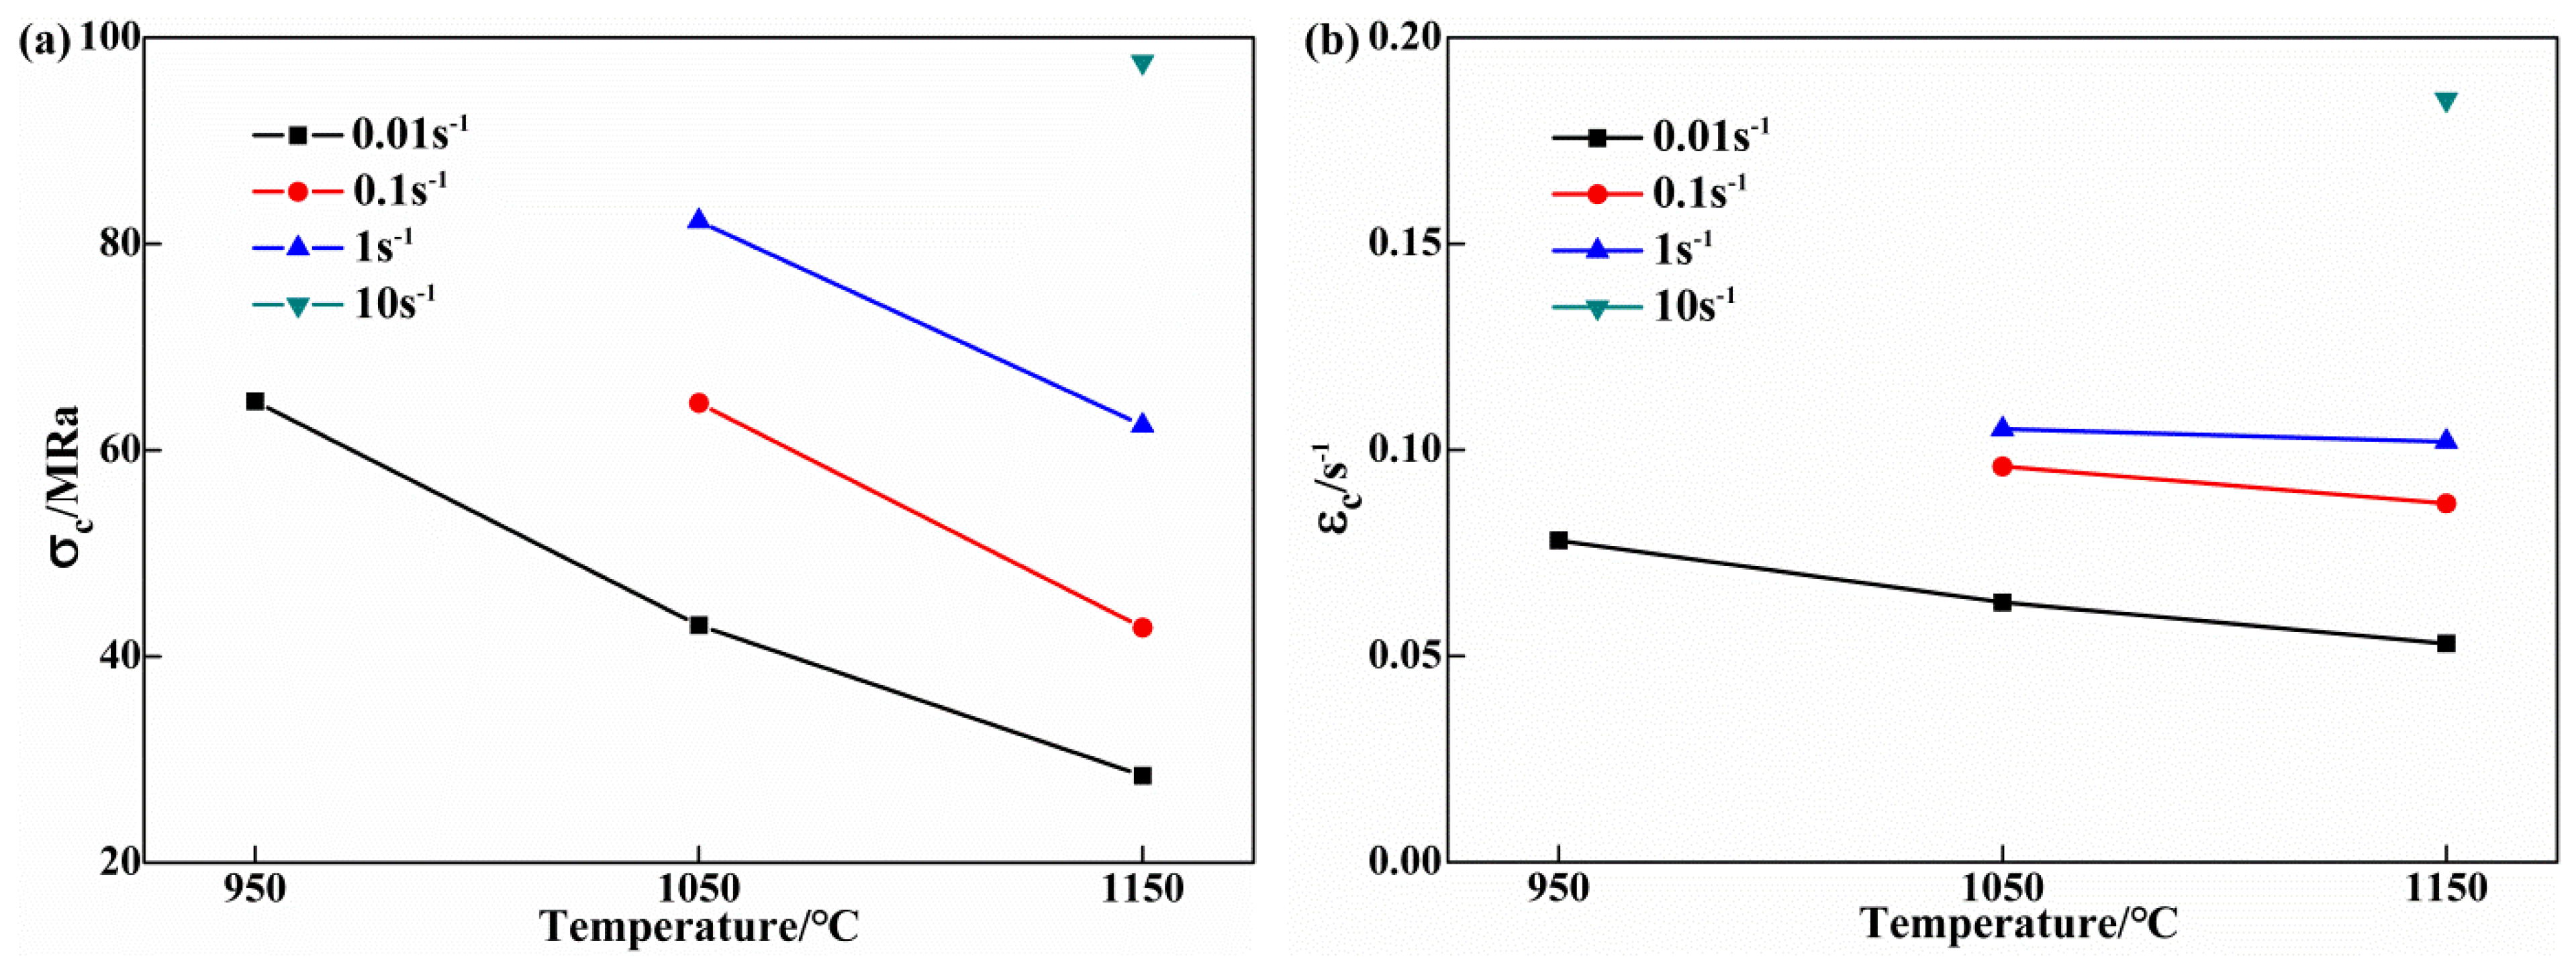
3.4. Critical Stress for Initiation of Dynamic Recrystallization (DRX)

Taking the deformation conditions 1050 °C/0.1 s−1 as an example, due to the rheological curve obtained by the experiment is not a smooth curve in the mathematical sense, the differential curve can cause the irregularities of the differential curve and affect the analysis of the data. In this case, the stress–strain curve (0 to peak strain) is first fitted with nine polynomial functions (Equation (7)), and then the differential operation is performed. This will avoid the effect of data irregularities on the differential operation, as shown in Figure 6.
σ = 8.56328 × 10 10 ε 9 8.00356 × 10 10 ε 8 + 3.22096 × 10 10 ε 7 7.3067 × 10 9 ε 6 + 1.02741 × 10 9 ε 5     9.27781 × 10 7 ε 4 + 5.39153 × 10 6 ε 3 1.96558 × 10 5 ε 2 + 4.386 × 10 3 ε + 1.93894
The stress σ in Figure 6 was derived from 0 to the peak stress σp, and the relationship between the strain hardening rate θ and the true stress σ as shown in Figure 7a is obtained. The curve in the figure was fitted with cubic polynomial to get θ-σ equation:
θ = 3.86 × 10 2 σ 3 + 0.75 × 10 σ 2 4.88 × 10 2 σ + 1.06 × 10 4
Again, the dθ/dσ-σ curve was derived and plotted, as shown in Figure 7b. The corresponding stress σ is the critical strain εc when d2θ/dσ2 = 0. Then the critical stress σc of 35CrMo steel is obtained as follows:
σ c = 7.5 0.0386 × 3 = 64.77 ( MPa )
The corresponding critical strain εc is 0.096.
The critical stress and critical strain of DRX of 35CrMo steel at different temperatures and strain rates can be obtained from Figure 8 and Figure 9. It is shown that the inflection point at the critical condition of DRX does not appear at low temperature (850 °C). With the increase of temperature, and at lower strain rate—i.e., 950 °C/0.01 s−1, 1050 °C/(0.01, 0.1, 1 s−1)—the existence of inflection point was observed on the θ-σ curves. After the temperature reached 1150 °C, DRX occurred all conditions before the peak stress appeared. This proves that the high temperature and low strain rate is favorable for the formation of DRX of 35CrMo steel. Table 2 shows the value of the inflection point on the θ-σ curves’ corresponding critical stress.
Figure 10 shows the curves of critical stress (σc) versus temperature (T) and critical strain (εc) versus T for 35CrMo steel under different deformation conditions. It is shown that the critical stress and critical strain increases with temperature decrease and strain rate increase, showing negative temperature sensitivity and positive strain rate sensitivity. This is because, at the same deformation temperature, the greater the strain rate, the shorter the deformation time and decreased dislocation density, and the critical strain of the recrystallization increases. As the temperature increases, the internal drive energy becomes larger and the dislocation motion occurs more easily, increasing the likelihood of DRX, so that the critical strain of DRX becomes smaller.
In general, the critical strain model of DRX can be expressed by the following equation [11,24]:
ε c = a 1 ε p
ε p = a Z c
As shown in Figure 11, the plots of εcp and lnεp-lnZ can determine the unknown parameters a and a1 of the Equations (10) and (11), i.e., a = 0.31912, a1 = 7.28 × 10⁻⁴, c = 0.1673 are obtained from linear fit. The critical strain and the peak strain satisfy the relationship: εc = 0.31912 εp, and the mathematical model of peak strain is: εp = 7.28 × 10⁻⁴Z0.17001. Combined with the above two formulas, the critical strain of DRX constitutive model is obtained: εc = 2.32 × 10⁻⁴Z0.1673.

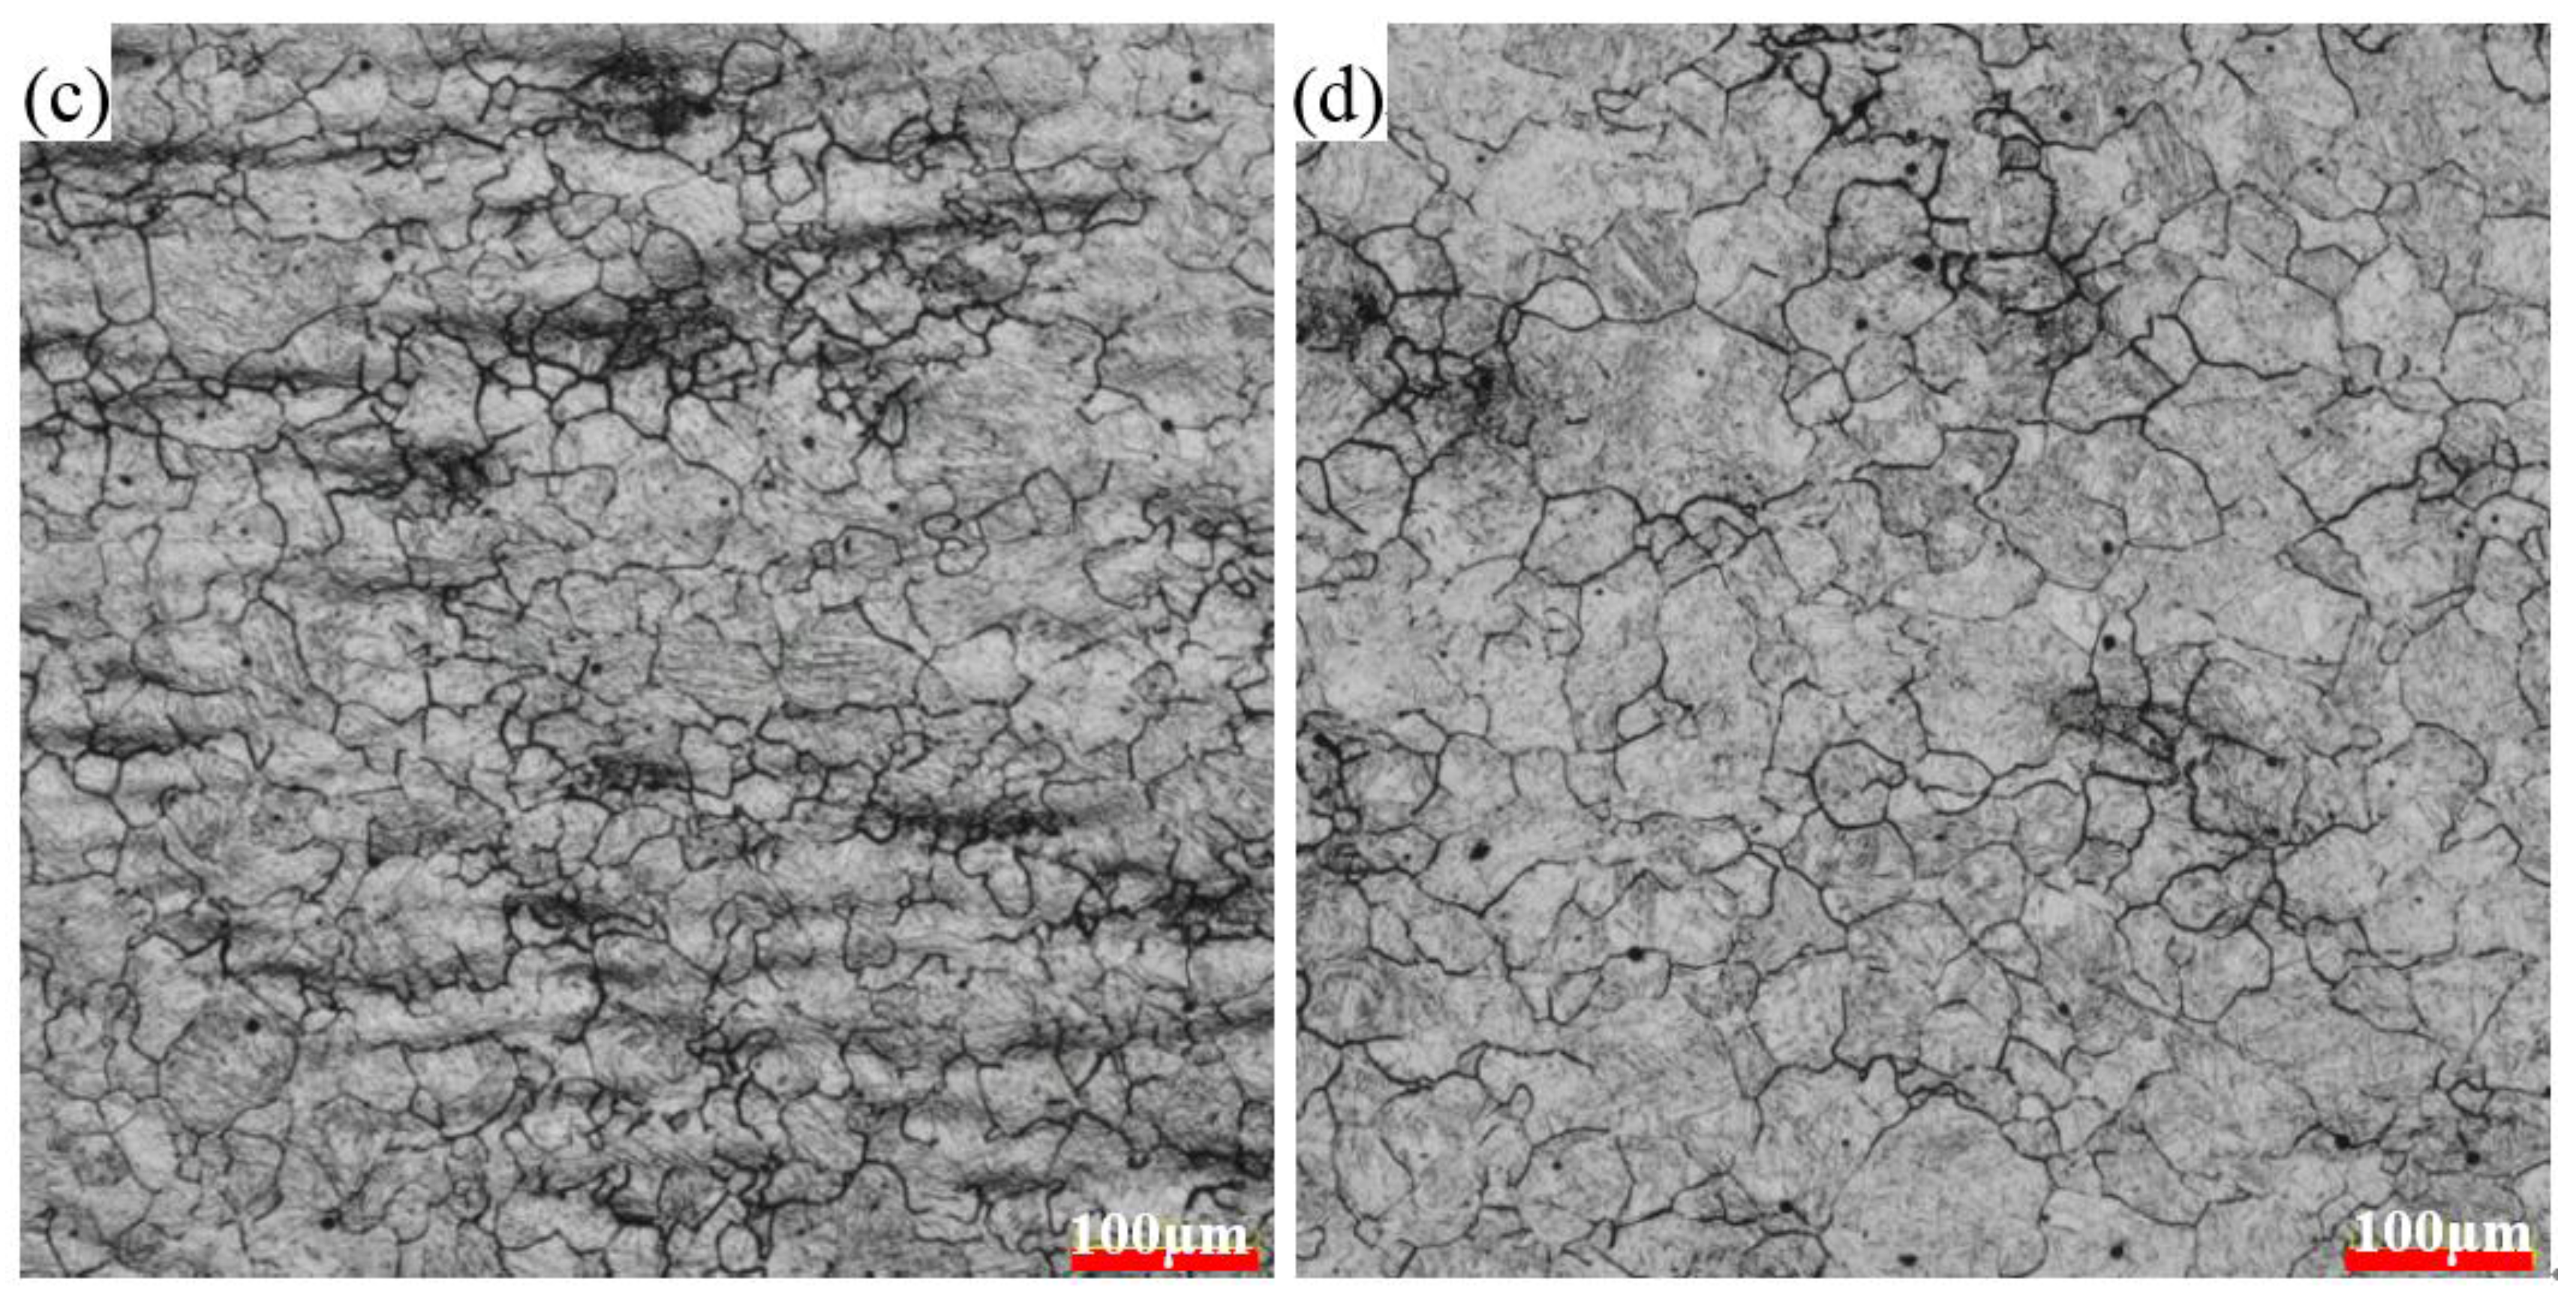
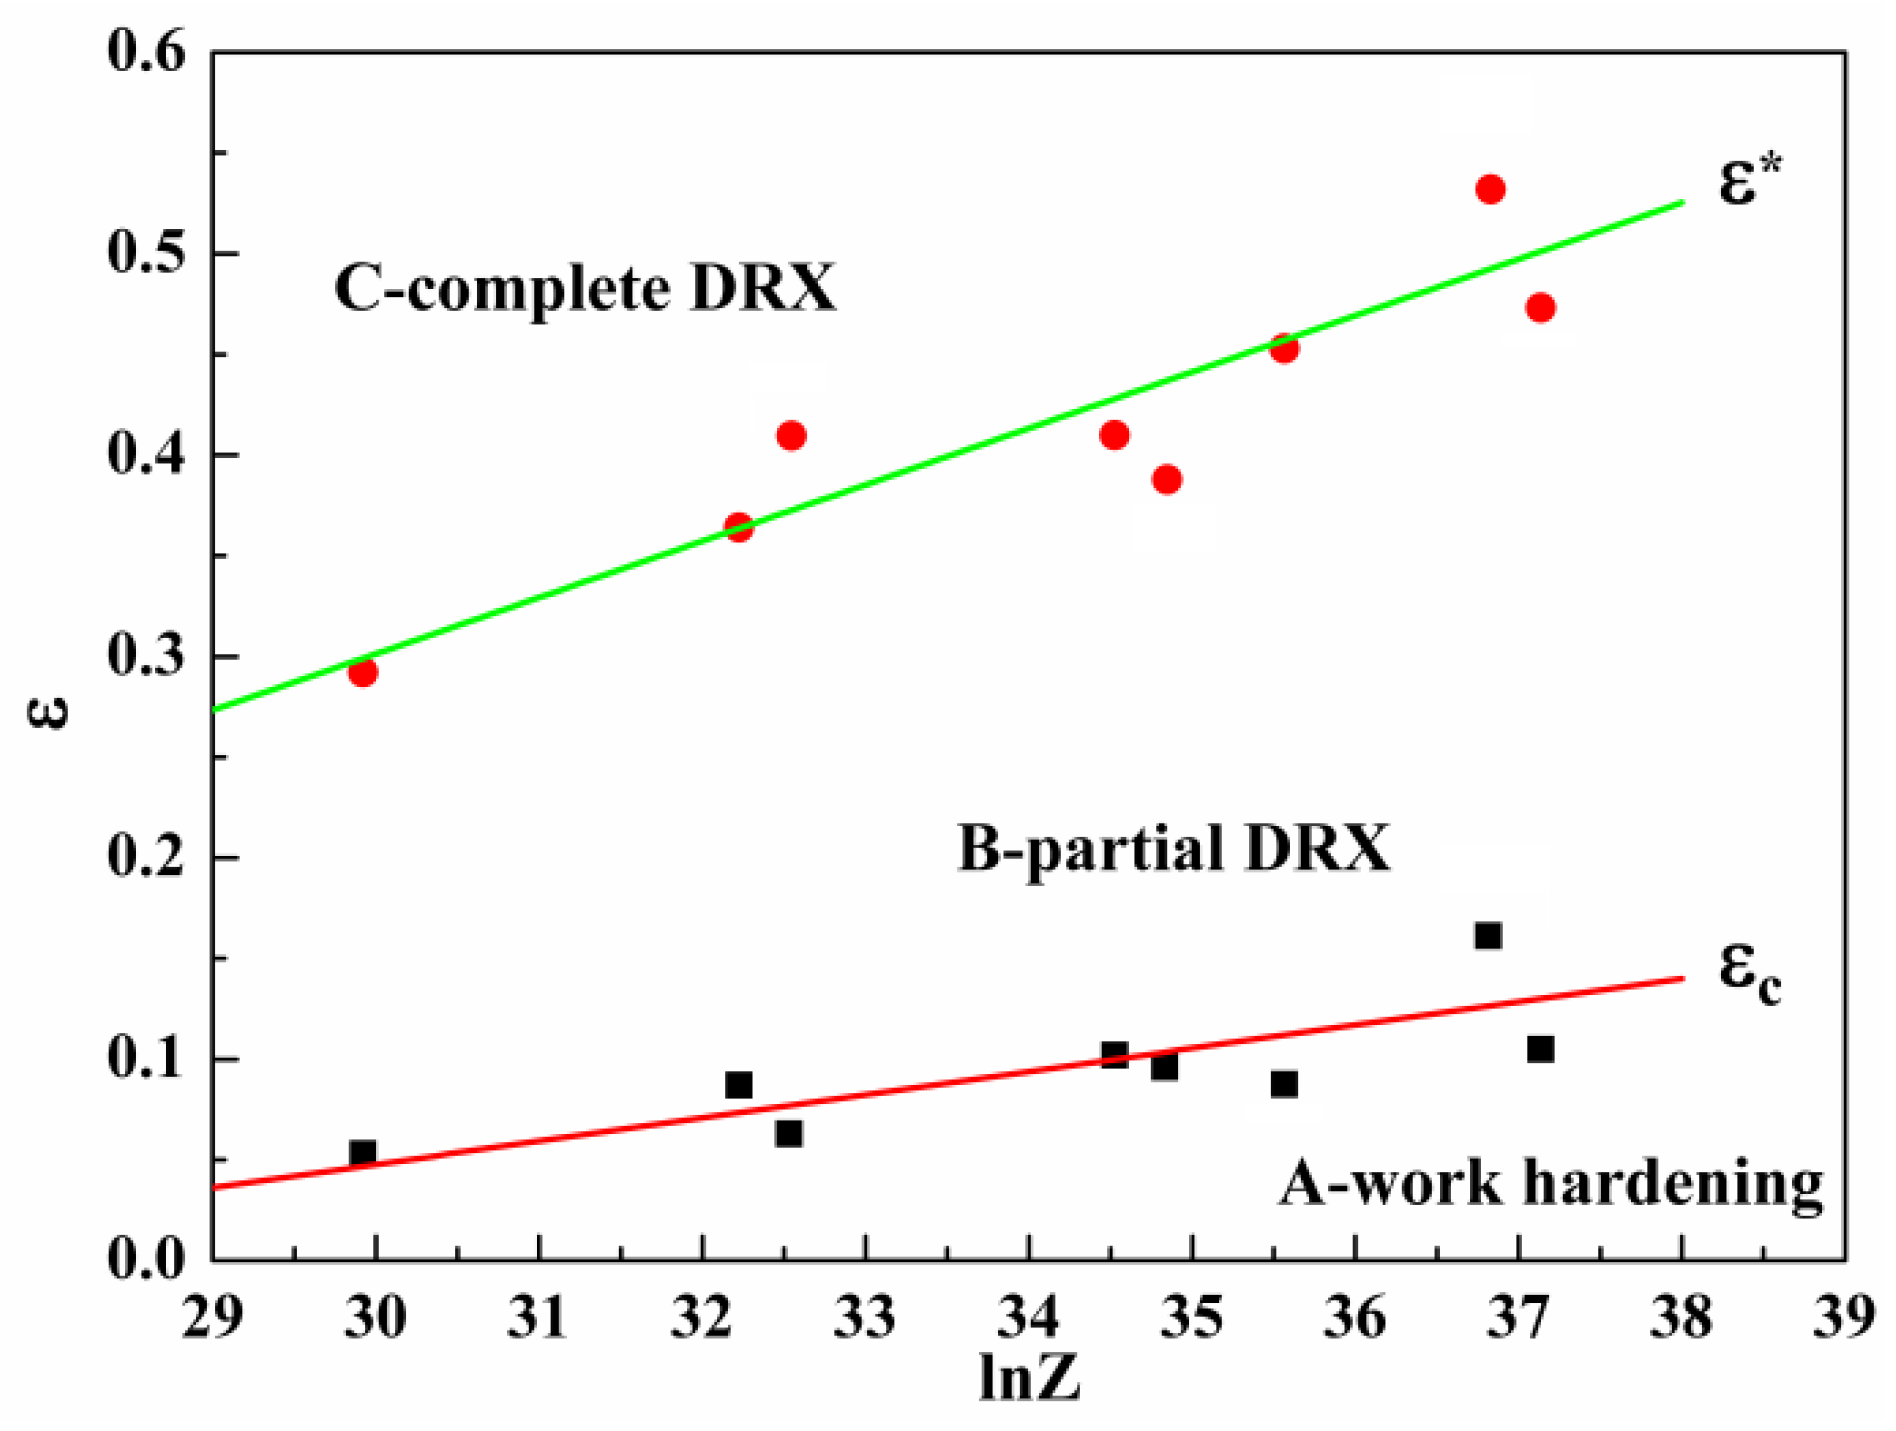
3.5. Microstructure Evolution and DRX State Diagram

Figure 12 shows the relationship between θ and ε deformed at 1050 °C with 0.1 s−1. The corresponding strain A, B, C, and D in the curve are the critical strain (εc), the peak strain (εp), the strain at the maximum softening rate (ε*) and the strain at steady-state flow stress (εs). Figure 13 shows the microstructure corresponding to four points.
In the early stage of deformation, the austenite grains of test steels are crushed and elongated, and the grain boundaries are locally migrated. When the strain reaches the critical strain εc, a small amount of fresh equiaxed dynamic recrystallized grains are deformed (Figure 13a). When the strain reaches the critical strain εc, and the work hardening rate is 0 at this moment, the experimental steel part of the DRX, deformed grains and coexistence of equiaxed recrystallized grains (Figure 13b), and then the DRX softening will be greater than the work hardening effect. When the strain reaches the maximum softening rate at strain ε*, the work hardening is minimized, the DRX is basically completed, and the microstructure is transformed into inhomogeneous recrystallized grains (Figure 13c). With the further increase of the deformation, the softening effect of recrystallization tends to balance the work hardening produced by the increase of the dislocation density, the rheological curve enters the steady state stage, where the microstructure is fully DRX and grows up to equiaxed austenite grains (Figure 13d).
The DRX state diagram of 35CrMo steel is drawn from the experimental data. As shown in Figure 14, where zone A is the work hardening zone, zone B is the partial DRX zone, zone C is the full DRX zone. The influence of strain and Z parameters on the recrystallization of 35CrMo steel was quantitatively described by the DRX state diagram. It can be seen from the DRX state diagram that with increase of Z parameters—i.e., with decreasing deformation temperature and increase of the strain rate, the critical strain of the material gradually increases—that is to say, DRX becomes more difficult.

4. Conclusions

(1)
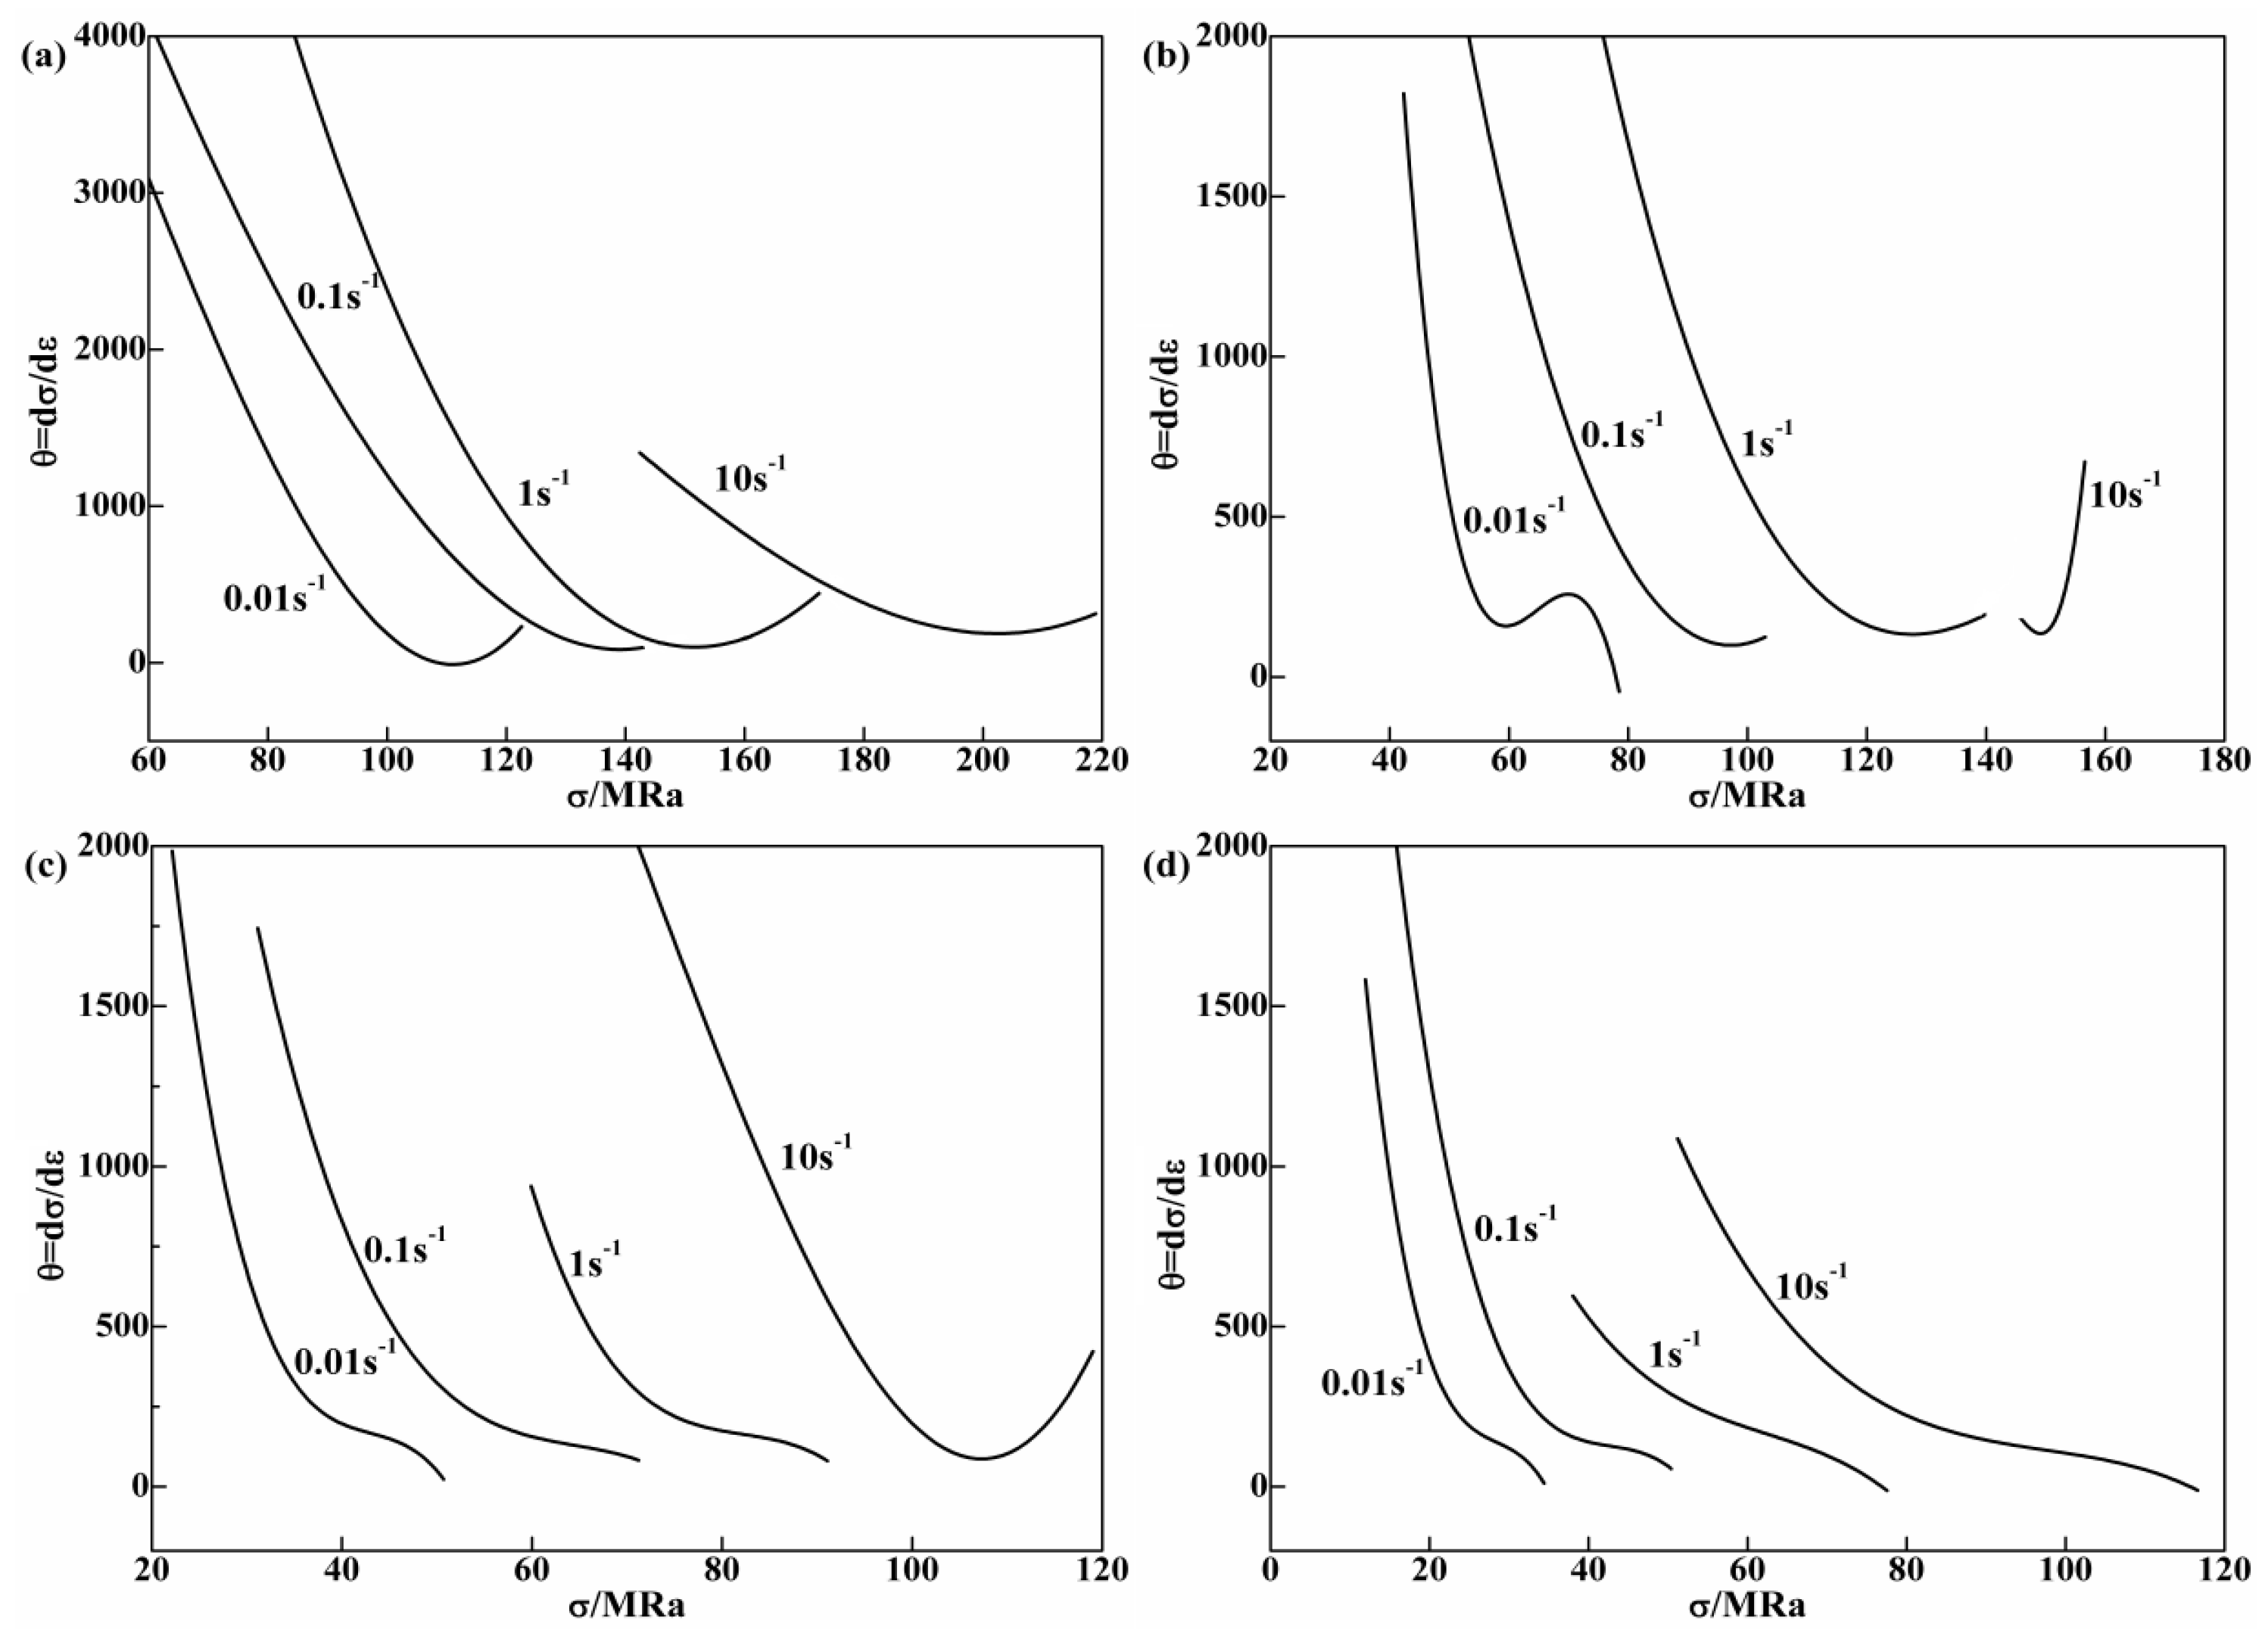
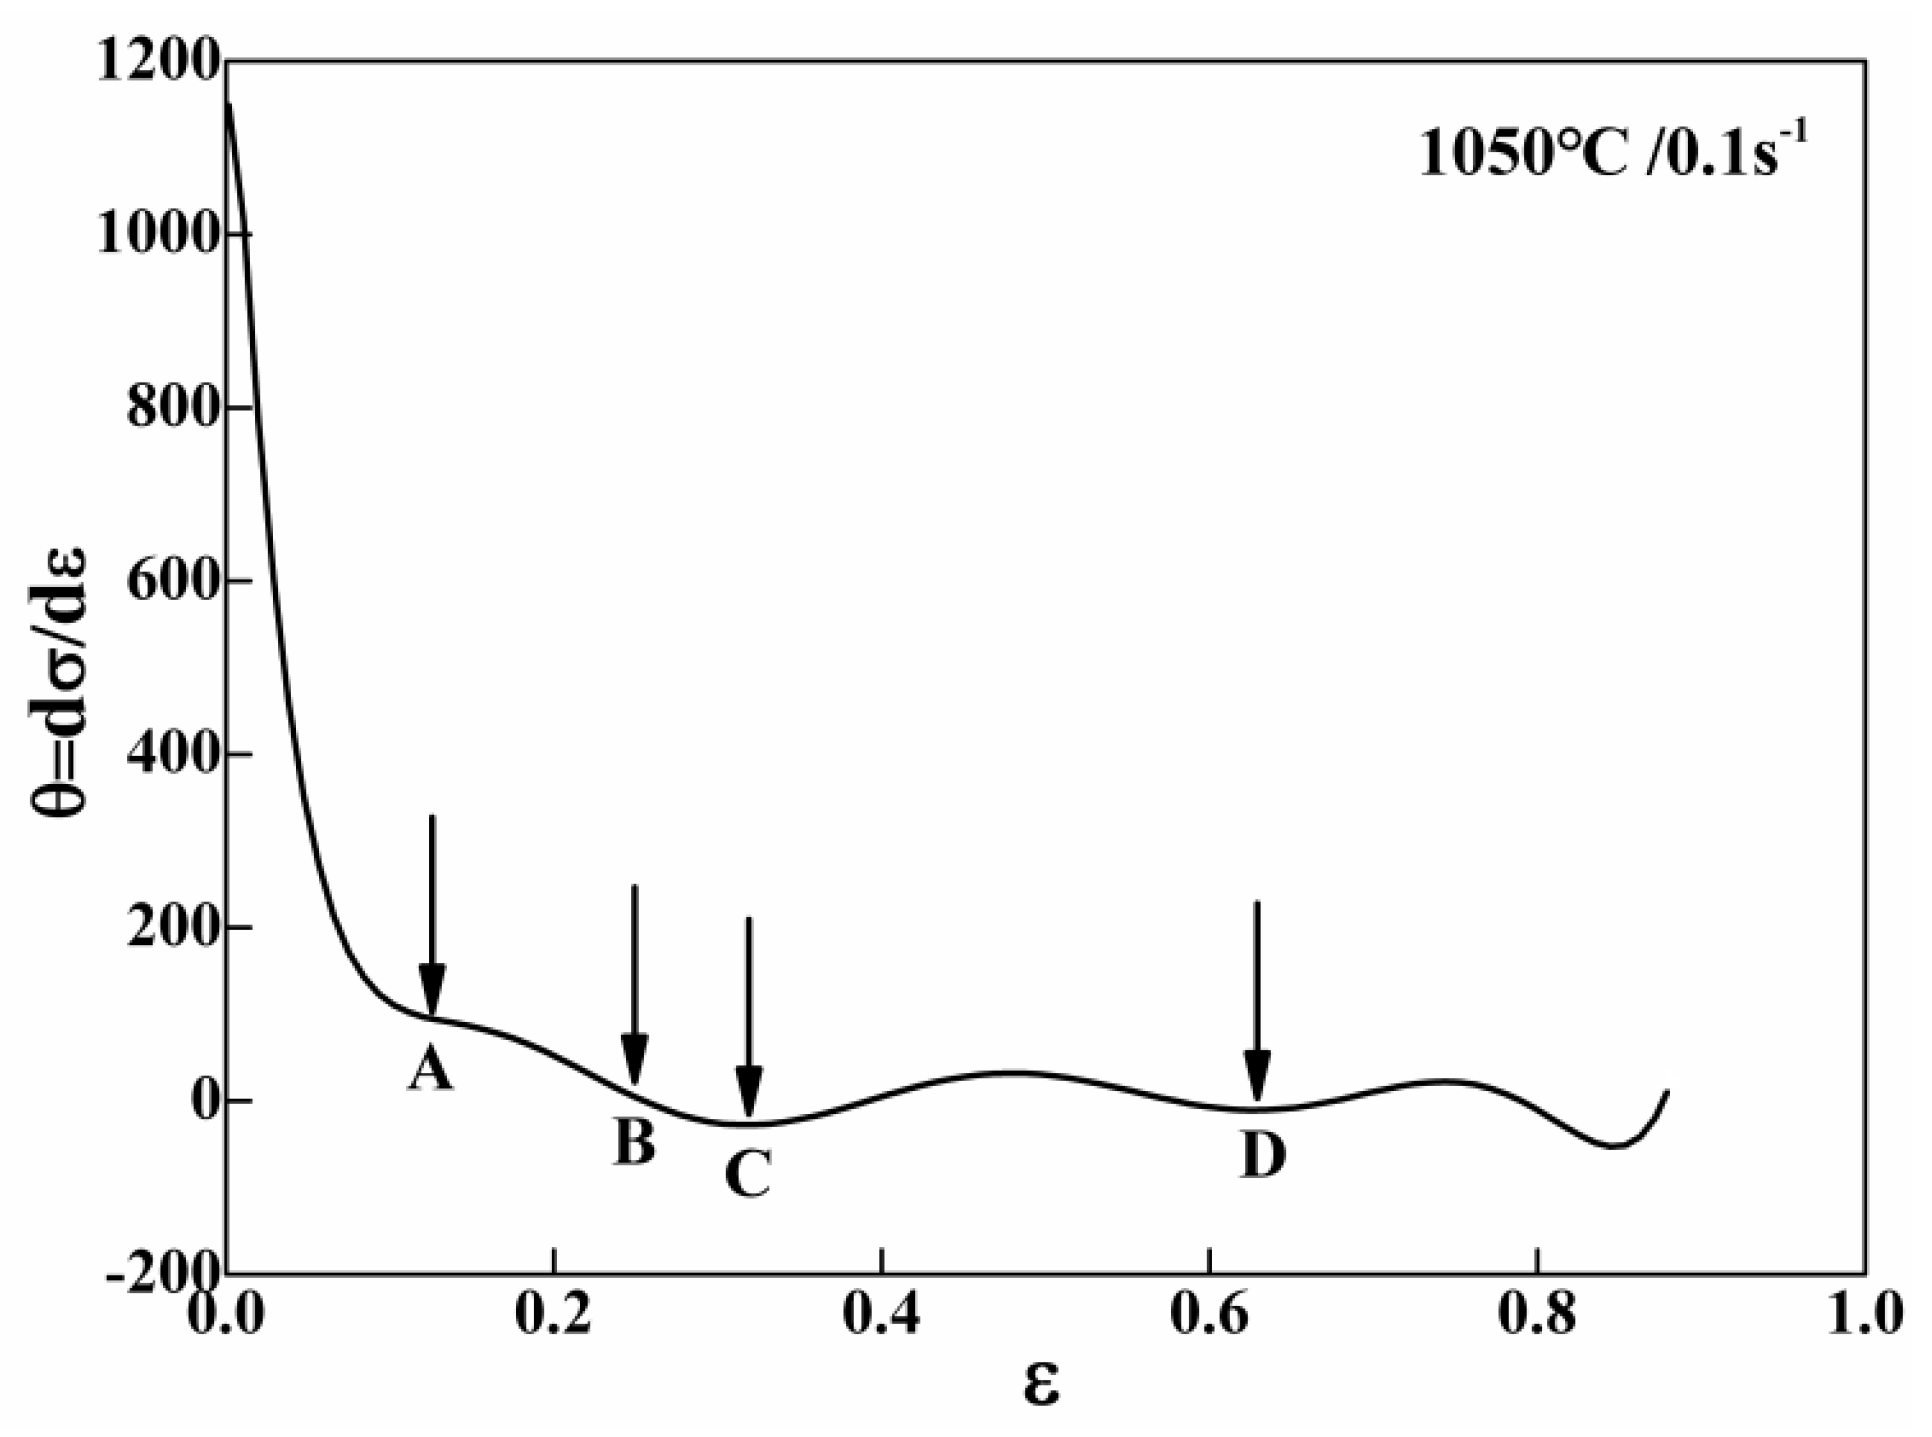
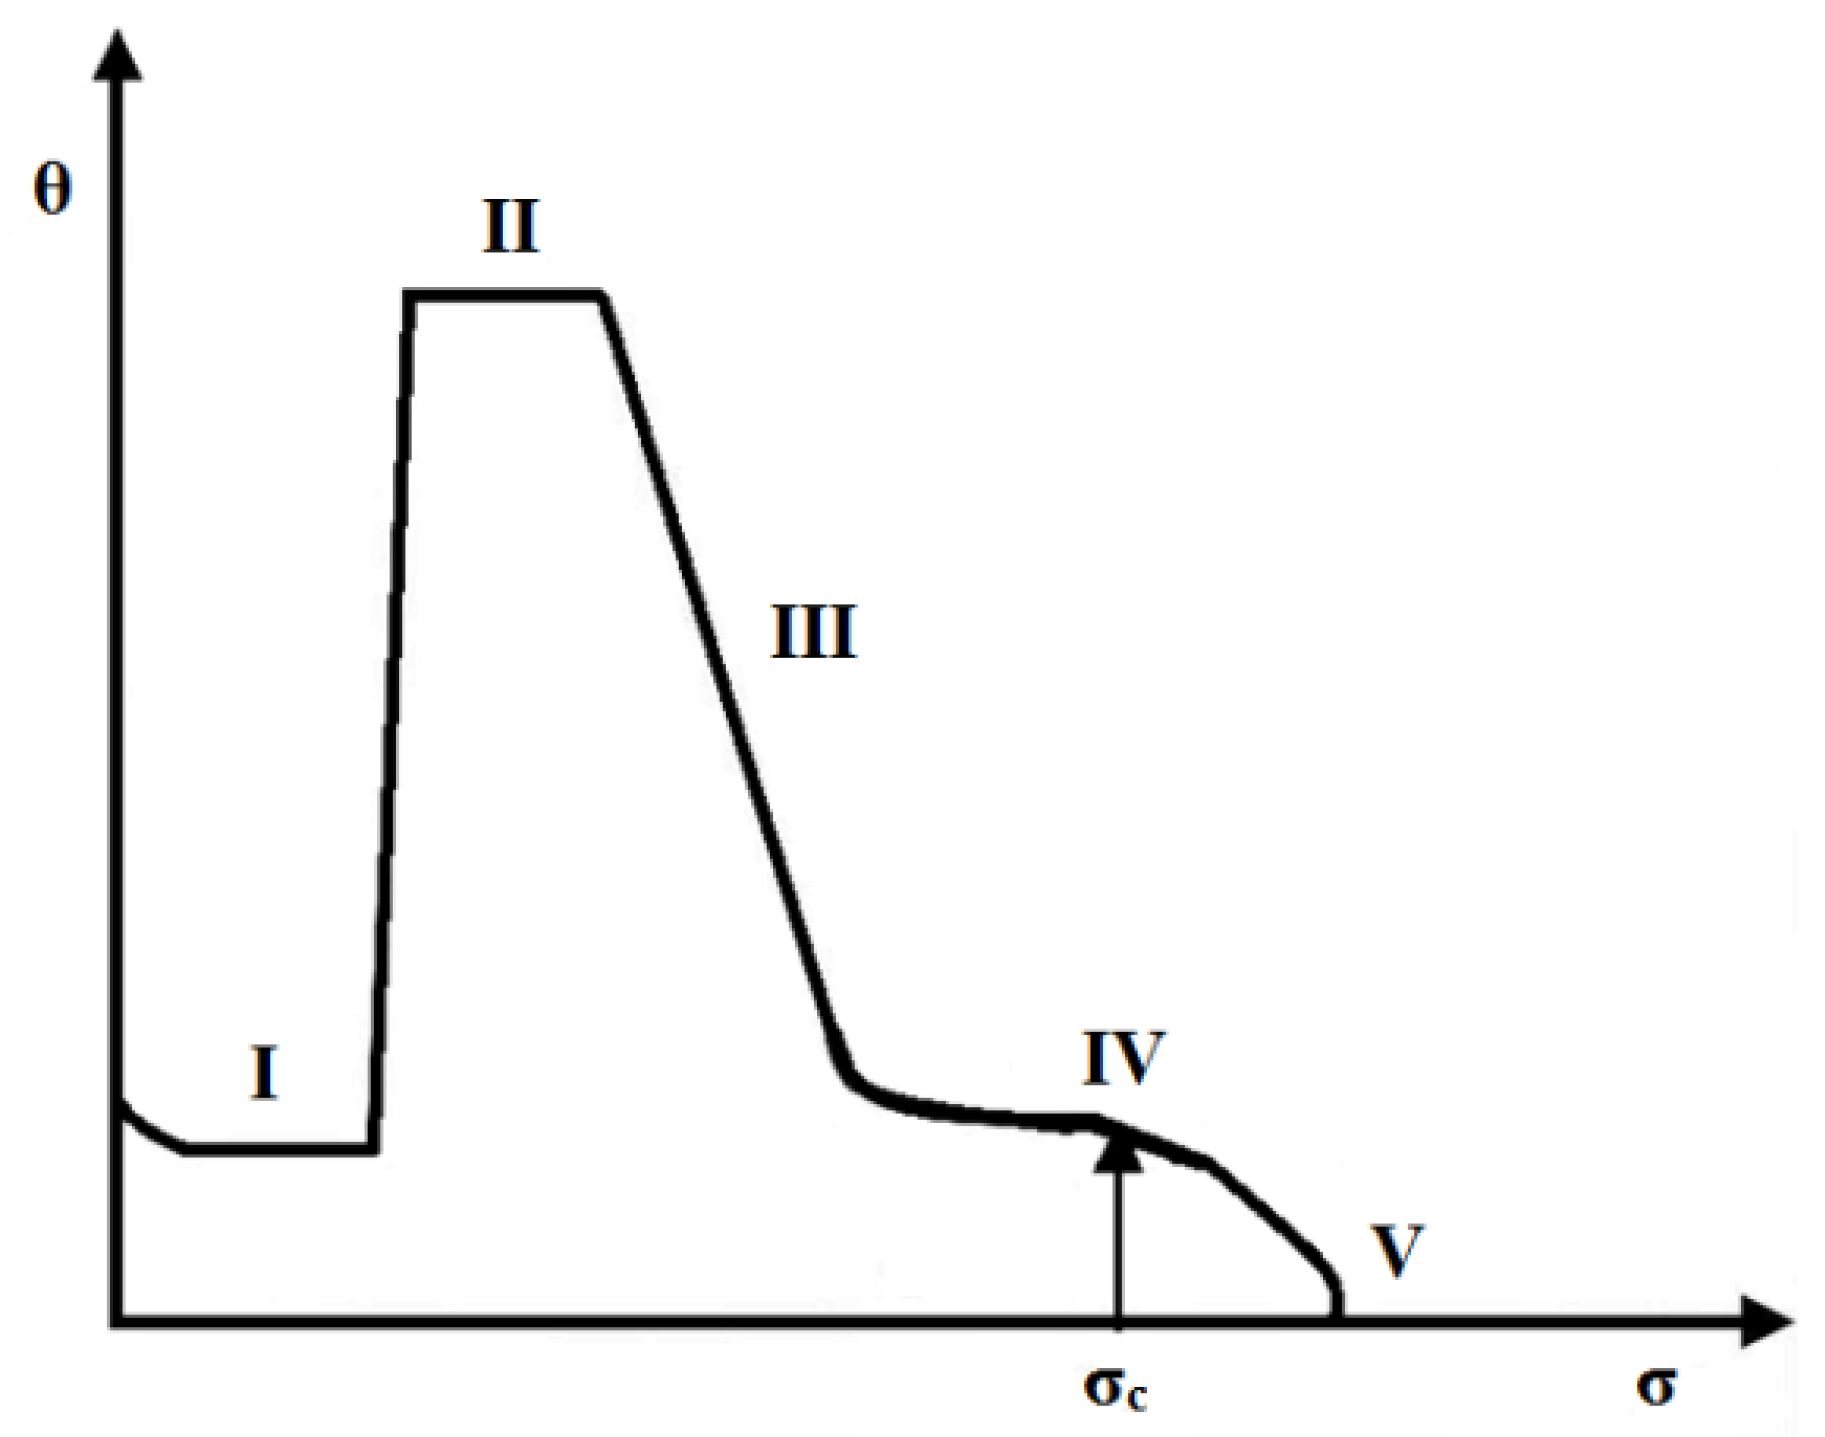
In the work hardening process, the dislocation density accumulated to a certain critical value, microstructural heterogeneity or boundary kinetics may play a role to render a microstructure that behaves stable or unstable at the critical point. Consequently, there will be a point of inflection which can be expressed on the θ-σ curve at the transition from large strain hardening stage to DRX softening stage.
(2)
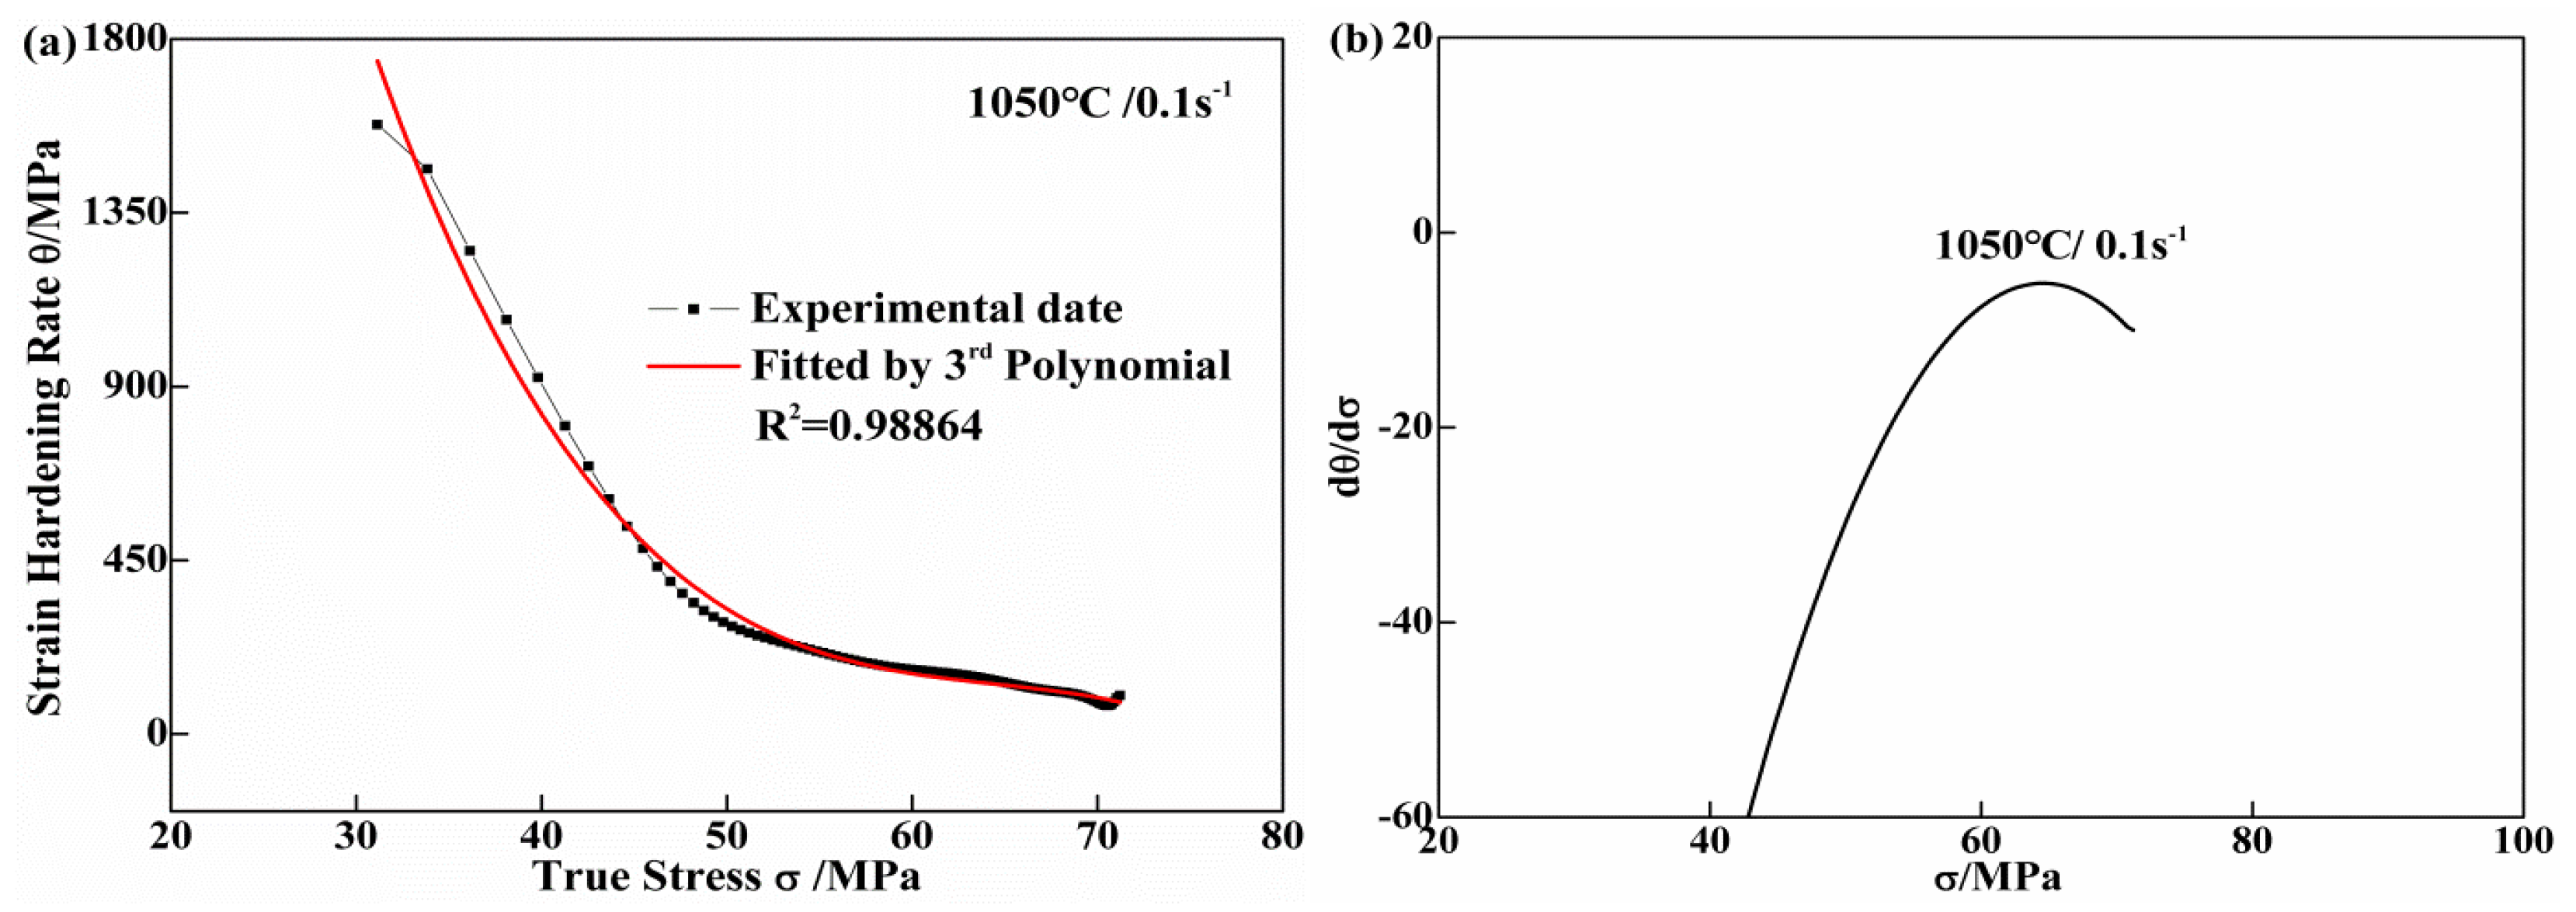
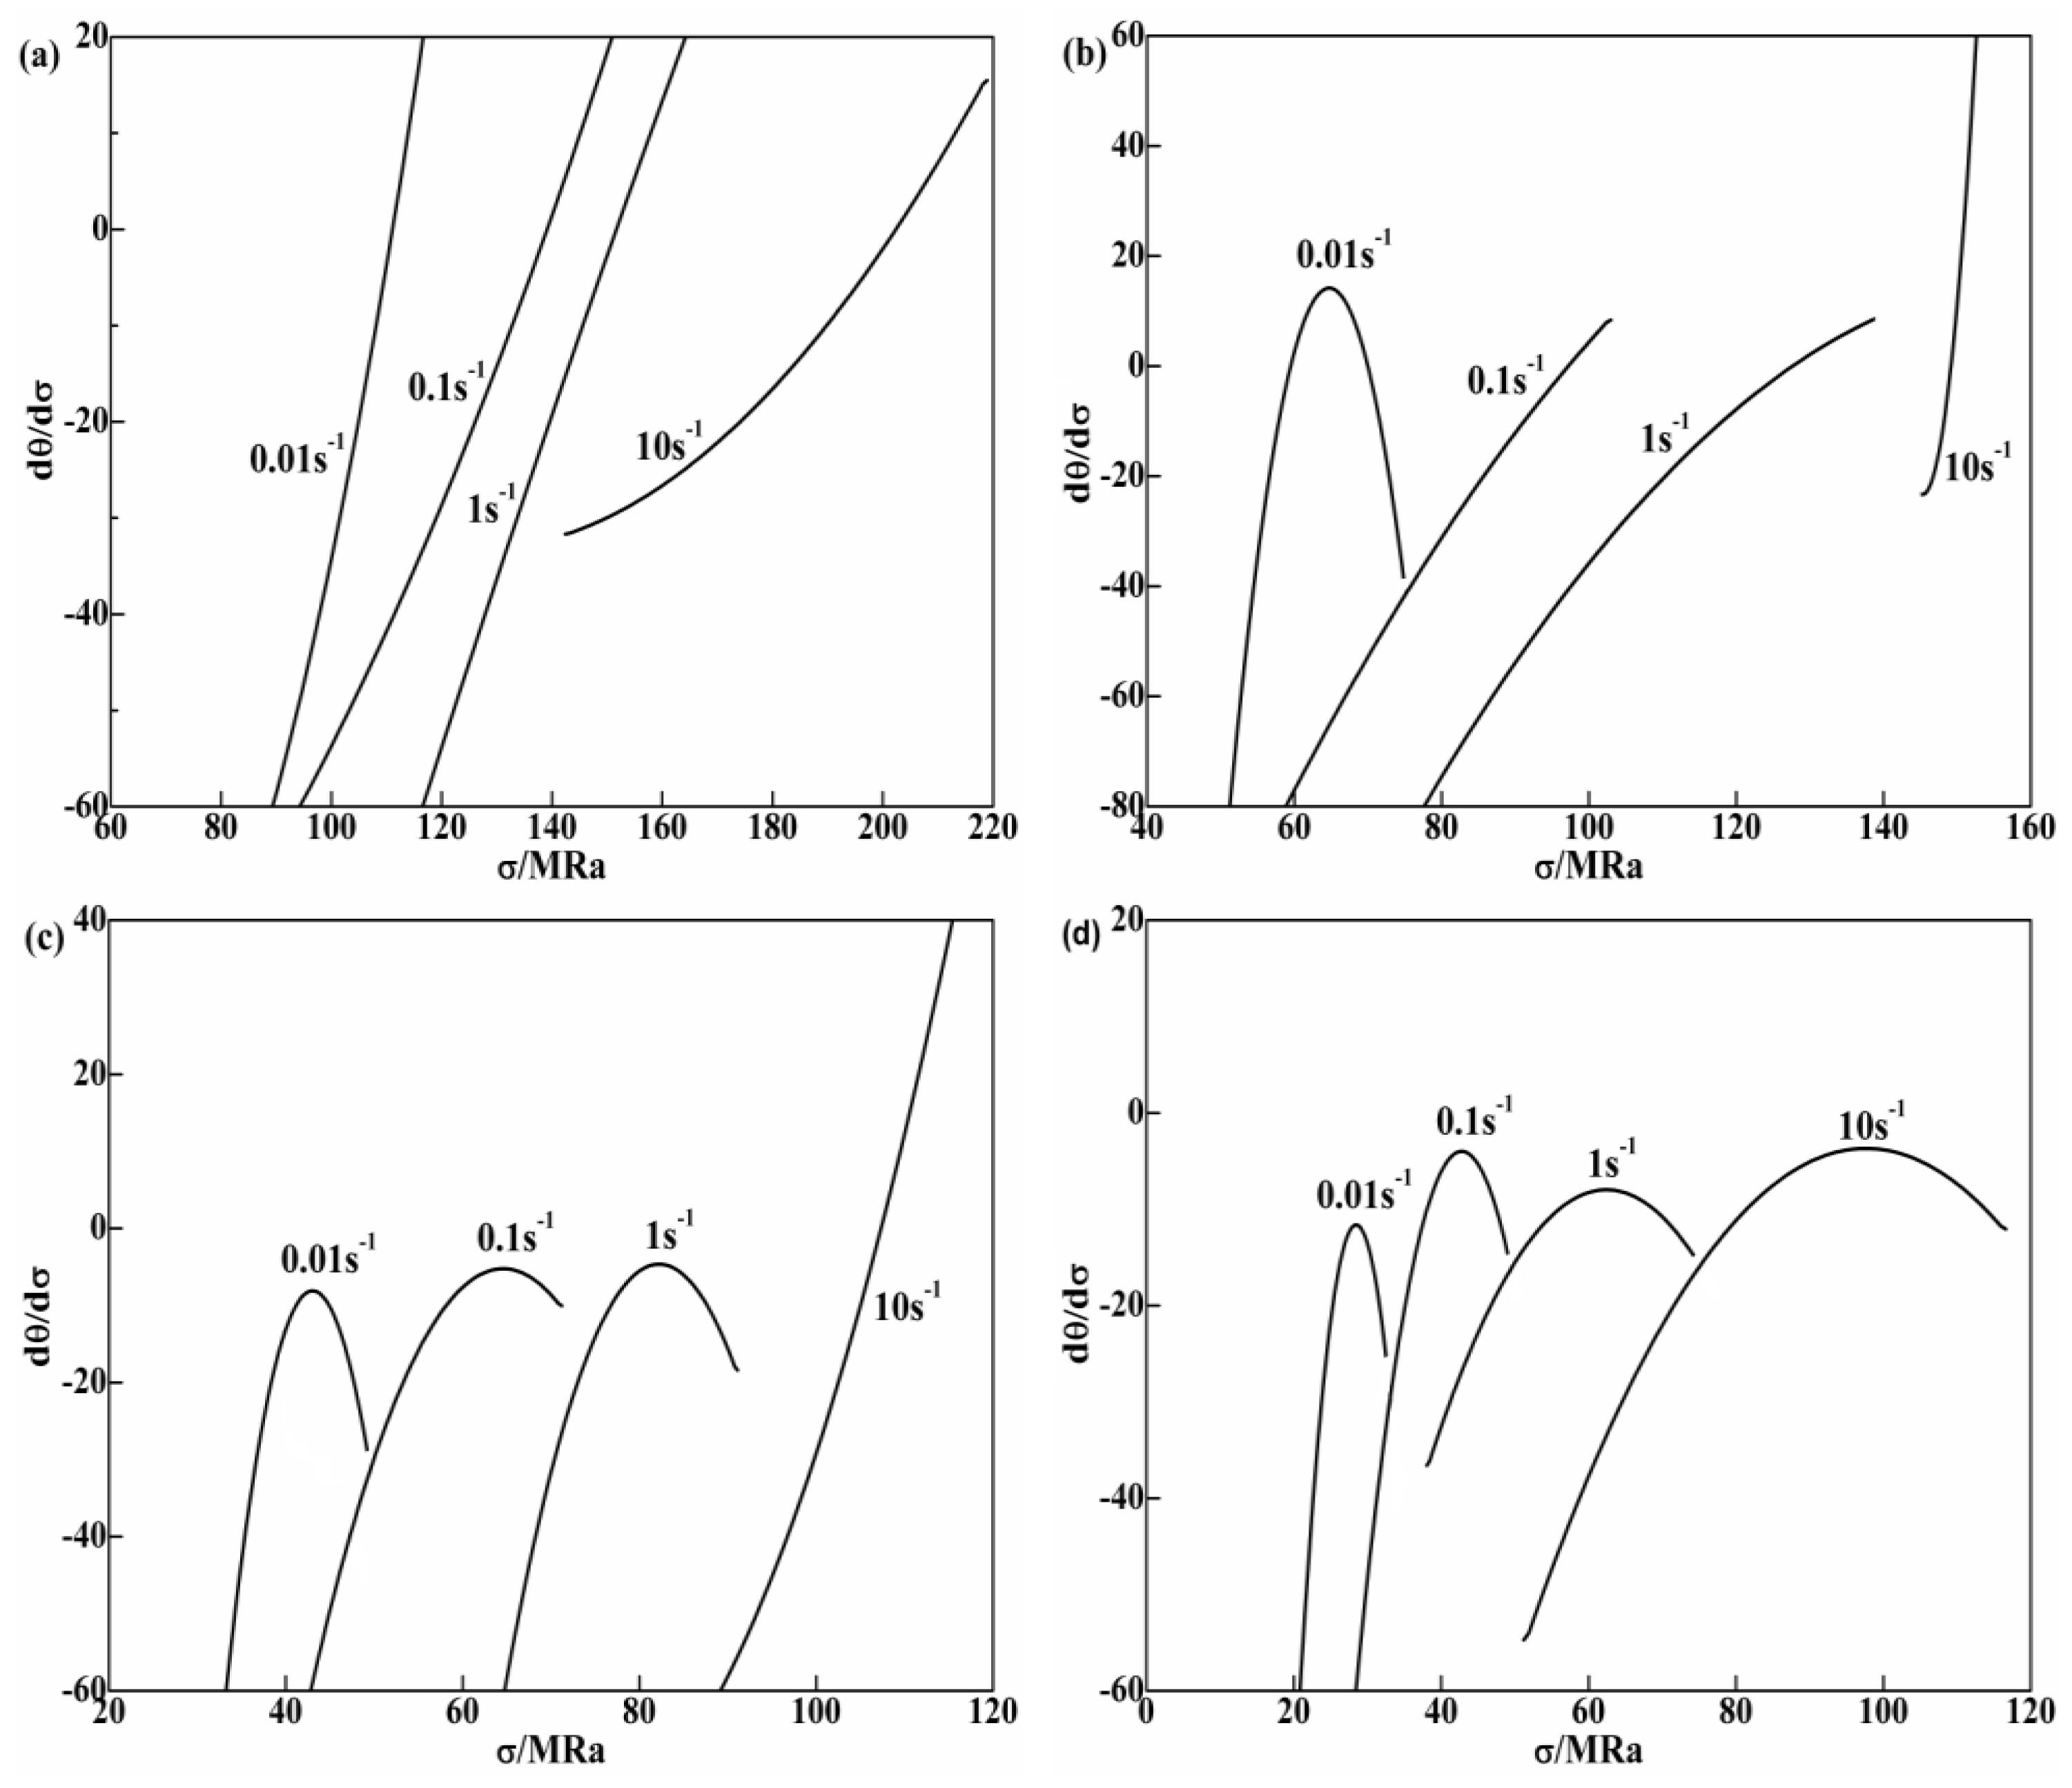
DRV and DRX mechanisms are the softening mechanisms of 35CrMo steel during hot deformation, whose flow curves exhibit DRV and DRX types and followed by a steady-state flow. When the DRX occurs in the 35CrMo steel, the θ-σ curve has an inflection point, and the maximum value appears on the dθ/dσ-σ curve. The critical strain of the DRX of 35CrMo steel can be determined by the inflection point criterion.
(3)
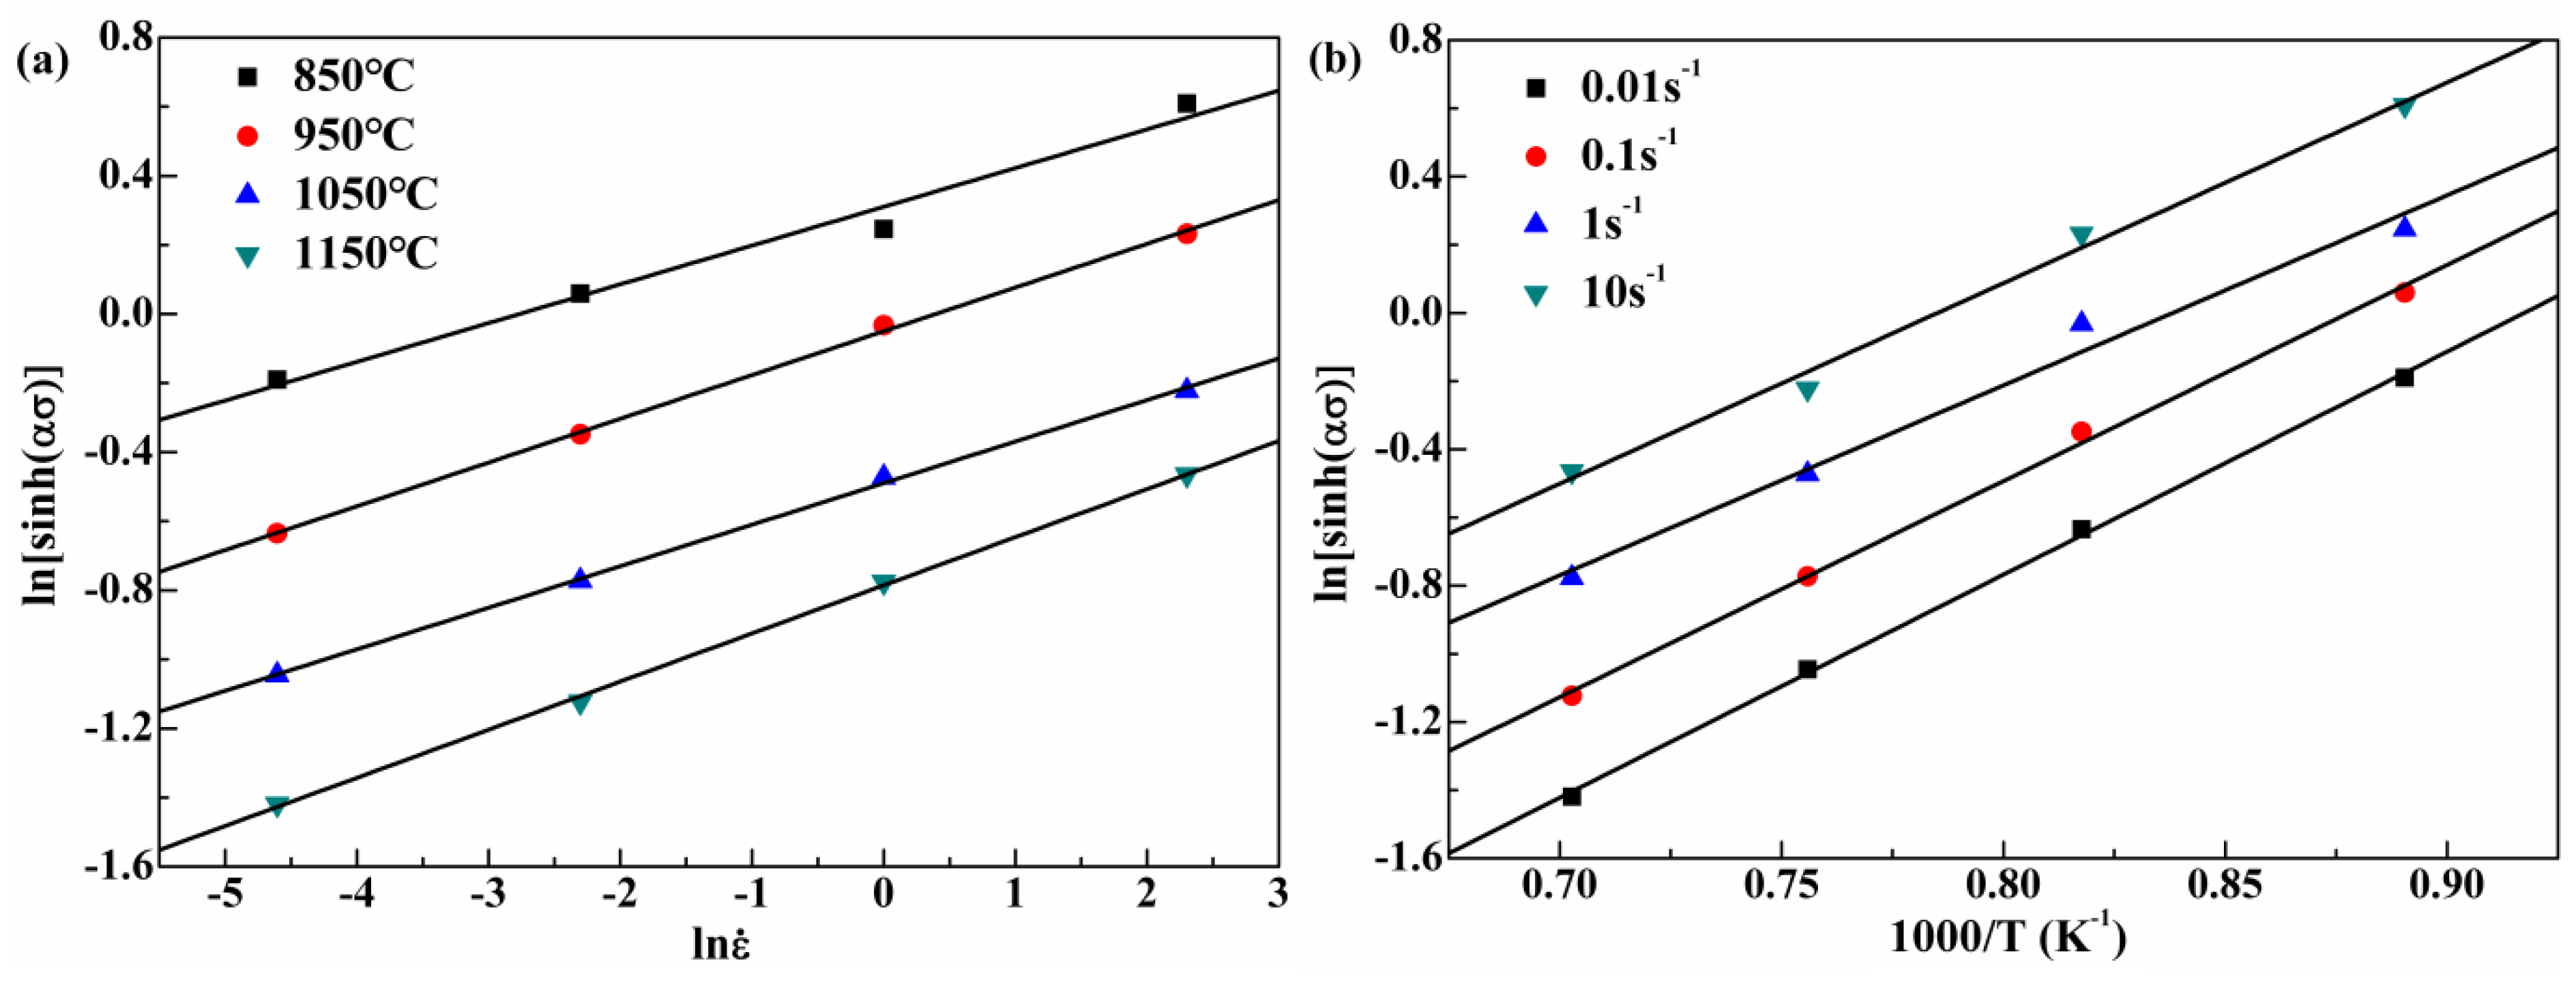
The experimental results show that the activation energy of 35CrMo steel in this paper is Q = 408.498 kJ/mol, and the expression of Z parameter is Z = ε ˙ exp ( 408.498 × 10 3 R T ) .
(4)
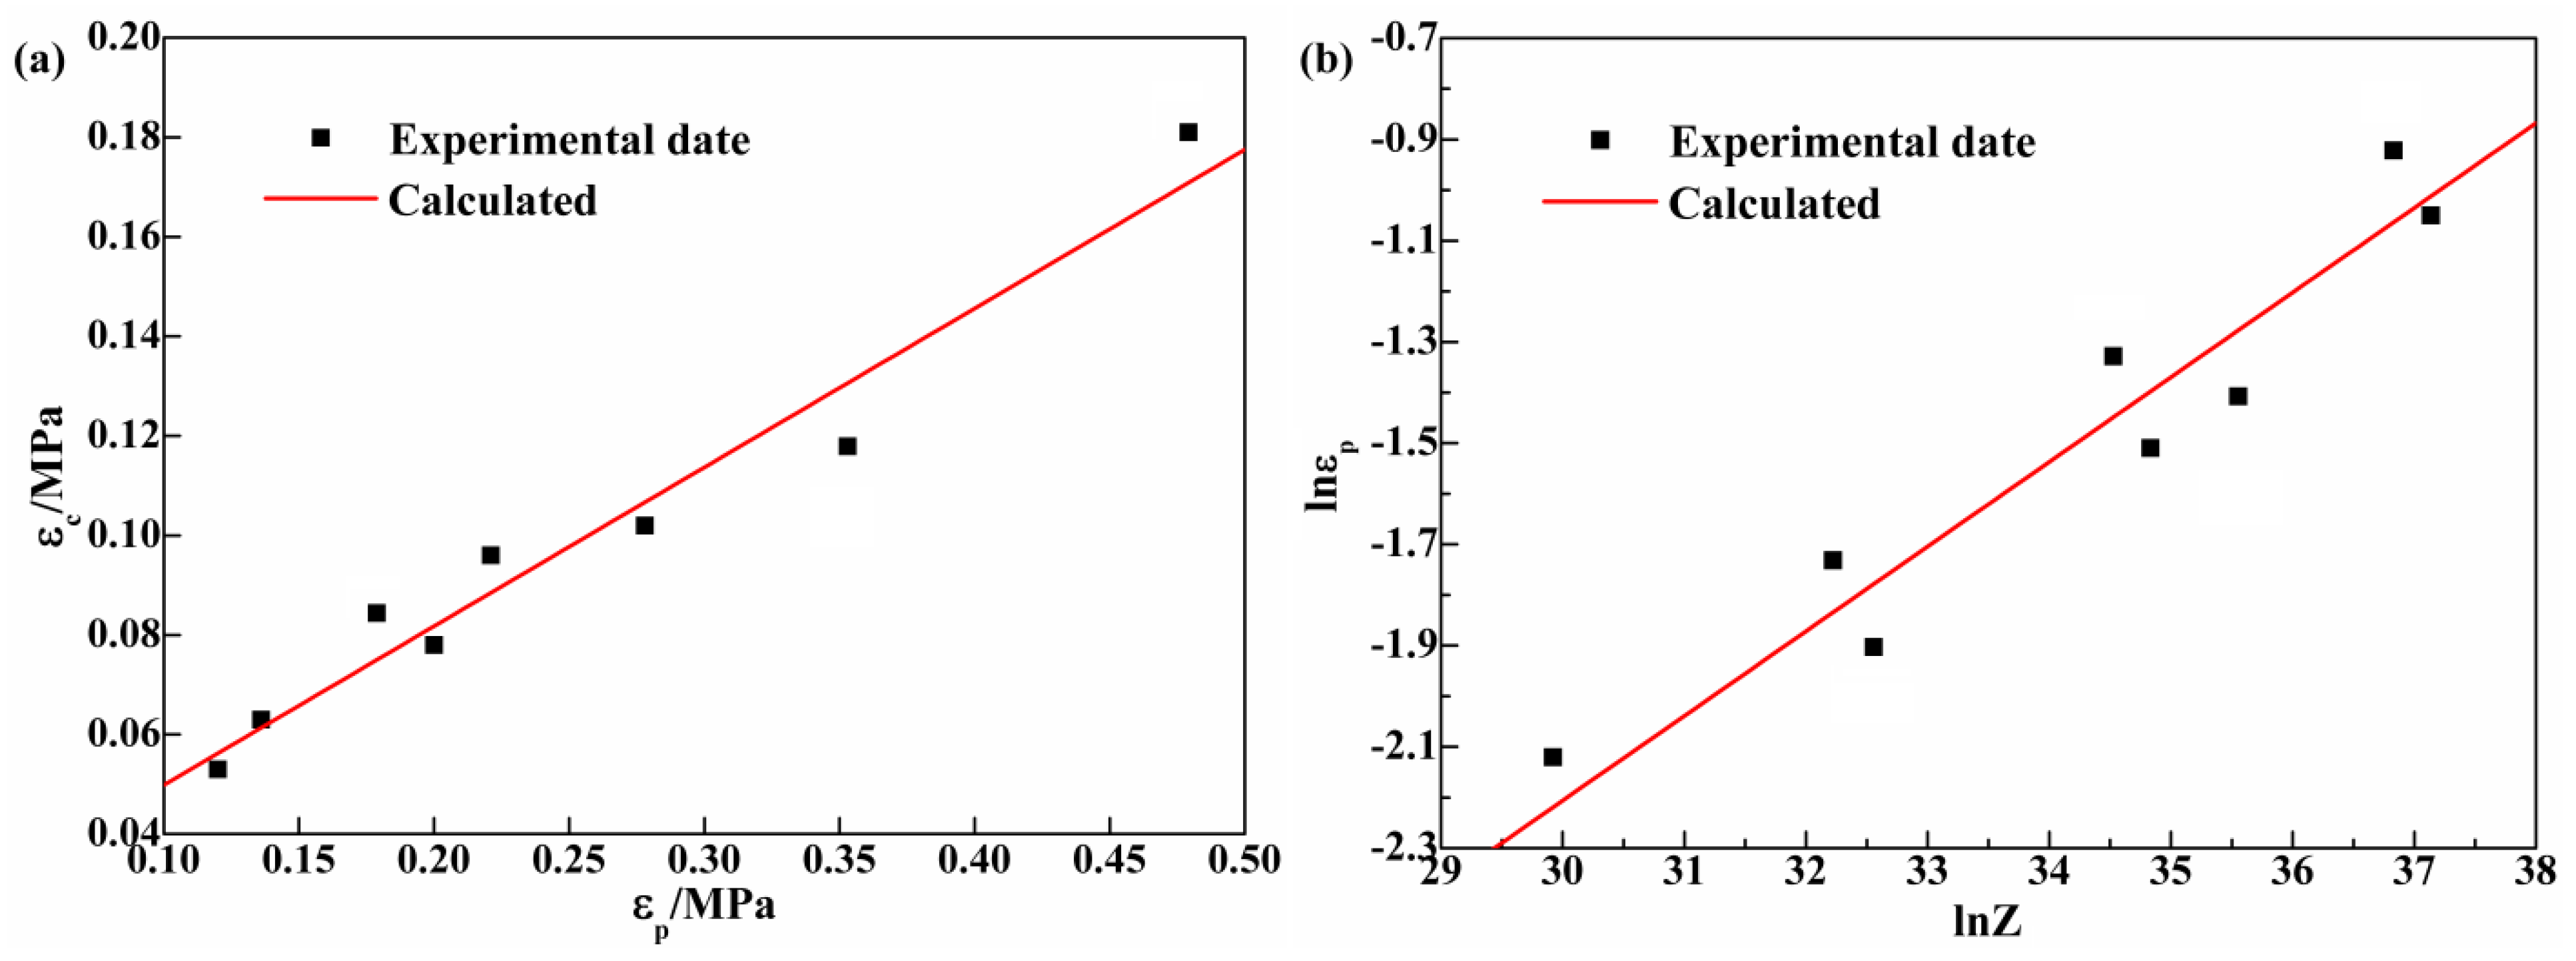
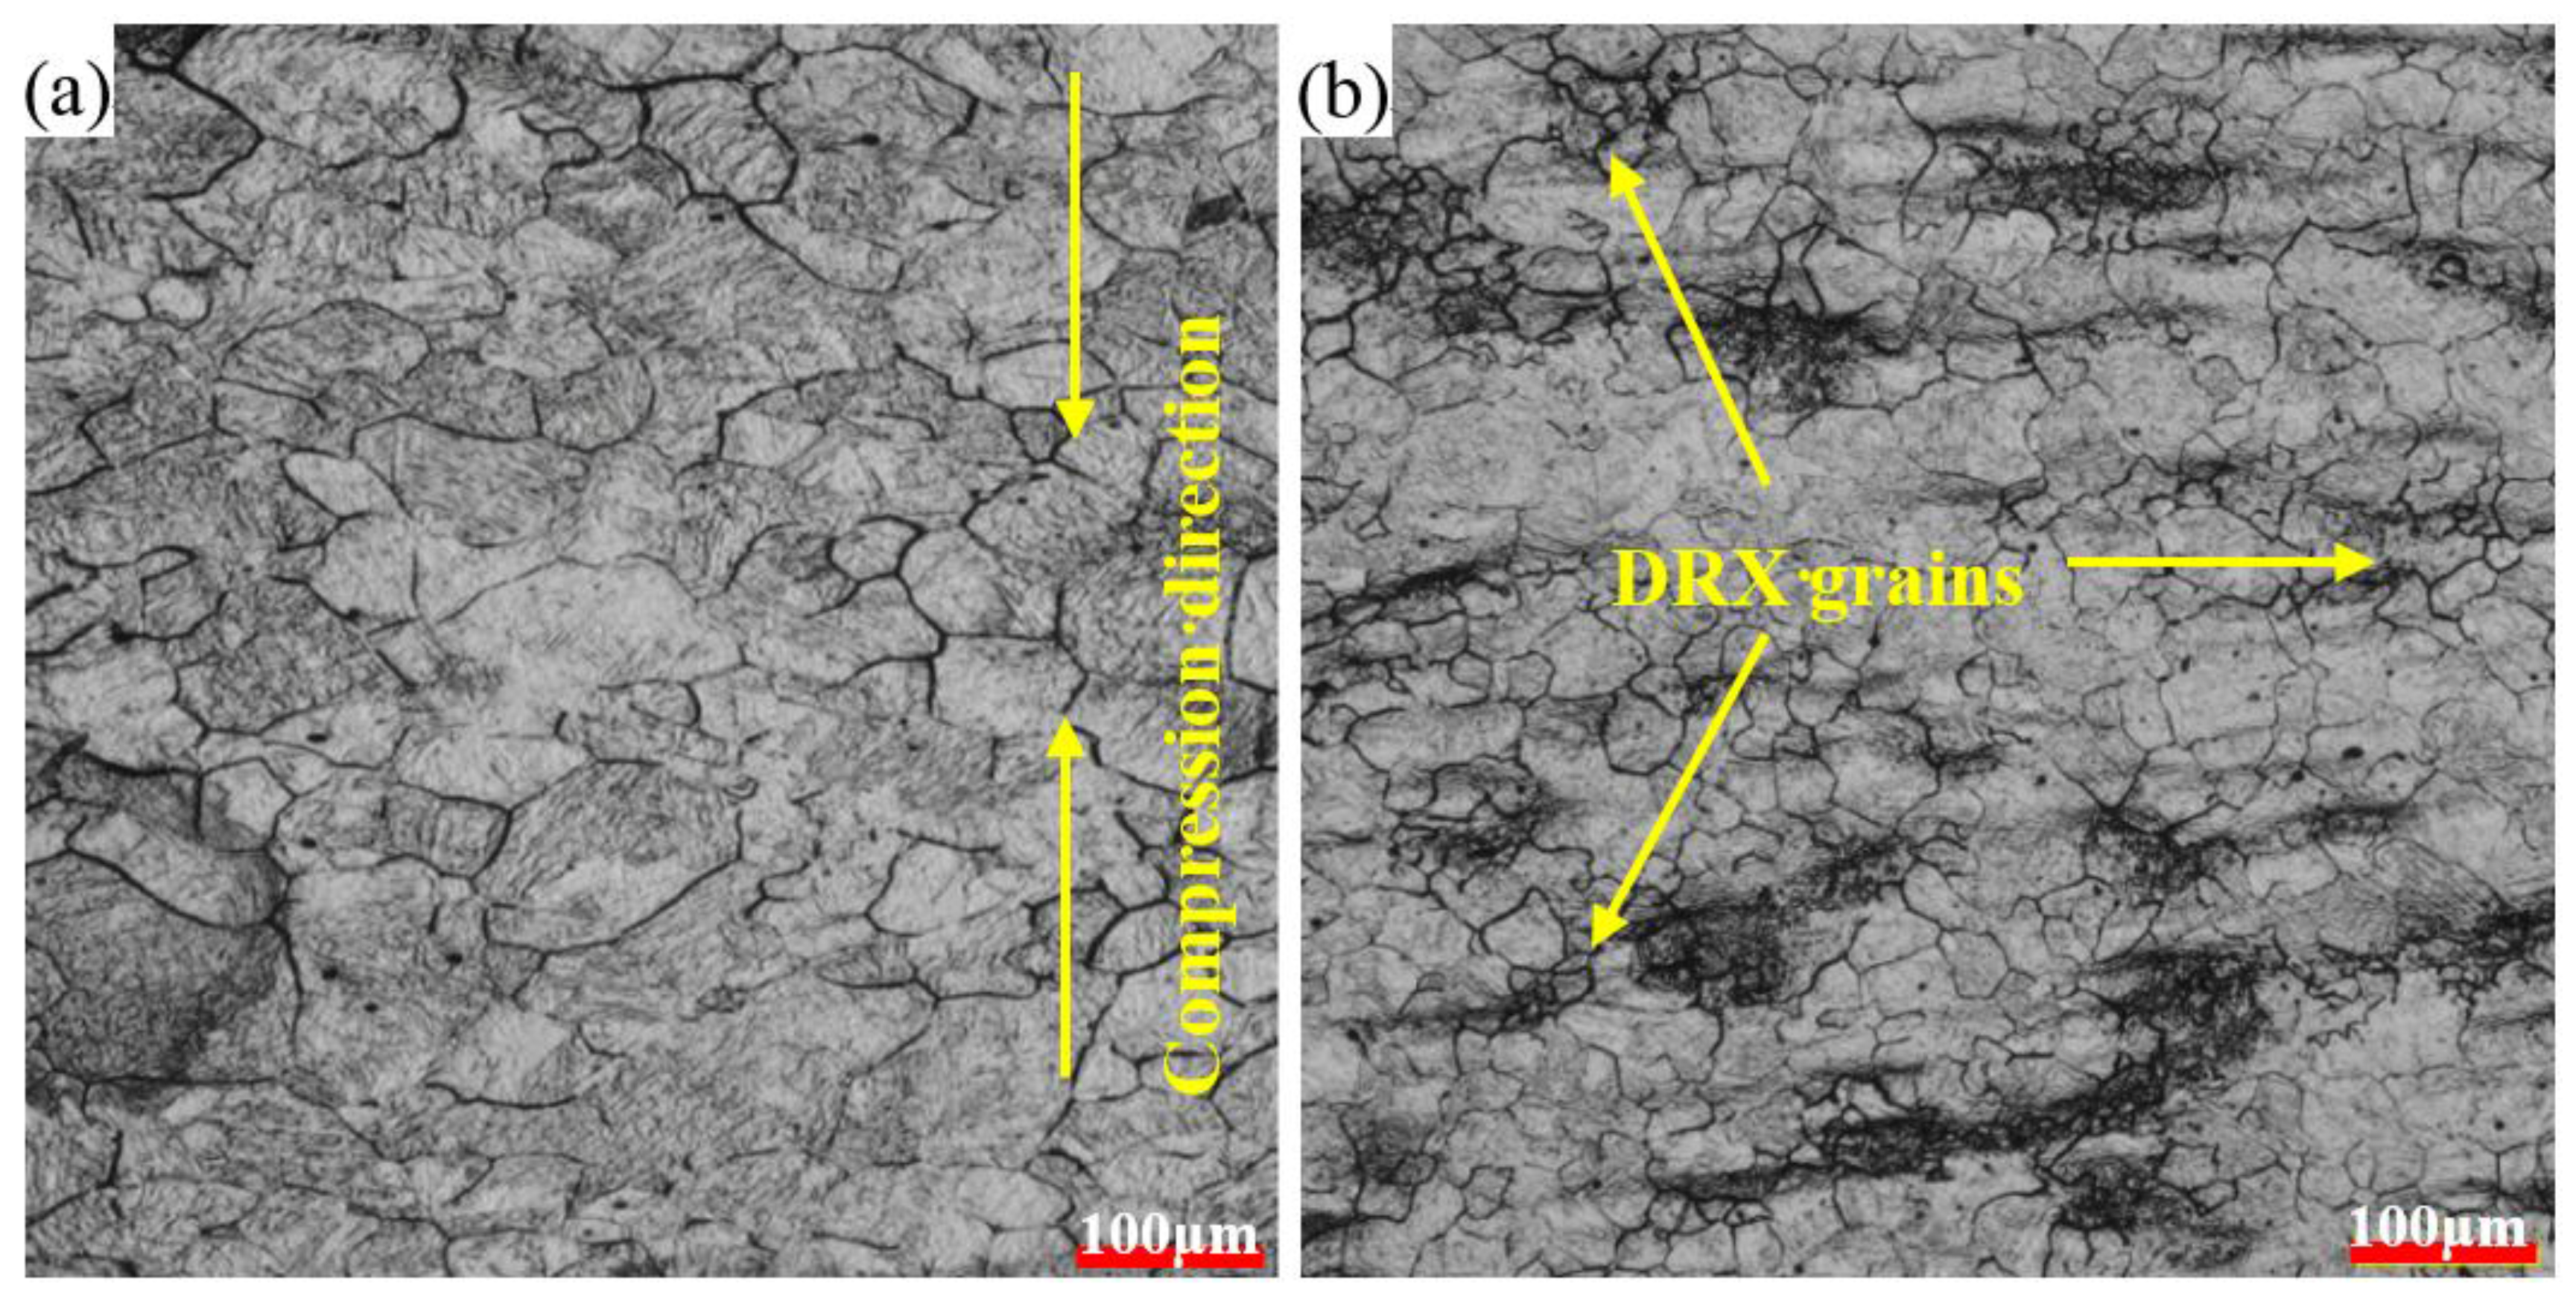
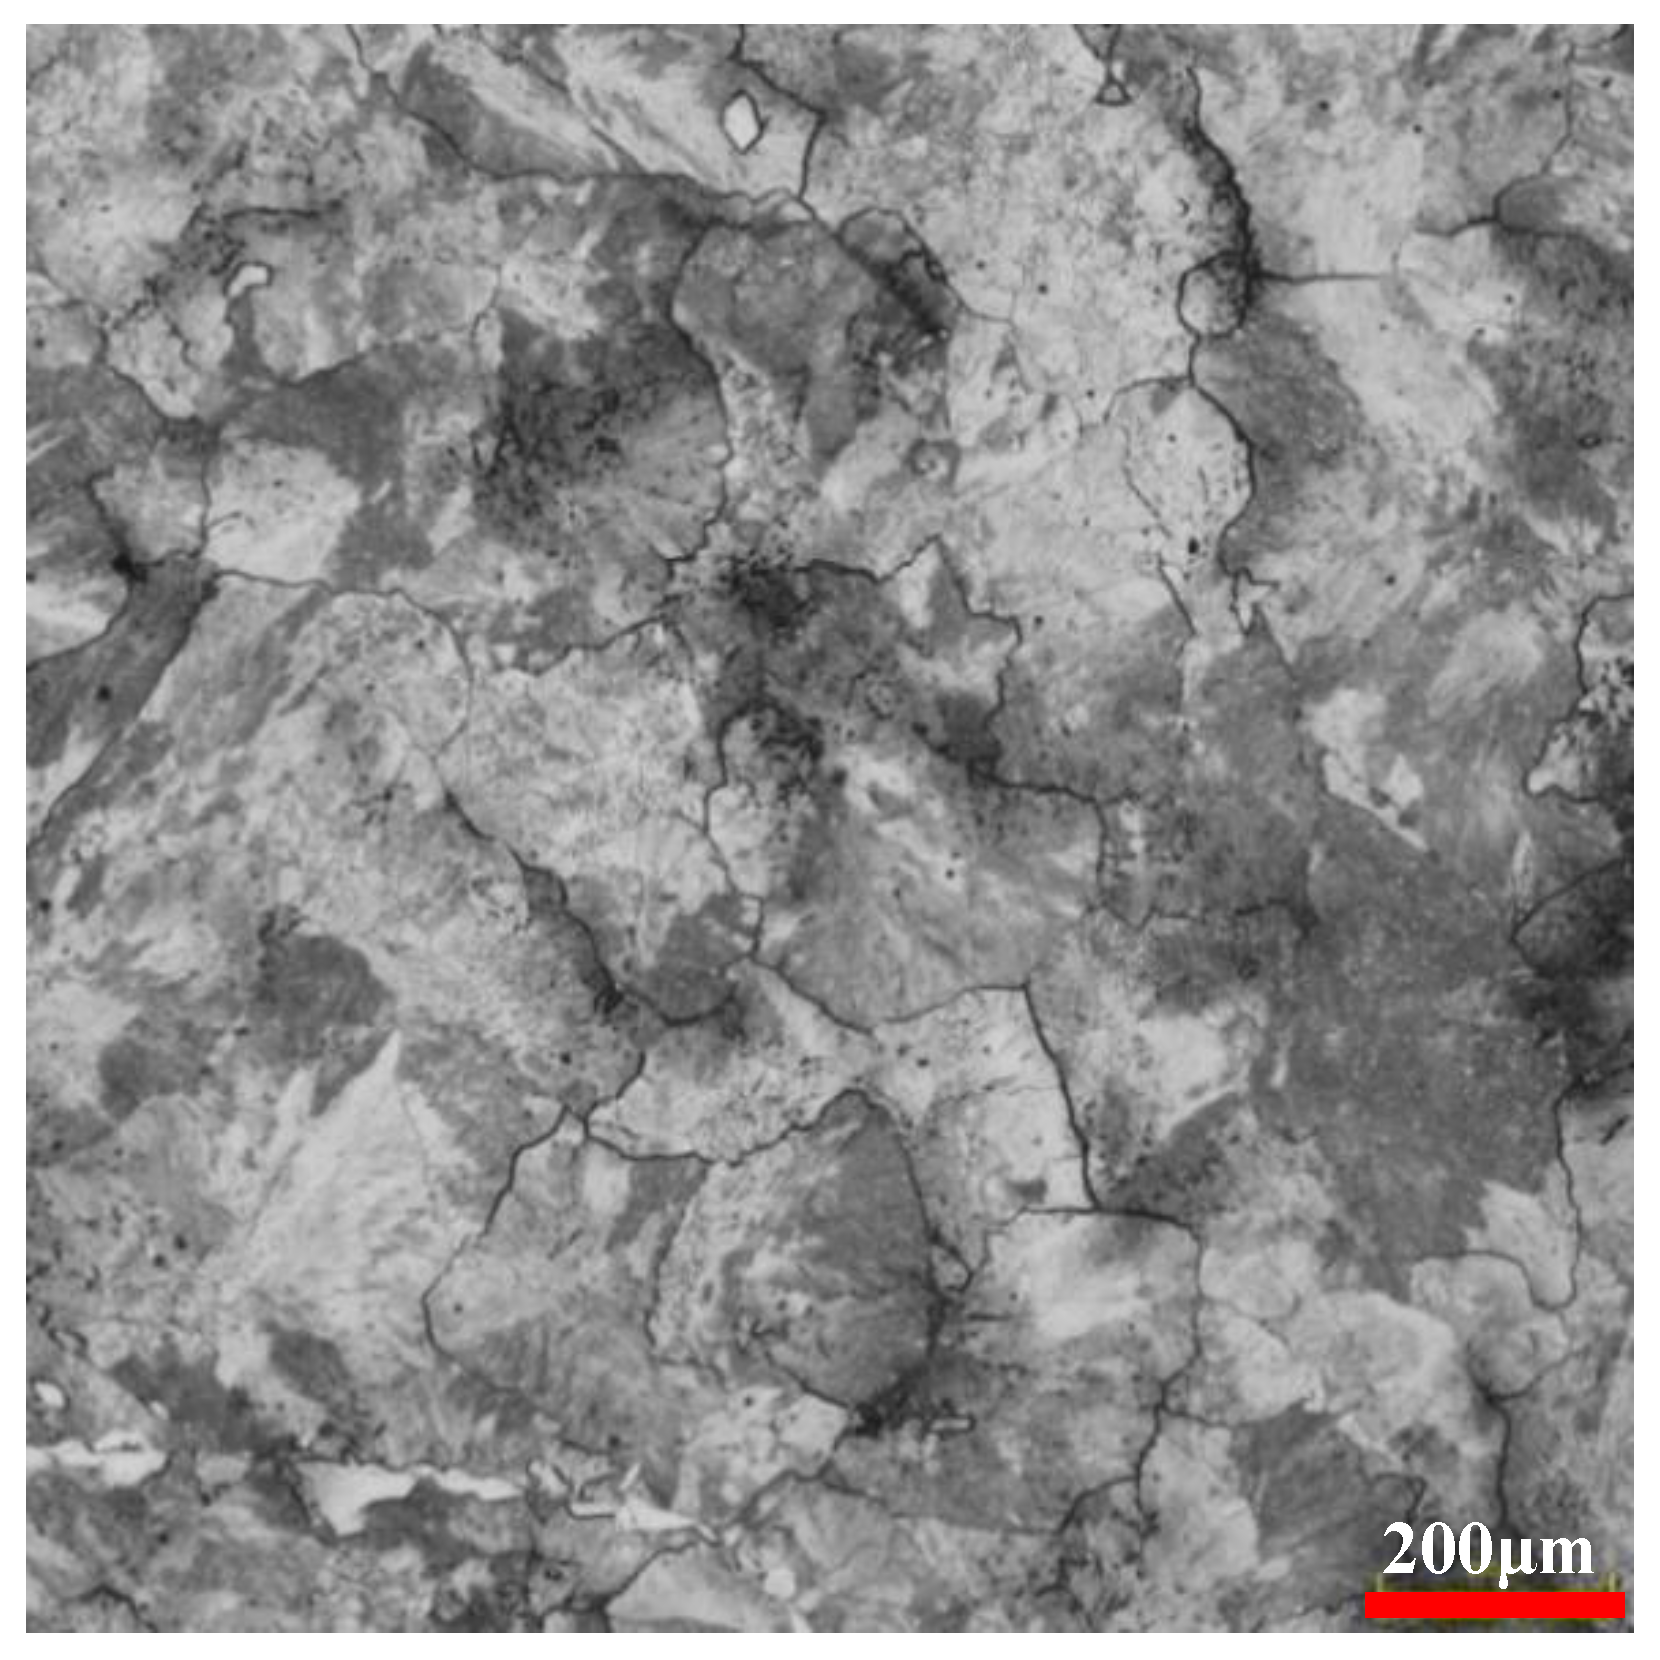
The critical stress σc and the critical strain εc of 35CrMo steel increase with the decrease of the deformation temperature and the increase of the strain rate. The critical strain and the peak strain satisfy the relationship: εc = 0.31912εp and the critical strain model is εc = 2.32 × 10⁻⁴Z0.1673. With the increase of Z parameters—i.e., with the decrease of deformation temperature and the increase of strain rate—the DRX of 35CrMo steel becomes more difficult, which can be reflected by the state diagram of DRX for 35CrMo steel.

Acknowledgments

The authors are grateful for the financial support from the National Program on Key Basic Research Project of China (No.2014CB046702).

Author Contributions

Yuanchun Huang and Sanxing Wang conceived and designed the experiments; Zhengbing Xiao and Hui Liu performed the experiments; Yuanchun Huang contributed reagents/materials/analysis tools; and Sanxing Wang wrote the paper.

Conflict of Interest

The authors declare no conflict of interest.

References

  1. Galiyev, A.; Kaibyshev, R.; Gottstein, G. Correlation of plastic deformation and dynamic recrystallization in magnesium alloy ZK60. Acta Mater. 2001, 49, 1199–1207. [Google Scholar] [CrossRef]
  2. Mejía, I.; Bedolla-Jacuinde, A.; Maldonado, C.; Cabrera, J.M. Determination of the critical conditions for the initiation of dynamic recrystallization in boron microalloyed steels. Mater. Sci. Eng. A 2011, 528, 4133–4140. [Google Scholar] [CrossRef]
  3. Takaki, T.; Yoshimoto, C.; Yamanaka, A.; Tomita, Y. Multiscale modeling of hot-working with dynamic recrystallization by coupling microstructure evolution and macroscopic mechanical behavior. Int. J. Plast. 2014, 52, 105–116. [Google Scholar] [CrossRef]
  4. Poliak, E.I.; Jonas, J.J. A one-parameter approach to determining the critical conditions for the initiation of dynamic recrystallization. Acta Mater. 1996, 44, 127–136. [Google Scholar] [CrossRef]
  5. Poliak, E.I.; Jonas, J.J. Initiation of Dynamic Recrystallization in Constant Strain Rate Hot Deformation. ISIJ Int. 2003, 43, 684–691. [Google Scholar] [CrossRef]
  6. Poliak, E.I.; Jonas, J.J. Critical Strain for Dynamic Recrystallization in Variable Strain Rate Hot Deformation. ISIJ Int. 2003, 43, 692–700. [Google Scholar] [CrossRef]
  7. Najafizadeh, A.; Jonas, J.J. Predicting the Critical Stress for Initiation of Dynamic Recrystallization. ISIJ Int. 2006, 46, 1679–1684. [Google Scholar] [CrossRef]
  8. Mirzadeh, H.; Najafizadeh, A. Prediction of the critical conditions for initiation of dynamic recrystallization. Mater. Des. 2010, 31, 1174–1179. [Google Scholar] [CrossRef]
  9. Xu, Y.; Tang, D.; Song, Y.; Pan, X. Dynamic recrystallization kinetics model of X70 pipeline steel. Mater. Des. 2012, 39, 168–174. [Google Scholar] [CrossRef]
  10. Li, L.; Ye, B.; Liu, S.; Hu, S.; Li, B. Inverse analysis of the stress–strain curve to determine the materials models of work hardening and dynamic recovery. Mater. Sci. Eng. A 2015, 636, 243–248. [Google Scholar] [CrossRef]
  11. Zhang, P.; Yi, C.; Chen, G.; Qin, H.; Wang, C. Constitutive model based on dynamic recrystallization behavior during thermal deformation of a nickel-based superalloy. Metals 2016, 6. [Google Scholar] [CrossRef]
  12. Zhang, B.; Zhang, H.B.; Ruan, X.Y.; Zhang, Y. Hot deformation behavior and dynamic recrystallization model of 35CrMo steel. Acta Metall. Sin. 2003, 16, 183–191. [Google Scholar]
  13. Far, S.V.S.; Ketabchi, M.; Nourani, M.R. Hot Deformation Characteristics of 34CrMo4 Steel. J. Iron Steel Res. 2010, 17, 65–69. [Google Scholar]
  14. Xu, W.; Zou, M.; Zhang, L. Constitutive analysis to predict the hot deformation behavior of 34CrMo4 steel with an optimum solution method for stress multiplier. Int. J Press. Vessel. Pip. 2014, 123, 70–76. [Google Scholar] [CrossRef]
  15. Xiao, Z.; Huang, Y.; Liu, H.; Wang, S. Hot Tensile and Fracture Behavior of 35CrMo Steel at Elevated Temperature and Strain Rate. Metals 2016, 6, 210. [Google Scholar] [CrossRef]
  16. Estrin, Y. Dislocation theory based constitutive modelling: Foundations and applications. J. Mater. Process. Technol. 1998, 80–81, 33–39. [Google Scholar] [CrossRef]
  17. Gottstein, G.; Frommert, M.; Goerdeler, M.; Schäfer, N. Prediction of the critical conditions for dynamic recrystallization in the austenitic steel 800H. Mater. Sci. Eng. A 2004, 387, 604–608. [Google Scholar] [CrossRef]
  18. Pantleon, W. Stage IV work-hardening related to disorientations in dislocation structures. Mater. Sci. Eng. A 2004, 387–389, 257–261. [Google Scholar] [CrossRef]
  19. Alexandrov, I.V.; Valiev, R.Z. Nanostructures from severe plastic deformation and mechanisms of large-strain work hardening. Nanostruct. Mater. 1999, 12, 709–712. [Google Scholar] [CrossRef]
  20. Sevillano, J.G.; van Houtte, P.; Aernoudt, E. Large strain work hardening and textures. Prog. Mater. Sci. 1980, 25, 69–134. [Google Scholar] [CrossRef]
  21. Gottstein, G.; Brünger, E.; Frommert, M.; Goerdeler, M.; Zeng, M. Prediction of the critical conditions for dynamic recrystallization in metals. Z. Metallkunde 2003, 94, 628–635. [Google Scholar] [CrossRef]
  22. Edington, J.W.; Smallman, R.E. The relationship between flow stress and dislocation density in deformed vanadium. Acta Metall. 1964, 12, 1313–1328. [Google Scholar] [CrossRef]
  23. Zhang, L.; Sekido, N.; Ohmura, T. Real time correlation between flow stress and dislocation density in steel during deformation. Mater. Sci. Eng. A 2014, 611, 188–193. [Google Scholar] [CrossRef]
  24. Solhjoo, S. Determination of critical strain for initiation of dynamic recrystallization. Mater. Des. 2010, 31, 1360–1364. [Google Scholar] [CrossRef]
  25. Sun, W.P.; Hawbolt, E.B. Comparison between Static and Metadynamic Recrystallization. An Application to the Hot Rolling of Steels. ISIJ Int. 1997, 37, 1000–1009. [Google Scholar] [CrossRef]
  26. Sellars, C.M. The kinetics of softening processes during hot working of austenite. Czechoslov. J. Phys. 1985, 35, 239–248. [Google Scholar] [CrossRef]
  27. Meysami, M.; Mousavi, S.A.A.A. Study on the behavior of medium carbon vanadium microalloyed steel by hot compression test. Mater. Sci. Eng. A 2011, 528, 3049–3055. [Google Scholar] [CrossRef]
  28. Sellars, C.M.; Mctegart, W.J. On the mechanism of hot deformation. Acta Metall. 1966, 14, 1136–1138. [Google Scholar] [CrossRef]
  29. Zener, C.; Hollomon, J.H. Effect of Strain Rate Upon Plastic Flow of Steel. J. Appl. Phys. 1944, 15, 22–32. [Google Scholar] [CrossRef]
Figure 1. Original microstructure.
Metals 07 00161 g001
Figure 2. Sketch map of strain hardening rate θ and stress σ.
Metals 07 00161 g002
Figure 3. True stress–strain curves of 35CrMo steel at different deformation conditions.
Metals 07 00161 g003
Figure 4. (a) ln σ ln ε ˙ plots; and (b) σ p ln ε ˙ plots under different deformation conditions.
Metals 07 00161 g004
Figure 5. (a) ln [ sinh ( α σ ) ] ln ε ˙ plots under different temperature; and (b) ln [ sinh ( α σ ) ] 1000 / T plots at different strain rates.
Metals 07 00161 g005
Figure 6. Contrast between experimental curve and fitted curve deformed at temperature of 1050 °C and strain rate of 0.1 s−1.
Metals 07 00161 g006
Figure 7. Curves of θ versus σ (a) and dθ/dσ versus σ (b) deformed at 1050 °C with 0.1 s−1.
Metals 07 00161 g007
Figure 8. Curves of θ versus σ for 35CrMo steel under different deformation temperatures: (a) 850 °C, (b) 950 °C, (c) 1050 °C, (d) 1150 °C.
Metals 07 00161 g008
Figure 9. Curves of dθ/dσ versus σ for 35CrMo steel under different deformation temperatures: (a) 850 °C, (b) 950 °C, (c) 1050 °C, (d) 1150 °C.
Metals 07 00161 g009
Figure 10. Curves of (a) σc versus T and (b) εc versus T for 35CrMo steel under different deformation conditions.
Metals 07 00161 g010
Figure 11. The plots of (a) εcp; (b) lnεp-lnZ.
Metals 07 00161 g011
Figure 12. Relationship between θ and σ deformed at 1050 °C with 0.1 s−1.
Metals 07 00161 g012
Figure 13. Microstructure corresponding to point A, B, C and D in Figure 9 (a) A; (b) B; (c) C; (d) D. DRX: dynamic recrystallization.
Metals 07 00161 g013aMetals 07 00161 g013b
Figure 14. State diagram of DRX for 35CrMo steel under hot temperature deformation.
Metals 07 00161 g014
Table 1. Chemical composite of 35CrMo steel in mass fraction.
ElementCSiMnCrMoSPAlNiFe
Content (wt. %)0.340.210.560.950.190.00510.0190.00320.05Bal.
Table 2. Parameters fitted for the strain hardening rate as a function of flow stress.
T (°C)Strain Rate(s−1θ/σ Relationσc (MPa)σp (MPa)
9500.01θ = −1.72 × 10⁻¹σ3 + 3.34 × 10σ2 − 2.15 × 10³σ + 4.60 × 10464.7378.87
10500.01θ= −1.81 × 10⁻¹σ3 + 2.33 × 10σ2 − 1.01 × 10³σ + 1.49 × 10443.0350.86
0.1θ = −3.86 × 10⁻²σ3 + 0.75 × 10σ2 − 4.88 × 10²σ + 1.06 × 10464.7772.97
1θ = −6.04 × 10⁻²σ3 + 1.49 × 10σ2 − 1.23 × 10³σ + 3.41 × 10482.21102.75
11500.01θ = −2.78 × 10⁻¹σ3 + 2.37 × 10σ2 − 6.87 × 10²σ + 6.87 × 10328.4534.67
0.1θ = −9.06 × 10⁻²σ3 + 1.16 × 10σ2 − 6.00 × 10²σ + 7.38 × 10342.7750.27
1θ = −1.63 × 10⁻²σ3 + 0.31 × 10σ2 − 1.99 × 10²σ + 4.63 × 10362.4077.59
10θ = −2.80 × 10⁻²σ3 + 0.24 × 10σ2 − 2.33 × 10²σ + 7.93 × 10397.64115.86

