Article

Intensification Behavior of Mercury Ions on Gold Cyanide Leaching

1
School of Minerals Processing and Bioengineering, Central South University, Changsha 410083, China
2
School of Mineral and Environment, Hunan Nonferrous Metals Vocational and Technical College, Zhuzhou 412006, China
*
Author to whom correspondence should be addressed.
Metals 2018, 8(1), 80; https://doi.org/10.3390/met8010080
Submission received: 5 December 2017 / Revised: 9 January 2018 / Accepted: 17 January 2018 / Published: 21 January 2018
(This article belongs to the Special Issue Advances in Hydrometallurgy)

Abstract

:
Cyanidation is the main method used to extract gold from gold raw materials; however, a serious problem with this method is the low leaching rate. In order to improve gold leaching, the intensification behavior of mercury ions on gold cyanide leaching, for two types of materials, sulphide gold concentrate and oxide gold ore, was investigated. The results showed that mercury ions, with only a 10−5 M dosage, could significantly intensify leaching and gold recovery. The dissolution behavior of gold plate was also intensified by 10−5 M mercury ions. Microstructure analysis showed that mercury ions intensified the cyanidation corrosion of the gold surface, resulting in a loose structure, where a large number of deep ravines and raised particles were evident across the whole gold surface. The loose structure added contact surface between the gold and cyanide, and accelerated gold dissolution. Moreover, mercury ions obstructed the formation of insoluble products, such as AuCN, Au(OHCN), and Au(OH)x, that lead to a passivation membrane on the gold surface, reducing contact between the gold and cyanide. These effects, brought about by mercury ions, change the structure and product of the gold surface during gold cyanidation and promote gold leaching.

1. Introduction

Gold is a rare and precious metal. It is not only a special currency for reserve and investment, but also an important material for the jewelry, electronics, and aerospace sectors, among others. Cyanidation has numerous advantages, in contrast with other methods, and is the main method to extract gold from gold materials, such as sulphide gold concentrate and oxide gold ore. However, a serious problem associated with this method is the low leaching rate [1,2,3]. Through past research, a large number of intensification techniques have been established. Hydrogen peroxide, as an assistant reagent, has been shown to accelerate gold leaching since its appearance in 1987 [4,5].
Gold leaching, in essence, is an electrochemical process that includes the anode dissolution of gold and the cathode reduction of oxygen and other oxidants [6,7]. Hydrogen peroxide assistant leaching is an intensified method for cathode reduction. After cathode reduction is intensified to an extreme level, further intensification no longer contributes to increased gold leaching and the subsequent leaching is determined by anode dissolution. Meanwhile, anodic intensification has received wide attention. Some heavy metals, such as lead, bismuth, silver, and thallium, have been shown to be effective in the intensification of the anodic dissolution of gold [8,9,10,11]. Their catalysis on gold leaching has been analyzed theoretically and research has also looked at their intensive electrochemistry. However, there have been few reports on the practical applications of these technologies and their intensified mechanisms, especially for mercury ions.
Mercury ions can be recycled and reutilized to intensify gold cyanide leaching. After cyanide leaching, gold is separated from the lixivium by active carbon adsorption, and the leaching raffinate, with mercury ions, will circulate back to the previous process and leach gold again. Even if only a few mercury ions exist in the gold concentrate, they will be treated to realize the green discharge of mercury ions. Therefore, there are no pollution problems brought about by mercury intensification in gold cyanide leaching, and it is a suitable intensifier. In our previous research [12,13,14], the electrochemical kinetics of gold anodic dissolution, intensified by heavy metals, was investigated. Additionally, the co-intensification of heavy metals and hydrogen peroxide to accelerate gold leaching from different types materials was also researched. Moreover, the electrochemical nature of the co-intensification of mercury ions and oxidants was discussed. Some knowledge was obtained based on these works; however, the intensification behavior and mechanism of mercury ions on gold cyanide leaching lack in-depth and systematic understanding. In this work, mercury ions, as the only intensified reagent, were applied to prevent the effect of hydrogen peroxide. A pure gold plate was employed to avoid the disturbance of other elements in the gold material. The leaching behavior of two types of materials, sulphide gold concentrate and oxide gold ore, and the dissolution behavior, structure information, and surface product of the gold plate, were investigated to analyze the intensification of mercury ions on gold cyanide leaching. This research will allow the intensification behavior and mechanism of mercury ions on gold cyanide leaching to be understood more clearly.

2. Materials and Methods

2.1. Materials

Two common gold materials, sulphide gold concentrate and oxide gold ore, were provided by a gold plant in China. As shown in Table 1, sulphide gold concentrate is a high gold-content material (73.21 g/t), while there is only 4.42 g/t gold-content in oxide gold ore. The oxide gold ore has little content of S and Fe; whereas, in the sulphide gold concentrate, the content of S and Fe is much higher at 28.34% and 29.57%, respectively, which may have a negative effect on gold leaching. Moreover, there is 29.57% Fe and 2.19% Cu in the sulphide gold concentrate, which indicates a high content of pyrite and that some copper pyrites exist in the gold concentrate. Meanwhile, a cylindrical gold plate (Φ 7.0 mm × 2.0 mm) with 99.99% purity was employed to analyze the effect of mercury ions on gold dissolution. Analytic reagents, HgSO4 and NaOH, were applied as the mercury ion intensifier and solution pH regulator, respectively. NaCN was used as a leaching agent.

2.2. Methods

2.2.1. Gold Leaching

In the gold leaching test, a 50 g sample was first ground in a Φ 160 mm × 50 mm wet ball mill with a 40% mass fraction in a grinding slurry. After grinding, the slurry was put in a 500 mL breaker and a certain amount of cyanide NaCN, intensifier HgSO4, pH regulator NaOH, and water, was added to the beaker. The concentration of NaCN was 0.3%, the liquid–solid ratio of leaching was 5:1, and the pH of the solution was 12. The concentration of mercury ions was 0, 10−6, 10−5, and 10−4 M, as determined by the experimental requirements. The slurry was stirred with a EUROSTAR stepless speed regulation stirrer, with a rotation speed of 400 rpm, and leaching time was recorded. After leaching for a given time, the slurry was filtered and the residue was dried in an electric drying oven (CIE, Changsha, China). The residue and pregnant solution were both analyzed by atomic absorption spectrometry (AA240FS+GTA120, VARIAN, San Francisco, CA, USA) to determine gold content.

2.2.2. Gold Dissolution

The cylindrical gold plate was prepared before cyanide dissolution. Firstly, the gold plate was rubbed and polished by a 0.06-A metallographic sandpaper. Secondly, the gold plate was processed with a high temperature treatment using an alcohol burner. Finally, the gold plate was ultrasonically cleaned for 8 min with successive cleaning solutions of distilled water, 10% diluted nitric acid, distilled water, anhydrous ethanol, and distilled water.
After being prepared, the gold plate was bonded on the stirring rod of a speed regulation stirrer. Then, the stirring rod, along with the gold plate, were placed in a solution with an NaCN concentration of 0.3% and pH of 12. Meanwhile, a certain amount of HgSO4 reagent was added into the solution for Hg intensification cyanidation. There were no mercury ions in the common cyanidation. The stirrer was rotated at a speed of 400 rpm and leaching time was recorded. After leaching for a given time, the gold plate was cleaned using distilled water and naturally air-dried. Afterwards, the gold plate was weighed and its microstructure and surface product were analyzed.

2.2.3. Microstructure and Surface Product Analysis after Dissolution

The microstructure and surface product of the gold plate after common cyanidation and Hg intensification cyanidation were analyzed by scanning electron microscope (SEM), atomic force microscope (AFM), X-ray photoelectron spectrometer (XPS), and fourier transform infrared spectoscopy (FT-IR) (NEXUS 670, NICOLET, Wisconsin Rapids, WI, USA ). SEM analysis was conducted using a JSM-6360LV scanning electron microscope (Quanta 250 FEG, FEI, Hillsboro, OR, USA). AFM analysis was conducted using a di NanoMan Vs AFM atomic force microscope (Multimode VIII, VEECO, Plainview, NY, USA). XPS analysis was conducted using a Ka 1063 X-ray photoelectron spectrometer (AXIS ULTRA DLD, Shimadzus, Kyoto, Japan), whose vacuum degree, X-ray source, and energy were 1 × 10⁻⁷ Pa, Al Ka, and 50 eV, respectively. Infrared spectrum analysis was performed using a Nexsus 670 IR spectrometer, with a resolution of 0.09 cm−1 and scan time of 60 times/s.

3. Results

3.1. The Effect of Mercury Ions on Gold Leaching

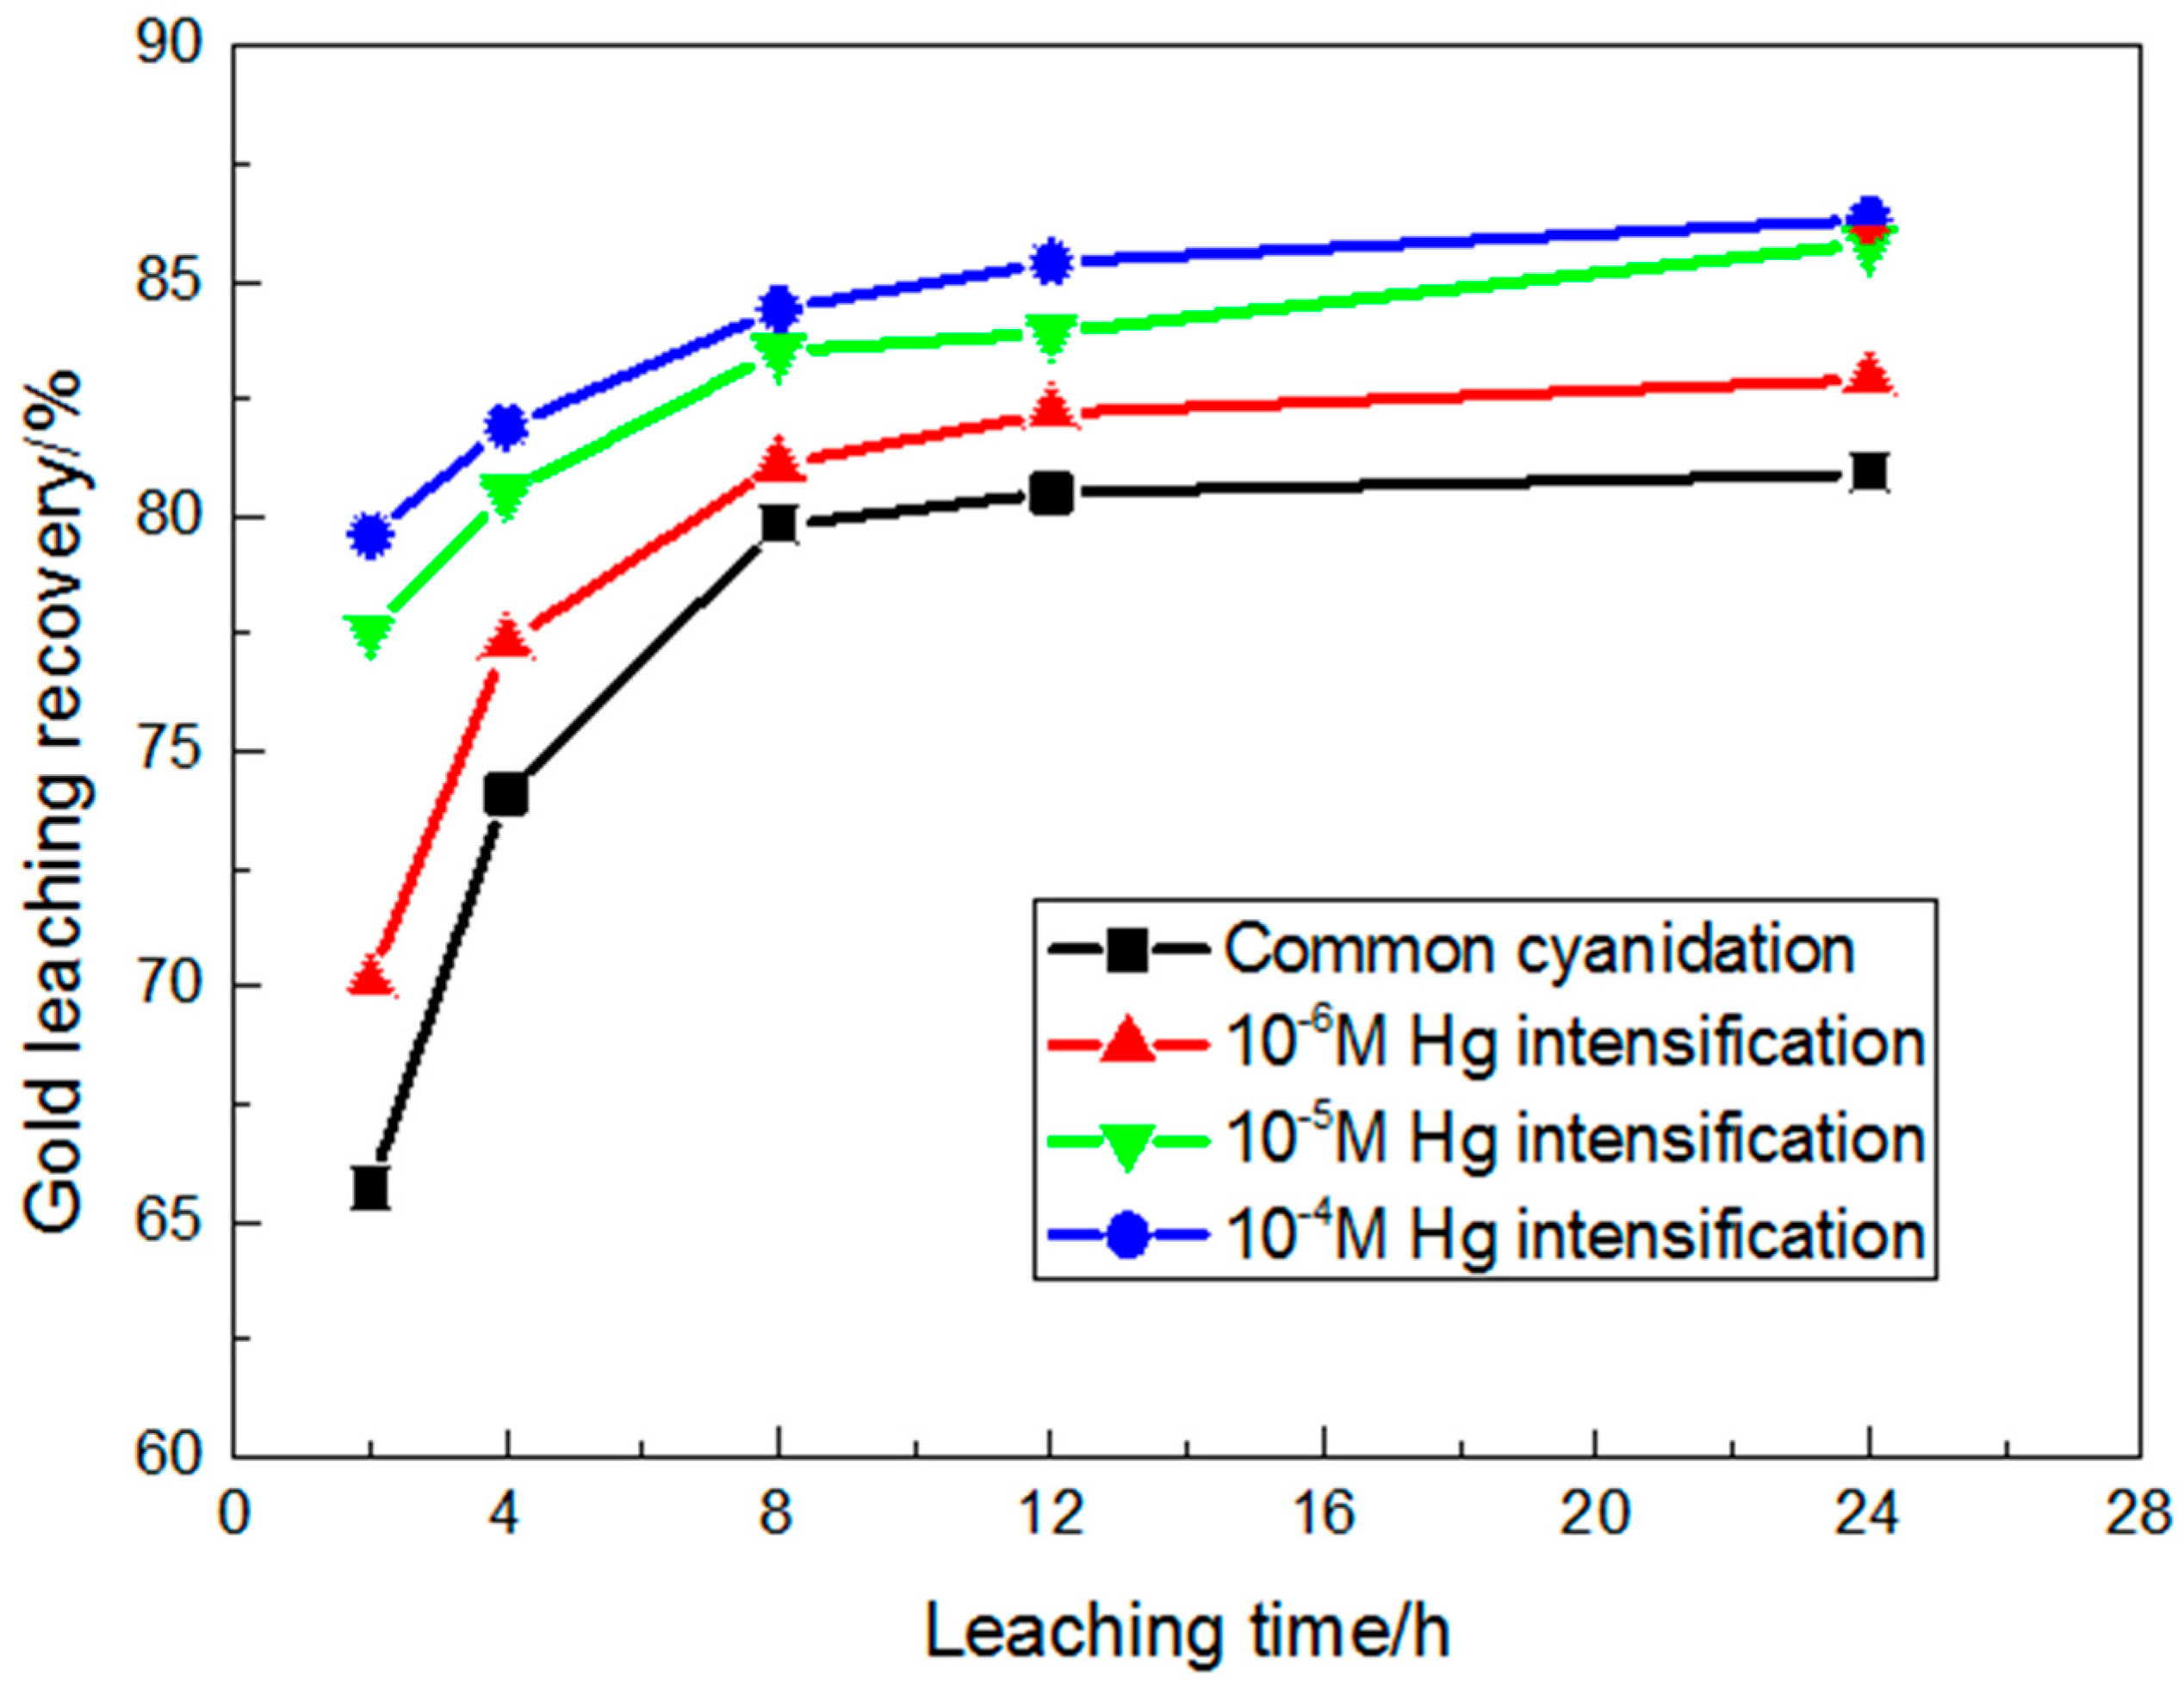
3.1.1. Sulphide Gold Concentrate

As a common gold concentrate in China, sulphide gold concentrate was used to investigate the intensification behavior of mercury ions on gold leaching. As shown in Figure 1, mercury ions have an obvious positive effect on sulphide gold concentrate leaching, especially for 10−5 and 10−4 M mercury ions. Mercury ions not only increase the gold leaching rate, but also improve final gold recovery. After adding 10−6 M Hg, gold recovery increased from 65.7% to 70.1% when the leaching time was two hours. Continuing to extend leaching time, gold recovery with Hg intensification was also higher than with common cyanidation. With 10−5 M Hg, gold recovery showed an obvious improvement compared to both common cyanidation and 10−6 M Hg intensification. With 10−5 M Hg, gold recovery was up to 77.6% after only two hours of leaching, while the same recovery with common cyanidation took nearly eight hours. Meanwhile, recovery further improved with extended leaching time and recovery after 24 hours leaching reached a high of 85.8%. Increasing the content of mercury ions to 10−4 M improved gold recovery, but this recovery was not considerably different to 10−5 M Hg. Therefore, mercury ions were an effective intensifier for the cyanide leaching of sulphide gold concentrate. Only with 10−5 M Hg can the gold cyanide leaching be adequately intensified. In addition, both common cyanidation and Hg intensification cyanidation took nearly twelve hours to complete gold leaching.

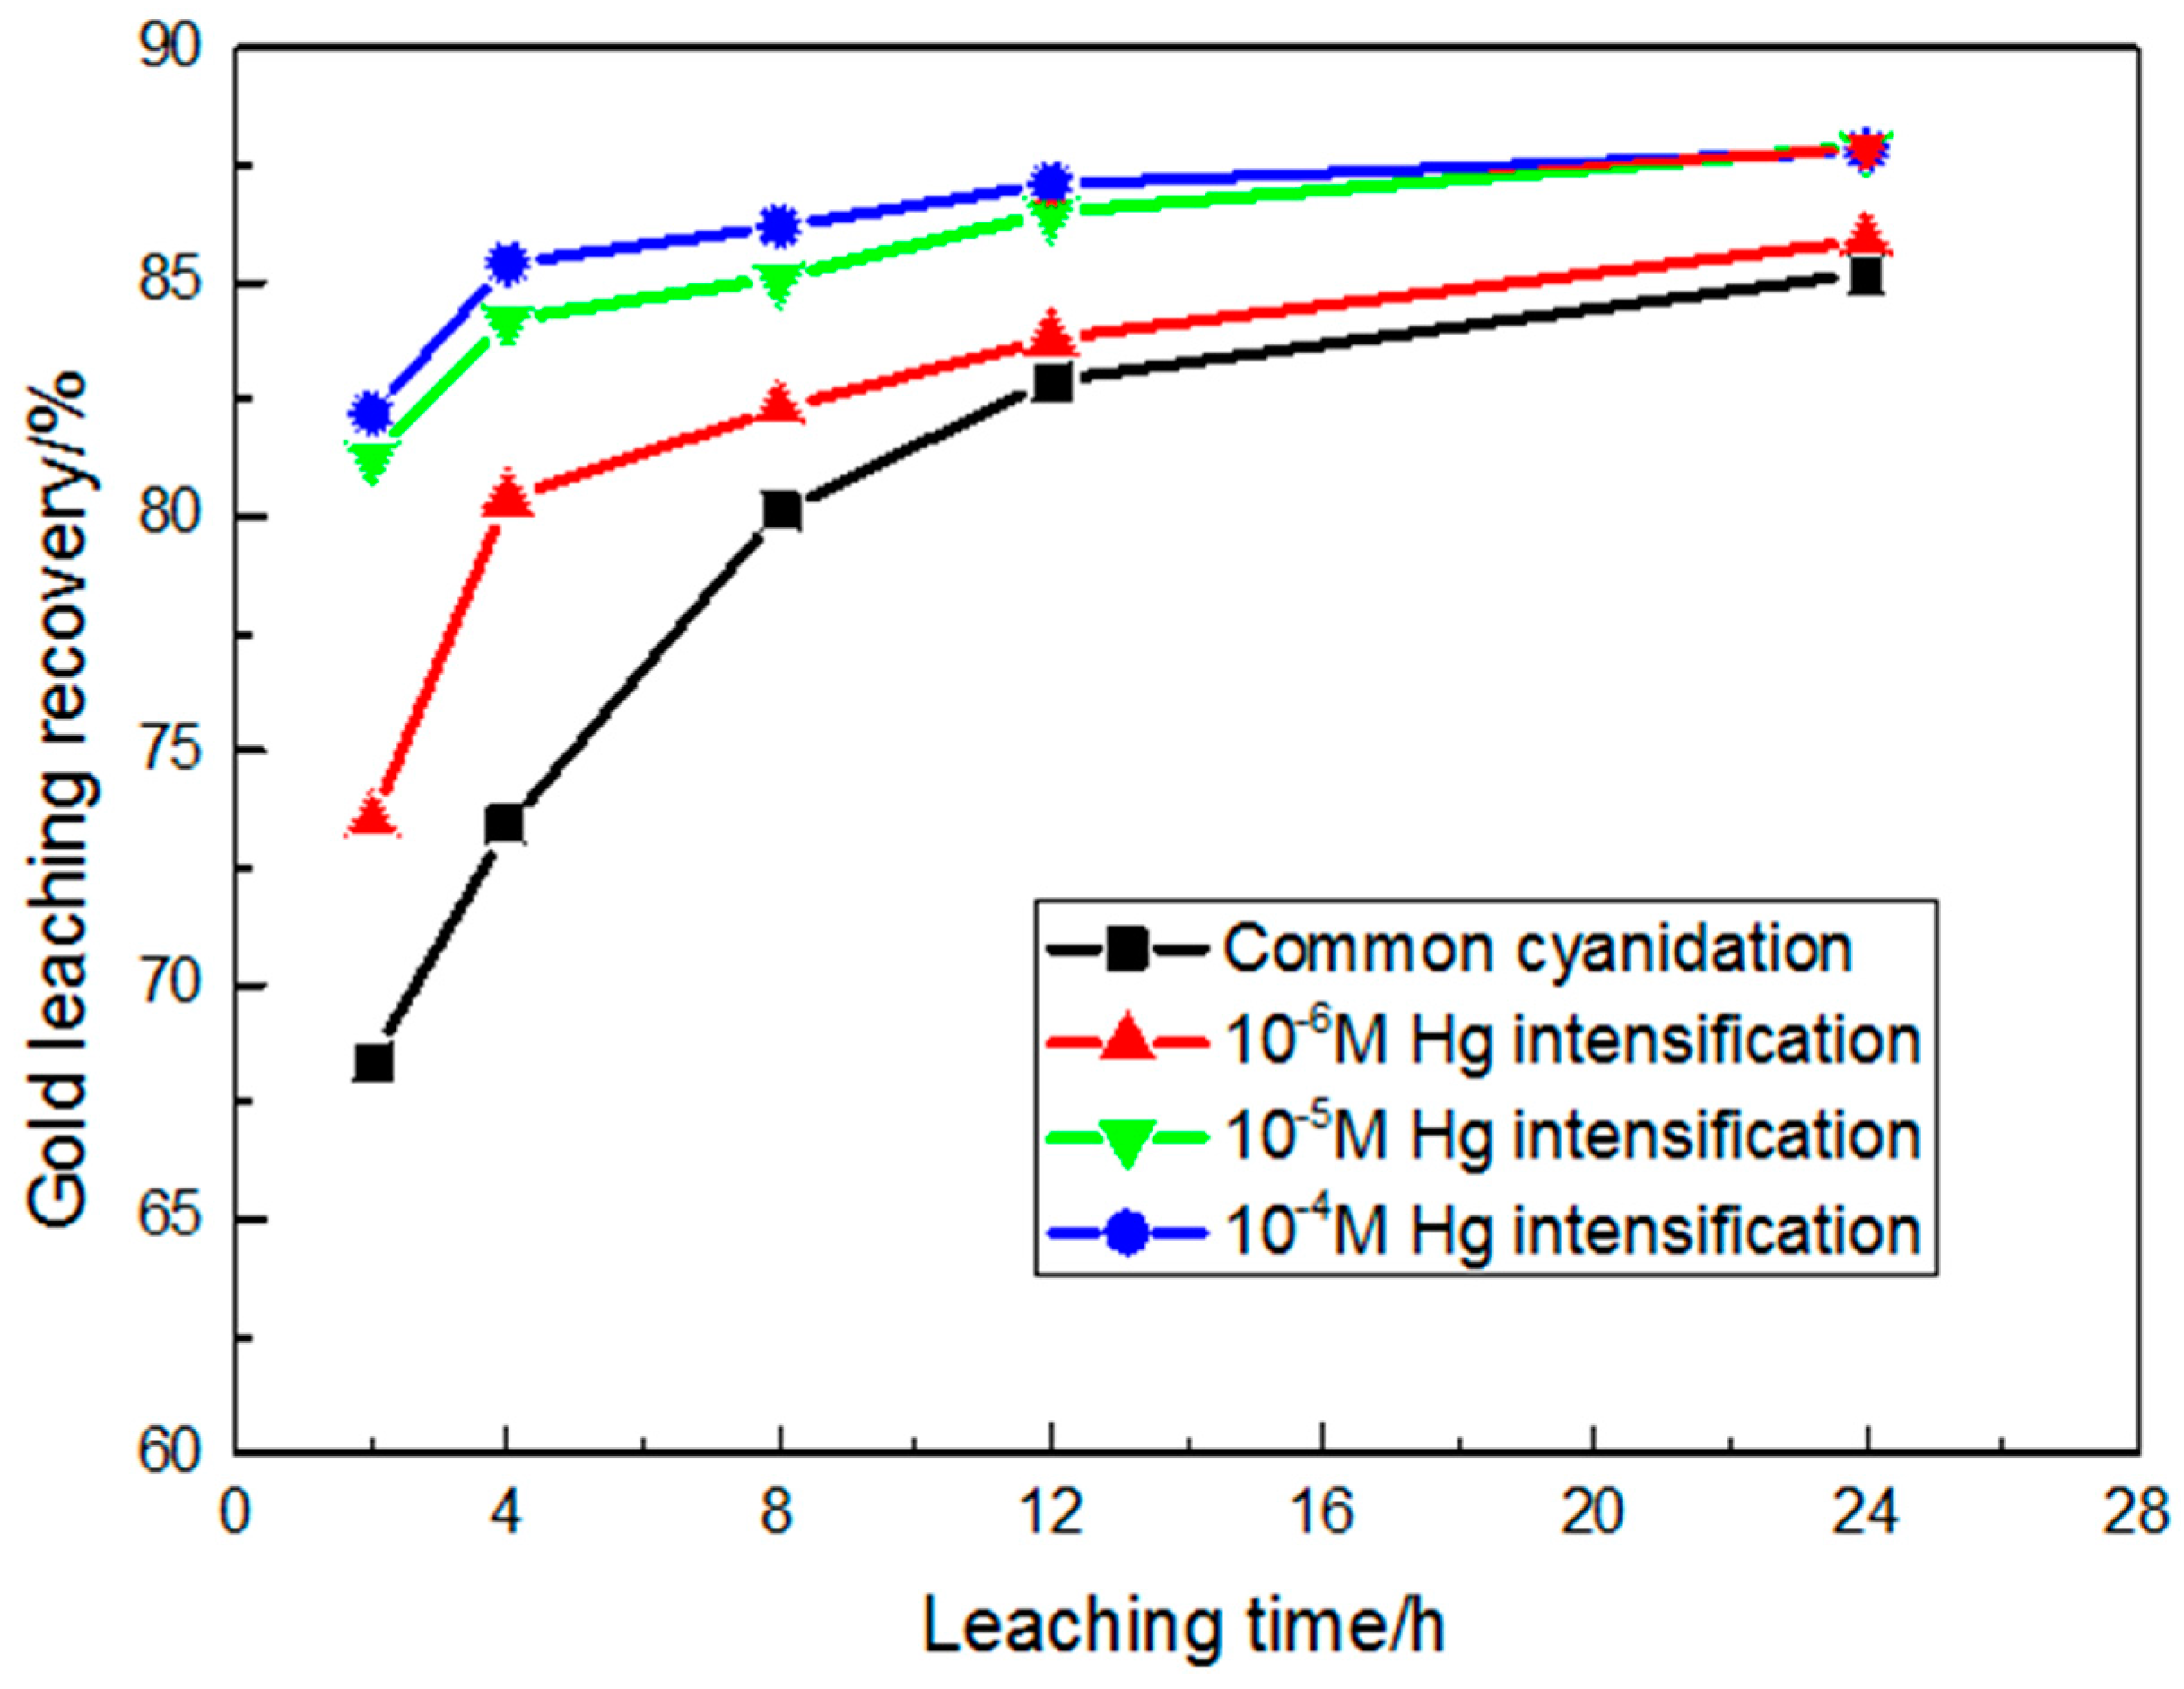
3.1.2. Oxide Gold Ore

In the same way, the intensification behavior of mercury on the gold leaching of oxide gold ore, was investigated. As shown in Figure 2, the leaching behavior of oxide gold ore was similar to that of sulphide gold concentrate. With 10−6 M Hg, gold recovery was 73.5% after two hours, compared to recovery of 68.4% with common cyanidation. With 10−6 M Hg, recovery reached 80.4% after four hours of leaching. Increasing the content of mercury ions to 10−5 and 10−4 M improved gold recovery and the leaching patterns were almost the same. Gold recovery with 10−5 M Hg intensification was as high as 81.3%, 84.2%, and 87.1% after leaching for two, four and twelve hours, respectively. Therefore, the gold cyanide leaching of oxide gold ore was intensified after adding 10−5 M Hg. Moreover, as with sulphide gold concentrate, oxide gold ore also needed twelve hours to complete its gold leaching.

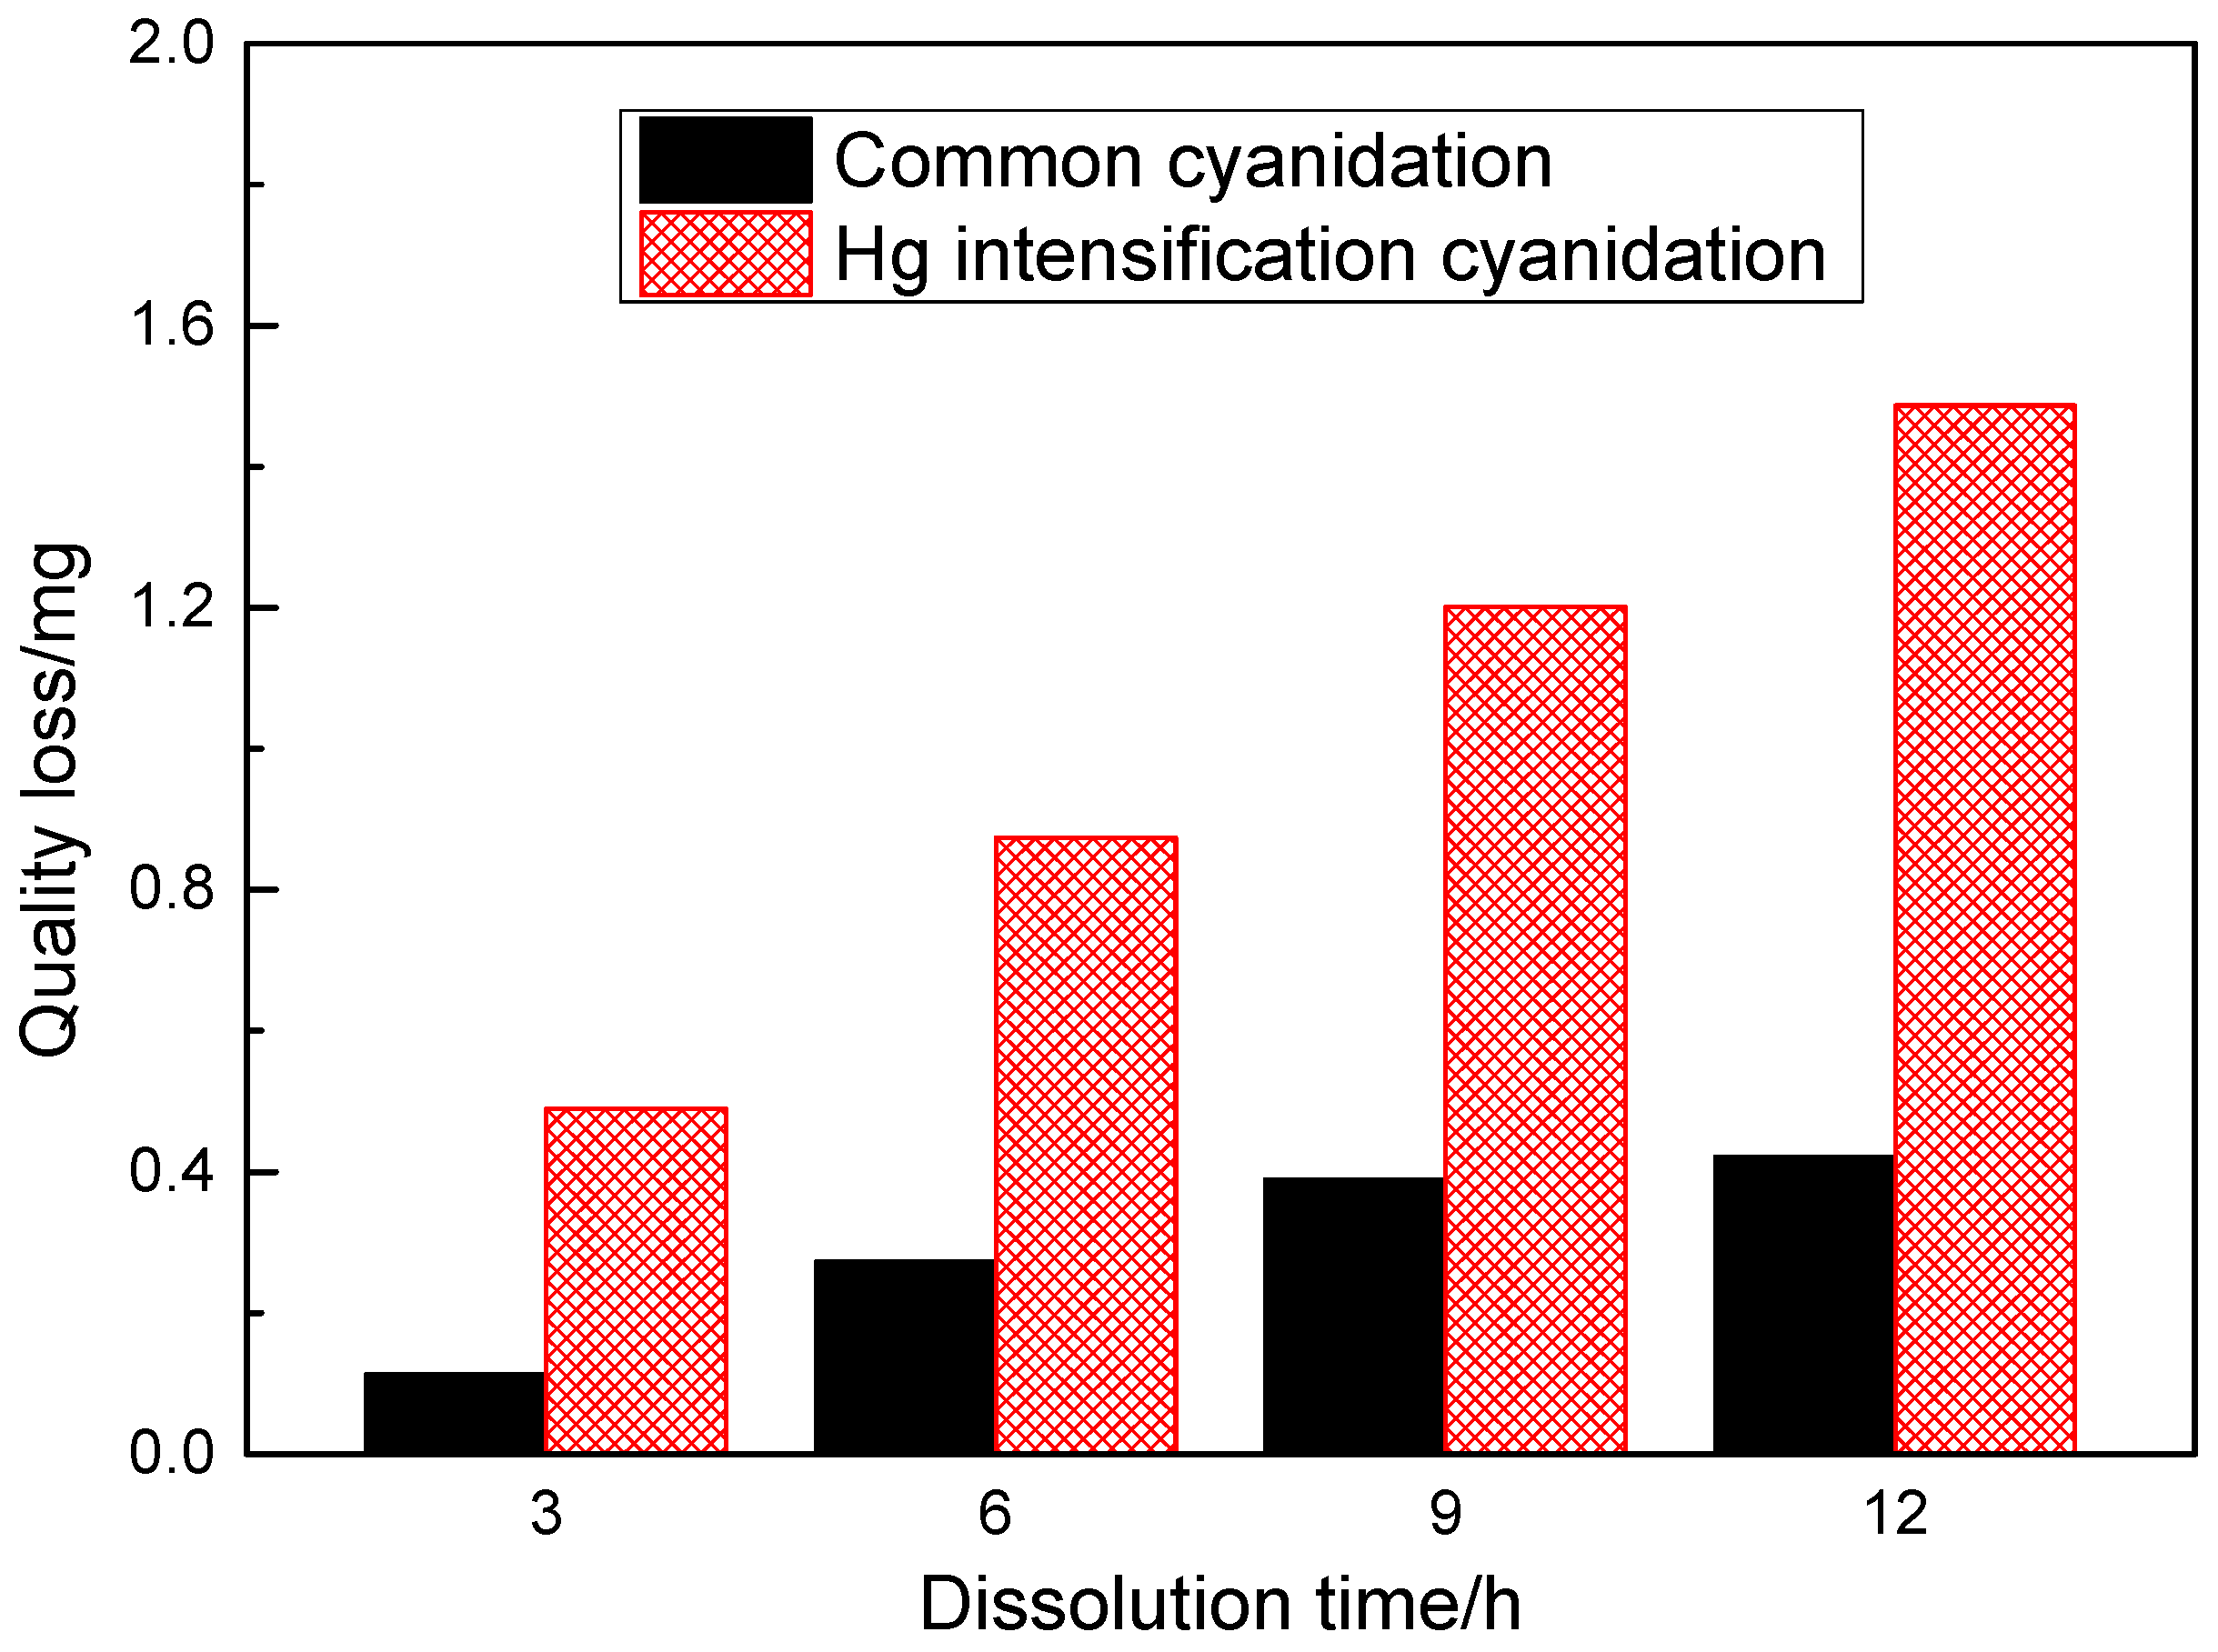
3.2. The Effect of Mercury Ions on Gold Dissolution

In order to avoid other factors and to better research the effect of mercury ions on gold leaching, a pure gold plate was used to analyze the intensification behavior of mercury ions on gold dissolution. The content of the mercury ions was 10−5 M and the effect at different time points on gold plate dissolution, was measured. As shown in Figure 3, the quality loss of the gold plate during Hg intensification cyanidation was far greater than that of common cyanidation. After three hours of dissolution, the quality loss of the gold plate with Hg intensification was 0.489 mg, while the quality loss with the common dissolution was only 0.113 mg. Even with 12 hours of common dissolution, the quality loss of the gold plate was 0.421 mg, which was still lower than after three hours of Hg intensification cyanidation. Moreover, the quality loss of the gold plate after 12 hours of Hg intensification dissolution was 1.487 mg. This shows that gold dissolution can be intensified by mercury ions. Similarly, mercury ions can promote the removal of gold from gold materials and promote gold dissolution in a cyanide solution.

3.3. Microstructure after Dissolution

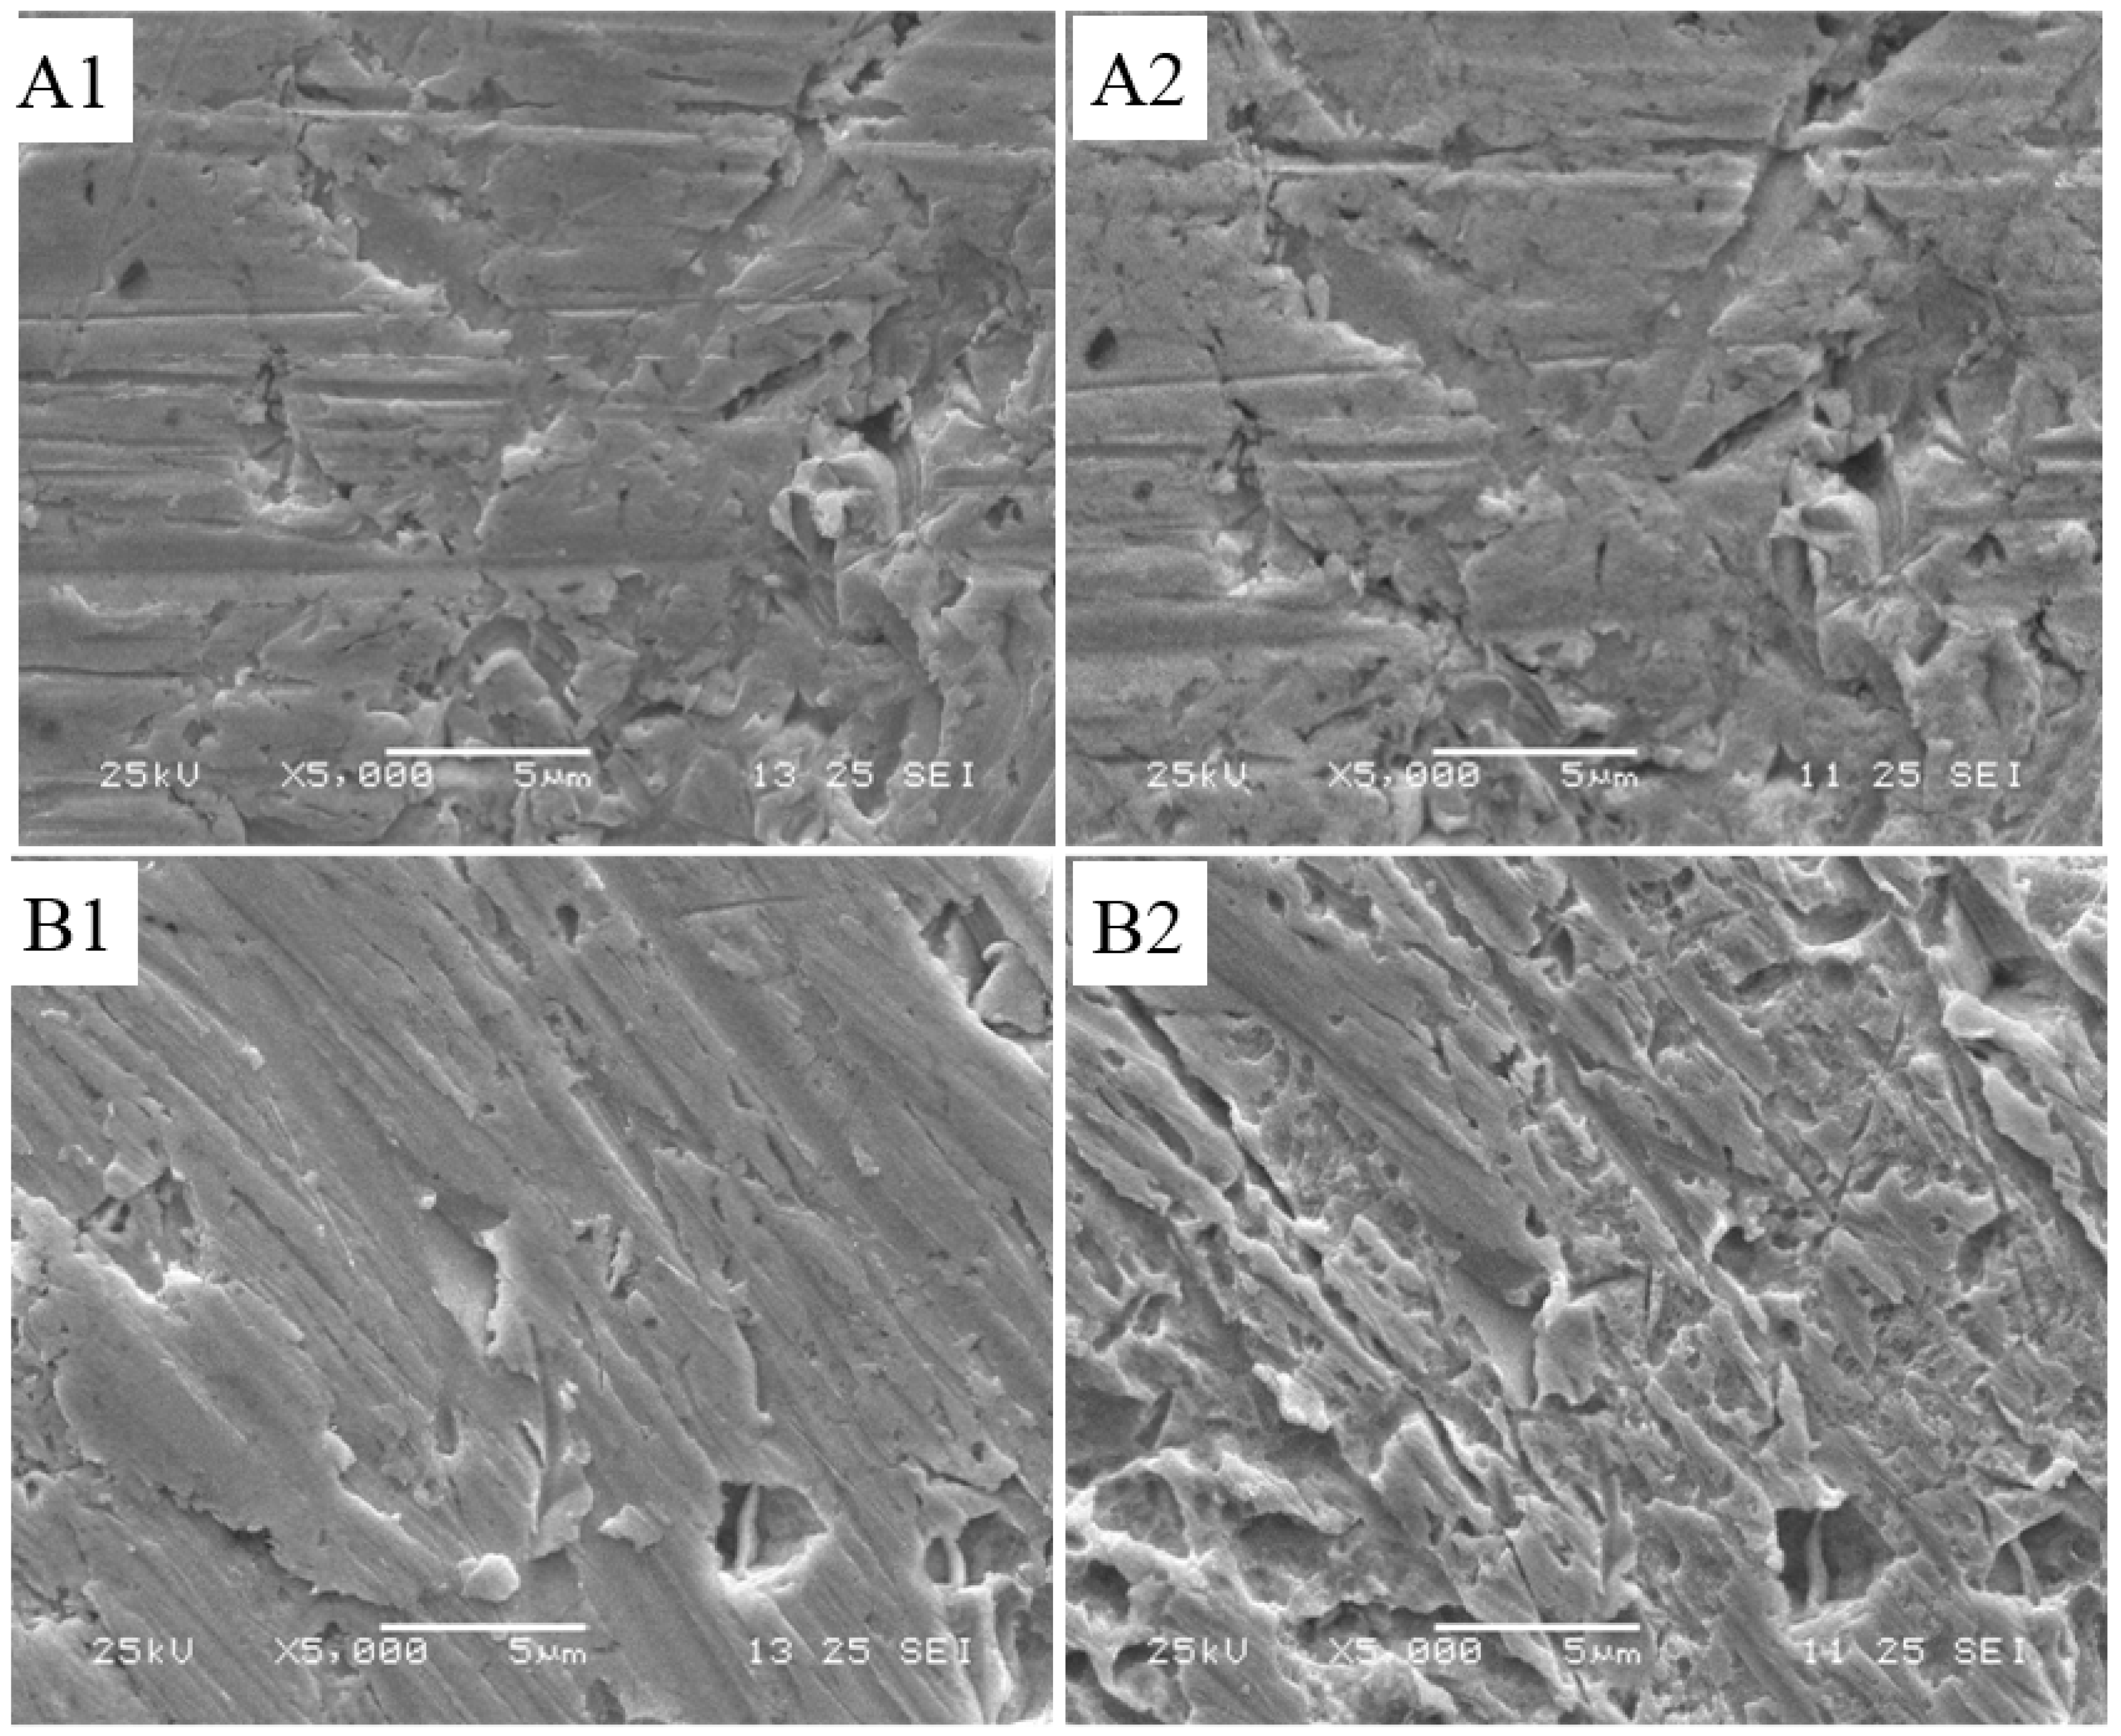
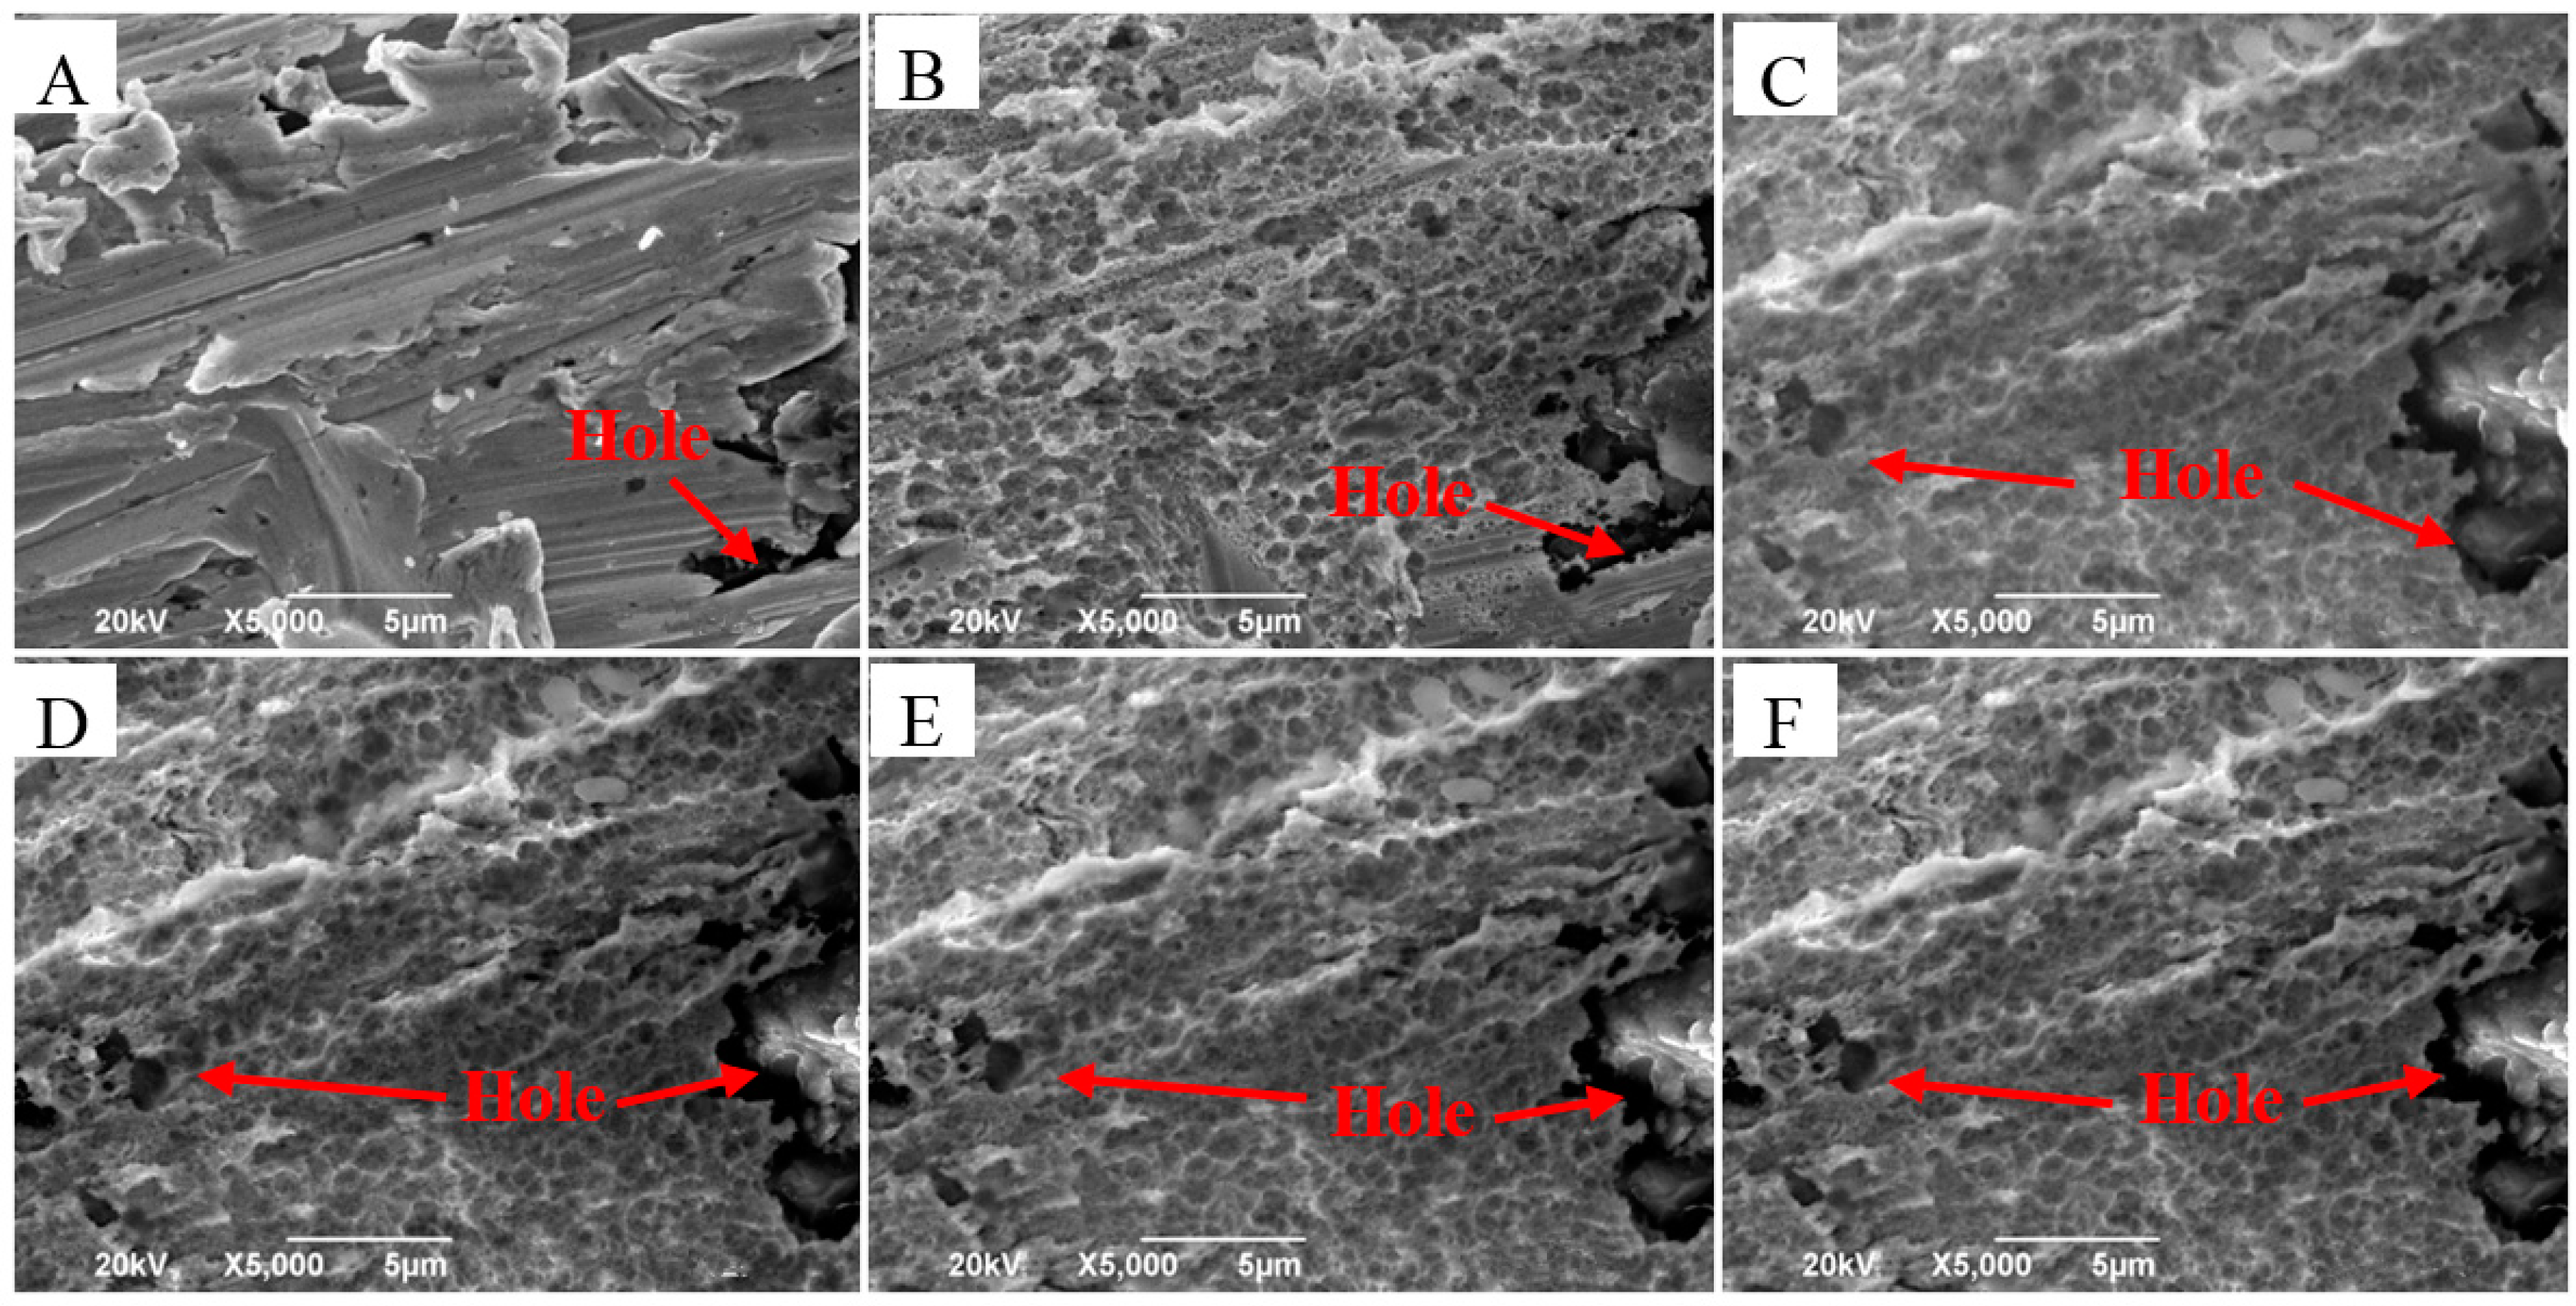
3.3.1. Structure Information Determined by SEM

The original gold plates were analyzed using SEM, as well as the same gold plates after six hours of cyanide dissolution (common or Hg intensification). As shown in Figure 4A1,A2, the microstructures of the two gold plates were almost the same, which means that the surface structures of the gold plates showed little change during common cyanide dissolution. However, the surface structure of the gold plates differed substantially after Hg intensification dissolution, as shown in Figure 4B1,B2. With the original gold plate, there were some shallow ravines on the surface, but it was an integral whole with a homogeneous structure. After Hg intensification dissolution, many deep ravines and pits appeared, making the surface rough with a loss of structure. Gold plates can be severely corroded and gold is removed from plates during Hg intensification dissolution. Meanwhile, the rough surface and loose structure improves the contact area between the gold and cyanide, further accelerating gold dissolution. Therefore, mercury ions have an important effect on gold plate structure. Hg intensification cyanidation corrodes the gold surface, destroys its structure, and ultimately accelerates gold dissolution.
Meanwhile, the original gold plate was put into the same Hg cyanide solution and dissolved in a stationary state. The gold plate, after different time points of dissolution, was analyzed using SEM, and the structure information from this analysis is shown in Figure 5. The surface of the original gold plate was smooth and homogeneous. After one day of dissolution, there were many shallow pits on the surface of the gold plate, and while the hole displayed some changes, these were not obvious when compared to the original gold plate. After two days of dissolution, the whole surface was rough and blurry, which may have been due to cyanide corrosion on the gold. Meanwhile, the hole displayed an obvious change, where the area of the hole was larger than that of Figure 5A,B, and some new holes had formed, as shown in Figure 5C. After three days of dissolution, the original hole displayed no obvious change, but the new holes were larger and deeper. Continuing to extend the dissolution time, the structure of the gold plate showed no obvious change. The results show that it should take three days to complete gold dissolution, which is uneconomical and unrealistic. Therefore, the intensification of mercury ions on gold dissolution is limited and inefficient when gold is dissolved in a stationary state. The intensification must combine with stirring.

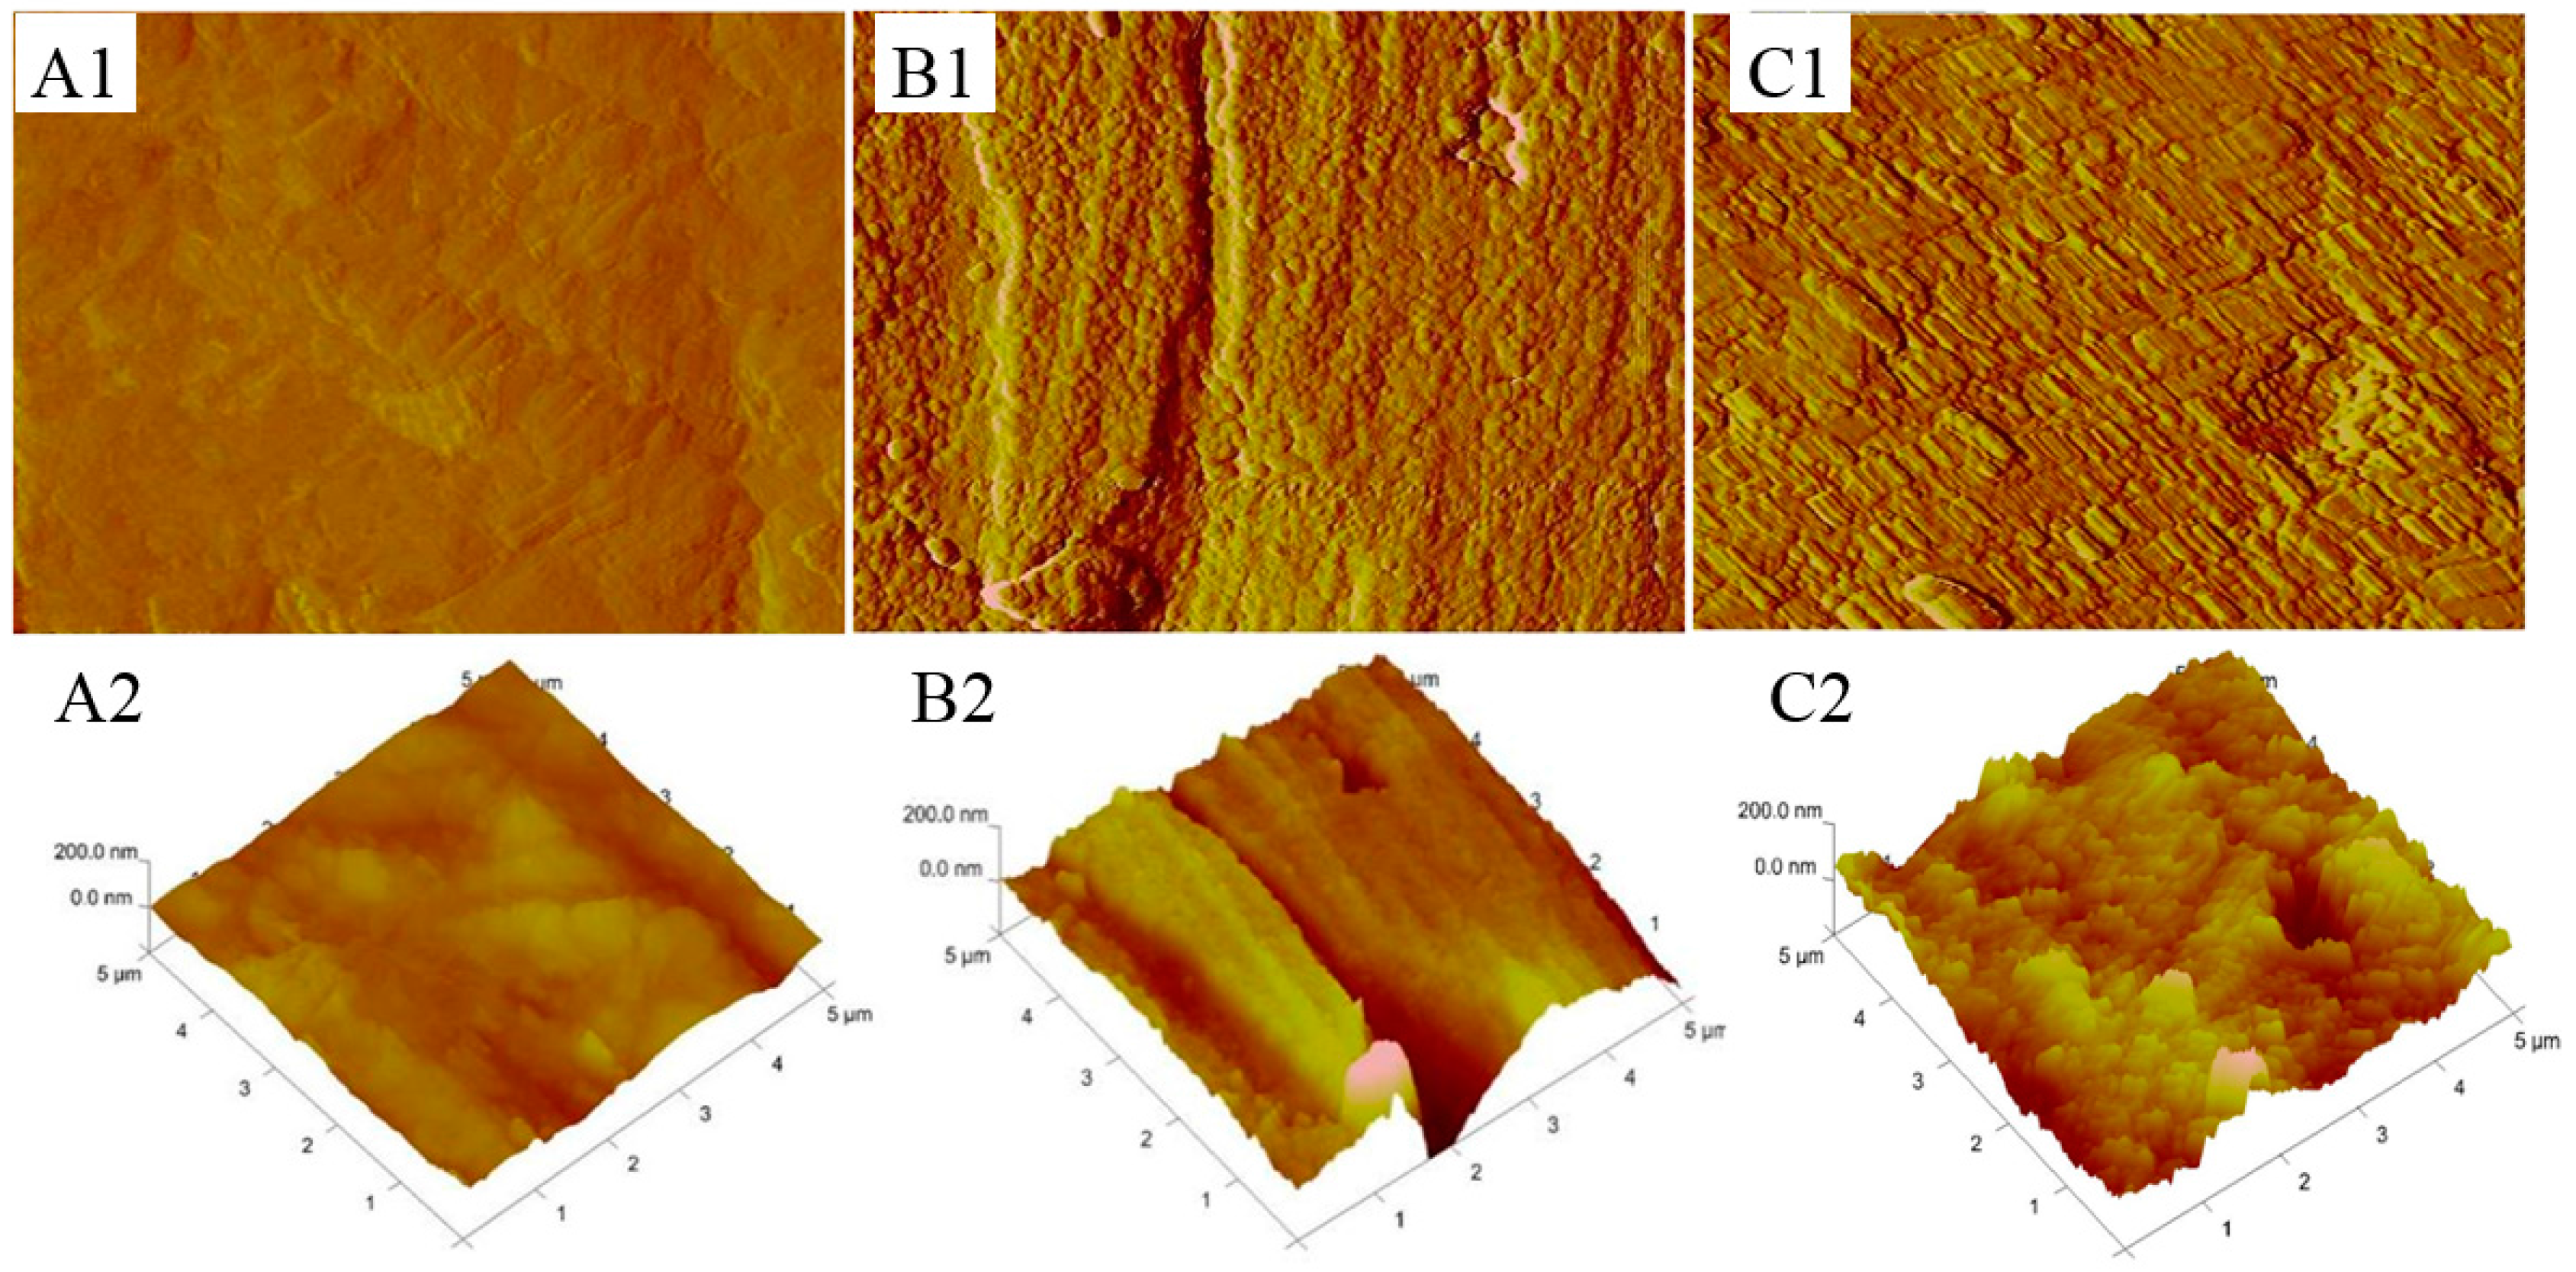
3.3.2. Structure Information Determined by Atomic Force Microscope (AFM)

To obtain more accurate structural information about the gold plates, the same gold plates, after SEM analysis, were analyzed using AFM. As shown in Figure 6, the structure of the three gold plates displayed different characteristics. The surface of the original gold plate was smooth and homogeneous, while its surface was rough and rugged after cyanidation, implying that the gold plate was corroded by the cyanide. Cyanide corrosion changed the surface structure of the gold plate, especially after Hg intensification cyanidation, where a large number of raised particles were evident across the whole surface. This structure change can be visually observed in the three-dimensional structure drawing in Figure 6A2,B2,C2. In contrast to the surface structure of the gold after common cyanidation, there were many overlapping, raised particles on the gold surface after Hg intensification cyanidation, making the structure rougher and more rugged than that of common cyanidation. This means that Hg intensification cyanidation makes gold plates suffer more serious cyanide corrosion than common cyanidation. In the same way, mercury ions can promote the removal of gold from gold materials and intensify gold cyanide dissolution.

3.4. Surface Product after Dissolution

Gold cyanide dissolution can be modeled by the following simplified equation [13,15,16]:
Au + CN = AuCN + e
AuCN + CN = Au ( CN ) 2
In the dissolution, the gold is the first cyanide resolved to the intermediate product, AuCN, which is insoluble in water, then the AuCN further reacts with CN and generates the final product of Au(CN)2, which is soluble in water. Meanwhile, the following equation occurs in the process of gold dissolution [17,18,19,20]:
AuCN + OH = Au ( OHCN ) + e
AuCN + X · OH = Au ( OH ) x + CN + ( X 1 ) · e
AuCN, Au(OHCN), and Au(OH)x, all insoluble in water, are the main intermediate products in cyanide dissolution. In order to reveal the products on the gold plate surface, such as AuCN, Au(OHCN), and Au(OH)x, and their quantitative relationship, the gold plates were analyzed after cyanide dissolution (common and Hg intensification).

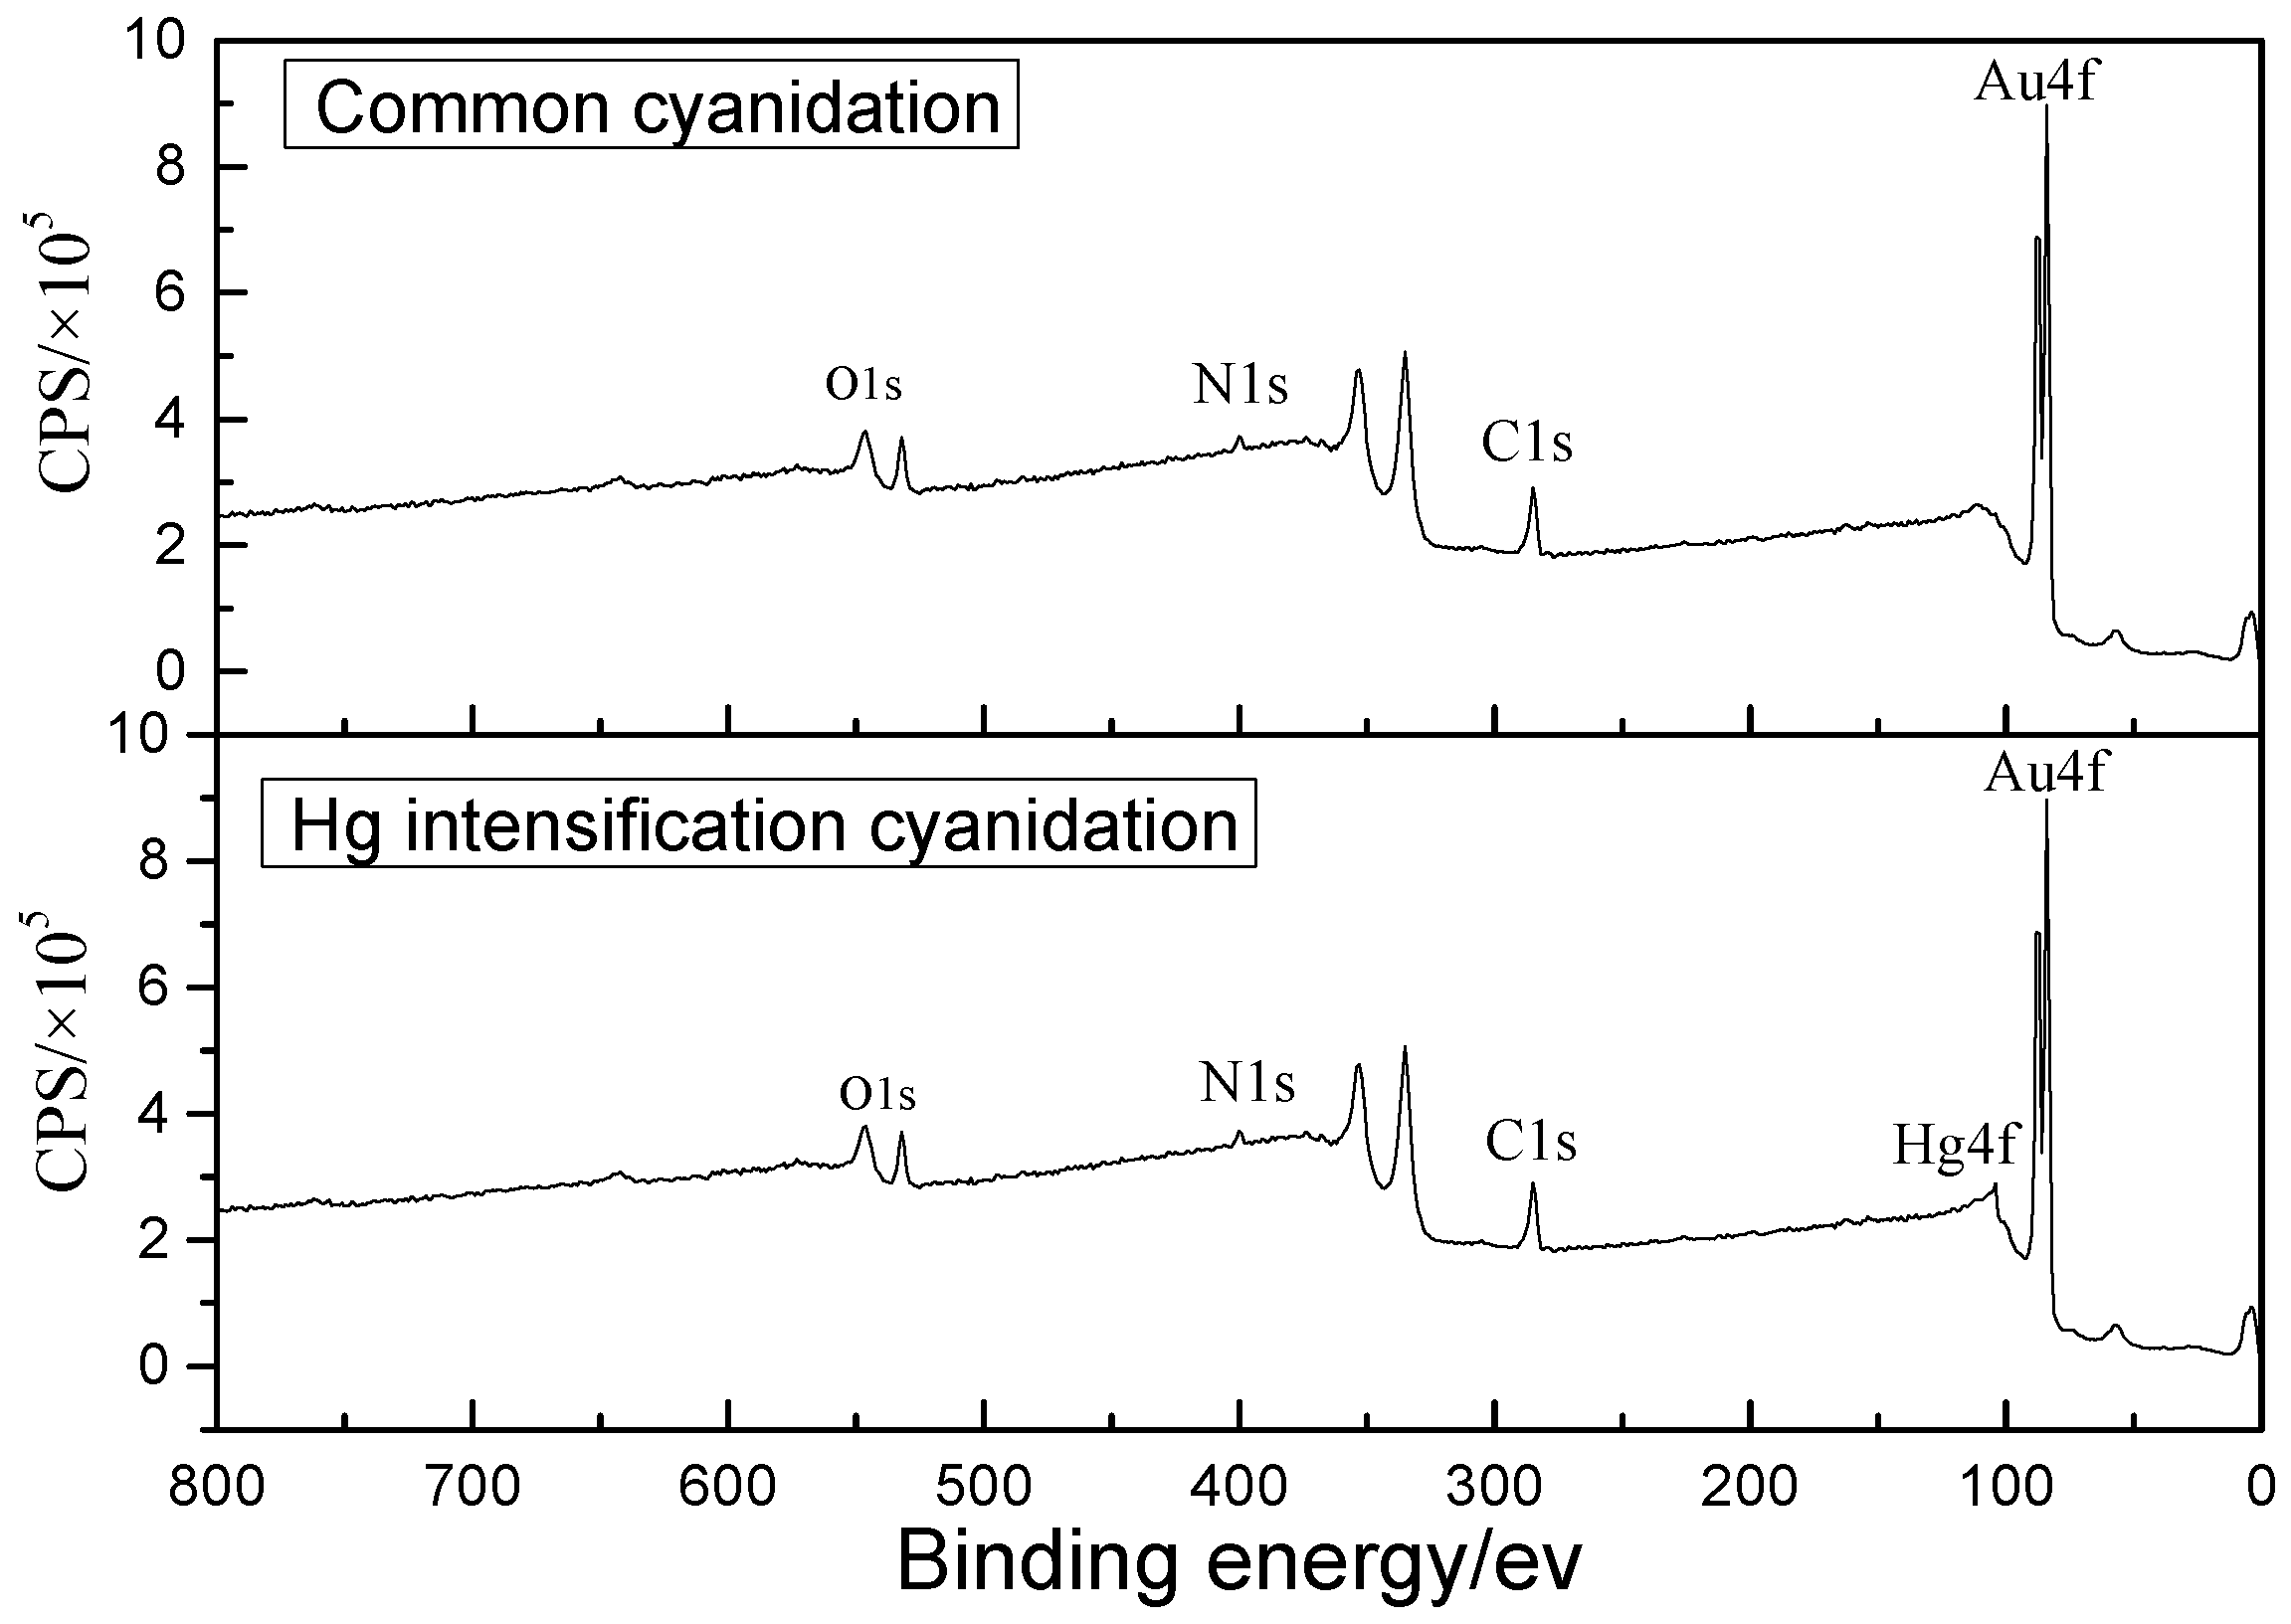
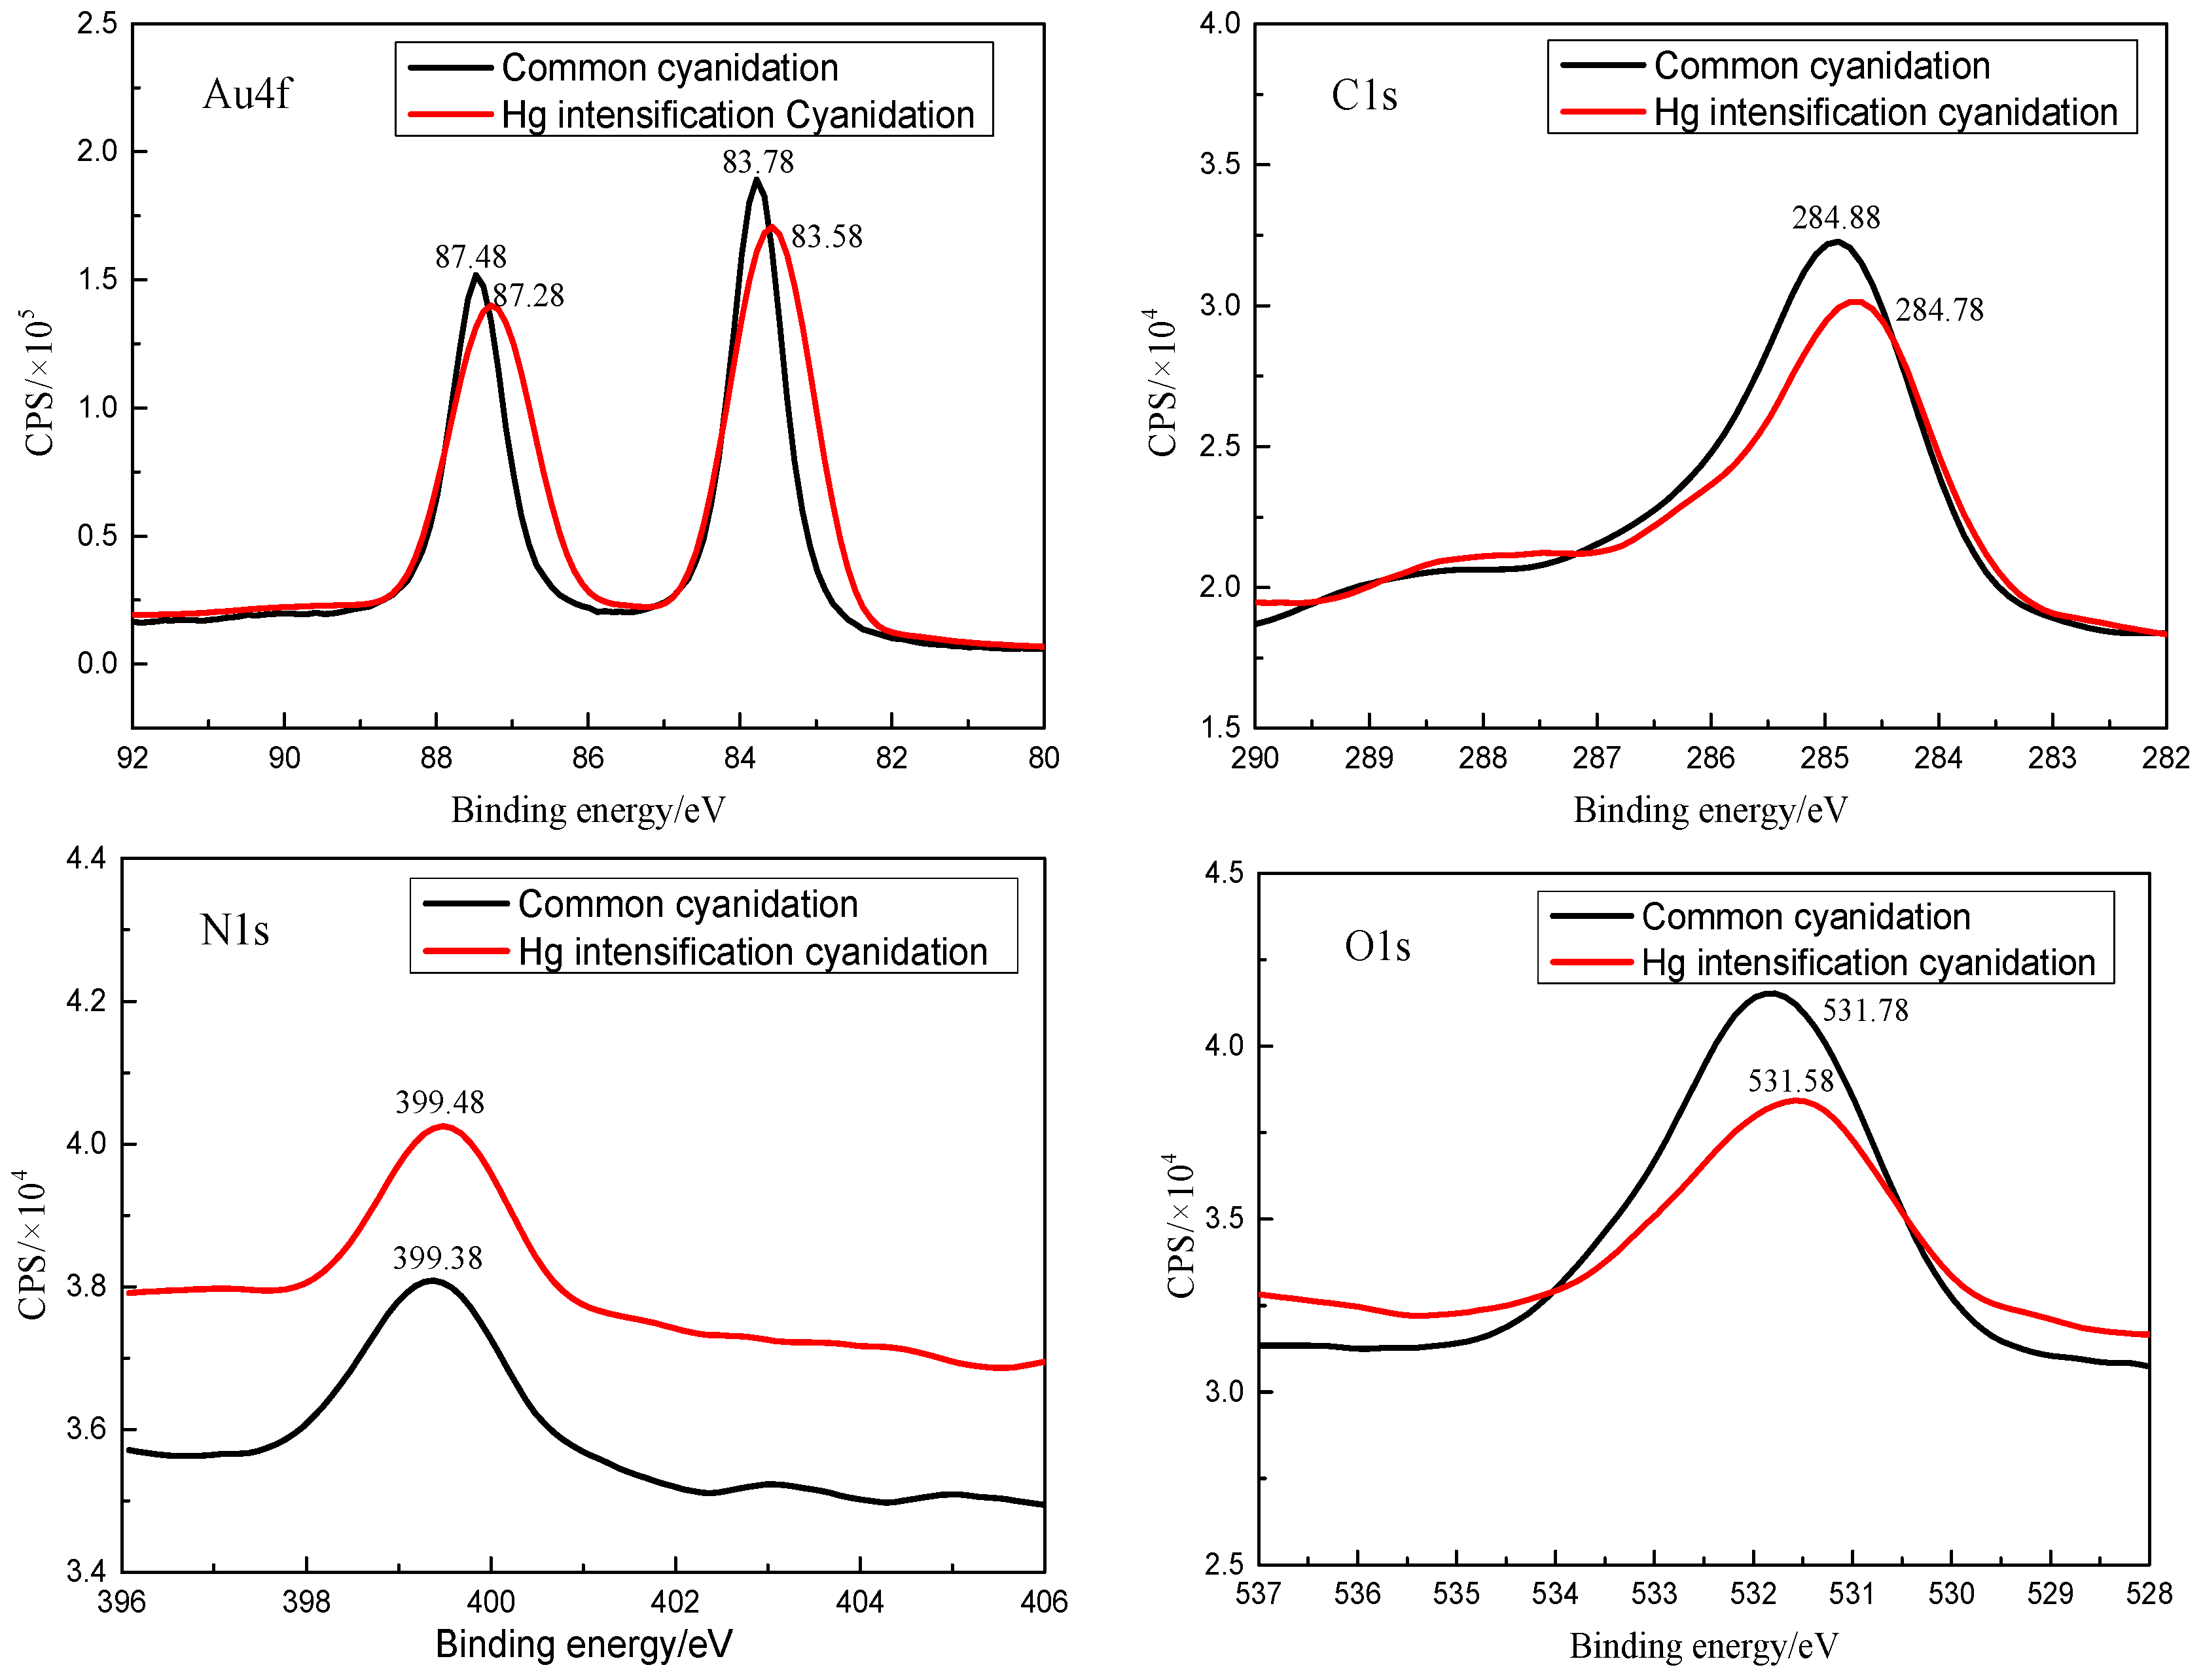
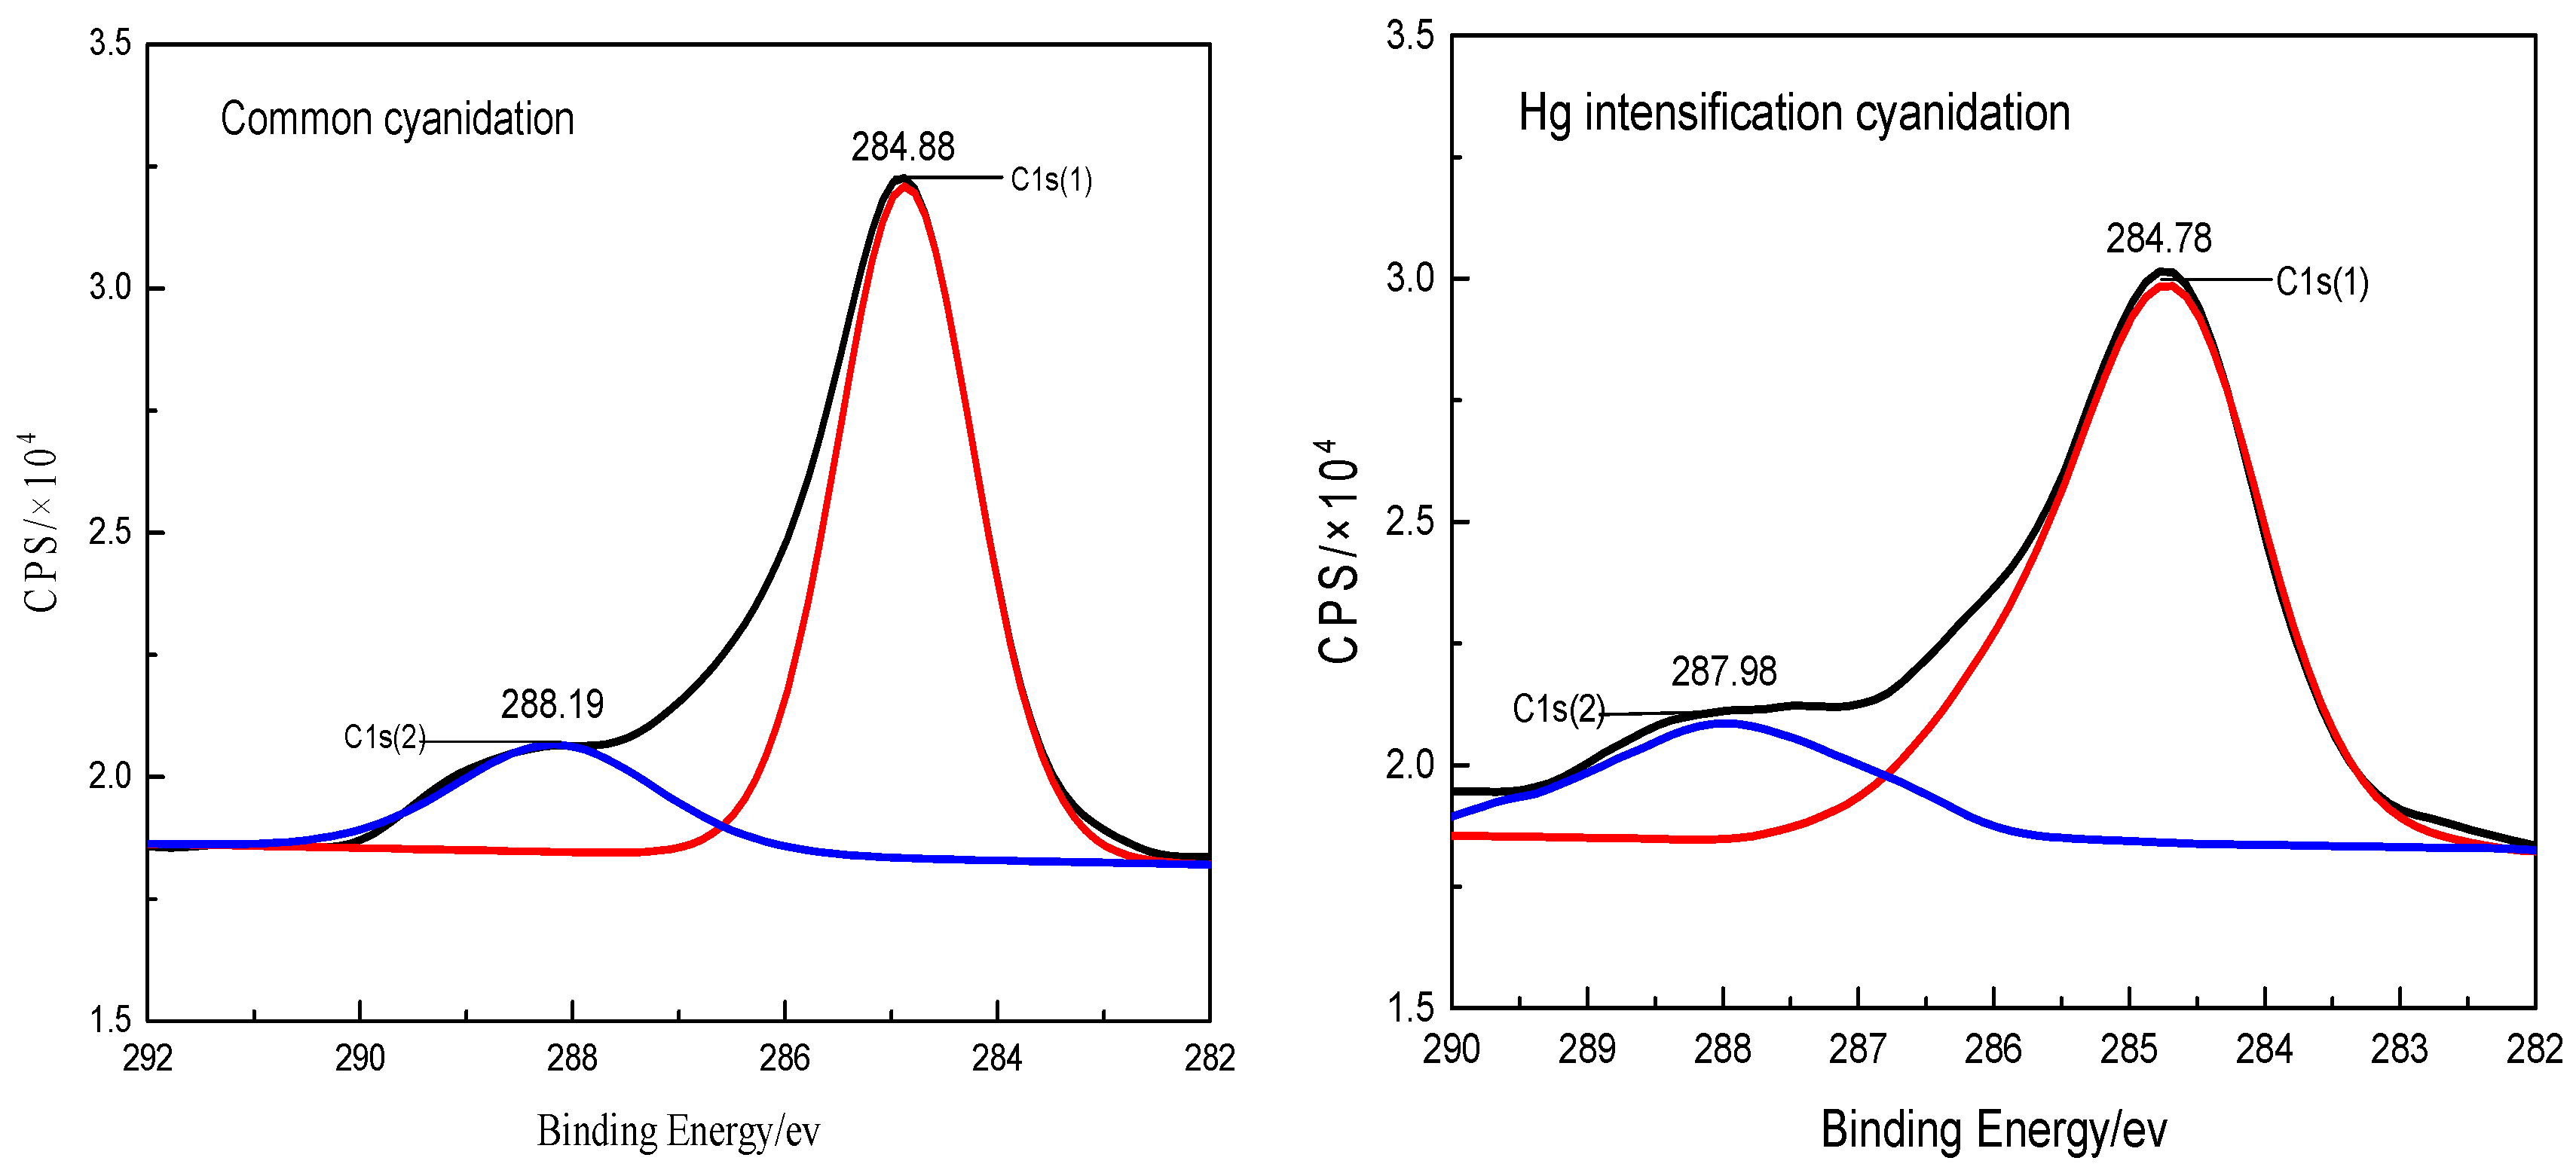
3.4.1. Surface Product Information Determined by X-ray Photoelectron Spectrometer (XPS)

After cyanide dissolution (common and Hg intensification), the gold plates were analyzed by XPS to obtain molecular level product information regarding their surface after cyanidation. The results of the XPS spectra (Au4f, C1s, N1s, O1s, and Hg4f) are shown in Figure 7. Both of the XPS spectra were similar, except that there was a weak Hg4f peak in the spectra of the Hg intensification, which was caused by the addition of mercury ions. The similar spectra meant that the surfaces of the two gold plates were composed of similar chemical elements. That the Au4f peak was larger than the others peak indicates that Au is the main element of the gold plate surface.
To reveal the surface product differences between the two gold plates, the spectra of Au4f, C1s, N1s, and O1s, were analyzed separately, as shown in Figure 8. Both of the Au4f spectra showed two peaks, while the C1s, N1s, and O1s spectra each exhibited only one peak. For the two Au spectra, the peaks with lower binding energy, at 83.58 and 83.78 eV, likely originated from Au, and the peaks with higher binding energy, at 87.28 and 87.48 eV, may be attributed to Au in the form of AuCN [21,22]. As shown by the N1s spectra, the binding energy of common cyanidation and Hg intensification cyanidation was 399.38 and 399.48 eV, respectively, which may have been derived from CN in the form of AuCN [23,24]. As shown by the O1s spectra, the binding energy of common cyanidation and Hg intensification cyanidation was 531.78 and 531.58 eV, respectively, which likely originated from OH in the form of Au(OH)x and Au(OHCN) [25]. Meanwhile, as shown by the C1s spectra, the binding energy of common cyanidation and Hg intensification cyanidation was 284.88 and 284.78 eV, respectively, which may be attributed to graphite carbon [26]. According to the comparison of peak areas, it is known that the quantities of CN and OH on the gold plate surface, are distinctly greater after common cyanidation than Hg intensification cyanidation. This means that a higher content of AuCN, Au(OH)x, and Au(OHCN) existed on the surface of the gold plate after common cyanidation compared to after Hg intensification cyanidation.
Moreover, the C1s resolved spectra of the two gold plates were analyzed, as shown in Figure 9. The peaks with lower binding energy, at 284.78 and 284.88 eV, may have originated from graphite carbon that was an insignificant component during the test [26]. The peaks with higher binding energy, at 287.98 and 288.19 eV, are likely attributed to CN in the form of AuCN [23,24,26]. The results for C1s-resolved spectra support the findings of the N1s XPS analysis.

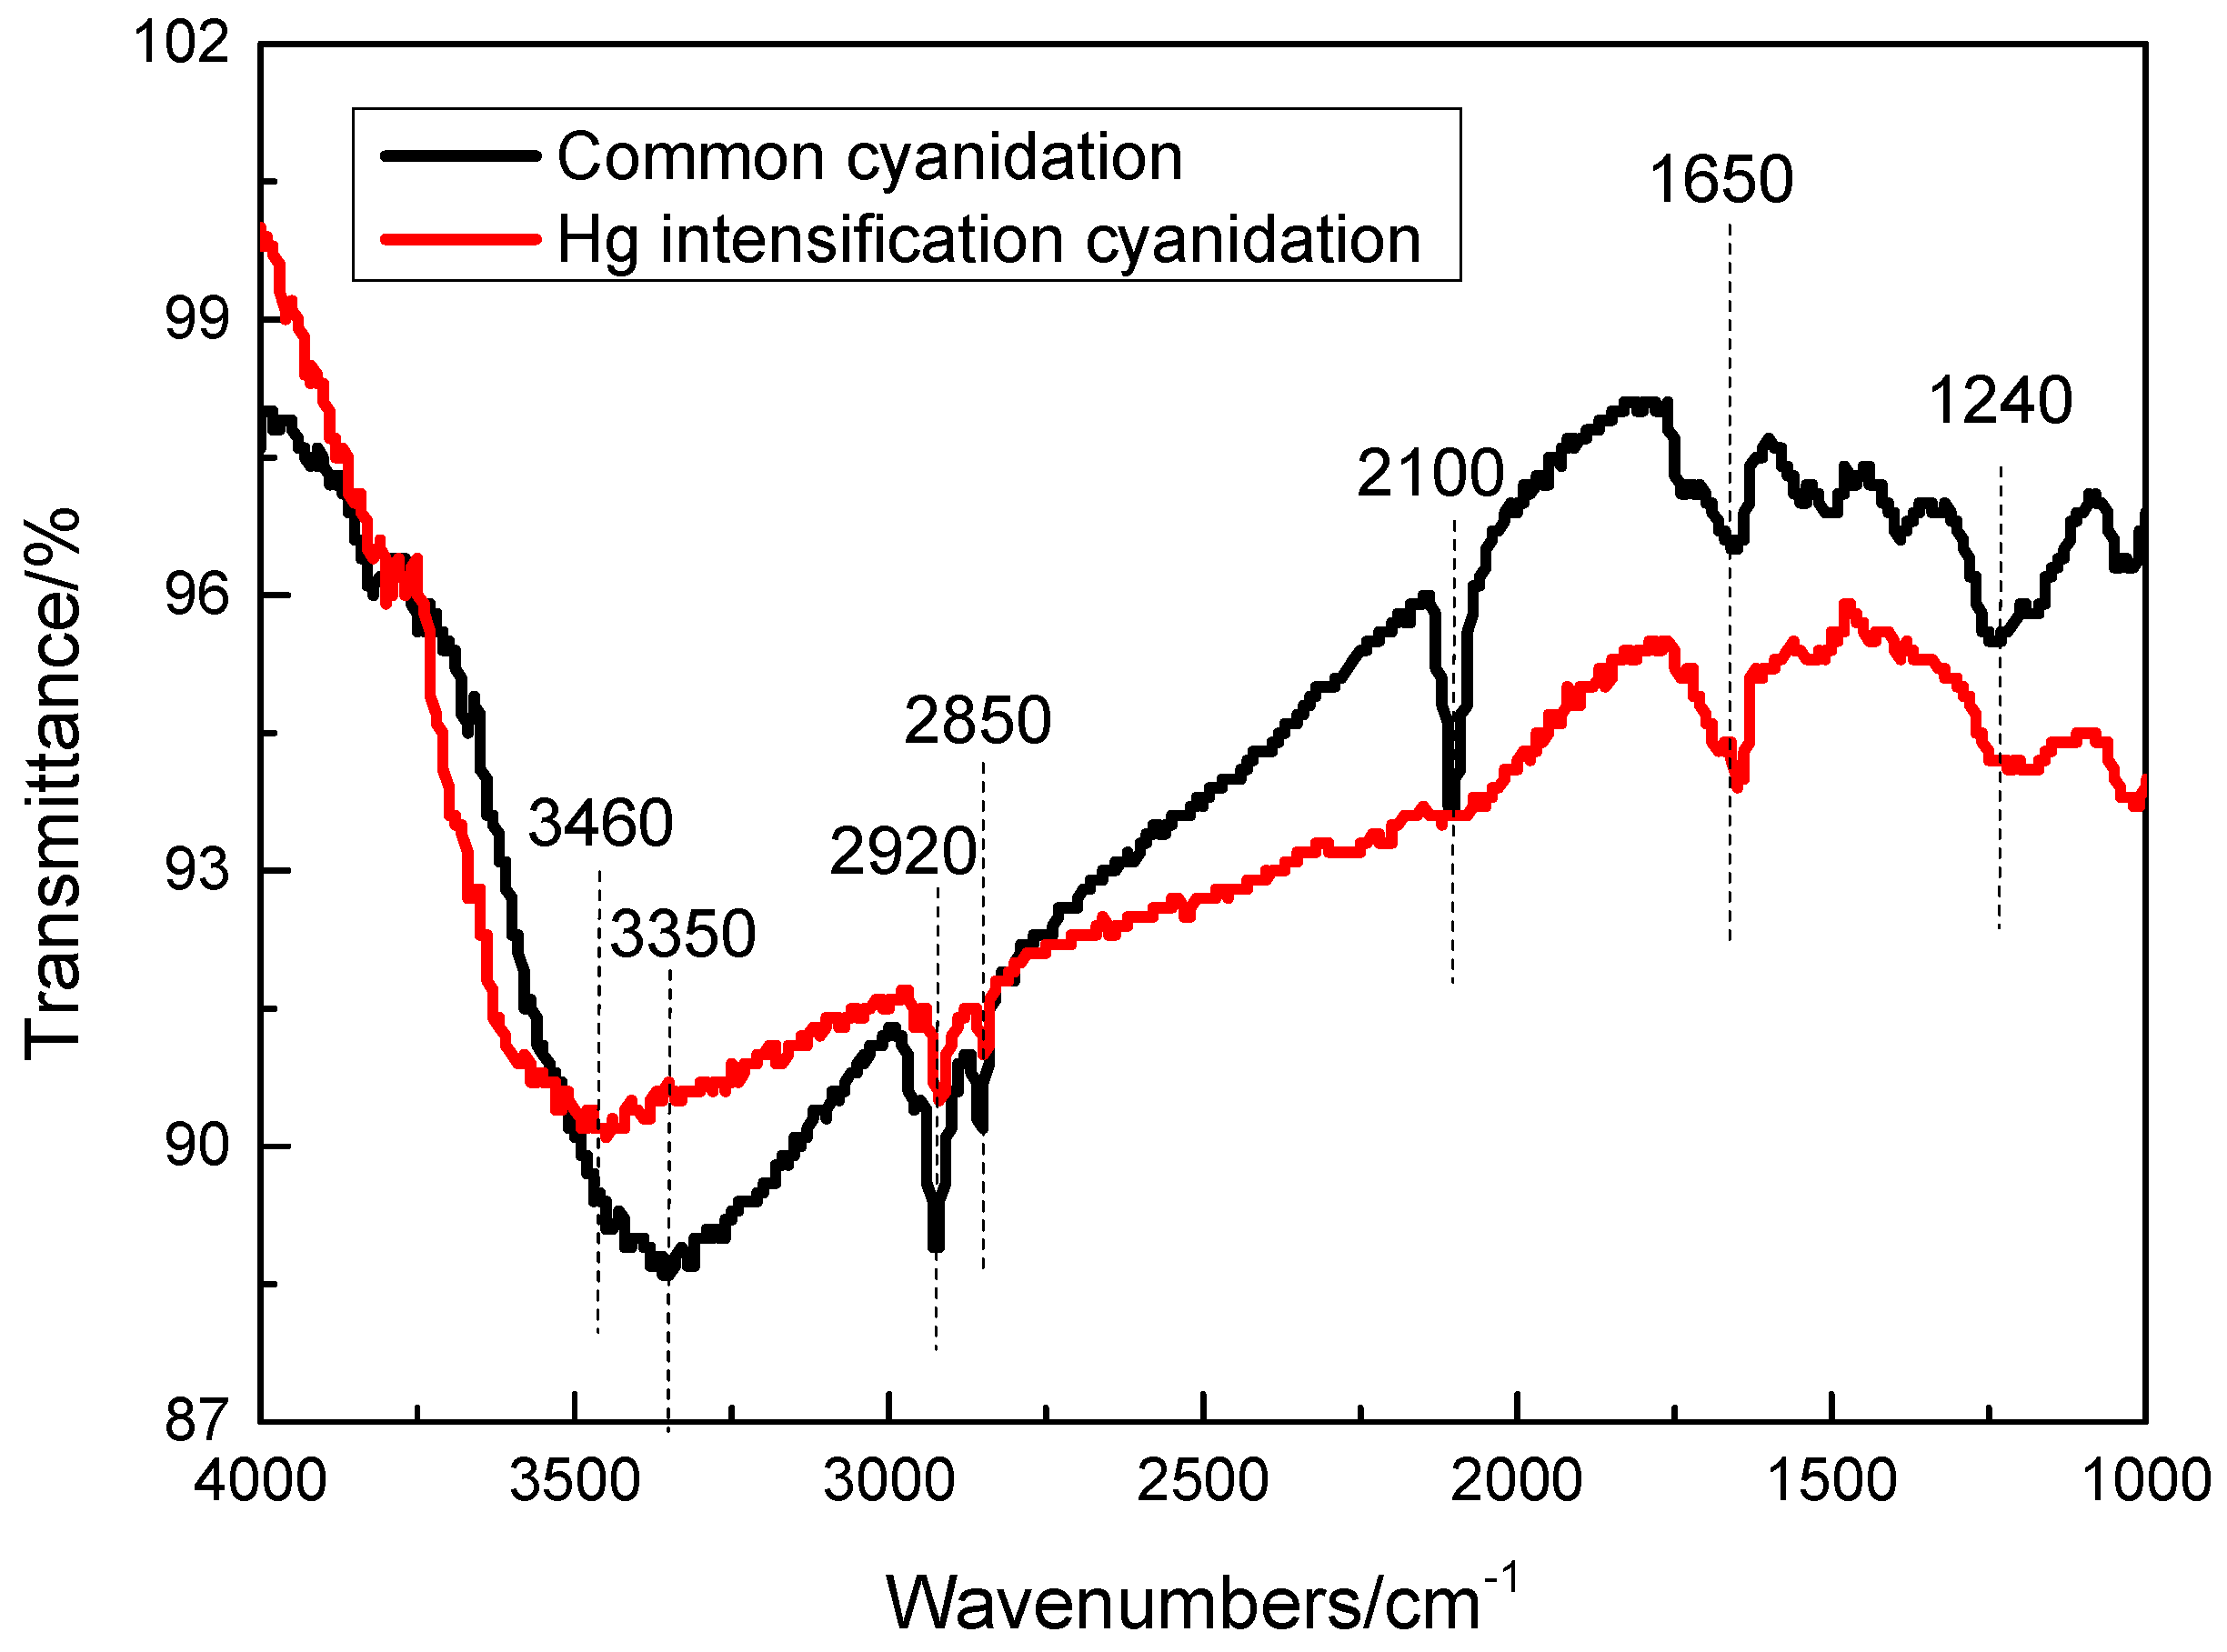
3.4.2. Surface Product Information Determined by Fourier Transform Infrared Spectroscopy (FT-IR)

After XPS analysis, the same gold plates were analyzed using FI-IR. The results of this analysis are shown in Figure 10 and Table 2. Comparing the two spectra, their curves showed some similarities. The peaks at 1240 and 1650 cm−1, that were evident on both of the spectra, were alcohol compounds and nitro compounds, respectively [27,28,29]. These may have been the residues of the nitric acid and ethanol used in the cleaning process of the gold plate. The peaks at 2850 and 2920 cm−1, that were also evident on both of the spectra, were hydrocarbon compounds [27,28,30]. The hydrocarbon compounds were a mixed impurity introduced during the cyanide dissolution because the original composition was Au, NaOH, NaCN, H2O, and HgSO4. The peaks at 3350 and 3460 cm−1 were alkaline compounds [27,28,30], caused by sodium hydroxide. Moreover, there was a peak at 2100 cm−1 on the spectrum of common cyanidation. This was the cyanide compound (C≡N) [31,32], meaning that considerable amounts of cyanide compound were evident on the gold plate surface after common cyanidation. Based on Equations (1)–(4), the Au(CN)2 product is soluble, which indicates that it will be removed from the gold plate surface and dissolve into the cyanide solution. The insoluble products, AuCN and Au(OHCN), cannot dissolve into the cyanide solution so deposit on the gold plate surface [33]. Therefore, the considerable cyanide compounds that existed on the surface of the gold plates after common cyanidation were AuCN and Au(OHCN). This peak (C≡N) did not exist on the spectrum of Hg intensification dissolution, indicating that a large number of cyanide compounds were not evident on the surface. This means mercury ions can promote the conversion of AuCN to Au(CN)2 and obstruct the generation of Au(OHCN), preventing the deposition of AuCN and Au(OHCN) on the gold surface.
Comprehensive analysis of the XPS and FT-IR results showed that the insoluble intermediate products, AuCN, Au(OHCN), and Au(OH)x, were constantly produced and deposited on the gold surface, forming a passivation membrane, which obstructs the reaction of gold and cyanide during common cyanidation. Mercury ions promoted the conversion of AuCN to Au(CN)2 and obstructed the generation of Au(OHCN) and Au(OH)x, which prevented their deposition on the gold surface, maintained good contact between the gold and cyanide, and, finally, ensured the gold was adequately leached by the cyanide.

4. Conclusions

The leaching behavior of two types of materials, sulphide gold concentrate and oxide gold ore, and the dissolution behavior, structure information, and surface product of gold plates, were investigated to analyze the intensification of mercury ions on gold cyanide leaching. A summary of the results obtained in this study is as follows:
(1)
Mercury ions intensified the leaching of sulphide gold concentrate and oxide gold ore, and gold recovery was significantly improved. Meanwhile, mercury ions could be recycled and reutilized to intensify gold cyanide leaching, with no pollution problems brought about by mercury intensification. After adding 10−5 M Hg, gold recovery was about 80% after only two hours of leaching and reached close to 90% after 12 hours leaching. Similarly, the pure gold plate was also intensified by mercury ions.
(2)
Mercury ions had an obvious effect on the surface structure of the gold plate during cyanide dissolution. Mercury ions intensified the cyanidation corrosion on the gold surface and destroyed its structure, resulting in a large number of deep ravines and raised particles covering the whole surface. This loose structure added to the surface contact area between the gold and cyanide, accelerating the gold dissolution.
(3)
With common cyanidation, the insoluble intermediate products of AuCN, Au(OHCN), and Au(OH)x were constantly deposited onto the gold surface, forming a passivation membrane that obstructed the reaction of gold and cyanide. Mercury ions promoted the conversion of AuCN to Au(CN)2 and obstructed the generation of Au(OHCN) and Au(OH)x, which prevented their deposition on the gold surface, promoted good contact between the gold and cyanide, and, finally, ensured the gold was adequately leached by the cyanide.

Acknowledgments

This work was supported by the National Natural Science foundation of China (No. 51574284 and No. 51504293) and the Postdoctoral Science Foundation of Central South University.

Author Contributions

Qiang Zhong, Yongbin Yang, and Lijuan Chen conceived and designed the experiments; Qiang Zhong performed the experiments; Yongbin Yang and Lijuan Chen analyzed the data; Qian Li and Bin Xu contributed reagents, materials, and analysis tools; Qiang Zhong and Qian Li wrote the paper; and Tao Jiang reviewed it before submission.

Conflicts of Interest

The authors declare no conflict of interest.

References

  1. Bas, A.D.; Ghali, E.; Choi, Y. A review on electrochemical dissolution and passivation of gold during cyanidation in presence of sulphides and oxides. Hydrometallurgy 2017, 172, 30–44. [Google Scholar] [CrossRef]
  2. Bas, A.D.; Zhang, W.; Ghali, E.; Choi, Y. A study of the electrochemical dissolution and passivation phenomenon of roasted gold ore in cyanide solutions. Hydrometallurgy 2015, 158, 1–9. [Google Scholar] [CrossRef]
  3. Acar, S. Process development metallurgical studies for gold cyanidation process. Miner. Metall. Proc. 2016, 33, 161–171. [Google Scholar] [CrossRef]
  4. Guzman, L.; Segarra, M.; Chimenos, J.M.; Fernandez, M.A.; Espiell, F. Gold cyanidation using hydrogen peroxide. Hydrometallurgy 1999, 52, 21–35. [Google Scholar] [CrossRef]
  5. Nunan, T.O.; Viana, I.L.; Peixoto, G.C.; Ernesto, H.; Verster, D.M.; Pereira, J.H.; Bonfatti, J.M.; Teixeira, L.A.C. Improvements in gold ore cyanidation by pre-oxidation with hydrogen peroxide. Miner. Eng. 2017, 108, 67–70. [Google Scholar] [CrossRef]
  6. Lin, H.K.; Chen, X. Electrochemical study of gold dissolution in cyanide solution. Miner. Metall. Proc. 2001, 18, 147–153. [Google Scholar]
  7. Yang, L.; Jia, F.; Song, S. Recovery of [Au(CN)2] from gold cyanidation with graphene oxide as adsorbent. Sep. Purif. Technol. 2017, 186, 63–69. [Google Scholar] [CrossRef]
  8. Guzman, L.; Chimenos, J.M.; Fernandez, M.A.; Segarra, M.; Espiell, F. Gold cyanidation with potassium persulfate in the presence of a thallium (I) salt. Hydrometallurgy 2000, 54, 185–193. [Google Scholar] [CrossRef]
  9. Tshilombo, A.F.; Sandenbergh, R.F. Electrochemical study of the effect of lead and sulphide ions on the dissolution rate of gold in alkaline cyanide solutions. Hydrometallurgy 2001, 60, 55–67. [Google Scholar] [CrossRef]
  10. Deschenes, G.; Lastra, R.; Brown, J.R.; Jin, S.; May, O.; Ghali, E. Effect of lead nitrate on cyanidation of gold ores: Progress on the study of the mechanisms. Miner. Eng. 2000, 13, 1263–1279. [Google Scholar] [CrossRef]
  11. Jeffrey, M.I.; Ritchie, I.M. The leaching of gold in cyanide solutions in the presence of impurities II. The effect of silver. J. Electrochem. Soc. 2000, 147, 3272–3276. [Google Scholar] [CrossRef]
  12. Yang, Y.B.; Li, Q.; Li, G.H.; Guo, Y.F.; Huang, Z.C.; Jiang, T. An electrochemical investigation on intensification of gold cyanidation by heavy metal ions. In EPD Congress 2005; Schlesinger, M.E., Ed.; TMS (The Minerals, Metals & Materials Society): Pittsburgh, PA, USA, 2005; pp. 977–984. [Google Scholar]
  13. Li, Q.; Jiang, T.; Yang, Y.B.; Li, G.H.; Guo, Y.F.; Qiu, G.Z. Co-intensification of cyanide leaching gold by mercury ions and oxidant. Trans. Nonferr. Met. Soc. 2010, 20, 1521–1526. [Google Scholar] [CrossRef]
  14. Yang, Y.B.; Li, Q.; Jiang, T.; Guo, Y.F.; Li, G.H.; Xu, B. Co-intensification of gold leaching with heavy metals and hydrogen peroxide. Trans. Nonferr. Met. Soc. 2010, 20, 903–909. [Google Scholar] [CrossRef]
  15. Arthur, D.M.M. A study of gold reduction and oxidation in aqueous solutions. J. Electrochem. Soc. 1972, 119, 672–677. [Google Scholar] [CrossRef]
  16. Cathro, K.J.; Koch, D.F.A. The anodic dissolution of gold in cyanide solutions. J. Electrochem. Soc. 1964, 111, 1416–1420. [Google Scholar] [CrossRef]
  17. Li, J. Electrochemical study of silver dissolution in cyanide solutions. J. Electrochem. Soc. 1993, 140, 1921–1927. [Google Scholar] [CrossRef]
  18. Pan, T.P.; Wan, C.C. Anodic behaviour of gold in cyanide solution. J. Appl. Electrochem. 1979, 9, 653–655. [Google Scholar] [CrossRef]
  19. Eisenmann, E.T. Kinetics of the electrochemical reduction of dicyanoaurate. J. Electrochem. Soc. 1978, 125, 717–723. [Google Scholar] [CrossRef]
  20. Sandenbergh, R.F.; Miller, J.D. Catalysis of the leaching of gold in cyanide solutions by lead, bismuth and thallium. Miner. Eng. 2015, 14, 1379–1386. [Google Scholar] [CrossRef]
  21. Moulder, J.F.; Chastain, J.; King, R.C. Handbook of x-ray photoelectron spectroscopy: A reference book of standard spectra for identification and interpretation of XPS data. Chem. Phys. Lett. 1995, 220, 7–10. [Google Scholar]
  22. Bas, A.D.; Safizadeh, F.; Zhang, W.; Ghali, E.; Choi, Y. Active and passive behaviors of gold in cyanide solutions. Trans. Nonferr. Met. Soc. 2015, 25, 3442–3453. [Google Scholar] [CrossRef]
  23. Ma, L.; Fan, H.; Wang, J.; Zhao, Y.; Tian, H.; Dong, G. Water-assisted ions in situ intercalation for porous polymeric graphitic carbon nitride nanosheets with superior photocatalytic hydrogen evolution performance. Appl. Catal. B-Environ. 2016, 190, 93–102. [Google Scholar] [CrossRef]
  24. Obrosov, A.; Gulyaev, R.; Ratzke, M.; Volinsky, A.A.; Bolz, S.; Naveed, M.; Weiß, S. XPS and AFM investigations of Ti-Al-N coatings fabricated using DC magnetron sputtering at various nitrogen flow rates and deposition temperatures. Metals 2017, 7, 52. [Google Scholar] [CrossRef]
  25. Štrbac, S.; Smiljanić, M.; Rakočević, Z. Spontaneously deposited Rh on Au(111) observed by AFM and XPS: Electrocatalysis of hydrogen evolution. J. Electrochem. Soc. 2016, 163, 3027–3033. [Google Scholar] [CrossRef]
  26. Goff, A.L.; Artero, V.; Metayé, R.; Moggia, F.; Jousselme, B.; Razavet, M.; Tran, P.D.; Palacin, S.; Fontecave, M. Immobilization of FeFe hydrogenase mimics onto carbon and gold electrodes by controlled aryldiazonium salt reduction: An electrochemical, XPS and ATR-IR study. Int. J. Hydrog. Energy 2010, 35, 10790–10796. [Google Scholar] [CrossRef]
  27. Geng, W.; Nakajima, T.; Takanashi, H.; Ohki, A. Analysis of carboxyl group in coal and coal aromaticity by Fourier transform infrared (FT-IR) spectrometry. Fuel 2009, 88, 139–144. [Google Scholar] [CrossRef]
  28. Barroso-Bogeat, A.; Alexandre-Franco, M.; Fernández-González, C.; Gómez-Serrano, V. FT-IR analysis of pyrone and chromene structures in activated carbon. Energy Fuels 2014, 28, 4096–4103. [Google Scholar] [CrossRef]
  29. Ibrahim, K.A. Synthesis and characterization of some new aromatic diamine monomers from oxidative coupling of anilines and substituted aniline with 4-amino-N,N-dimethyl aniline. Arab. J. Chem. 2014, 7, 1017–1023. [Google Scholar] [CrossRef]
  30. Zhong, Q.; Yang, Y.B.; Jiang, T.; Li, Q.; Xu, B. Xylene activation of coal tar pitch binding characteristics for production of metallurgical quality briquettes from coke breeze. Fuel Process. Technol. 2016, 148, 12–18. [Google Scholar] [CrossRef]
  31. Shriver, D.F.; Shriver, S.A.; Anderson, S.E. Ligand field strength of the nitrogen end of cyanide and structures of cubic cyanide polymers. Inorg. Chem. 1965, 4, 725–730. [Google Scholar] [CrossRef]
  32. Tseng, T.F.; Yang, Y.L.; Lin, Y.J.; Lou, S.L. Effects of electric potential treatment of a chromium hexacyanoferrate modified biosensor based on PQQ-dependent glucose dehydrogenase. Sensors 2010, 10, 6347–6360. [Google Scholar] [CrossRef] [PubMed]
  33. Kirk, D.W.; Foulkes, F.R. Anodic dissolution of gold in aqueous alkaline cyanide solutions at low overpotentials. J. Electrochem. Soc. 1980, 127, 1993–1997. [Google Scholar] [CrossRef]
Figure 1. The effect of mercury ions with different content on gold leaching (in sulphide gold concentrate).
Metals 08 00080 g001
Figure 2. The effect of mercury ions with different content on gold leaching (in oxide gold ore).
Metals 08 00080 g002
Figure 3. Gold dissolution at different time points.
Metals 08 00080 g003
Figure 4. The microstructure of different gold surfaces, as shown by SEM; (A1, B1) The original gold plates; (A2) The gold plate after common cyanidation; (B2) The gold plate after Hg intensification cyanidation.
Metals 08 00080 g004
Figure 5. The microstructure of the gold surface, as shown by SEM; (A) The original gold plate; (BF) dissolution after one day, two days, three days, four days, and five days, respectively.
Metals 08 00080 g005
Figure 6. The microstructure of different gold surfaces, as shown by AFM; (A1,A2) The original gold plate; (B1,B2) The gold plate after common cyanidation; (C1,C2) The gold plate after Hg intensification cyanidation.
Metals 08 00080 g006
Figure 7. XPS spectra of the gold plates after cyanidation (common and Hg intensification).
Metals 08 00080 g007
Figure 8. Au4f, C1s, N1s, and O1s, XPS spectra of the gold plates after cyanidation (common and Hg intensification).
Metals 08 00080 g008
Figure 9. C1s XPS-resolved spectra of the gold plates after cyanidation (common and Hg intensification).
Metals 08 00080 g009
Figure 10. Infrared spectra of the different gold plates.
Metals 08 00080 g010
Table 1. Chemical composition of gold concentrate (%).
SampleAu *Ag *CuPbZnFeS
Sulphide gold concentrate73.21176.052.190.981.0329.5728.34
Oxide gold ore4.420.360.050.040.053.210.16
* Unit g/t.
Table 2. FT-IR (Fourier Transform Infrared spectroscopy) spectra of the gold plates under different conditions.
Position (cm−1)AssignmentGroup
1240O–HAlcohol compound
1650NO2Nitro compound
2100C≡NCyanide compound
2850, 2920C–HHydrocarbon compound
3460, 3550O–HAlkaline compound

