Effects of Cold Swaging on Mechanical Properties and Magnetic Susceptibility of the Zr–1Mo Alloy
by
Maki Ashida
1, 
Masahiro Morita
1,
Yusuke Tsutsumi
1,2,*,
Naoyuki Nomura
3,
Hisashi Doi
1,
Peng Chen
1 and
Takao Hanawa
1 1
Department of Metallic Biomaterials, Institute of Biomaterials and Bioengineering, Tokyo Medical and Dental University (TMDU), Tokyo 101-0062, Japan
2
Graduate School of Engineering, The University of Tokyo, Tokyo 113-8656, Japan
3
Department of Materials Processing, Graduate School of Engineering, Tohoku University, Sendai 980-8579, Japan
*
Author to whom correspondence should be addressed.
Metals 2018, 8(6), 454; https://doi.org/10.3390/met8060454
Submission received: 20 April 2018
/
Revised: 23 May 2018
/
Accepted: 12 June 2018
/
Published: 13 June 2018
(This article belongs to the Special Issue Zirconium Alloys)
Abstract
:Zr alloy is expected to decrease the artifact volume of magnetic resonance imaging (MRI) due to its relatively small magnetic susceptibility. To improve the mechanical properties of a Zr–1mass%Mo alloy that yielded a reduced artifact volume during MRI, the alloy was melted, hot-forged, and cold-swaged with area reduction ratios of 30%, 50%, 60%, 70%, and 84%. The effects of cold swaging on the microstructure, mechanical properties, and magnetic susceptibility of the alloy were investigated. Before cold swaging, the microstructure consisted of laminated and layered α- and β-phases; however, after cold swaging, the α- and β-phases were bent and distorted, and the α-phase became oriented along the {10 0} plane. The ultimate tensile strength and elongation to fracture of the Zr–1Mo alloy after cold swaging with an 84% area reduction were 1001 MPa and 10.7%, respectively. The alloy only experienced work-hardening when subjected to large deformations. On the other hand, the change in magnetic susceptibility with cold-swaging was small, from 13.85 × 10⁻⁹ to 14.87 × 10⁻⁹ m3·kg−1. Thus, a good balance of mechanical properties and low magnetic susceptibility in the Zr–1Mo alloy was obtained by cold swaging. Therefore, this alloy is suitable for utilization in medical devices and is expected to decrease the artifact volume.
1. Introduction
Magnetic resonance imaging (MRI) is widely used in surgical diagnosis because it does not involve exposure to radiation, unlike X-ray imaging. However, MRI is affected by artifacts, e.g., defects in the MR images caused by metallic devices implanted in the human body. These artifacts are caused by the differences in magnetic susceptibility of the implanted metallic devices and the surrounding human tissue. The artifact volume is related to the magnetic susceptibility of the implanted metallic devices. Therefore, metallic implant materials with low magnetic susceptibilities are required to reduce the artifact volume.
For 316L-type stainless steel and Co–Cr alloys, the artifact volume is relatively large because the magnetic susceptibilities of the constituent elements, namely Fe, Ni, and Co, are quite high [1]. Ti alloys also show artifacts, despite the relatively low magnetic susceptibility of Ti. Zr is an attractive metal for decreasing the artifact volume because of its low magnetic susceptibility. In addition, Zr has a high corrosion resistance and low cytotoxicity [2]. However, the strength of commercially pure Zr is similar to that of pure Ti and much lower than Ti alloys, rendering Zr insufficient for use in medical devices. Consequently, it is necessary to employ Zr in alloys containing additives with low magnetic susceptibility, high safety, and good solid solution strengthening. Zr–Nb [3,4,5,6,7,8,9] and Zr–Mo [2,10] alloys have been subject to extensive study because Nb and Mo both show low magnetic susceptibilities and are non-cytotoxic. In recent years, the Zr–Cu alloy [11] and Zr–Ru alloy [12] have been reported to have low magnetic susceptibility. The magnetic susceptibilities and mechanical properties of these alloys are influenced by their crystal phases [10]. Zr alloys have multiple phases, including two stable and three metastable phases. The stable phases are the α- and β-phases, while the metastable phases are the α’-, α’’-, and ω-phases [13]. The magnetic susceptibility of the ω-phase is the lowest, despite its brittleness. While the mechanical properties of the β-phase are good, its magnetic susceptibility is relatively high. The α-phase exhibits a good balance between mechanical properties and magnetic susceptibility.
Previous studies have employed small, arc-melted ingots of Zr–Mo alloys with weights of approximately 50 g, subjected to neither mechanical processing, nor heat treatment. Among the Zr–Mo alloys, the Zr–1mass%Mo alloy was reported to show a good balance between mechanical properties and low magnetic susceptibility [10]. It has also been reported that the Zr–1Mo alloy shows a high corrosion resistance among Zr–1X (Ti, Nb, Mo, Cu, Au, Pd, Ag, Ru, Hf and Bi) alloys [14]. In our previous study, we performed large-scale melting using an industrial method and casting to produce a large ingot of Zr–1Mo to investigate the possibility of producing highly homogeneous ingots [15]. We succeeded in preparing a homogeneous ingot with the chemical composition of Zr–1Mo. The microstructure comprised coarse colony-like structures of the plate-like α-phase and a thin β-phase. Precipitation of the ω-phase was observed in the β-phase. The elongation of the alloy was 23%, and its magnetic susceptibility was 12.4 × 10⁻⁹ m3·kg−1. Thus, we confirmed the feasibility of producing homogeneous large-scale ingots of Zr–1Mo alloy with high elongation and low magnetic susceptibility. However, the tensile strength of the alloy was as low as 670 MPa. Therefore, it is necessary to apply thermomechanical processing to strengthen the alloy. The processes of hot forging and cold swaging have been reported for Ti alloys [16,17,18].
In this study, a large ingot of Zr–1Mo alloy was prepared by melting and then subjected to hot forging and cold swaging in order to improve the strength of the alloy while maintaining a low magnetic susceptibility. The effects of cold swaging on the mechanical properties and magnetic susceptibility of the Zr–1Mo alloy were investigated.
2. Materials and Methods
2.1. Process and Materials
A Zr–1mass%Mo alloy was formed by melting a Zr crystal bar (99.8%) and a piece of Mo wire (99.9%) in a cold-crucible induction melting furnace. The Mo wire was tightly wound around the Zr bar and placed in the upper part of the crucible. Melting was performed at a power of 200 kW for at least 15 min in an Ar atmosphere. After the first melting process, the ingot was flipped and re-melted under identical conditions. This process was repeated at least three times to minimize segregation. The resultant ingot had a diameter of 130 mm and weight of 11 kg. Subsequently, the ingot was subjected to hot forging at 1050 °C to form a homogenized bar with a diameter of 50 mm; the oxidized skin was then peeled off, decreasing the diameter to 40 mm. Cold swaging was performed at room temperature with area reduction ratios of 30%, 50%, 60%, 70%, and 84%, as shown in Figure 1. The area reduction ratios were measured based on the cross-sectional area.
2.2. Characterization of Microstructure
The phase configurations and microstructures of Zr–1Mo after hot forging and cold swaging were characterized using an X-ray diffractometer (XRD; D8 ADVANCE, Bruker AXS, Karlsruhe, Germany) and a transmission electron microscope (TEM; JEM-2100F, JEOL, Tokyo, Japan). For the XRD analysis, rod-like specimens, 8 mm in diameter, were extracted using an electric discharge machine (ROBOCUT α-C400iA, FANUC, Yamanashi, Japan) from the homogenized bars along the working direction or the long-axis direction after swaging. In other words, the longitudinal direction of the rods was parallel to the processing direction for both hot forging and cold swaging. Rod-like specimens were also extracted in the direction normal to the long axis. The rod-like specimens were cut to disks of 1 mm in thickness using a precision cutting machine. These specimens were metallographically polished with SiC papers with grit numbers reaching #1000. The measured surface was normal to the processing direction for the hot-forged and cold-swaged specimens and was parallel to the processing direction for the cold-swaged specimen with an area reduction of 30%. The XRD measurements were performed using Cu Kα radiation to give diffraction angles (2θ) of 25–80° at an accelerating voltage of 40 kV and current of 40 mA. For TEM observations, the specimens were ground with SiC papers with grit numbers reaching #1000 to a thickness of approximately 0.3 mm. Disks of 3 mm in diameter were then punched from the specimens. These small disks were ground to a thickness of approximately 0.1 mm and subjected to twin-jet electrochemical polishing in a solution containing 8 vol % perchloric acid, 57 vol % methanol, and 35 vol % butanol at 20–35 V and −30 °C. The acceleration voltage for TEM imaging was 200 kV.
2.3. Evaluation of Mechanical Properties
The mechanical properties of the specimens were evaluated through tensile tests and Vickers hardness tests. Dumbbell-type specimens (n = 3) with cylindrical necking parts with a gauge length of 15 mm and diameter of 3 mm (ISO 6871-1:1994) were prepared using an electric discharge machine and a lathe from the bars before and after swaging. The longitudinal direction of the tensile specimens was parallel to the processing direction during hot forging and cold swaging. The tensile tests were performed using a tensile testing machine (Autograph AG-2000B, SHIMADZU, Kyoto, Japan) at an initial strain rate of 1 × 10⁻³ s−1. At least five specimens were tested for each area reduction ratio. The Vickers hardness test was performed under a load of 300 g for a test period of 15 s. The test was performed radially every 5 mm from the center to the edge of the specimen, and the average value was calculated from the midsection of the specimen disk.
2.4. Measurement of Magnetic Susceptibility
Rod-like specimens (3 mm in diameter and 25 mm in length) were produced from the swaged bars by electrical discharge machining. The longitudinal direction of the test rods was parallel to the processing direction for hot forging and cold swaging. To confirm the anisotropy of the specimens, rod-like specimens with longitudinal directions normal to the processing direction were prepared from the 30% swaged bar. The magnetic susceptibilities of the specimens were measured using a magnetic balance (MSB-MKI, Sherwood Scientific, Cambridge, UK) under a magnetic field of 0.35 T at room temperature. The direction of the applied magnetic field was normal to the longitudinal direction of the test rods. Each specimen was subjected to at least six measurements.
3. Results and Discussion
3.1. Microstructure
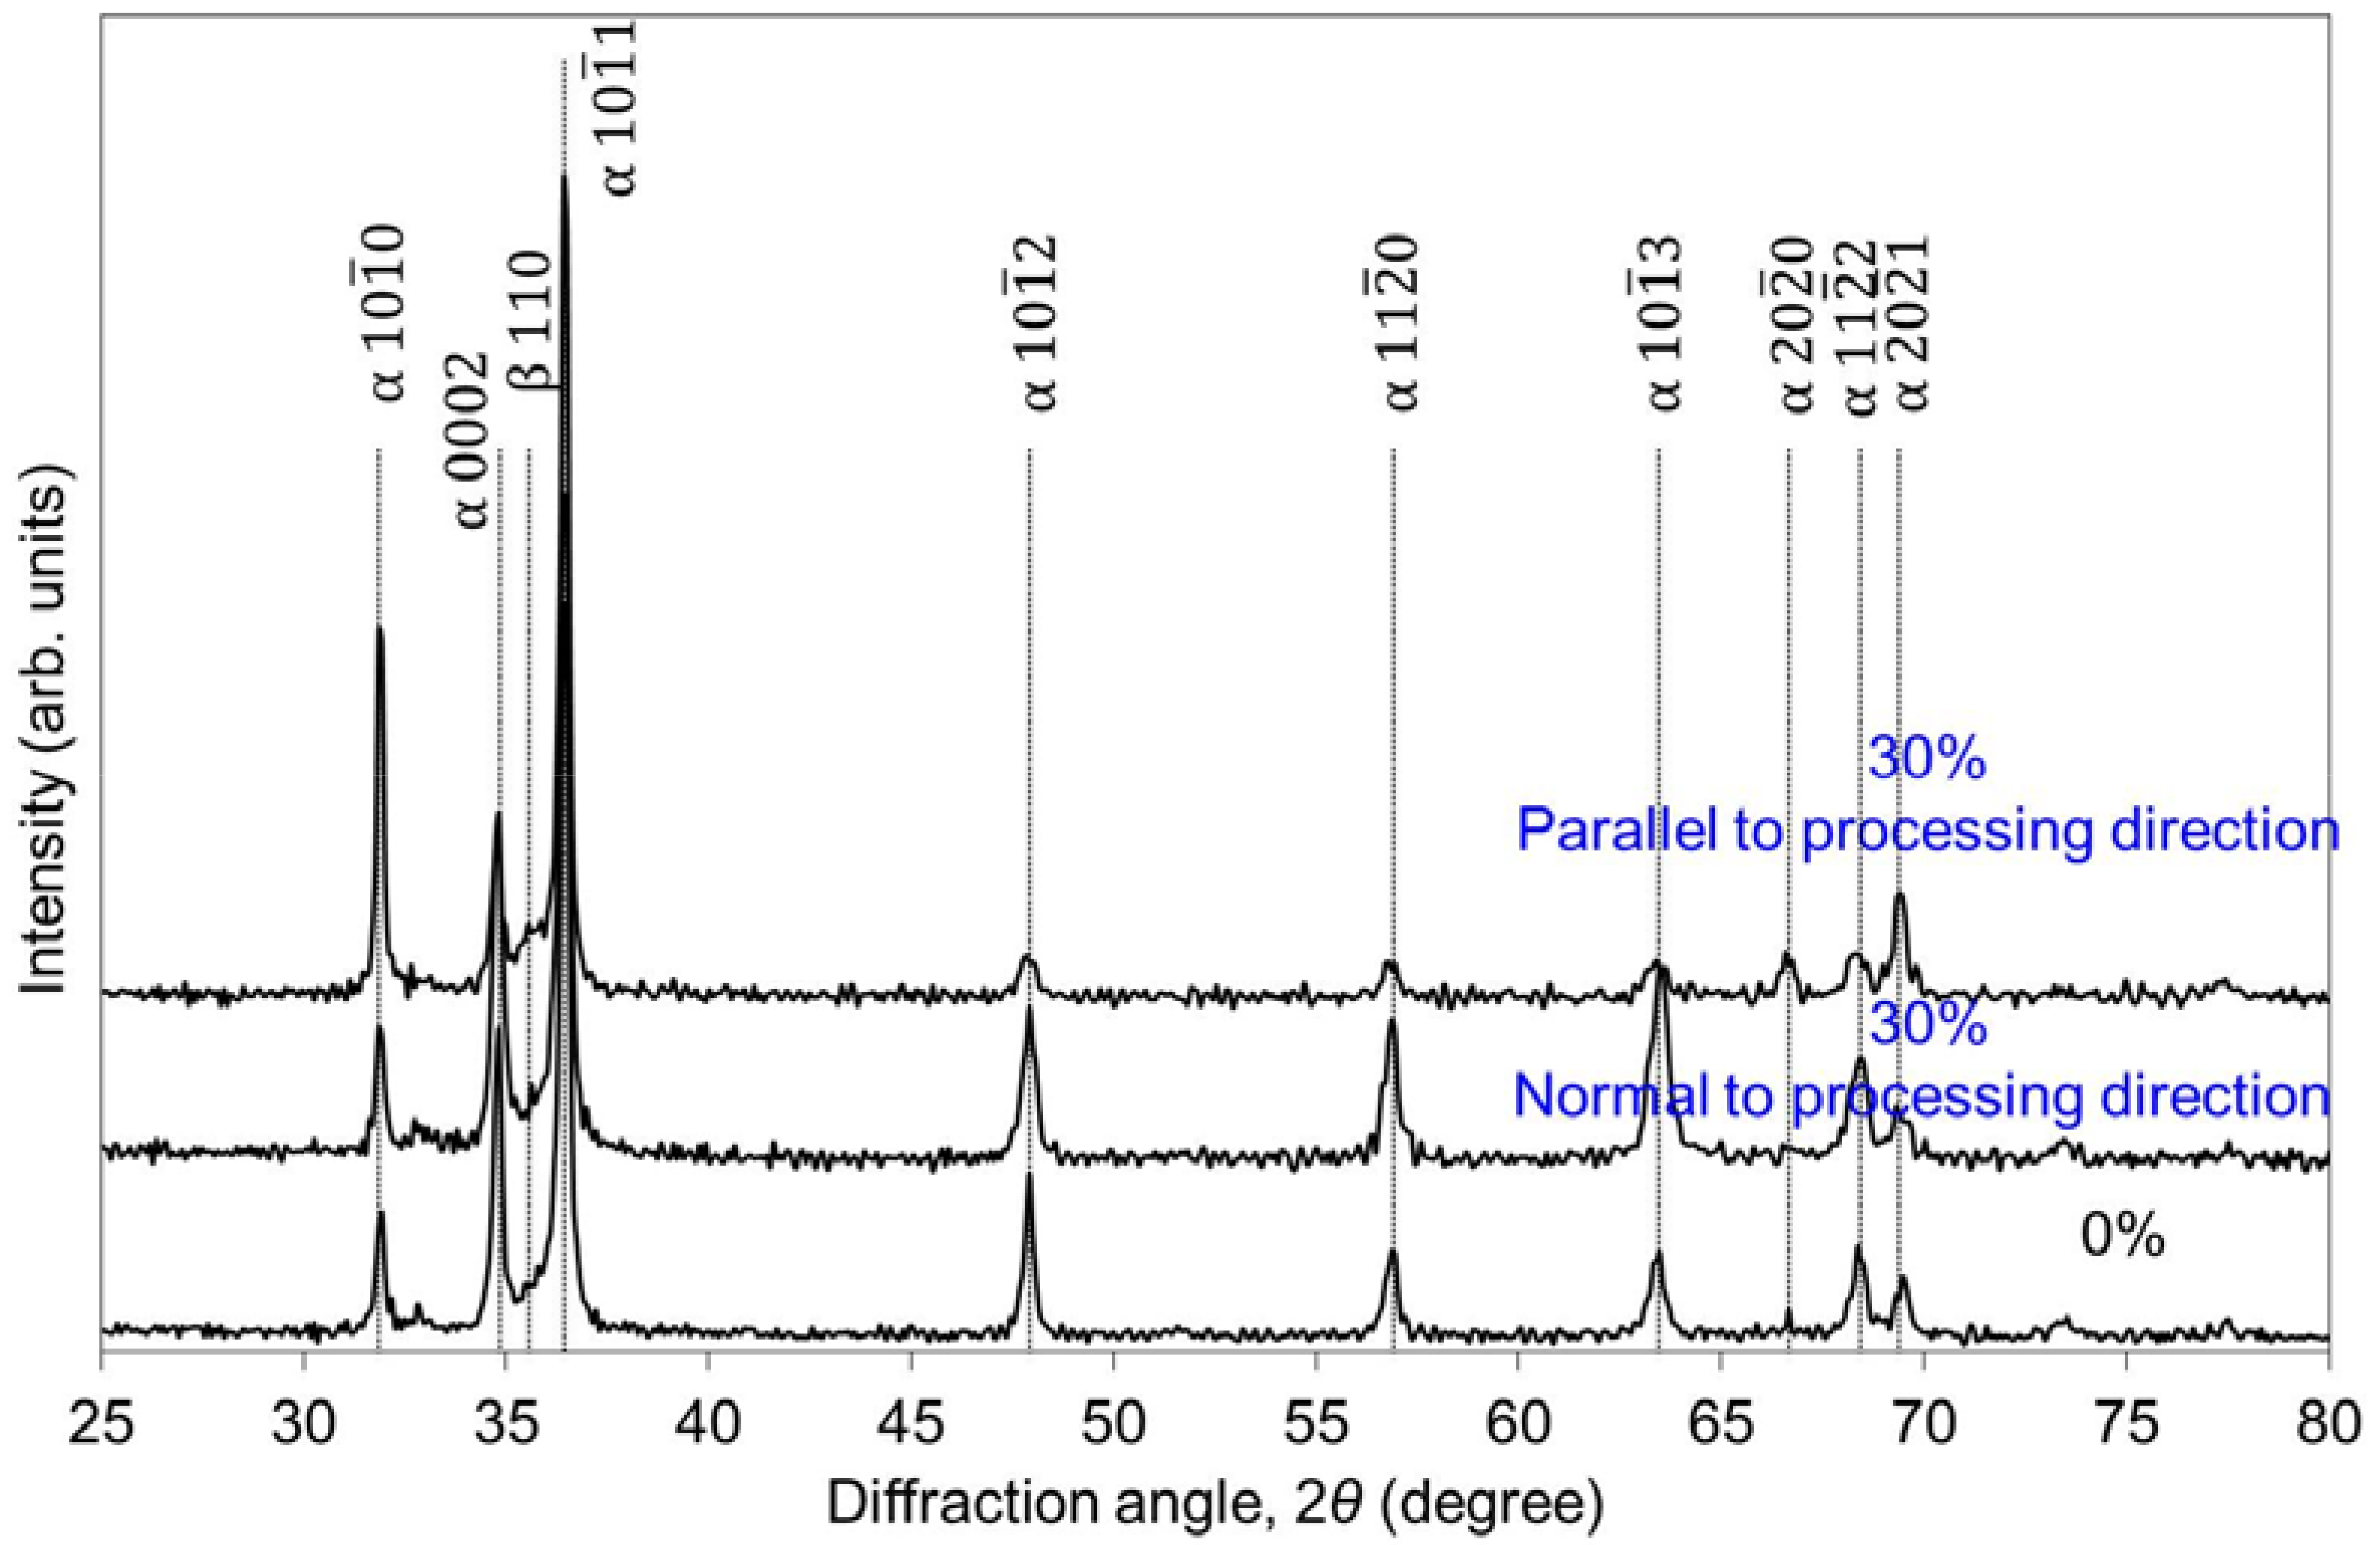
Figure 2 shows the XRD patterns of the specimens before (0%) and after cold swaging (30%, 50%, 60%, 70%, and 84%). The primary phase of the Zr–1Mo alloy is the α-phase. A small peak from the β-phase also appeared, based on the shoulder of the α (10 1) peak. However, no peak related to the ω-phase was detected. If the ω-phase was present, its volume fraction was small. The intensity of the α (10 0) peak increased with an increase in the area reduction ratio, while the intensities of the other peaks decreased. With an area reduction ratio of 84%, all peaks except those attributable to α (10 0) and α (20 0) almost vanished. The deformation of Zr occurred primarily through prismatic {10 0} <1 10> slip [19]. These changes in the XRD patterns after swaging indicate that the crystal structure of the alloy samples in the longitudinal direction is oriented along the α {10
0} plane. Meanwhile, the intensities of the α (10
1) peak and α (0002) peak decreased sharply for the sample with an area reduction ratio of 70%, suggesting that the microstructure of the Zr–1Mo alloy changes abruptly for area reductions of approximately 60–70%.
Figure 3 shows the XRD patterns of the specimen before swaging (0%), as well as those of specimens extracted along the processing direction and along the direction normal to the processing direction after 30% cold swaging. In both directions, the intensity of the α (10 1) peak was the largest. However, despite equal reductions in area, the XRD profiles of the samples extracted in the directions parallel and normal to the processing direction were markedly different. In the former case, the intensity of the prismatic α (10 0) peak was greater than that of the basal α (0002) peak. Meanwhile, in the latter case, the intensity of the α (0002) peak was greater than that of the α (10 0) peak. In addition, the XRD pattern of the specimen obtained in the direction normal to the processing direction was similar to that of the non-swaged specimen. These results reveal that the microstructure of the post-swaging alloy is anisotropic, with texture generally developing along the processing direction.
Figure 4 shows TEM images recorded both before and after cold swaging with area reductions of 50% and 84%. Before cold swaging, or just after hot forging, the microstructure of Zr–1Mo comprised lamellar layers of plate-like α- and thin β-phases. The widths of the α- and β-phases were 0.08–0.1 μm and 0.01 μm, respectively, and remained almost constant after cold swaging. However, the post-swaging microstructure contained distorted and bent α- and β-phases for the sample with 50% area reduction. This distortion and bending was much more severe for the sample with an area reduction of 84%. Similarly, distorted and bent structures have been reported in cold-swaged Ti–Nb–Ta–Zr–O alloys [16] and hot-extruded Zr alloys [20]. Many dislocations in the α-plates appeared after cold swaging, and the number increased as the area reduction ratio increased. This confirms the accumulation of dislocations during the swaging process. Deformation from swaging therefore likely occurs through the distortion and bending of the colonies of the laminated and layered phases, with preferential orientation along the α {10 0} plane in the deformed α-plates.
3.2. Mechanical Properties
The Vickers hardness values of the Zr–1Mo alloy specimens before and after cold swaging are shown in Figure 5. The hardness before cold swaging was 203 HV. As the area reduction ratio increased from 0% to 60%, the Vickers hardness remained almost unchanged, but increased notably when the area reduction ratio increased from 70% to 84%. The hardness was 209 HV with an area reduction of 70%, and the maximum value of 240 HV was achieved with an area reduction of 84%. These results indicate that the Zr–1Mo alloy does not undergo significant hardening in the initial stages of cold working.
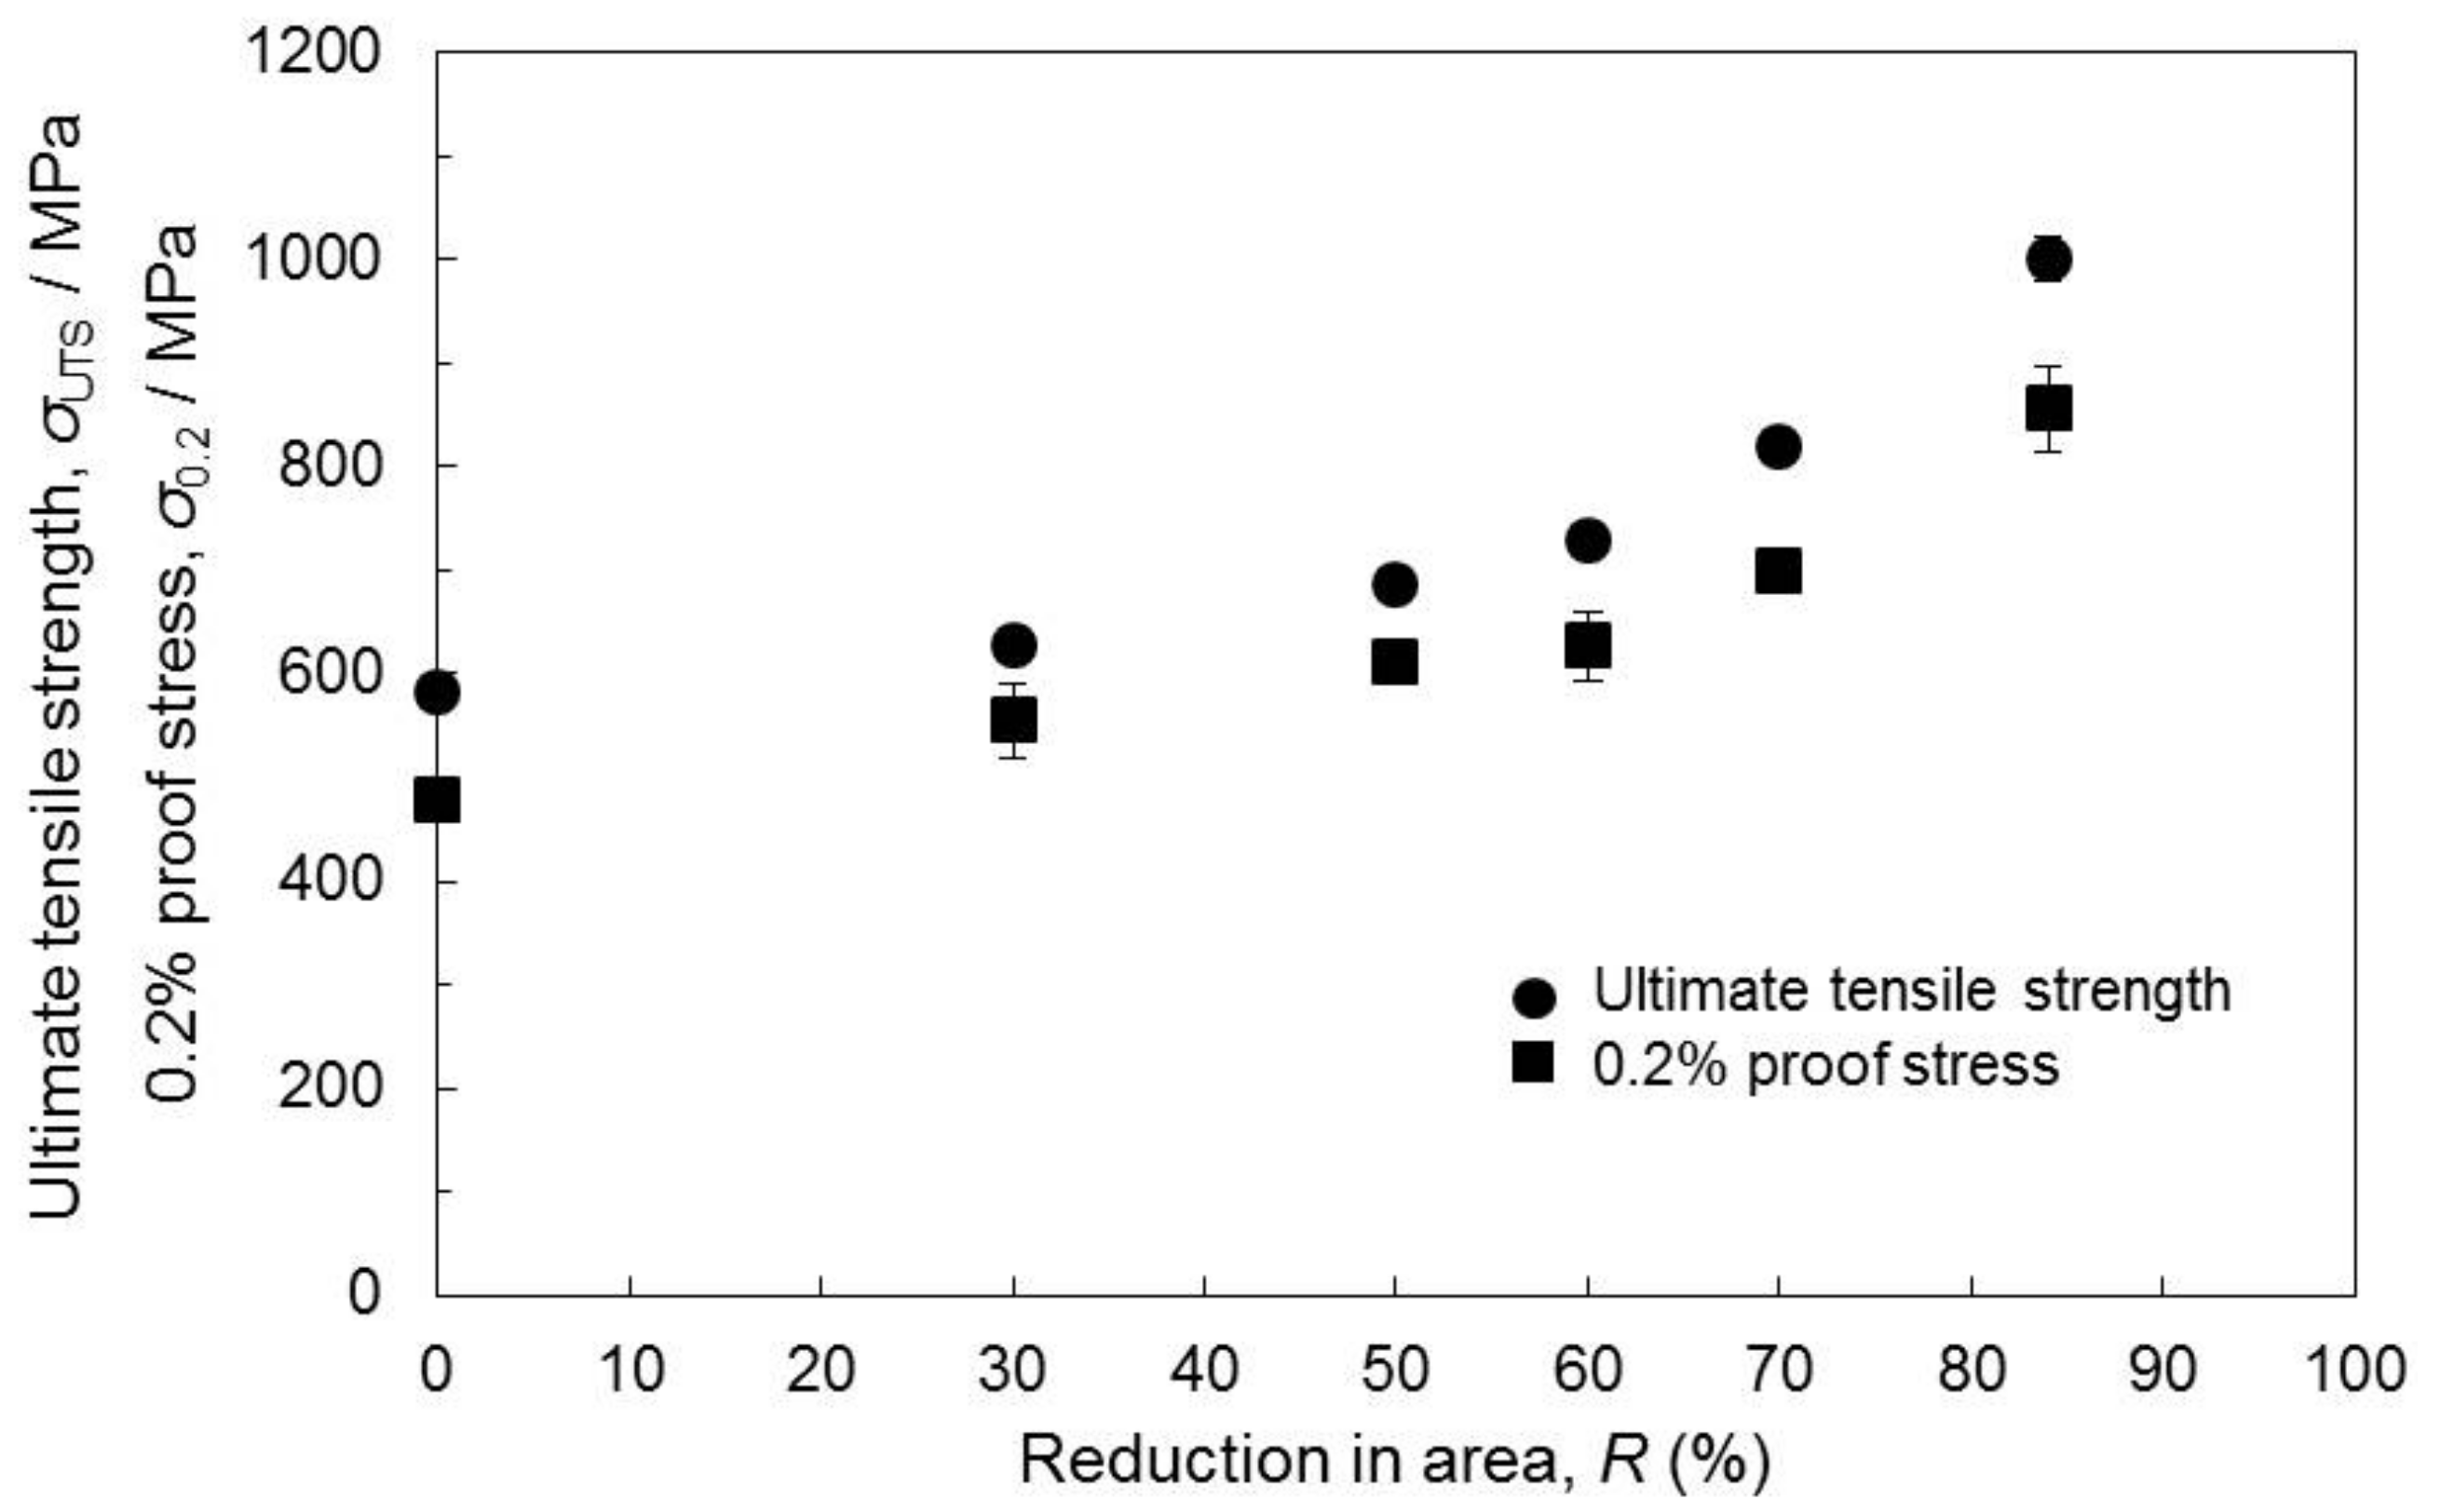
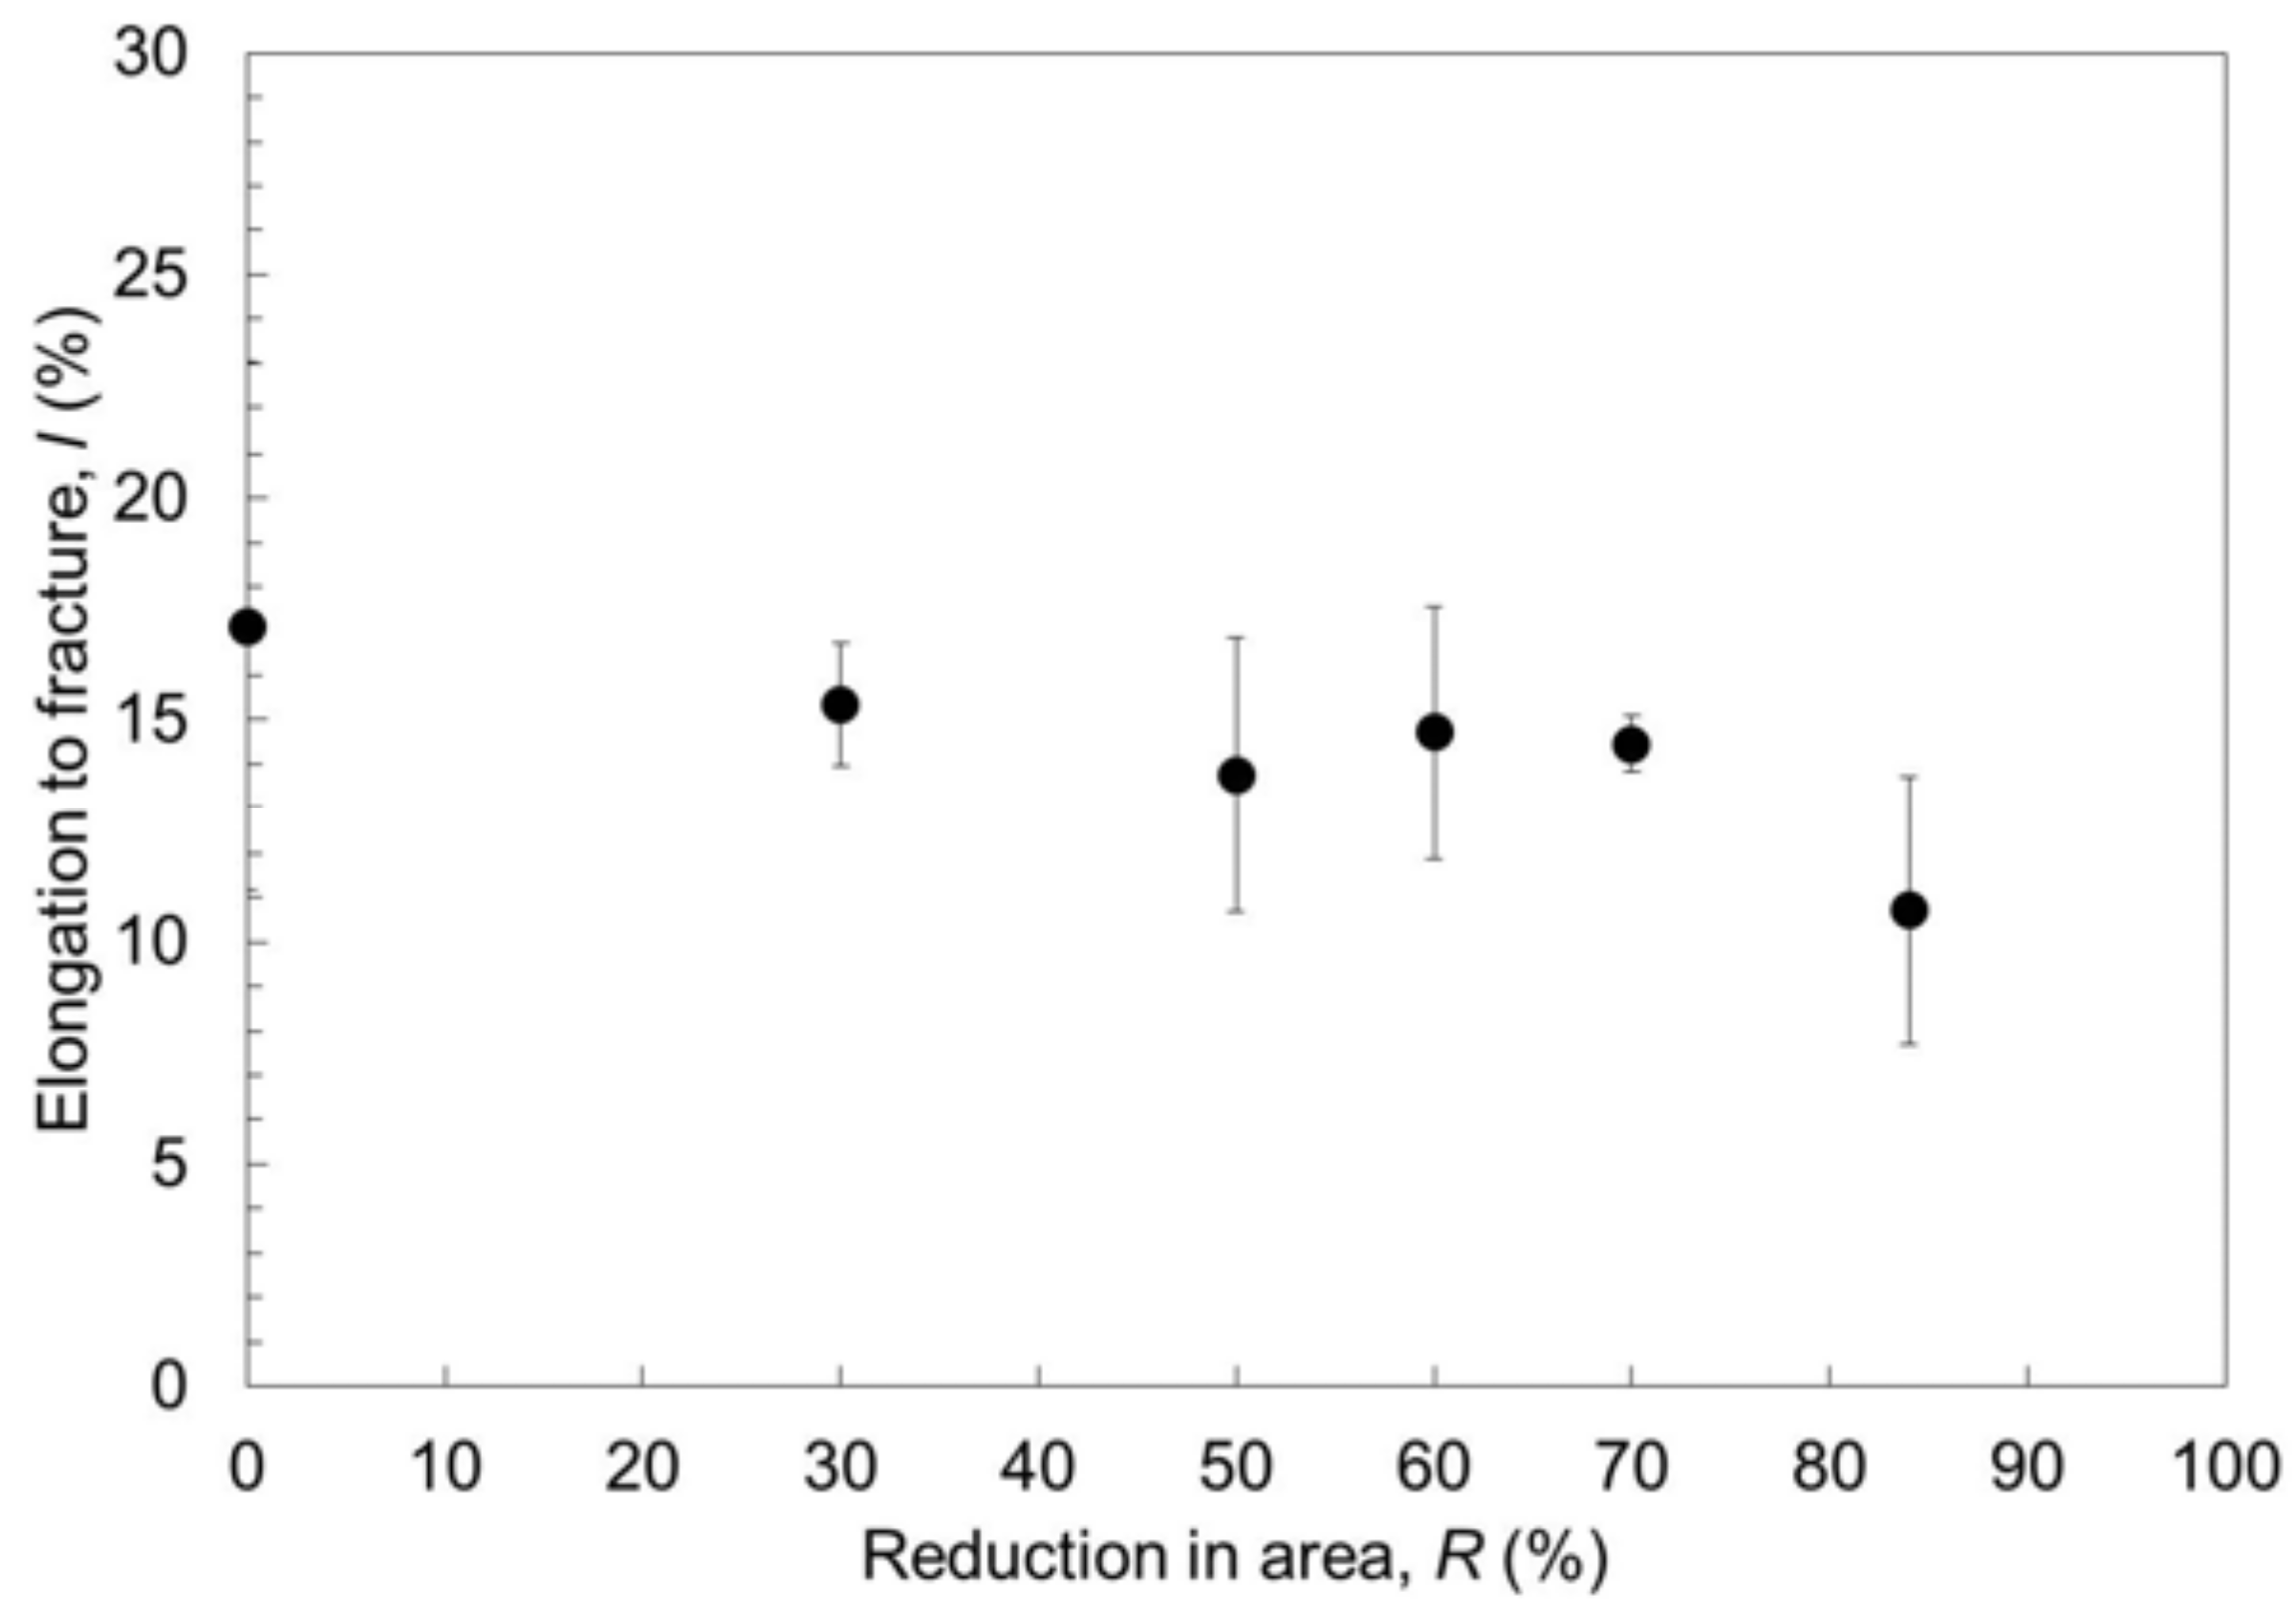
The stress-strain curves, ultimate tensile strengths (UTS), 0.2% proof stress, and elongation to fracture values of the Zr–1Mo alloy specimens before and after cold swaging are shown in Figure 6, Figure 7 and Figure 8, respectively. The UTS, 0.2% proof stress, and elongation to fracture before cold swaging were 584 MPa, 479 MPa, and 17%, respectively. The UTS and 0.2% proof stress increased to 1001 MPa and 856 MPa, and the elongation decreased to 10.7% after cold swaging for the specimen with an area reduction of 84%; these properties are comparable to those of the Ti–6Al–4V alloy [21]. The increase in the UTS was consistent with the decrease in the elongation, and the changes were small for area reduction ratios reaching 60%, but large for the ratio of 84%. This tendency is consistent with that observed for the Vickers hardness. These results indicated that the Zr–1Mo alloy does not undergo significant hardening in the initial stages of cold working.
3.3. Magnetic Susceptibility
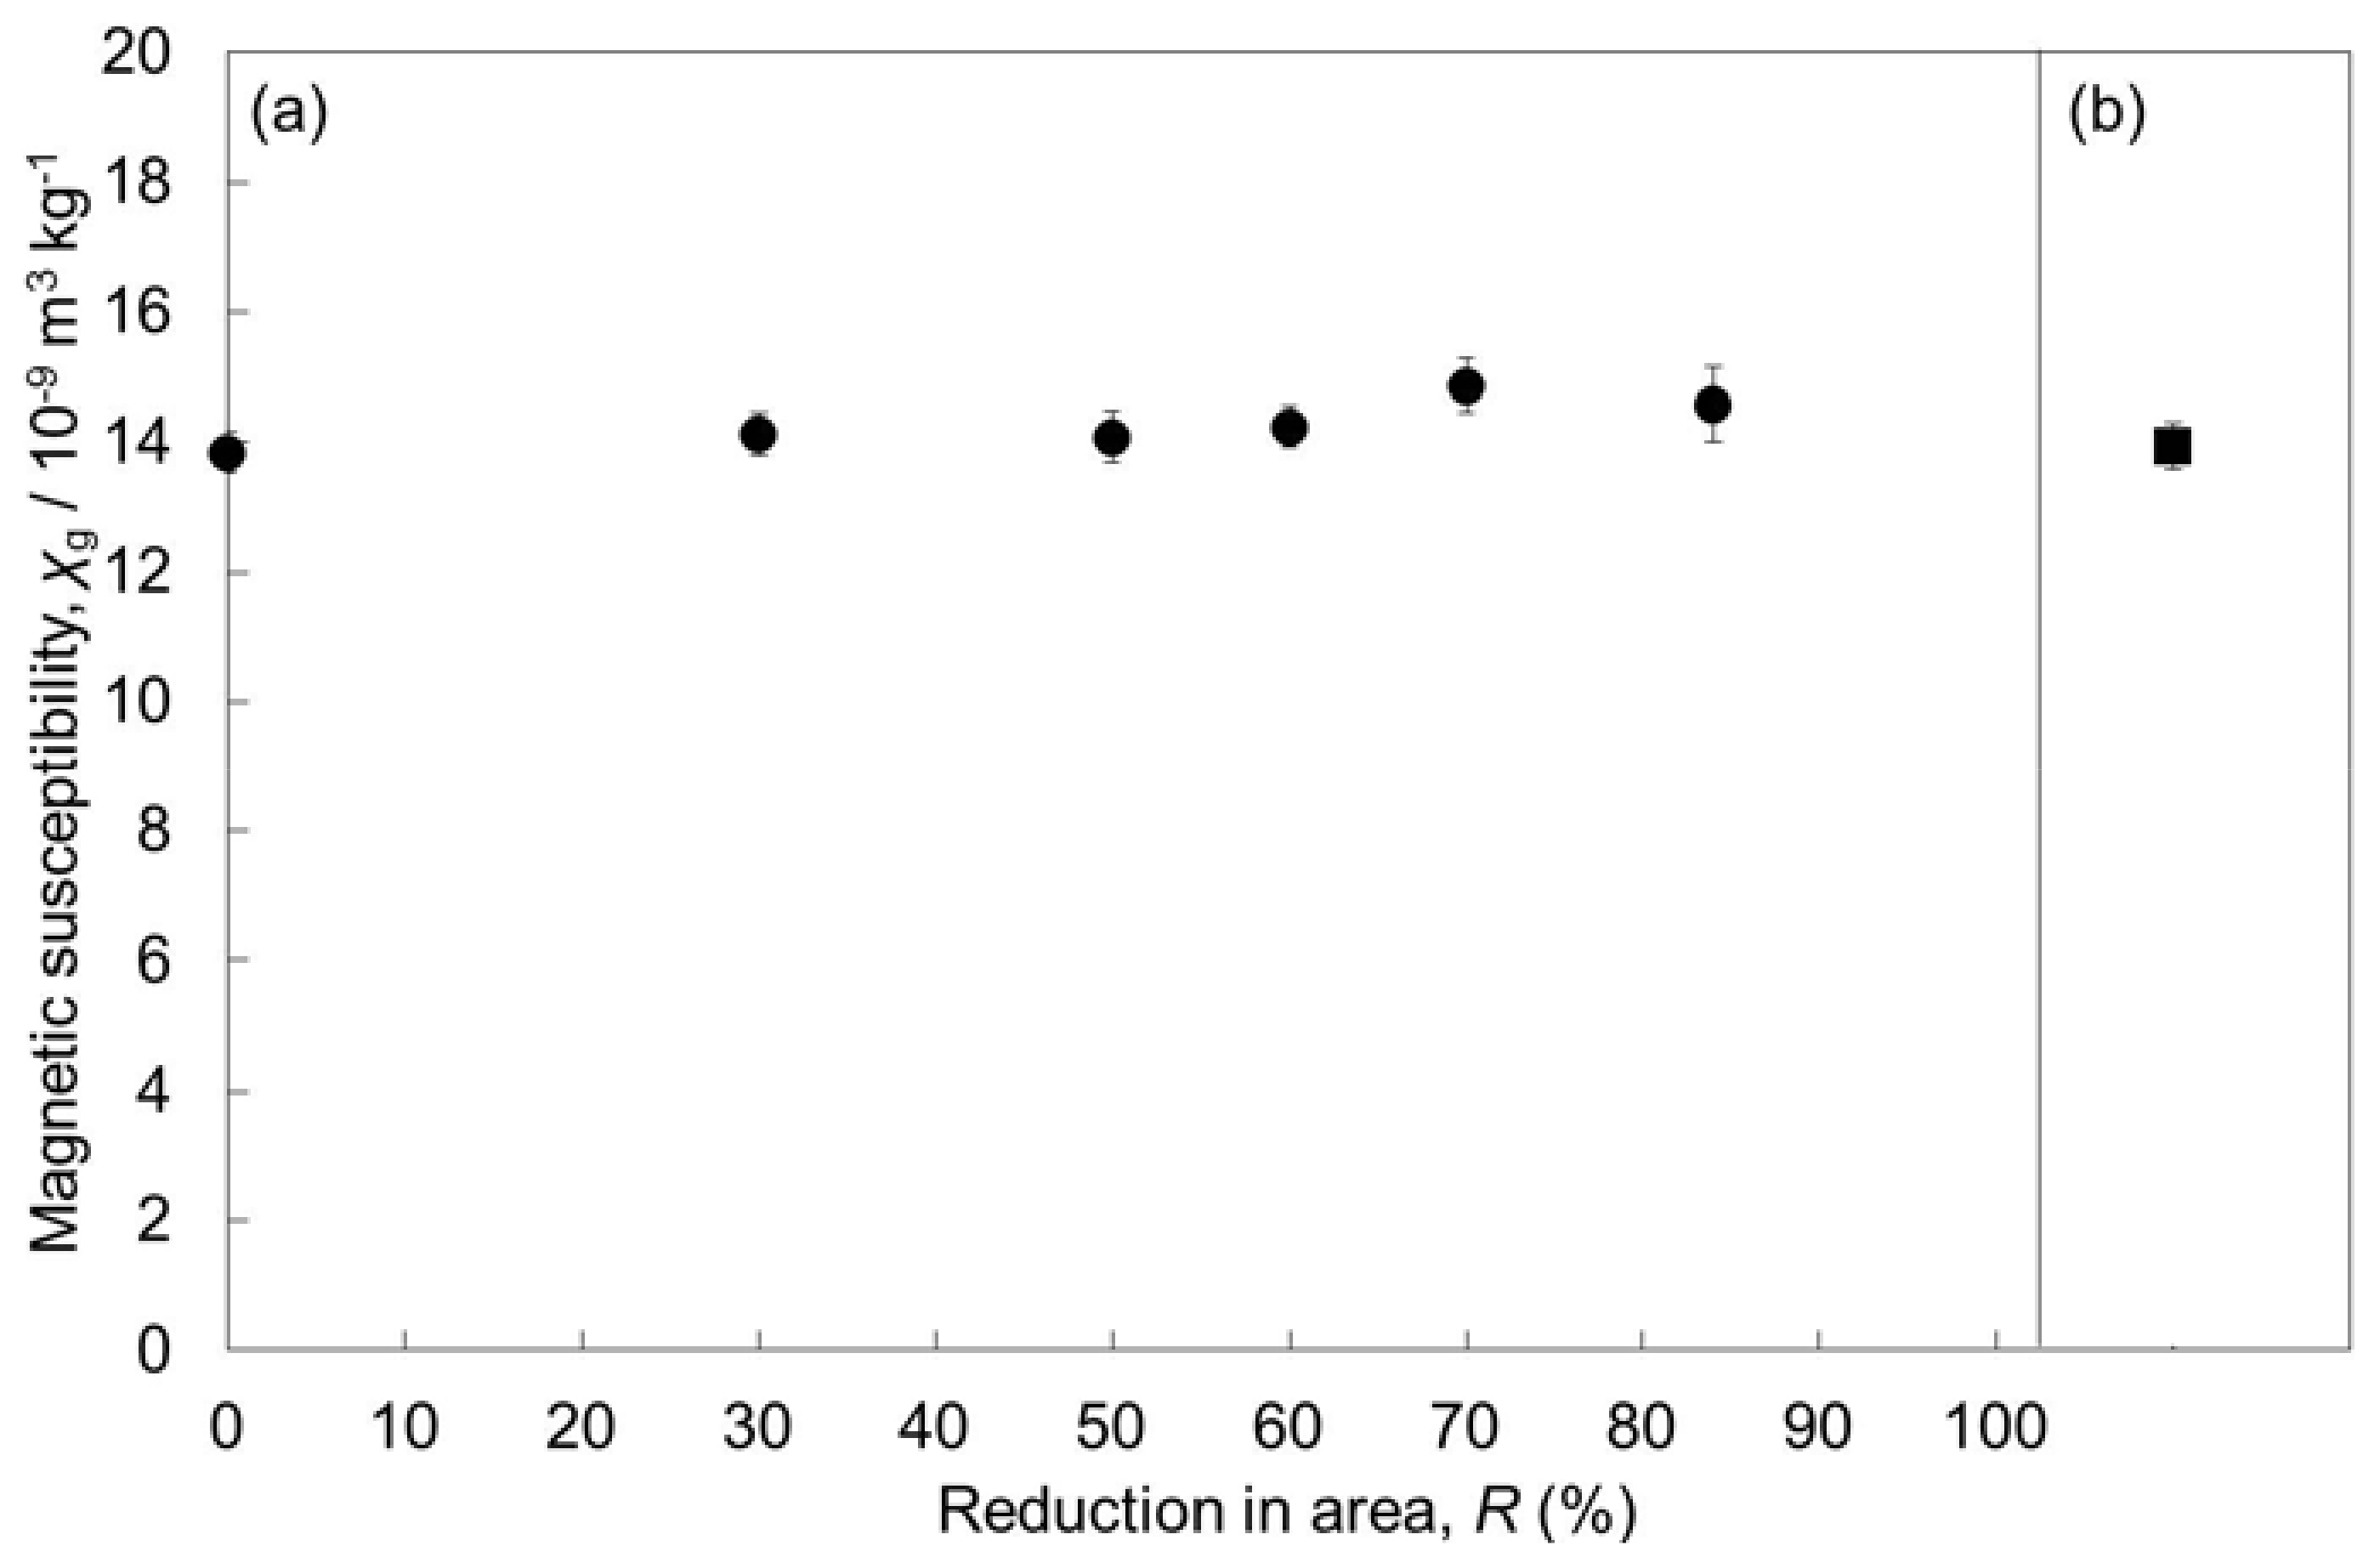
The magnetic susceptibilities of the Zr–1Mo alloy specimens before and after cold swaging are shown in Figure 9. The magnetic susceptibility of the specimen whose longitudinal direction was normal to the processing direction and whose area was reduced by 30% is also shown (Figure 9b). A slight change in the magnetic susceptibility was observed with cold swaging, with the value falling between 13.85 × 10⁻⁹ and 14.87 × 10⁻⁹ m3·kg−1 (volume susceptibility, χ: 90.65 × 10⁻⁶ and 97.33 × 10⁻⁶). The magnetic susceptibility of the specimen extracted parallel to the processing direction with an area reduction of 30% was 14.13 × 10⁻⁹ m3·kg−1 (χ = 92.48 × 10⁻⁶), slightly larger than that of 13.95 × 10⁻⁹ m3·kg−1 (χ = 91.31 × 10⁻⁶) for the specimen extracted normal to the processing direction. It has previously been reported that the crystallographic orientation and phase constitution of Zr alloys affect their magnetic susceptibility [3,22]. In this study, the phase configuration was unchanged, but the orientation to the α {10
0} plane during cold swaging was confirmed from the XRD results. Therefore, the small change in magnetic susceptibility due to cold swaging is suggested to have arisen from the changed crystal orientation. However, the value of 14.87 × 10⁻⁹ m3·kg−1 after the 84% reduction was smaller than those of 16.84 × 10⁻⁹ m3·kg−1 (χ = 109.8 × 10⁻⁶) for pure Zr [23] and 39.84 × 10⁻⁹ m3·kg−1 (χ = 175.7 × 10⁻⁶) for the Ti–6Al–4V alloy [10]. Thus, cold swaging does not affect the magnetic susceptibility.
4. Conclusions
In this study, the effects of hot forging and cold swaging on the microstructure, mechanical properties, and magnetic susceptibility of Zr–1Mo were investigated. The Zr–1Mo alloy showed the unique characteristic of avoiding significant work-hardening in the initial stages of cold working. The microstructure consisted of laminated and layered α- and β-phases before cold swaging, but distorted and bent α- and β-phases appeared with the orientation to α {10
0} after cold swaging. A high strength of 1001 MPa and large elongation of 10.7% were achieved after cold swaging with an area reduction of 84%. In addition, a low magnetic susceptibility of 14.87 × 10⁻⁹ m3·kg−1 was retained after a reduction of 84% by cold swaging. Thus, a good balance of mechanical properties and low magnetic susceptibility of the Zr–1Mo alloy can be achieved by cold swaging; the alloy should yield a low artifact volume, regardless of the fabrication processes employed.
Author Contributions
T.H. and Y.T. conceived and designed the experiments; M.M. performed the experiments; Y.T., M.M., M.A., N.N., H.D., and P.C. analyzed the data; N.N. and T.H. contributed materials/analysis tools; M.M., M.A., Y.T., and T.H. wrote the paper.
Funding
This research received no external funding.
Acknowledgments
This work was supported, in part, by funding from the S-Innovation (Strategic Promotion of Innovative Research and Development) program of the Japan Agency for Medical Research and Development (AMED) under Grant Number JP17im0502002 and the project of Creation of Life Innovation Materials for Interdisciplinary and International Researcher Development from the Ministry of Education, Culture, Sports, Science, and Technology (MEXT). This work was supported by the Research Center for Biomedical Engineering.
Conflicts of Interest
The authors declare no conflict of interest.
References
- Imai, H.; Tanaka, Y.; Nomura, N.; Tsutsumi, Y.; Doi, H.; Kanno, Z.; Ohno, K.; Ono, T.; Hanawa, T. Three-dimensional quantification of susceptibility artifacts from various metals in magnetic resonance images. Acta Biomater. 2013, 9, 8433–8439. [Google Scholar] [CrossRef] [PubMed]
- Zhou, F.Y.; Wang, B.L.; Qiu, K.J.; Li, L.; Lin, J.P.; Li, H.F.; Zheng, Y.F. Microstructure, mechanical property, corrosion behavior, and in vitro biocompatibility of Zr–Mo alloys. J. Biomed. Mater. Res. Part B 2013, 101, 237–246. [Google Scholar] [CrossRef] [PubMed]
- Kondo, R.; Shimizu, R.; Nomura, N.; Doi, H.; Suyalatu; Tsutsumi, Y.; Mitsuishi, K.; Shimojo, M.; Noda, K.; Hanawa, T. Effect of cold rolling on the magnetic susceptibility of Zr–14Nb alloy. Acta Biomater. 2013, 9, 5795–5801. [Google Scholar] [CrossRef] [PubMed]
- Yang, H.L.; Kano, S.; Matsukawa, Y.; Li, Y.F.; Shen, J.J.; Li, F.; Zhao, Z.S.; Satoh, Y.; Abe, H. Effect of molybdenum on microstructures in Zr–1.2Nb alloys after β-quenching and subsequently 873 K annealing. Mater. Des. 2016, 104, 355–364. [Google Scholar] [CrossRef]
- Kajima, Y.; Takaichi, A.; Yasue, T.; Doi, H.; Takahashi, H.; Hanawa, T.; Wakabayashi, N. Evaluation of the shear bond strength of dental porcelain and the low magnetic susceptibility Zr–14Nb alloy. J. Mech. Behav. Biomed. Mater. 2016, 53, 131–141. [Google Scholar] [CrossRef] [PubMed]
- Kondo, R.; Nomura, N.; Suyalatu; Tsutsumi, Y.; Doi, H.; Hanawa, T. Microstructure and mechanical properties of as-cast Zr–Nb alloys. Acta Biomater. 2011, 7, 4278–4284. [Google Scholar] [CrossRef] [PubMed]
- Zhao, X.L.; Li, L.; Niinomi, M.; Nakai, M.; Zhang, D.L.; Suryanarayana, C. Metastable Zr–Nb alloys for spinal fixation rods with tunable Young’s modulus and low magnetic resonance susceptibility. Acta Biomater. 2017, 62, 372–384. [Google Scholar] [CrossRef] [PubMed]
- Lim, Y.S.; Kim, H.G.; Jeong, Y.H. Recrystallization behavior of Zr–xNb alloys. Mater. Trans. 2008, 49, 1702–1705. [Google Scholar] [CrossRef]
- Zhou, F.Y.; Wang, B.L.; Qiu, K.J.; Lin, W.J.; Li, L.; Wang, Y.B.; Nie, F.L.; Zheng, Y.F. Microstructure, corrosion behavior and cytotoxicity of Zr–Nb alloys for biomedical application. Mater. Sci. Eng. C 2013, 32, 851–857. [Google Scholar] [CrossRef]
- Suyalatu; Nomura, N.; Oya, K.; Tanaka, Y.; Kondo, R.; Doi, H.; Tsutsumi, Y.; Hanawa, T. Microstructure and magnetic susceptibility of as-cast Zr–Mo alloys. Acta Biomater. 2010, 6, 1033–1038. [Google Scholar]
- Hong, S.P.; Ko, Y.M.; Kim, C.S. Magnetic susceptibility of Zr–Cu binary alloys. Mater. Trans. 2014, 55, 1634–1636. [Google Scholar] [CrossRef]
- Li, H.F.; Zhou, F.Y.; Li, L.; Zheng, Y.F. Design and development of novel MRI compatible zirconium–ruthenium alloys with ultralow magnetic susceptibility. Sci. Rep. 2016, 6, 24414. [Google Scholar] [CrossRef] [PubMed]
- Banerjee, S.; Mukhopadhyay, P. Martensitic transformations. In Phase Transformations: Examples from Titanium and Zirconium Alloys, 1st ed.; Cahn, R.W., Ed.; Elsevier Science: London, UK, 2007; pp. 282–283. ISBN 978-0-08-042145-2. [Google Scholar]
- Zhou, F.Y.; Qiu, K.J.; Li, H.F.; Huang, T.; Wang, B.L.; Li, L.; Zheng, Y.F. Screening on binary Zr–1X (X = Ti, Nb, Mo, Cu, Au, Pd, Ag, Ru, Hf and Bi) alloys with good in vitro cytocompatibility and magnetic resonance imaging compatibility. Acta Biomater. 2013, 9, 9578–9587. [Google Scholar] [CrossRef] [PubMed]
- Ashida, M.; Sugimoto, T.; Nomura, N.; Tsutsumi, Y.; Chen, P.; Doi, H.; Hanawa, T. Microstructure and mechanical properties of large-scale ingots of the Zr–1Mo alloy. Mater. Trans. 2015, 56, 1544–1548. [Google Scholar] [CrossRef]
- Guo, W.Y.; Xing, H.; Sun, J.; Lix, L.; Wu, J.S.; Chen, R. Evolution of microstructure and texture during recrystallization of the cold-swaged Ti–Nb–Ta–Zr–O alloy. Metall. Mater. Trans. A 2008, 39, 672–678. [Google Scholar] [CrossRef]
- Jung, T.; Semboshi, S.; Masahashi, N.; Hanada, S. Mechanical properties and microstructures of β Ti–25Nb–11Sn ternary alloy for biomedical applications. Mater. Sci. Eng. C 2013, 33, 1629–1635. [Google Scholar] [CrossRef] [PubMed]
- Niinomi, M.; Hattori, T.; Morikawa, K.; Kasuga, T.; Suzuki, A.; Fukui, H.; Niwa, S. Development of low rigidity β-type titanium alloy for biomedical applications. Mater. Trans. 2002, 43, 2970–2977. [Google Scholar] [CrossRef]
- Akhtar, A. Schmid’s law and prismatic slip of zirconium. Scr. Mater. 1975, 9, 859–861. [Google Scholar] [CrossRef]
- Tewari, R.; Srivastava, D.; Dey, G.K.; Chakravarty, J.K.; Banerjee, S. Microstructural evolution in zirconium based alloys. J. Nucl. Mater. 2008, 383, 153–171. [Google Scholar] [CrossRef]
- Niinomi, M. Recent metallic materials for biomedical applications. Metall. Mater. Trans. A 2002, 33, 477–486. [Google Scholar] [CrossRef]
- Imai, H.; Tanaka, Y.; Nomura, N.; Doi, H.; Tsutsumi, Y.; Ono, T.; Hanawa, T. Magnetic susceptibility, artifact volume in MRI, and tensile properties of swaged Zr–Ag composites for biomedical applications. J. Mech. Behav. Biomed. 2017, 9, 5795–5801. [Google Scholar] [CrossRef] [PubMed]
- Martienssen, W.; Warlimont, H. The elements. In Springer Handbook of Condensed Matter and Materials Data; Springer: Berlin/Heidelberg, Germany, 2005; pp. 45–158. ISBN 978-3-540-44376-6. [Google Scholar]
Figure 1.
Processing history of the Zr–1Mo alloy used in this study.
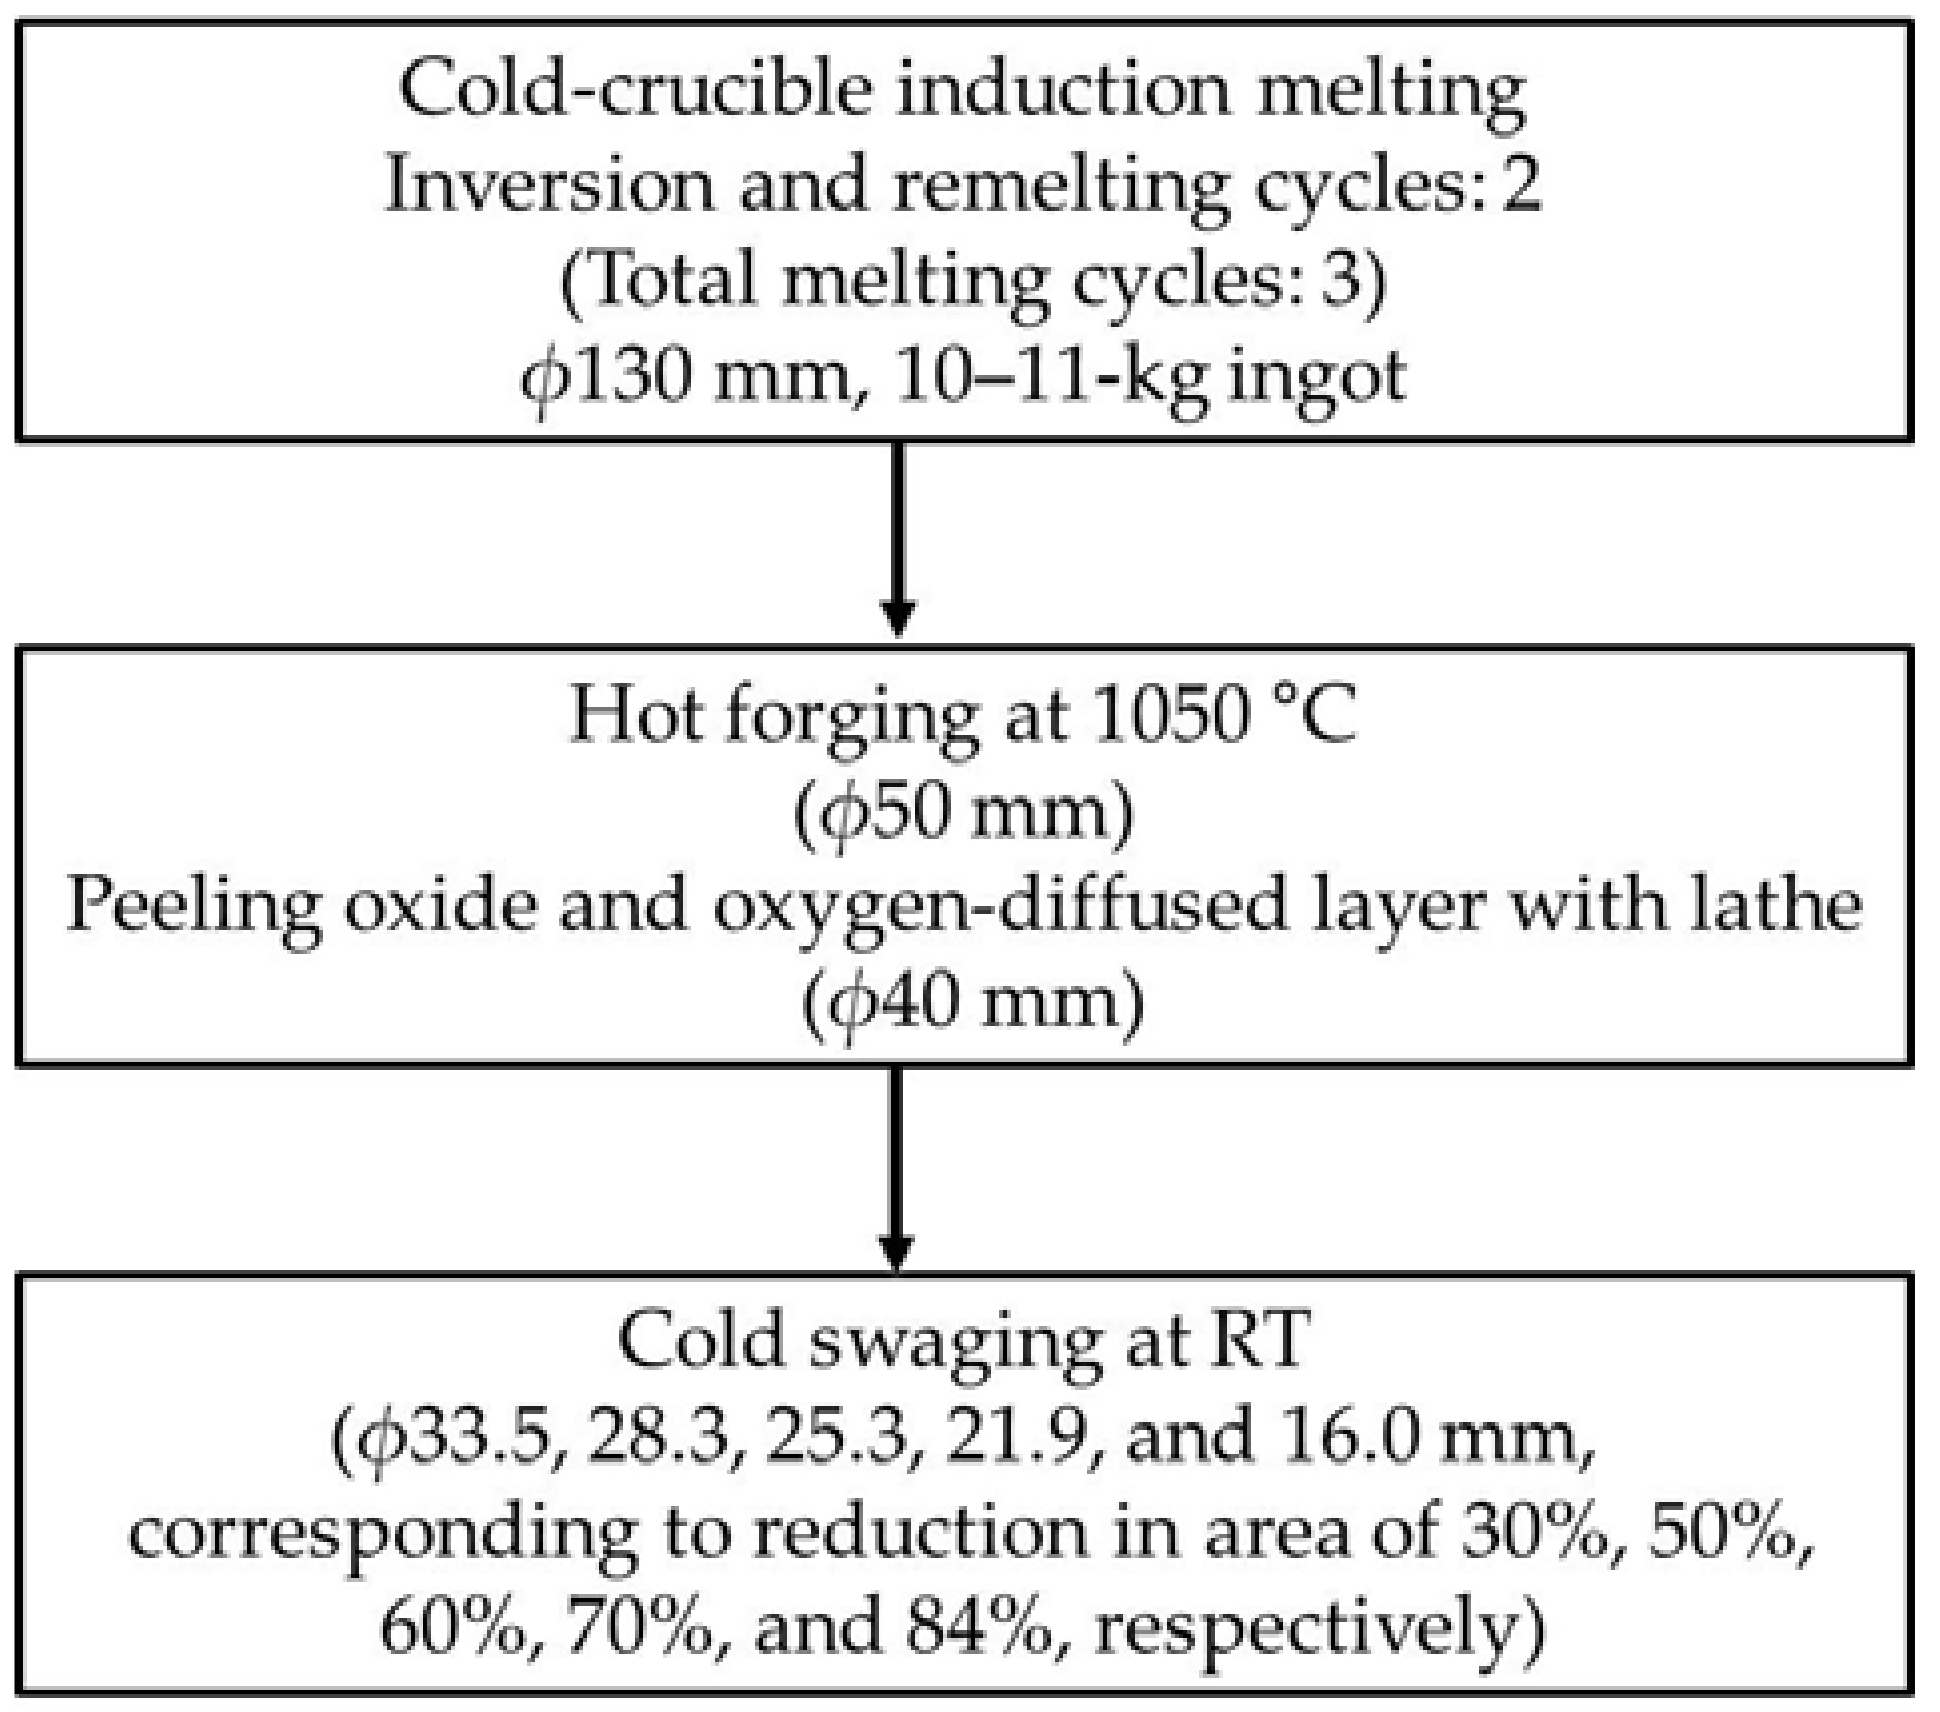
Figure 2.
XRD profiles of Zr–1Mo alloy specimens extracted parallel to the processing direction and with area reductions of 0–84%.
Figure 2.
XRD profiles of Zr–1Mo alloy specimens extracted parallel to the processing direction and with area reductions of 0–84%.
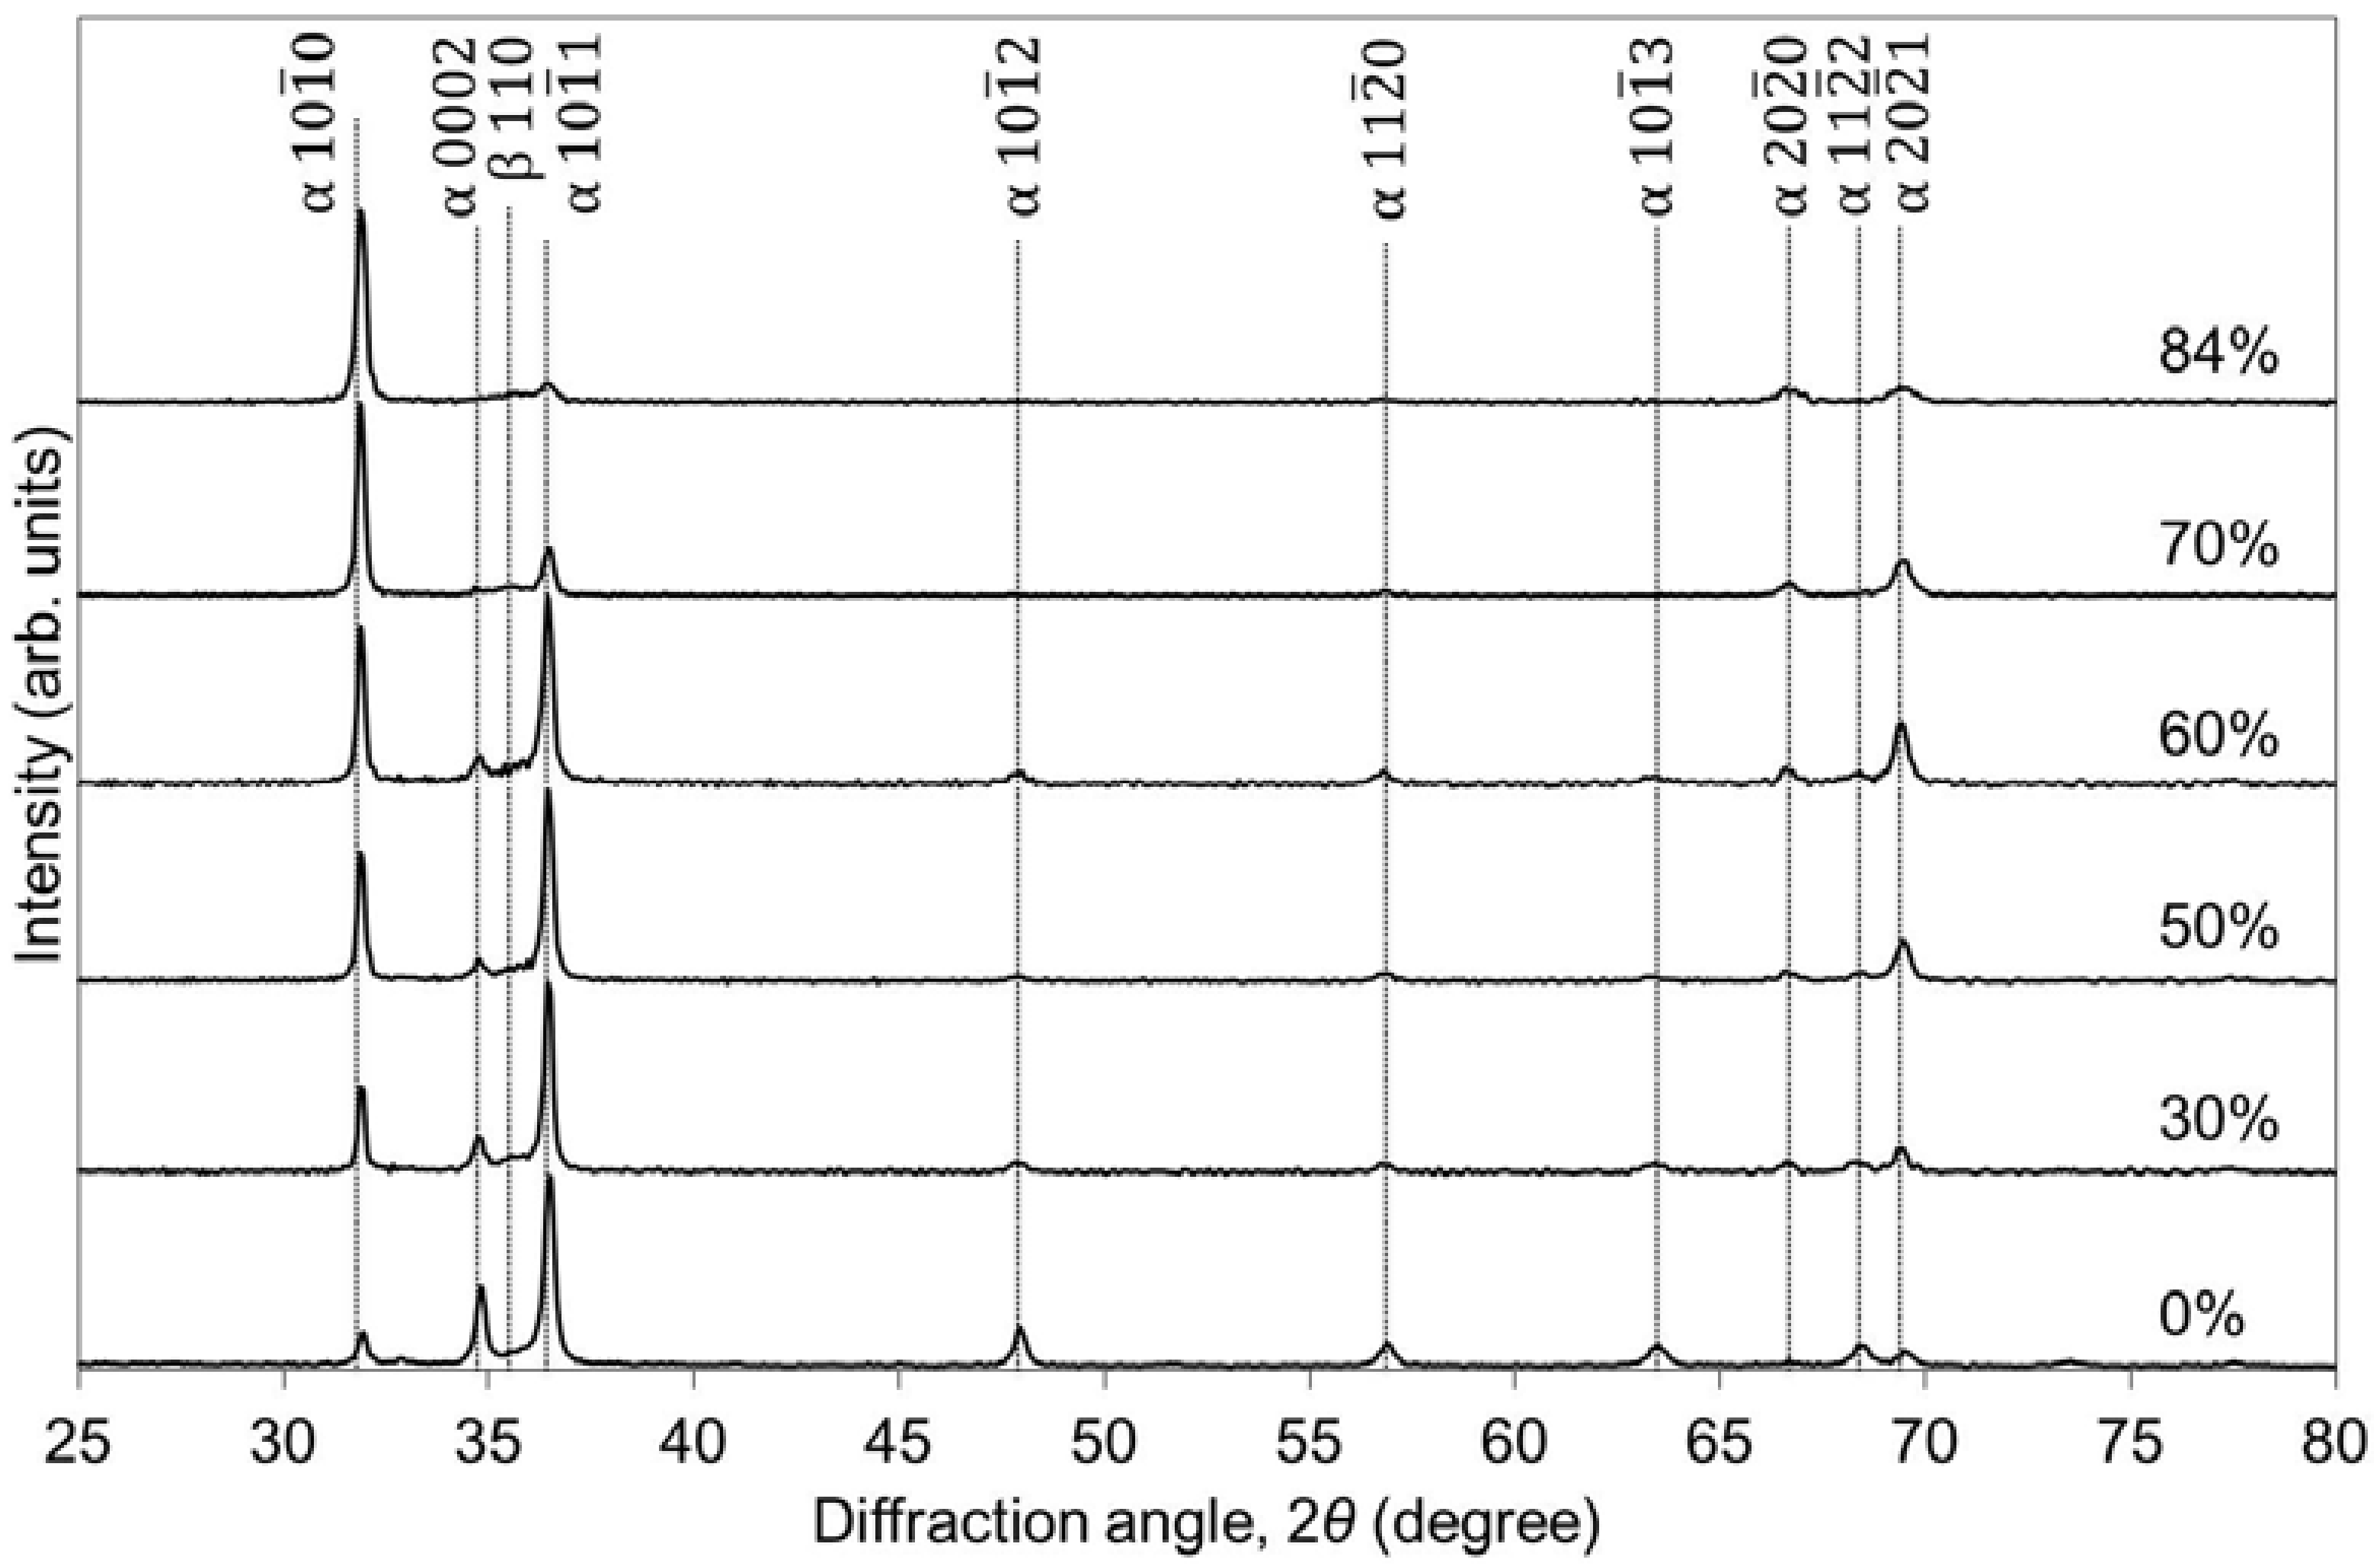
Figure 3.
XRD profiles of Zr–1Mo alloy specimens extracted parallel and normal to the processing direction with an area reduction of 30%, compared to the profile of an unswaged Zr–1Mo specimen.
Figure 3.
XRD profiles of Zr–1Mo alloy specimens extracted parallel and normal to the processing direction with an area reduction of 30%, compared to the profile of an unswaged Zr–1Mo specimen.

Figure 4.
TEM images (a) before and after cold swaging of specimens, corresponding to area reduction ratios of (b) 50% and (c) 84%.
Figure 4.
TEM images (a) before and after cold swaging of specimens, corresponding to area reduction ratios of (b) 50% and (c) 84%.
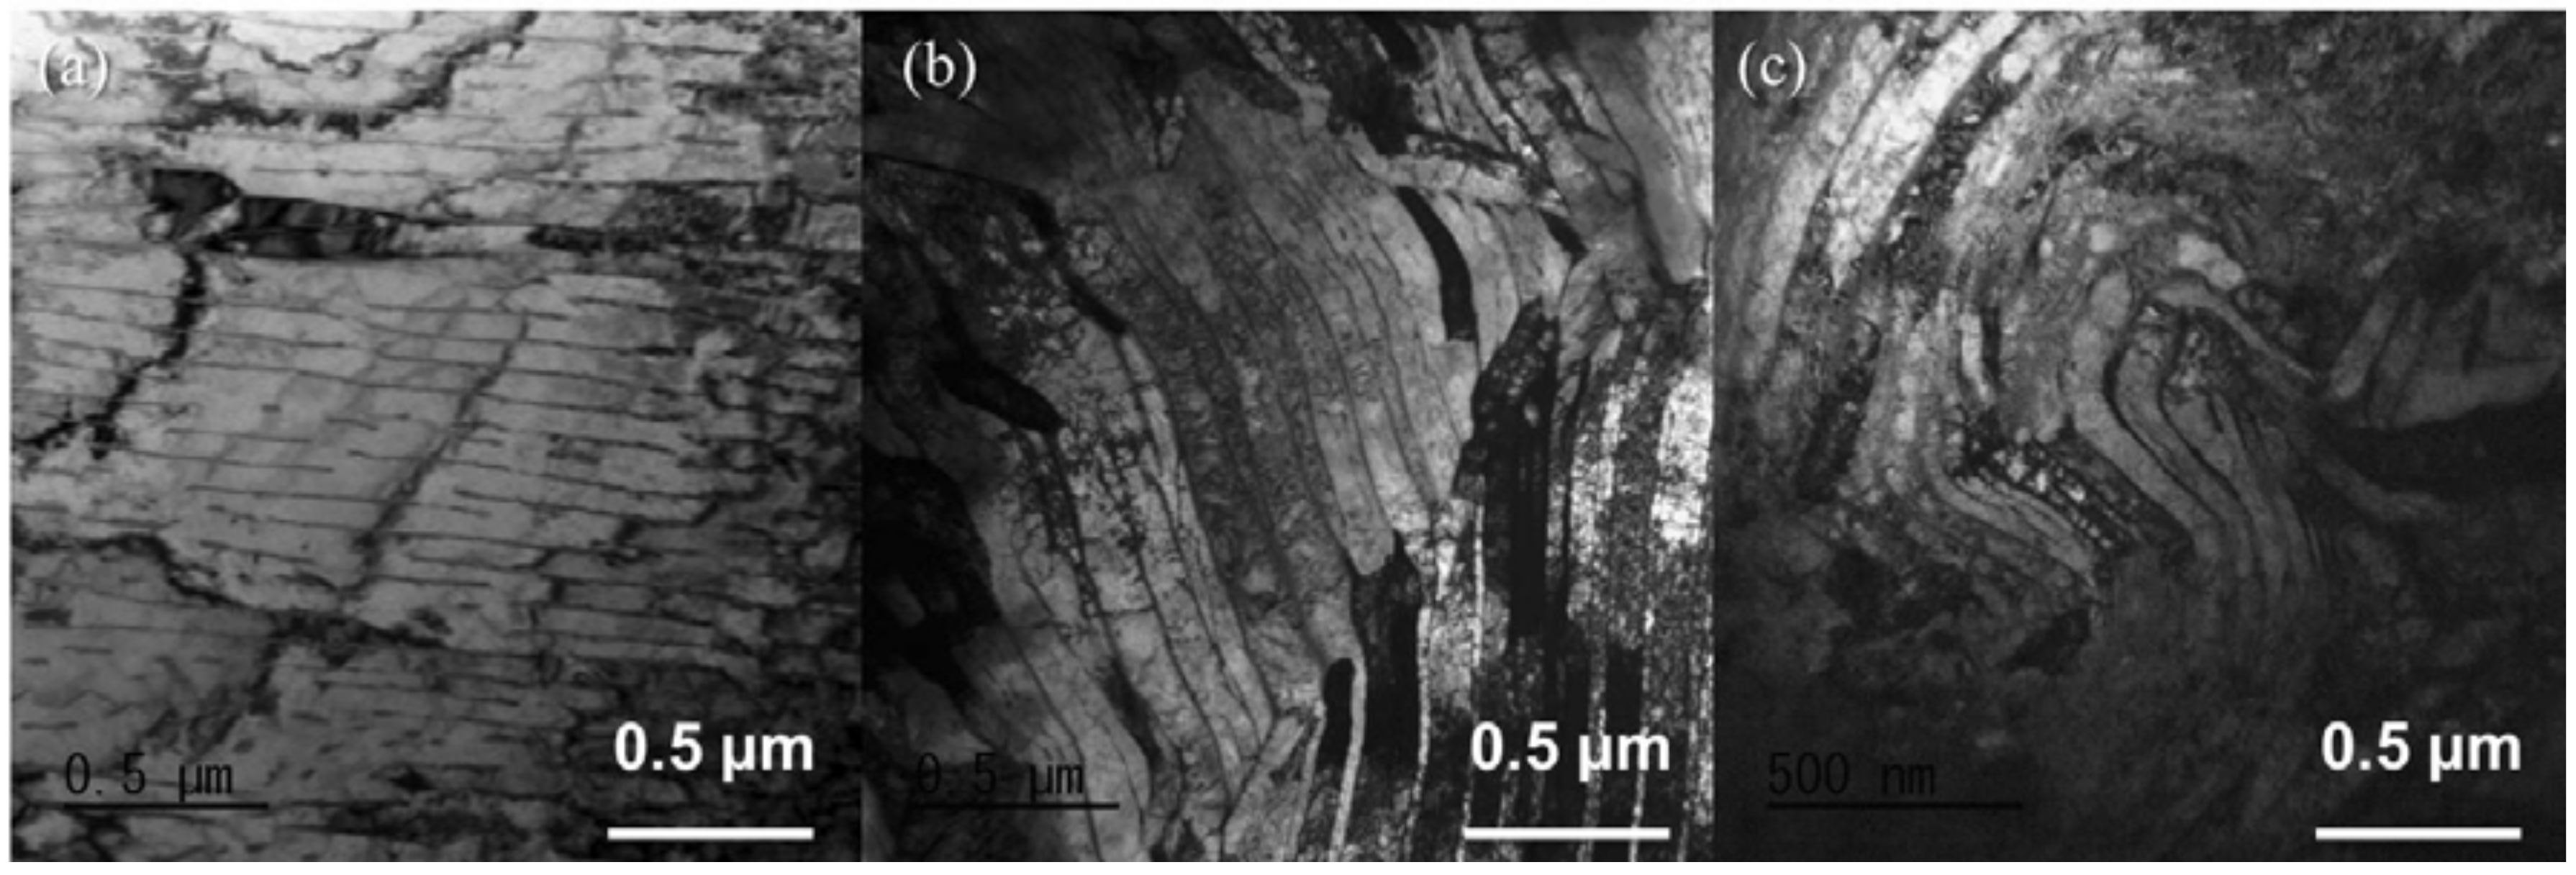
Figure 5.
Vickers hardness values of Zr–1Mo alloy specimens with area reductions of 0–84%.
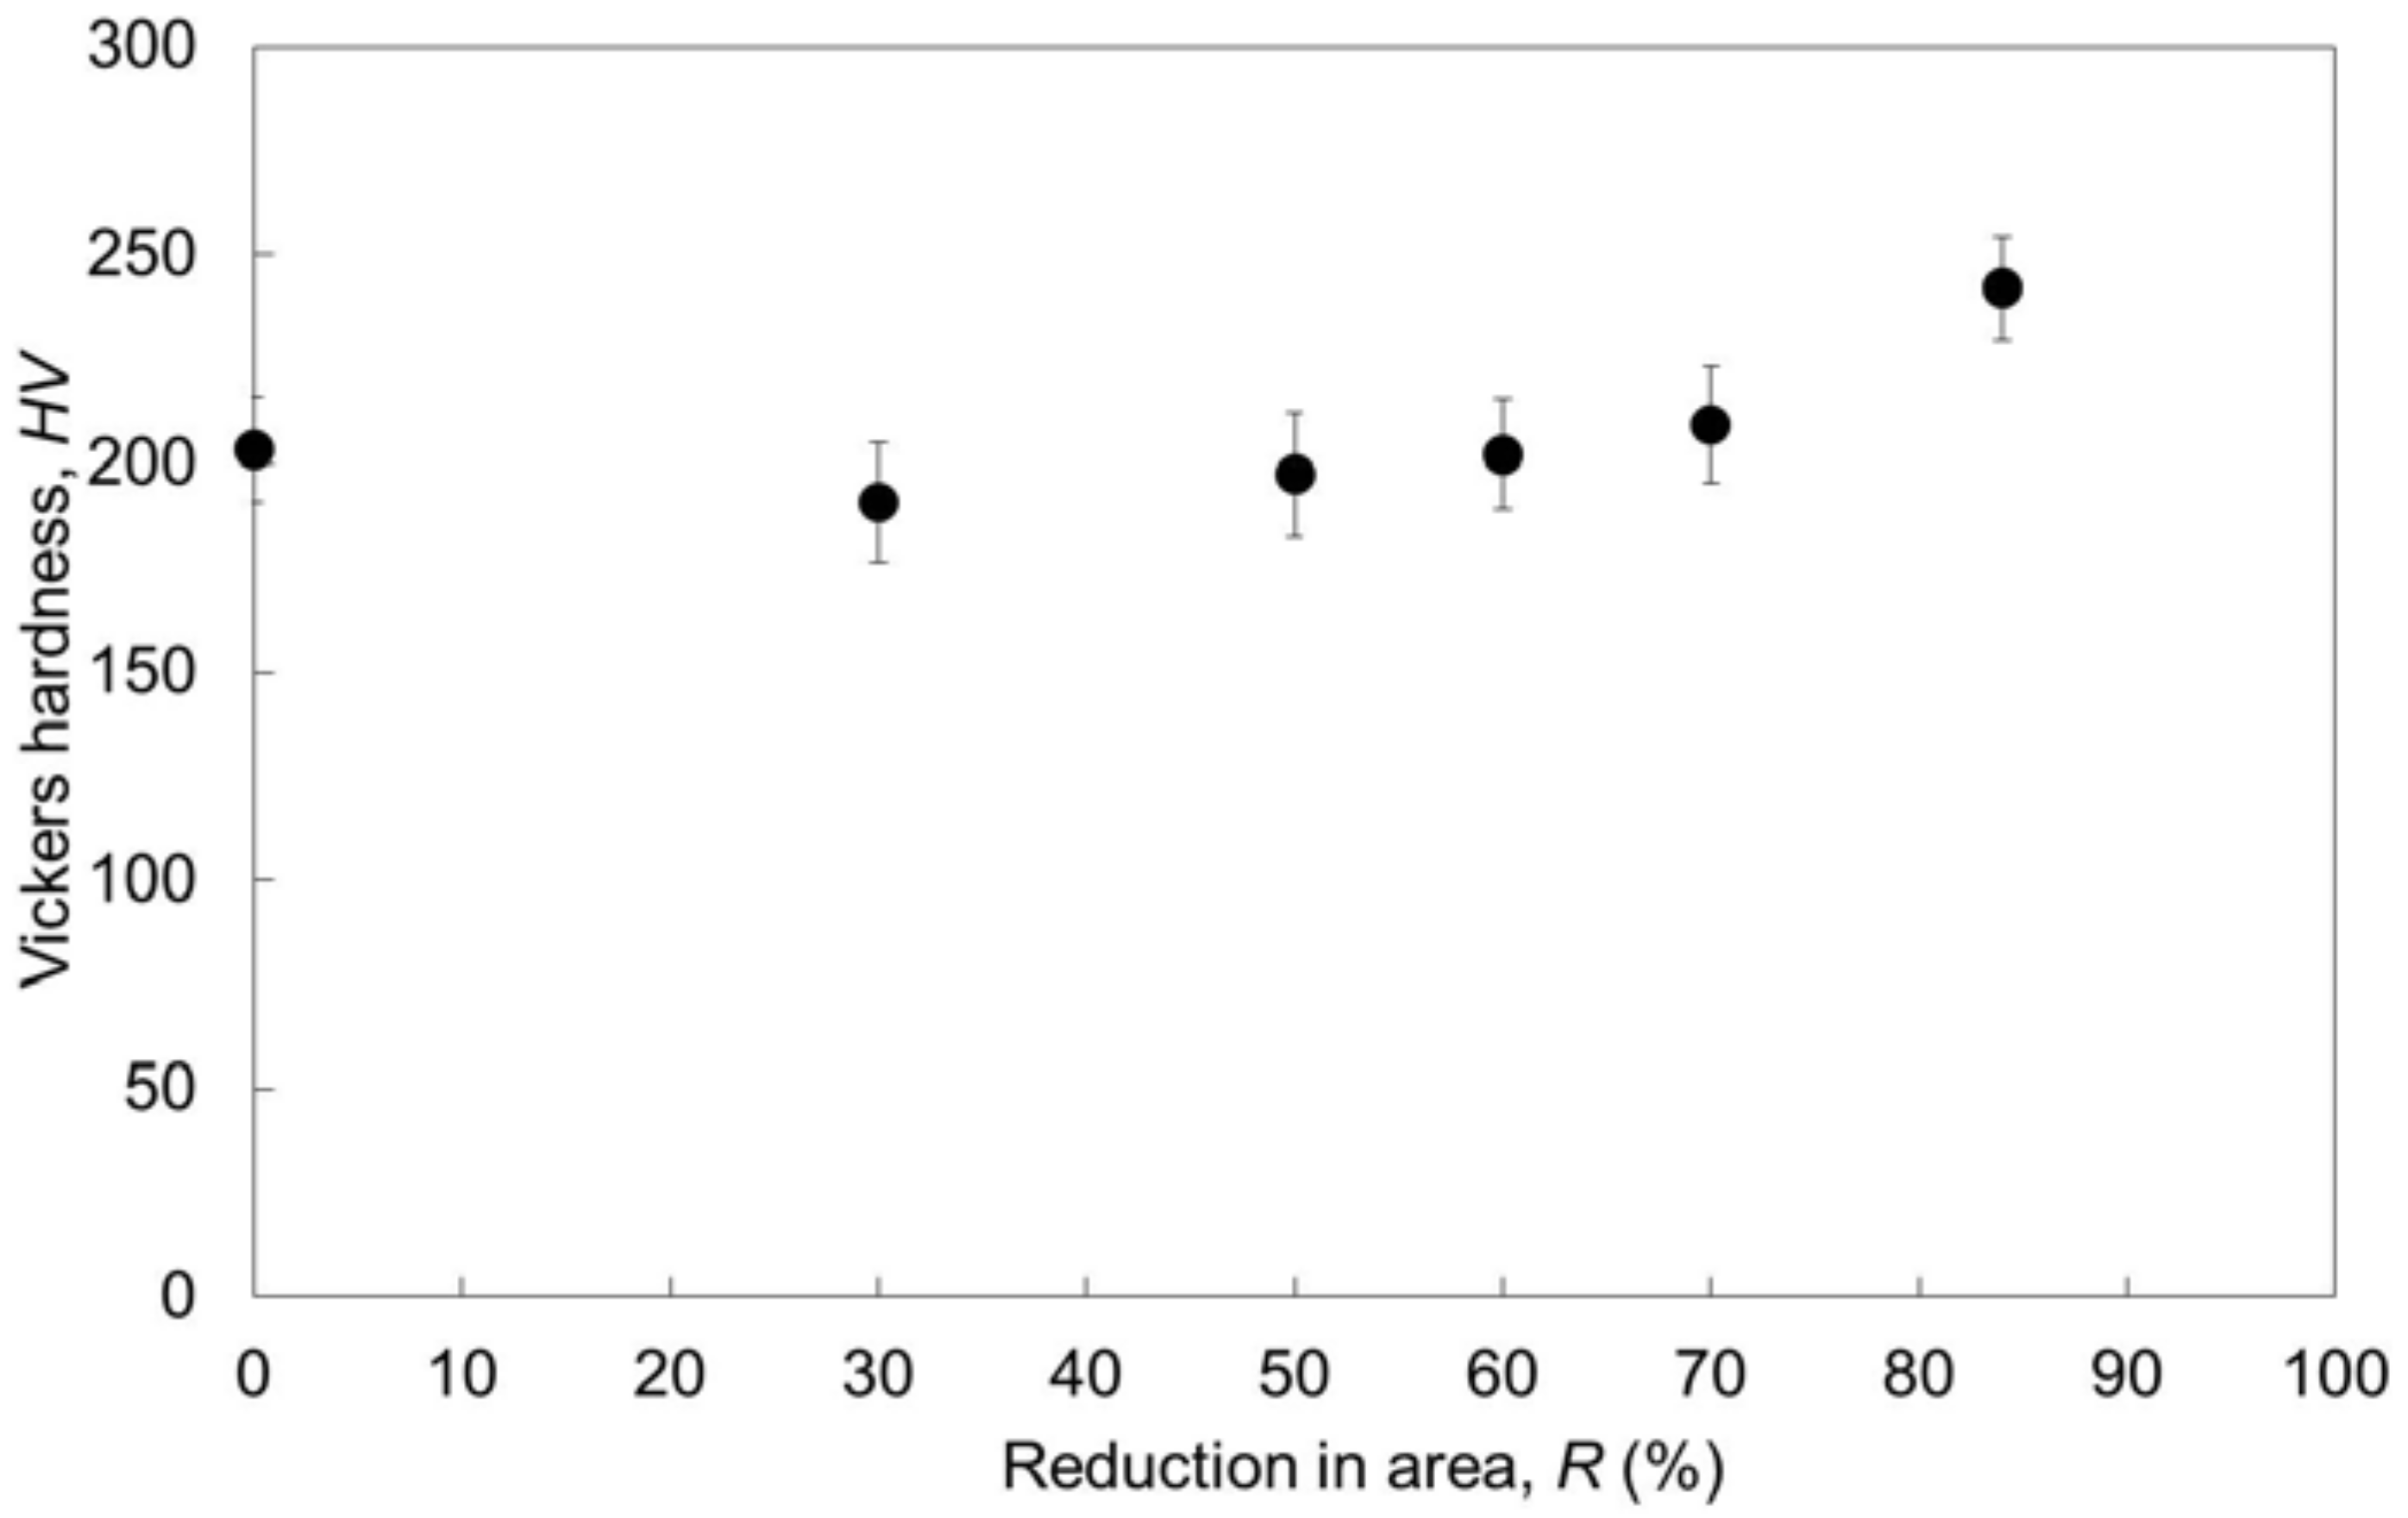
Figure 6.
Stress-strain curves of the Zr–1Mo alloy specimens: (a) before cold swaging and after cold swaging at area reduction ratios of (b) 30%, (c) 50%, (d) 60%, (e) 70%, and (f) 84%.
Figure 6.
Stress-strain curves of the Zr–1Mo alloy specimens: (a) before cold swaging and after cold swaging at area reduction ratios of (b) 30%, (c) 50%, (d) 60%, (e) 70%, and (f) 84%.
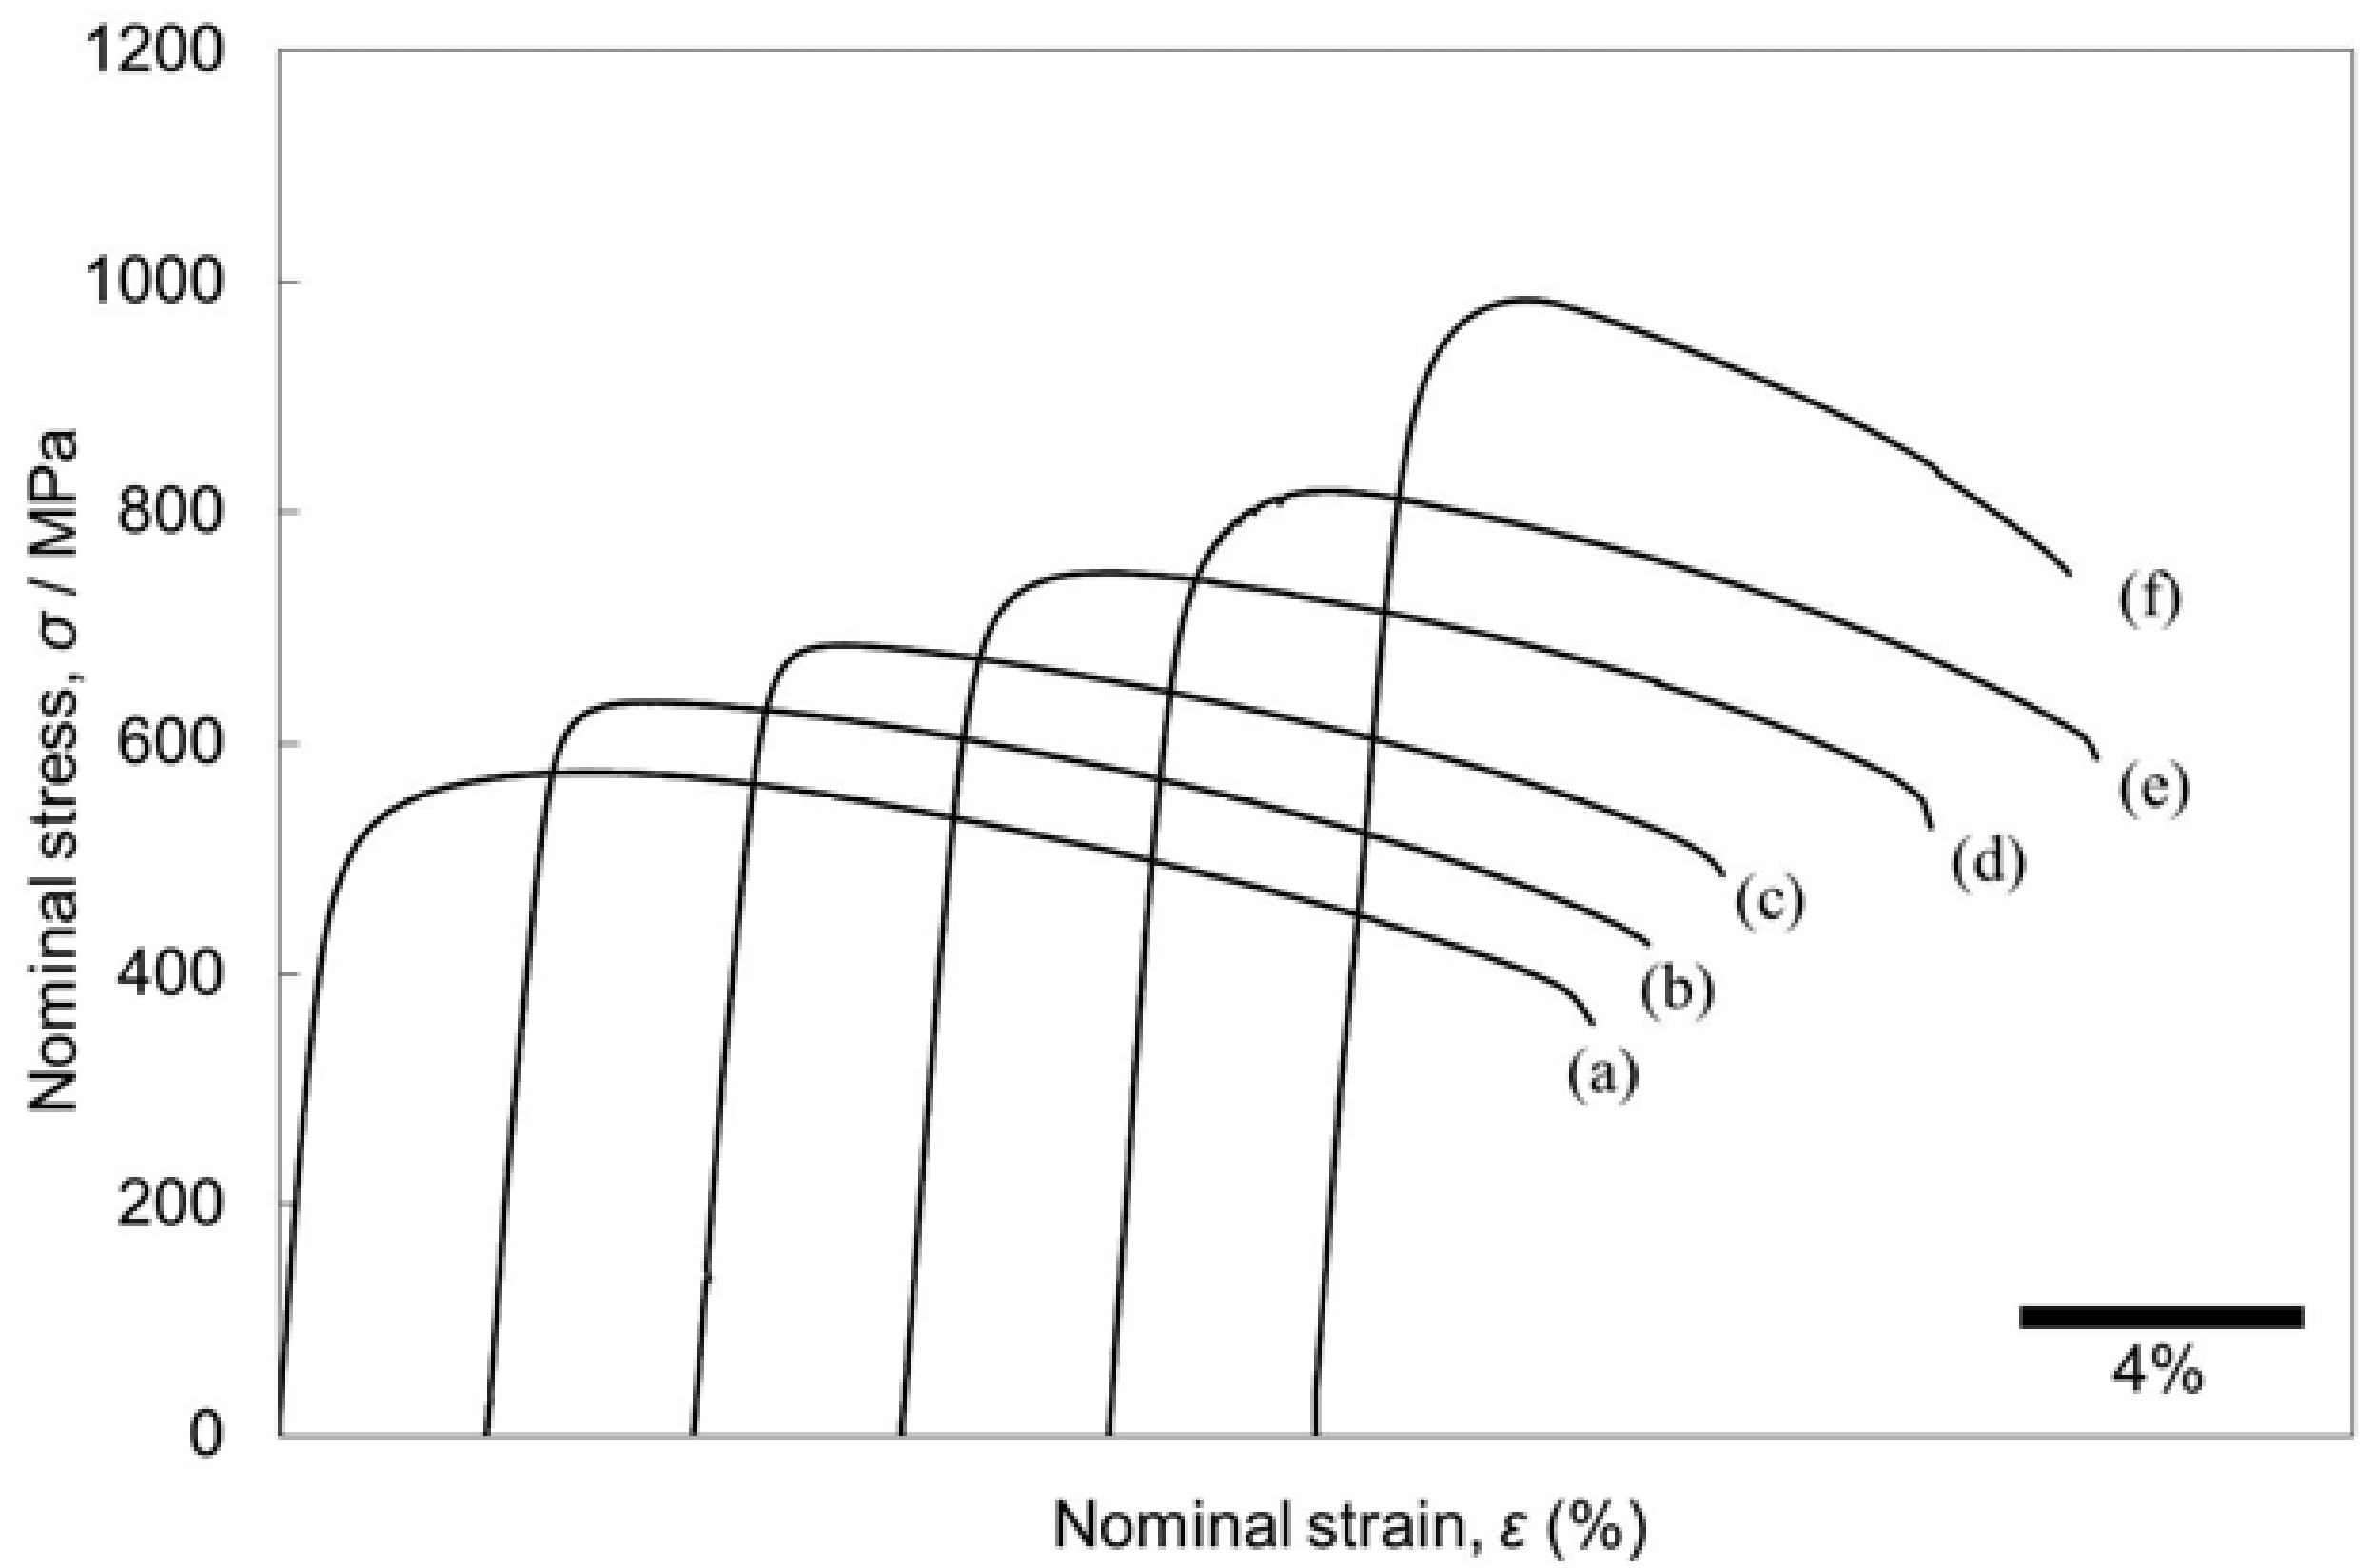
Figure 7.
Ultimate tensile strengths (UTS) and 0.2% proof stress values of Zr–1Mo alloy specimens with area reductions of 0–84%.
Figure 7.
Ultimate tensile strengths (UTS) and 0.2% proof stress values of Zr–1Mo alloy specimens with area reductions of 0–84%.

Figure 8.
Elongation to fracture values of Zr–1Mo alloy specimens with area reductions of 0–84%.

Figure 9.
Magnetic susceptibilities of Zr–1Mo alloy specimens extracted (a) parallel to the processing direction, with area reductions of 0–84%, and (b) normal to the processing direction, with an area reduction of 30%.
Figure 9.
Magnetic susceptibilities of Zr–1Mo alloy specimens extracted (a) parallel to the processing direction, with area reductions of 0–84%, and (b) normal to the processing direction, with an area reduction of 30%.
© 2018 by the authors. Licensee MDPI, Basel, Switzerland. This article is an open access article distributed under the terms and conditions of the Creative Commons Attribution (CC BY) license (http://creativecommons.org/licenses/by/4.0/).
Share and Cite
MDPI and ACS Style
Ashida, M.; Morita, M.; Tsutsumi, Y.; Nomura, N.; Doi, H.; Chen, P.; Hanawa, T. Effects of Cold Swaging on Mechanical Properties and Magnetic Susceptibility of the Zr–1Mo Alloy. Metals 2018, 8, 454. https://doi.org/10.3390/met8060454
AMA Style
Ashida M, Morita M, Tsutsumi Y, Nomura N, Doi H, Chen P, Hanawa T. Effects of Cold Swaging on Mechanical Properties and Magnetic Susceptibility of the Zr–1Mo Alloy. Metals. 2018; 8(6):454. https://doi.org/10.3390/met8060454
Chicago/Turabian StyleAshida, Maki, Masahiro Morita, Yusuke Tsutsumi, Naoyuki Nomura, Hisashi Doi, Peng Chen, and Takao Hanawa. 2018. "Effects of Cold Swaging on Mechanical Properties and Magnetic Susceptibility of the Zr–1Mo Alloy" Metals 8, no. 6: 454. https://doi.org/10.3390/met8060454
Note that from the first issue of 2016, this journal uses article numbers instead of page numbers. See further details here.