GIS Modeling of Solar Neighborhood Potential at a Fine Spatiotemporal Resolution


Abstract
:1. Introduction
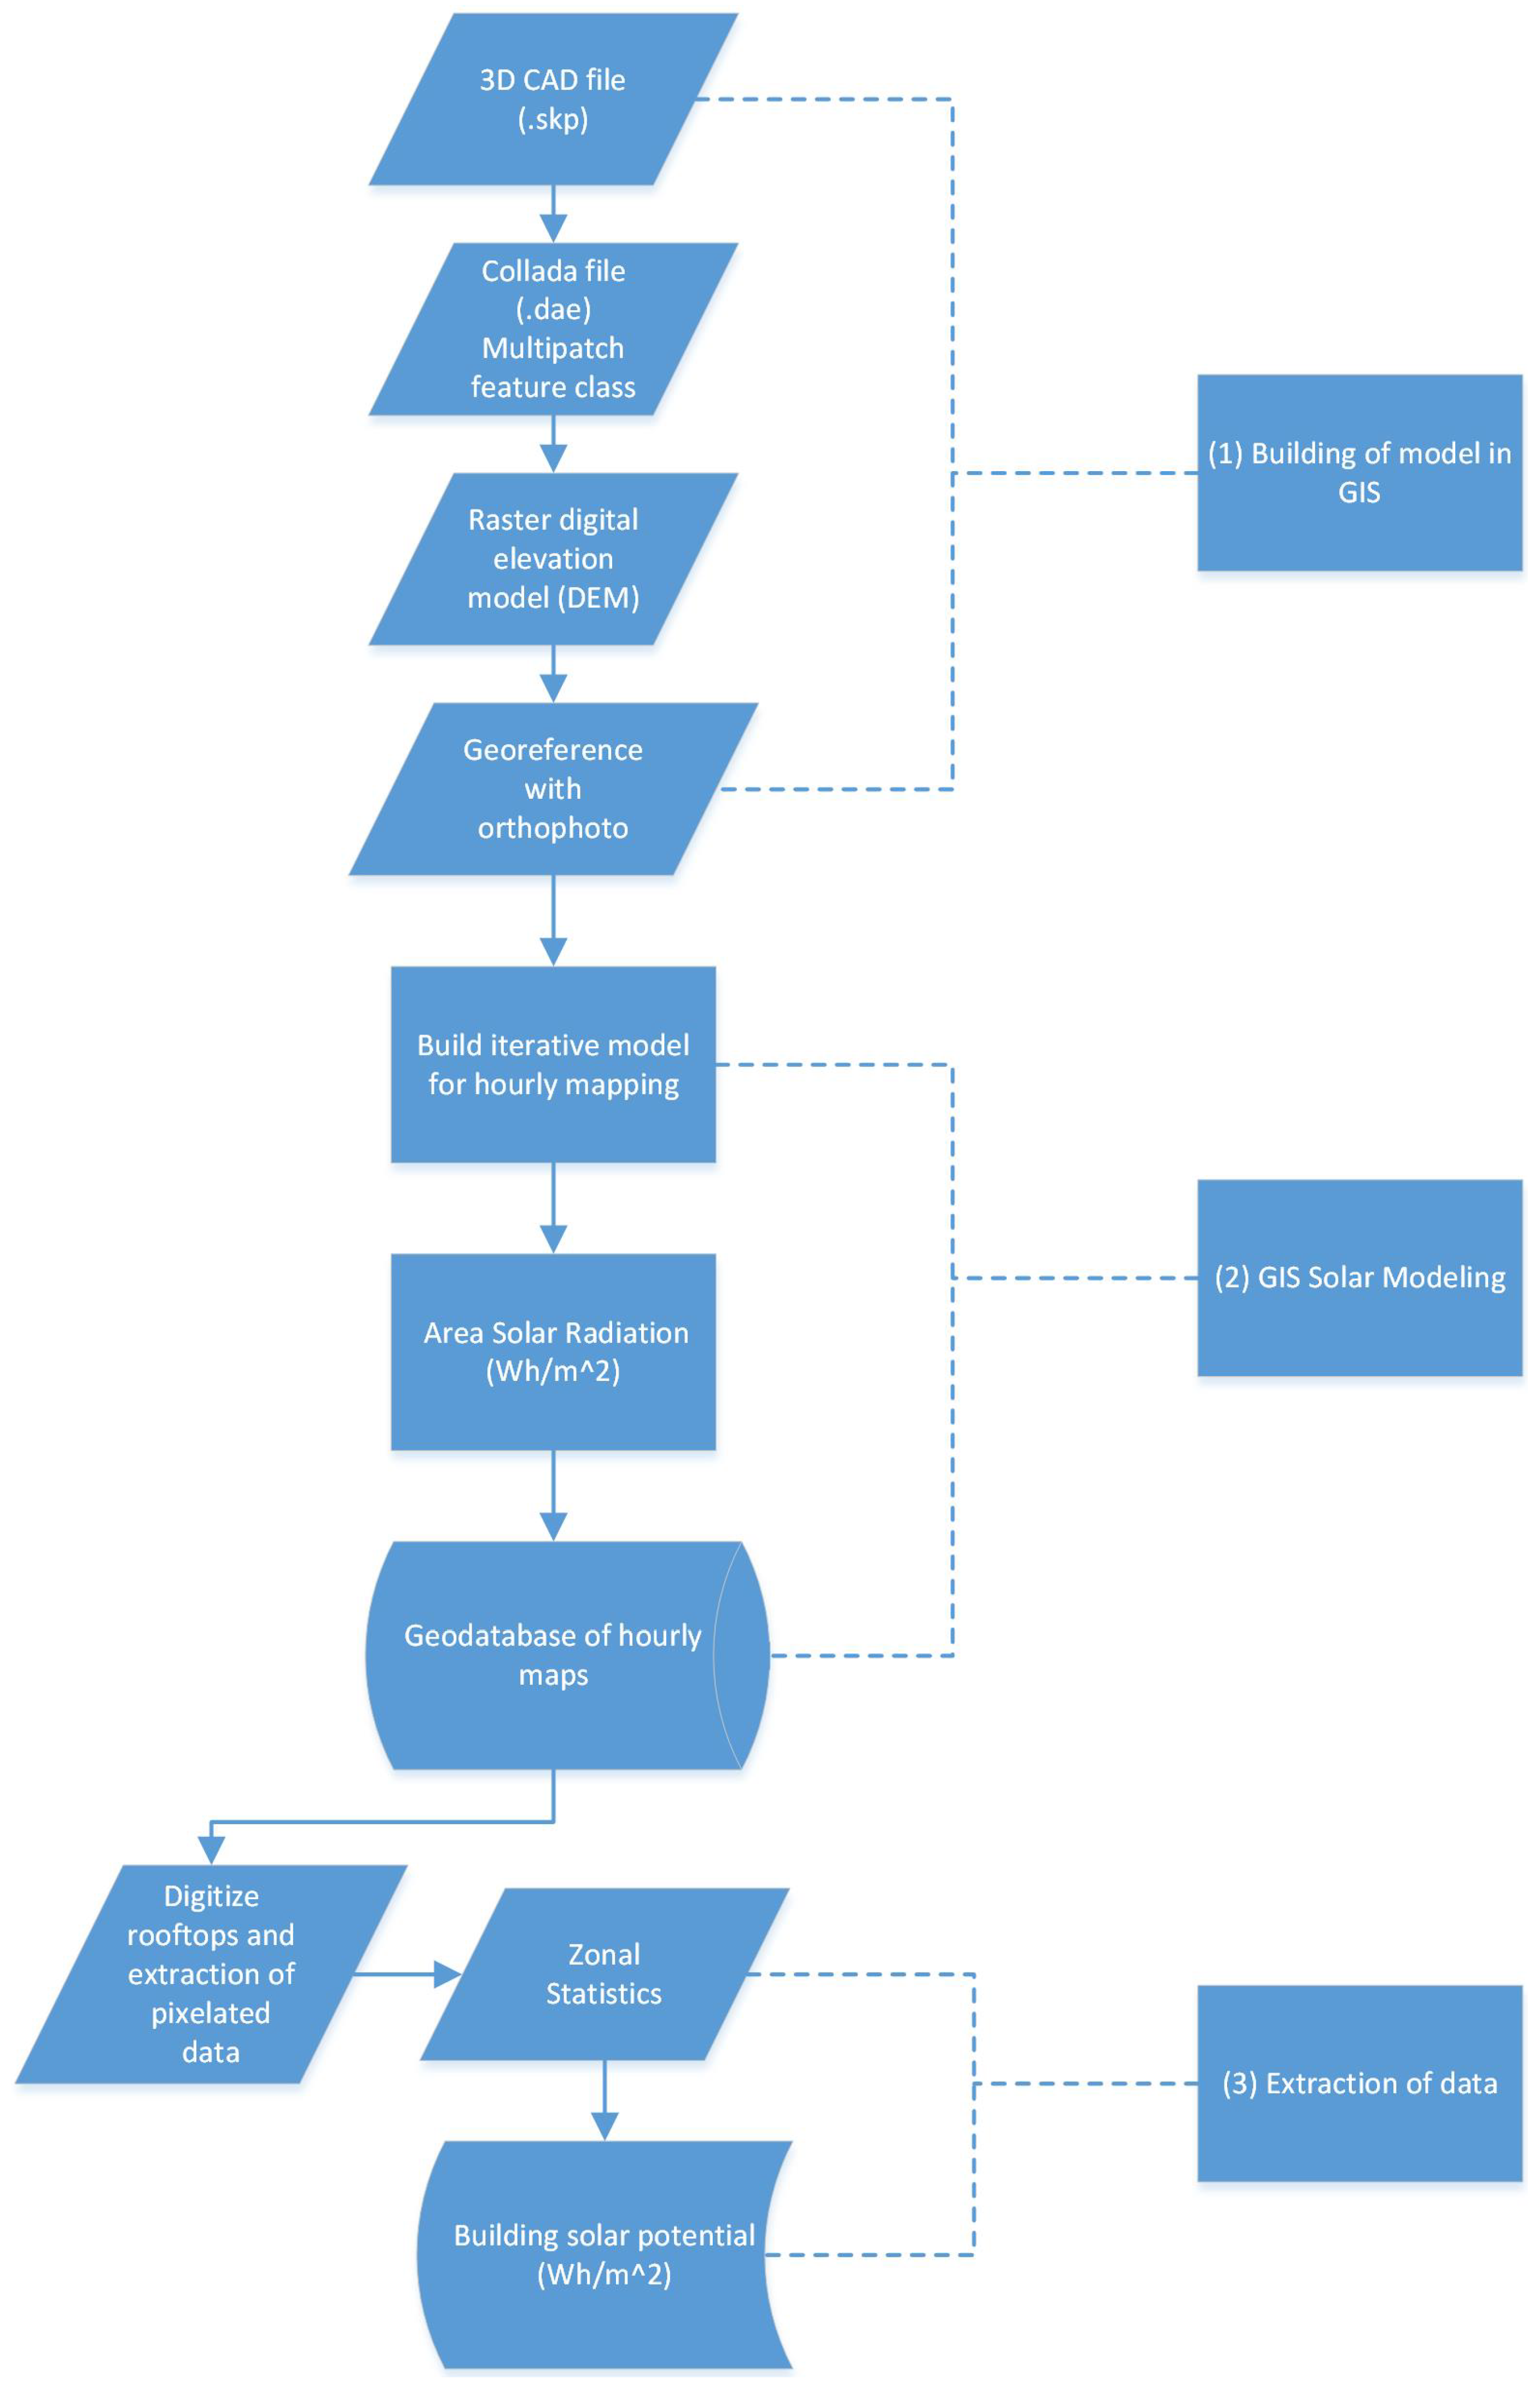
2. Methodology

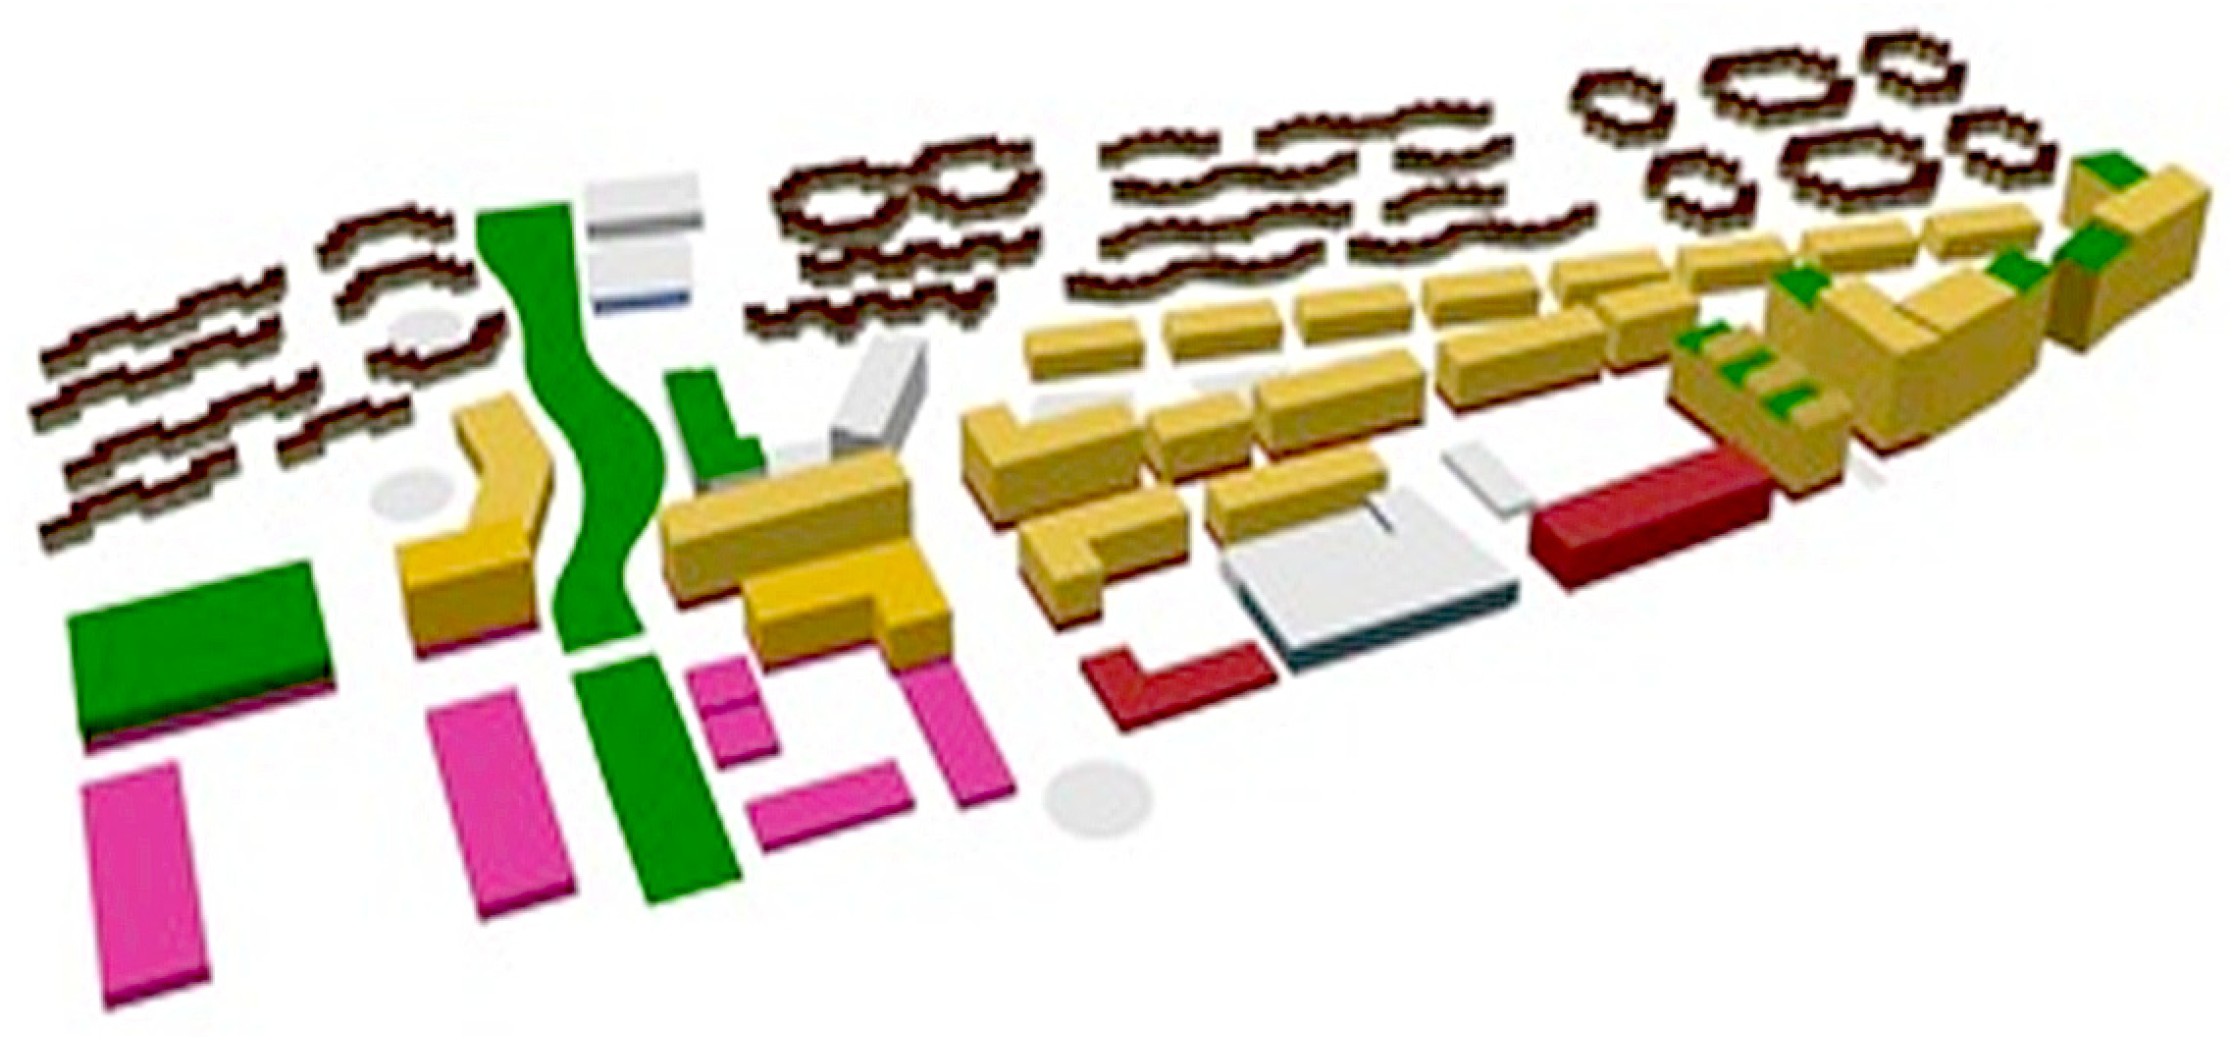
2.1. Building of the 3D Model


2.2. GIS Solar Modeling


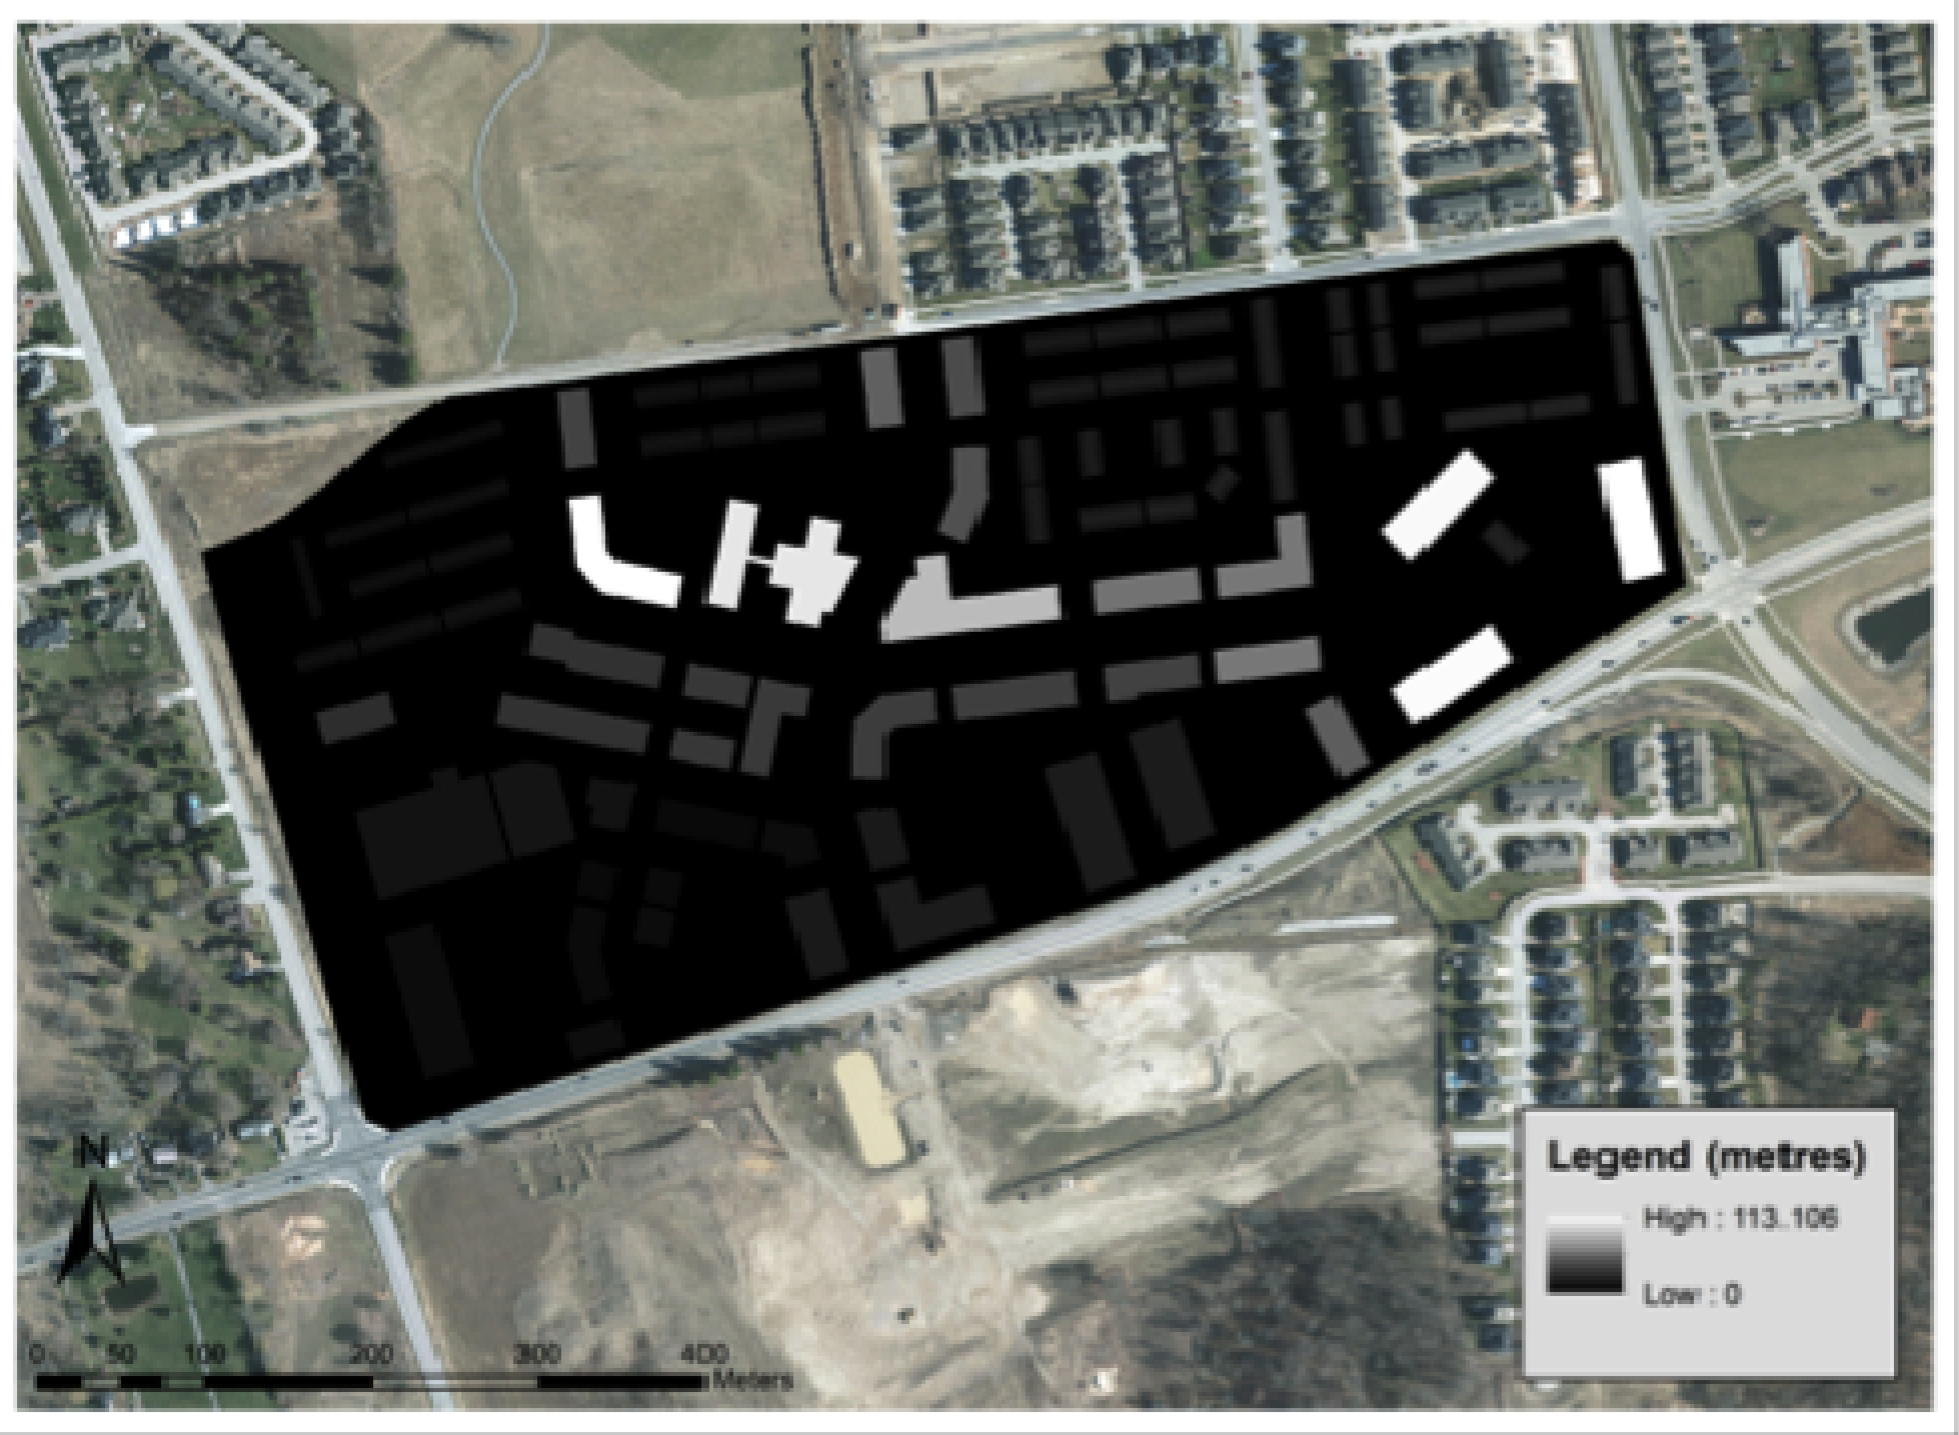
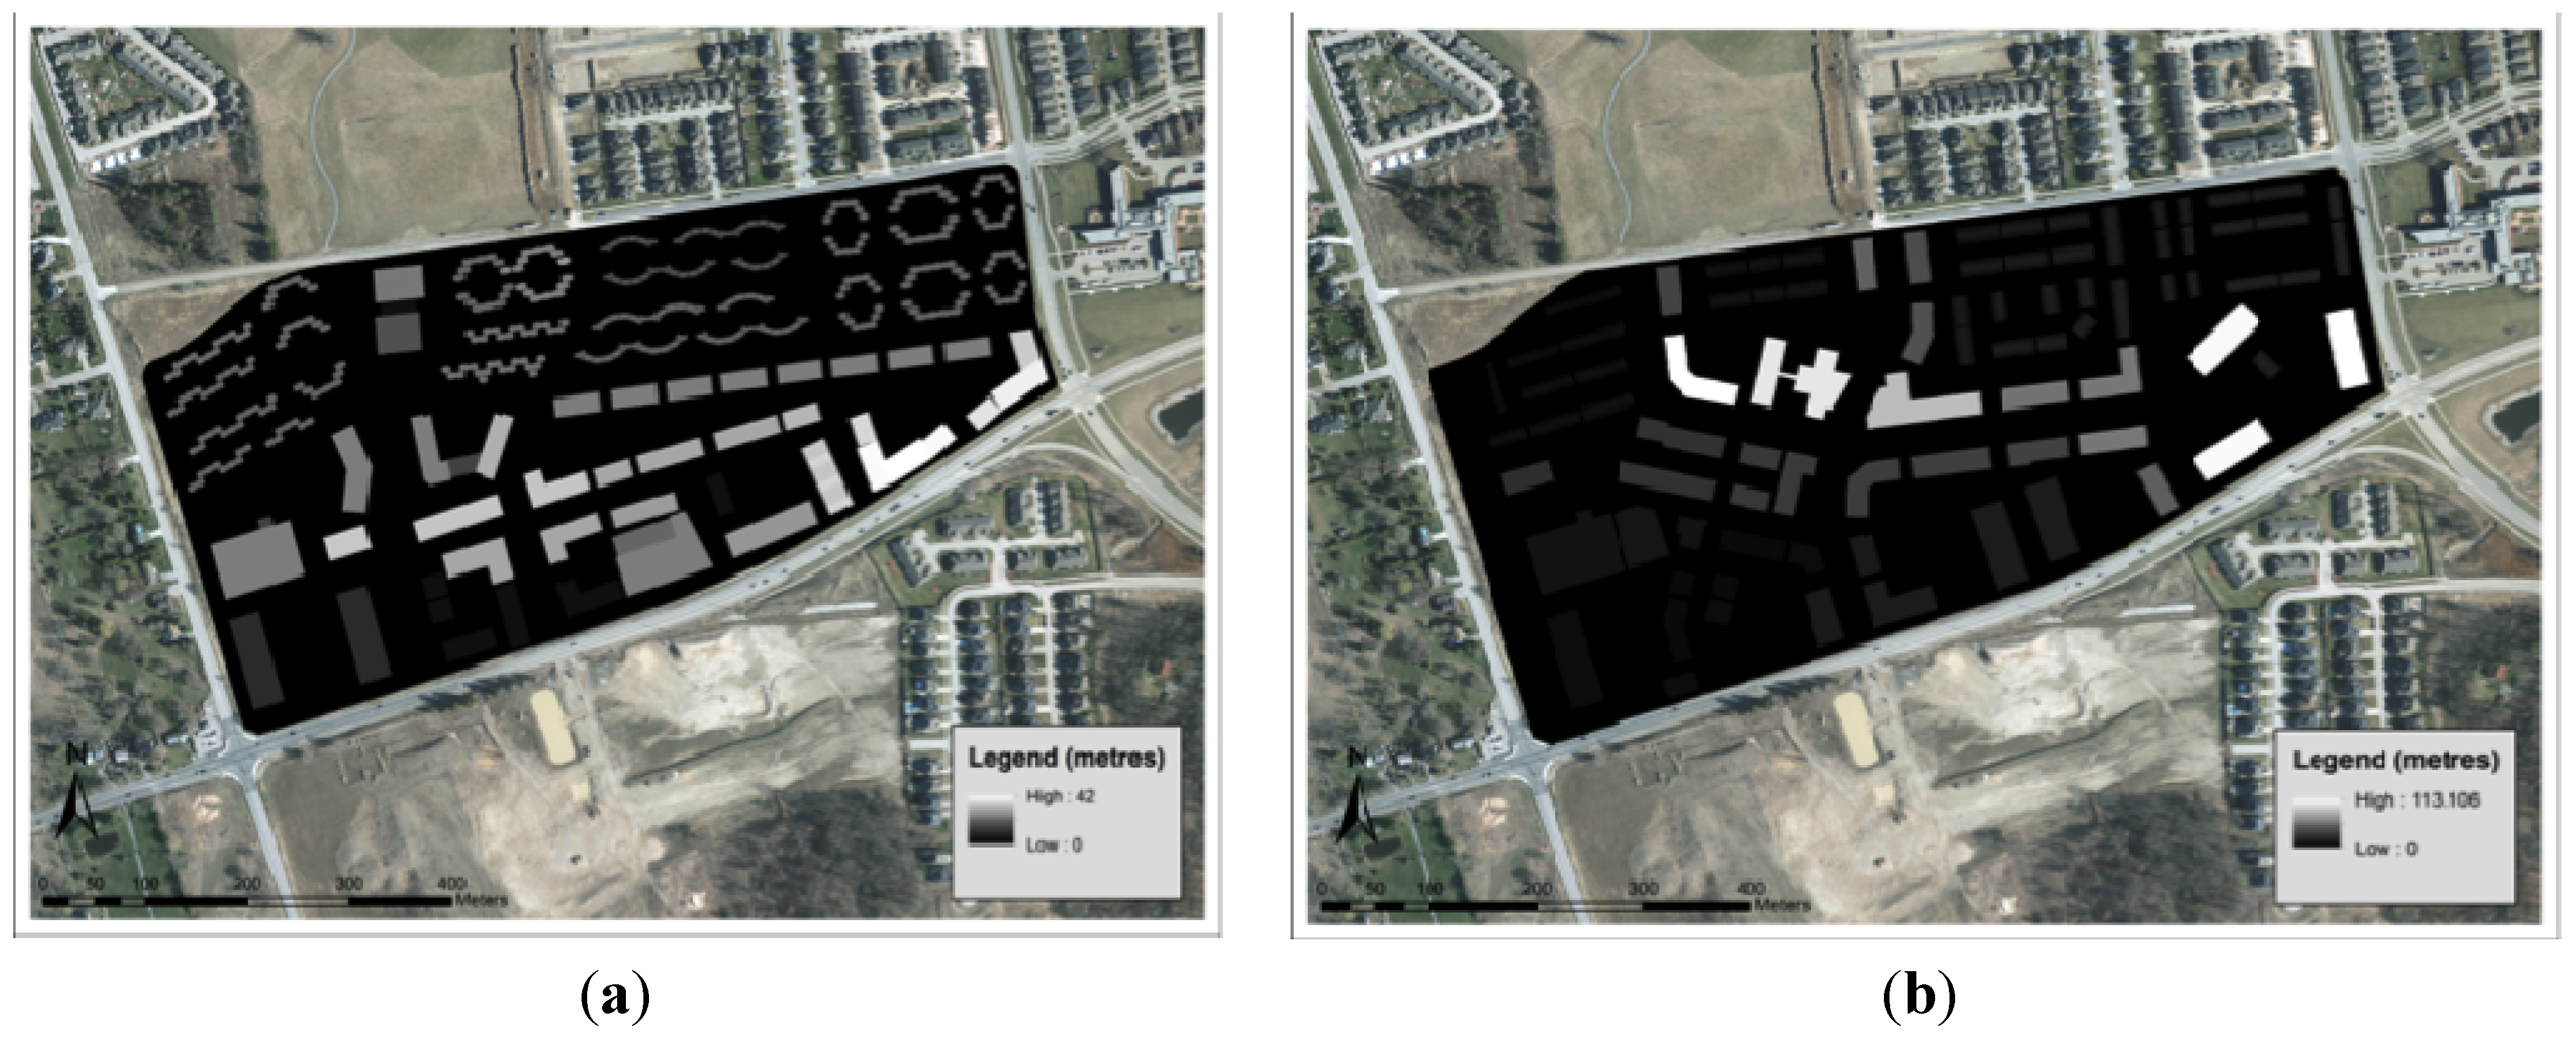
2.3. Extraction of Data
3. Preliminary Results & Discussions


4. Conclusions
Acknowledgments
Author Contributions
Conflicts of Interest
References
- O’Brien, W.; Kennedy, C.; Athienitis, A.; Kesik, T. The relationship between net energy use and the urban density of solar buildings. Environ. Plan. 2010, 37, 1002–1021. [Google Scholar] [CrossRef]
- Athienitis, A.K.; Kesik, T.; Morrison, I.B.; Noguchi, M.; Tzempelikos, A.; Charron, R.; Karava, P.; Zmeureanu, R.; Love, J.; Harrison, S.; et al. Development of Requirements for a Solar Building Conceptual Design Tool. In Proceedings of the Canadian Solar Buildings Conference, Montreal, Canada, 20–24 August 2006.
- Brown, S.; Rowlands, I. Nodal pricing in Ontario, Canada: Implications for solar PV electricity. Renew. Energy 2009, 34, 170–178. [Google Scholar] [CrossRef]
- Sun, Y.; Hof, A.; Wang, R.; Liu, J.; Lin, Y.; Yang, D. GIS-based approach for potential analysis of solar PV generation at the regional scale: A case study of Fujian province. Energy Policy 2013, 58, 248–259. [Google Scholar] [CrossRef]
- Brito, M.; Gomes, N.; Santos, T.; Tenedorio, J. Photovoltaic potential in a Lisbon suburb using LiDAR data. Sol. Energy 2012, 86, 283–288. [Google Scholar] [CrossRef]
- La Gennusa, M.; Lascari, G.; Rizzo, G.; Scaccianoce, G.; Sorrentino, G. A model for predicting the potential diffusion of solar energy systems in complex urban environments. Energy Policy 2011, 39, 5335–5343. [Google Scholar] [CrossRef]
- Wiginton, L.K.; Nguyen, H.T.; Pearce, J.M. Quantifying rooftop solar photovoltaic potential for regional renewable energy policy. Comput. Environ. Urban Syst. 2010, 34, 345–357. [Google Scholar] [CrossRef]
- Longley, A.; Goodchild, M.; Maguire, D.; Rhind, D. Geographic Information Systems and Science, 2nd ed.; John Wiley & Sons Ltd.: Chichester, UK, 1995. [Google Scholar]
- ESRI. ArcGIS Help 10.1. Understanding solar radiation analysis. 2012. Available online: http://resources.arcgis.com/en/help/main/10.1/index.html#//009z000000t8000000 (accessed on 20 October 2013).
- ESRI. ArcGIS Help 10.1. How solar radiation is calculated. 2012. Available online: http://resources.arcgis.com/en/help/main/10.1/index.html#/How_solar_radiation_is_calculated/009z000000tm000000/ (accessed on 19 October 2013).
- Rich, P.M.; Dubayah, R.; Hetrick, W.A.; Saving, S.C. Using Viewshed Models to Calculate Intercepted Solar Radiation: Applications in Ecology. Available online: http://professorpaul.com/publications/rich_et_al_1994_asprs.pdf (accessed on 19 May 2014).
- Fu, P.; Rich, P. Design and Implementation of the Solar Analyst: An ArcView Extension for Modeling Solar Radiation at Landscape Scales. In Proceedings of the Nineteenth Annual ESRI User Conference, San Diego, CA, USA, 26–30 July 1999.
- ESRI. ArcGIS Desktop 10.2 Help. Area solar radiation (Spatial Analyst). Available online: http://resources.arcgis.com/en/help/main/10.2/index.html#//009z000000t5000000 (accessed on 10 January 2014).
- Blundell, J.; Opitz, D. Object recognition and feature extraction from imagery: The feature analyst approach. In Proceedings of the First International Conference on Object-based Image Analysis, Salzburg, Austria, 4–5 July 2006.
© 2014 by the authors; licensee MDPI, Basel, Switzerland. This article is an open access article distributed under the terms and conditions of the Creative Commons Attribution license (http://creativecommons.org/licenses/by/3.0/).
Share and Cite
Chow, A.; Fung, A.S.; Li, S. GIS Modeling of Solar Neighborhood Potential at a Fine Spatiotemporal Resolution. Buildings 2014, 4, 195-206. https://doi.org/10.3390/buildings4020195
Chow A, Fung AS, Li S. GIS Modeling of Solar Neighborhood Potential at a Fine Spatiotemporal Resolution. Buildings. 2014; 4(2):195-206. https://doi.org/10.3390/buildings4020195
Chicago/Turabian StyleChow, Annie, Alan S. Fung, and Songnian Li. 2014. "GIS Modeling of Solar Neighborhood Potential at a Fine Spatiotemporal Resolution" Buildings 4, no. 2: 195-206. https://doi.org/10.3390/buildings4020195
APA StyleChow, A., Fung, A. S., & Li, S. (2014). GIS Modeling of Solar Neighborhood Potential at a Fine Spatiotemporal Resolution. Buildings, 4(2), 195-206. https://doi.org/10.3390/buildings4020195