Article

Thermal and Economic Analysis of Renovation Strategies for a Historic Building in Mediterranean Area

1
Architectural Engineer, Via G.B. Pergolesi 18, 95034 Bronte, Italy
2
Department of Electric, Electronic and Computer Engineering, University of Catania, Viale A. Doria 6, 95125 Catania, Italy
3
Department of Civil Engineering and Architecture, University of Catania, Via Santa Sofia 64, 95123 Catania, Italy
*
Author to whom correspondence should be addressed.
Buildings 2017, 7(3), 60; https://doi.org/10.3390/buildings7030060
Submission received: 4 May 2017 / Revised: 23 June 2017 / Accepted: 28 June 2017 / Published: 3 July 2017
(This article belongs to the Special Issue Passive Strategies for Building Renovation in Temperate Climate)

Abstract

:
Around 30% of the European building stock was built before 1950, when no regulations about energy efficiency were in force. Since only a small part of them has been renovated by now, the energy performance of this building stock is on average quite poor, resulting in a significant impact on the energy balance of European countries, as confirmed by data published by ISTAT (Italian National Statistical Institute). However, energy retrofit in historic edifices is a quite demanding issue as any intervention must take into account the need to preserve existing building materials and appearances while also allowing reversibility and low invasiveness. As an example, in these buildings it is not possible to apply an ETICS (External Thermal Insulation Composite System), since this would alter the historic and architectural value of the façade. On the other hand, internal insulation would have the drawback of reducing the net useful floor area, which also implies a loss of economic value. Moreover, internal insulation may induce overheating risks and mold formation. In this paper, all these issues are investigated with reference to an existing historic building located in southern Italy, showing that a retrofit strategy aimed at energy savings and cost-effectiveness is still possible if suitable materials and solutions are adopted.

1. Introduction

1.1. Main Issues in Historic Buildings Renovation

It is well known that a substantial share of the existing building stock in Europe dates back to before the 1960s and shows poor energy performance. If one also considers the current low rates of new constructions (around 1% of the existing building stock), it is undeniable that any action towards energy efficiency in buildings has to envisage a substantial energy retrofit of the existing building stock. However, a specifically tailored approach must be taken for a particular category of buildings, namely the historic buildings.
The adjective ‘historic’, if applied to a building, does not refer just to the fact of belonging to the past but also indicates that that building has a certain historical significance due to its cultural and architectural value. Usually, historic buildings are at least 50 years old and retain a relatively high degree of physical integrity [1]. A small percentage of historic buildings can even be considered to belong to the cultural heritage, and in Italy they fall under the regulations of Legislative Decree no. 42 of 22 January 2004 (Code of Cultural Heritage and Landscape). These buildings show elements of artistic, historical, archeological, or ethno-anthropological interest and are subject to protection by the competent ministerial authorities. Protected buildings cannot be allowed to deteriorate, be damaged, or used in ways not compatible with their historical or artistic nature, which would jeopardize their conservation [2].
It is then obvious that, when approaching the retrofit of protected historic buildings, the requisites introduced by Italian legislation in the case of energy retrofit in compliance with the latest European Directive on Building Energy Performance [3] do not apply. In some cases, no measures for energy retrofitting are even taken insofar as they would unacceptably alter the appearance and cultural value of the historic building [4].
Hence, the matter is quite complex. Cultural heritage preservation and energy savings are important issues, but there seems to be no coordination at the EU level. Mazzarella [1] also highlights the lack of specific protocols to provide balanced solutions for the improvement of energy efficiency and conservation of historic buildings; in this process, the effects of retrofitting on thermal comfort and daylight exploitation should also be analyzed [5]. Directives and laws should then promote and emphasize a trans-disciplinary approach for the retrofitting of historic buildings [6].
As concerns more technical issues, some authors remark that vertical walls in historic buildings usually show a non-homogeneous and non-isotropic composition (e.g., local stones plus mortar with variable percentage), which does not allow a clear stratigraphy to be identified. This implies that their performance should be characterized through on-site experimental investigations, especially for the assessment of the thermal transmittance [7]. In any case, in order to perform energy simulations, some simplifications and assumptions must be introduced; as an example, the vaults can be approximated as flat surfaces and an appropriate mean floor height can be assumed to get equivalent heated volumes [8]. De Fino et al. [9] underline that, in the case of exposed stone surfaces, retrofitting walls in historic buildings has a very low degree of transformability, whereas in the case of plastered surfaces, a medium degree of transformability is observed since one has only to ensure similar color and thickness.
Thermal insulating plasters are frequently regarded as a very interesting solution thanks to their relatively easy installation and their reversibility. Their thermal conductivity is more than ten times lower than traditional plasters; hence they offer a good compromise between energy and conservation aspects [10]. On the other hand, the application of an insulating material on the interior of a traditional wall may result in the accumulation of moisture within the wall, frost damage, timber decay, and mold growth [11,12]. Moreover, this practice accentuates the risk of overheating since thermal mass cannot be effectively exploited [13,14]; future climatic scenarios may induce further increases in the cooling load [15,16].
In any case, this solution is often regarded as the only choice for insulating the walls [17]. As an example, Ascione et al. [18] proposed the application of a 50-mm layer of a thermal plaster (λ = 0.058 W·m−1·K−1) on the inner side of the walls of a historic building in southern Italy, having care of the cultural integrity of the building. The proposed solution reduced the wall U-value by 30% and also required a vapor-barrier in order to avoid condensation phenomena in Winter. This retrofit solution reduced the overall primary energy demand by only 2% since the building already had sufficiently good thermal insulation and due to the mild climate.
On the other hand, Cornaro et al. proposed the application of a highly insulating plaster (λ = 0.045 W·m−1·K−1) to a historic building built in the Sixteenth Century in central Italy [19]. The plaster, the thickness of which was between 40 and 60 mm, was applied on the external side and, combined with the floor insulation, reduced the energy demand by 38%. Ascione et al. [20] demonstrated that the more suitable package of energy efficiency measures to retrofit an ancient educational building in the historic center of Benevento (Italy) is the replacement of the existing windows (single clear glazing plus wooden frames) with higher performing ones (low-e glazing and wood-aluminum frames), combined with the application of 50-mm inner thermal plaster plus the thermal insulation of the roof (100-mm thick Expanded Polystyrene boards).
Finally, Magrini et al. [21] tried to apply an environmental sustainability assessment for the energy retrofit of a historic building and concluded that, for this category of buildings, the rating systems should also take into account issues like preservation, historic value, or the valorization of elements (e.g., paintings) that represent a limit to refurbishment actions. In this direction, Roberti et al. introduced a methodology to find optimal retrofit solutions for historic buildings under a multi-perspective approach, wherein a score is attributed to conservation compatibility based on the opinions of 10 experts in the field [22]. Other interesting case studies of retrofitting measures in historic buildings can be found in [23].

1.2. Cost-Optimal Methodology for the Energy Renovation

When designers approach the energy retrofit of historic buildings, they must not just aim to comply with a prescriptive limit value concerning energy performance indicators. Indeed, the additional value of improved thermal comfort and reduced operational costs should be taken into account in a perspective involving the entire lifetime of the building [24].
A starting point for comparing the cost efficiency of different combinations of Energy Efficiency Retrofit Measures (EERM) for the energy retrofit of historic buildings is the cost optimal approach. In particular, the recast of the Energy Performance of Building Directive (EPBD) [3] has introduced the global cost method, which is described in the European Standard EN 15459 [25], to assess the cost efficiency of net Zero Energy Buildings. The global cost of a building is evaluated through the net present value (NPV), which is an indicator used for evaluating the financial feasibility of medium and long-term projects.
The EN 15459 distinguishes between financial calculation and macro-economic analysis. The financial calculation includes charges, grants, taxes, and VAT, and it is based on the private investor perspective. On the other hand, the macro-economic calculation follows the member state perspective since it comprises the costs for greenhouse gases (GHG) emissions, which represent the monetization of the environmental injury caused by CO2 emissions associated with the building energy consumptions.
In the context of building energy renovation, the cost-optimal approach compares the global cost of alternative EERMs, taking into account the initial investment costs, the operational, maintenance, disposal and energy costs, and the replacement cost referred to in the calculation period, as well as the residual value of the EERM [26]. A calculation period of 30 years can be used for residential and public buildings, whereas 20 years is more suitable for non-residential commercial buildings [27]. It is not necessary to include the costs that do not change for the investigated EERM configurations as well as the costs of building elements that do not affect the energy performance of the building.
Baglivo et al. [28] applied the cost-optimal analysis to new residential buildings located in a warm climate. Globally, 168 different configurations were analyzed; the optimal configuration required an annual primary energy demand of 8.99 kWh·m−2 and had a global cost of 342.79 €·m−2. The macro-economic analysis, which includes the cost of CO2 emissions, indicated a different optimal configuration, with an annual primary energy demand of 3.28 kWh·m−2 and a global cost of 309.47 €·m−2. Moreover, Bonakdar et al. [29] applied the cost-optimal methodology to assess the cost-effectiveness of several retrofit measures on a reference building ideally located in four different climate zones in Sweden and concluded that the discount rate plays a major role on the identification of the optimal solution, especially in the coldest regions.
Presently, the literature shows a lack of studies concerning the application of the cost-optimal methodology for the design of the energy retrofit of historical buildings. For a building built in Coimbra at the beginning of the Twentieth Century, Tadeus et al. developed a cost optimal analysis focused on how the insulation cost variability influenced the cost-optimal retrofit packages [30]. This study highlighted that the application of thermal insulation thicker than 80 mm does not allow global cost reduction. Di Giuseppe et al., with reference to a typical Italian single-family house that dates from 1976–1990, have tested several EERMs, considering data uncertainty related to inflation rates, interest rates, and energy prices evolution [31].
Finally, De Angelis et al. have investigated the economic sustainability of different strategies of energy retrofit applied to an Italian social housing district by means of the Cost of Conserved Energy (CCE) method and the payback of the investments (Return on Investment) [32].

1.3. Outline of the Paper
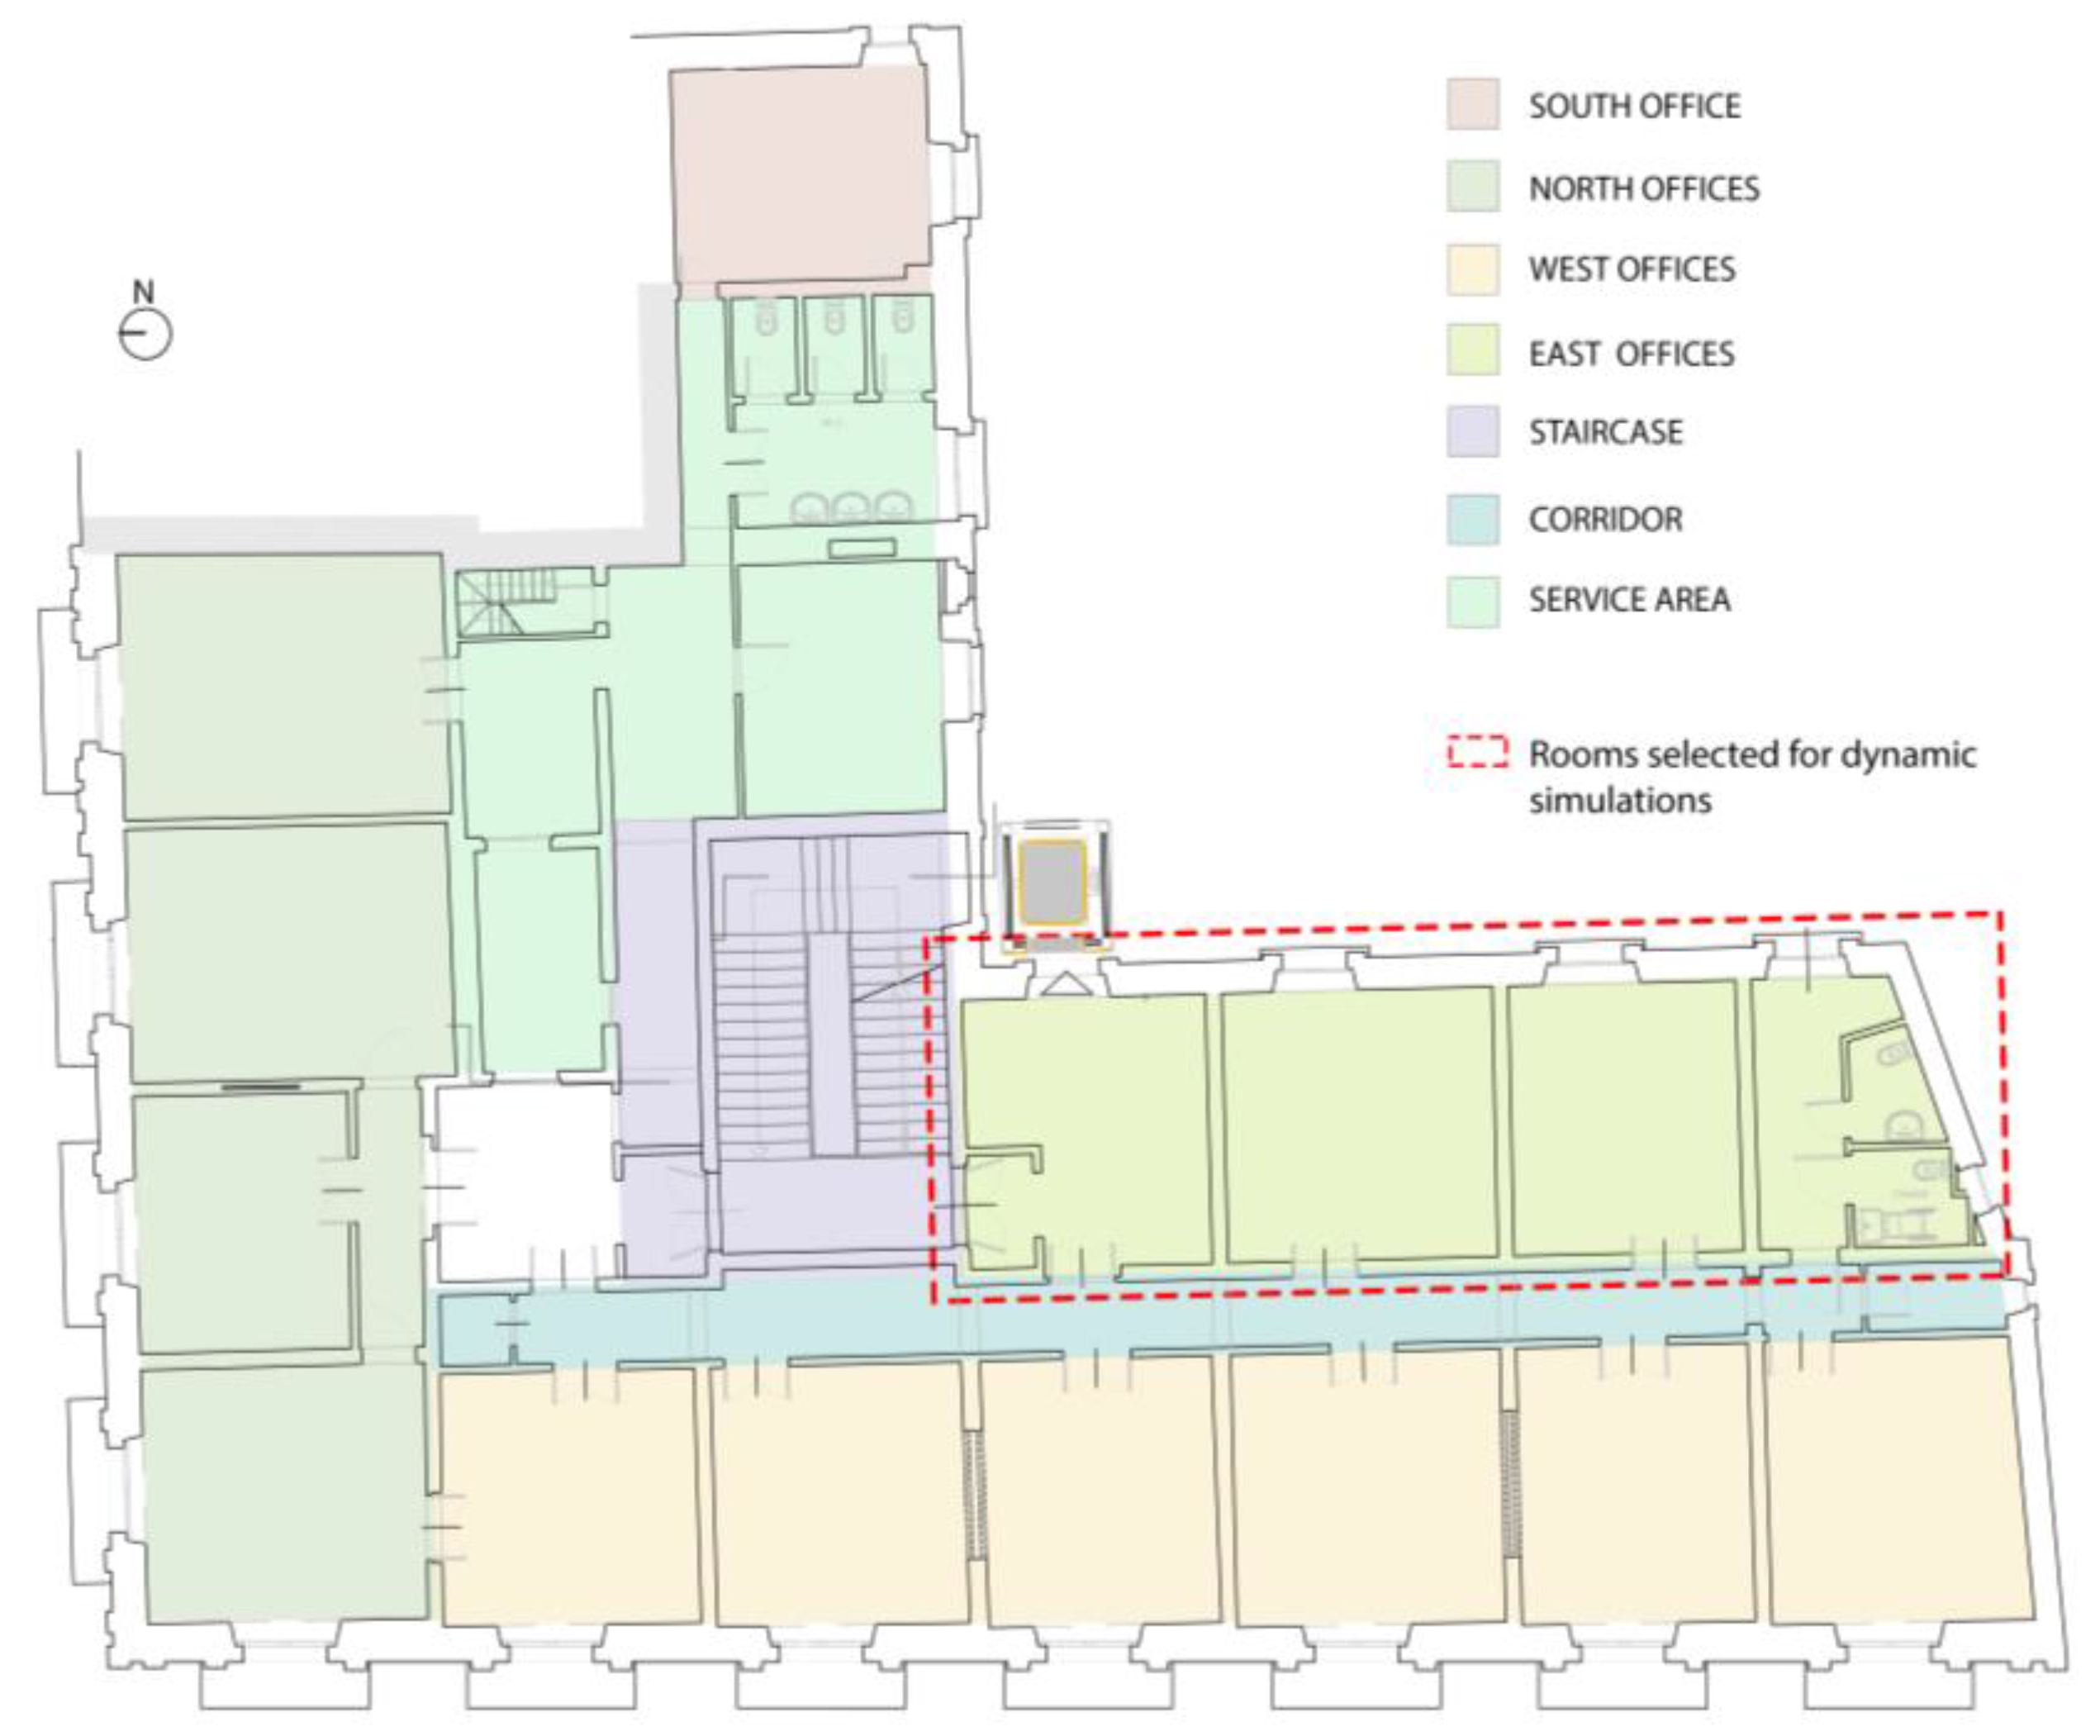
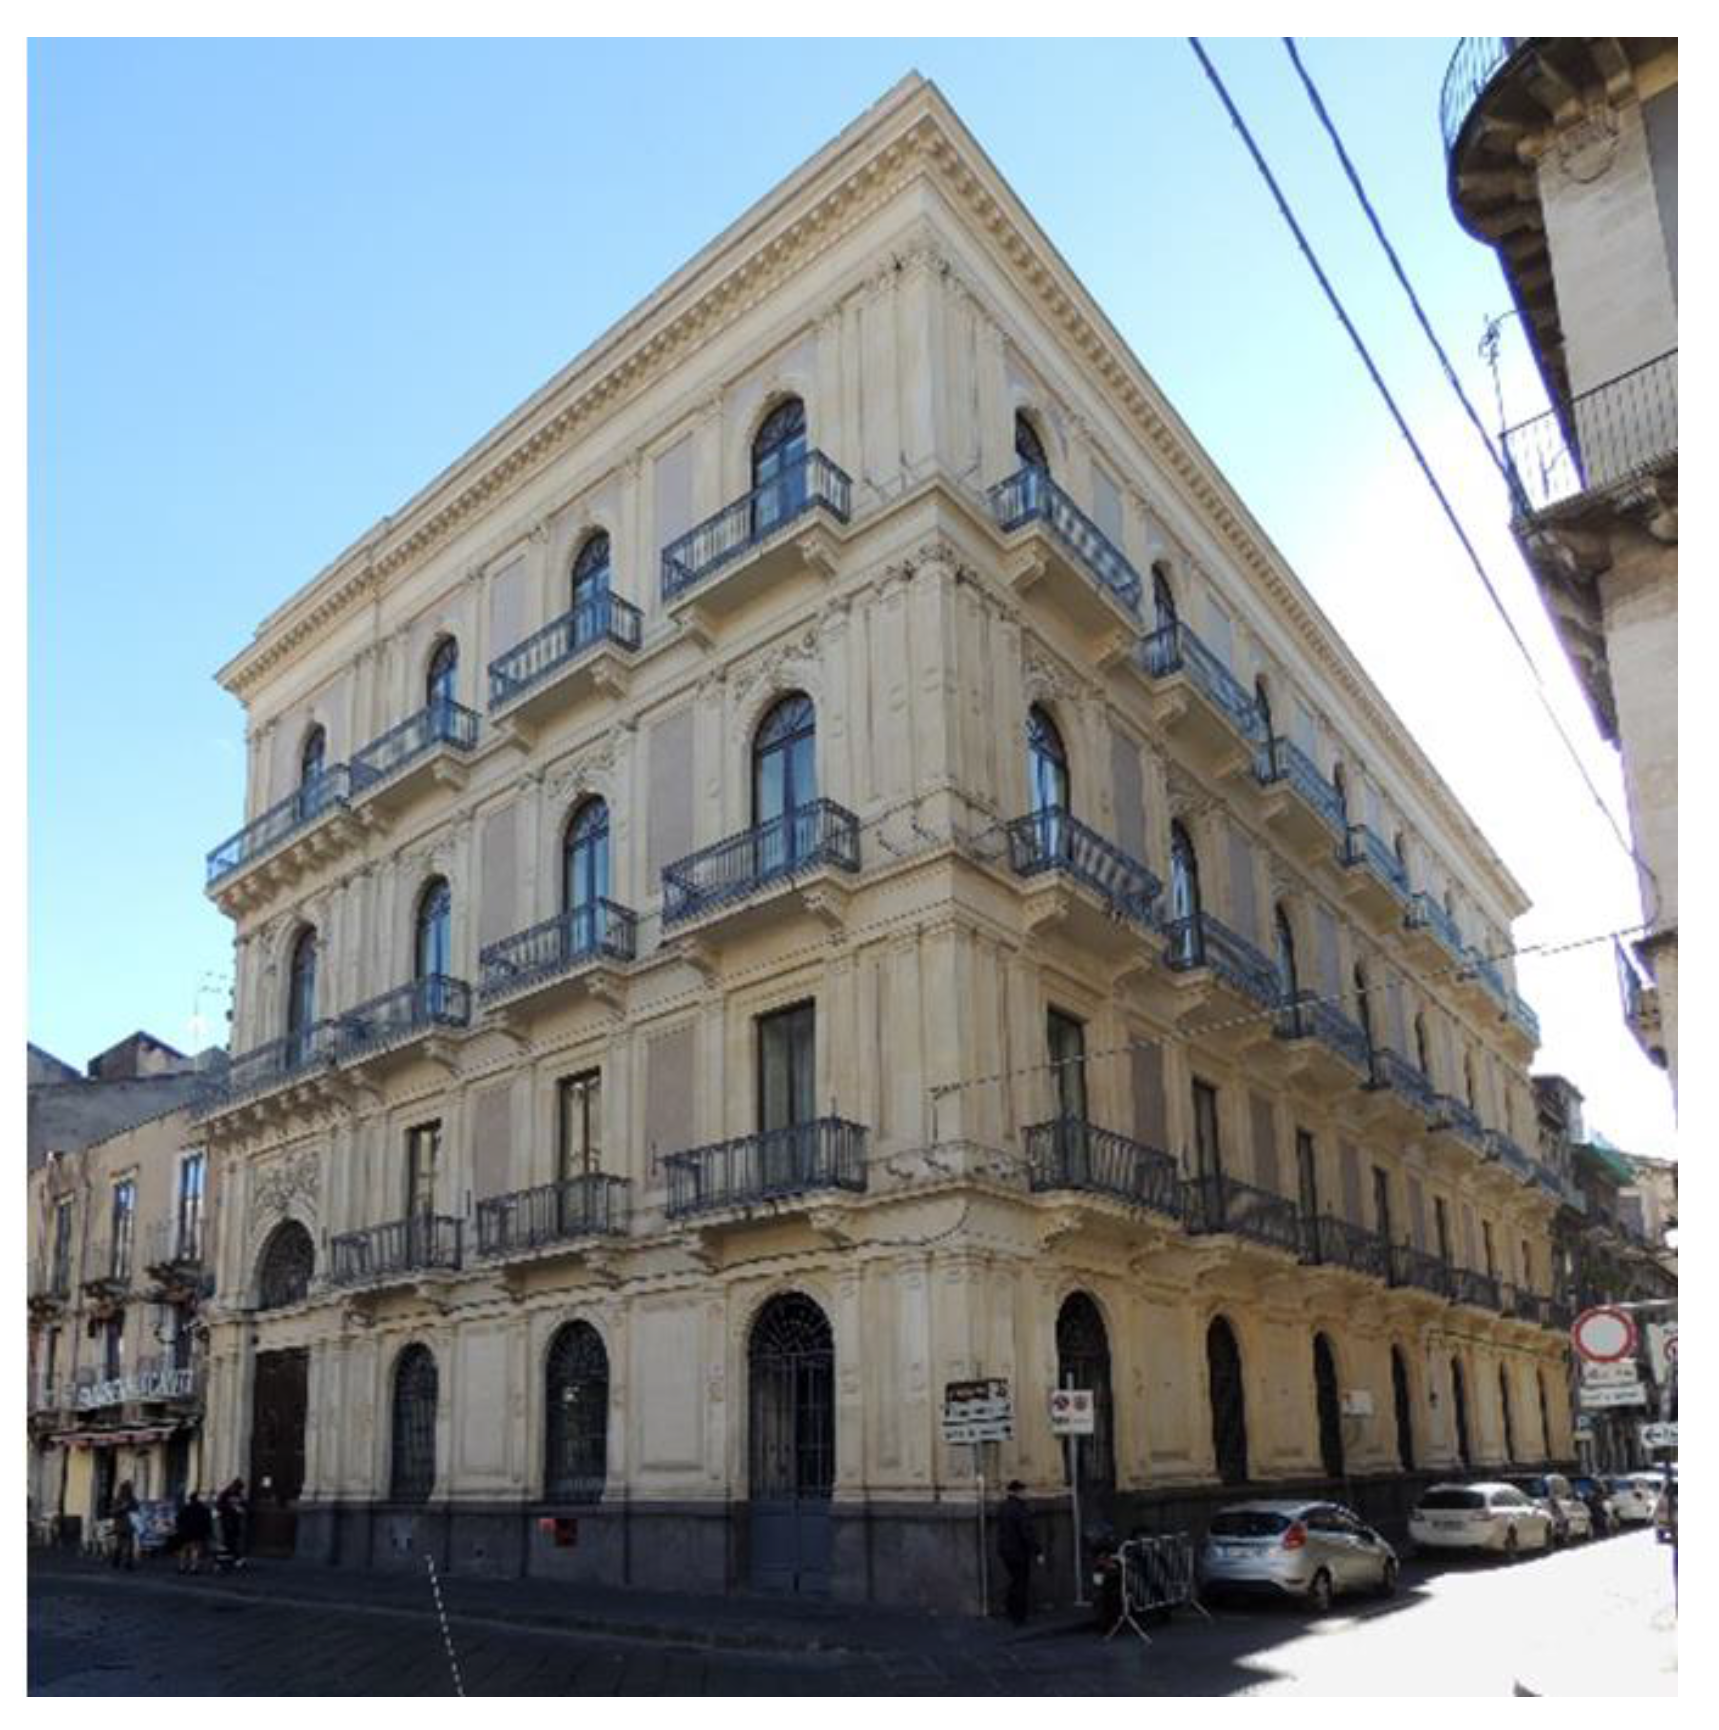
This paper aims to make a contribution in the previously discussed framework by studying the energy and economic effectiveness of a series of potential renovation strategies for a historic building located in southern Italy. The case study is described in Section 2, and its main feature consists in having very thick and heavy walls made of basalt stones; the main façades are highly valuable, and they cannot be modified by retrofit actions.
To this aim, two different sorts of energy simulations are performed. First of all, in order to quantify the annual energy needs for space heating and cooling, the methodology outlined in Section 3.1 is adopted. This methodology applies a quasi-stationary calculation method on a monthly basis and includes a sufficiently detailed performance analysis of the energy systems. It is the official methodology to be used in Italy to assess the energy consumption of buildings under standard use as well as to perform their energy certification.
On the other hand, we also investigated the thermal performance of the selected building in free-running conditions, i.e., without any energy systems for indoor air-conditioning. In hot climates like in southern Italy, this kind of analysis is especially interesting in Summer, when indoor temperatures may reach very uncomfortable values if not controlled by a space cooling system. In this case, detailed dynamic thermal simulations are needed in order to correctly account for the thermal inertia of the building envelope. Hence, the software tool Design Builder was used, which is based on the calculation engine of Energy Plus. Starting from the results of the dynamic simulations, it was also possible to assess the degree of thermal discomfort perceived in Summer by the occupants, as outlined in Section 3.2. It is important to underline that in Winter, when the solar irradiance is lower and the outdoor temperature is steadier than in Summer, the role of thermal inertia played by the massive walls is far less important. Hence, dynamic thermal simulations were not performed for this season.
Finally, by knowing the annual energy needs and hence the operating costs, the cost-optimal analysis described in Section 3.3 can be applied to all the proposed retrofit solutions detailed in Section 4. These solutions improve the insulating performance of the building envelope and differ mainly in the insulating material to be used, according to its type, thickness, and position on the existing wall. This latter issue is particularly relevant since the internal insulation of historic massive walls, even if useful to reduce energy needs in Winter, may severely spoil thermal inertia and impact on thermal comfort in Summer, which can be emphasized by dynamic simulations.
Finally, Section 5 is devoted to the discussion of the results, in terms of the energy needs for space heating and cooling (Section 5.1), summer thermal comfort in dynamic conditions (Section 5.2), and the cost-effectiveness of the proposed retrofit solutions (Section 5.3).

2. Case Study

The case study is a building located in the historic center of Catania (Sicily), built during the Eighteenth Century as the headquarters of the ‘Academy of fine Arts’. The edifice has four floors, which currently host offices of the University of Catania, with an overall net floor surface as high as 1805 m2. This building is undoubtedly representative of the Italian historic building stock; moreover, the energy bill data are available, which provide the actual energy consumption.
The main material used for the opaque envelope consists of basalt stones originating from remote eruptions of the volcano Etna, arranged with a burnt lime mortar. This construction technique was very widespread in Catania up to the end of the 1950s, and it is still quite common due to the great availability of volcanic rock. Basalt stones provide high thermal inertia, which is particularly suitable for the climate in this area; indeed, the summer season is quite long and hot, with peak daily outdoor temperatures that may easily exceed 35 °C. The thickness of the walls ranges from 60 to 110 cm; they are mainly cladded with limestone in the northern and western façades, and with volcanic ash plaster in the eastern and southern fronts, which face an internal courtyard. Figure 1 shows the main façade of the building and its surroundings.
Table 1 reports the thermophysical properties of the external walls and attic floors for the building in its current configuration. It is interesting to remark that the value retained for the thermal conductivity of the basalt stones is lower than what suggested in the literature (λ = 2.9 W·m−1·K−1) to take into account the presence of a non-negligible quantity of mortar. The building is also characterized by a traditional wooden roof (wood boards, 30 mm) with local terracotta tiles. The roof is not insulated and shows a very high U-value (around 4 W·m−1·K−2). The intermediate floors consist of pumice stones bound with abundant gypsum mortar. The windows are single-glazed and with wooden frames (U = 4.8 W·m−1·K−2).

3. Methodology

3.1. Calculation of the Energy Needs for Space Heating and Cooling

The energy needs of the selected building can be attributed to several energy-consuming systems, namely those dedicated to space heating, space cooling, sanitary hot water production, and mechanical ventilation. However, since this study investigates retrofit solutions for the building envelope in historic edifices, sanitary hot water production and mechanical ventilation are not taken into account as they are not affected by modifications to the building envelope. Hence, only the energy needs for space heating and space cooling are calculated.
The methodology adopted to this aim is outlined in the Italian standard UNI TS 11300 [33]. In particular, this standard contemplates a simplified procedure (asset rating), applicable to existing buildings under standard use, with the being purpose to evaluate a conventional performance level, eventually leading to Energy Certification.
According to this simplified procedure, the thermal energy needs for space heating and space cooling can be calculated on a monthly basis through a quasi-stationary approach, leading to Equations (1) and (2):
Q H , n d = ( Q H , t r + Q H , v e ) H e a t l o s s e s η H , g n ( Q s o l , w + Q int ) G a i n s
Q C , n d = ( Q s o l , w + Q int ) G a i n s η C , l s ( Q C , t r + Q C , v e ) H e a t l o s s e s
Here, Qtr and Qve are respectively the monthly heat losses due to transmission and ventilation. On the other hand, Qsol,w quantifies the beneficial contribution of the solar gains penetrating the glazed envelope. Finally, Qint refers to the internal gains due to people, artificial lighting, and electrical appliances.
In order to make clear the role of the building envelope in Equations (1) and (2), it may be useful to report the relation used for the assessment of the transmission heat losses in Winter:
Q H , t r = [ j ( U j S j b u , j ) + k ( ψ k L k b u , k ) ] ( T i T e ) j ( Q s o l , o p ) j
In Equation (3), U is the thermal transmittance of all envelope components and S is their surface area. The coefficient bu allows those envelope components separating the conditioned spaces from non-conditioned spaces, the temperature of which is different from the outdoors, to be accounted for; in this case, bu < 1. As concerns the indoor air temperature, Ti = 20 °C in Winter and Ti = 26 °C in Summer. The outdoor temperature adopted in the calculation is an average monthly value.
On the other hand, Qsol,op is a term that takes into account the solar gains through the opaque envelope that are proportional to the solar absorptance of the outside surface of the walls.
The calculation is repeated for all months included in the winter season (from December to March) and in the summer season (from June to September).
Still looking to Equation (1), this implies that solar and internal gains cannot be entirely exploited to compensate for the heat losses. Indeed, the walls and floors will first absorb the radiant energy; then, they will partially re-emit heat by convection to the indoor air. The effective exploitation of the heat gains is assessed through the utilization factor ηH,gn; as a rule, the higher the thermal capacity of the envelope components is, the higher the utilization factor. In the case of the application of an insulating material on the inner side of the outside walls, as in most of the proposed retrofit packages, the thermal capacity decreases, thus penalizing the exploitation of heat gains.
Moreover, it must be underlined that a retrofit action on the glazed envelope also has an impact on Equations (1) and (2) since the solar gains through the windows are proportional to the g-value of the glazed component.
Finally, since the space heating and cooling system uses a reversible air-to-water electric heat pump, the calculation of the electricity consumption can be performed according to Equation (4):
E e l = Q H , t r S C O P + Q C S E E R
Here, SCOP and SEER are respectively the mean monthly values of the Coefficient of Performance (COP in heating mode) and the Energy Efficiency Ratio (EER in cooling mode), for the whole system, including heat distribution.
All the calculations are performed through MasterClima (Version 3.00, Aermec S.p.A., Bevilacqua, Milan, Italy), a software tool commonly used in Italy for Energy Certification, based on the procedure outlined in UNI TS 11300.

3.2. Dynamic Simulations for the Assessment of Summer Thermal Comfort

The proposed energy retrofit packages are also investigated in terms of thermal comfort. In particular, special attention is paid to the hot season, when pronounced overheating may occur if no air-conditioning system is adopted (free-running conditions). This kind of analysis is particularly relevant in the Mediterranean climate and provides useful information about the ability of the building envelope to avoid excessive temperature fluctuations in Summer.
In order to investigate in this direction, a suitable methodology has to be defined so as to allow easy and unambiguous comparisons amongst the proposed solutions. In this sense, it is useful to remember that thermal comfort is strongly correlated with indoor operative temperature. Based on these assumptions, the indoor operative temperature can be used to define an indicator called the Intensity of Thermal Discomfort (ITD). This indicator is defined as the time integral over the entire occupancy period P of the positive difference between the running operative temperature and the upper threshold for comfort (see Equation (5)) [34]:
I T D = P ( T o p ( τ ) T l i m ) + d τ
According to its definition, the ITD can be regarded as an effective way to quantify the uncomfortable thermal sensation due to overheating. Indeed, with a single number, it measures at the same time the intensity and the duration of the thermal discomfort perceived by the occupants [35].
In Equation (5), the value of the threshold temperature depends on the choice of a specific thermal comfort theory. In free-running buildings, the adaptive approach is particularly suitable [36]; in this case, the threshold value is not constant in time, but it is determined daily as a function of the running mean outdoor air temperature (Trm), the latter referring to the previous seven days, described in the Standard EN 15251 [37]:
T l i m = 20.8 + 0.33 T r m
Equation (6) refers to the upper limit of Category I, i.e., the highest comfort category introduced by EN 15251. It is useful to remember that the threshold values defined in Equation (6) can be used only if the occupants can freely adapt their clothing to the thermal conditions and easily access operable windows.
Now, in moderate thermal environments, the indoor operative temperature can be calculated as the average of the indoor air temperature and the mean radiant temperature. Hence, the calculation of the ITD is subject to the possibility of calculating both parameters as a function of time over the summer season.
To this aim, detailed dynamic energy simulations are performed by using Design Builder (Version 4.6, DesignBuilder Software Ltd., Stroud, UK), a well-known tool based on the calculation engine of Energy Plus. The simulations are run with reference only to the rooms indicated in Figure 2, located on the third floor and facing East; these offices can be considered representative of the current building usage and are subject to more severe conditions than those located in the intermediate floors. All other adjacent rooms, as well as the second floor, are described in the simulations as adiabatic zones. No outside obstructions are introduced since a preliminary study showed that the other buildings nearby do not cast shadows on the façade of the selected rooms. As the outer envelope shows a light color (see Figure 1), the solar absorptance is set to 0.3. A constant rate of infiltration as high as 0.5 air changes per hour (ACH) is also considered.
As concerns the weather data used for the simulations, the weather file available for Catania Fontanarossa is used. No air-conditioning systems are considered (free-running conditions) to evaluate how the planned retrofit actions affect the indoor temperature fluctuations in Summer.

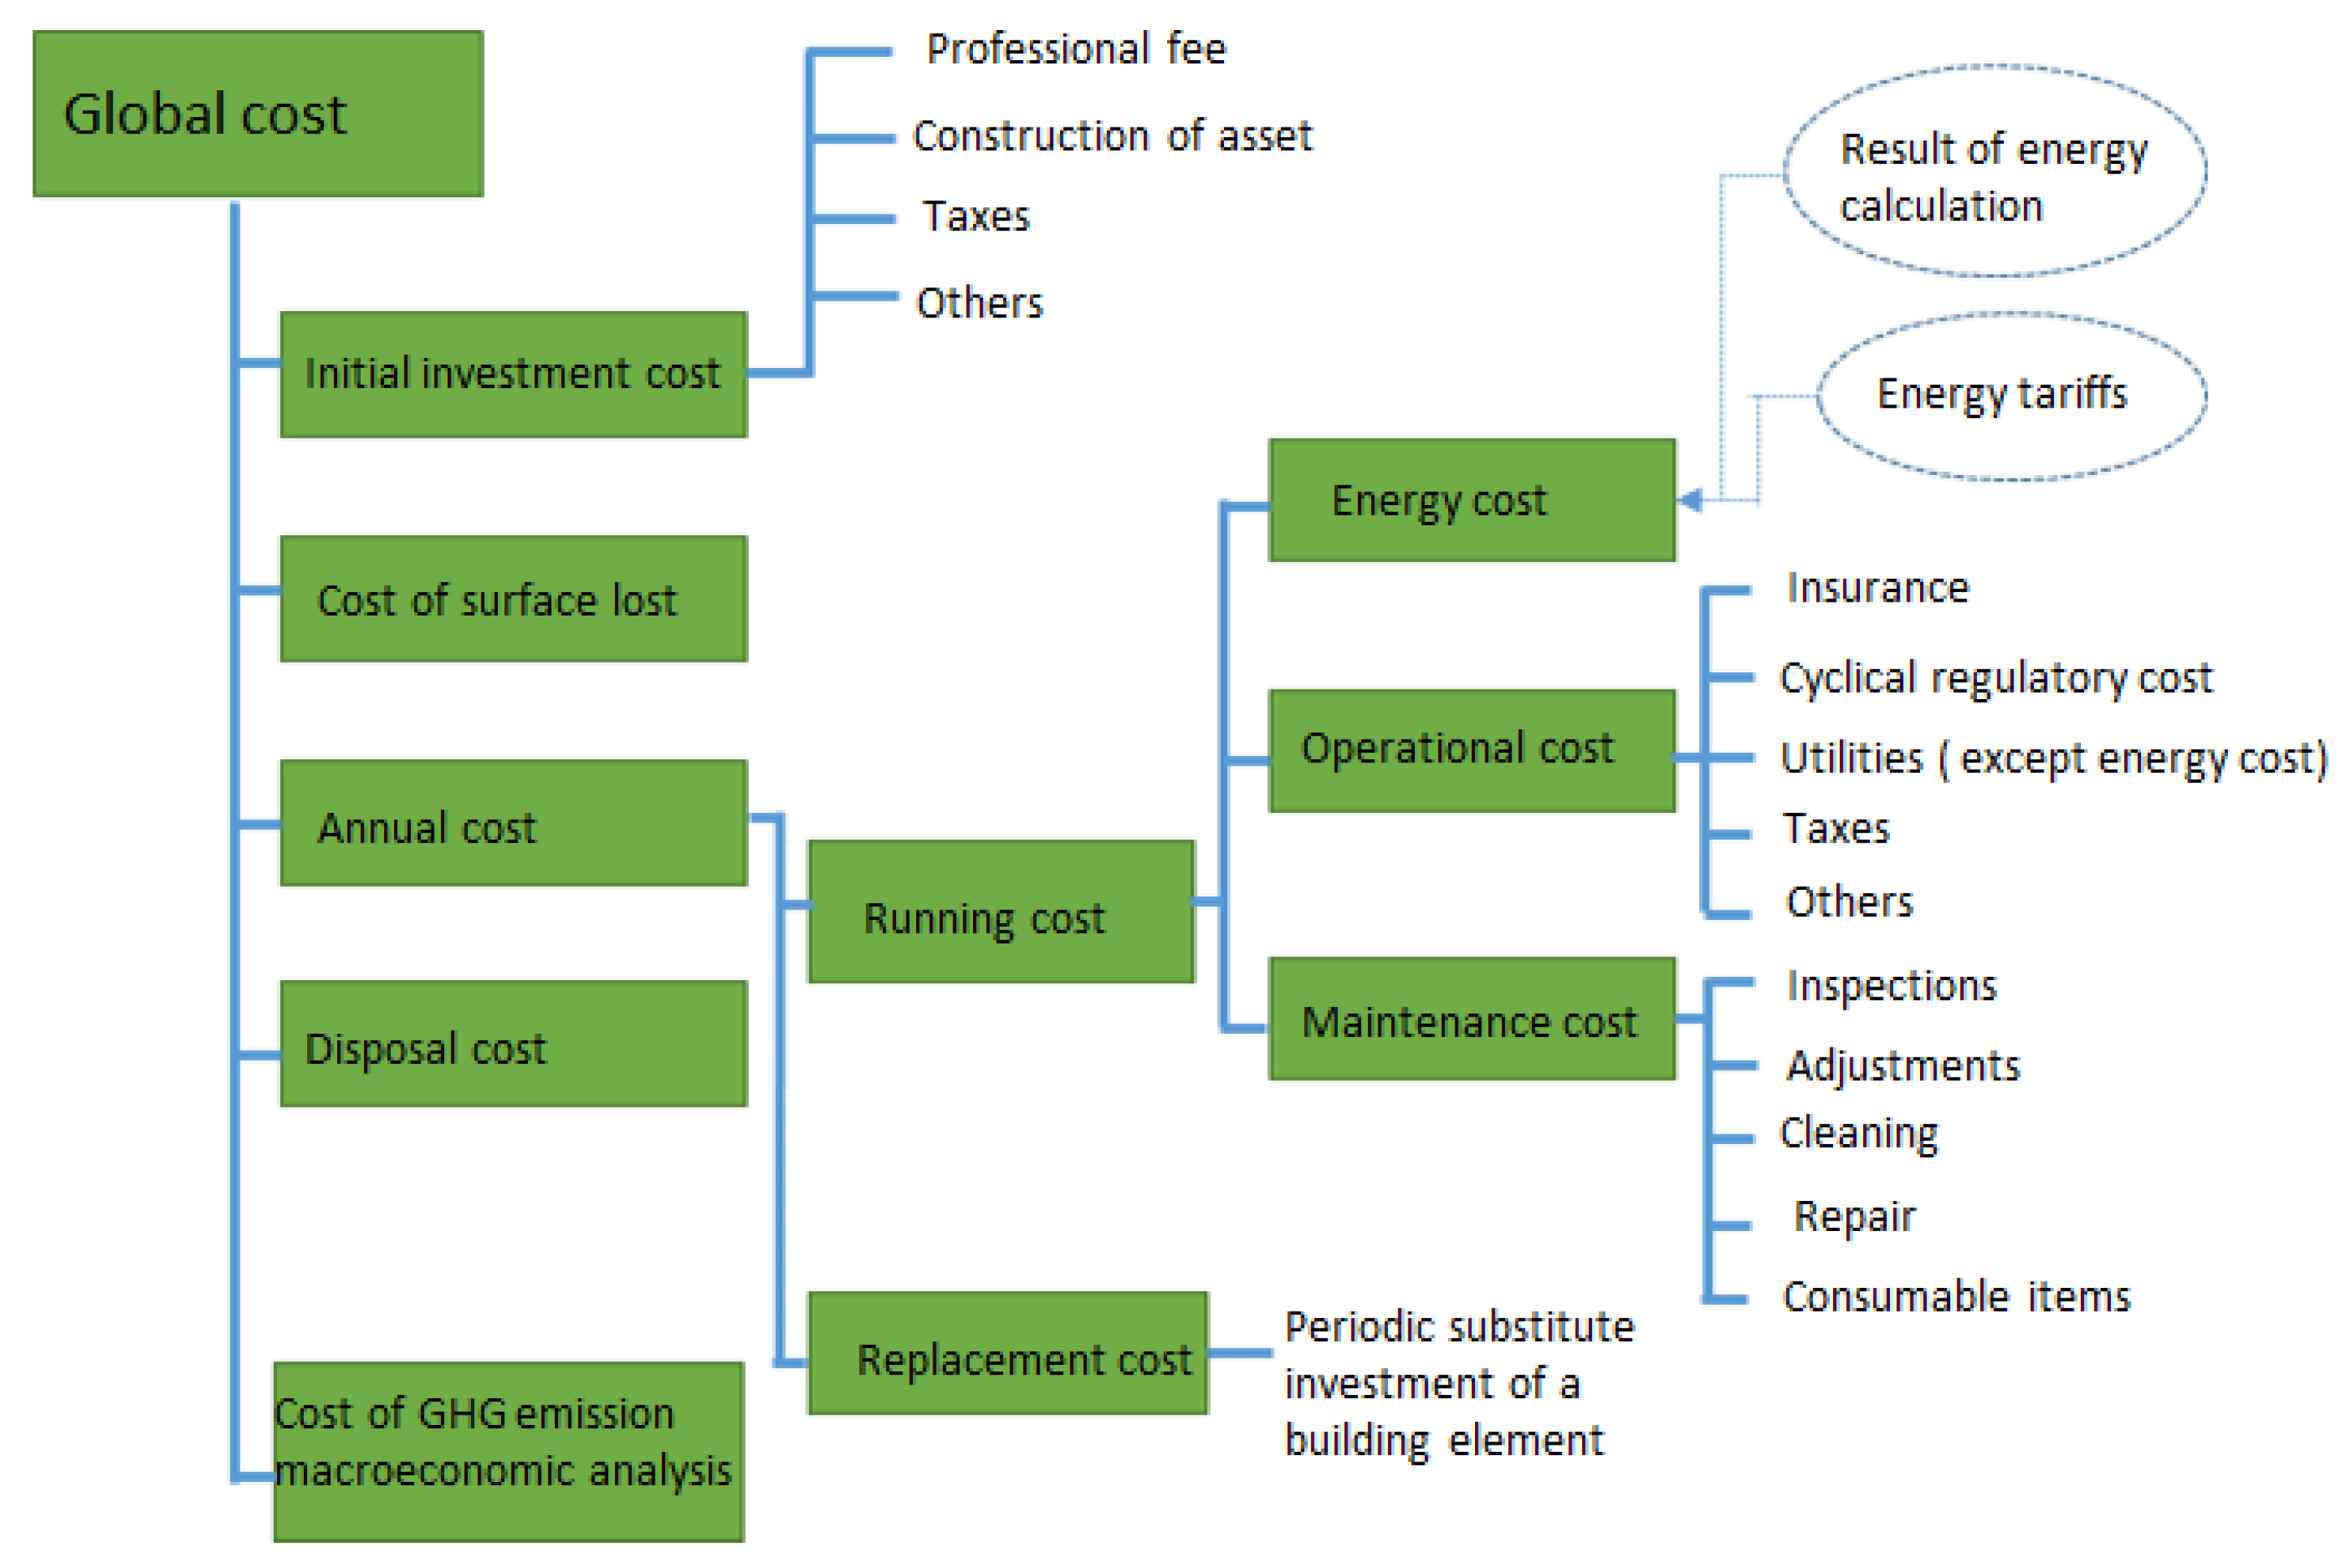
3.3. Economic Analysis

3.3.1. Cost Optimal Analysis

In this paper, several possible EERMs are compared in order to identify the solution implying the lowest global cost, according to the methodology indicated by the standard EN 15459 [25].
We have determined the global cost Cg by summing up the initial investment cost CI, as well as the periodic replacement cost and the annual operational and energy cost Ca,n(j), for every year n and for each building component or system j embodied in the EERM, discounted by the rate Rdis,n.
In particular, the following equation has been used to calculate Cg referring to a calculation period τ:
C g = C I + C s l + j [ n = 1 τ C a , n ( j ) R d i s , n V F , τ ( j ) ]
Here VF,τ(j) represents, for each component j, the residual value at the end of the calculation period τ, discounted at the starting year.
In addition to the formulation proposed by the European standard, in Equation (7) we have also considered a supplementary cost Csl that takes into account the loss of useful floor surface when the thermal insulation is applied on the internal side of the outer walls.
The periodic replacement costs of building components were evaluated with a frequency depending on the lifespan of each component j. It is not necessary to include costs that do not change in all the considered EERMs as well as the costs of components that do not affect the energy performance of the considered edifice. We have adopted a calculation period of 20 years since our study refers to the retrofit scenarios of an office building [25].
According to the considered methodology framework, the cost categorization is illustrated in Figure 3.

Initial Investment Cost

The initial cost embodies the market and the installation costs of the materials and components comprised in each EERM.
The assumed prices include also general costs, design and work supervision, business profits, and VAT. These costs have been determined using as a reference the regional pricing lists in combination with market surveys.

Annual and Periodic Cost

In this category, only maintenance and billing costs due to the energy consumption were taken into account. More specifically, for the internal insulation measures, only the maintenance of the internal finishing (painting) was evaluated, considering an average price of 0.9 €/m2 per year. As regards the energy costs, it was necessary to calculate preliminarily the energy consumption in kWh/m2 per year; then, the operational cost was evaluated, assuming a price of electricity as high as 0.24 €/kWh. Moreover, since the price of electricity has constantly risen in the last years, we have applied an average annual increase of 2%.
Moreover, EERMs may benefit from incentives governed by the Ministerial Decree of 16 February 2016 (also known as ‘Conto Termico 2.0’) [38], which provides financial support to the production of thermal energy from renewable sources and the increase in energy efficiency. These incentives cover 40% of the eligible expenditure, with specific limits for the unit and total costs of each type of EERM. They will be refunded either in five annual rates or in a single solution in the case of public administrations or Energy Service Companies (ESCOs).

Cost for Loss of Useful Floor Surface
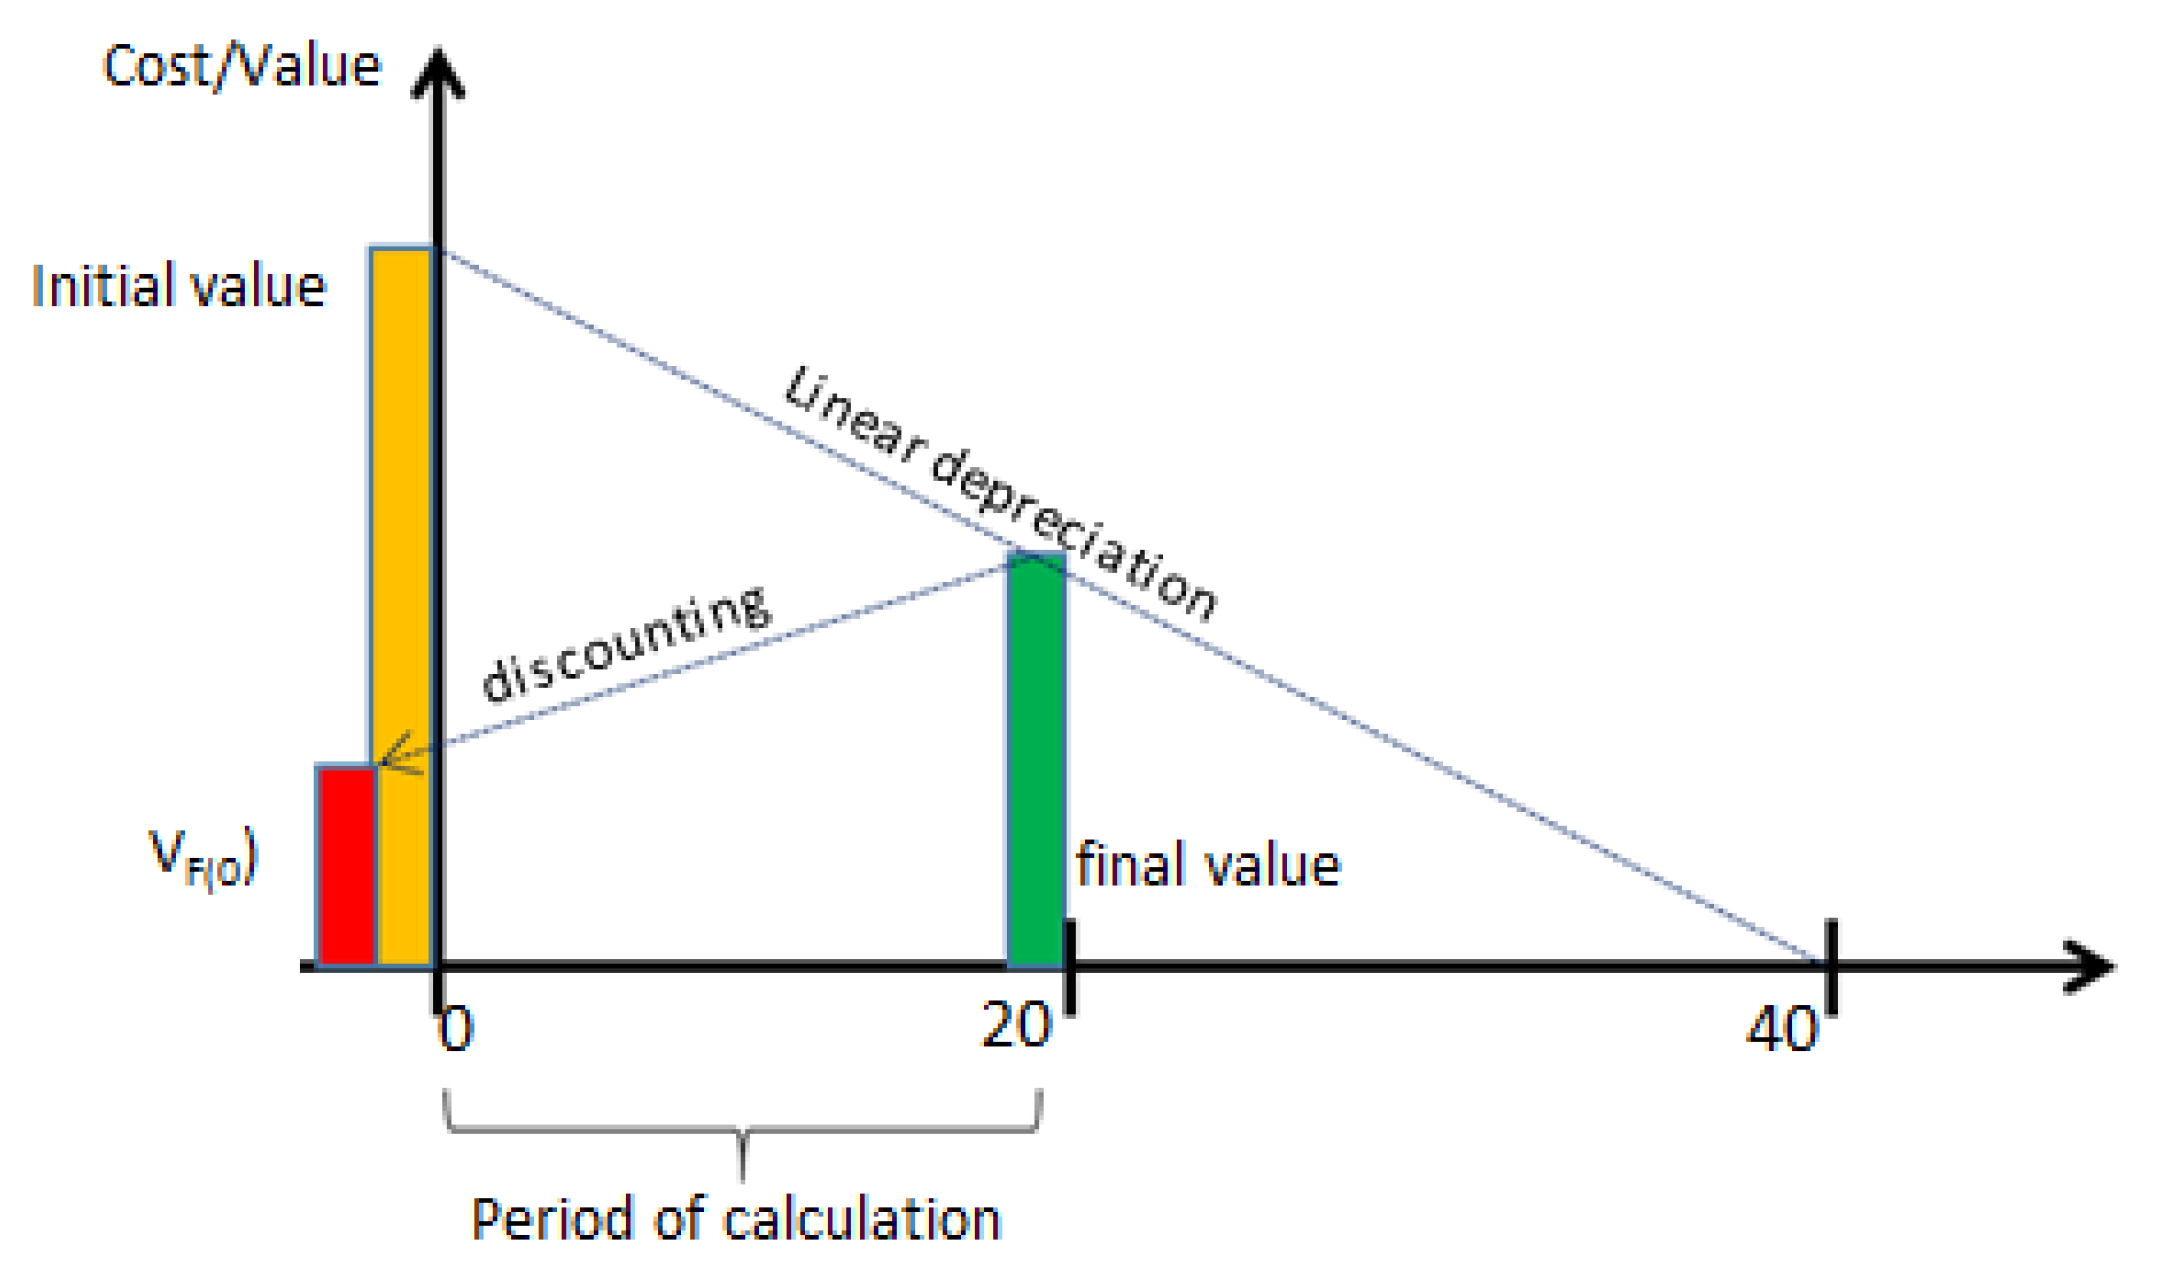
The unitary cost of useful floor surface has been determined through a market survey on the real estate prices in the historic center of Catania, where the building is located. According to this survey, we have determined an average cost as high as 1700 €/m2.
Thereby, for the scenarios that include internal insulation, we have calculated the floor surface occupied as a function of the insulation thickness, and, subsequently, we have translated the reduction of the building value into an additional indirect cost (Csl).

Residual Value

The residual value has been determined considering a linear devaluation of the initial investment cost of the component at the end of the period of calculation, discounted at the starting year [31]. Figure 4 explains the above-mentioned methodology.

Discount Rate

The discount rate Rdis is necessary for referring the recurrent costs (revenue) and the final value to the starting year. It is expressed as:
R d i s = 1 ( 1 + r e f f ) n
where reff is the effective interest rate and n is the year of calculation. reff was calculated according to Equation (9), considering the nominal rate of interest i and the rate of inflation p:
r e f f = 1 + i 1 + p 1
In this study, in accordance with the trends of the nominal rate of interest i and the rate of inflation p, the following data has been assumed: i = 4.5% and p = 1.8%. Therefore, the real rate of interest retained is reff = 2.7%.

3.3.2. Discounted Payback Time

The Discounted Payback Time (DPT) is the duration that an investment requires to recover its initial cost by taking into consideration the time value of money.
In practice, the DPT can be calculated as the time required to have an overall discounted cash flow equal to the cost of investment; that is to say, the smallest value of T (years) in which the Net Present Value (NPV) becomes non-negative.
The Net Present Value (NPV) is defined as:
N P V ( T ) = C I + i = 1 T F i ( 1 + r e f f ) i
where CI represents the initial investment cost, Fi the annual cash flow (incomes minus annual costs), reff the effective interest rate, and T the time. The cash flow is determined by the decrease of the energy cost originating with the specific EEEM. The DPT has been here evaluated considering reff = 2.7%.

4. Proposed Retrofit Solutions and Corresponding Costs

As highlighted in Section 2, the historic building selected in this study shows poor thermal performance since the opaque envelope components are not insulated and the thermal transmittance of the transparent and the opaque surfaces is very high.
In the case of retrofit, wall insulation is of course the first intervention to be envisaged. However, post-insulation of the outer walls in historic buildings is a challenging task; actually, the façades have high cultural value and must be preserved. Hence, the only choice is to insulate walls from the inside, even if this solution shows several risks and disadvantages that must be attentively considered when designing the intervention [12]:
  • risk of mold formation as the outer walls become colder after the retrofit intervention;
  • risk of reducing the transpiration capacity of the outer walls, thus preventing moisture from being transferred outdoors;
  • loss of useful floor surface;
  • impossibility of seeing the original finishing from inside;
  • complexity of the installation;
  • difficulty in eliminating thermal bridges.
Table 2 shows the possible retrofit solutions proposed to improve the thermal performance of the building envelope. As concerns the wall insulation, three different materials are selected, namely aerogel boards, calcium silicate boards, and thermal plaster; the last solution is the only one that allows application also from the outside (see solution IE) but only for the façades in the internal courtyard (468 m2), which are mostly plastered, while the other fronts are mainly cladded with carved limestone (see Figure 2).
Aerogel is an interesting option since it shows very low thermal conductivity, which makes it promising for historic buildings, where it is important to minimize the impact in terms of lost useful floor surface. On the other hand, calcium silicate boards are quite popular for retrofitting historic buildings; indeed, their thermal conductivity is slightly higher than other insulating materials, but they also perform as a capillary active material that facilitates drying possible liquid water accumulated in the walls [15].
Finally, the selected thermal plaster is based on natural hydraulic lime and contains lightweight aggregates, hence its relatively low density (650 kg/m3). It also shows a high attitude of water vapor diffusion, with a water vapor resistance factor (μ value) of around five.
The energy retrofit of the roof implies the installation of Polyurethane (PUR) boards (80 mm) below the tiles. On the other hand, in the windows, it is preferable to keep wooden frames that show a sufficiently good performance and a certain aesthetic value; hence, only the glazed component will be replaced with double-glazing filled with air (4-8-6 mm).
For each possible retrofit solution, Table 2 also shows the U-value attained after renovation, and compares it with the maximum thermal transmittance allowed to access the financial incentives currently available in Italy for the energy retrofit of public buildings [38]. In the case of thermal insulation from the inner side, the maximum U-value allowed to get the incentives is increased by 15%. As outlined in Section 3.3.1, the incentives allow 40% of the initial costs to be cut but only within a maximum amount of 80 €/m2 in the case of the internal insulation of the walls (this value referring to a unit of useful floor surface). The data reported in Table 2 suggest that only two solutions for wall insulation can access the financial incentives, namely A3 (30-mm aerogel boards) and P3 (80-mm calcium silicate boards); however, the unit cost of aerogel is much higher than the maximum allowable cost, hence the incentives cannot be fully exploited. Moreover, even if the windows reach a sufficiently low thermal transmittance after retrofit, this intervention cannot access the incentives because these are not applicable in the considered case of the mere replacement of the glazed component.
Moreover, Table 3 shows the values of the most relevant dynamic thermal properties, namely time lag (TL), periodic thermal transmittance (YIE), and internal heat capacity (Cint), calculated according to EN ISO 13786 [39]. These results allow the main drawback of inner insulation to be pointed out, i.e., the severe reduction in the internal heat capacity. This parameter measures the amount of heat that can be stored by a unit of wall surface when subject to a unit of periodic temperature fluctuation on its inner side; in the case of inner insulation, the internal heat capacity reduces to one third if compared to the current massive walls and to outer insulation (IE), meaning that the wall will not effectively store internal gains, thus producing room overheating in summer.
Table 4 reports the initial costs for the proposed retrofit packages with and without incentives. All retrofit packages share the insulation of the roof (RT) and the replacement of the existing windows with double-glazing (RV). As a consequence, the main differences amongst the proposed packages consist in the retrofit interventions selected for the external walls.
Finally, Table 5 shows the indirect costs Csl related to the loss of useful floor surface, which vary as a function of the internal insulation thickness (see Section 3.3.1). Aerogel boards are much more expensive than calcium silicate ones, but their low thickness reduces by at least 50% the cost for the loss of useful floor surface.

5. Results and Discussion
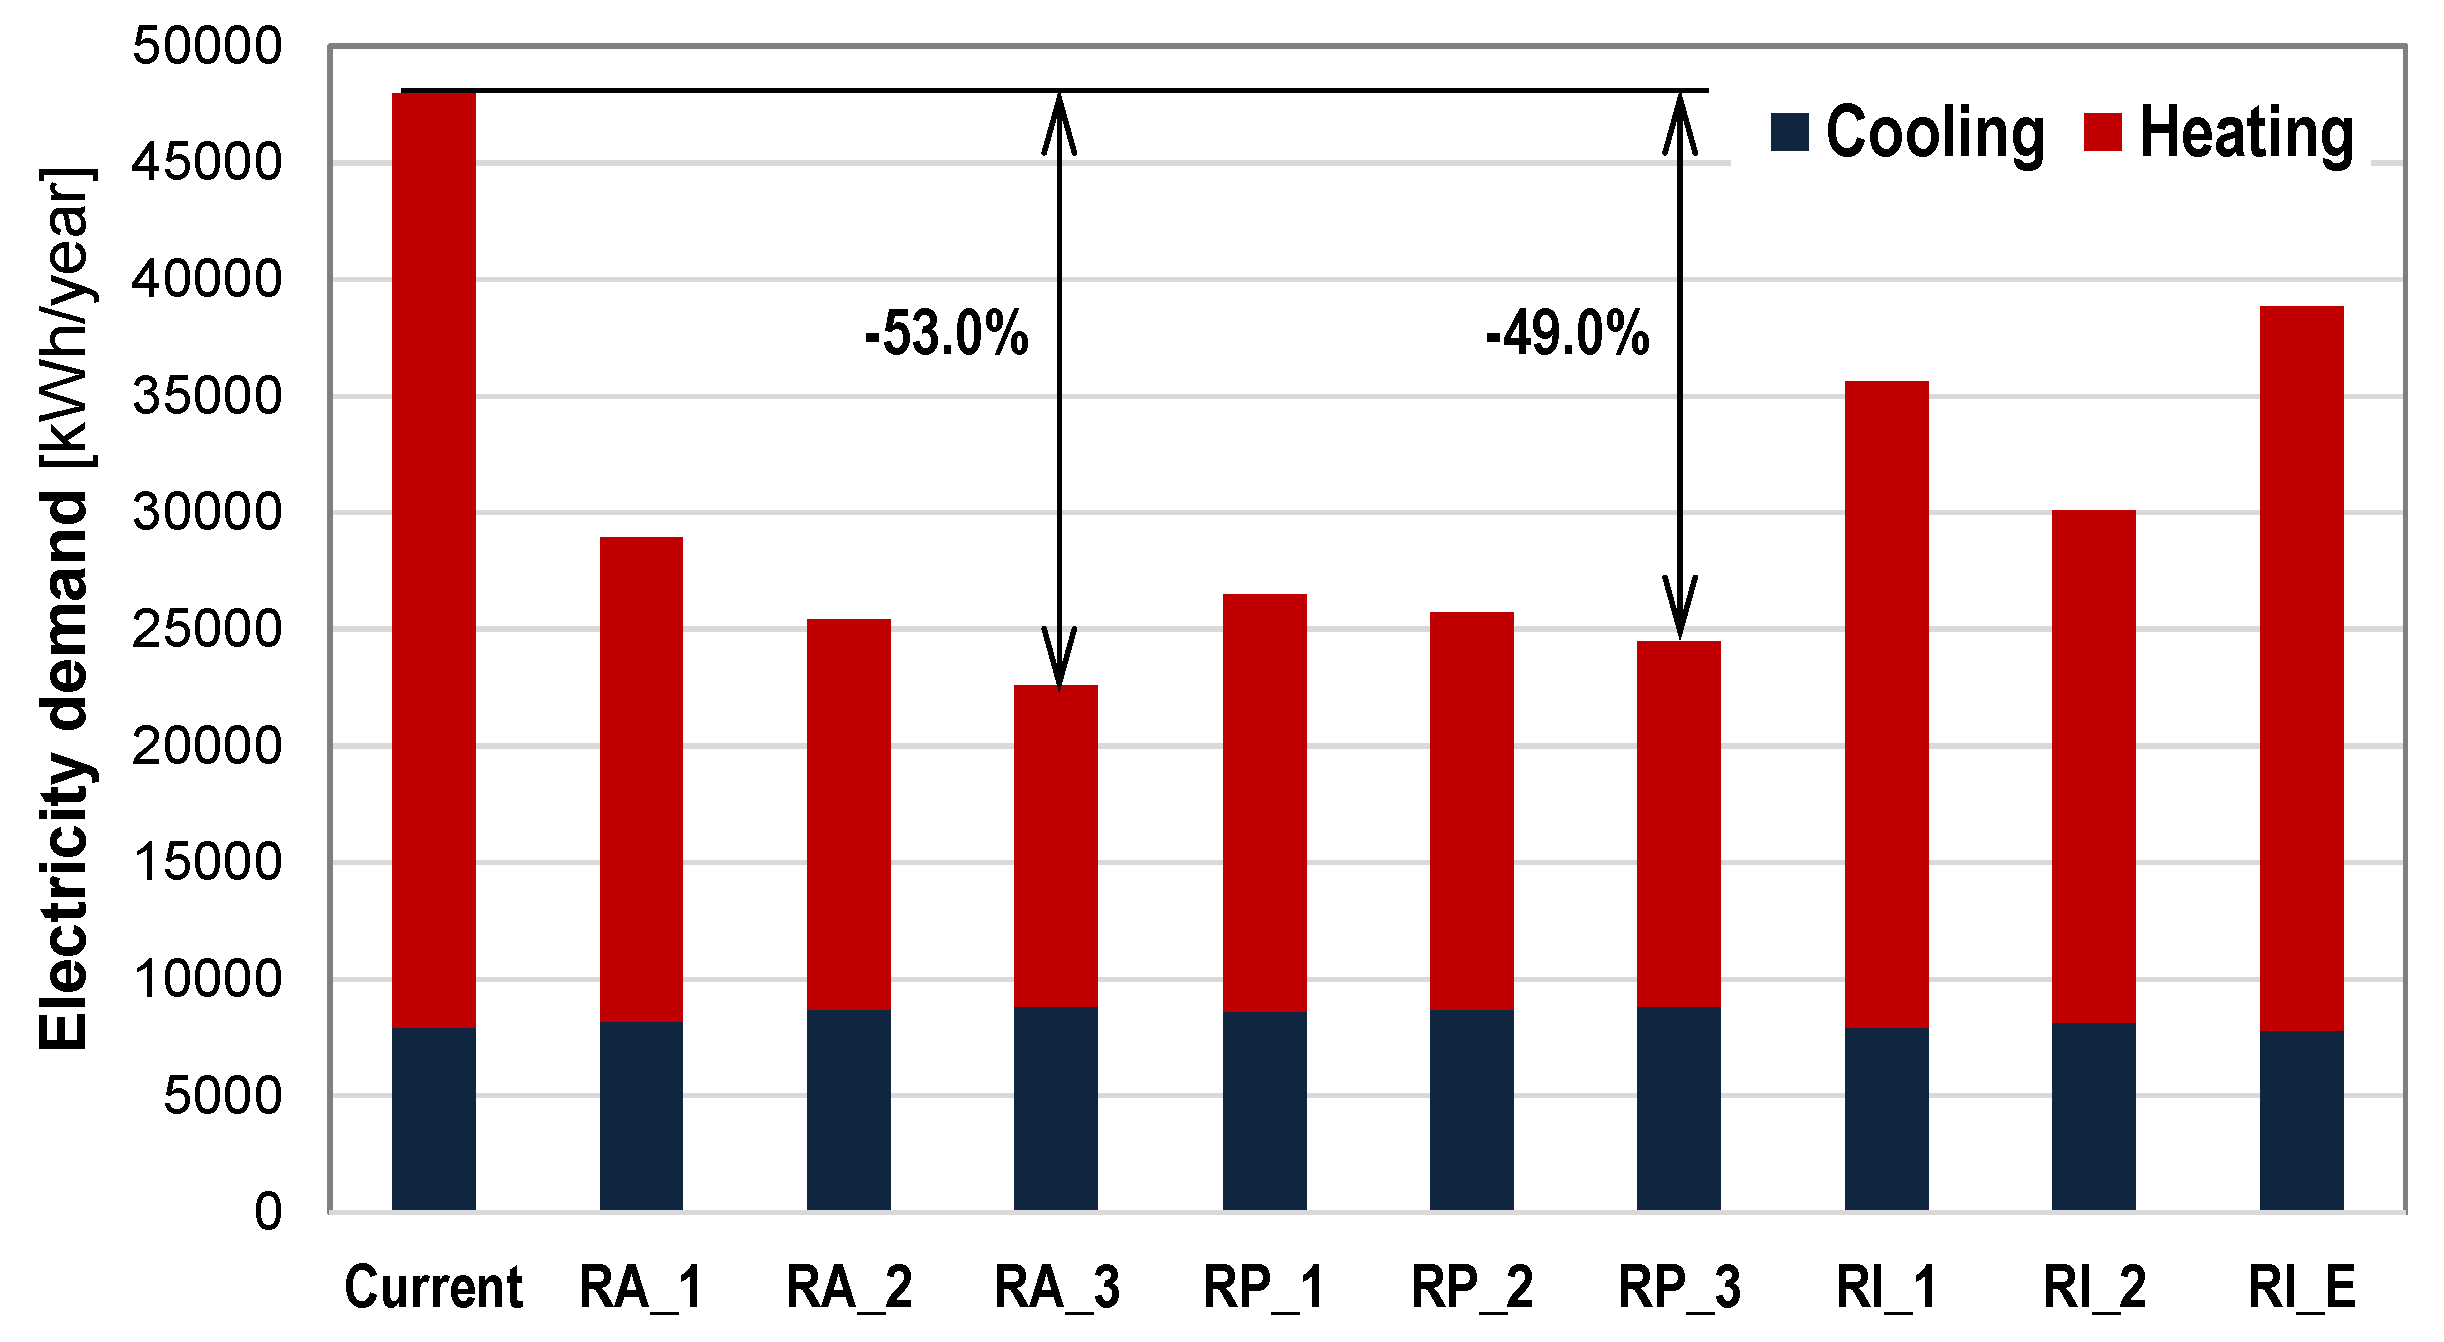
5.1. Energy Needs

The annual electricity consumption for space heating and cooling has been calculated through the methodology outlined in Section 3.1. The existing air-conditioning system is based on four reversible air-to-water electric heat pumps, with an overall nominal heating capacity as high as 230.4 kW. The average seasonal coefficients of performance for heating and cooling are, respectively, SCOP = 2.8 and SEER = 2.5. The heating needs are calculated over the period ranging from the 1st of December to the 31st of March, whereas the cooling needs refer to the summer months (June–September).
The results supplied by MasterClima are summarized in Figure 5. As one can observe, in the current configuration, the energy needs for space heating are much higher than those for space cooling (the ratio is 5:1). If one improves the thermal transmittance of the envelope through the retrofit solutions proposed in Section 4, the energy needs for space heating are drastically reduced; however, most of these solutions also yield a slight increase in the energy needs for space cooling, which may attain 11% in those cases with the highest insulation thickness (RA_3 and RP_3). Indeed, a high wall thermal resistance prevents internal heat gains to be effectively dissipated outdoors when the outdoor temperature is sufficiently low. The only exception is solution RI_E, which implies a slight reduction in the energy needs for space cooling (around 1.5%) as a result of the insulation from the outer side.
Overall, the most performing solution seems to be RA_3 (aerogel boards, 30 mm), which allows the annual electricity needs to be reduced by 53%, followed by solution RP_3 (calcium silicate boards, 80 mm), with 49% of annual energy savings. It is important to remember that these two solutions are the only ones with access to financial incentives.
Finally, the least effective solution is RI_E; however, this solution is penalized by the fact of being applied on a smaller surface due to aesthetic constraints (see Table 2).

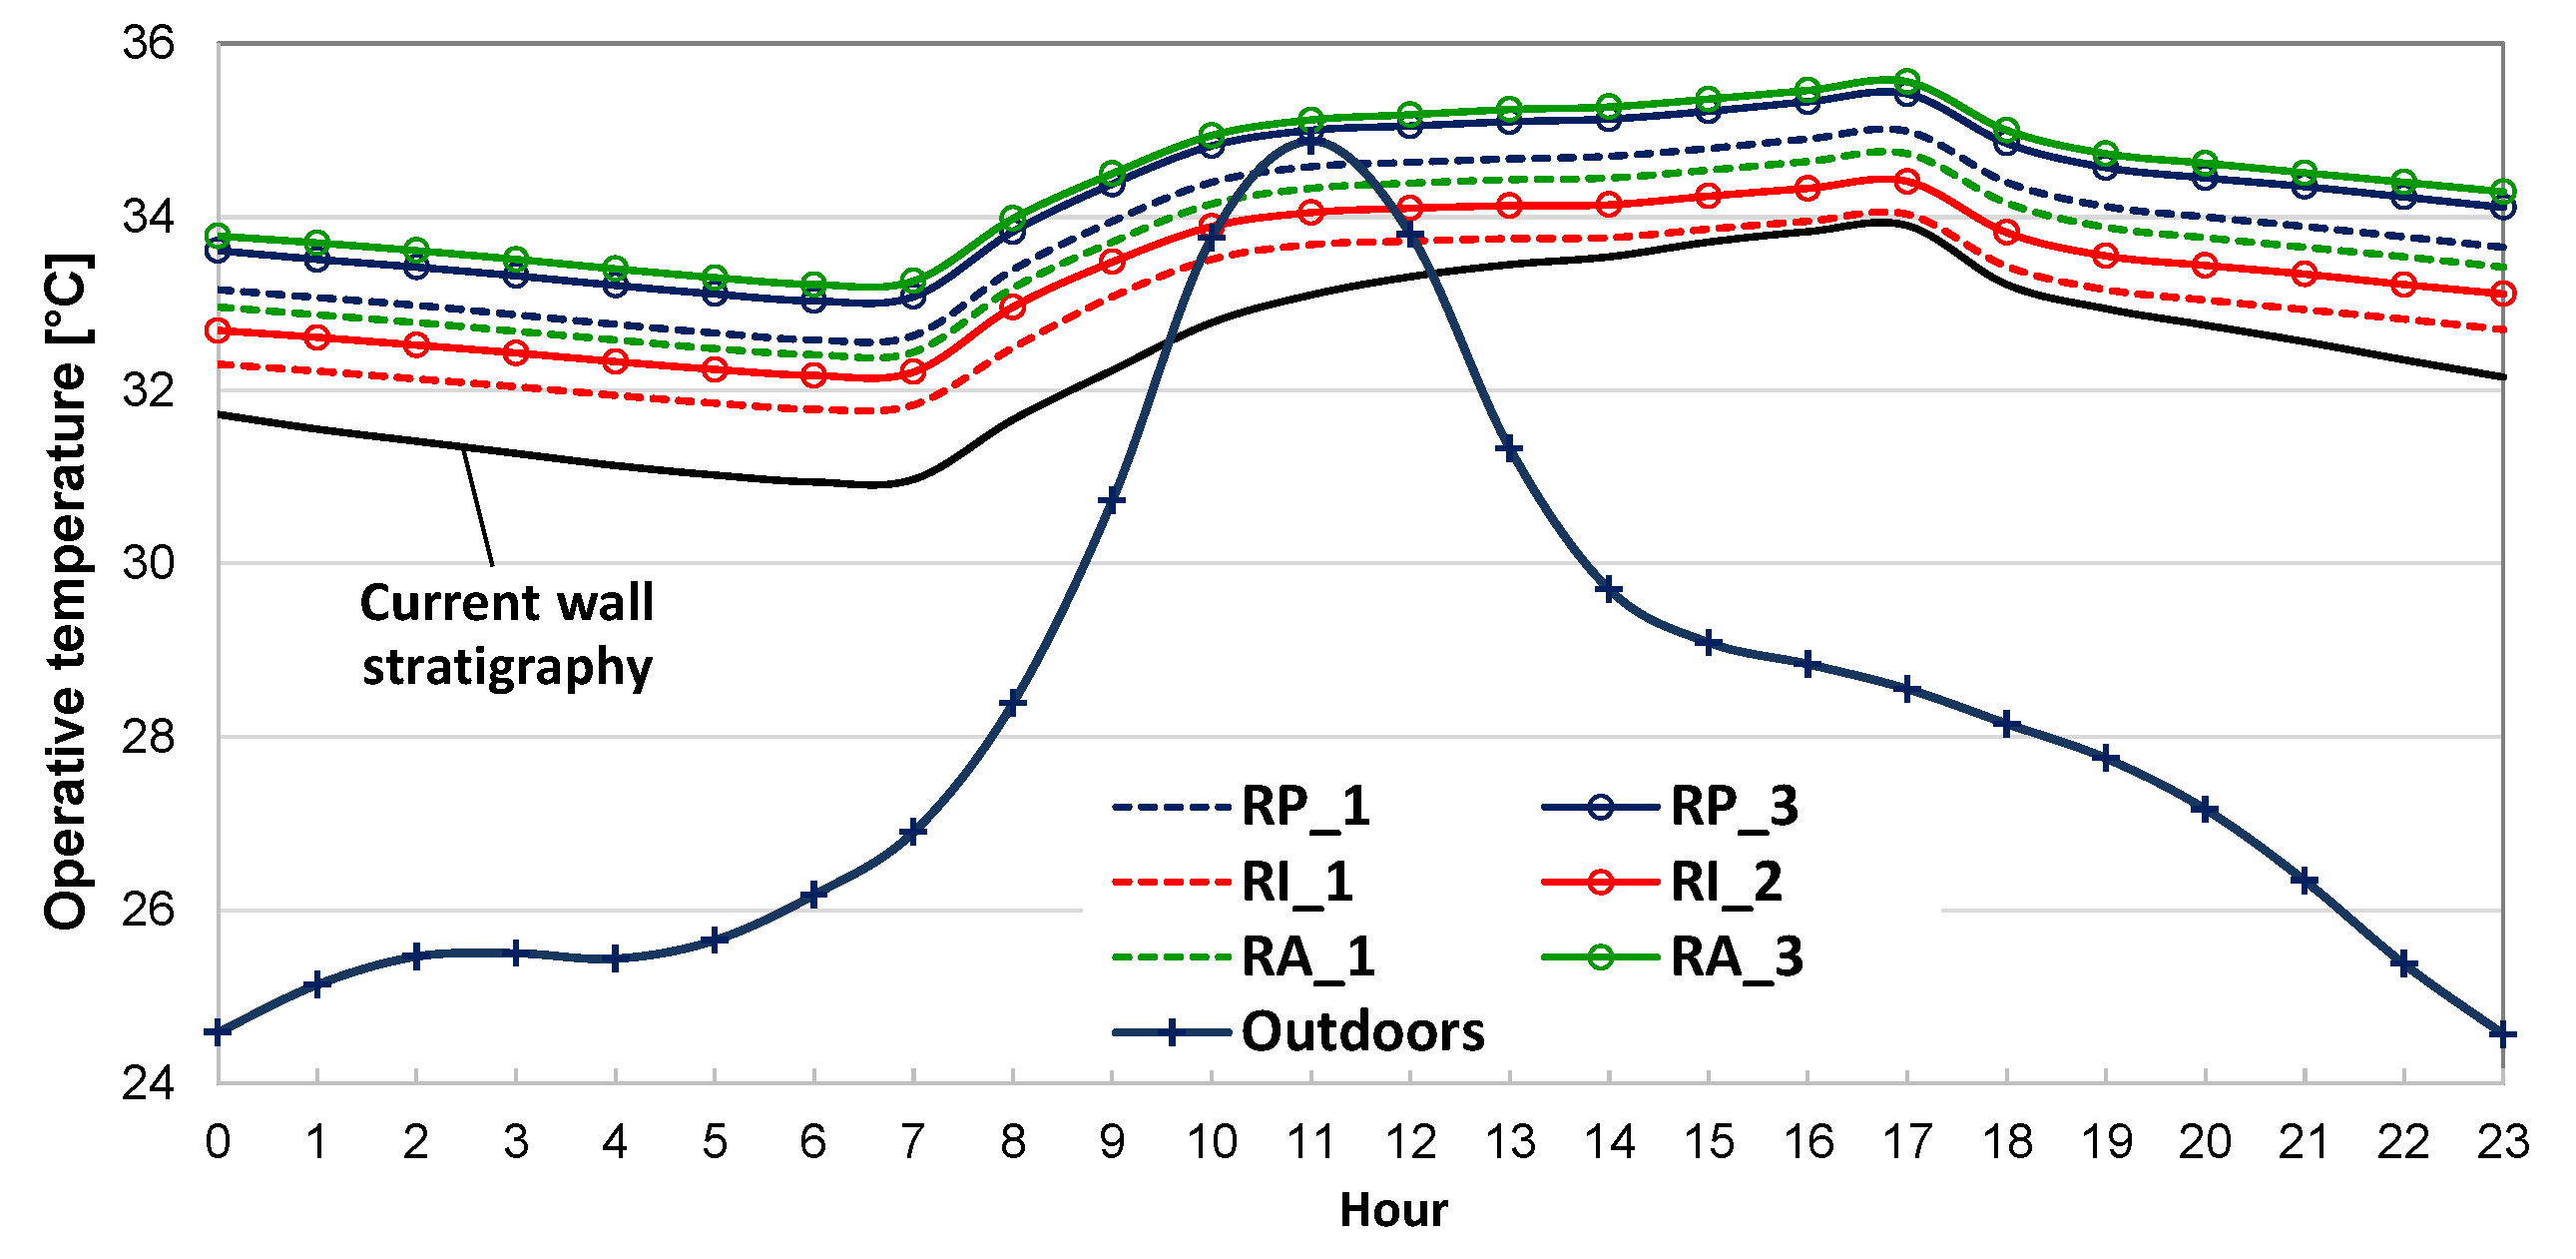
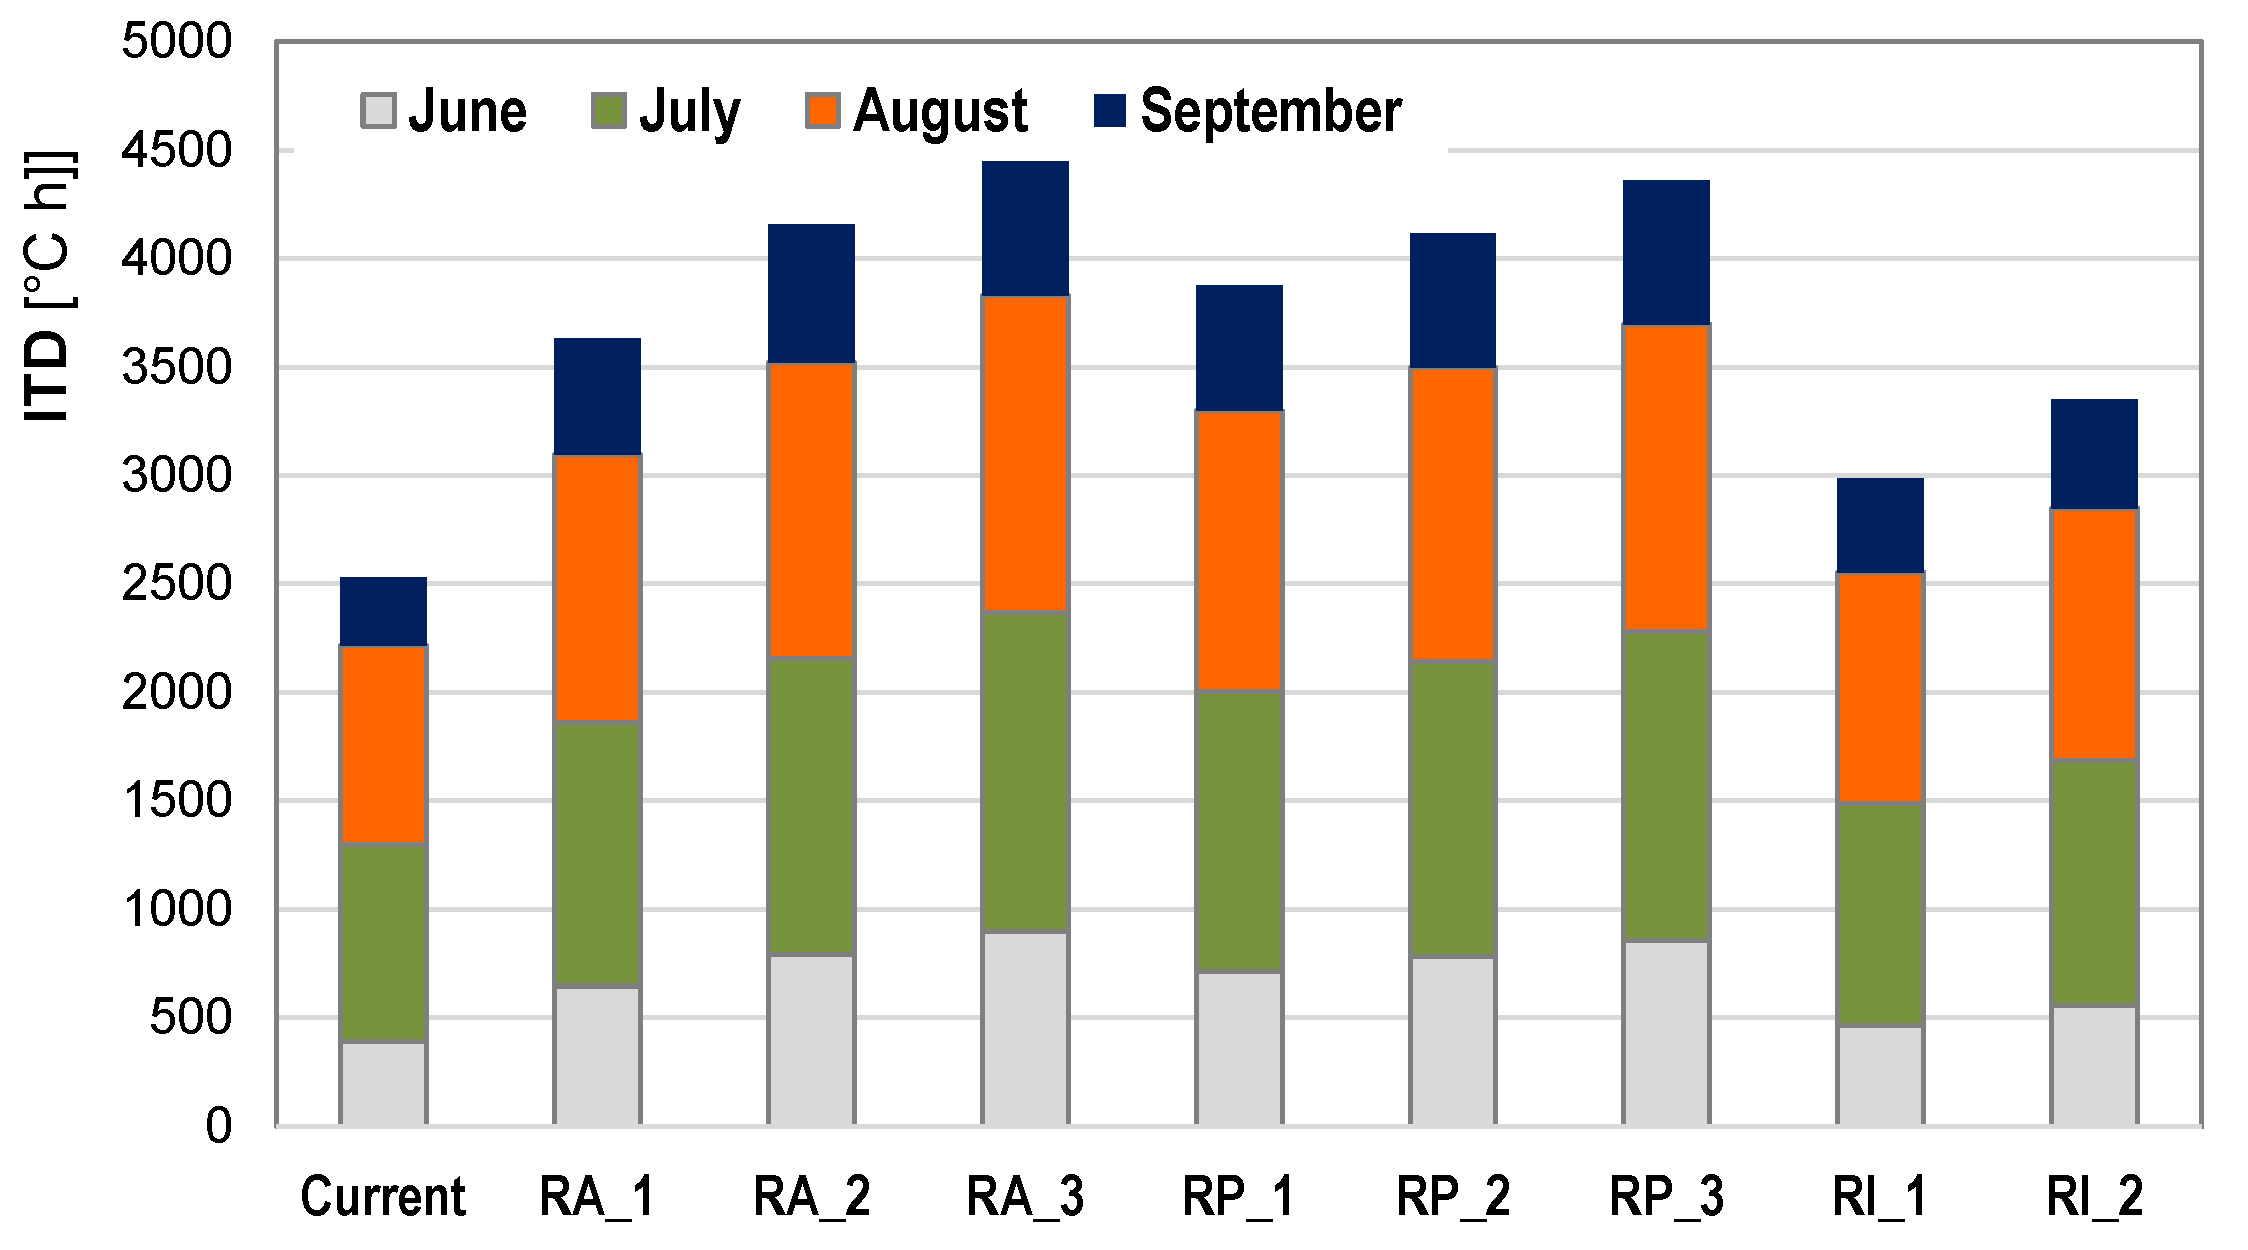
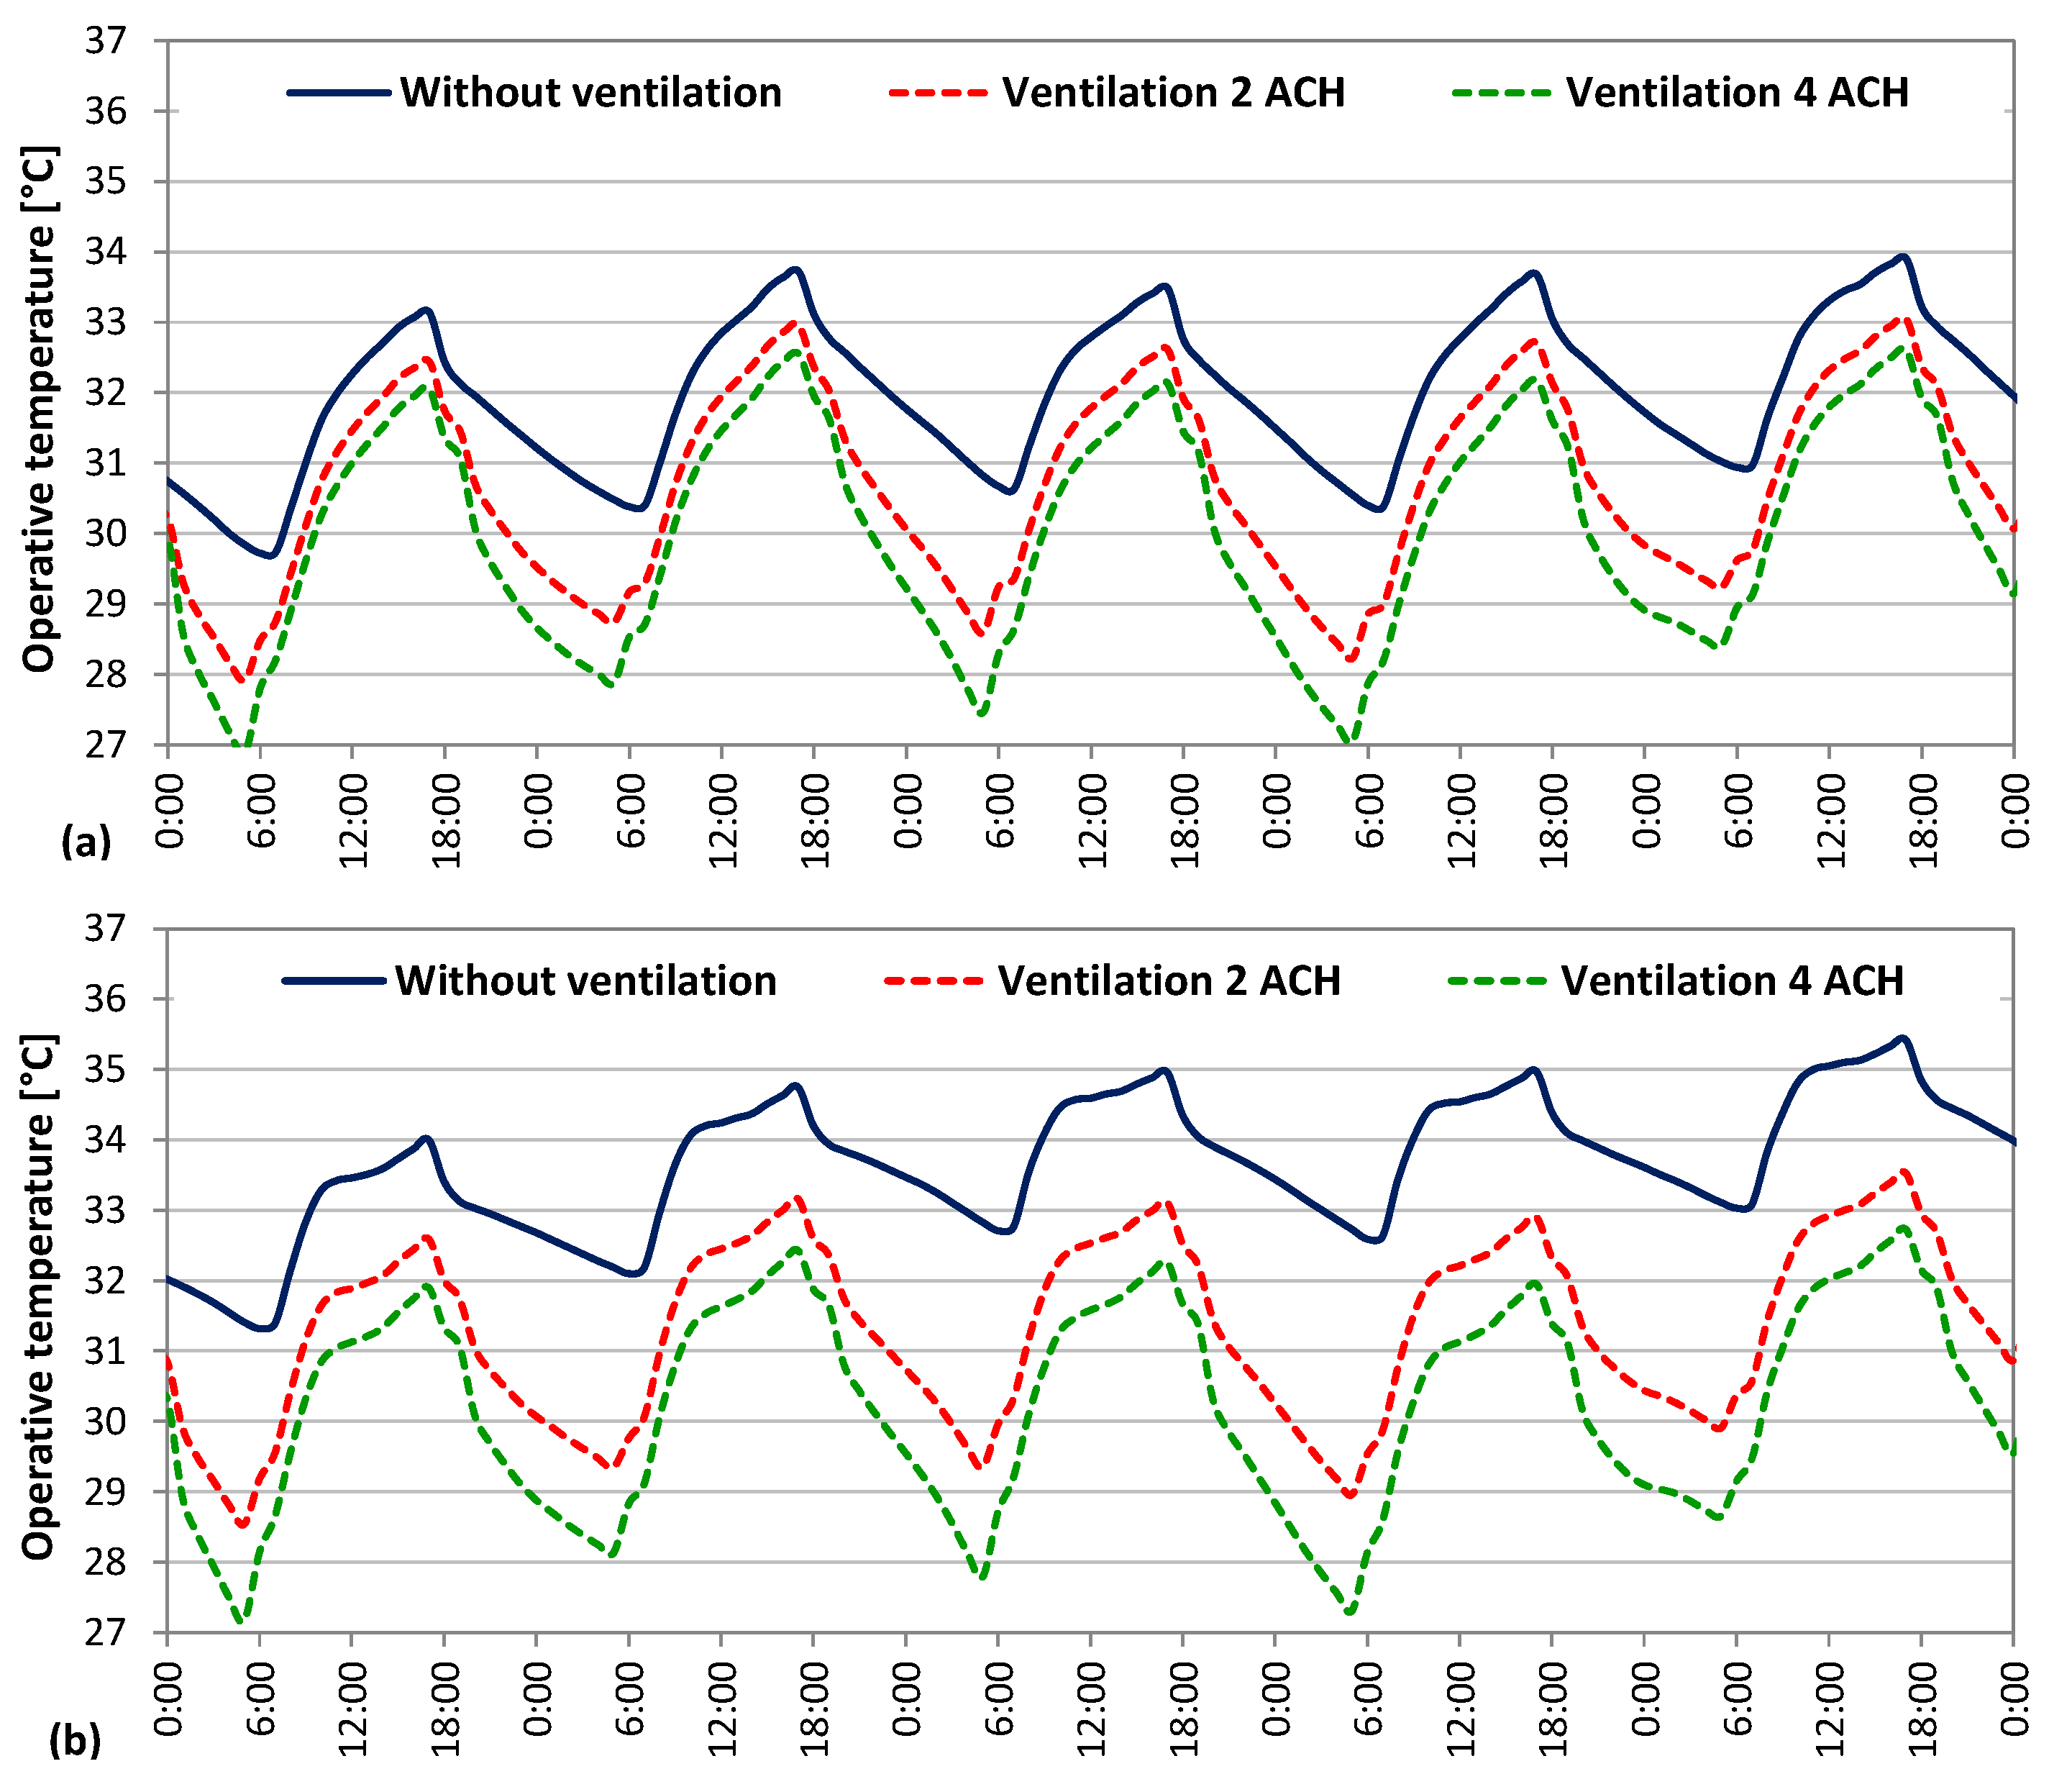
5.2. Thermal Comfort

In order to evaluate the effect of the proposed retrofit solutions upon the thermal comfort perceived by the occupants in Summer, it is appropriate to consider the hourly indoor operative temperature profiles during the hottest day of the season. The results of the simulations, with reference to the East-facing office highlighted in Figure 2, are reported in Figure 6; here, the results of case RI_E (outer insulating plaster) are not shown since this retrofit solution can only be applied to a restricted part of the building (façade surfaces not cladded with carved limestone). Moreover, the ITD values calculated according to the methodology outlined in Section 3.2 are shown in Figure 7.
The curves reported in Figure 6 suggest that the application of insulating materials for retrofit purposes provokes a noticeable increase in the operative temperature in summer if compared to the current building configuration (solid black line). This effect is somewhat proportional to the additional thermal resistance introduced by the insulating layer and reaches 2 °C for solution RA_3 (30 mm of aerogel, plus double-glazed windows and roof insulation). The temperature rise decreases to less than 1.5 °C in the case of minimum insulation thickness (RA_1 and RP_1) and hardly exceeds 1 °C when the insulating plaster is applied. It is also interesting to observe that in cases RA_3 and RP_3, i.e., those retrofit solutions showing the highest additional thermal resistance, the indoor operative temperature remains constantly higher than the outdoor air temperature; this is a further issue that proves the excessive indoor overheating produced in Summer.
Now, it is important to highlight that the results shown in Figure 6 refer just to a specific and particularly unfavorable day in summer. However, a most comprehensive investigation should look at a long period, which is possible by considering the ITD. In this sense, the ITD values reported in Figure 7 seem to confirm what has been previously discussed. Indeed, the ITD values for the retrofit packages RA_3 and RP_3 are almost twice as high as in the current state, which means that occupants inside the office will feel uncomfortable more intensely and for a much longer time. On the other hand, the lowest ITD values are associated with the solutions involving the use of insulation plaster (RI_1 and RI_2).
Finally, it is interesting to investigate the role of natural ventilation. To this aim, the dynamic simulations have been repeated by assuming two different constant values for the ventilation rate, namely 2 ACH and 4 ACH, from 20:00 to 06:00, which may be obtained by keeping the windows partially open. In order to emphasize the possible correlation between the effectiveness of natural ventilation and the wall thermal capacity, this series of simulations was performed for both the current building configuration (high thermal capacity) and the case RP_3 (where the inner insulation significantly reduces the thermal capacity).
The results are shown in Figure 8 with reference to a sequence of very hot days in August and suggest that nighttime ventilation is a very effective practice to improve summer thermal comfort. Indeed, this produces a significant decrease in the indoor operative temperature of up to 3–4 °C with 2 ACH or even 5 °C with 4 ACH. By comparing Figure 8a,b, one can also observe that, with 4 ACH, the operative temperature converges toward the same value at 06:00, no matter what the envelope solution. Then, when natural ventilation is stopped, the operative temperature increases according to two different shapes, but at around 17:00 it reaches more or less the same peak daily value (around 33 °C). On the contrary, the difference between the two envelope solutions is much more evident if nighttime natural ventilation is not exploited; in this case, in case RP_3 (Figure 8b) the peak daily operative temperature is more than 1 °C higher than for the current configuration (Figure 8a). This suggests that nighttime natural ventilation is a very effective strategy to counterbalance the negative effect of inner insulation on summer thermal comfort.

5.3. Economic Analysis
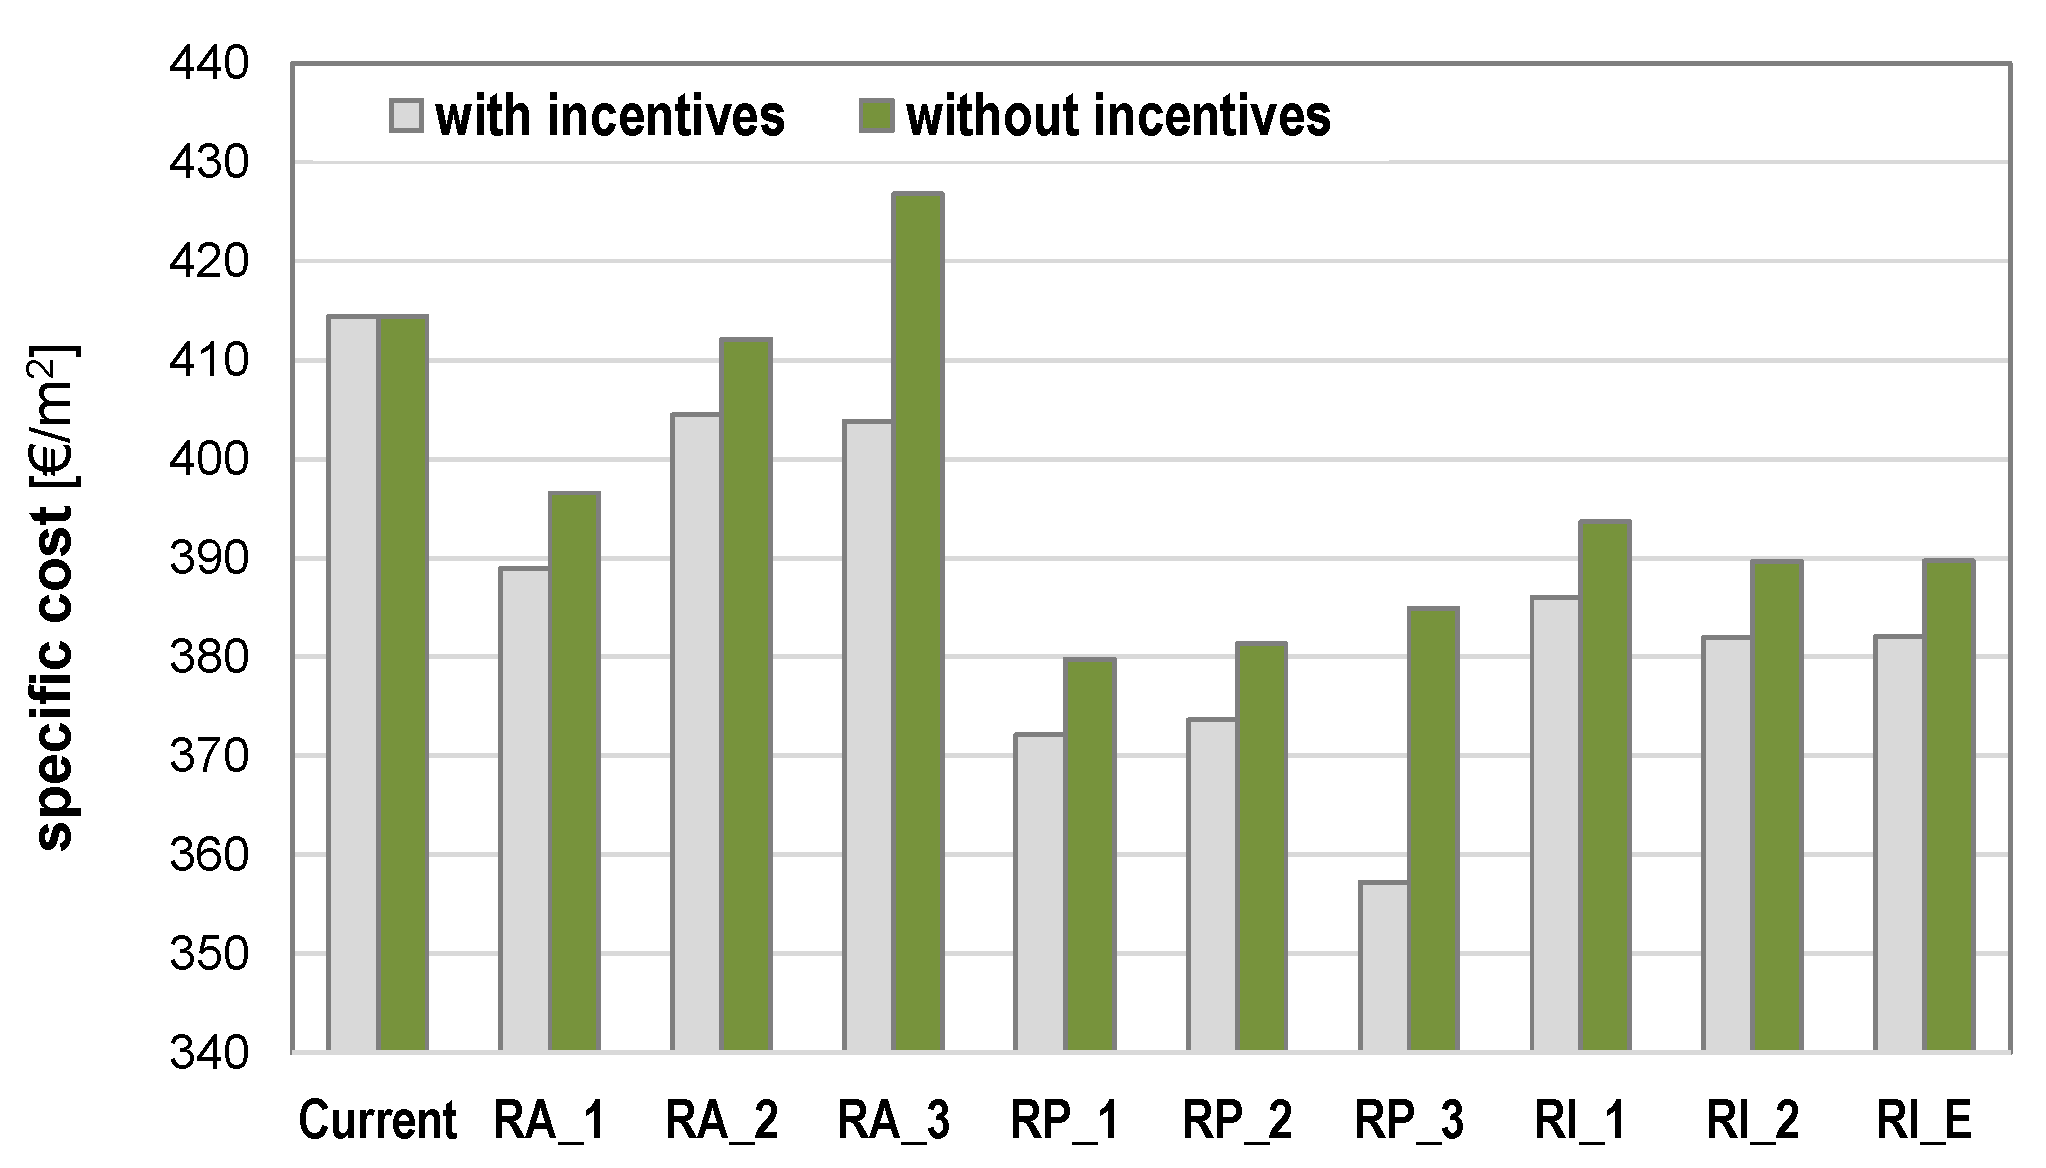
5.3.1. Cost Optimal

The global cost Cg has been calculated for each EERM, considering the period indicated by the standard EN 15459 for office buildings, i.e., 20 years [25]. As mentioned in Section 3.3.1, the evaluation was carried out including the available financial incentives when applicable, according to the achieved thermal transmittance. To select the cost optimal solution, we have estimated Cg for unit heated surface (€/m2). Figure 9 illustrates the results of the cost optimal analysis, indicating both scenarios with and without incentives.
These results show that the retrofit packages with the lowest global costs are RP_1, RP_2, and RP_3 (internal insulation with calcium silicate boards): indeed, when considering financial incentives, they allow specific costs to be lower by around 10% if compared with RA_1, RA_2, and RA_3 (aerogel boards). Packages RI_1 and RI_2 (inner insulating plaster) each show a specific cost that is intermediate between aerogel and calcium silicate solutions. However, for all retrofit solutions, the global cost is lower than for the current building configuration, which suggests that the initial costs for the interventions can be compensated by the savings in the energy bills within 30 years, even accounting for the costs associated with the loss of useful floor surface. It is also worth pointing out that even if the installation of aerogel boards of 30 mm (RA_3) entails a reduced loss of useful floor surface and a very low transmittance value (which permits access to the financial incentives), these advantages do not counterbalance the very high cost of aerogel compared to calcium silicate boards.

5.3.2. Discounted Payback Time

As illustrated in Table 6, the calculation of the discounted DPT shows that, for some retrofit packages, the DPT exceeds 20 years, obviously with higher values if the incentives cannot be obtained. An investment with a DPT higher than 20 years (i.e., longer than the lifespan of the considered materials) is considered not convenient and therefore should not be taken into account.
Also in this case, the high cost of aerogel boards leads this solution to be considered economically not suitable. Indeed, aerogel solutions, even if considering the available incentives, entail a DPT between 23 and 32 years.
Finally, one can observe that the most cost-effective package turns out to be RP_3 (internal insulation with 80-mm thick calcium silicate boards) since it provides the lowest DPT (12 years). Of course, this solution also permits the exploitation of the financial incentives.

6. Conclusions

This study has analysed the effectiveness of different Energy Efficiency Retrofit Measures (EERMs) for the energy retrofit of a historic building in the Mediterranean climate, taking into account their cost efficiencies through a cost-optimal approach. In particular, the selected retrofit packages have been compared based on their global costs by considering also the possibility of accessing Italian financial incentives.
Amongst the proposed solutions for the wall insulation, aerogel boards show the best thermal performance since they can reduce the overall energy needs for space heating and cooling by 53% if the thickness of the boards is 30 mm (case RA_3). Calcium silicate boards also perform very well (49% annual energy savings with a thickness of 80 mm, case RP_3).
However, aerogel boards are still not cost-effective because of the current high price of the material: indeed, their unit cost is from three to five times as high as the cost of calcium silicate boards depending on the thickness. As a consequence, the most cost-effective solution is the one based on the installation of calcium silicate boards on the inner side of the walls; by applying 80 mm of this material (solution RP_3), it is possible to achieve the thermal transmittance required to access the Italian financial incentives, and this allows the lowest DPT to be obtained (12 years), whereas the DPT would be between 23 and 32 years if aerogel boards were adopted. Calcium silicate boards are also effective in terms of global costs, which are lower by around 10% than those for aerogel boards. Moreover, for all retrofit solutions, the global cost is lower than for the current building configuration, which means that the initial costs for the interventions can be compensated by the savings in the energy bills within 30 years.
The different packages have also been studied by looking at thermal comfort. In hot climates, internal insulation inhibits heat transfer from the indoors to the outdoors, and, above all, it drastically reduces the internal heat capacity of the wall; this leads to an increase in thermal discomfort, which penalizes those solutions that perform better in winter, i.e., RP_3 (80-mm thick calcium silicate boards) and RA_3 (30-mm thick aerogel boards), which are characterized by the lowest U-values. Indeed, the possibility of room overheating compared to the current building configuration reaches 2 °C for solution RA_3 and RP_3 and decreases to less than 1.5 °C in the case of minimum insulation thickness (RA_1 and RP_1).
Finally, the most cost-effective solution (RP_3) has been studied following the adaptive comfort approach, considering nighttime ventilation (from 20:00 to 06:00) with two possible ventilation rates (2 ACH and 4 ACH), which may be reasonably obtained by keeping the windows partially open. The results suggest that nighttime ventilation is a very effective practice to improve summer thermal comfort, producing a significant decrease in the indoor operative temperature (up to 3–4 °C with 2 ACH or even 5 °C with 4 ACH) compared to case RP_3 without natural ventilation. Moreover, for a given ventilation rate, the peak daily operative temperature for case RP_3 is very close to what is observed in the current configuration, and this suggests that nighttime natural ventilation is a very effective strategy to counterbalance the negative effect of inner insulation on summer thermal comfort.
In conclusion, it is possible to state that the initial investment costs for energy renovation actions in historic buildings are still a significant obstacle, while the thermal transmittance limits imposed to obtain fiscal and financial incentives turn out to be too restrictive for this building category. Indeed, for these edifices, the choice of retrofit actions is limited by the necessity of preserving their cultural and architectural identity. Current standards and codes show the lack of a specific protocol that provides balanced solutions to significantly improve the energy efficiency of historic buildings.

Author Contributions

A.G. and G.M. conceived and designed the research, and supervised the simulations; S.C. performed the simulations and the calculations; G.E. supervised the analysis of the results and wrote the paper.

Conflicts of Interest

The authors declare no conflict of interest.

References

  1. Mazzarella, L. Energy retrofit of historic and existing buildings. the legislative and regulatory point of view. Energy Build. 2015, 95, 23–31. [Google Scholar] [CrossRef]
  2. Filippi, M. Remarks on the green retrofitting of historic buildings in Italy. Energy Build. 2015, 95, 15–22. [Google Scholar] [CrossRef]
  3. European Parliament. Directive 2010/31/EU of the European Parliament and of the Council of 19 May 2010 on the Energy Performance of Buildings (Recast); Official Journal of the European Union, 18 June 2010. Available online: http://www.buildup.eu/en/practices/publications/directive-201031eu-energy-performance-buildings-recast-19-may-2010 (accessed on 30 June 2017).
  4. Giombini, M.; Pinchi, E.M. Energy functional retrofitting of historic residential buildings: The case study of the historic center of Perugia. Energy Procedia 2015, 82, 1009–1016. [Google Scholar] [CrossRef]
  5. Bellia, L.; D’Ambrosio Alfano, F.R.; Giordano, J.; Ianniello, E.; Riccio, G. Energy requalification of a historical building: A case study. Energy Build. 2015, 95, 184–189. [Google Scholar] [CrossRef]
  6. Şahin, C.D.; Arsan, Z.D.; Tunçoku, S.S.; Broström, T.; Akkurt, G.G. A transdisciplinary approach on the energy efficient retrofitting of a historic building in the Aegean Region of Turkey. Energy Build. 2015, 96, 128–139. [Google Scholar] [CrossRef]
  7. De Berardinis, P.; Rotilio, M.; Marchionni, C.; Friedman, A. Improving the energy-efficiency of historic masonry buildings. A case study: A minor centre in the Abruzzo region, Italy. Energy Build. 2014, 80, 415–423. [Google Scholar] [CrossRef]
  8. Franco, G.; Magrini, A.; Cartesegna, M.; Guerrini, M. Towards a systematic approach for energy refurbishment of historical buildings. The case study of Albergo dei Poveri in Genoa, Italy. Energy Build. 2015, 95, 153–159. [Google Scholar] [CrossRef]
  9. De Fino, M.; Scioti, A.; Cantatore, E.; Fatiguso, F. Methodological framework for assessment of energy behavior of historic towns in Mediterranean climate. Energy Build. 2017, 144, 87–103. [Google Scholar] [CrossRef]
  10. Bianco, L.; Serra, V.; Fantucci, S.; Dutto, M.; Massolino, M. Thermal insulating plaster as a solution for refurbishing historic building envelopes: First experimental results. Energy Build. 2015, 95, 86–91. [Google Scholar] [CrossRef]
  11. Gagliano, A.; Nocera, F.; Patania, F.; Detommaso, M.; Sapienza, V. Deploy energy-efficient technologies in the restoration of a traditional building in the historical center of Catania (Italy). Energy Procedia 2014, 62, 62–71. [Google Scholar] [CrossRef]
  12. Zagorskas, J.; Zavadskas, E.K.; Turskis, Z.; Burinskiene, M.; Blumberga, A.; Blumberga, D. Thermal insulation alternatives of historic brick buildings in Baltic Sea Region. Energy Build. 2014, 78, 35–42. [Google Scholar] [CrossRef]
  13. Gagliano, A.; Patania, F.; Nocera, F.; Signorello, C. Assessment of the dynamic thermal performance of massive buildings. Energy Build. 2014, 72, 361–370. [Google Scholar] [CrossRef]
  14. Gagliano, A.; Nocera, F.; Patania, F.; Moschella, A.; Detommaso, M.; Evola, G. Synergic effects of thermal mass and natural ventilation on the thermal behavior of traditional massive buildings. Int. J. Sustain. Energy 2016, 35, 411–428. [Google Scholar] [CrossRef]
  15. Walker, R.; Pavía, S. Thermal performance of a selection of insulation materials suitable for historic buildings. Build. Environ. 2015, 94, 155–165. [Google Scholar] [CrossRef]
  16. Keeffe, G.; McHugh, I. IDEAhaus: A Modular Approach to Climate Resilient UK Housing. Buildings 2014, 4, 661–682. [Google Scholar] [CrossRef]
  17. Moran, F.; Blight, T.; Natarajan, S.; Shea, A. The use of Passive House Planning Package to reduce energy use and CO2 emissions in historic dwellings. Energy Build. 2014, 75, 216–227. [Google Scholar] [CrossRef]
  18. Ascione, F.; De Rossi, F.; Vanoli, G.P. Energy retrofit of historical buildings: Theoretical and experimental investigations for the modelling of reliable performance scenarios. Energy Build. 2011, 43, 1925–1936. [Google Scholar] [CrossRef]
  19. Cornaro, C.; Puggioni, V.A.; Strollo, R.M. Dynamic simulation and on-site measurements for energy retrofit of complex historic buildings: Villa Mondragone case study. J. Build. Eng. 2016, 6, 17–28. [Google Scholar] [CrossRef]
  20. Ascione, F.; Bianco, N.; De Masi, R.F.; De’Rossi, F.; Vanoli, G.P. Energy retrofit of an educational building in the ancient center of Benevento. Feasibility study of energy savings and respect of the historical value. Energy Build. 2015, 95, 172–183. [Google Scholar] [CrossRef]
  21. Magrini, A.; Franco, G. The energy performance improvement of historic buildings and their environmental sustainability assessment. J. Cult. Herit. 2016, 21, 834–841. [Google Scholar] [CrossRef]
  22. Roberti, F.; Oberegger, U.F.; Lucchi, E.; Troi, A. Energy retrofit and conservation of a historic building using multi-objective optimization and an analytic hierarchy process. Energy Build. 2017, 138, 1–10. [Google Scholar] [CrossRef]
  23. Martinez-Molina, A.; Tort-Ausina, I.; Cho, S.; Vivancos, J.L. Energy efficiency and thermal comfort in historic buildings: A review. Renew. Sustain. Energy Rev. 2016, 61, 70–85. [Google Scholar] [CrossRef]
  24. Ascione, F.; Cheche, N.; De Masi, R.F.; Minichiello, F.; Vanoli, G.P. Design the refurbishment of historic buildings with the cost-optimal methodology: The case study of a XV century Italian building. Energy Build. 2015, 99, 162–176. [Google Scholar] [CrossRef]
  25. EN-15459. Energy Performance of Buildings, Economic Evaluation Procedure for Energy System in Buildings; European Commitee for Standardization: Brussels, Belgium, 2007. [Google Scholar]
  26. Corrado, V.; Ballarini, I.; Paduos, S. Sviluppo della Metodologia Comparativa Cost-Optimal. 2013. Available online: http://www.enea.it/it/Ricerca_sviluppo/documenti/ricerca-di-sistema-elettrico/edifici-pa/2012/rds-2013-144.pdf (accessed on 24 April 2017).
  27. Guidelines Accompanying Commission Delegated Regulation (EU) No. 244/ 2012 of 16 January 2012 Supplementing Directive 2010/31/EU of the European Parliament and of the Council. Official Journal of the European Union, 19 April 2012. Available online: http://www.eib.org/epec/ee/documents/comparative-methodology-epbd.pdf (accessed on 30 June 2017).
  28. Baglivo, C.; Congedo, P.M.; D'Agostino, D.; Zac, I. Cost-optimal analysis and technical comparison between standard and high efficient mono-residential buildings in a warm climate. Energy 2015, 83, 560–575. [Google Scholar] [CrossRef]
  29. Bonakdar, F.; Sasic Kalagasidis, A.; Mahapatra, K. The Implications of Climate Zones on the Cost-Optimal Level and Cost-Effectiveness of Building Envelope Energy Renovation and Space Heat Demand Reduction. Buildings 2017, 7, 39. [Google Scholar] [CrossRef]
  30. Tadeu, S.; Rodrigues, C.; Tadeu, A.; Freire, F.; Simões, N. Energy retrofit of historic buildings: Environmental assessment of cost-optimal solutions. J. Build. Eng. 2015, 4, 167–176. [Google Scholar] [CrossRef]
  31. Di Giuseppe, E.; Massi, A.; D’Orazio, M. Impacts of uncertainties in life cycle cost analysis of buildings energy efficiency measures: application to a case study. Energy Procedia 2017, 111, 442–451. [Google Scholar] [CrossRef]
  32. De Angelis, E.; Pansa, G.; Serra, E. Research of economic sustainability of different energy refurbishment strategies for an apartment block building. Energy Procedia 2014, 48, 1449–1458. [Google Scholar] [CrossRef]
  33. UNI TS 11300-1. Prestazioni Energetiche Degli Edifici—Parte 1: Determinazione del Fabbisogno di enErgia Termica Dell’edificio per la Climatizzazione Estiva ed Invernale; Ente Italiano di Normazione: Milan, Italy, 2014. (In Italian) [Google Scholar]
  34. Sicurella, F.; Evola, G. A statistical approach for the evaluation of thermal and visual comfort in free-running buildings. Energy Build. 2012, 47, 402–410. [Google Scholar] [CrossRef]
  35. Evola, G.; Marletta, L.; Costanzo, V.; Caruso, G. Different strategies for improving summer thermal comfort in heavyweight traditional buildings. Energy Procedia 2015, 78, 3228–3233. [Google Scholar] [CrossRef]
  36. Nicol, J.F.; Humphreys, M.A. Adaptive thermal comfort and sustainable thermal standards for buildings. Energy Build. 2002, 34, 563–572. [Google Scholar]
  37. EN 15251. Indoor Environmental Input Parameters for Design and Assessment of Energy Performance of Buildings Addressing Indoor Air Quality, Thermal Environment, Lighting and Acoustics; European Commitee for Standardization: Brussels, Belgium, 2007. [Google Scholar]
  38. Ministerial Decree 16 February 2016. Aggiornamento della Disciplina per l’Incentivazione di Interventi di Piccole Dimensioni per l’Incremento dell’Efficienza Energetica e per la Produzione di Energia Termica da Fonti Rinnovabili; Gazzetta Ufficiale della Repubblica Italiana No. 51 del 02 Marzo 2016: Rome, Italy. (In Italian)
  39. EN ISO 13786. Thermal Performance of Building Components—Dynamic Thermal Characteristics—Calculation Methods; European Commitee for Standardization: Brussels, Belgium, 2007. [Google Scholar]
Figure 1. North- and west-facing façades of the selected building.
Buildings 07 00060 g001
Figure 2. Plan of the third floor: identification of the rooms selected for dynamic simulations.
Buildings 07 00060 g002
Figure 3. Cost categorization according to the methodology framework (modified from [27]).
Buildings 07 00060 g003
Figure 4. Methodology to calculate the residual value.
Buildings 07 00060 g004
Figure 5. Annual electricity needs for space heating and cooling.
Buildings 07 00060 g005
Figure 6. Operative temperature profile on the hottest day (9th of August, East-facing office).
Buildings 07 00060 g006
Figure 7. Intensity of thermal discomfort for the proposed retrofit packages.
Buildings 07 00060 g007
Figure 8. Effect of nighttime natural ventilation on the indoor operative temperature (from 5th to 10th August). (a): current building configuration; (b): case RP_3.
Buildings 07 00060 g008
Figure 9. Cg for unit heated surface with and without incentives.
Buildings 07 00060 g009
Table 1. Thermophysical properties of the opaque envelope in the actual configuration.
Layers (from Inside to Outside)s (mm)λ (W·m−1·K−1)ρ (kg·m−3)cp (J·kg−1·K−1)
Traditional wall: basalt stones + mortar (U = 1.57 W·m−2·K−1)
Plaster (lime + gypsum)150.714001090
Basalt stones with mortar7001.72500900
Plaster (lime + volcanic ash)300.914001090
Attic floor (U = 1.21 W·m−2·K−1)
Reed matting300.0561901000
Mortar (gypsum)350.5812001090
Plaster (lime + gypsum)150.714001090
Table 2. Proposed retrofit solutions: thermal properties and unit costs.
Retrofit SolutionMaterialCodes (mm)R (m2·K·W−1)U (W·m−2·K−1)Uinc (W·m−2·K−1)Csol (€·m−2)Cuf (€·m−2)
Wall insulation (IE: 468 m2; others: 932.5 m2)Aerogel boards (λ = 0.014 W·m−1·K−1)A1100.710.740.44102.8753.15
A2201.430.480.44162.2483.82
A3302.140.360.44221.14114.25
Calcium silicate boards (λ = 0.045 W·m−1·K−1)P1501.110.570.4442.7422.08
P2601.330.510.4444.8923.19
P3801.780.410.4447.7424.66
Thermal plaster (λ = 0.075 W·m−1·K−1)I1200.271.110.4442.5021.96
I2400.530.850.4453.4427.61
IE400.530.850.3870.6118.29
Roof insulation (558 m2)PUR boards (λ = 0.022 W·m−1·K−1)RT803.640.240.2766.820.65
Glazing replacement (143 m2)Double glazing with air gap (4-8-6)RV18-2.102.60110.08.71
U = thermal transmittance of the envelope components (wall, roof, window) after the retrofit intervention
Uinc = maximum thermal transmittance allowed to get the incentives
Csol = cost of the retrofit solution, referring to the unit surface involved in the retrofit
Cuf = cost of the retrofit solution, referring to the unit net useful floor surface of the building (1805 m2)
Table 3. Dynamic thermal properties for all the proposed wall configurations.
Wall SolutionTL (h)YIE (W·m−2·K−1)Cint (kJ·m−2·K−1)
Current20.00.03271.4
A121.20.00824.9
A221.50.00623.0
A321.80.00421.9
P121.80.00624.7
P222.00.00524.8
P322.60.00425.4
I120.60.01332.0
I221.40.00921.9
IE21.60.00971.6
Table 4. Proposed retrofit packages: initial costs (with and without incentives).
Retrofit PackageIncluded SolutionsInitial Costs
Without IncentivesWith Incentives
RA_1A1 + RT + RV€ 148,932.54€ 134,022.78
RA_2A2 + RT + RV€ 204,292.27€ 189,382.51
RA_3A3 + RT + RV€ 259,221.18€ 214,471.42
RP_1P1 + RT + RV€ 92,854.79€ 77,945.03
RP_2P2 + RT + RV€ 94,865.26€ 79,955.50
RP_3P3 + RT + RV€ 97,521.95€ 64,805.17
RI_1I1 + RT + RV€ 92,639.38€ 77,729.62
RI_2I2 + RT + RV€ 102,835.34€ 87,925.58
RI_EIE + RT + RV€ 86,013.38€ 71,103.62
Table 5. Proposed retrofit packages: indirect costs Csl due to the loss of useful floor surface.
Retrofit PackageThickness (mm)Loss of Surface (m2)Unit Costs (€/m2)Csl (€)
RA_1102.931,7004,985.3
RA_2205.871,7009,970.5
RA_3308.801,70014,955.8
RP_15014.661,70024,926.3
RP_26017.601,70029,911.5
RP_38023.461,70039,882.0
RI_1205.871,7009,970.5
RI_24011.731,70019,941.0
Table 6. Discounted Payback Time of the proposed retrofit packages with and without incentives.
Retrofit PackageIncluded SolutionsDPT
Without IncentivesWith Incentives
RA_1A1 + RT + RV2523
RA_2A2 + RT + RV3230
RA_3A3 + RT + RV3832
RP_1P1 + RT + RV1816
RP_2P2 + RT + RV1816
RP_3P3 + RT + RV1912
RI_1I1 + RT + RV2118
RI_2I2 + RT + RV1917
RI_EIE + RT + RV2218

