Whole Life-Cycle Ecological Footprint of Rural Existing Houses in Northern China

1
Laboratory of Building Technology, School of Architecture and Fine Art, Dalian University of Technology, Dalian 116024, China
2
School of Civil Engineering, Dalian University of Technology, Dalian 116024, China
*
Author to whom correspondence should be addressed.
Buildings 2018, 8(7), 92; https://doi.org/10.3390/buildings8070092
Submission received: 3 May 2018
/
Revised: 24 June 2018
/
Accepted: 28 June 2018
/
Published: 10 July 2018
Abstract
:To solve the increasing contradiction between the living environment and residential energy consumption in rural areas, it is urgent to alter the traditional living mode and create a new living pattern with a pleasant environment. Based on the theory of ecological footprint, in this article we compare the whole life-cycle ecological footprint between the northern rural house with various energy-saving measures and the urban multi-layer residence with only external wall thermal-insulation as the energy-saving measure. The results show that the sustainability of the multi-layer residence is obviously superior to the rural house. Therefore, rural house designers should learn the multi-layer residential design strategies, construction methods, and operation modes to reduce the unnecessary waste of the energy and resources. Through centralized planning, construction, and heating systems, the multi-level residence is conducive to sustainable human development. The study provides relevant theoretical support for low-carbon house construction in village areas.
1. Introduction
In China, the rural house directly reflects the level of living conditions of rural residences, the development of related production, the cleanliness of a village’s appearance, and the situation of civilized village custom that accompanies the rapid development of urbanization. Reasonable rural low-carbon housing is the key to building a resource-saving and harmonious society. While the residential environment, indoor comfort, and living facilities in a rural house are still significantly worse than in an urban house, the resource consumption of the rural house is more than that of the urban house, causing contradictions between indoor comfort and energy-saving in the village areas to be increasingly significant. Rural residents are no longer satisfied with their traditional living mode and they urgently require new house patterns with beautiful environments and full function. Consequently, due to the large rural population, rural housing construction and operation will annually consume significant resources. Therefore, only by accurately analyzing and evaluating the rural house pressure on the natural environment can a scientific basis to enable the development of design and technical standards that take effective measures, such as residential design, construction, and operation stages, into consideration be realized. Based on this management, the energy consumption of the rural house should be greatly reduced to achieve sustainable development within the advancement of rural house comfort and it can accelerate the process of constructing a resource-saving society.
Buildings are responsible for consuming 35–40% of energy in the developed countries, especially existing houses. A significant fraction of the energy consumption is transformed into comfortable, habitable, indoor environments [1,2]. B.Z. Li et al. investigate indoor thermal environments in China, and put forward an index suitable for the assessment of thermal environment comfort in the Chongqing area, and analyze the differences between indoor thermal environments in five climate zones [1]. In northern China, the principal way to improve indoor thermal comfort in winter is to enhance the building envelope and material properties. This paper will compare the ecological footprint and analyze the sustainable development of the buildings. As is known to us, the whole life-cycle assessment is the main research method on the environmental factors and their potential effects on the entire process of a product’s life-cycle. In a building’s practical application, the whole life-cycle assessment is intended to reduce the environmental impact to its minimum, shortening the design period, and lowering relevant costs.
Ecological footprint theory is an important method to measure sustainability and it has been widely applied in many fields [3], but the application is not yet mature in the field of architectural design. Ecological footprint theory is a quantitative study on the influence of the consumption of resources caused by human activity on the environment from the perspective of sustainability through analyzing all kinds of resources and assessing land area impact [4,5].
Most of the application fields of ecological footprint are used to assess concepts such as the economic system, energy utilization, tourism, diet structure, and more. Currently, the measurement of the ecological footprint as it relates to architecture is mostly concerned with a sustainability evaluation of a construction project. Yan Zhao [6] is the first scholar to use an ecological footprint and energy analysis to evaluate a building. Their article calculates the ecological footprint of the construction stage of a house. Zhe Yan [7] calculated the reduction of the ecological footprint through five key aspects—land saving, energy saving, water saving, material saving, and environmental protection)—and calculated a building’s ecological footprint from another perspective. Shuhe Wu [8,9] uses ecological footprint theory to estimate the ecological footprint of a building, analyzes its sustainable development status, and then uses the theory of energy analysis to evaluate the economic benefits. Nevertheless, there is a lack of research regarding the total ecological footprint on the whole life-cycle of a building for the design stage, construction stage, operation stage, and demolition stage in related research. Therefore, this paper uses the theory of energy ecological footprint to solve the total ecological footprint of the whole life-cycle of rural housing in Wafangdian City and in Liaoyang City. The analysis is intended to evaluate the influence of the village and town housing to the natural environment and the sustainable development of the rural houses.
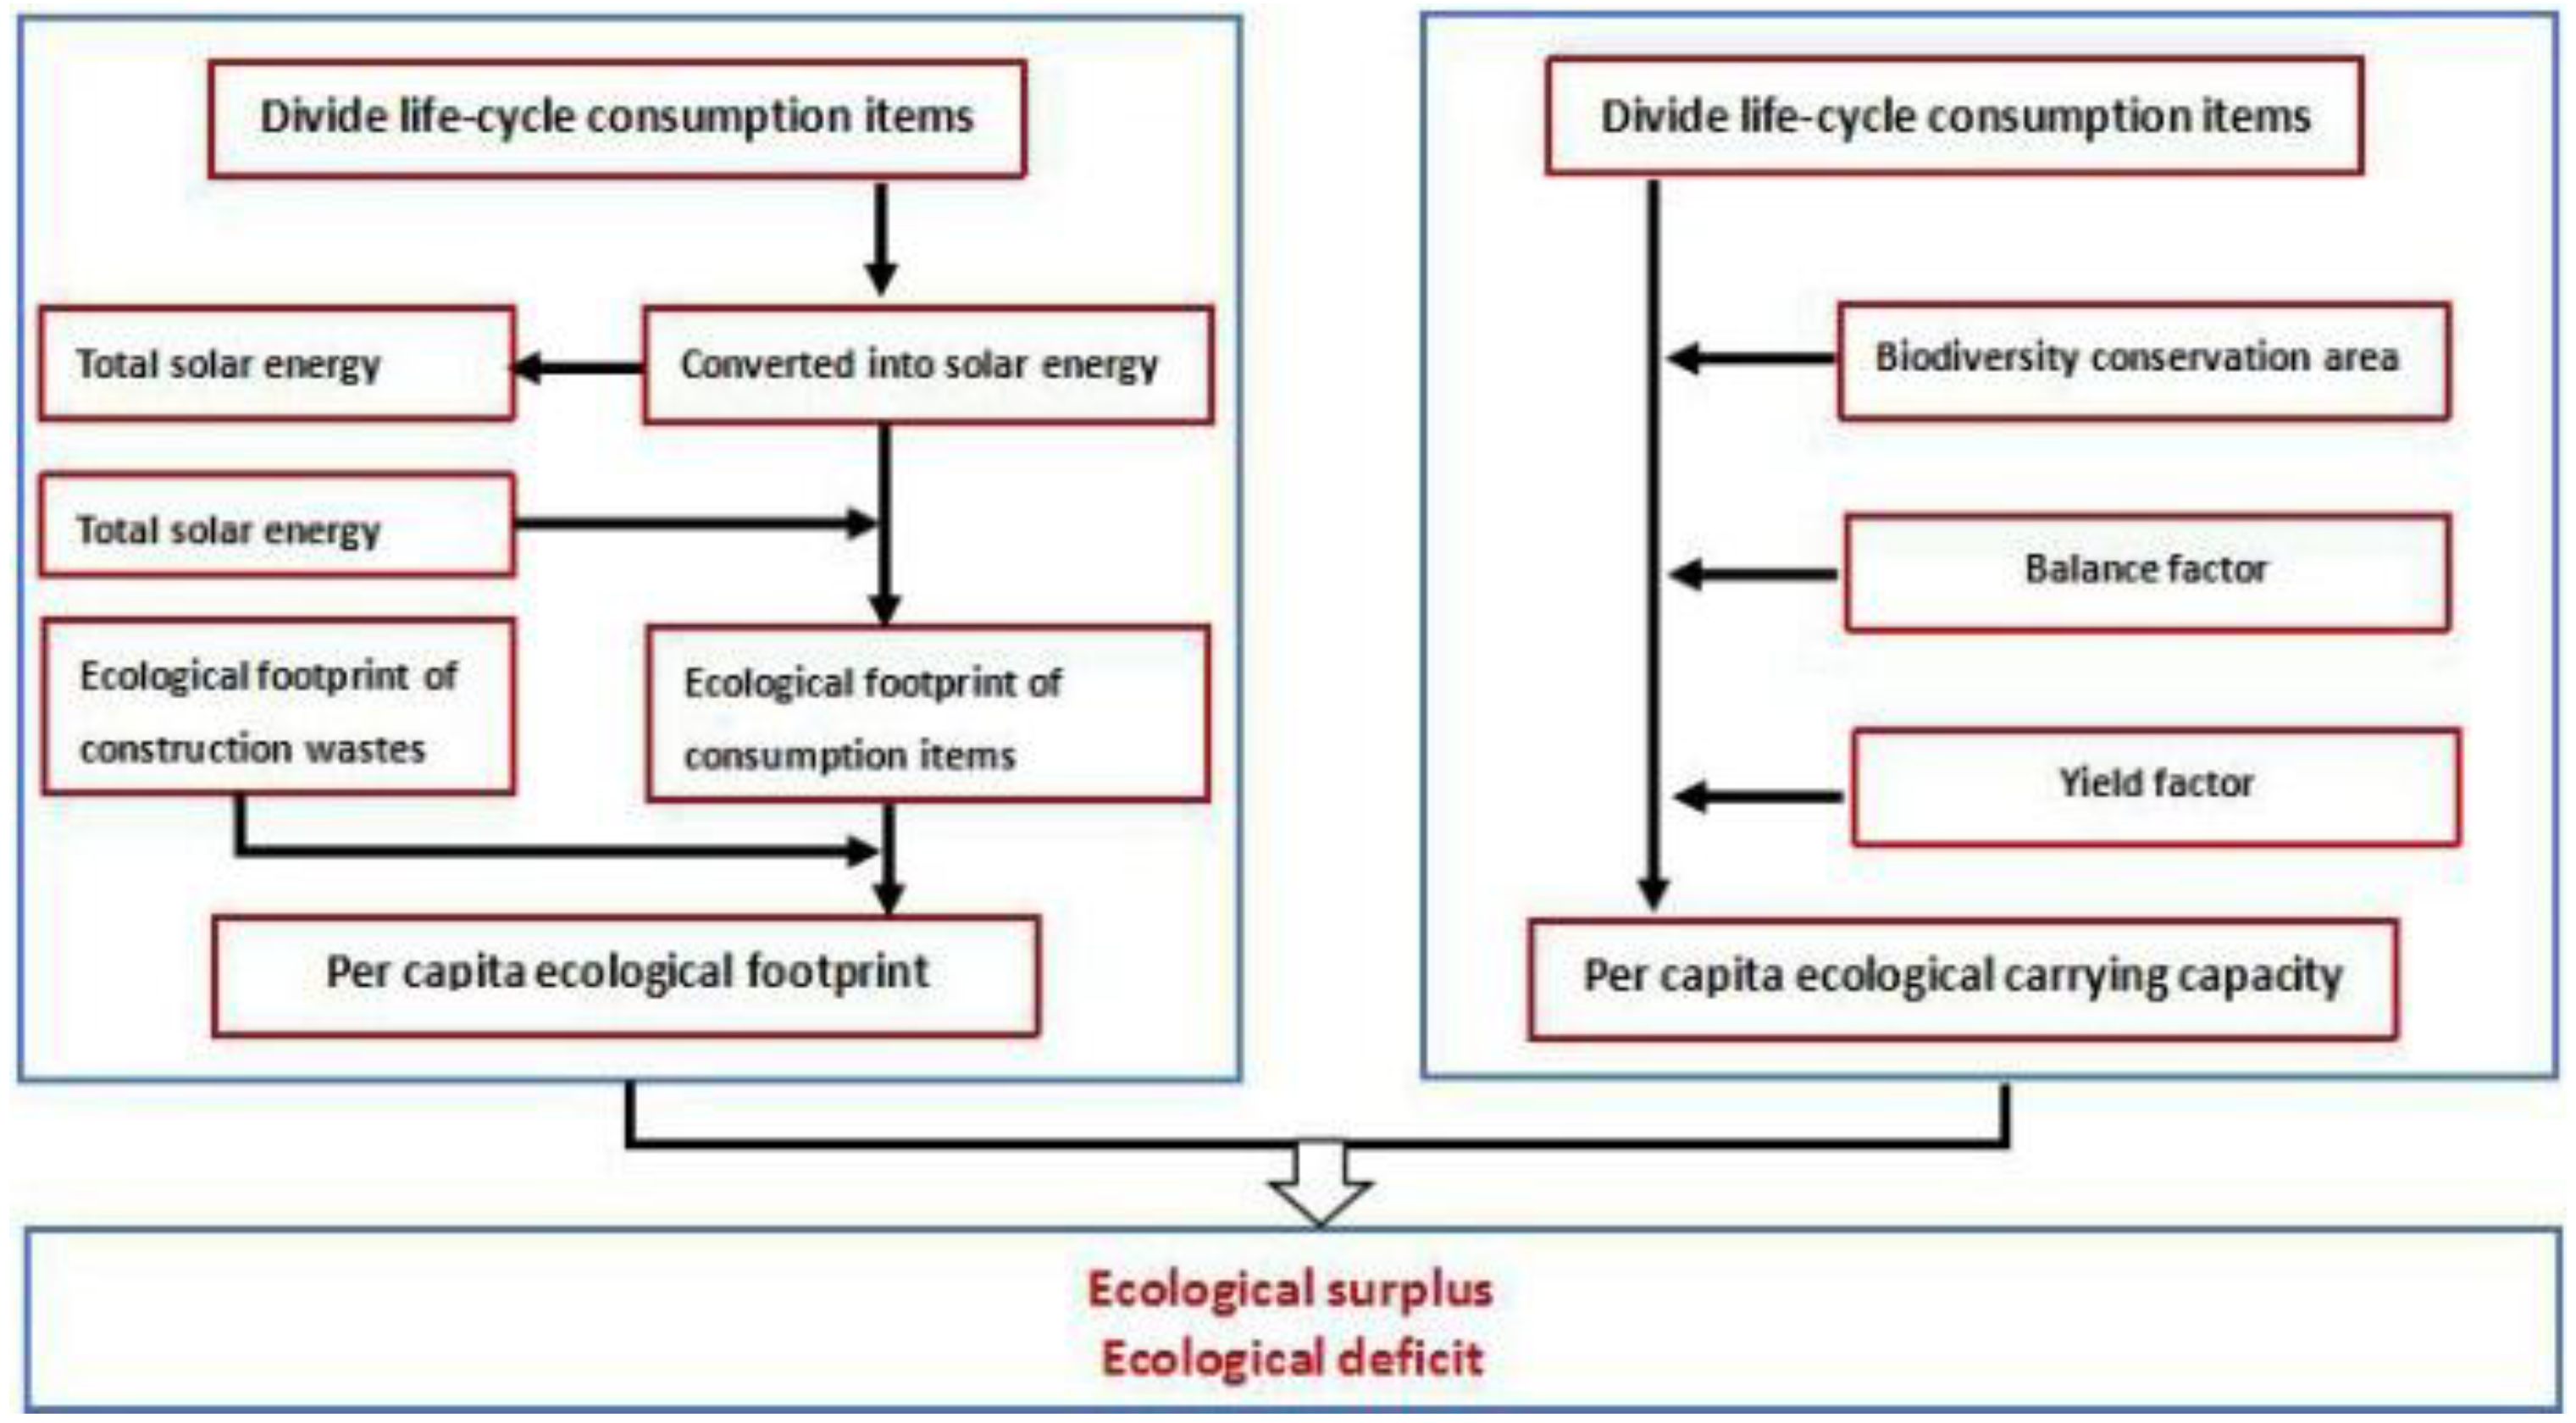
Through comparing the ecological footprint of the buildings with their ecological carrying capacity, one can know the sustainability degree of the building: whether the building is in a state of ecological surplus or ecological deficit. A life-cycle framework of the ecological footprint model is shown in Figure 1. When the ecological footprint of a region is greater than its ecological carrying capacity, the region has an ecological deficit and is in a state of unsustainable development. When the ecological footprint is less than the ecological carrying capacity, the region appears to have an ecological surplus and is in a sustainable development state.
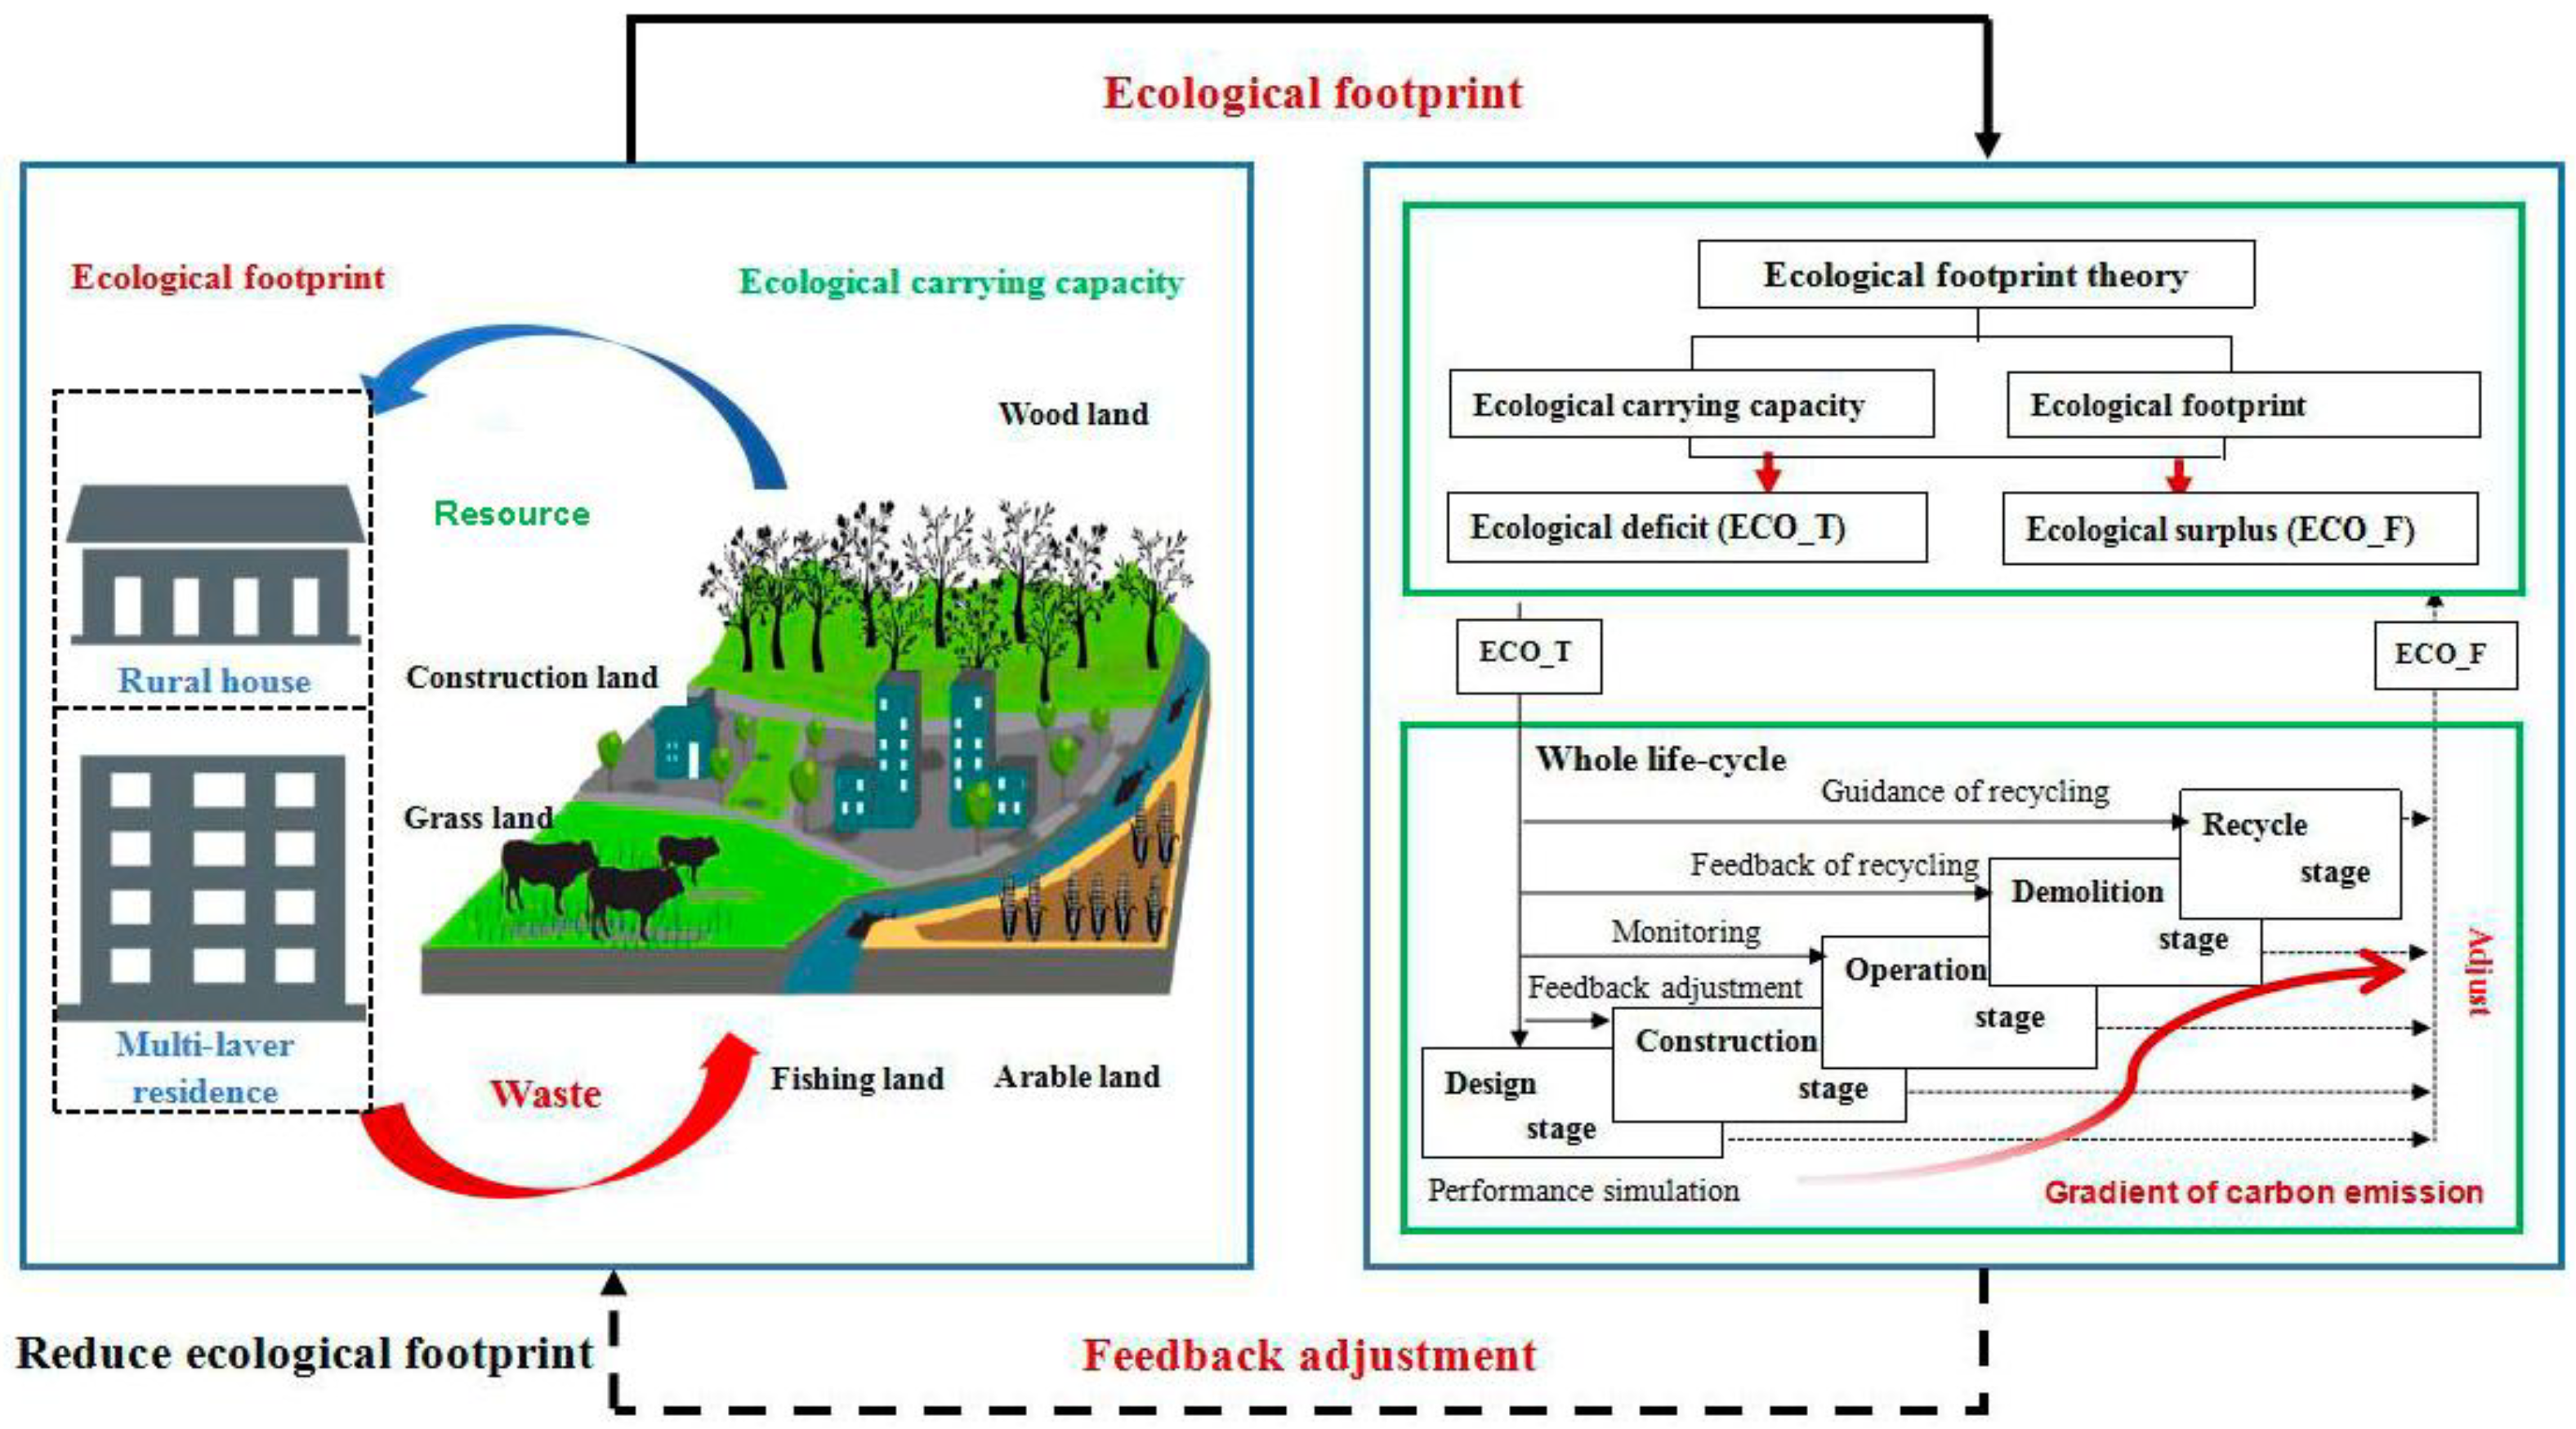
This paper uses an ecological footprint analysis method based on improved energy theory to analyze the impact on the ecological carrying capacity during the building of whole life-cycle residences from the perspective of sustainable development. As shown in Figure 2, by calculating the ecological carrying capacity and comparing it to the ecological footprint in the design, construction, operation, demolition, and recycle stages, the pressure of the building’s life-cycle on nature can be obtained. As a result, the design strategies that increase the ecological surplus in each stage and contribute to sustainability can be analyzed over the course of the building’s entire life. Current research on a building’s ecological footprint is confined to incorporating the ecological footprint produced during the construction period into the analysis model for calculation. This paper, however, comprehensively analyzes the building’s ecological footprint in various stages from the perspective of building for the whole life-cycle, to provide a convenient tool for the quantitative evaluation of a green building scenario.
2. The Theory of Ecological Footprint
2.1. Contents of Ecological Footprint
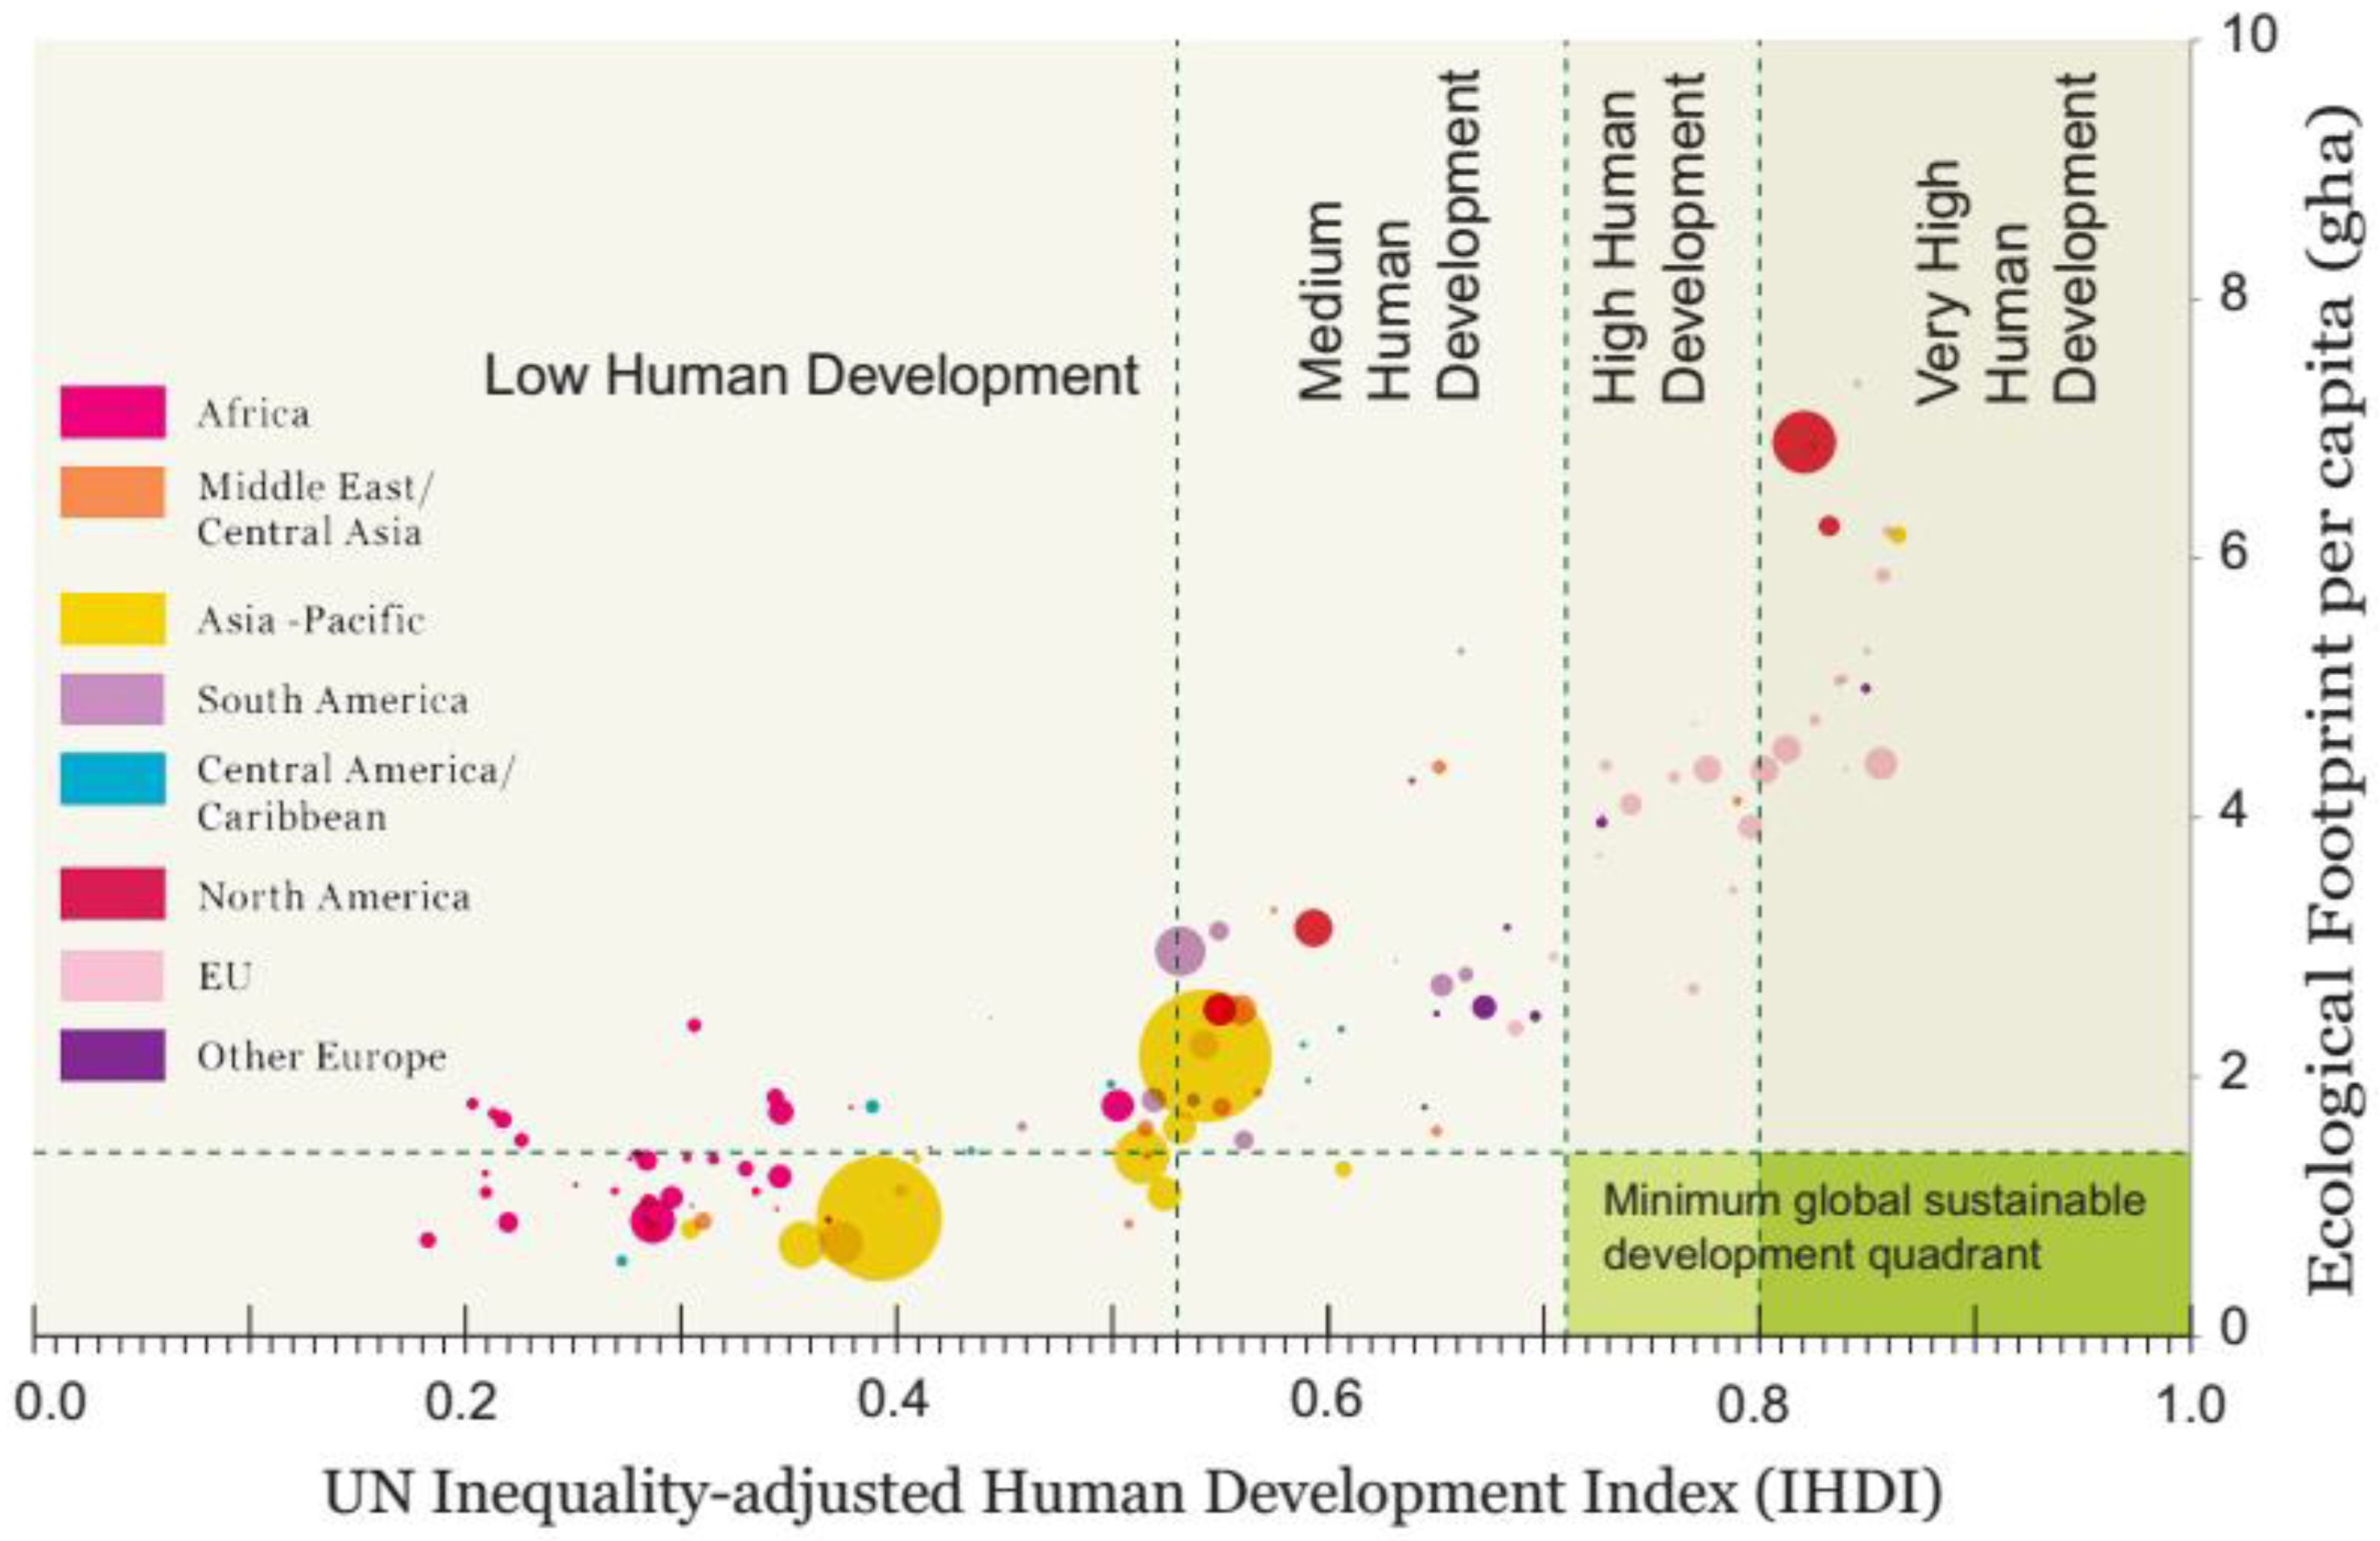
Ecological footprint is defined as the areas of biologically productive land and water required to produce the resources to satisfy the consumption of a given population or economy and to assimilate the waste generated by the population. The development and improvement of living standards are partly related to the growing consumption of ecological services: the high human development in developed countries has been achieved at the expense of a high ecological footprint, so decoupling and reversing this relationship is a key global challenge. The challenge for countries in the bottom-left sector is to significantly increase their inequality-adjusted Human Development Index (IHDI) (Low Human Development Index) without significantly increasing their ecological footprint while, for countries in the upper-right sector having high IHDI, the goal is to reduce their footprints (Figure 3).
2.2. Basis of Ecological Footprint Evaluation
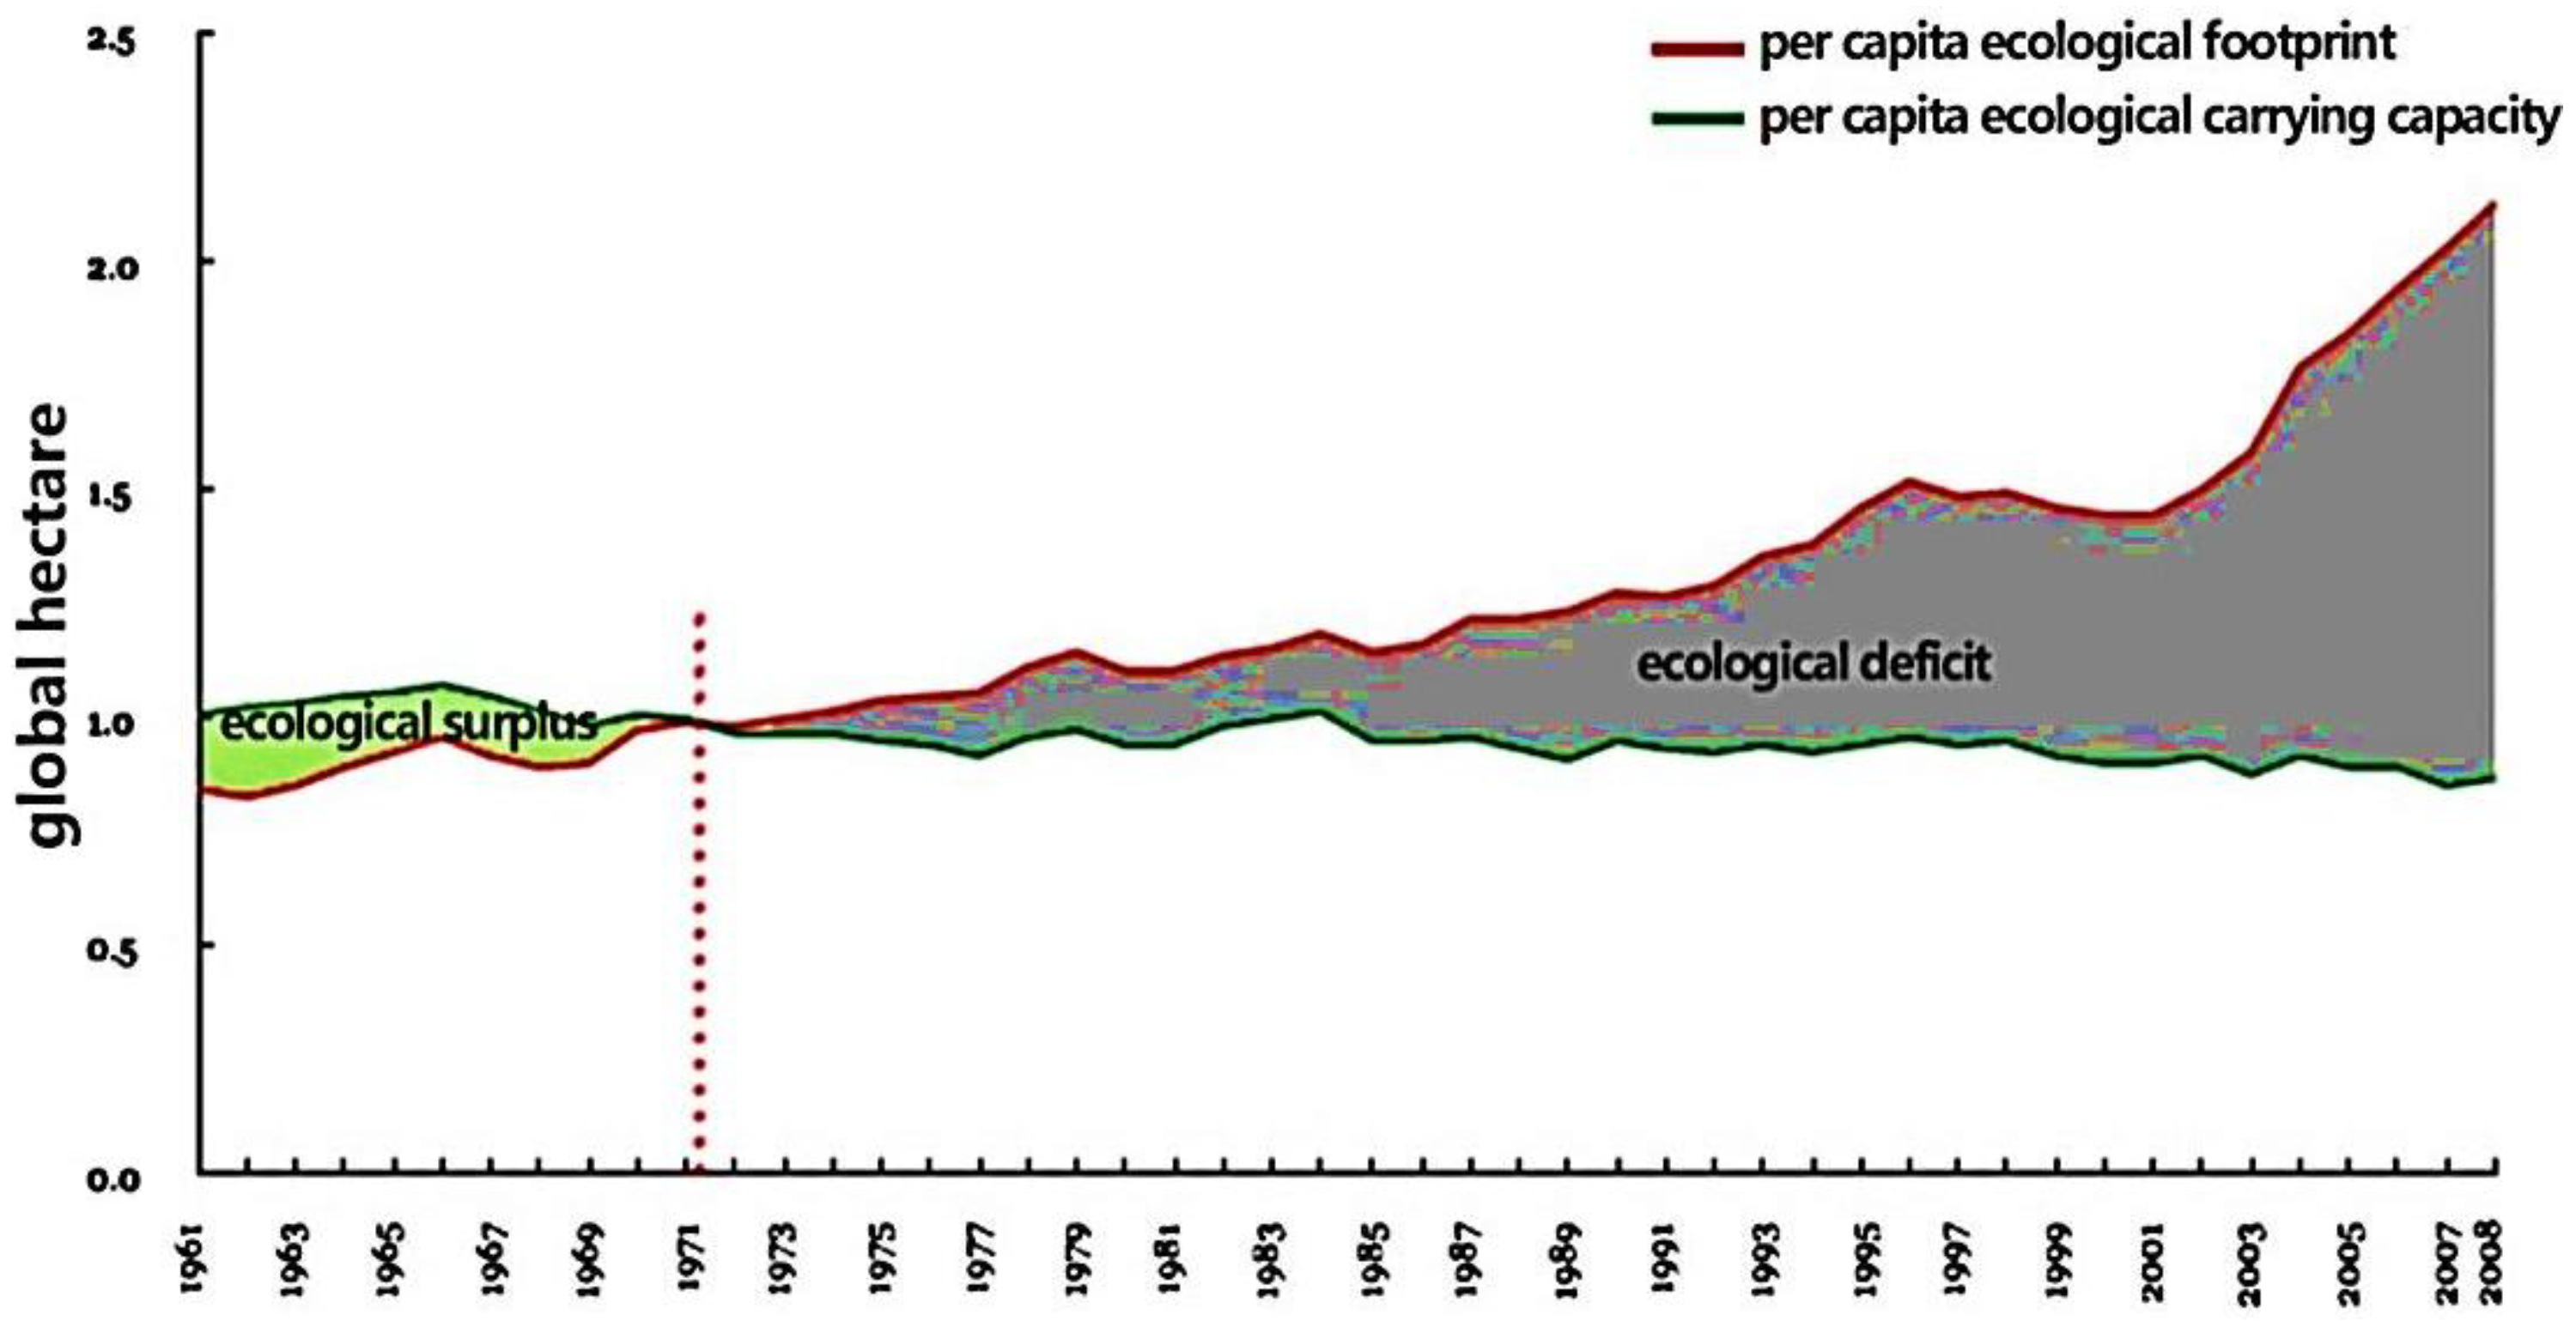
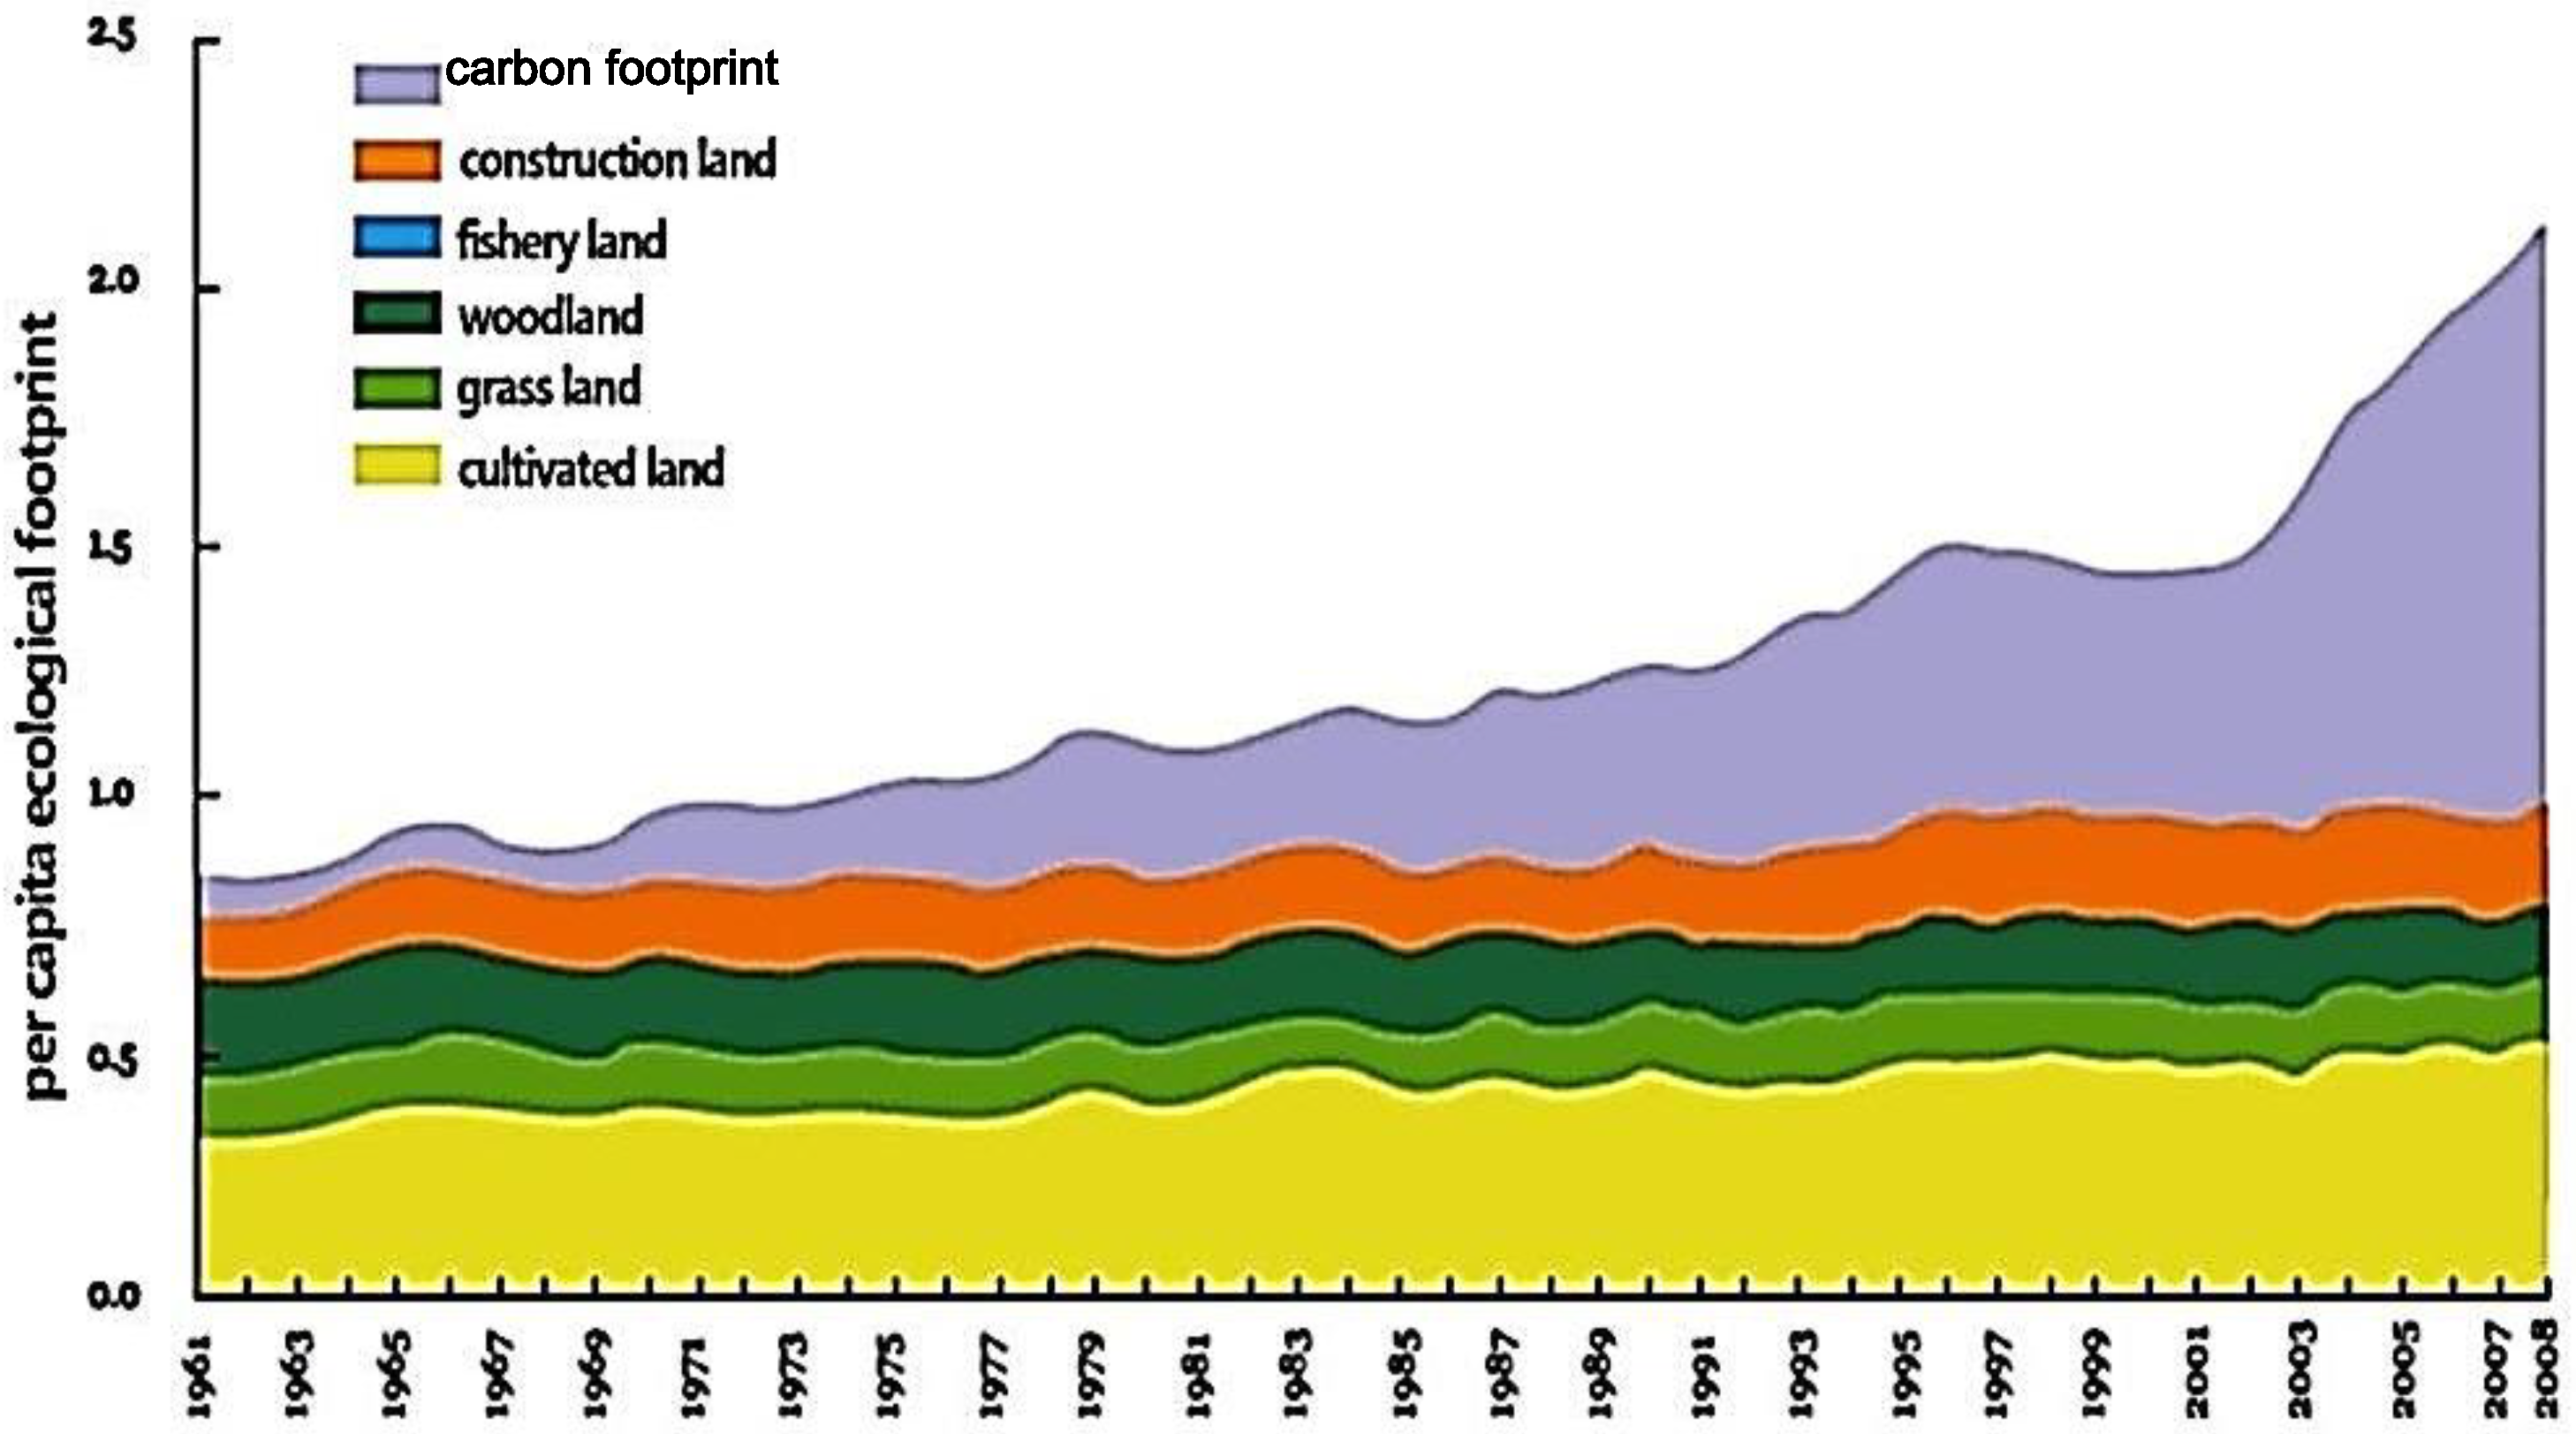
The Earth’s total ecological footprint already surpassed the ecological carrying capacity in the 1980s, and the ecological deficit has been growing continuously since. The report “China Ecological Footprint Report 2012” released by the World Wildlife Fund (WWF) pointed out that, although the per capita ecological footprint is below the global average, the Chinese ecological footprint is still the largest in the world. The per capita ecological footprint is about twice the per capita ecological carrying capacity. Figure 4 and Figure 5 show the main reason for that is the rapid growth of the carbon footprint due to energy consumption and the waste of resources. The total ecological footprint of buildings has been increasing and the per capita ecological footprint is over 0.91 ghm2/cap of the per capita of buildings in the world, with rapid urban construction still occurring in China. Therefore, it is important to reduce energy consumption and build green buildings with more sustainability to reduce the ecological footprint. Applying ecological footprint theory in the assessment of housing sustainability is necessary.
The core idea of green building is sustainability and the impact of a building on the natural environment. The bearing capacity of the earth should be considered in the whole operation cycle while building using the existing assessment systems, such as the LEED (Leadership in Energy and Environmental Design) system, and must be influenced by the knowledge and personal preferences of the assessments [12,13,14,15,16], which may incorporate methods that are subjective in nature. Moreover, such assessment systems are based on weight and expert decisions. These kinds of assessment systems are concerned with ecological strategies, such as energy-saving, water-saving, environment and culture, but in the harmonious coexistence of architecture and environment there is no clear expression.
The ecological footprint method is informed by the perspective of sustainable development, and it quantitatively studies the occupation and influence of various resource consumption caused by human activities Ecological footprint theory can make up for the uncertainty of the existing evaluation methods and the lack of assessment of environmental health. The implied cost to the ecological environment in life-cycle activities is well reflected by the ecological footprint. It can easily measure the required materials, activities, operating costs, consumed resources, waste, and pollution of each building by the corresponding natural costs. A building’s life-cycle has an impact on the environment. The calculation of the consumption items that correspond to each resource must be executed in order to build a comprehensive analysis of the impacts on the environment. The evaluation and research of residential sustainability can be accomplished using these basic data. Ecological footprint analysis can convert all kinds of resources into land areas to solve the problem of inconsistently measured units, which other assessment methods cannot solve.
3. Ecological Footprint Calculation Methods on a Rural House
3.1. Rural House Introduction
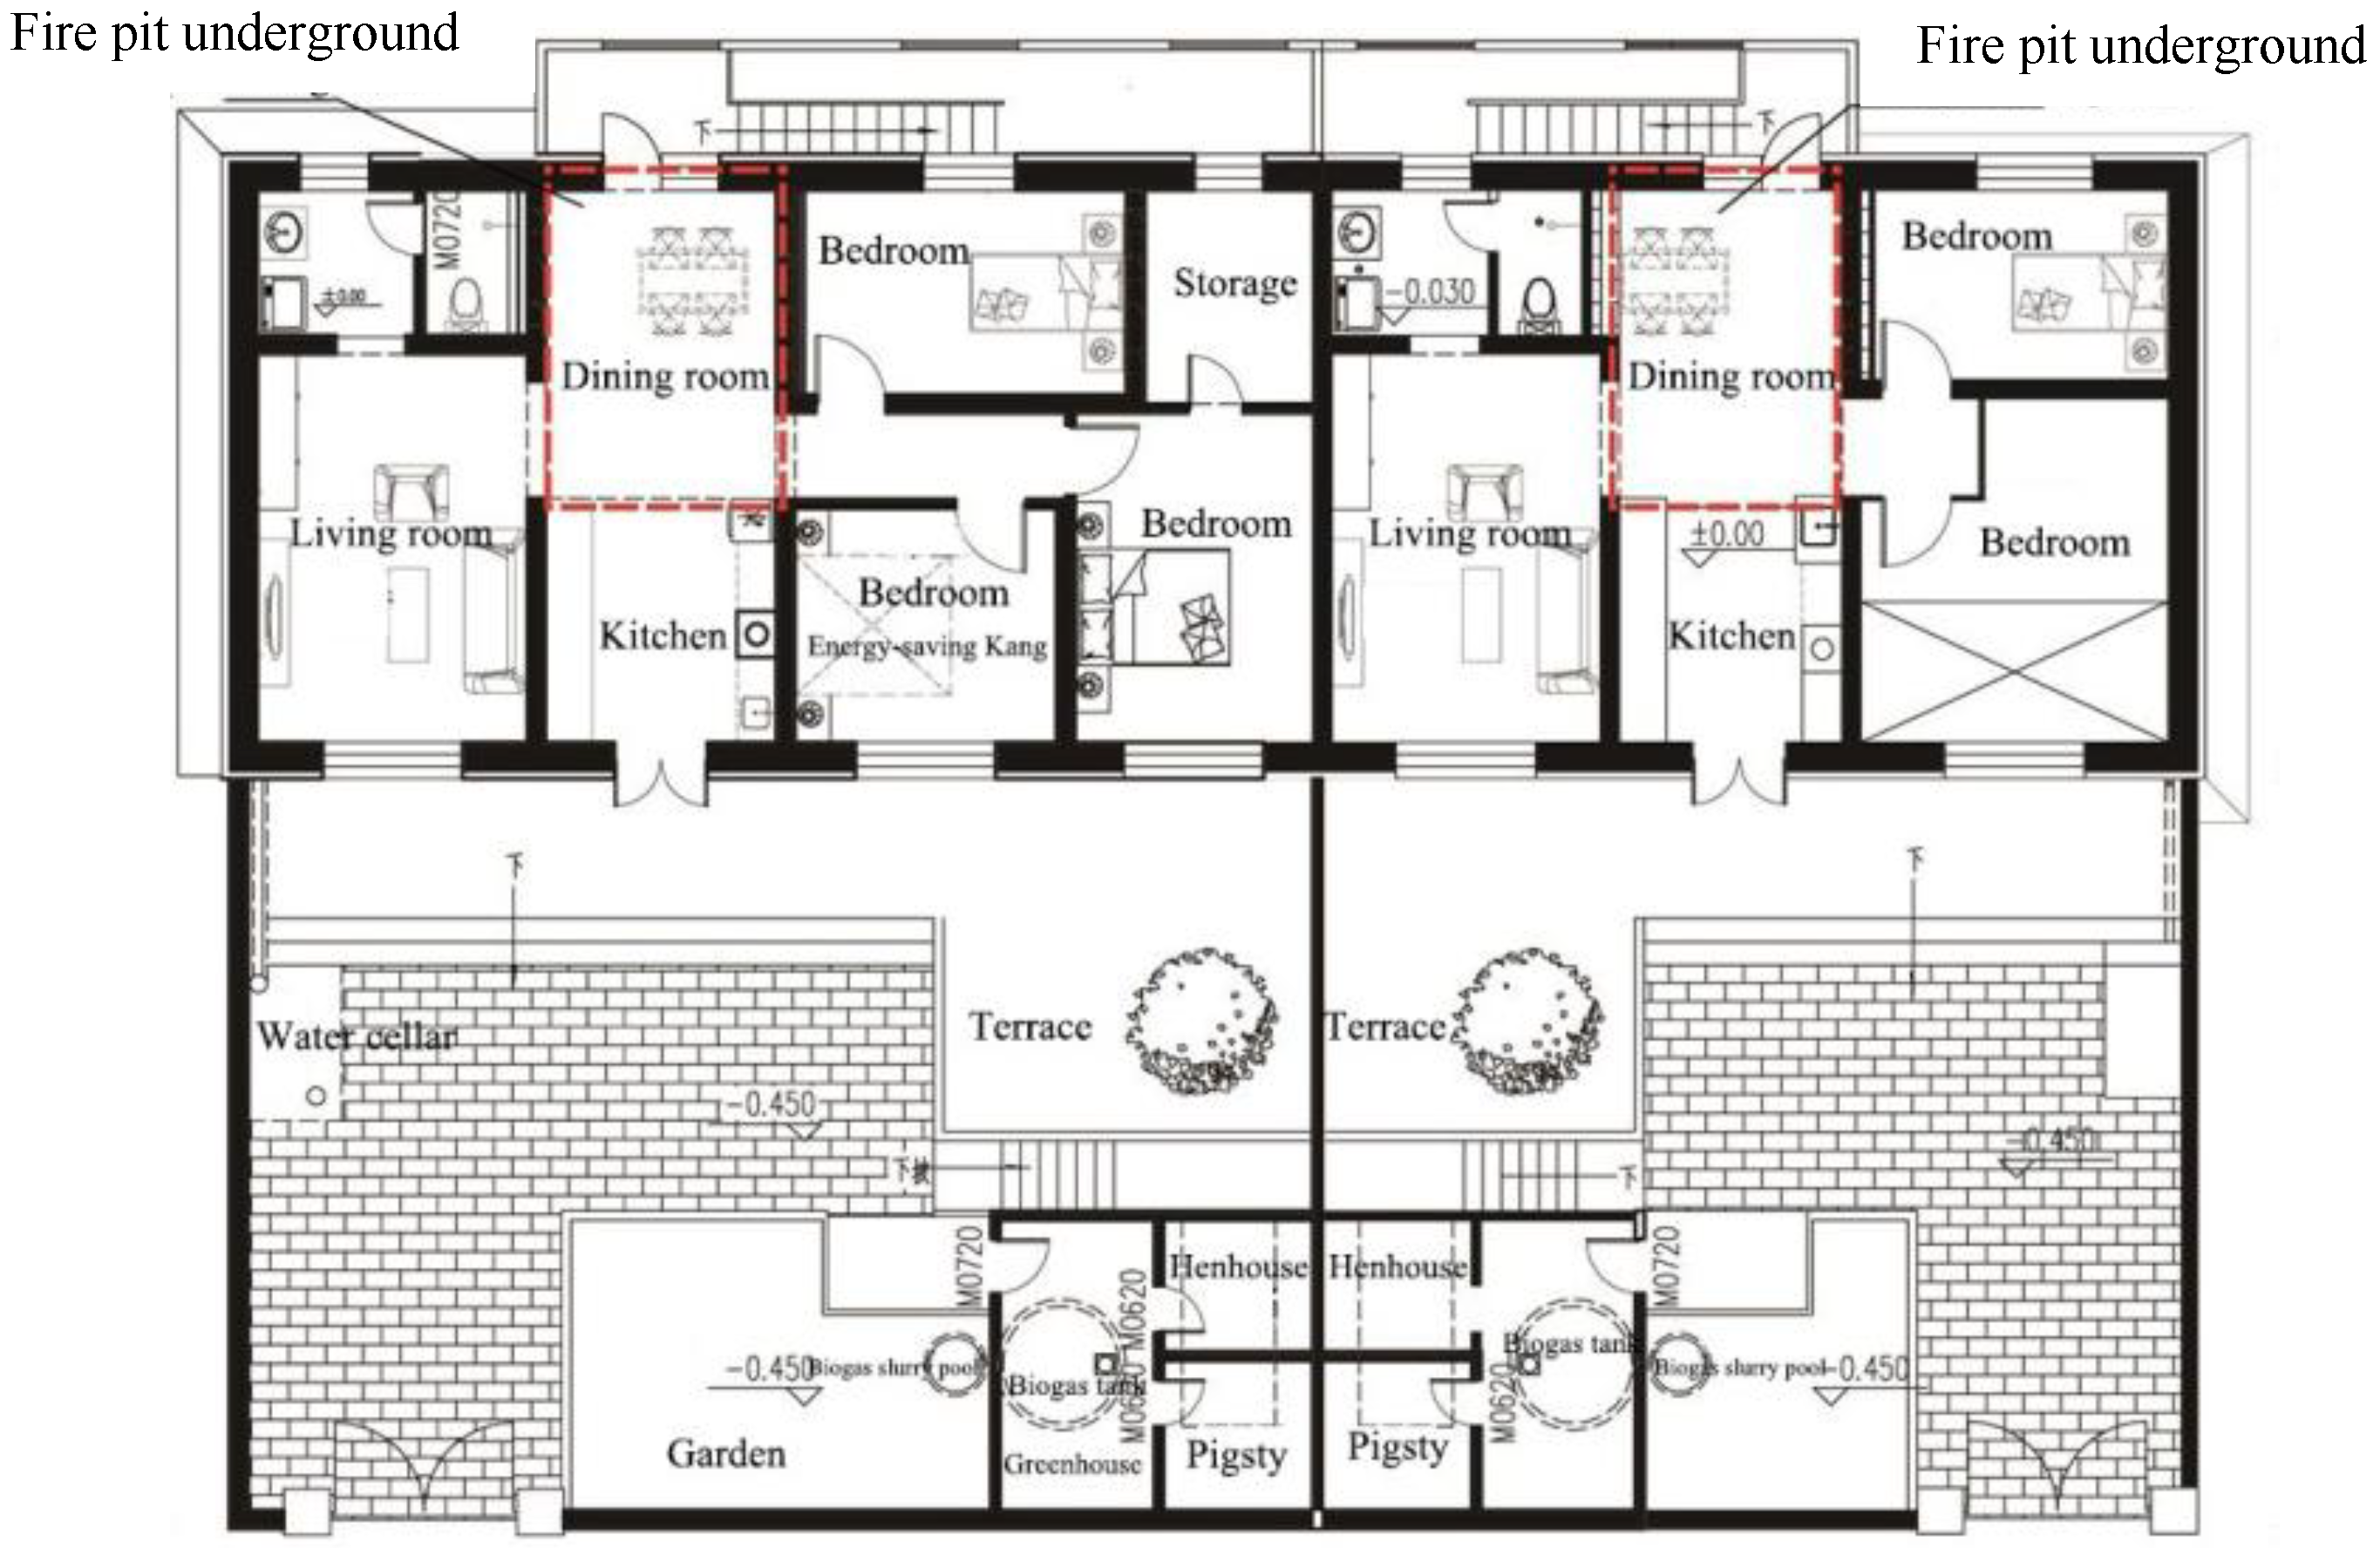
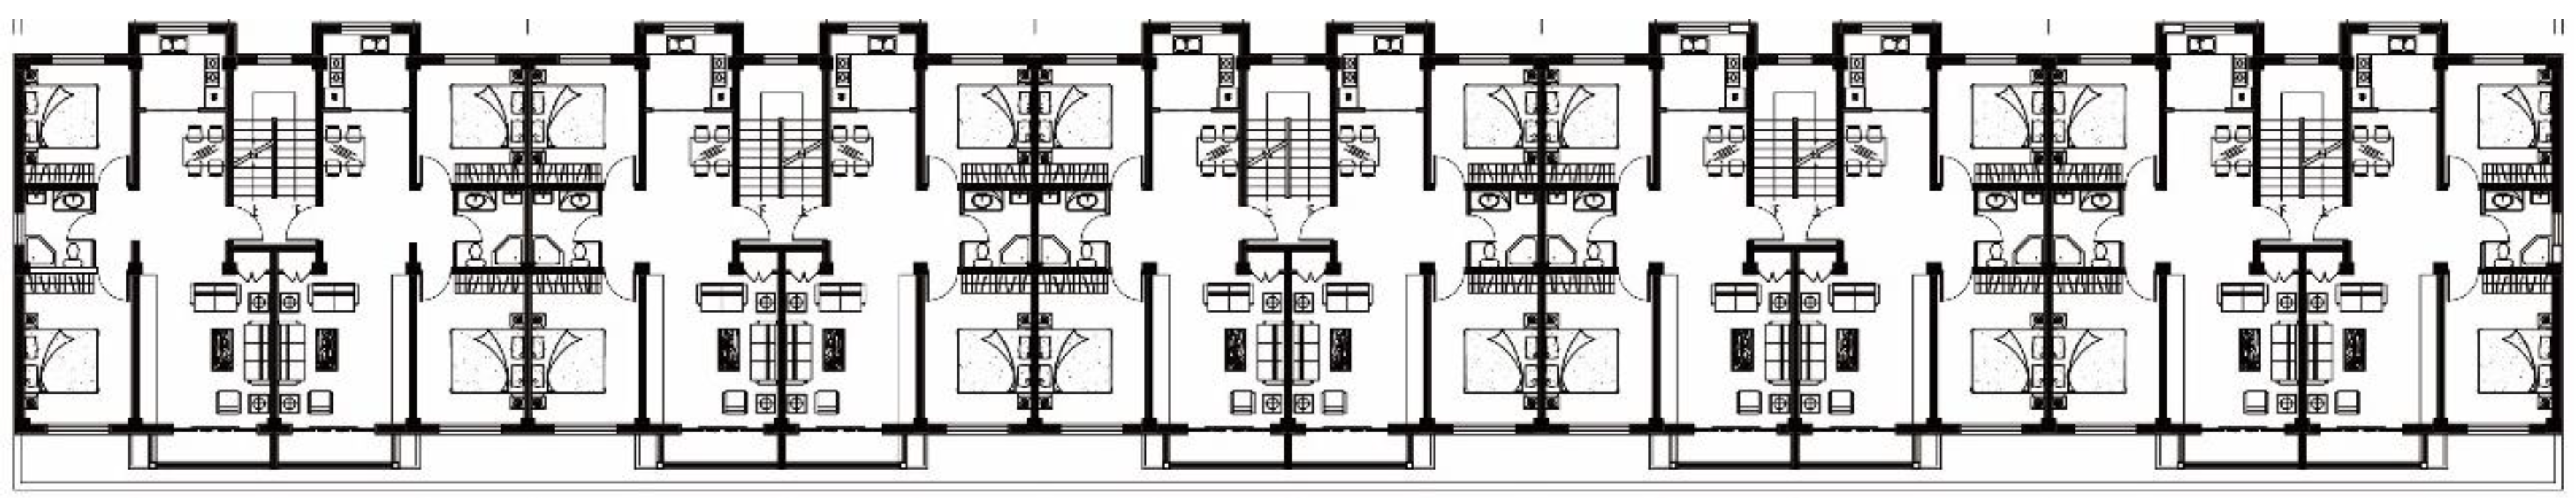
The rural two-family house is located in Wafangdian, Liaoning province, and covers an area of 474 m2. The house is single-floored with the height of 5.2 m. One of the families lives in the three-bedroom whose main building area is 103 m2; the other residence in the structure is four-bay with a building area of 128 m2. The rural house uses a fire pit, Kang, firewall, wall insulation, double glazing windows, and a series of passive design techniques combined with local traditional customs. The house plan (Figure 6) follows the form of the traditional rural house. When stepping into the house, there is a kitchen with a fire stove that acts as a heat resource for the master bedroom. Compared with a traditional rural house, this house adds a separate living room, dining room, and indoor toilets, conforming to a more modern lifestyle. The house types are simple and practical. Its north side contains the stairwell into the underground fuel tank. The terrain on the north compared to the south is highly different, so the north side of the residence is covered with soil to keep the room insulated from cold weather.
3.2. Ecological Footprint Model
Ecological footprint analysis is a method to study the consumption of resources and the life-support services of the Earth. The basic idea of this method is to transform those consumption activities that are necessary to maintain human life into a corresponding ecologically productive land area. Original data can be obtained from the construction budget books or statements. The ecological footprint can describe a building or buildings in a region based on specific resources or energy flow values, calculate the demands and pressures on the environment, and can be compared with the ecological carrying capacity [15,16,17]. Thus, the impact on the environment from the stages of design, construction, operation, and demolition can be directly reflected.
Full life-cycle theory, also known as “from cradle to grave” [18], refers to the process of the initial material acquisition, manufacture, operation, maintenance, and disposal in the entire ecological cycle. According to this theory, the life-cycle of the Wafangdian rural house can be divided into five stages: design, construction, operation, demolition, and recycling. According to the basic principles of the ecological footprint analysis, the resource consumption and the environmental pollution from the building’s life-cycle stages can be summed up into a variety of consumption items. Based on that, the consumption items can be converted respectively into biologically productive land areas. Concrete steps of the calculation model of the whole life-cycle ecological footprint of the rural house are as follows:
- (1)
- Estimating the consumption items in each stage of building for the whole life-cycle (including building materials, labor, machinery, and other energy consumptions).
- (2)
- Making uniform the dimensions of the various consumption items in this building and converting the consumption items into the corresponding solar energy value by using an energy conversion rate. Then summarize the various consumption items.
- (3)
- Collecting solar energy value to weight, then the total solar energy value of the rural house of 2.04 × 10¹⁸ sej can be drawn, with the result that the solar density of the rural house is: pj = total solar energy value/total building land areas = 4.3 × 10¹⁹ sej·hm−2.
- (4)
- Using solar density to convert the whole life-cycle consumption items into the corresponding ecological productive areas and make a summation. The calculation formula is:
Among them, EFr represents the ecological footprint of the consumption in each stage, measured in ghm2; ef represents the per capita ecological footprint, represented byghm2/cap; rj represents the land equalization factor j measured by ghm2/hm2, Ai represents the per capita ecological footprint of the i resource, represented by ghm2/cap; ci represents the per capita energy consumption of the i resource; pj is the energy density of building, measured by sej·hm−2.
There will be many by-products, such as harmful gas, dust, sewage, construction waste, and so on. These by-products should be regarded as waste in the ecological footprint. It is estimated that the building area per 1 m2 brings about 60 kg of construction waste in the construction process. Most of the construction waste in China is buried, and each stacked 1000 kg block of construction waste occupies about 0.067 m2. The total ecological footprint of the building waste in the construction and demolition stage is (EFw). The ecological footprint calculation formula [19,20] of the building waste is:
The whole life-cycle ecological footprint of the rural house (EF) is consisted to be the ecological footprint of the main consumption items (EFr) and the building wastes produced in the life-cycle (EFw), shown by EF = EFr + EFw [21].
4. Analysis and Discussion
4.1. Calculation Results
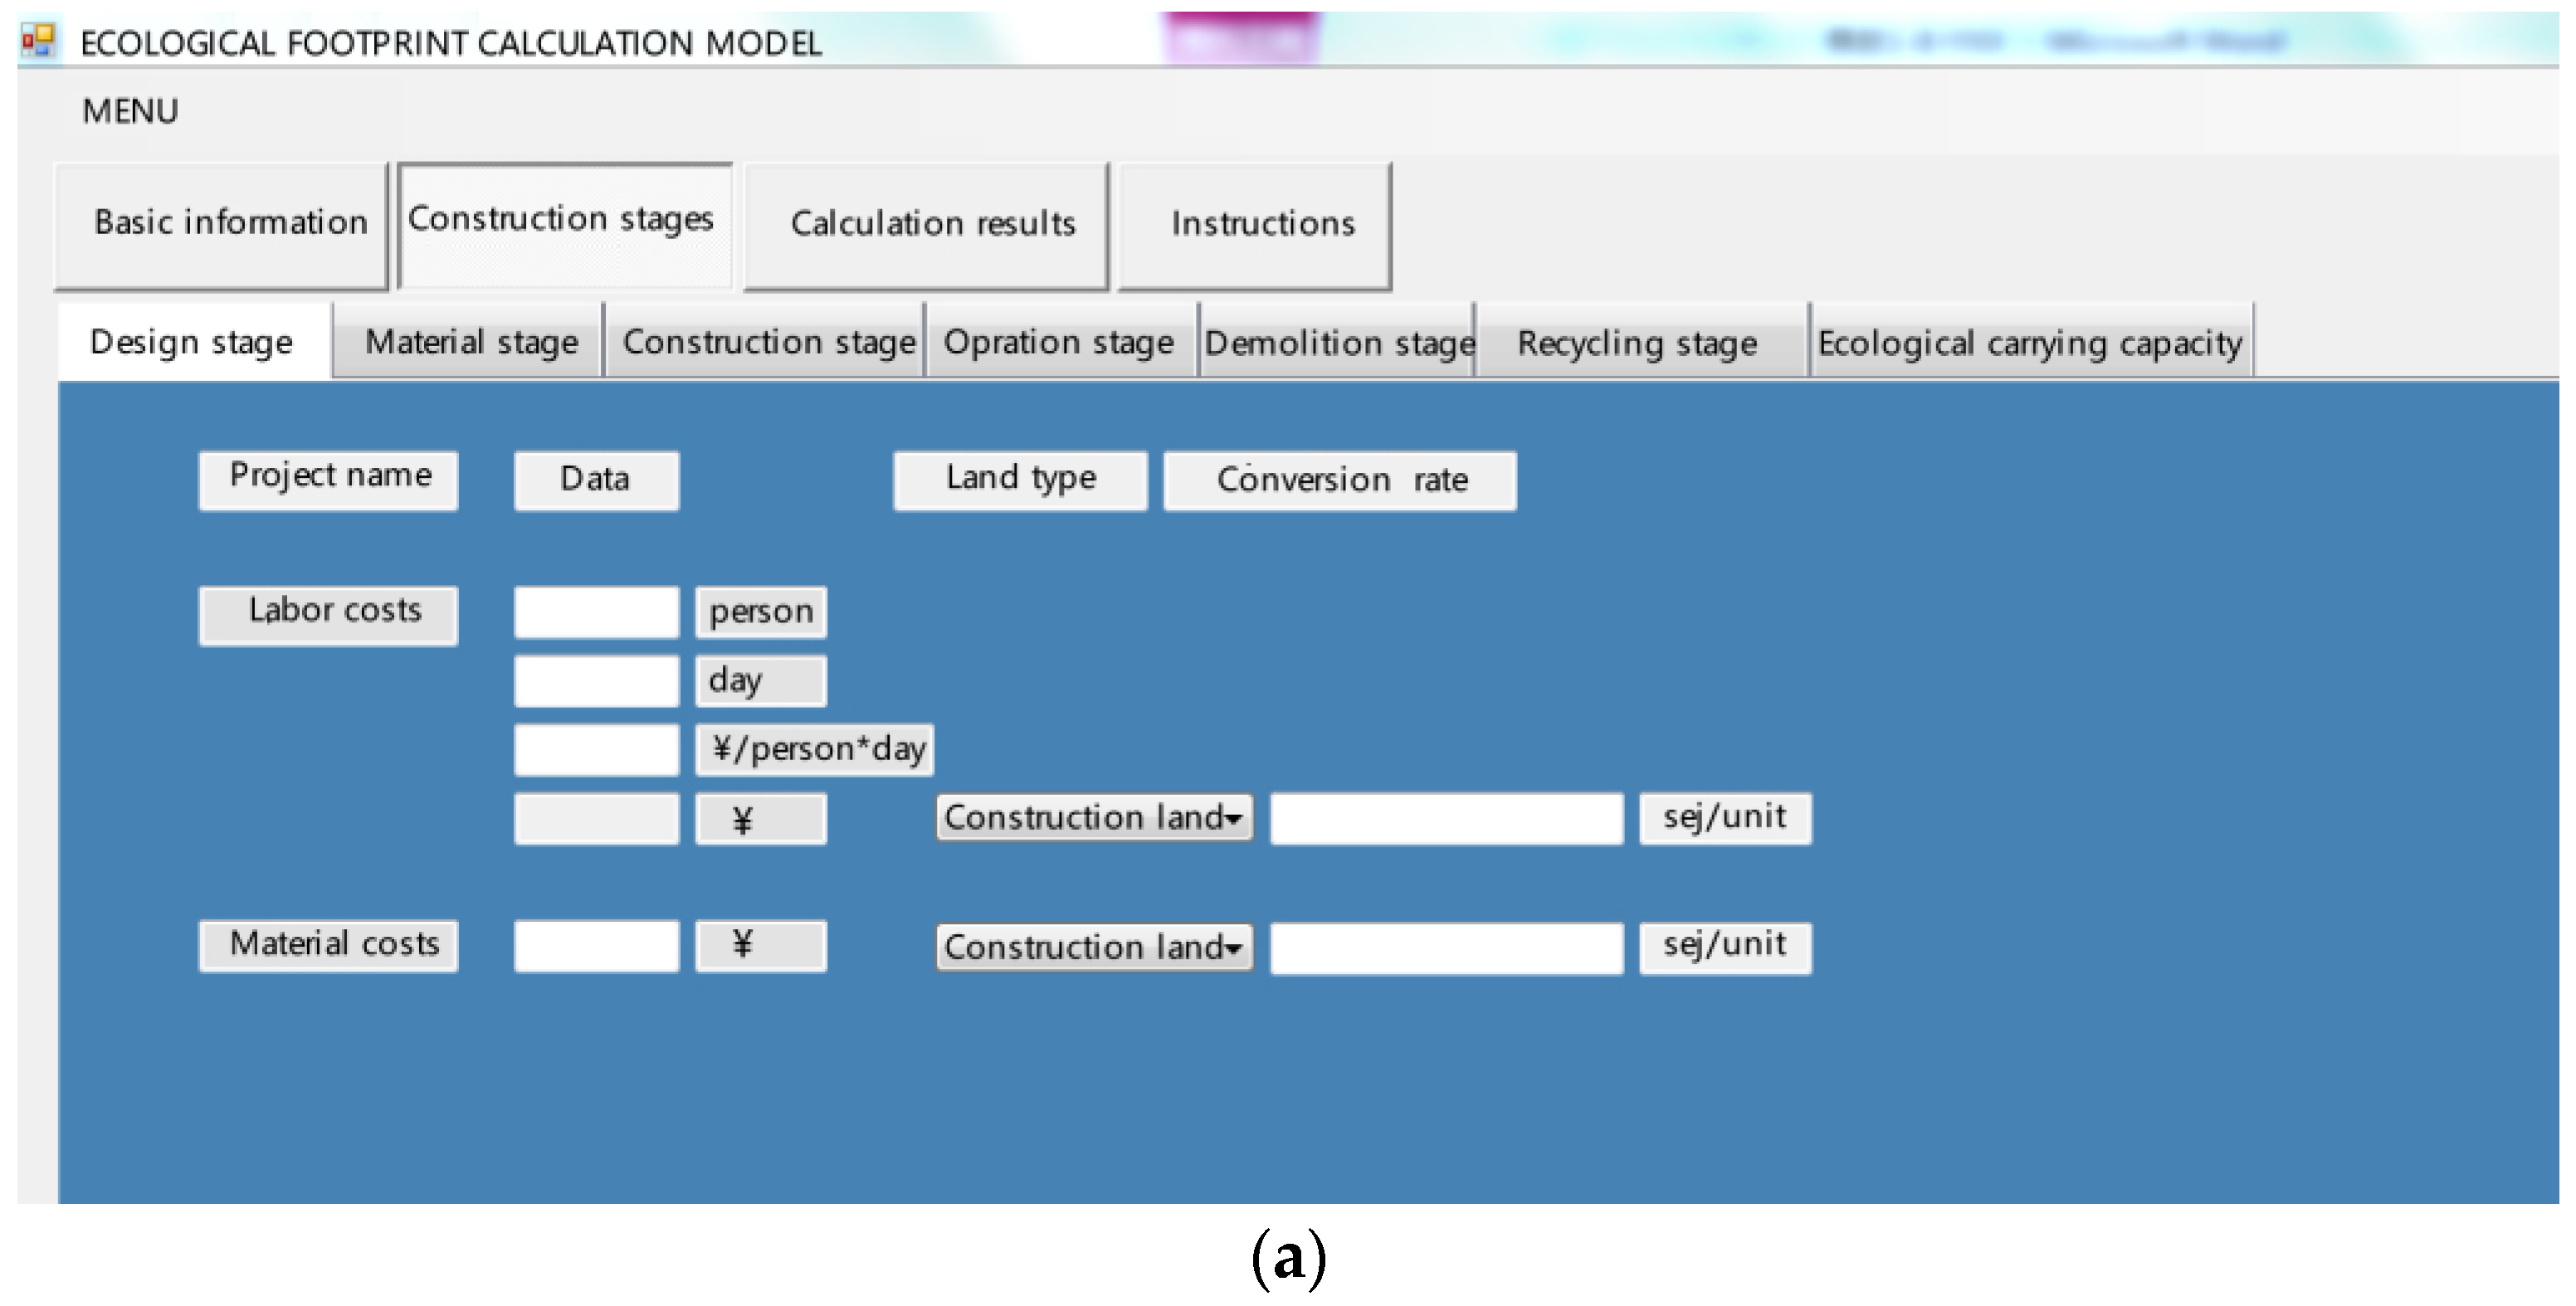
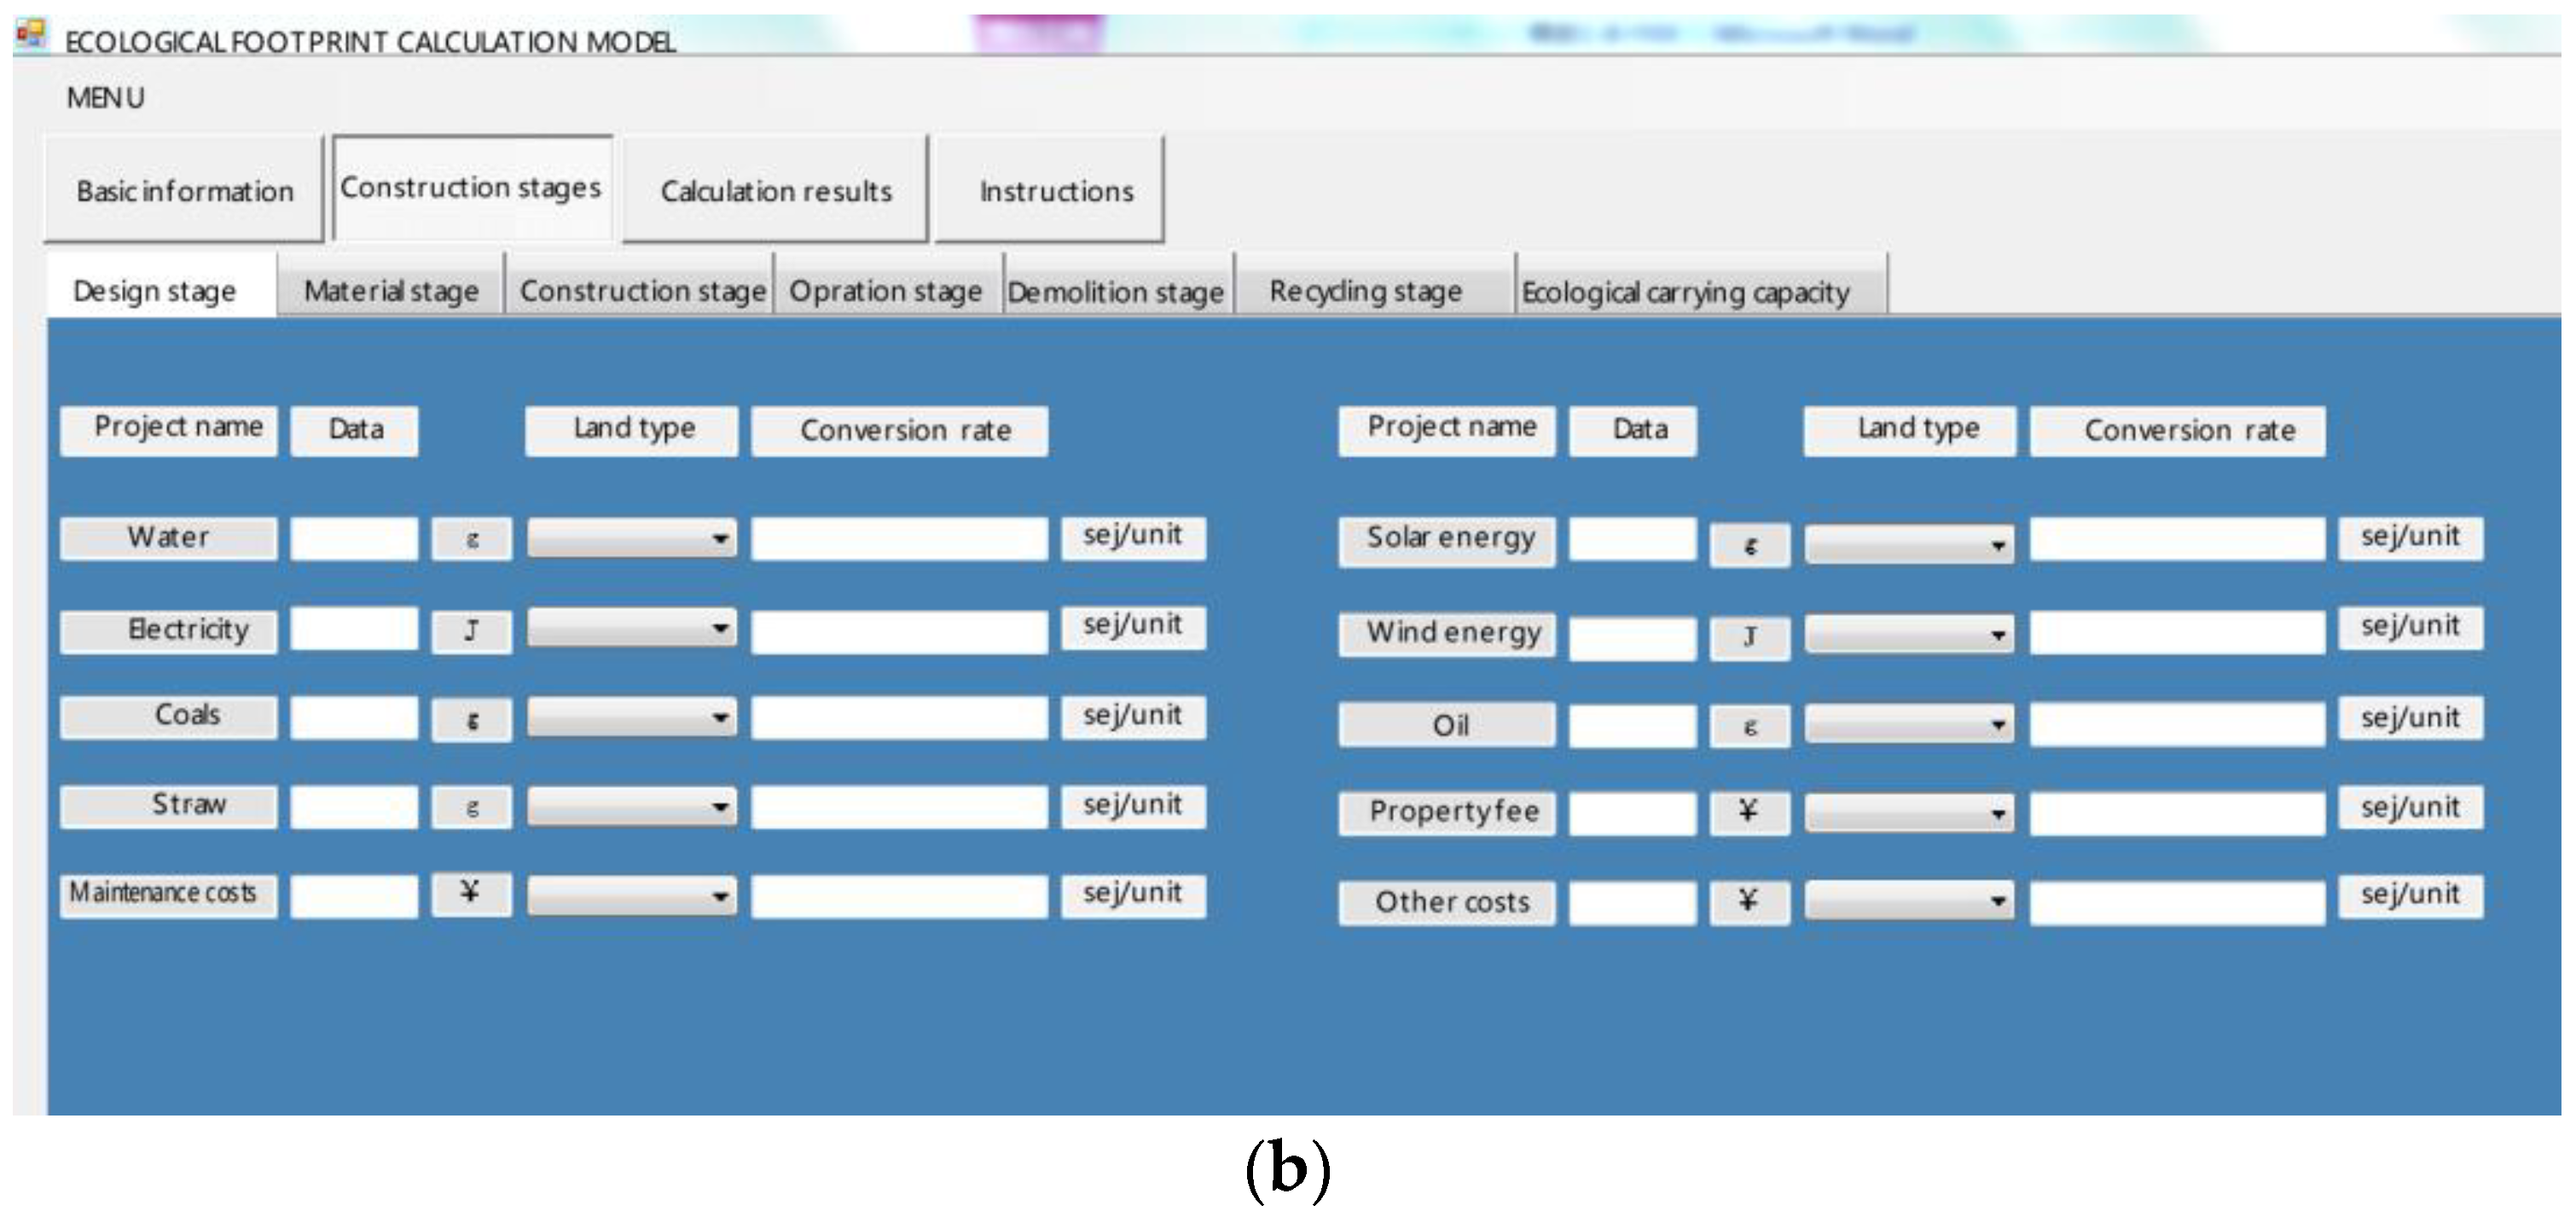
Based on the theories above, a program was written to calculate the whole life-cycle ecological footprint (Figure 7). Visual Studio is used for the data processing. The results can be easily calculated once the original data is entered. The interface of the program is shown in Figure 7:
The impact of the building on nature during the whole life-cycle and the contribution of sustainable development can be drawn by calculating the ecological carrying capacity and comparing it with the ecological footprint. Then, the design strategies that increase the ecological surplus in each stage and the contribution to sustainable development can be analyzed. The formula for calculating ecological carrying capacity is
Among them, represents the ecological carrying capacity (ghm2); N represents the total population (cap); ec represents the per capita ecological carrying capacity (ghm2/cap); represents the equilibrium factor of J land (ghm2/hm2); represents the annual average supply of J land (hm2); represents the yield factor of J land; J represents the land type of biological production. To calculate the ecological carrying capacity, 12% of the biodiversity conservation area should be subtracted in accordance with the proposal. The land type of the rural house is arable land, the equilibrium factor is 2.8, and the yield factor is 1.66. Reconsidering with 12% of the bioprotective ecological area, the total ecological carrying capacity is:
Ec1 = (1–12%) aj·rj·yj = 0.88 × 0.0474 × 2.8 × 1.66 = 0.194 ghm2
The family population is nine. The ecological footprint calculation results of the rural house are shown in Table 1.
4.2. Assessment of Sustainable Development
The index of the ecological footprint and ecological carrying capacity can reflect the degree of a sustainable development on the environment. When the ecological footprint is higher than the ecological carrying capacity, it presents the ecological deficit and the environmental unsustainability. Quite the reverse, when the ecological footprint is lower than the ecological carrying capacity, the ecological surplus is presented, and the environment is in a sustainable development state. The total ecological footprint of the rural house in this research is 0.091 ghm2, which is significantly lower than its ecological capacity, making the ecological surplus within the ecological footprint index 53%, thus it has higher sustainable level (Figure 8). According to these data, it can be determined that there is less impact on the local ecological environment during the whole life-cycle stages of the rural house. Therefore, the design strategy and related energy-saving technologies used in the rural house are worth being promoted from the viewpoint of sustainable development of the ecological environment.
4.3. Analysis on Rural House in Whole Life-Cycle
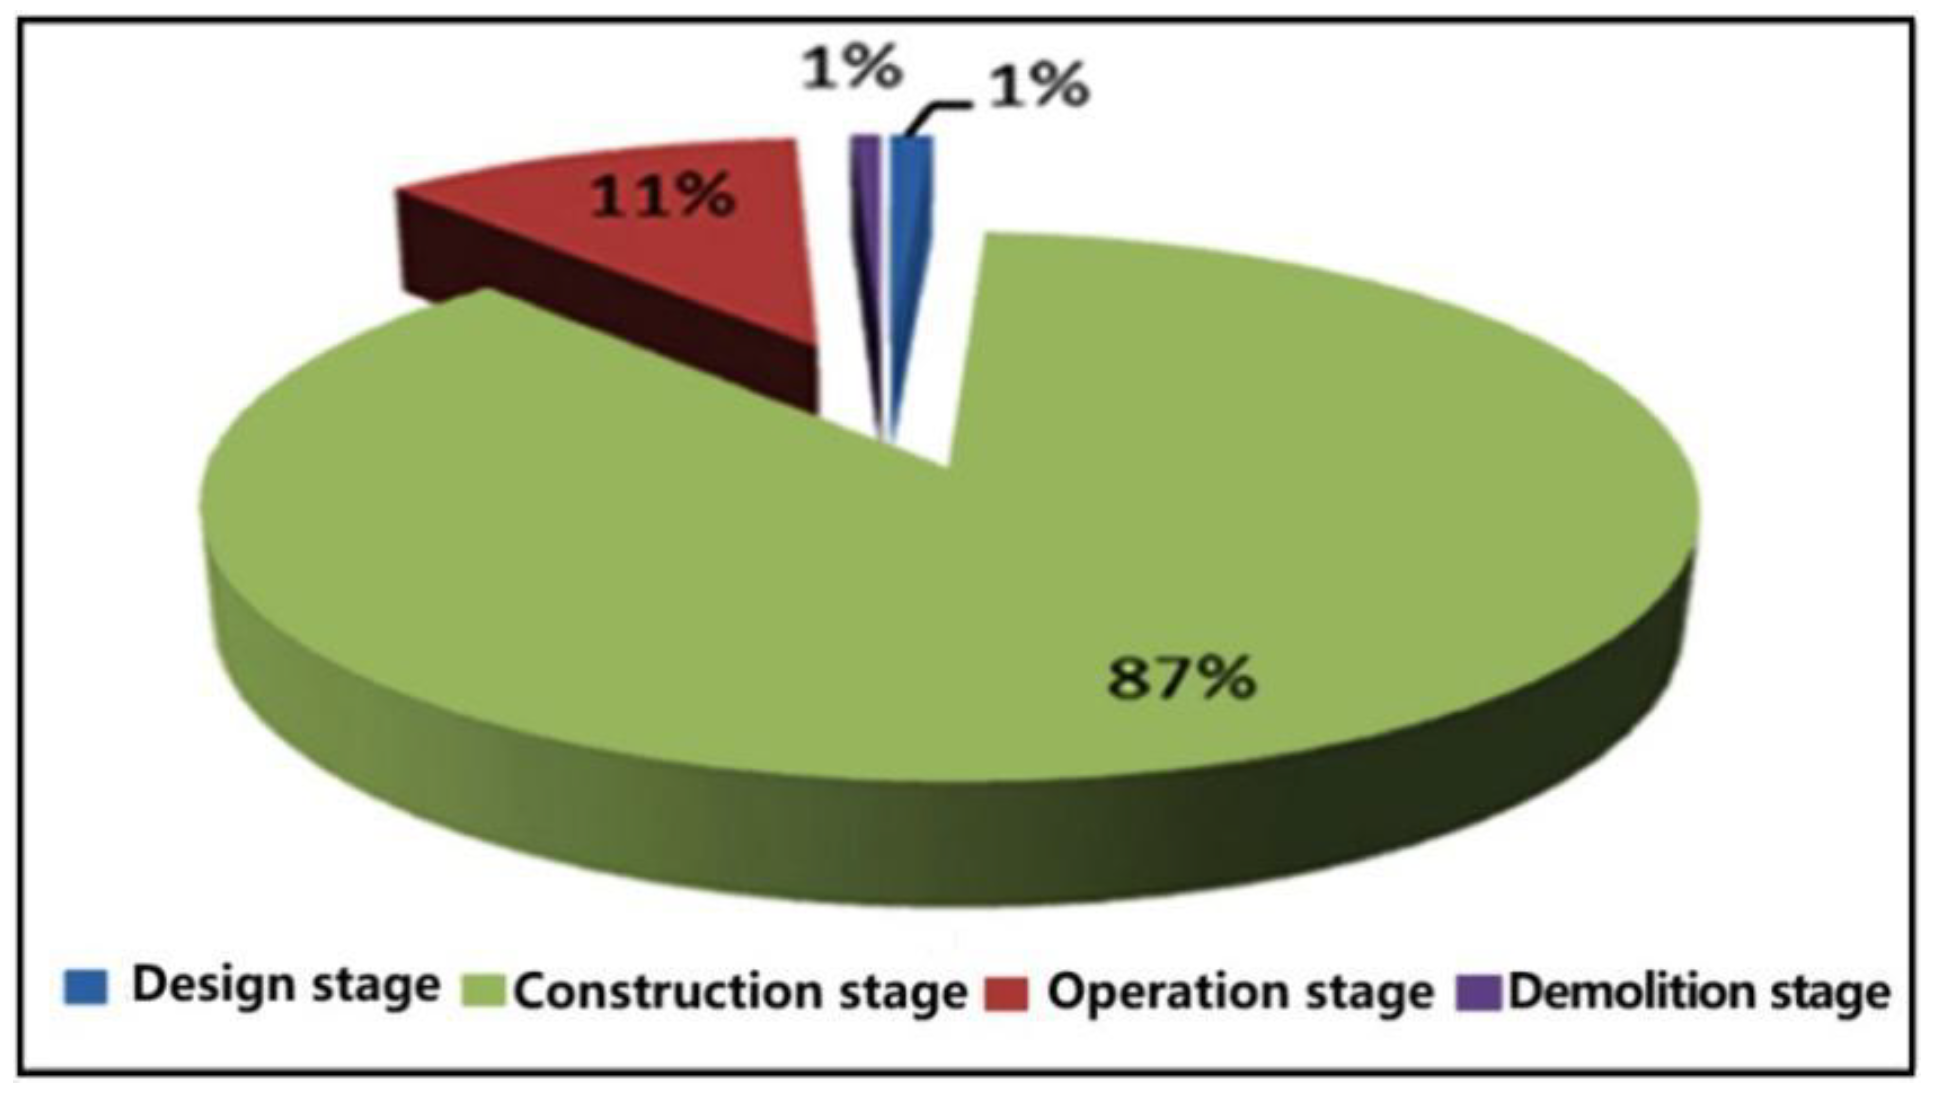
The whole life-cycle of the house is composed of five stages and each stage has a very important role. Figure 9 shows the proportion of the ecological footprint of the Wafangdian rural house in each stage. The house is currently in use and does not include the ecological footprint of the recycling stage. Since the recycling stage depends on the reusing method of the house after its demolition, the calculation results are uncertain. Therefore, Figure 9 does not include the recycling stage. It can be seen from the picture that the proportion of the ecological footprint of the construction stage is the largest, at approximately 87%. The proportion of the ecological footprint in the operation stage is roughly 11%, the design stage about 1%, and the demolition stage is in the region of 1%. Thus, the reduction of the ecological footprint during the construction stage and operation stage can effectively reduce the total ecological footprint of the whole life-cycle (Figure 9).
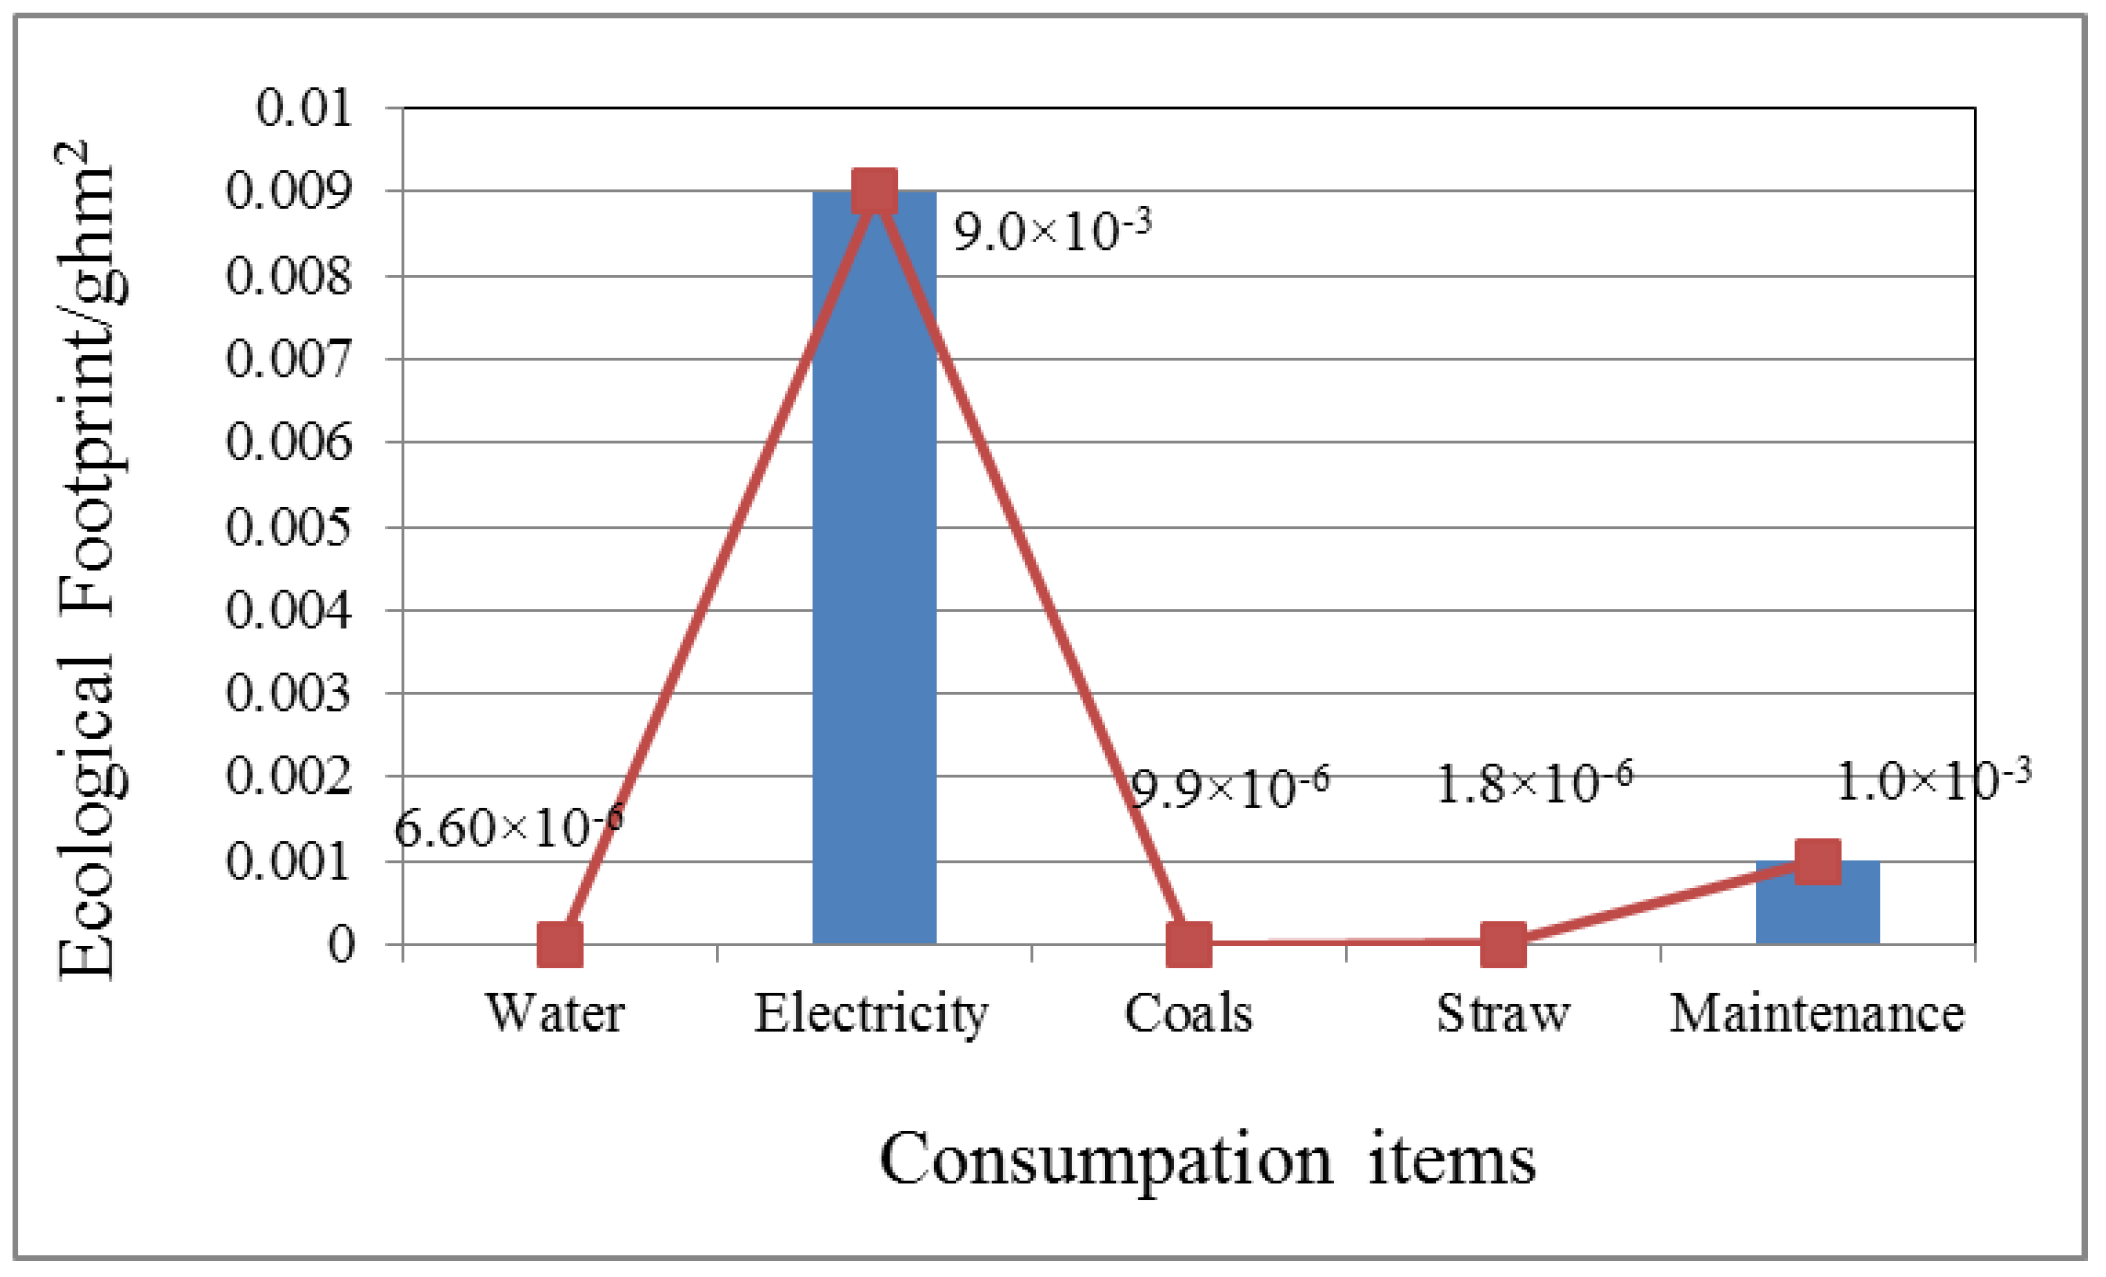
Reducing energy consumption and improving energy use efficiency are effective measures to reduce the ecological footprint of the operation stage. Figure 10 shows the ecological footprint of the main consumption items in the operation stage of the Wafangdian rural house. Electricity and other maintenance takes up a large proportion in the total ecological footprint during the operation stage. The ecological footprint of electricity consumption is about 0.009 ghm2, accounting for 89% of the total ecological footprint in the operation stage, while the ecological footprint of straw accounts for less than 1 percent of the total ecological footprint in the operation phase. Straw is mainly used as fuel for the fire pit and stoves, so the ecological footprint of the heating system is very low. The main components of electricity consumption include lighting, air conditioning and other daily household electrical appliances. Therefore, the ventilating and cooling measures should be considered for the design in northern China villages.
The rural house in Wafangdian uses passive technologies such as a fire pit, firewall, and a new stove Kang bed, which uses crop straws as fuel and effectively reduces the energy consumption during residential heating. Currently, most of the time the straw is directly burned in fields that are not effectively utilized. However, the farms of the Wafangdian make full use of this energy. Therefore, a fire pit and a new furnace are worth promoting in the northern rural areas.
The ecological footprint of demolition is mainly caused by the direct burial of the construction waste, which occupies a large amount of farmland. Reduction and recycling of construction waste can effectively reduce the ecological footprint during the demolition stage. Through reducing the occupancy of arable land by waste emissions, the environmental pollution can be reduced indirectly. The directly buried building waste is mainly brick and concrete—by choosing building materials that can be degraded by way of self-classification, or recyclable or reusable, the ecological footprint in the demolition stage could be significantly reduced or even brought to zero. Thus, the ecological footprint is reduced during the recycling phase.
4.4. Selection of Building Materials on a Rural House
The consumption of building material is the main part of the ecological footprint, so the choice of building material is critical for building operation during the whole life-cycle. The greater the amount of building materials, the greater the energy conversion rate, which leads to a greater ecological footprint. The energy conversion rate of the building materials mainly corresponds to the productivity required to produce these materials. The more complex the production processes of the building materials are, the greater the investment in human and material resources, which leads to a greater energy conversion rate. Bricks and concrete eco-footprints are a big part of the ecological footprint, with the second being the power ecological footprint of the construction phase. Among the various building materials, the energy conversion rate of concrete is the highest, followed by glass, steel, and brick, which are the main building materials in traditional house construction (Figure 11). Therefore, when choosing building materials, one should consider using building materials with a low-energy conversion rate, rather than a high-energy conversion rate, to reduce the ecological footprint of the rural house.
5. Comparison with Multi-Level Residence
The advantages and the disadvantages of the rural house and the multi-layer residence are studied in depth, as well as favorable design strategies in the urban house, are compared and analyzed. Furthermore, how to introduce the modern life style to rural areas while reducing energy to provide guidance for designing low-carbon rural houses is also studied.
5.1. Calculation of Ecological Footprint of Multi-Level Residence
The multi-layer residence chosen in this article is located in the Liaohua chemical industrial park of Liaoyang. It is a 6-level concrete structure building with a total land area of 5250 m2, construction area of 5613.54 m2, 20.44 m in height, 11.84 m in depth, and 74.4 m in length (Figure 12). Its energy saving rate was 65% with routine energy-saving measures such as an exterior insulation system and double glazing.
Calculating the whole life-cycle (design, construction, operation, and demolition in four stages) the ecological footprint of the multi-layer residence was based on a run time of 50 years. The calculation process of the whole life-cycle ecological footprint of the multi-layer residence is consistent with the rural house. The population of the multi-layer building is 210. The measured data and the results of the whole life-cycle ecological footprint of the multi-layer residence are shown in Table 2, and its ecological carrying capacity is 2.147 ghm2 (Ec2 = (1–12%) aj·rj·yj = 0.88 × 0.525 × 2.8 × 1.66 = 2.147 ghm2).
5.2. Comparison of Sustainability Assessment on Two Residences
The life-cycle ecological footprint of the multi-layer residence was 0.859 ghm2 and the ecological carrying capacity was 2.147 ghm2, which is higher than the ecological footprint. Additionally, the multi-layer residence was in a state of ecological surplus with the impact on the environment within the carrying capacity scope of the area. Moreover, it can be seen that the plan design, profile design of ventilation and heating insulation, heating, and insulation measures of the building, such as the external wall insulation, double glazing and central heating, and the operation mode of the multi-layer residence played a good energy-saving effect [22,23], which reduced the load of the house to the environment.
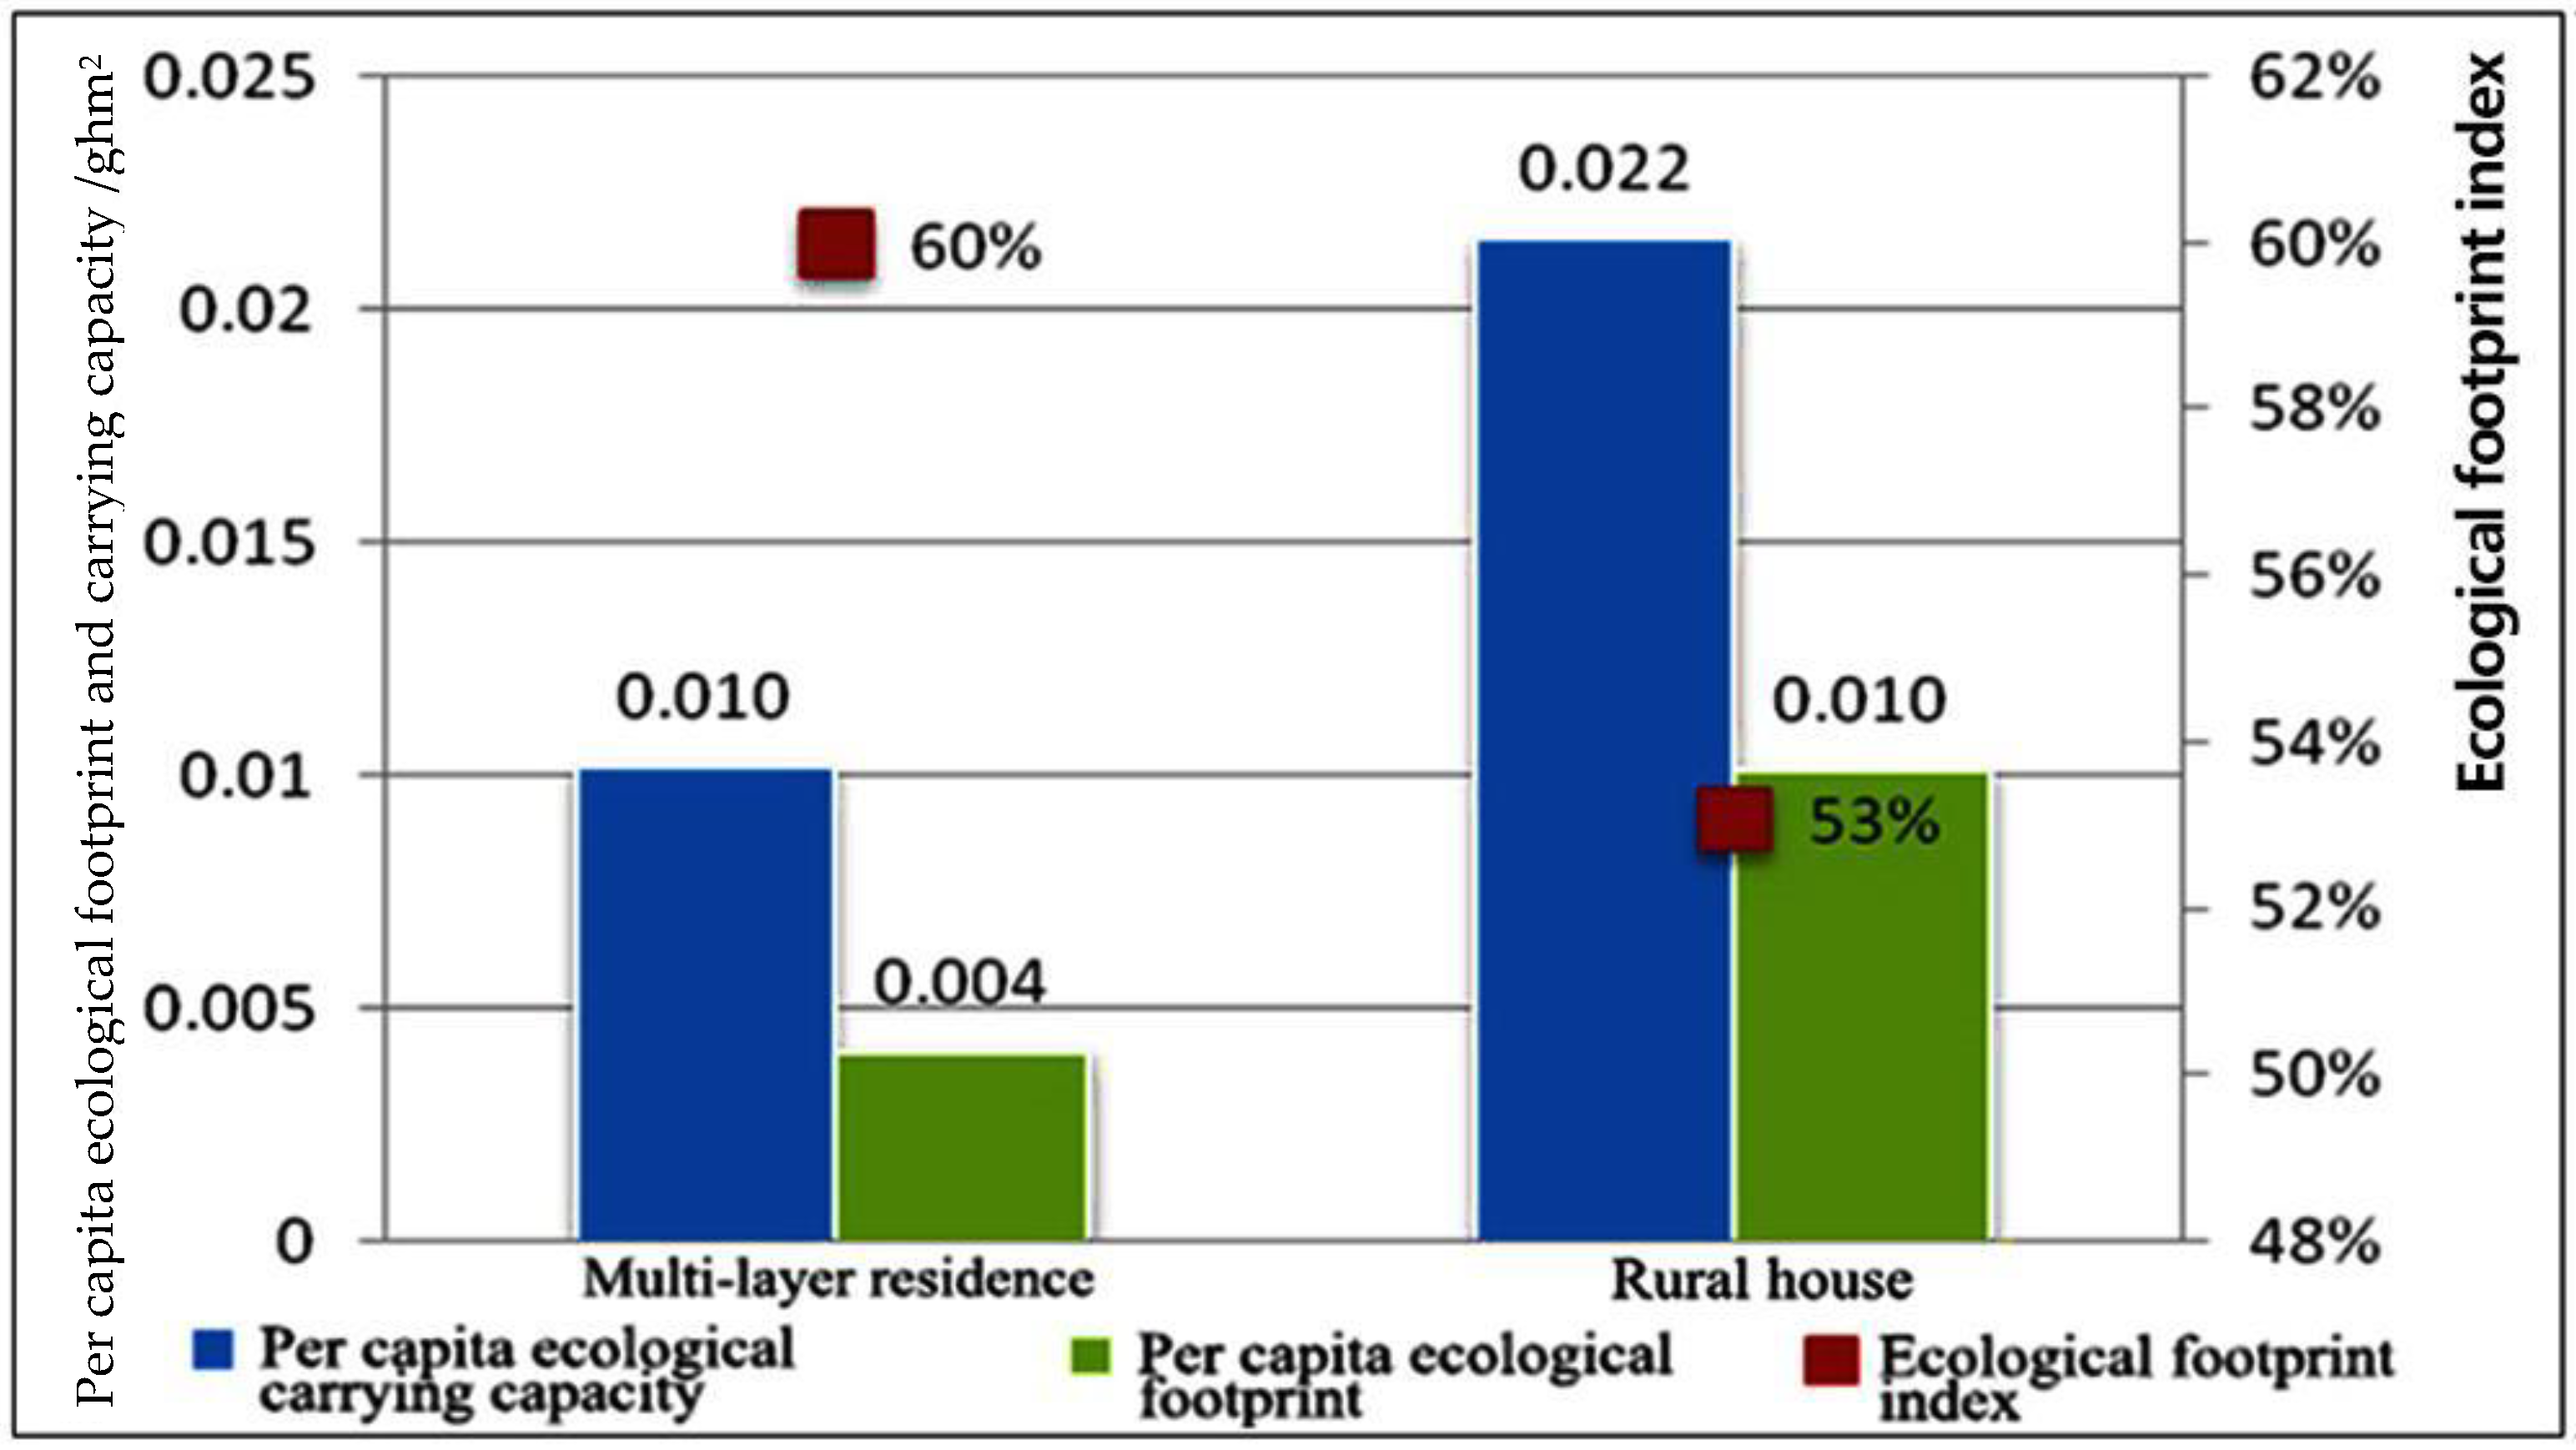
Figure 13 is a comparison between the ecological footprint of the Wafangdian farm house and the multi-layer residence, both of which were in a state of sustainable development. The ecological footprint index of the multi-layer residence was 60% and the rural house was 53%, which indicates that the sustainability of the multi-layer residence is higher than that of the rural house. However, in the process of the ecological footprint calculation, the use of residential decoration and furniture are not considered. Multi-layer residences generally consume more in this area than low-level residences, so its actual ecological footprint index should be less than 60%. The difference of the ecological footprint index between the two types of residence should be less than 7%. It can be seen from Figure 14, the per capita ecological carrying capacity of the multi-layer residence was far less than the rural house. The reason for this is that the per capita construction land area in the village is much larger than that in the urban areas. The per capita ecological footprint of the multi-layer residence was 0.004 ghm2/cap and the rural house was 0.010 ghm2/cap, which demonstrates that the load on the environment caused by the multi-layer residence was far less than that by the rural house. Thus, the design strategies of the multi-layer residence used during the design, construction, and operation stages are worthy of reference.
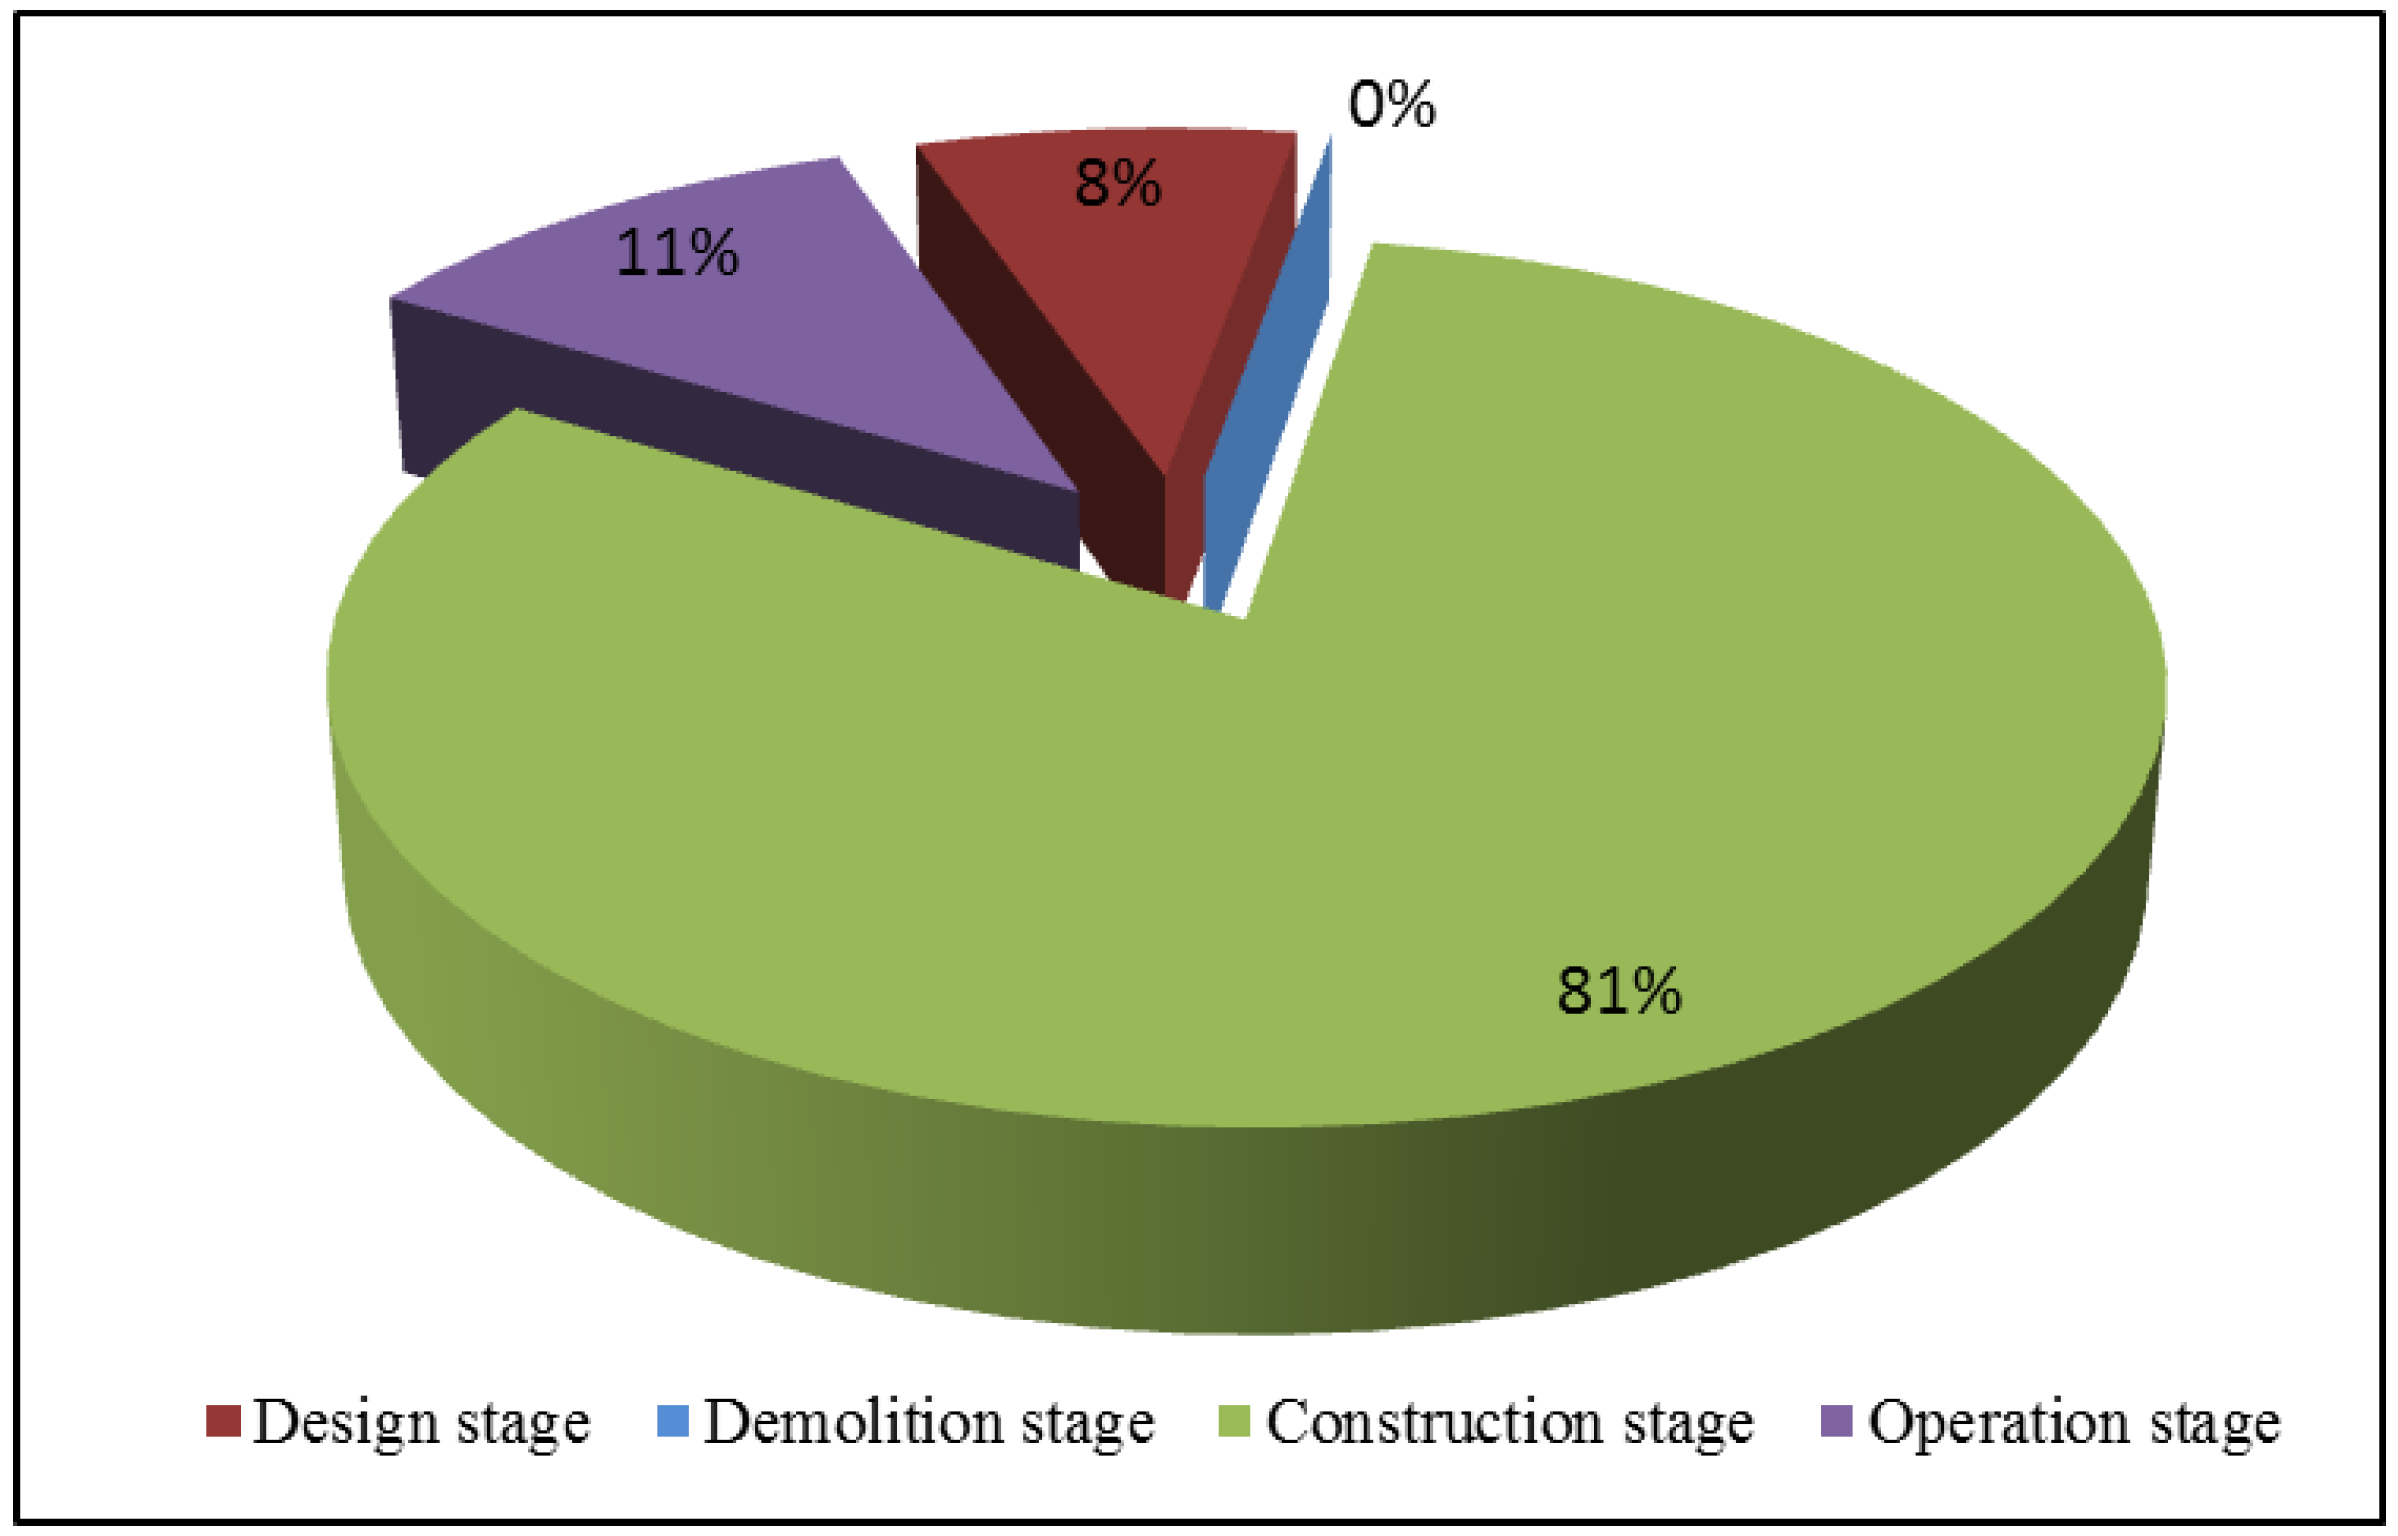
5.3. Whole Life-Cycle Comparison on Two Residences
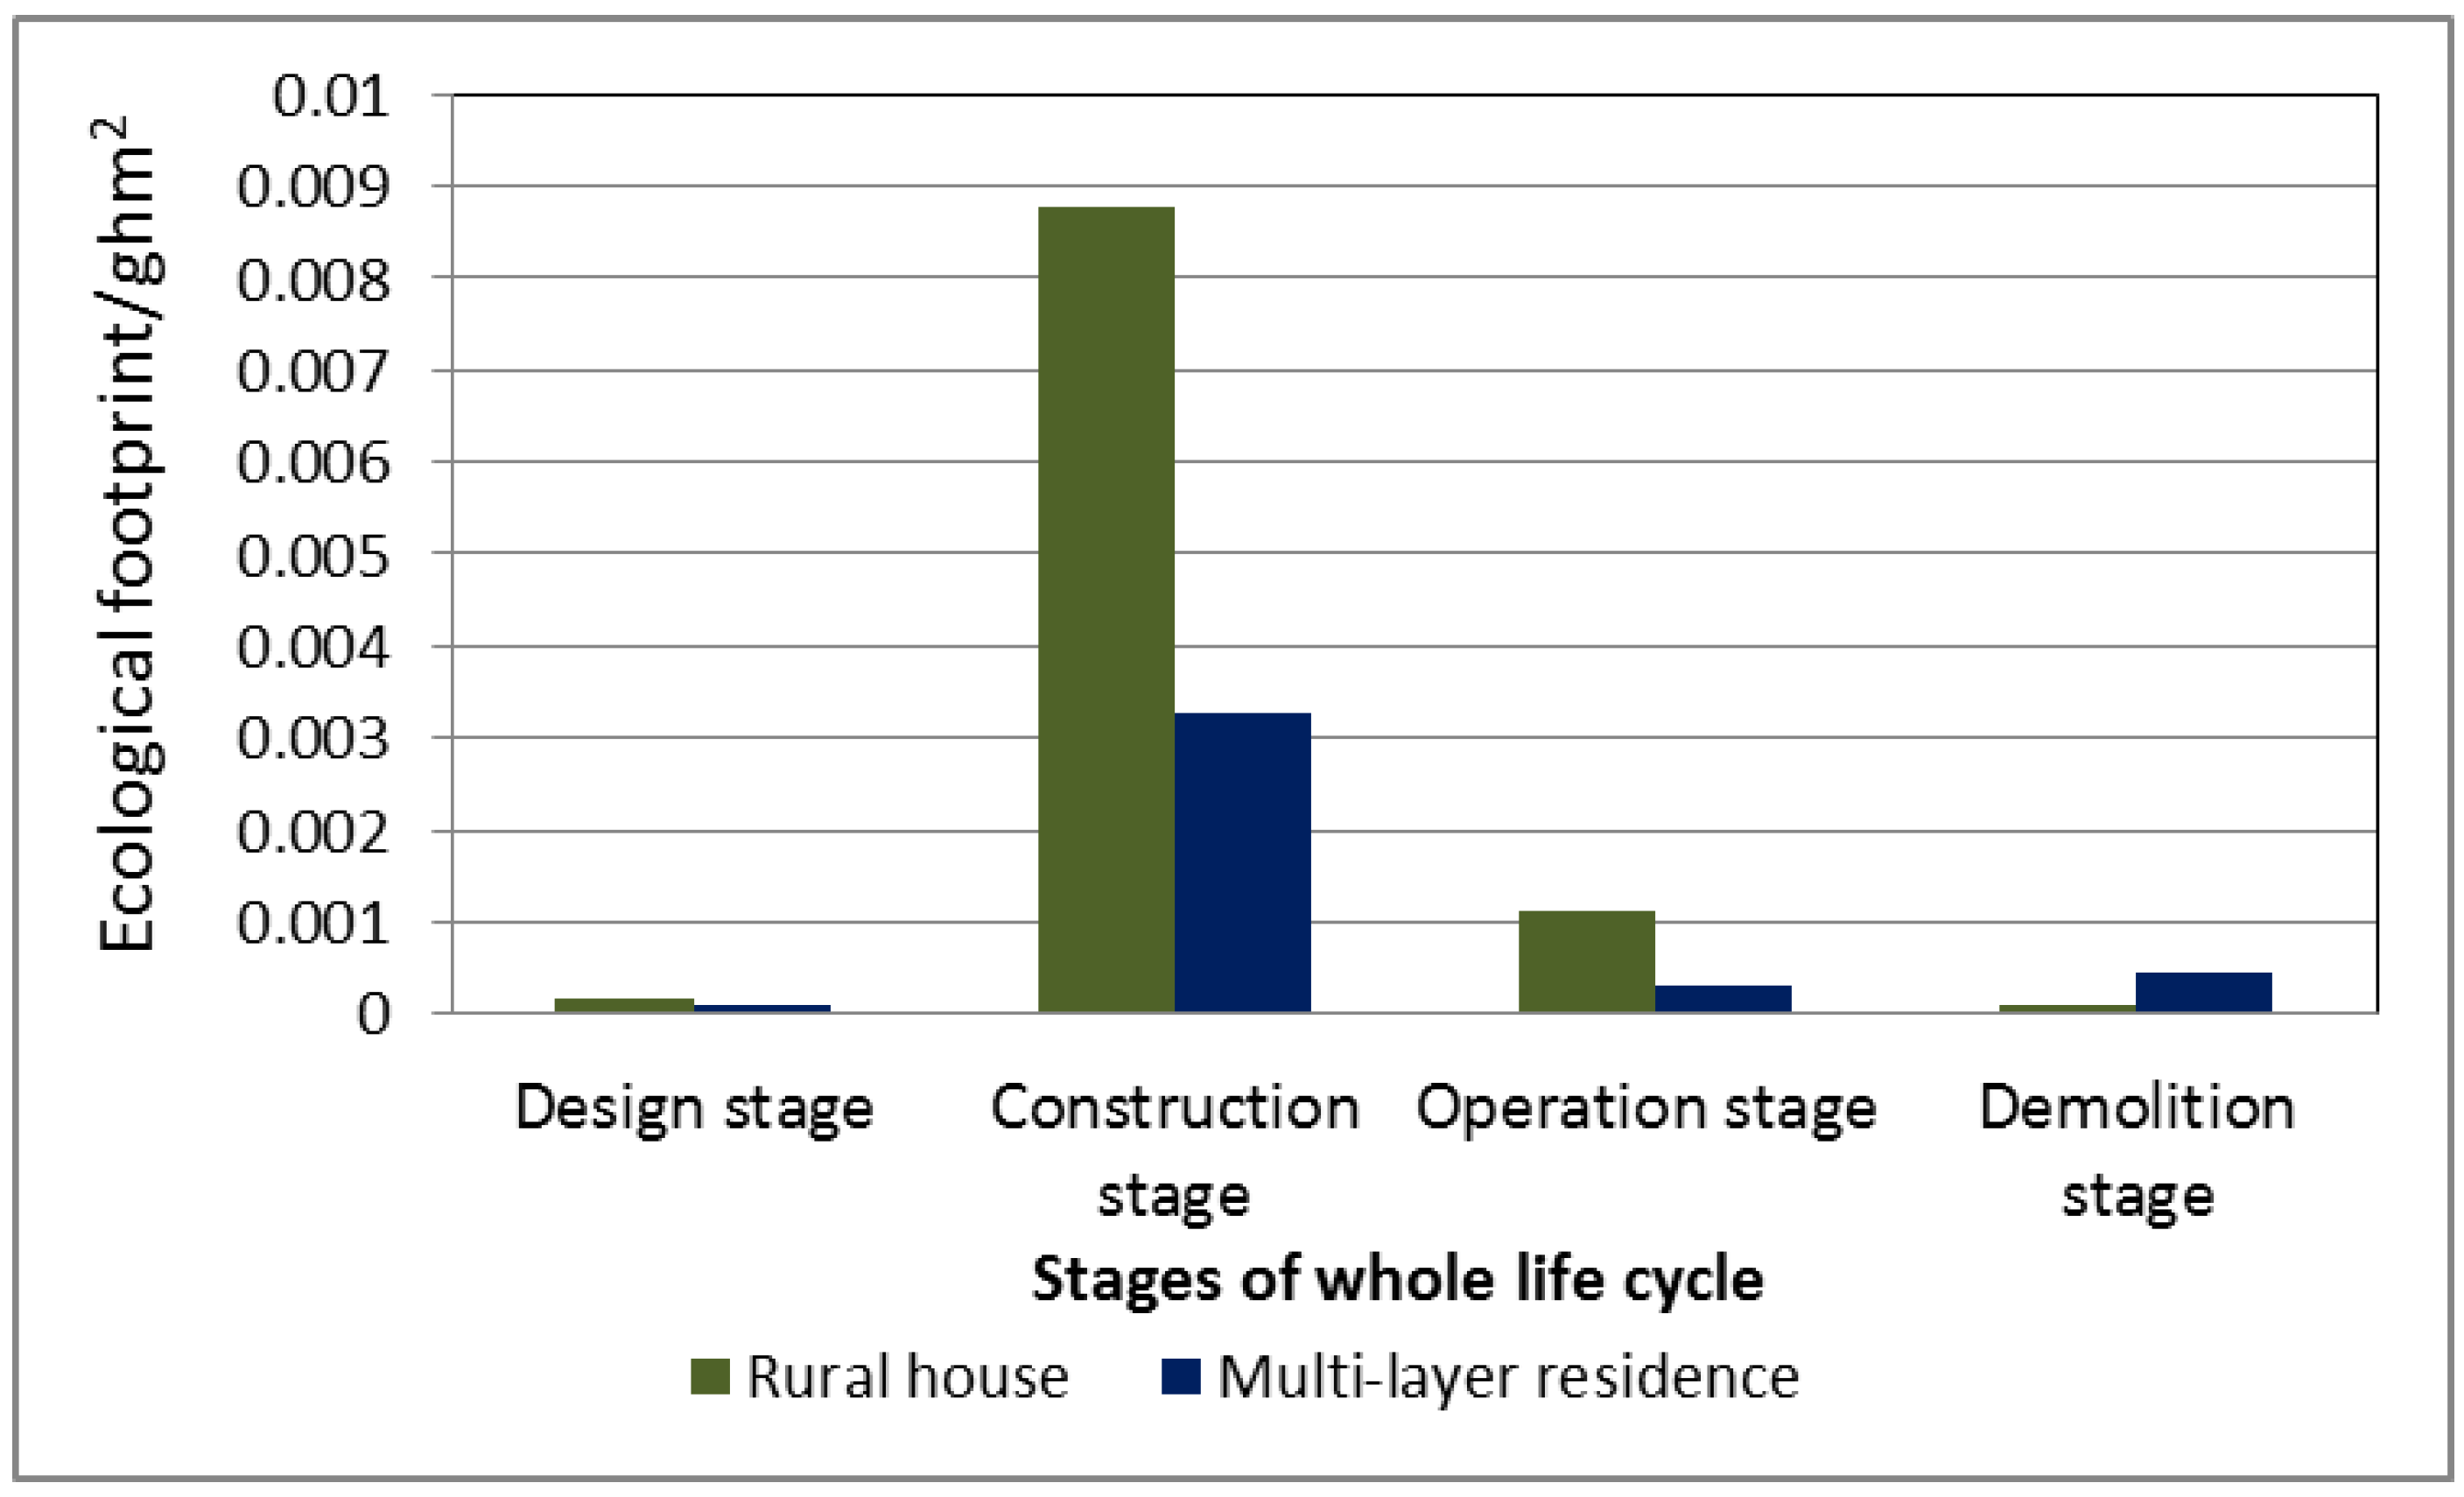
The proportion of the multi-layer residential ecological footprint in the design stage (Figure 15) was small, approximately 81% in the construction stage, about 8% in the operation stage, and around 11% in the demolition stage. The proportion of the ecological footprint of the two kinds of residences were both large during the construction stage. During the construction stage, the ecological footprint was mainly composed of four parts: labor, machinery, materials, and construction waste. The ways to reduce the ecological footprint in the construction stage were to increase the amount of factory prefabricated materials and use mechanized operations. The most important measure was to choose building materials with less ecological footprint. The per capita ecological footprint of the multi-layer residence was significantly less than that of the rural house during the construction and operation stages, which indicates that within an amalgamated dwelling, the organized operation of centralized heating and air supply can effectively reduce the ecological footprint and resource consumption (Figure 16). Therefore, when designing the rural house, the centralized heating and daily energy consumption system should be considered to make rational use of the abundant renewable resources in village areas.
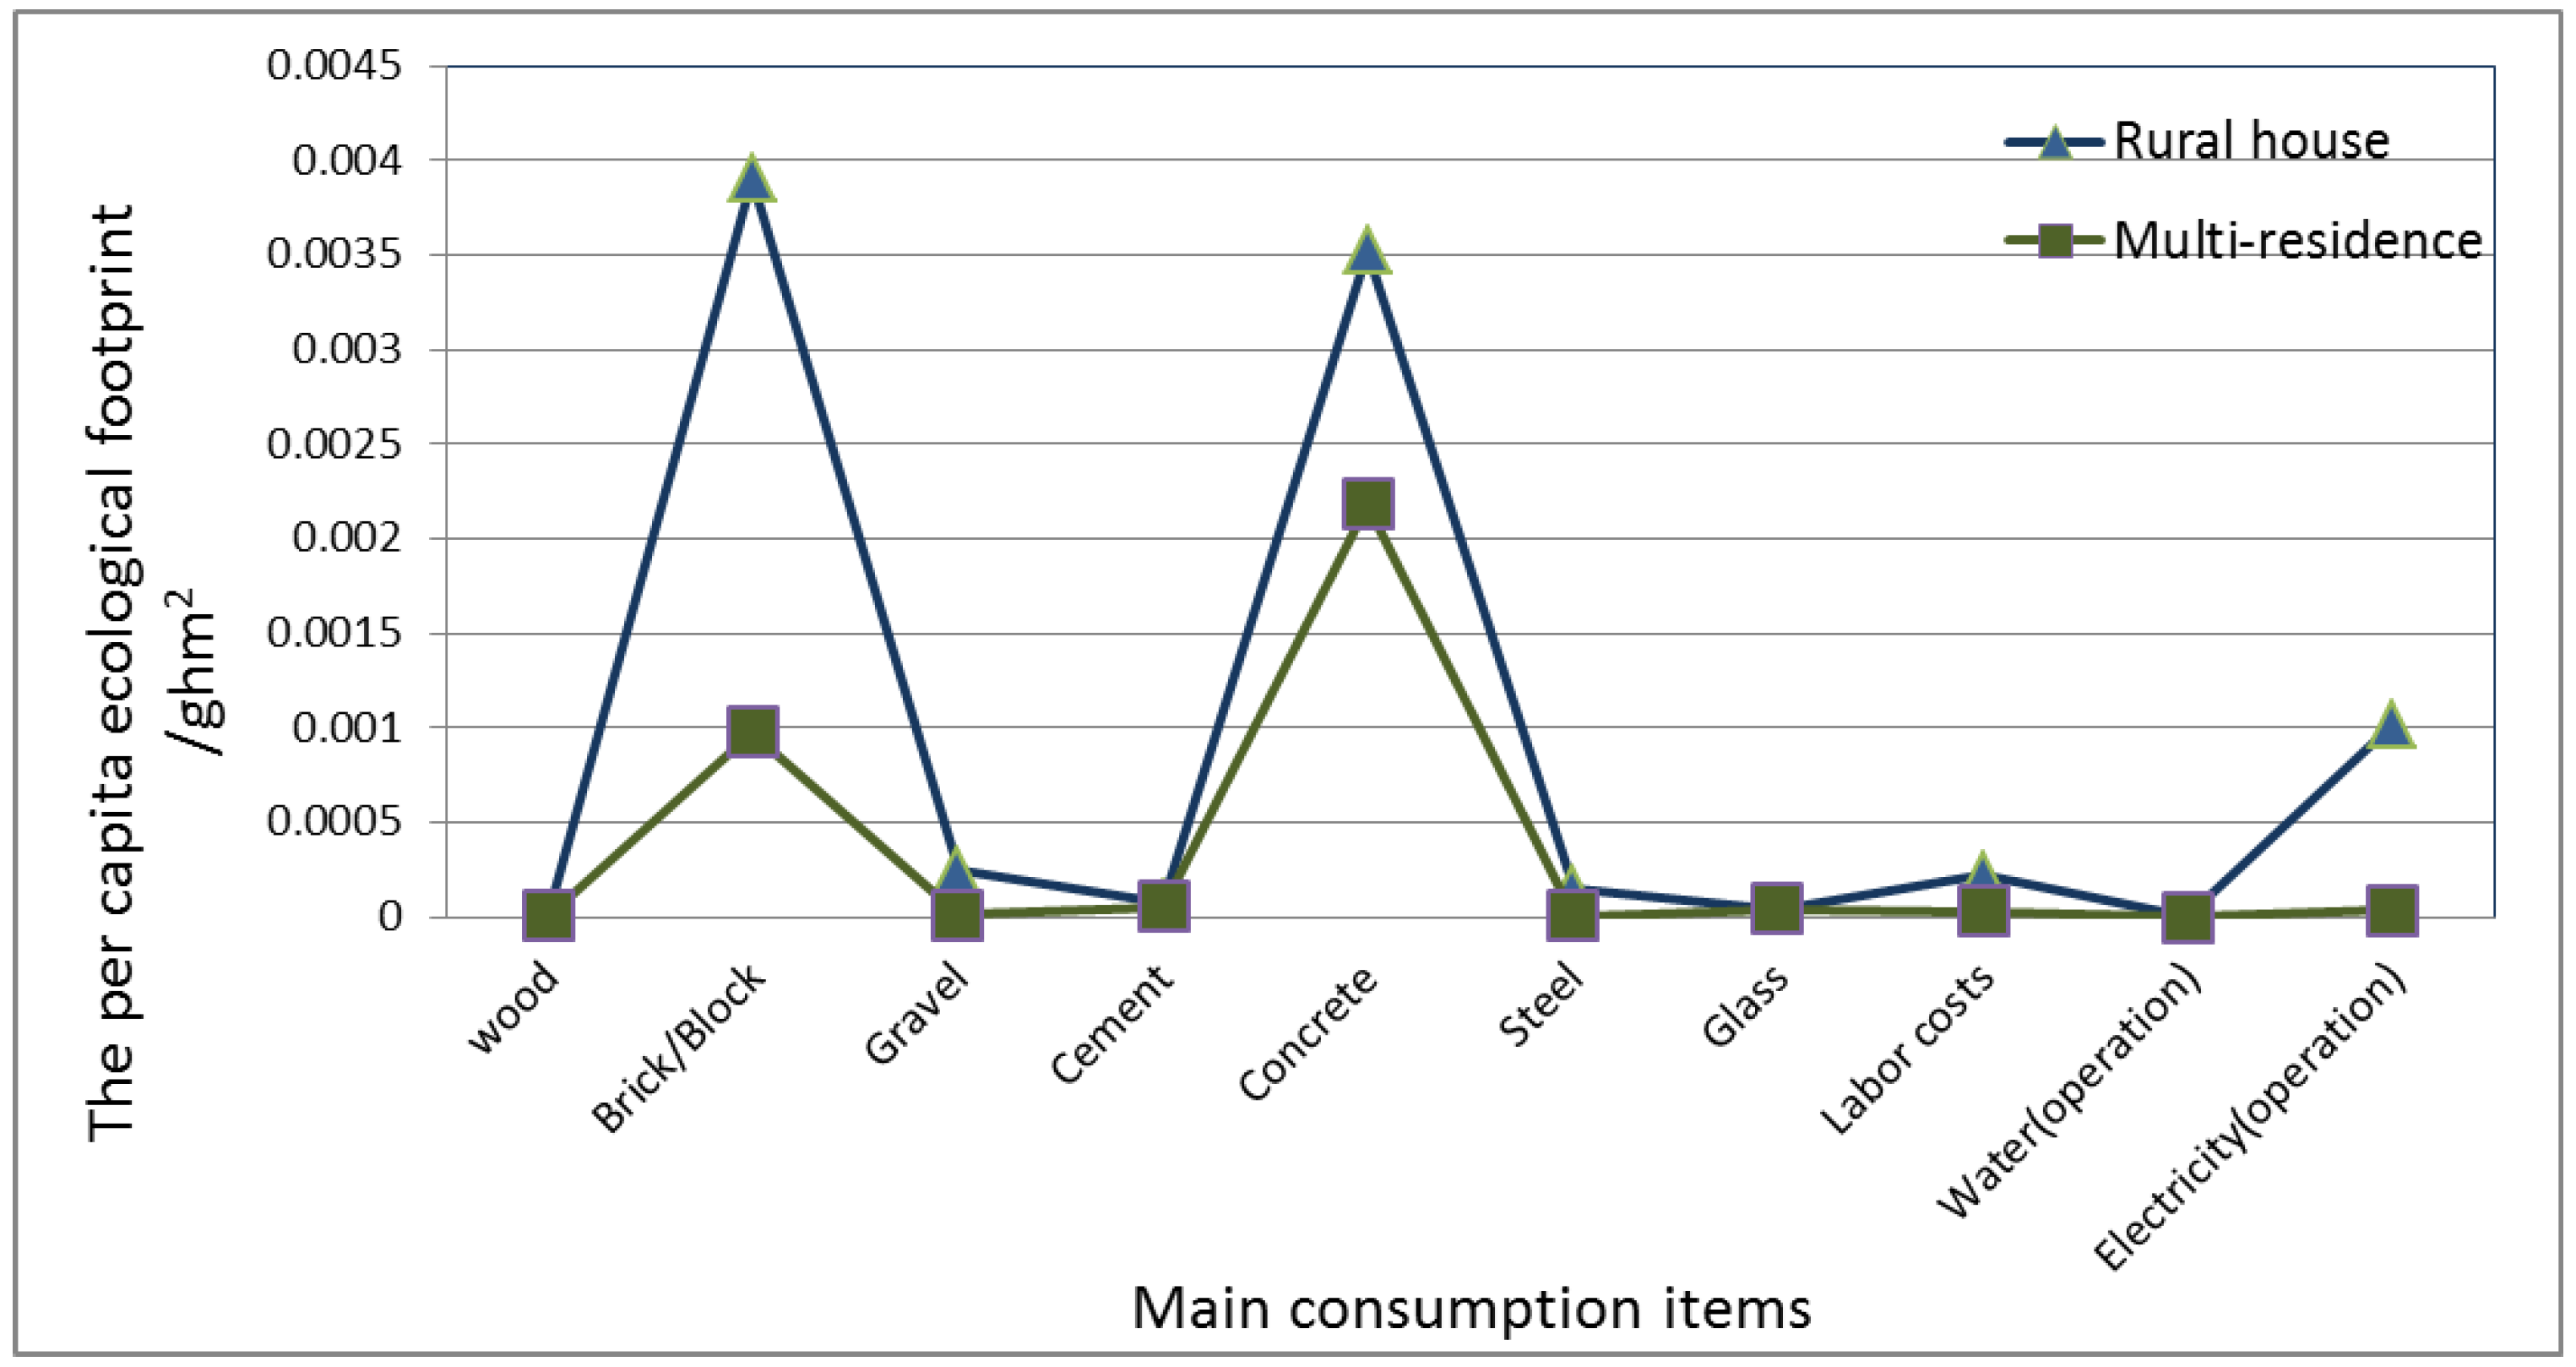
5.4. Comparison of Main Consumption Items on the Two Residences
The main building materials in the rural house and the multi-layer residence are concrete, bricks or blocks, sand and more. Figure 17 is a summary comparison icon of the higher per capita ecological footprint of two kinds of residences for main consumption items, to demonstrate that the ecological footprint of blocks or bricks, concrete, labor, and electricity consumed during the operation stage are much higher than during others.
Concrete and blocks or bricks were used as the main building materials of the two residences envelope structure. The sum of the per capita ecological footprint of these building materials for the rural house was significantly higher than the multi-layer residence, which indicates that the per capita resource consumption of the enclosure structure of the multi-layer residential building was far less than that of the rural house. Regarding the gravel and electricity consumption during the operation stage, the per capita ecological footprint of the rural house was far higher than the multi-layer residence. Vis-a-vis the multi-layer residential structure, the construction methods and mode of operation were more conducive to save energy and operating supplies. Architects should to take full account of how to use the advantages of the multi-layer residence in the construction of a rural house as well as how to transform the disadvantages of the rural house into advantages.
5.5. Analysis of Comparative Results
Although the overall life quality and public infrastructure in the village areas are far less than those in urban areas, the per capita ecological footprint of the rural house was higher than the multi-layer residence, which indicates that sustainability in rural areas is weaker. Through the comparative analysis of the two houses, in this paper, the reasons are as follows:
The multi-layer residence mentioned above was mainly six layers, and a large part of enclosure structures of residential buildings such as walls, floor layers, and other components were for two families in the rural house. The per capita enclosure structure area was relatively small, as well, the amount of per capita building materials was relatively less. Based on these differences, the ecological footprint of the multi-layer residence will drop a lot. However, the rural house was a 1-layer house that was built mostly by users at different times, with a rare case of a common building enclosure resulting in a larger consumption of building materials.
The multi-layer residence construction was implemented centrally by developers. Although there were still many shortcomings in the construction stage, compared to the rural house, the multi-layer residences remained centralized, mechanized, and organized, which correspondingly saved labor and material resources, and reduced a lot of the waste;
The per capita construction area of the multi-layer residence was small, while the rural per capita housing floor space was relatively large. When the building area was the same, the external wall area of the urban multi-layer residence was smaller than that of the rural independent house, thus the heat flowing outdoors and the heat loss in winter were less in the urban multi-layer residence. Additionally, the heating energy consumption in winter was correspondingly less. Moreover, in summer, due to the small area of the urban building envelope, the received direct solar radiation was smaller, so there was an obvious corresponding decrease in cooling energy consumption;
The height of the urban house was generally lower than that of the rural house with the pitched roof. When there was the same area, the per capita interior volume of the urban house was generally less than the rural house, thus the heating volume of the urban house in winter was less than that in the rural house, which results in savings in heating energy consumption to some degree;
During the operation stage, the consumption of water, electricity, gas, and heating that are required in the urban house was delivered centrally, which reduced the unnecessary waste, while in the village area, the energy required to heat, cook and manufacture was provided by the tenants themselves. Moreover, many farmers burned coal or wood with low-energy efficiency for residence heating, which caused a large waste of the resource.
6. Conclusions
By combining whole life-cycle assessment and ecological footprint theory, we are able to analyze and quantify the effect of the Wafangdian rural house and the multi-layer residence on environment. The higher the ecological footprint value, the larger the share of non-renewable fossil energy use; consequently, the share of the direct consumption of natural capital is larger and the Earth’s biological carrying capacity shrinks.
- (1)
- The Wafangdian ecological footprint is 0.091 ghm2, which is significantly lower than its ecological capacity, making the ecological surplus within the ecological footprint index 53%. Compared to the rural house, the multi-layer residence has a higher sustainable level, with an ecological footprint index 60%.
- (2)
- The rural house ecological footprint of the construction stage is the largest at approximately 87%, the proportion in the operation stage is roughly 11%, and in the design and demolition stage nearly 1%. Thus, the reduction of the ecological footprint during the construction stage and operation stage can reduce the total ecological footprint of the whole life-cycle effectively. In addition, although the multi-layer residence only added external wall thermal-insulation and a few necessary energy-saving measures, the sustainability of the multi-layer residence was obviously superior to the rural house and the load on the environment caused by the multi-layer residence was far less than the rural house (The per capita ecological footprint of the multi-layer residence was 0.004 ghm2/cap, the rural house was 0.010 ghm2/cap). Thus, the rural house designer should draw on the strategies of the multi-layer residential design and construction methods, while operation modes should be centralized, planned, and constructed. The heating demand of residents should be settled centrally, which could reduce the unnecessary waste of energy and resources.
- (3)
- The ecological footprint of the demolition is mainly caused by the direct burial of construction waste, which occupies a large amount of farmland. Thus, the reduction and recycling of construction waste can effectively reduce the ecological footprint during the demolition stage.
- (4)
- Electricity and other maintenance take up a large proportion in the total ecological footprint during the operation stage. Therefore, the ventilating and passive cooling measures should be considered for the design in northern Chinese villages.
- (5)
- The consumption of building material is the principal aspect of the ecological footprint. Thicker building envelopes can improve the thermal performance of the building. However, a thicker building construction consumes greater building materials and increases the ecological footprint. Thus, when choosing building materials, architects should consider using building materials with a low-energy conversion rate and higher thermal performance indexes to reduce the energy conversion and the ecological footprint. The most important thing is to use local materials.
- (6)
- It can be drawn from the value of energy density (the radio of total energy value to residential land area), improving the intensification of construction land can effectively reduce the ecological footprint. The important measures to save the land area are to have reasonable overall planning, reduce the residential courtyard area appropriately, increase the house depth, and use the multi-layer residential forms as much as possible. There are many resources available in village areas, so one should give full consideration to the recycling of resources, which is also an effective way to increase the Earth’s ecological carrying capacity, making it conducive to human sustainable development.
Author Contributions
Conceptualization, M.L. and B.Z.; Methodology, M.L.; Software, B.Z.; Validation, J.Y.; Formal Analysis, M.L.; Investigation, M.L. and B.Z.; Resources, M.L.; Data Curation, M.L., B.Z. and J.R.; Writing-Original Draft Preparation, M.L., B.Z., J.R. and C.L., J.Y.; Writing-Review & Editing, M.L., B.Z., J.R., Q.H.; Visualization, M.L. and J.R., C.L., J.Y., Q.H.; Supervision, M.L.; Project Administration, M.L.; Funding Acquisition, M.L.
Funding
The State Key Program of National Natural Science Foundation of China (Project No. 51638003) and the Fundamental Research Funds for the Central Universities (DUT17RW118).
Acknowledgments
The authors gratefully acknowledge The State Key Program of National Natural Science Foundation of China (Project No. 51638003) and the Fundamental Research Funds for the Central Universities (DUT17RW118).
Conflicts of Interest
Declare conflicts of interest or state “The authors declare no conflict of interest.” Authors must identify and declare any personal circumstances or interest that may be perceived as inappropriately influencing the representation or interpretation of reported research results. Any role of the funders in the design of the study; in the collection, analyses or interpretation of data; in the writing of the manuscript, or in the decision to publish the results must be declared in this section. If there is no role, please state “The funders had no role in the design of the study; in the collection, analyses, or interpretation of data; in the writing of the manuscript, and in the decision to publish the results”.
References
- Li, B.; Du, C.; Yao, R.; Yu, W.; Costanzo, V. Indoor thermal environments in Chinese residential buildings responding to the diversity of climates. Appl. Therm. Eng. 2018, 129, 693–708. [Google Scholar] [CrossRef]
- Loveday, D.L.; Parsons, K.C.; Taki, A.H.; Hodder, S.G. Displacement ventilation environments with chilled ceilings: Thermal comfort design within the context of the BS EN ISO7730 versus adaptive debate. Energy Build. 2002, 34, 573–579. [Google Scholar] [CrossRef]
- Wackernagel, M.; Rees, W. Our Ecological Footprint: Reducing Human Impact on the Earth; New Society Publishers: Gabriola, BC, Canada, 1998; ISBN 9780865713123. [Google Scholar]
- Zhou, G. Research progress of ecological footprint at home and abroad. J. Zhejiang Univ. 2010, 6, 167–171. [Google Scholar]
- McDonald, G.W.; Patterson, M.G. Ecological Footprint sand interdependencies of New Zealand regions. Ecol. Econ. 2004, 50, 49–67. [Google Scholar] [CrossRef]
- Zhao, Y.; Liu, X.; Zhao, Y. Estimation of sustainable development of residential projects based on ecological footprint. J. Northwest Univ. 2010, 8, 703–707. [Google Scholar]
- Zhe, Y.; Ying, Y. Green Building Assessment Based on Ecological Footprint. Build. Econ. 2011, 3, 96–100. [Google Scholar]
- Wu, S. Green Building Ecological Footprint Calculation and Evaluation; Xi’an University of Architecture and Technology: Xi’an, China, 2011. [Google Scholar]
- Xu, Y.; Wu, S.; Wang, J. Ecological footprint analysis of engineering construction projects. Resour. Ind. 2010, 12, 150–153. [Google Scholar]
- WWF. Living Planet Report 2014 Summary. Available online: https://www.footprintnetwork.org/content/images/article_uploads/LPR2014_summary_low_res.pdf (accessed on 30 September 2014).
- China Ecological Footprint Report 2012; WWF Beijing Office: Beijing, China; Institute of Geographic Sciences and Natural Resources Research of Chinese Academy of Sciences: Beijing, China; Global Footprint Network: Oakland, CA, USA; Institute of Zoology: Beijing, China; Zoological Society of London: London, UK, 2012; Available online: https://www.footprintnetwork.org/content/images/article_uploads/China_Ecological_Footprint_2012.pdf (accessed on 19 December 2012).
- Van Vuuren, D.P.; Smeets, E.M.W. Ecological footprints of Benin, Bhutan, Costa Rica and the Netherlands. Ecol. Econ. 2003, 34, 115–130. [Google Scholar] [CrossRef]
- Gao, J.; Cheng, H. Analysis of Sustainable Development of Beijing Based on Ecological Footprint Method. Resour. Ind. 2010, 12, 101–108. [Google Scholar]
- Wang, X.; Zhang, Z.; Xiong, Y. Metrological Analysis of Literature on International Ecological Footprint. Adv. Earth Sci. 2007, 8, 872–877. [Google Scholar]
- Zhang, Z. An Understanding and Analysis of Ecological Footprint Methods. Resour. Environ. 2006, 16, 69–78. [Google Scholar]
- Yang, K.; Yang, Y.; Chen, J. Theory and method of ecological footprint analysis. Prog. Earth Sci. 2000, 12, 630–635. [Google Scholar]
- Wackernagel, M.; Kitzes, J.; Dan, M.; Goldfinger, S.; Thomas, M. The Ecological Footprint of cities and regions: comparing resource availability with resource demand. Environ. Urban. 2006, 18, 103–112. [Google Scholar] [CrossRef] [Green Version]
- Warrenr, K.; Koenig, A. Ecosystem appropriation by Hong Kong and its implications for sustainable development. Ecol. Econ. 2001, 39, 347–359. [Google Scholar] [CrossRef]
- Zhu, J.; Chen, B. Analysis of System Construction of Low-carbon Residence Based on Ecological Footprint. Archit. Sci. 2012, 28, 64–68. [Google Scholar]
- Li, J. Research on Eco-City Evaluation Method Based on Energy-Ecological Footprint Model; Tianjin University: Tianjin, China, 2010. [Google Scholar]
- Zhang, F.; Pu, L.; Zhang, J. Estimated Footprint Model Based on Energy Analysis Theory and Its Application: A Case Study of Jiangsu Province. J. Nat. Resour. 2006, 21, 653–660. [Google Scholar]
- Qian, F.; Wang, W. Energy Value Analysis and Evaluation of Building Environmental Efficiency—A Case Study of Peking University Gymnasium. Act. Archit. 2007, 7, 39–42. [Google Scholar]
- Wackernagel, M.; Onisto, L.; Bello, P.; Linares, A.C.; Falfán, I.S.L.; Garcıa, J.M.; Guerrero, A.I.S.; Guerrero, M.G.S. National natural capital accounting with the ecological footprint concept. Ecol. Econ. 1999, 29, 375–390. [Google Scholar] [CrossRef]
Figure 1.
The model frame of ecological footprint calculation.

Figure 2.
The research thought of the paper.

Figure 3.
Correlating the Ecological Footprint with IHDI [10].
Figure 3.
Correlating the Ecological Footprint with IHDI [10].

Figure 4.
Ecological footprint and ecological carrying capacity of China in 1961–2008 [11].
Figure 4.
Ecological footprint and ecological carrying capacity of China in 1961–2008 [11].

Figure 5.
Composition of the ecological footprint of China in 1961–2008 [11].
Figure 5.
Composition of the ecological footprint of China in 1961–2008 [11].

Figure 6.
Floor plan of the rural house.

Figure 7.
Program of ecological footprint model visualization design. (a) Design stage; (b) Operation stage.
Figure 7.
Program of ecological footprint model visualization design. (a) Design stage; (b) Operation stage.


Figure 8.
Sustainable analysis of rural house.

Figure 9.
The proportion of the Wafangdian farm house in whole life-cycle.

Figure 10.
The ecological footprint of the consumption items in operation stage.

Figure 11.
The ecological footprint of consumption items of a rural house in the whole life-cycle.

Figure 12.
Standard layer of the multi-layer residence.

Figure 13.
The comparison of sustainability assessment of two kinds of houses.

Figure 14.
The comparison of per capita ecological footprint of the two houses.

Figure 15.
The proportion of multi-layer residential ecological footprint in each stage.

Figure 16.
The comparison of per capita ecological footprint of two residences in whole life-cycle.

Figure 17.
The comparison of main items of two residences.


Table 1.
The ecological footprint calculation model of the rural house.
| Project stage | Consumption Items | Original Data | Energy Conversion Rate/(sej/unit) | Solar Energy Value/sej | Per Capita Energy Value/sej | Per Capita Ecological Footprint/hm2 | Corresponding Land Type | Equilibrium Factor | Ecological Footprint/hm2 |
|---|---|---|---|---|---|---|---|---|---|
| Design stage | Labor costs/$ | 2568 | 5.20 × 10¹² | 1.33536 × 10¹⁶ | 1.6692 × 10¹⁵ | 3.8805 × 10⁻⁵ | Construction land | 2.8 | 9.78 × 10⁻⁴ |
| Construction stage | Wood/g | 874,606 | 4.40 × 10⁸ | 3.84827 × 10¹⁴ | 4.81033 × 10¹³ | 1.11829 × 10⁻⁶ | Woodland | 1.1 | 1.10711 × 10⁻⁵ |
| Brick | 1.8 × 10⁸ | 2.60 × 10⁹ | 4.79213 × 10¹⁷ | 5.99017 × 10¹⁶ | 0.001392573 | Construction land | 2.8 | 0.035092838 | |
| Sand/g | 7.7 × 10⁷ | 1.00 × 10⁹ | 7.6636 × 10¹⁶ | 9.5795 × 10¹⁵ | 0.000222701 | Fossil energy land | 1.1 | 0.002204739 | |
| Stone/g | 7.3 × 10⁷ | 1.00 × 10⁹ | 7.2594 × 10¹⁶ | 9.07425 × 10¹⁵ | 0.000210955 | Fossil energy land | 1.1 | 0.002088455 | |
| Cement/g | 2.9 × 10⁷ | 2.30 × 10⁹ | 6.7829 × 10¹⁶ | 8.47862 × 10¹⁵ | 0.000197108 | Fossil energy land | 1.1 | 0.00195137 | |
| Cement/g | 9,520,000 | 2.30 × 10⁹ | 2.1896 × 10¹⁶ | 2.737 × 10¹⁵ | 6.36288 × 10⁻⁵ | Fossil energy land | 1.1 | 0.000629925 | |
| Cement/g | 3.9 × 10⁷ | 2.80 × 10¹⁰ | 1.10264 × 10¹⁸ | 1.3783 × 10¹⁷ | 0.003204224 | Fossil energy land | 1.1 | 0.031721817 | |
| Cement/g | 90 | 5.20 × 10¹² | 4.68 × 10¹⁴ | 5.85 × 10¹³ | 1.35999 × 10⁻⁶ | Construction land | 2.8 | 3.42717 × 10⁻⁵ | |
| XPS/$ | 886 | 5.20 × 10¹² | 4.6072 × 10¹⁵ | 5.759 × 10¹⁴ | 1.33883 × 10⁻⁵ | Construction land | 2.8 | 0.000337386 | |
| Asphalt/$ | 954 | 5.2 × 10¹² | 4.9608 × 10¹⁵ | 6.201 × 10¹⁴ | 1.44159 × 10⁻⁵ | Construction land | 2.8 | 0.00036328 | |
| Steel/g | 4,243,458 | 4.20 × 10⁹ | 1.78225 × 10¹⁶ | 2.22782 × 10¹⁵ | 5.17915 × 10⁻⁵ | Construction land | 2.8 | 0.001305145 | |
| Glass/g | 295,000 | 7.90 × 10⁹ | 2.3305 × 10¹⁵ | 2.91313 × 10¹⁴ | 6.77233 × 10⁻⁶ | Construction land | 2.8 | 0.000170663 | |
| Water/g | 7.7 × 10⁷ | 6.60 × 10⁵ | 5.08134 × 10¹³ | 6.35168 × 10¹² | 1.47662 × 10⁻⁷ | Waters | 0.2 | 2.65791 × 10⁻⁷ | |
| Electricity/J | 1.6 × 10⁹ | 1.60 × 10⁵ | 2.59557 × 10¹⁴ | 3.24446 × 10¹³ | 7.54262 × 10⁻⁷ | Construction land | 2.8 | 1.90074 × 10⁻⁵ | |
| Labor costs/$ | 5198 | 5.20 × 10¹² | 2.70296 × 10¹⁶ | 3.3787 × 10¹⁵ | 7.85468 × 10⁻⁵ | Construction land | 2.8 | 0.00197938 | |
| Finished doors/$ | 110 | 5.2 × 10¹² | 5.72 × 10¹⁴ | 7.15 × 10¹³ | 1.66221 × 10⁻⁶ | Construction land | 2.8 | 4.18876 × 10⁻⁵ | |
| Other coasts/$ | 1000 | 5.20 × 10¹² | 5.2 × 10¹⁵ | 6.5 × 10¹⁴ | 1.5111 × 10⁻⁵ | Construction land | 2.8 | 0.000380797 | |
| Building wastes | - | - | - | - | - | - | - | 0.000260014 | |
| Operation stage | Water/g | 1.9 × 10⁹ | 6.60 × 10⁵ | 1.26852 × 10¹⁵ | 1.58565 × 10¹⁴ | 3.68626 × 10⁻⁶ | Waters | 0.2 | 6.63528 × 10⁻⁶ |
| Electricity/J | 7.8 × 10¹¹ | 1.60 × 10⁵ | 1.25019 × 10¹⁷ | 1.56274 × 10¹⁶ | 0.0003633 | Construction land | 2.8 | 0.009155157 | |
| Coal/g | 8.8 × 10⁷ | 3.93 × 10⁴ | 3.4584 × 10¹² | 4.323 × 10¹¹ | 1.005 × 10⁻⁸ | Fossil energy land | 1.1 | 9.94946 × 10⁻⁸ | |
| Straw/g | 1.4 × 10⁸ | 1.70 × 10⁵ | 2.448 × 10¹³ | 3.06 × 10¹² | 7.11378 × 10⁻⁸ | Arable land | 2.8 | 1.79267 × 10⁻⁶ | |
| Other maintenance/$ | 2837 | 5.20 × 10¹² | 1.47524 × 10¹⁶ | 1.84405 × 10¹⁵ | 4.28698 × 10⁻⁵ | Construction land | 2.8 | 0.00108032 | |
| Demolition stage | Building wastes | - | - | - | - | - | - | - | 0.000772799 |
| Total ecological footprint | - | - | - | - | - | - | - | - | 0.090518681 |
Table 2.
The ecological footprint calculation model of multi-layer residence.
| Project Stage | Consumption Items | Original Data | Energy Conversion Rate/(sej/unit) | Solar Energy Value/sej | Per Capita Energy Value/sej | Per Capita Ecological Footprint/hm2 | Corresponding Land Type | Equilibrium Factor | Ecological Footprint/hm2 |
|---|---|---|---|---|---|---|---|---|---|
| Design stage | Labor costs/$ | 8622.4 | 5.20 × 10¹² | 4.48365 × 10¹⁶ | 2.13507 × 10¹⁴ | 6.14827 × 10⁻⁷ | Construction land | 2.8 | 0.00036 |
| Construction stage | Wood/g | 41,524,525 | 4.40 × 10⁸ | 1.82708 × 10¹⁶ | 8.70038 × 10¹³ | 2.50541 × 10⁻⁷ | Woodland | 1.1 | 5.7875 × 10⁻⁵ |
| Red brick/g | 97,364,027 | 2.60 × 10⁹ | 2.53146 × 10¹⁷ | 1.20546 × 10¹⁵ | 3.47131 × 10⁻⁶ | Arable land | 2.8 | 0.00204 | |
| Hollow block/g | 898,493,730 | 2.80 × 10¹⁰ | 2.51578 × 10¹⁹ | 1.19799 × 10¹⁷ | 0.000344981 | Construction land | 2.8 | 0.20284 | |
| Gravel/g | 903,291,280 | 1.00 × 10⁹ | 9.03291 × 10¹⁷ | 4.30139 × 10¹⁵ | 1.23865 × 10⁻⁵ | Fossil energy land | 1.1 | 0.00286 | |
| Cement/g | 162,189,614 | 2.30 × 10⁹ | 3.73036 × 10¹⁷ | 1.77636 × 10¹⁵ | 5.11532 × 10⁻⁶ | Fossil energy land | 1.1 | 0.00118 | |
| Cement tile/g | 6,043,805 | 2.30 × 10⁹ | 1.39008 × 10¹⁶ | 6.61941 × 10¹³ | 1.90616 × 10⁻⁷ | Fossil energy land | 1.1 | 0.00004403 | |
| Concrete/g | 5,156,518,149 | 2.80 × 10¹⁰ | 1.44383 × 10²⁰ | 6.87536 × 10¹⁷ | 0.001979868 | Fossil energy land | 1.1 | 0.45734 | |
| Lime/$ | 1863 | 5.20 × 10¹² | 9.6876 × 10¹⁵ | 4.61314 × 10¹³ | 1.32843 × 10⁻⁷ | Construction land | 2.8 | 0.0000781 | |
| Asphalt/$ | 7718 | 5.20 × 10¹² | 4.01336 × 10¹⁶ | 1.91112 × 10¹⁴ | 5.50338 × 10⁻⁷ | Construction land | 2.8 | 0.00032 | |
| Steel/g | 11,903,783 | 4.20 × 10⁹ | 4.99959 × 10¹⁶ | 2.38076 × 10¹⁴ | 6.85576 × 10⁻⁷ | Construction land | 2.8 | 0.00040 | |
| Insulation mortar/$ | 4216 | 5.20 × 10¹² | 2.19232 × 10¹⁶ | 1.04396 × 10¹⁴ | 3.00625 × 10⁻⁷ | Fossil energy land | 1.1 | 6.94444 × 10⁻⁵ | |
| Coating/$ | 14,162 | 5.20 × 10¹² | 7.36424 × 10¹⁶ | 3.50678 × 10¹⁴ | 1.00983 × 10⁻⁶ | Construction land | 2.8 | 0.00059 | |
| Plastic pipe/$ | 13,482 | 5.20 × 10¹² | 7.01064 × 10¹⁶ | 3.3384 × 10¹⁴ | 9.61345 × 10⁻⁷ | Construction land | 2.8 | 0.00056 | |
| Glass cloth/$ | 3223 | 5.20 × 10¹² | 1.67596 × 10¹⁶ | 7.98076 × 10¹³ | 2.29819 × 10⁻⁷ | Construction land | 2.8 | 0.00013 | |
| Glass/g | 137,415,600 | 7.90 × 10⁹ | 1.08558 × 10¹⁸ | 5.16944 × 10¹⁵ | 1.48862 × 10⁻⁵ | Construction land | 2.8 | 0.00875 | |
| Water/g | 769,900,000 | 6.60 × 10⁵ | 5.08134 × 10¹⁴ | 2.41969 × 10¹² | 6.96787 × 10⁻⁹ | Waters | 0.2 | 2.9265 × 10⁻⁷ | |
| Electricity/J | 1,622,232,000 | 1.60 × 10⁵ | 2.59557 × 10¹⁵ | 1.23599 × 10¹³ | 3.55922 × 10⁻⁸ | Construction land | 2.8 | 0.000020 | |
| Cylindrical cast-iron radiators /$ | 14,363 | 5.20 × 10¹² | 7.46876 × 10¹⁶ | 3.55655 × 10¹⁴ | 1.02417 × 10⁻⁶ | Construction land | 2.8 | 0.00060 | |
| Labor costs/$ | 138,929 | 5.20 × 10¹² | 7.22431 × 10¹⁷ | 3.44015 × 10¹⁵ | 9.90645 × 10⁻⁶ | Construction land | 2.8 | 0.00582 | |
| Machinery costs/$ | 49,035 | 5.20 × 10¹² | 2.54982 × 10¹⁷ | 1.2142 × 10¹⁵ | 3.49648 × 10⁻⁶ | Construction land | 2.8 | 0.00205 | |
| Finished doors/$ | 16,973 | 5.20 × 10¹² | 8.82596 × 10¹⁶ | 4.20284 × 10¹⁴ | 1.21027 × 10⁻⁶ | Construction land | 2.8 | 0.00071 | |
| Other costs/$ | 11,766 | 5.20 × 10¹² | 6.11832 × 10¹⁶ | 2.91349 × 10¹⁴ | 8.38984 × 10⁻⁷ | Construction land | 2.8 | 0.00049 | |
| Building wastes | - | - | - | - | 3.00857 × 10⁻⁵ | Construction land | 2.8 | 0.00631 | |
| Operation stage | Water/g | 6,078,240,000 | 6.60 × 10⁵ | 4.01164 × 10¹⁶ | 1.9103 × 10¹⁴ | 5.50102 × 10⁻⁷ | Water | 0.2 | 0.0000231 |
| Electricity/J | 5.95728 × 10¹² | 1.60 × 10⁵ | 9.53165 × 10¹⁷ | 4.53888 × 10¹⁵ | 1.30704 × 10⁻⁵ | Construction land | 2.8 | 0.00768 | |
| Heating costs/$ | 900,886.5 | 5.20 × 10¹² | 4.68461 × 10¹⁸ | 2.23077 × 10¹⁶ | 6.42384 × 10⁻⁵ | Construction land | 2.8 | 0.03777 | |
| Gas/$ | 80,892 | 3.93 × 10⁴ | 3,179,055,600 | 15,138,360 | 4.35933 × 10⁻¹⁴ | Fossil energy land | 1.1 | 1.00701 × 10⁻¹¹ | |
| Other costs/$ | 560,795.52 | 5.20 × 10¹² | 2.91614 × 10¹⁸ | 1.38864 × 10¹⁶ | 3.9988 × 10⁻⁵ | Construction land | 2.8 | 0.02351 | |
| Demolition stage | Building wastes | - | - | - | - | 0.000460649 | Construction land | 2.8 | 0.09673 |
| Total ecological footprint | 0.85942 | ||||||||
© 2018 by the authors. Licensee MDPI, Basel, Switzerland. This article is an open access article distributed under the terms and conditions of the Creative Commons Attribution (CC BY) license (http://creativecommons.org/licenses/by/4.0/).
Share and Cite
MDPI and ACS Style
Liu, M.; Zhang, B.; Ren, J.; Lian, C.; Yuan, J.; Hao, Q. Whole Life-Cycle Ecological Footprint of Rural Existing Houses in Northern China. Buildings 2018, 8, 92. https://doi.org/10.3390/buildings8070092
AMA Style
Liu M, Zhang B, Ren J, Lian C, Yuan J, Hao Q. Whole Life-Cycle Ecological Footprint of Rural Existing Houses in Northern China. Buildings. 2018; 8(7):92. https://doi.org/10.3390/buildings8070092
Chicago/Turabian StyleLiu, Ming, Baogang Zhang, Jingwei Ren, Chaoli Lian, Jie Yuan, and Qingli Hao. 2018. "Whole Life-Cycle Ecological Footprint of Rural Existing Houses in Northern China" Buildings 8, no. 7: 92. https://doi.org/10.3390/buildings8070092
Note that from the first issue of 2016, this journal uses article numbers instead of page numbers. See further details here.