Lacquerware Pigment Identification with Fixed and Mobile Raman Microspectrometers: A Potential Technique to Differentiate Original/Fake Artworks


Abstract
:1. Introduction

2. Context

3. Experimental Methods
3.1. Artworks
- (a)
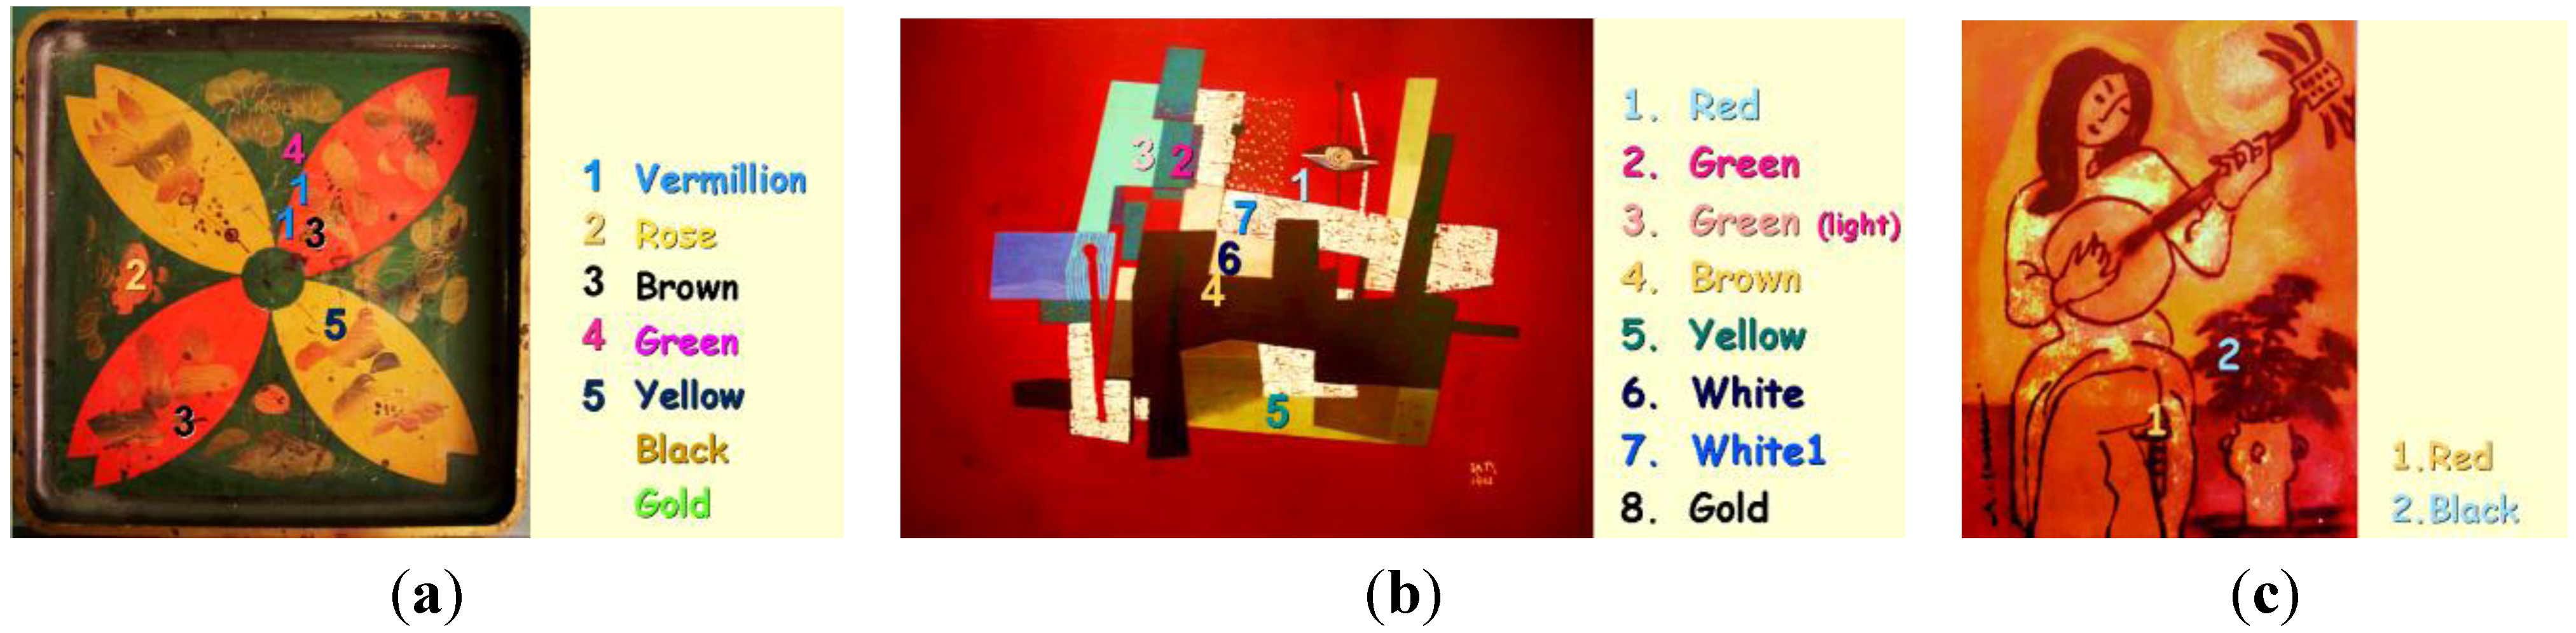
- a Japanese tray (26 × 26 cm2), accessory of a two-level table imported from Japan at the end of the 19th century, depicting flowers and leaves (Figure 1a), with seven different colors: red, rose, brown, green, yellow, black and gold. Millimeter chips were taken from the reverse black side as well as from a companion black tray with a yellow lacquered rim.
- (b)
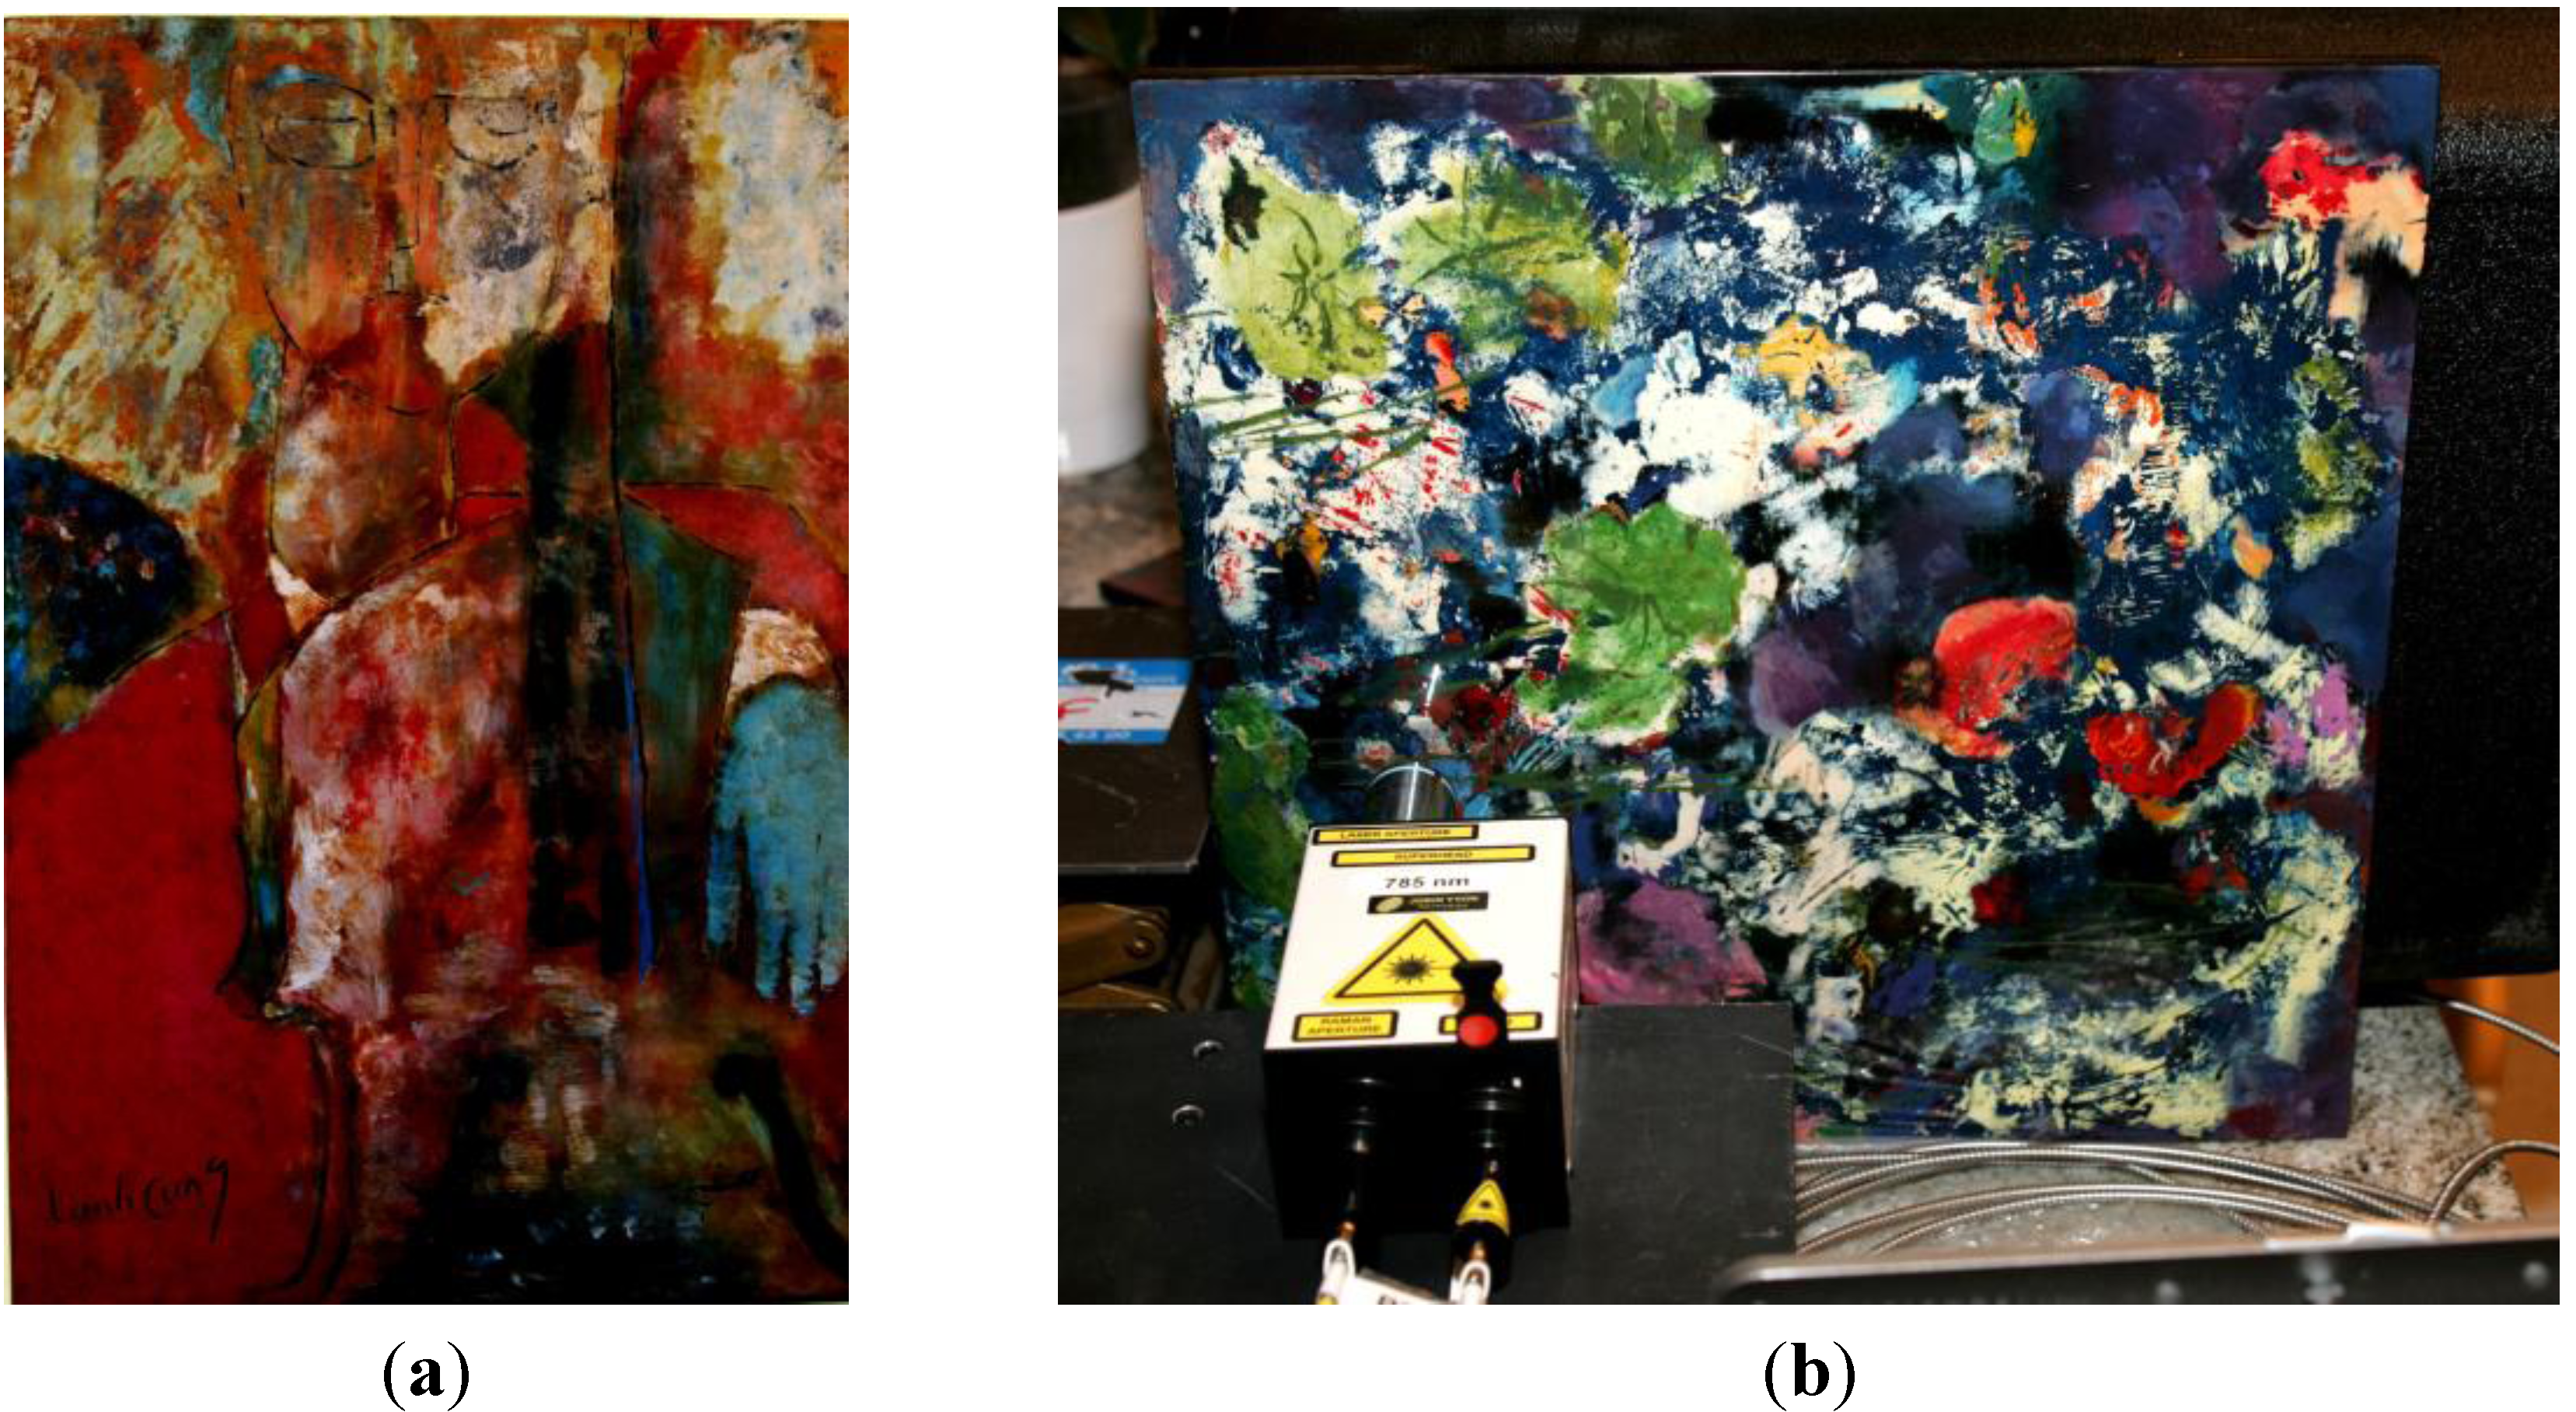
- a non-representational artwork (30 × 39.5 cm2, 1961, Figure 1b) in the style of Ta Ty, a famous Vietnamese Painter (1922–2004), with eight different colors: red, green, light green, brown, yellow, white and gold.
- (c)
- a portrait (15 × 20 cm2) from the beginning of the 1990s (Figure 1c), depicting the heroin from the famous Kim Vân Kiều novel by Nguyễn Du (1765–1820) with red, black and gold colors.The analyzed spots are indicated in Figure 1.Figure 3 (shows the lacquer paintings studied in the Collector’s rooms with the HE785 mobile Raman set-up:
- (d)
- a Đinh Cường (1939-) artwork, depicting a woman playing violin (60 × 40 cm2) with red, black, green, blue, yellow, white and gold colors.
- (e)
- an anonymous decorative lacquerware depicting flowers.
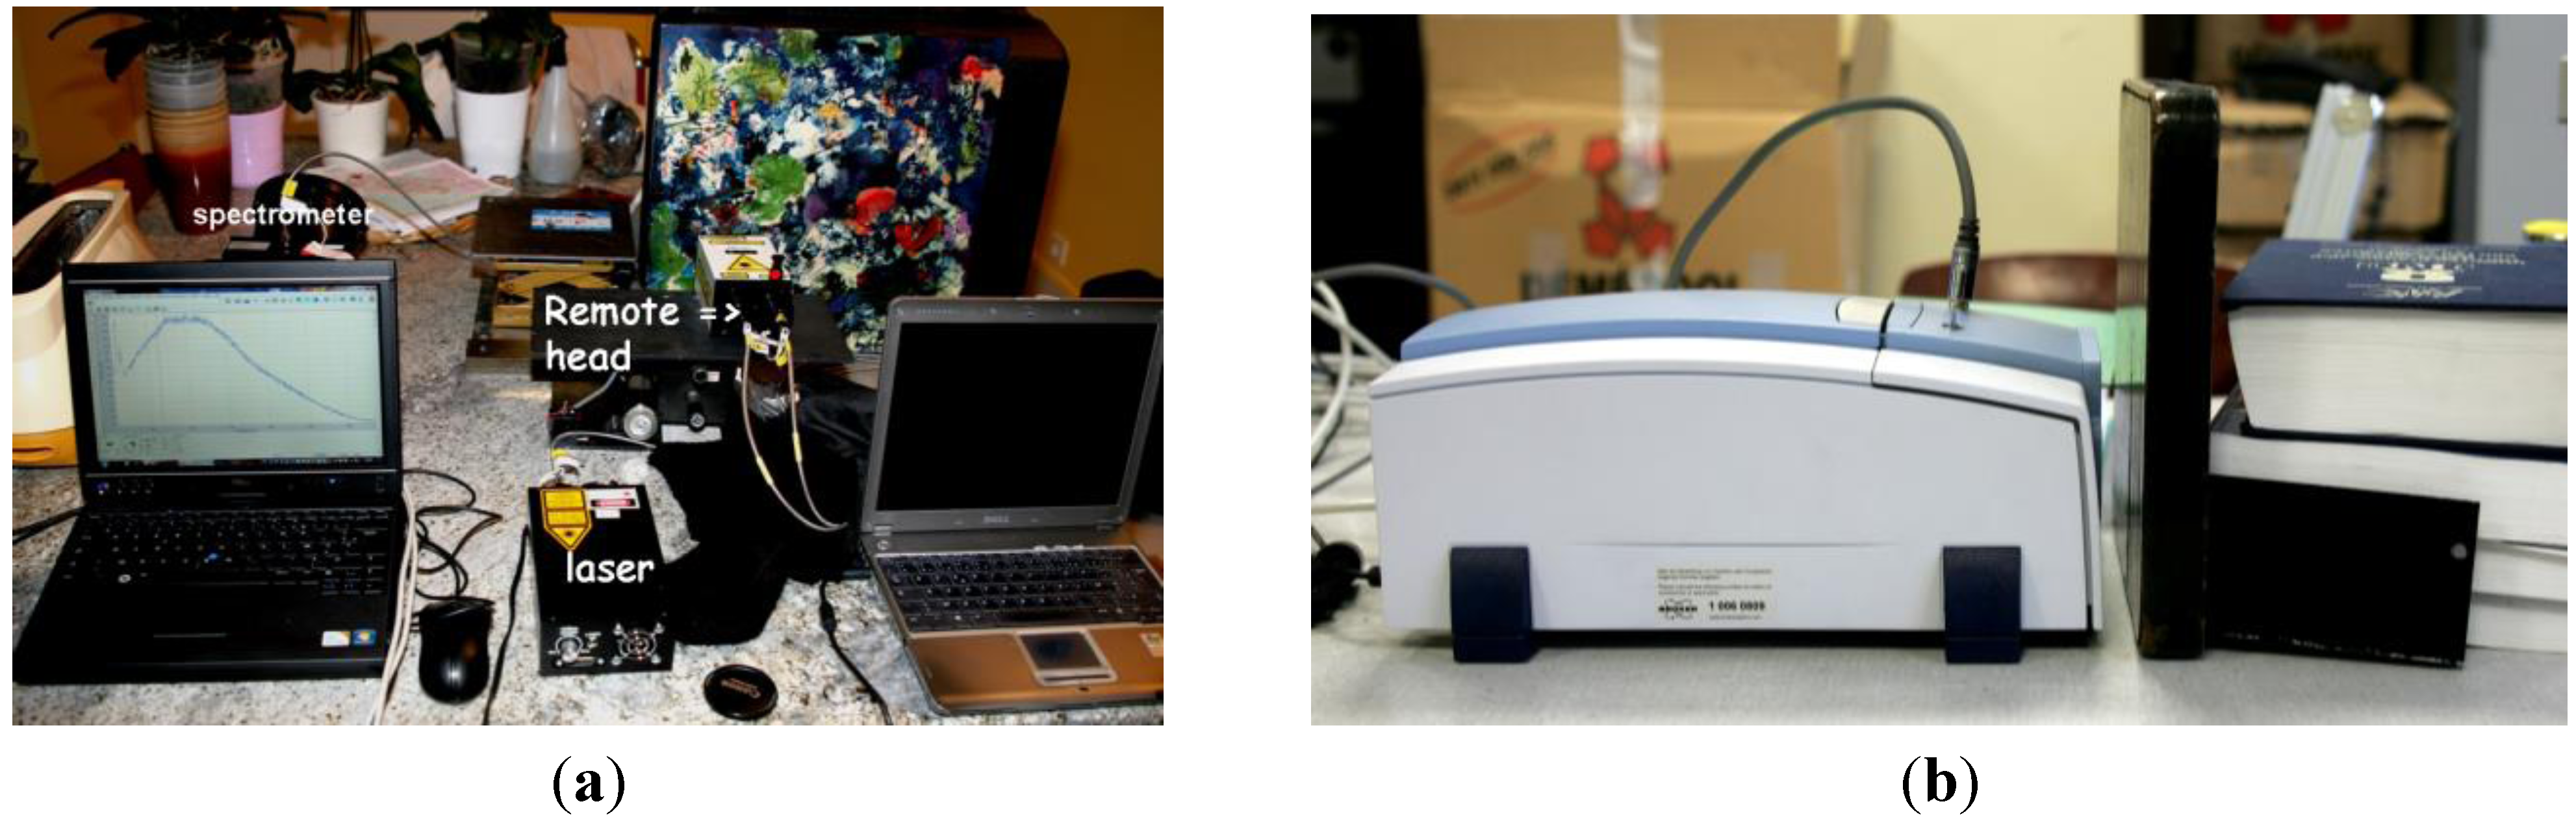
3.2. Techniques
- (i)
- a Senterra microspectrometer from Bruker Optics (Germany) equipped with a Peltier-cooled CCD matrix detector and with two laser sources (edge filtered Nd:YAG 532 nm and 785 nm diode).
- (ii)
- a RFS 100 s FT-Raman microscope III, also from Bruker Optics, equipped with a 1064 nm double Nd:YAG laser.
4. Results
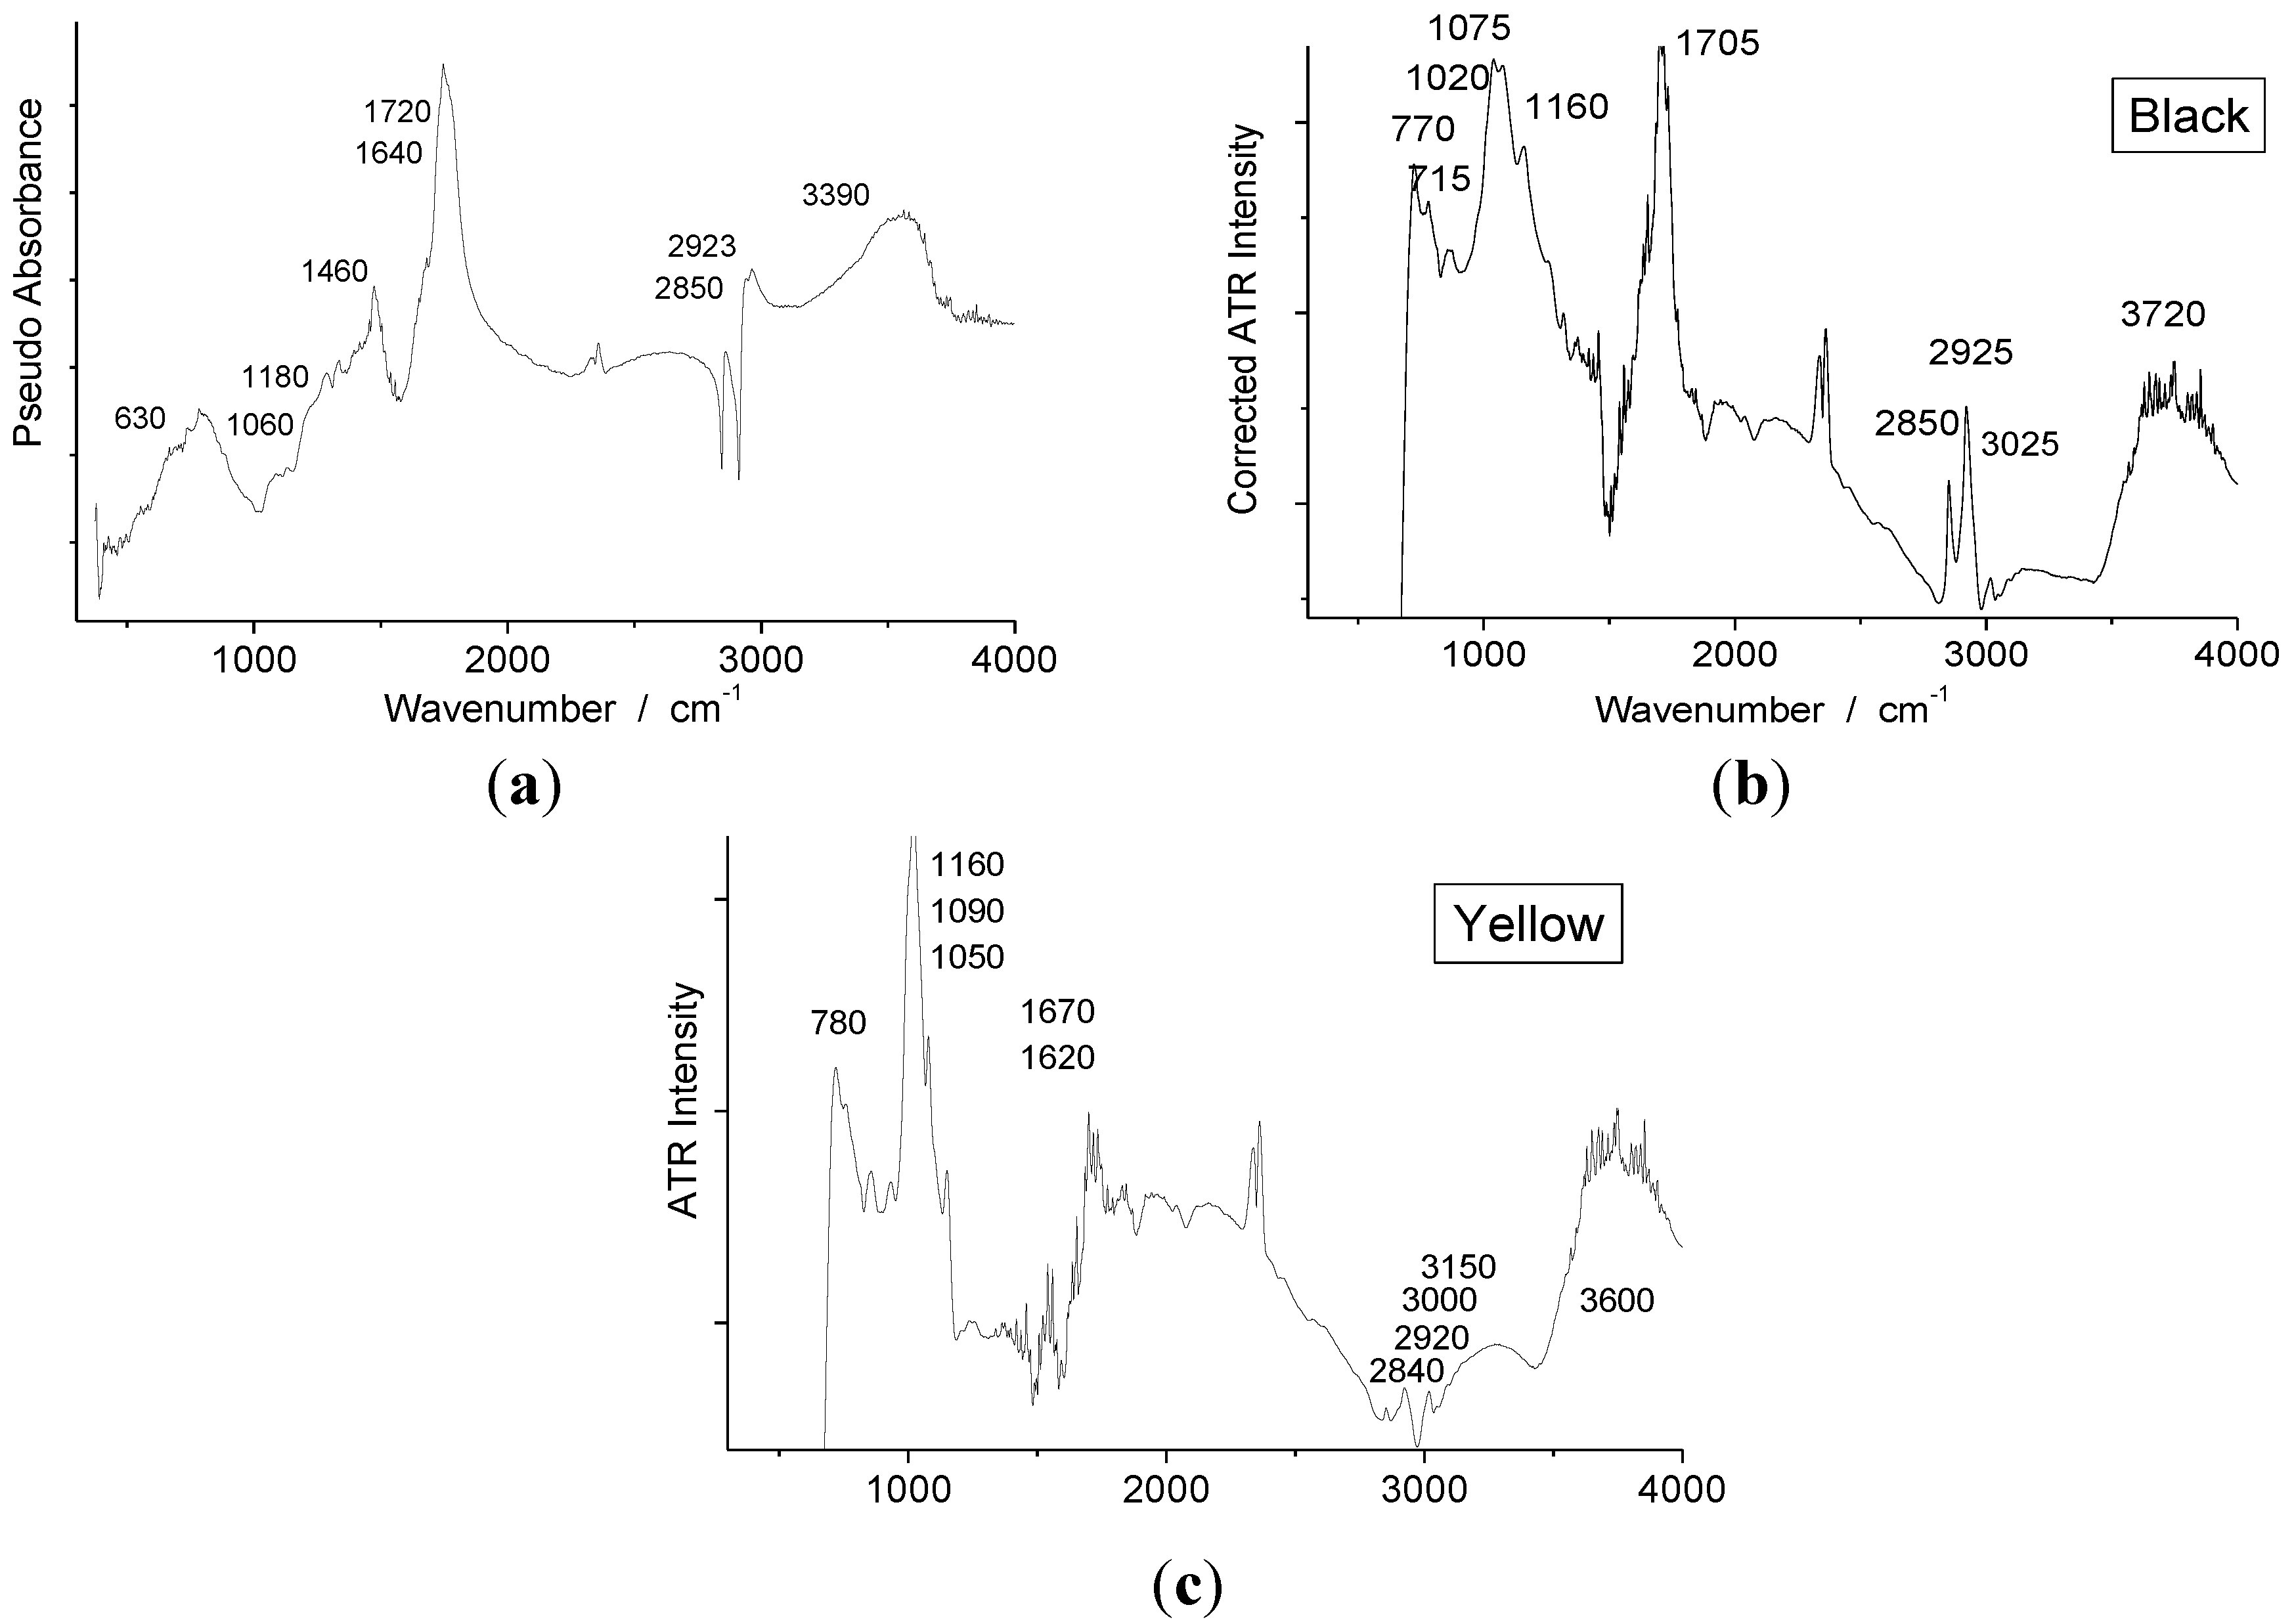
4.1. Lacquer Medium

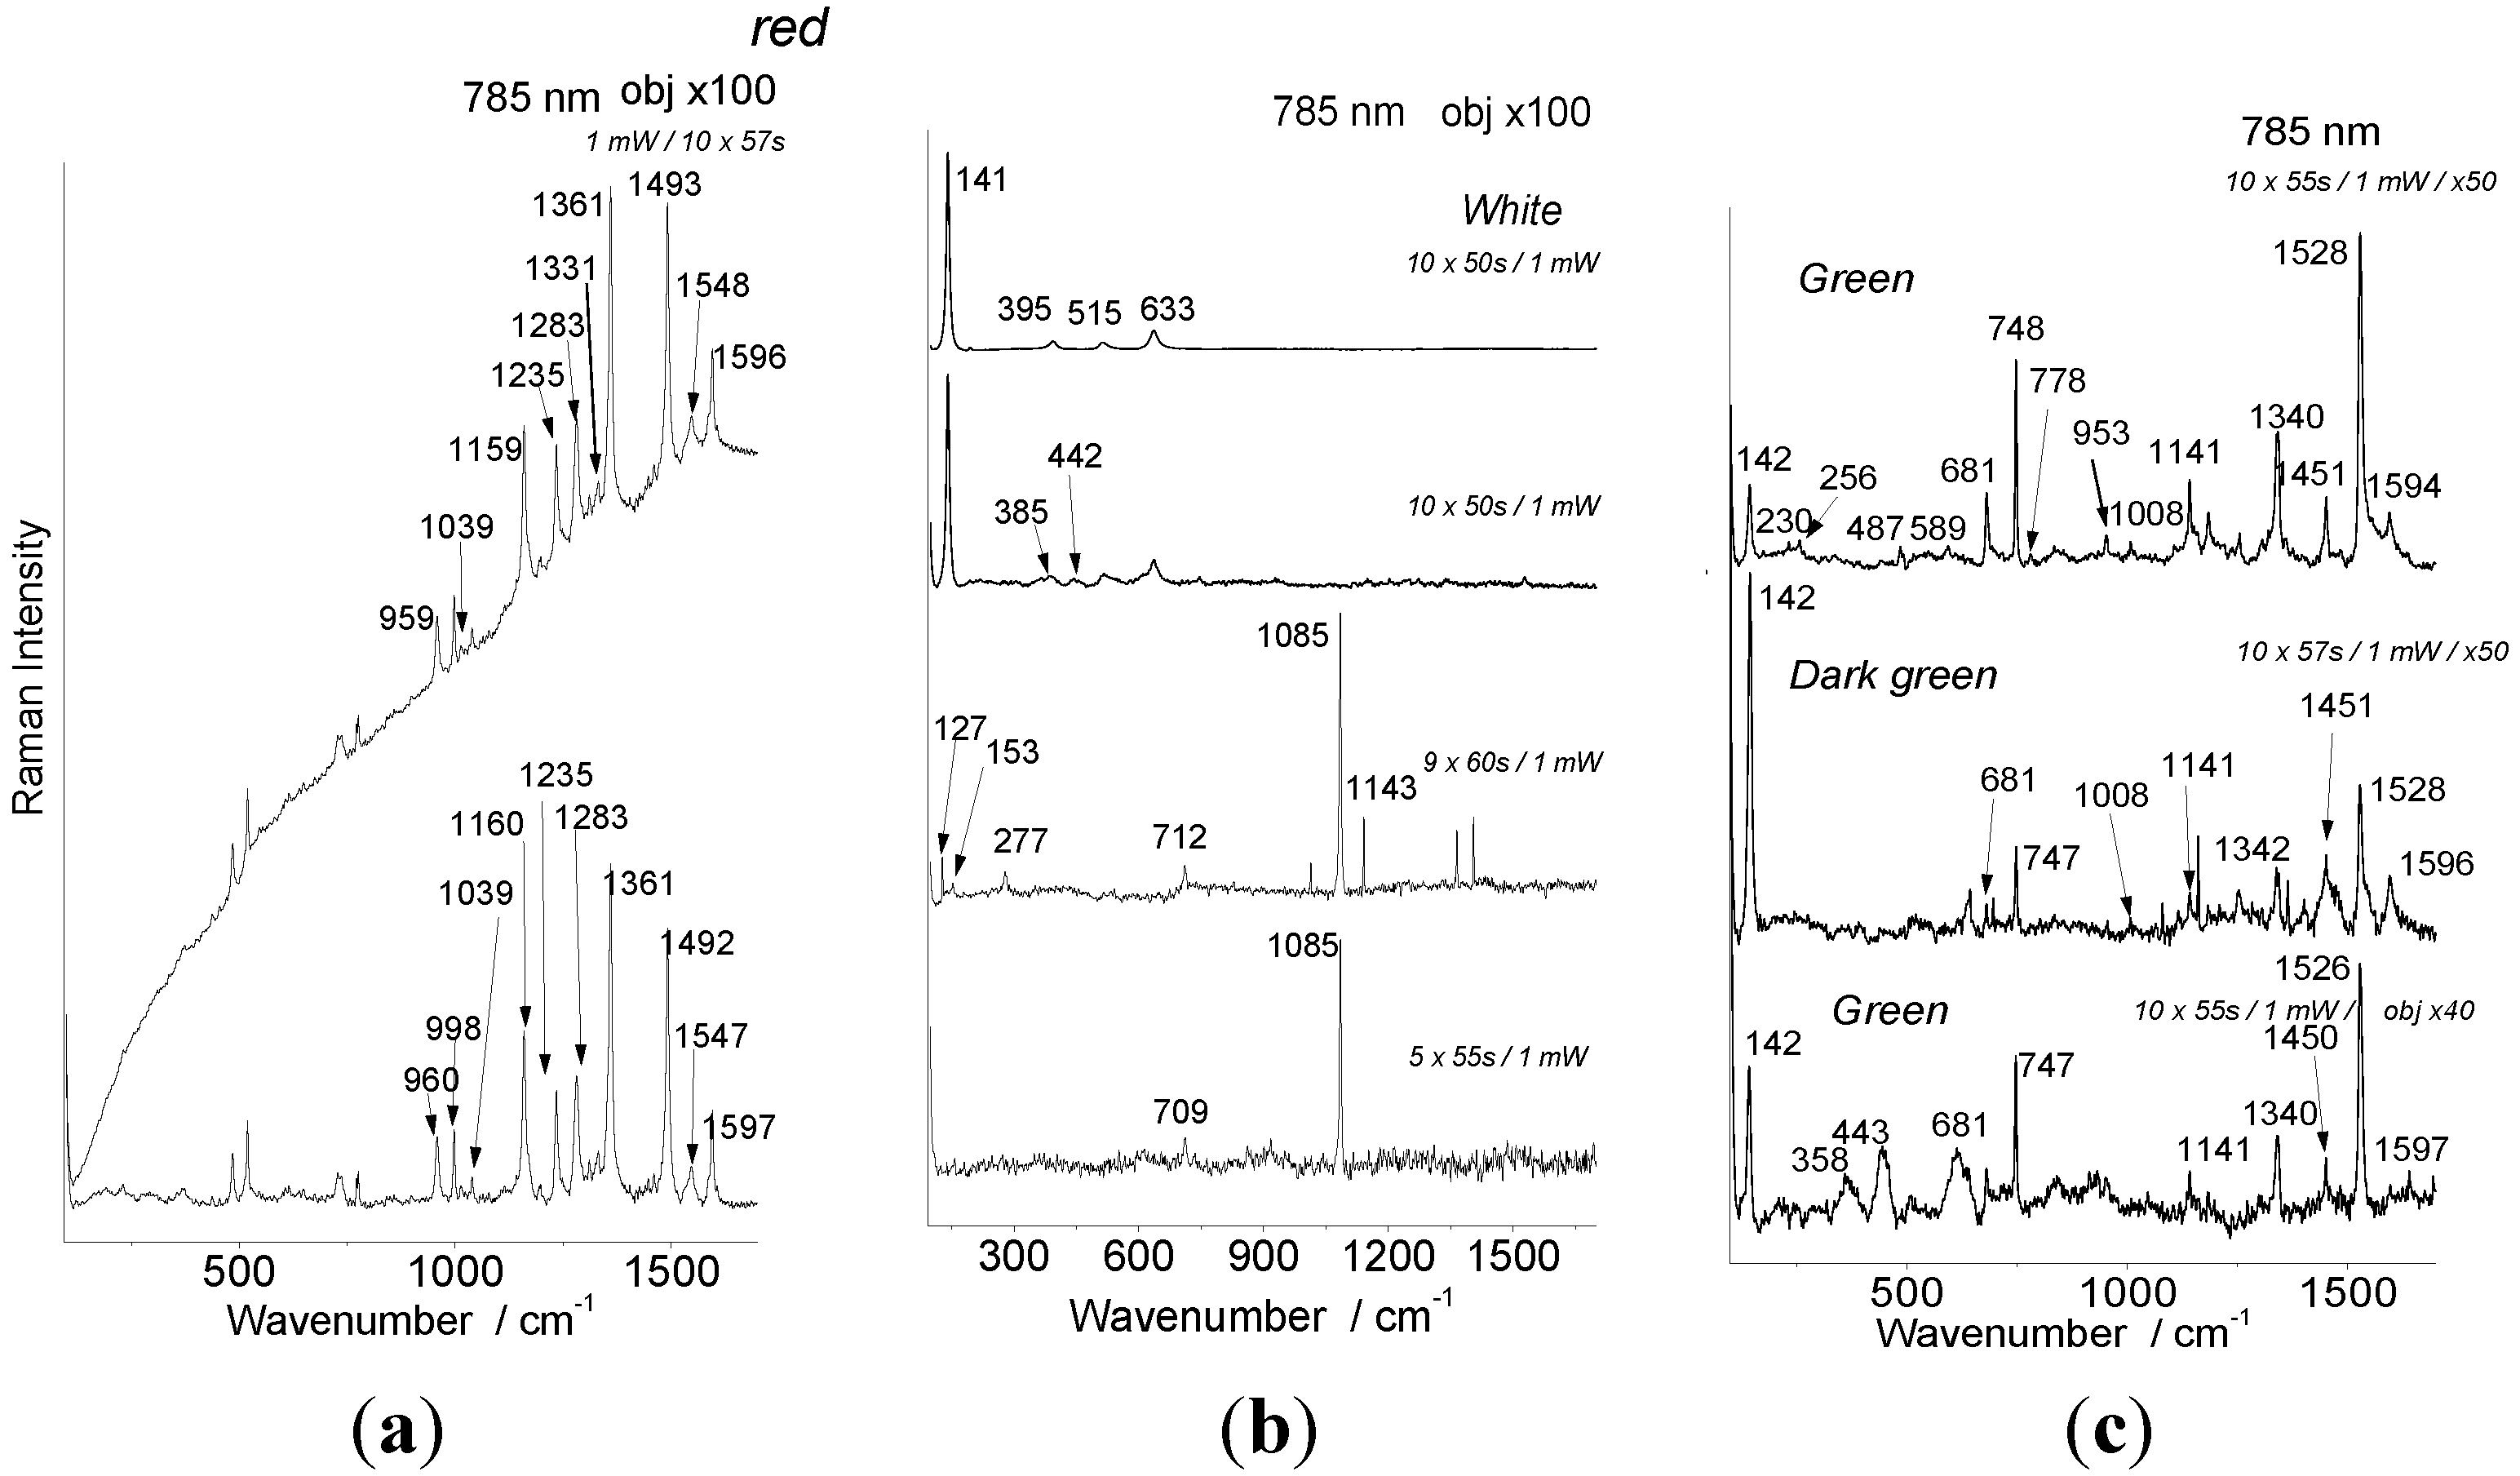
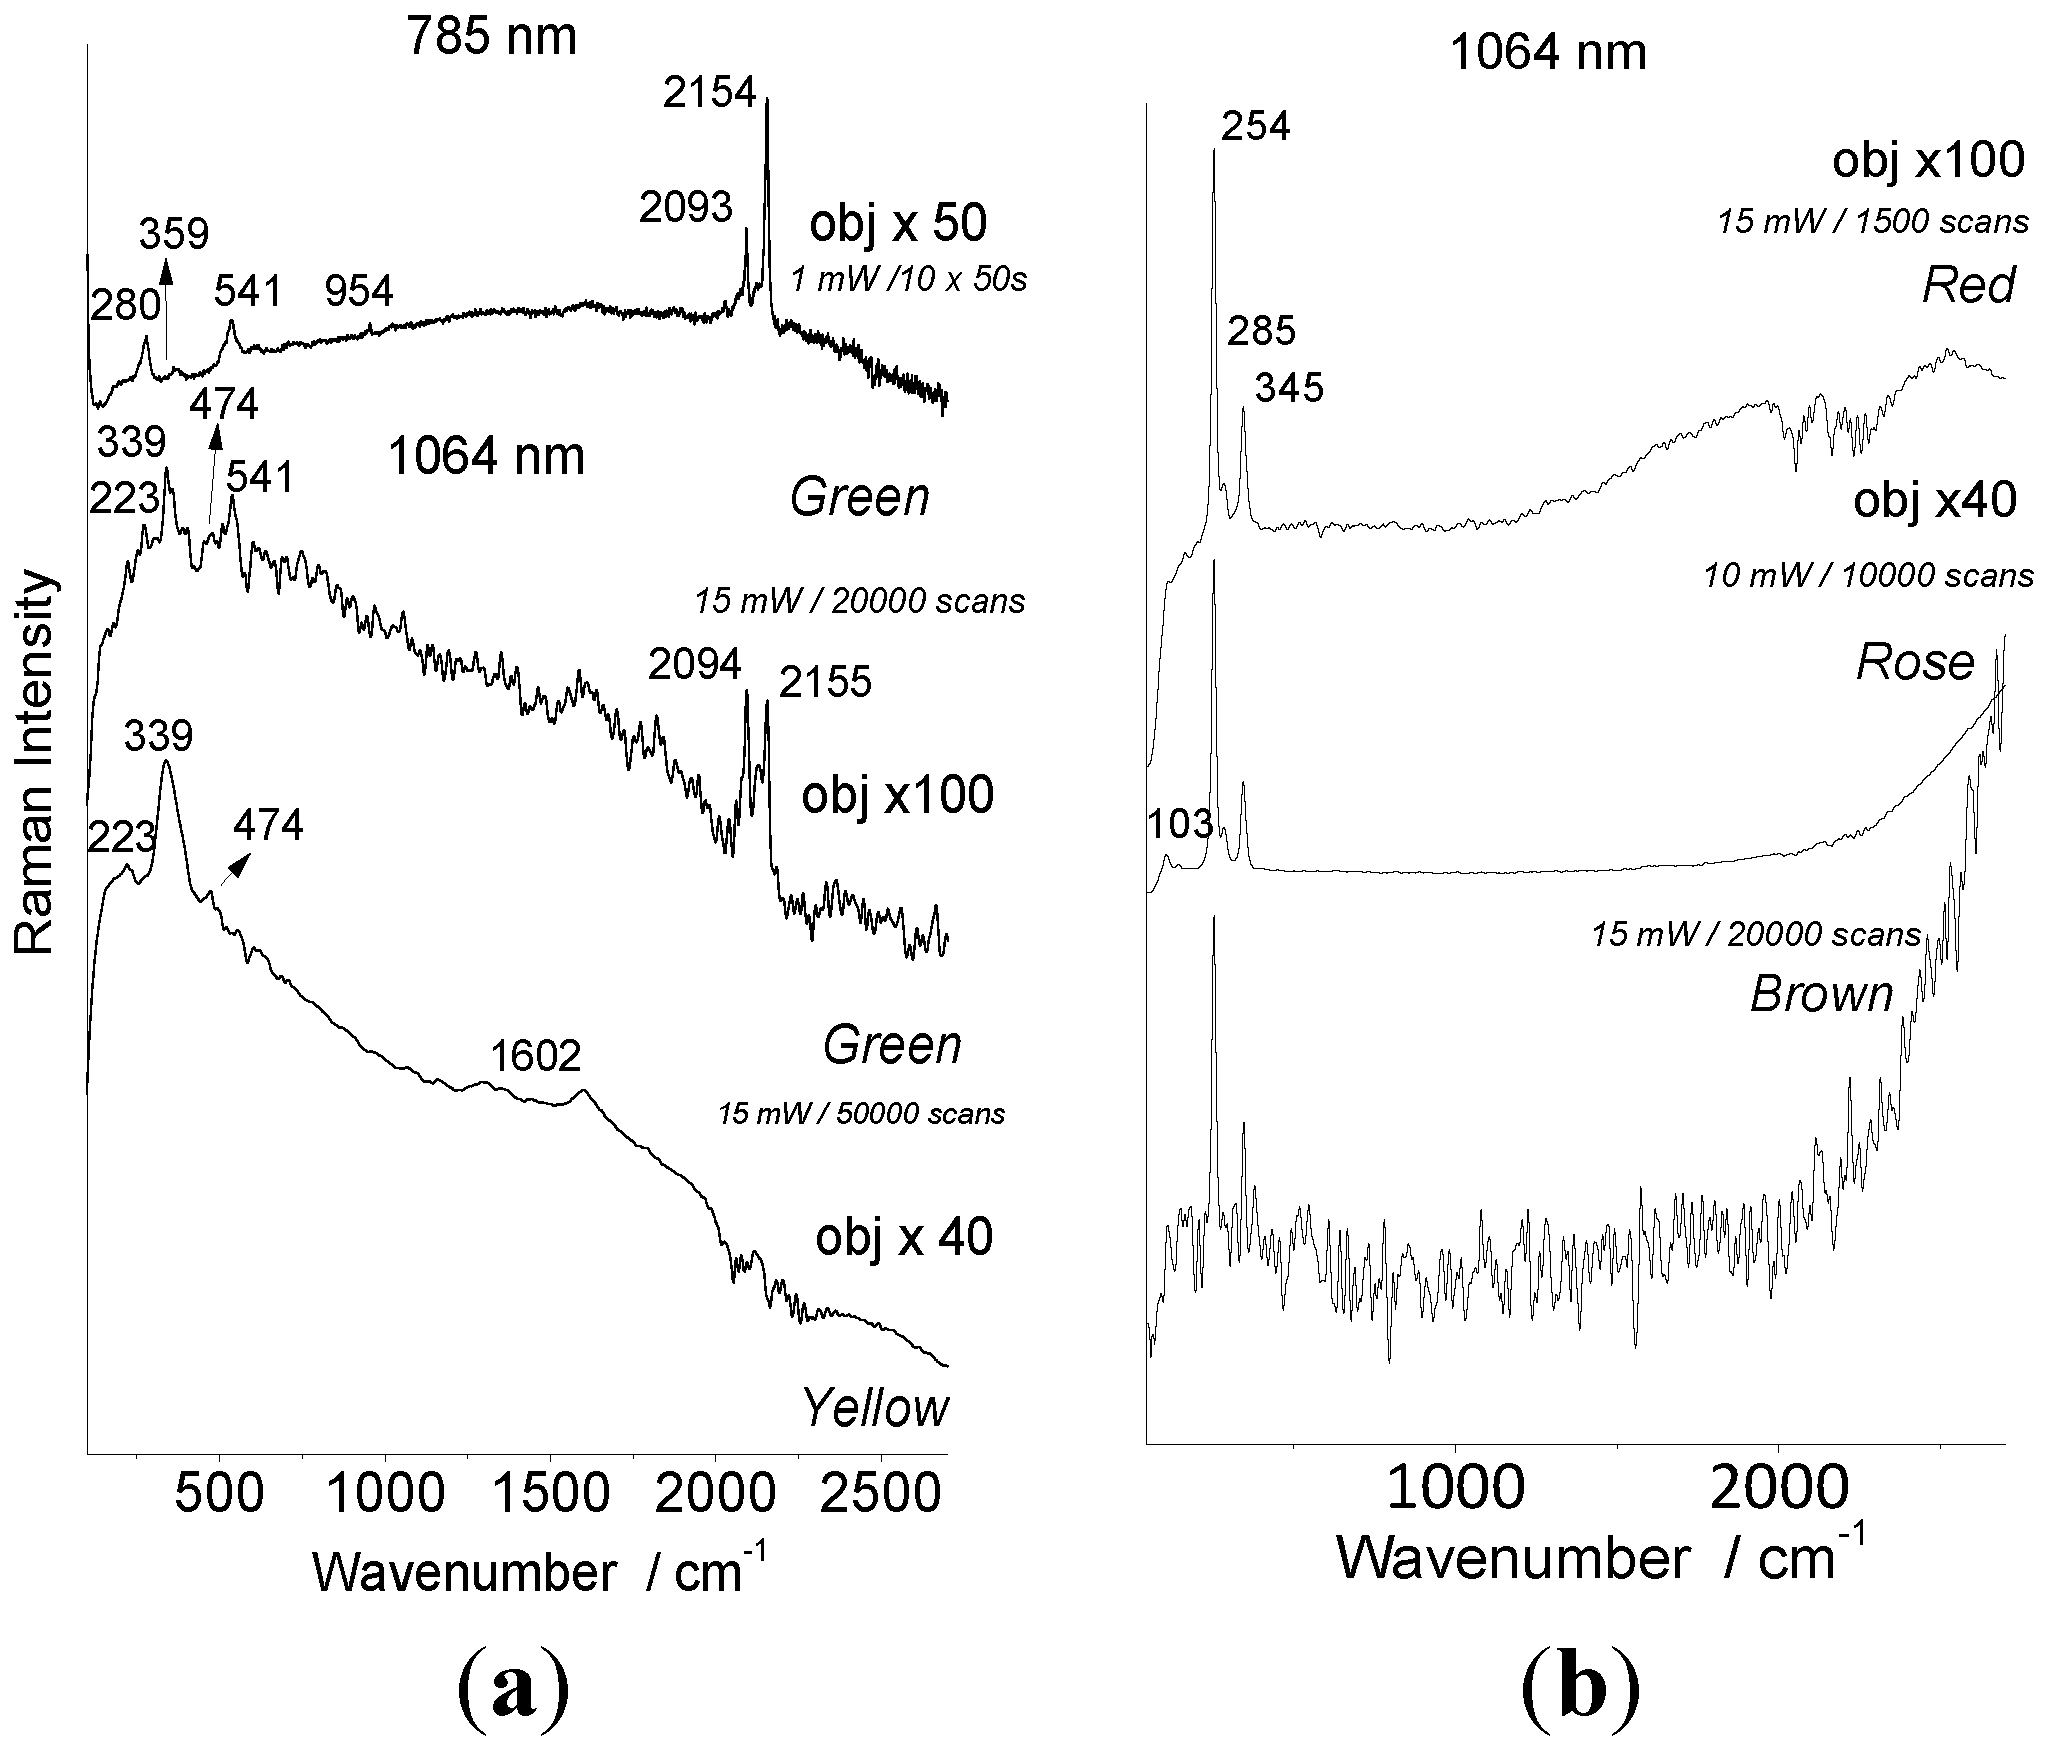
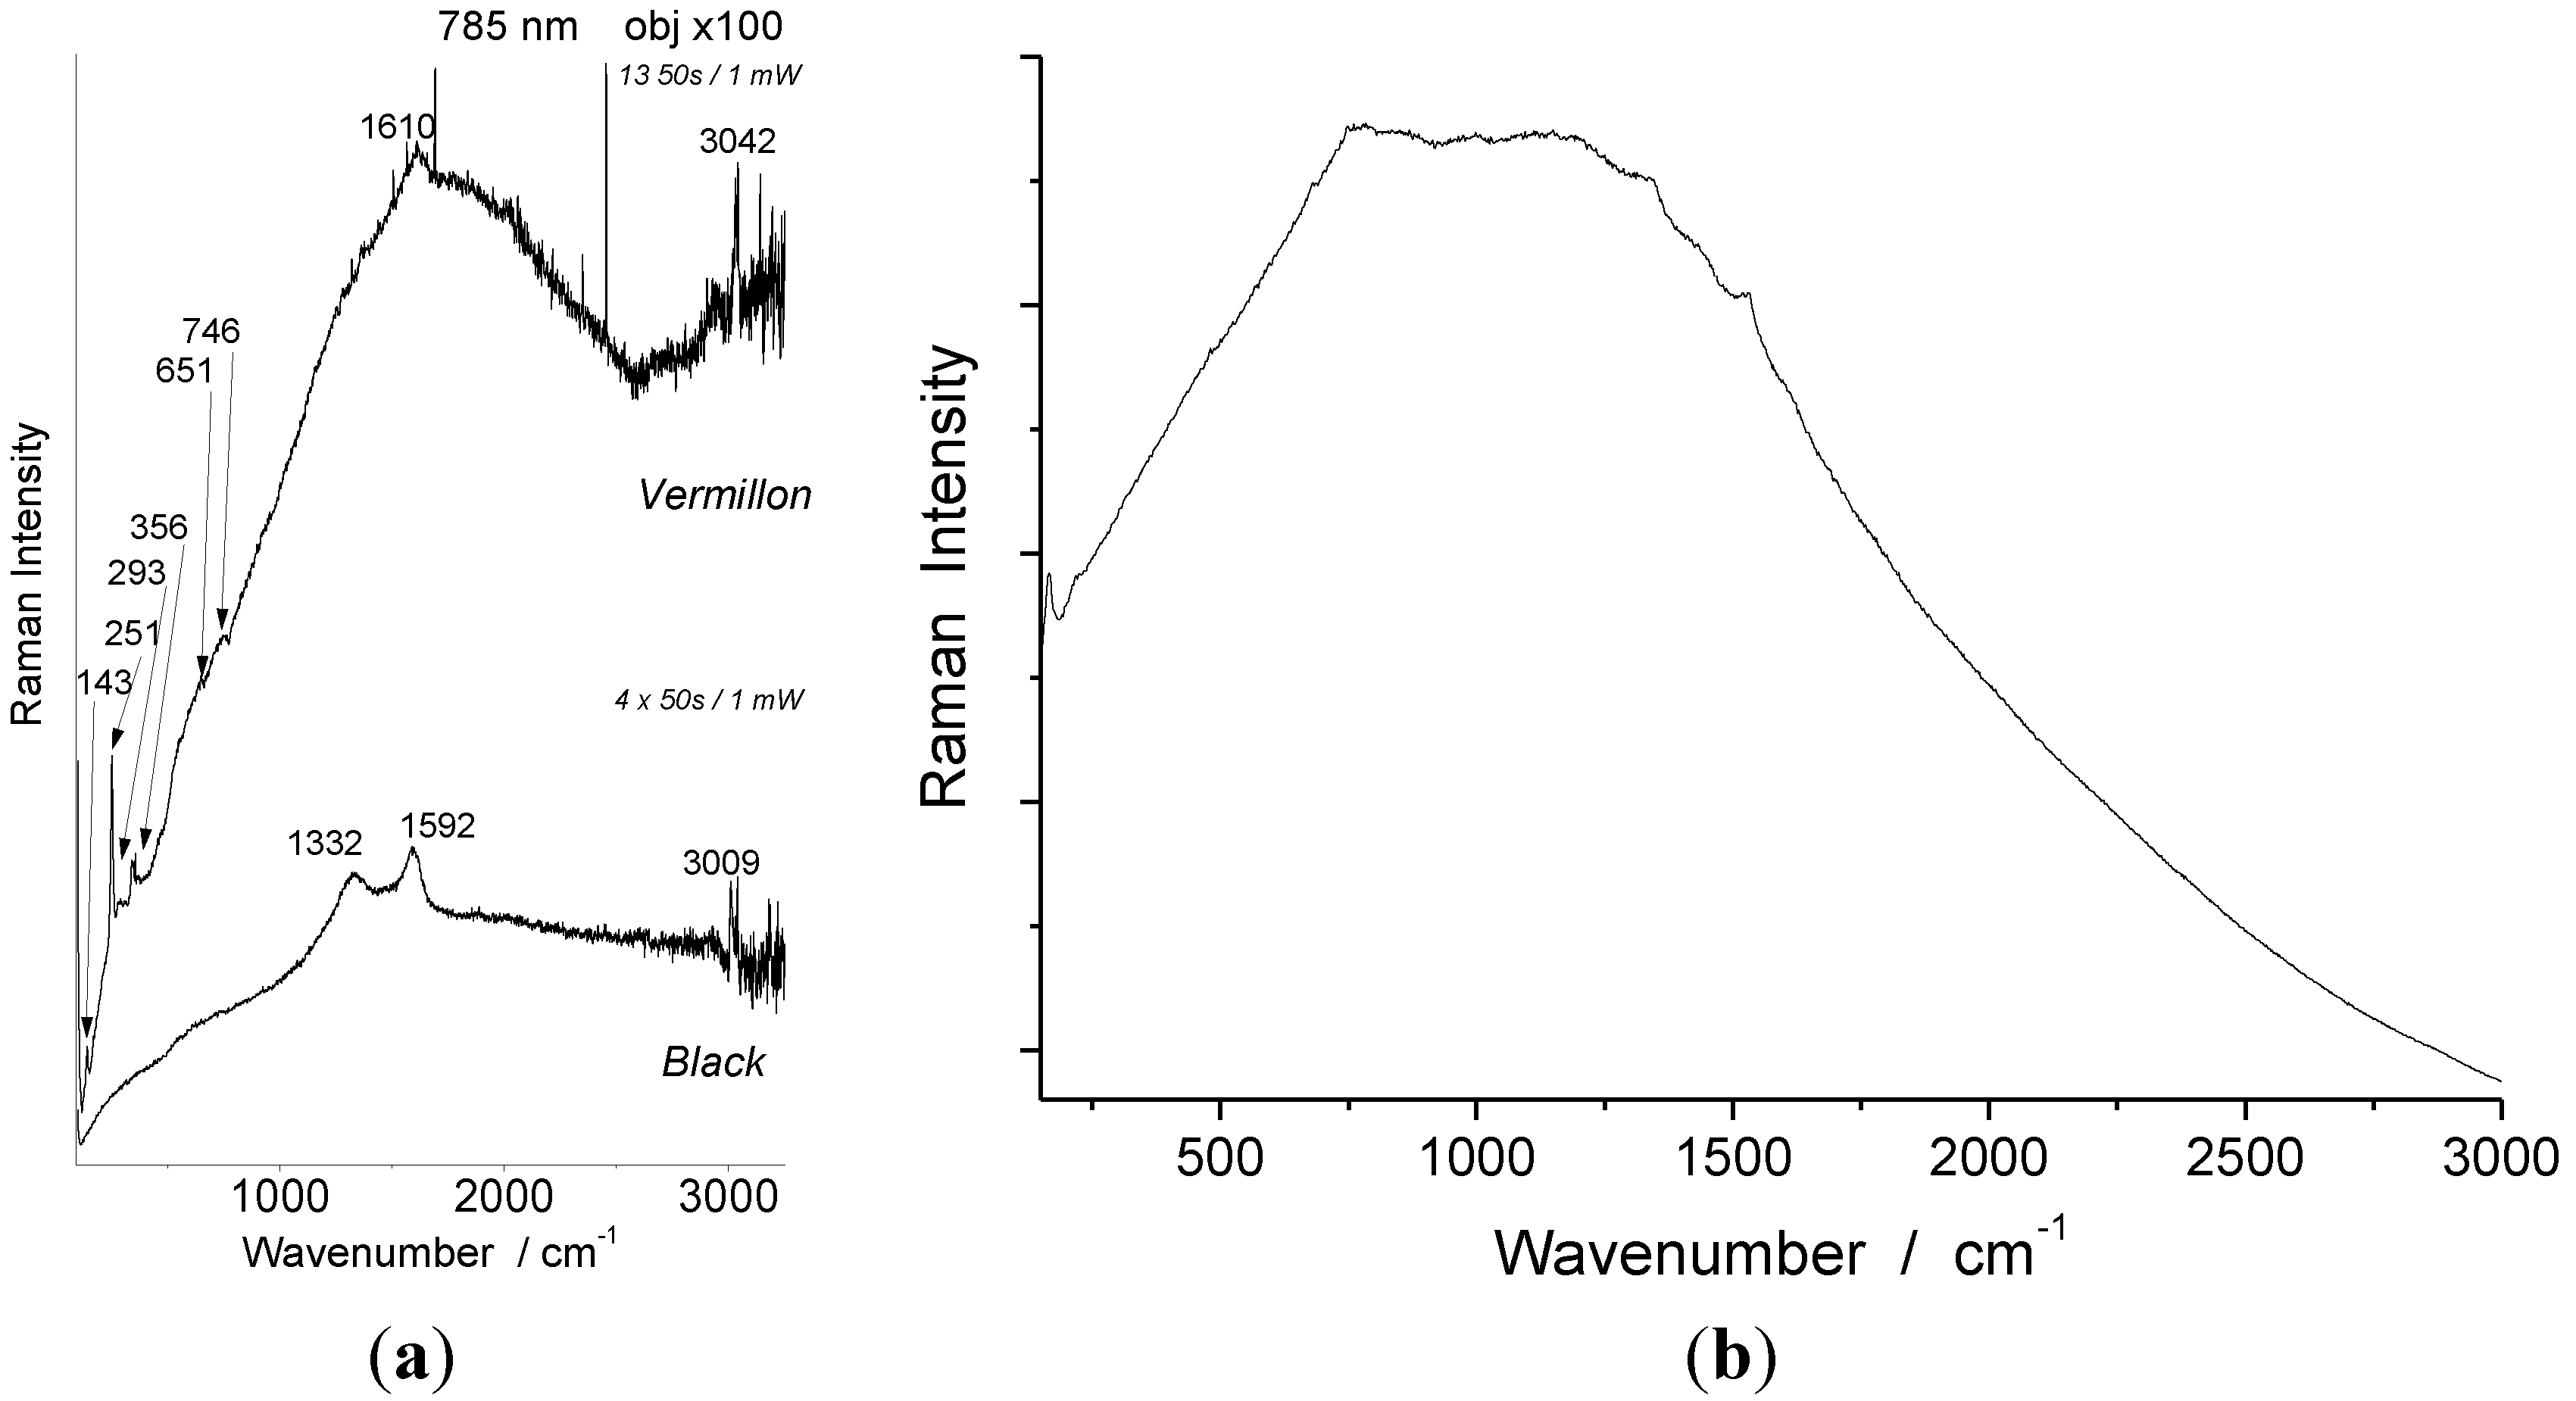
4.2. Pigments


| Artifact | Color | 785 nm identified | 1064 nm identified |
|---|---|---|---|
| Japanese tray | Red | HgS vermilion | HgS vermilion |
| Rose | none | HgS vermilion | |
| Green | Prussian blue | Prussian blue | |
| Brown | HgS vermilion | HgS vermilion | |
| Yellow | none | Pb3O4? | |
| Ta Ty’s lacquerware | Red | Purpurine | Purpurine |
| Green | Anatase Phthalocyanine blue | None | |
| Dark green | Anatase Phthalocyanine blue | None | |
| Yellow | Anatase | Anatase | |
| Brown | Anatase, Carbon | Carbon | |
| White | Anatase | Anatase | |
| White 1 | Egg shell | Egg shell | |
| Kim portrait | Red | HgS vermilion | HgS vermilion |
| Black | Carbon black | Carbon black |
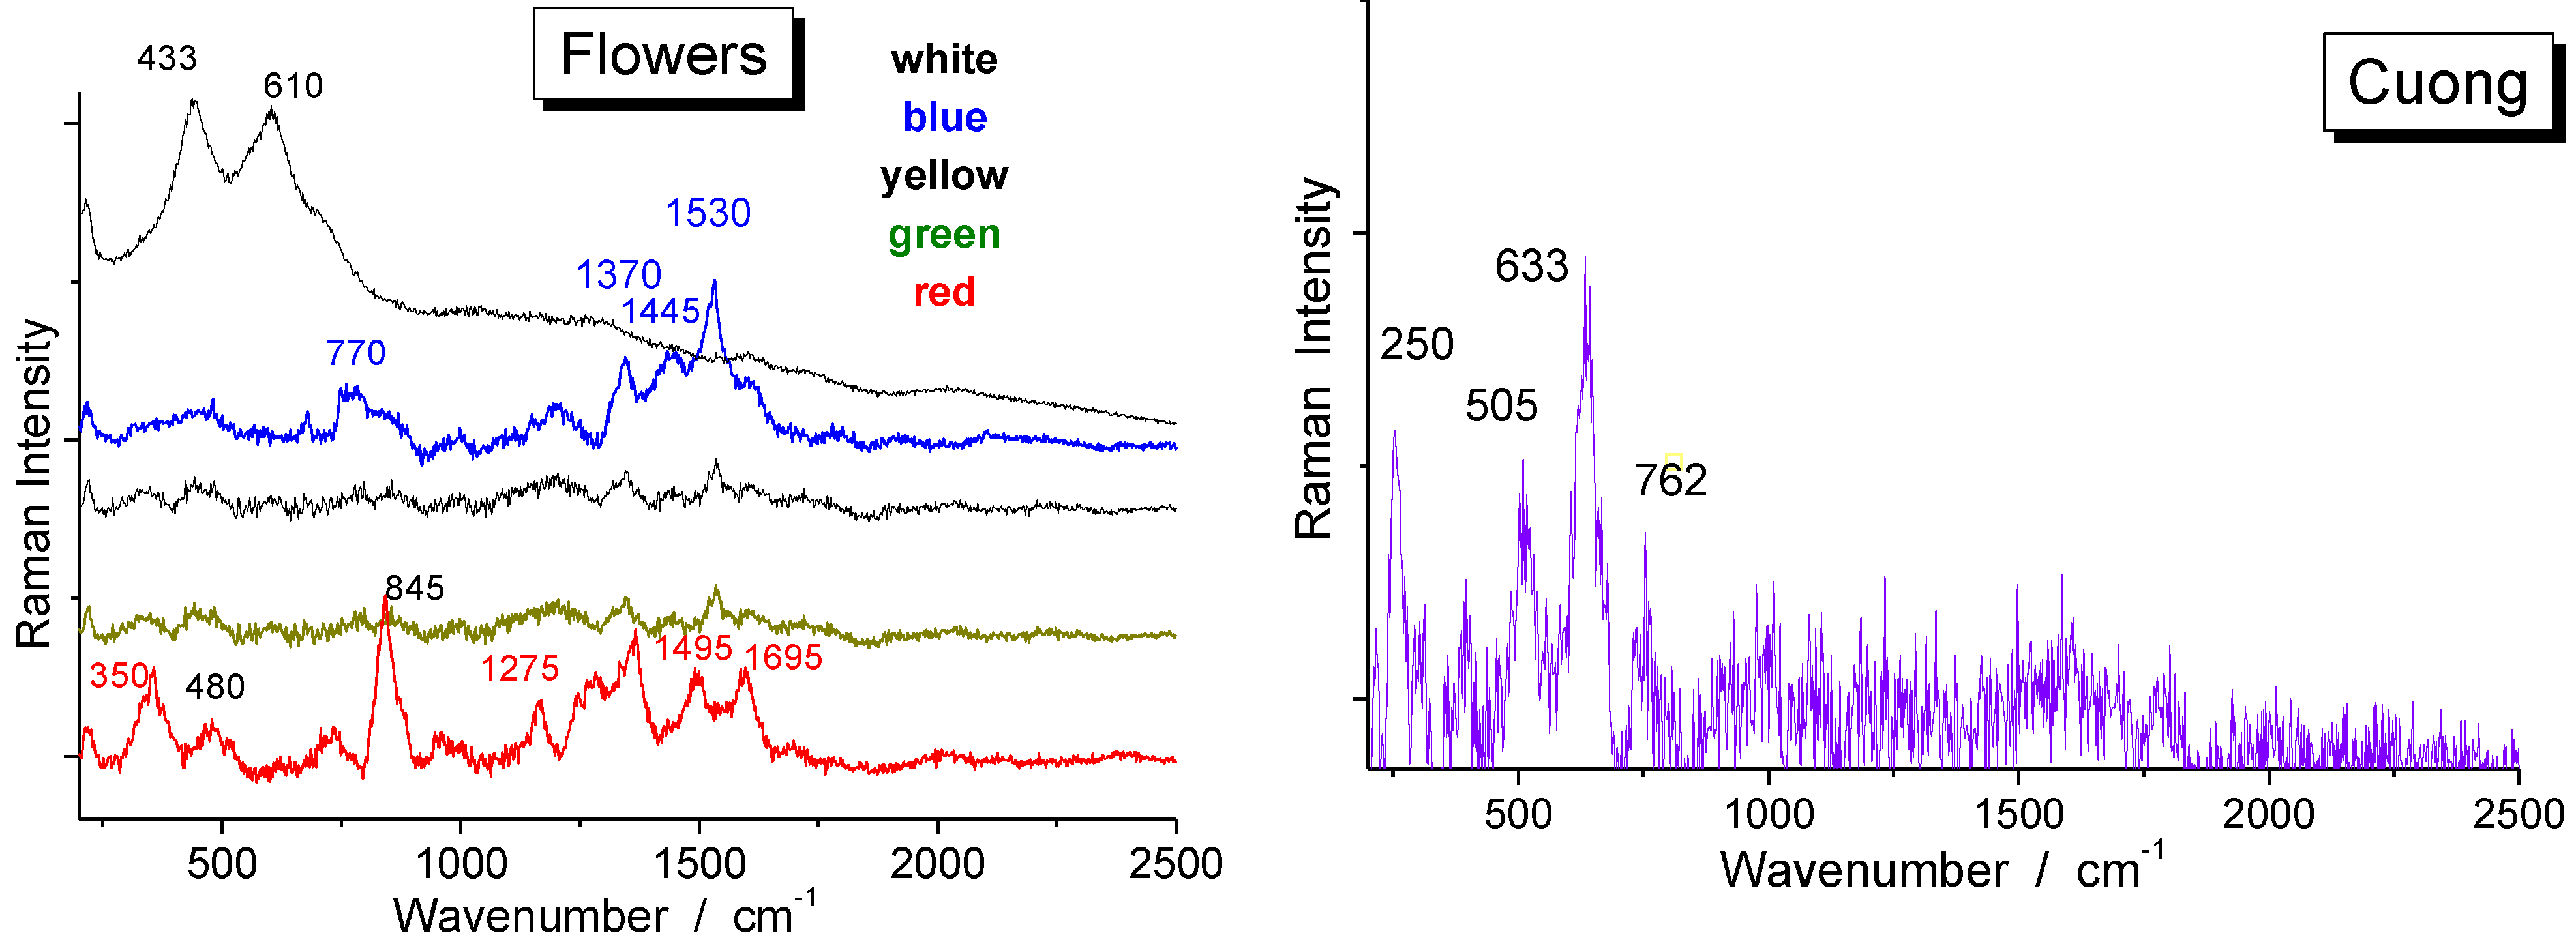
4.3. Test with the Mobile Raman Set-up

5. Conclusion
Acknowledgments
Conflict of Interest
References
- I.M. Bell, R.J.H. Clark, and P.J. Gibbs. “Raman spectroscopic library of natural and synthetic pigments (pre–similar to 1850 AD).” Spectrochim. Acta Part A 53 (1997): 2159–2179. [Google Scholar] [CrossRef]
- L. Burgio, and R.J.H. Clark. “Library of FT–Raman spectra of pigments, minerals, pigment media and varnishes, and supplement to existing library of Raman spectra of pigments with visible excitation.” Spectrochim. Acta Part A 57 (2001): 1491–1521. [Google Scholar] [CrossRef]
- R.J.H. Clark. “Raman Microscopy—Application to the identification of pigments on medieval manuscript.” Chem. Soc. Rev. 24 (1995): 187–196. [Google Scholar] [CrossRef]
- P. Colomban. Chemistry and the Heritage—From the Arts Chimiques to the Chemistry of Arts—The Destructive/Non–destructive Analysis Techniques of Enamelled Pottery and Glass Artefacts and Associated Pigments Chemistry for the XXI Century. Edited by J. Livage and F. Rochetm. Berlin: Springer Verlag, in press.
- S. Saverwyns. “Russian avant–garde … or not? A micro–Raman spectroscopy of six paintings attributed to Liubov Popovastudy.” J. Raman Spectrosc. 41 (2010): 1525–1532. [Google Scholar] [CrossRef]
- M.C. Caggiani, and P. Colomban. “Testing of Raman spectroscopy as a non–invasive tool for the investigation of glass–protected pastels.” J. Raman Spectrosc. 42 (2011): 790–798. [Google Scholar] [CrossRef]
- P. Vandenabeele, L. Moens, H.G.M. Edwards, and R. Dams. “Raman Spectroscopic Database of azo–pigments and application to modern art studies.” J. Raman Spectrosc. 31 (2000): 509–517. [Google Scholar] [CrossRef]
- F. Casadio, M. Leona, J.R. Lombardi, and R. van Dyune. “Identification of organic colorants in fibers, paints and glazes by Surface enhanced spectroscopy.” Acc. Chem. Res. 43 (2010): 782–791. [Google Scholar] [CrossRef]
- K.L. Wustholz, C.L. Brosseau, F. Casadio, and R. van Duyne. “Surface–enhanced Raman spectroscopy of dyes: From single molecules to the artists’ canvas.” Phys. Chem. Chem. Phys. 11 (2009): 7350–7359. [Google Scholar]
- F. Schulte, K.W. Brzezinka, K. Lutzenberger, H. Stege, and U. Panne. “Raman spectroscopy of synthetic organic pigments used in 20th century works of art.” J. Raman Spectrosc. 39 (2008): 1455–1463. [Google Scholar]
- J. Winter. East Asian Paintings Materials, Structures and Deterioration Mechanismes. London, UK: Archetype, 2008. [Google Scholar]
- D. Mancini, A. Tournié, M.C. Caggiani, and P. Colomban. “Testing of Raman spectroscopy as a non–invasive tool for the investigation of glass–protected miniature portraits.” J. Raman Spectrosc. 43 (2012): 294–302. [Google Scholar] [CrossRef]
- P. Colomban, G. Sagon, and X. Faurel. “Differentiation of antique ceramics from the Raman spectra of their colored glazes and paintings.” J. Raman Spectrosc. 32 (2001): 351–360. [Google Scholar] [CrossRef]
- P. Ricciardi, P. Colomban, A. Tournié, and V. Milande. “Non–destructive on–site identification of ancient glasses: Genuine artefacts, embellished pieces or forgeries? ” J. Raman Spectrosc. 40 (2009): 604–617. [Google Scholar] [CrossRef]
- K. Sakellariou, C. Miliani, A. Morresi, and M. Ombelli. “Spectroscopic investigation of yellow majolica glazes.” J. Raman Spectrosc. 35 (2004): 61–67. [Google Scholar] [CrossRef]
- P. Colomban. “On–site Raman identification and dating of ancient glasses: Procedures and tools.” J. Cult. Herit. 9 (2008): e55–e60. [Google Scholar] [CrossRef]
- P. Colomban, A. Tournié, M. Maucuer, and P. Meynard. “On–site Raman and XRF analysis of Japanese/Chinese Bronze/Brass Patina—The search of specific Raman signatures.” J. Raman Spectrosc. 43 (2012): 799–808. [Google Scholar] [CrossRef]
- P. Colomban, A. Tournié, and L. Bellot–Gurlet. “Raman Identification of glassy silicates used in ceramic, glass and jewellry: A tentative differentiation guide.” J. Raman Spectrosc. 37 (2006): 841–852. [Google Scholar] [CrossRef]
- P. Colomban. “The on–site/remote Raman analysis with portable instruments—A review of drawbacks and success in Cultural Heritage studies and other associated fields.” J. Raman Spectrosc. 43 (2012): 1529–1535. [Google Scholar] [CrossRef]
- P. Colomban. “Analyses Non–destructives des Objets d'art par Méthodes Portables.” in Techniques de l'Ingénieur, RE 217. Paris; 2012. Available online: http://www.techniques-ingenieur.fr/base-documentaire/innovations-th10/innovations-en-analyses-et-mesures-42112210/analyse-non-destructive-des-objets-d-art-par-methodes-spectroscopiques-portables-re217 (accessed on 8th July 2013).
- T. Honda, R. Lu, R. Sakai, T. Ishimura, and T. Miyakoshi. “Characterization and comparison of Asian lacquer saps.” Progr. Organ. Coatings 61 (2008): 68–75. [Google Scholar] [CrossRef]
- N. Niimura. “Determination of the type of lacquer on East Asian lacquer ware.” Int. J. Mass Spectrom. 284 (2009): 93–97. [Google Scholar] [CrossRef]
- J.C. Frade, M.I. Ribeiro , J. Graça, and J. Rodrigues. “Applying pyrolysis–gas chromatography/mass spectrometry to the identification of oriental lacquers: Study of two lacquered shields.” Anal. Bioanal. Chem. 395 (2009): 2167–2174. [Google Scholar] [CrossRef]
- N. Niimura, and T. Miyakoshi. “Structural studies of oriental lacquer films during the hardning process.” Talanta 70 (2006): 146–152. [Google Scholar] [CrossRef]
- T. Li, Y.-F. Xie, Y.-M. Yang, C.-S. Wang, X.-Y. Fang, J.-L. Shi, and Q.-J. He. “Pigment identification and decoration analysis of a 5th century Chinese lacquer painting lacquer screen: A micro Raman and FTIR study.” J. Raman Spectrosc. 40 (2009): 1911–1918. [Google Scholar] [CrossRef]
- P.-J. Jin, Z.-Q. Yao, M.-L. Zhang, Y.-H. Li, and H.-P. Xing. “A pigment (CuS) identified by micro-Raman spectroscopy on a Chinese funerary lacquer ware of West Han Dynasty.” J. Raman Spectrosc. 41 (2010): 222–225. [Google Scholar]
- S. Wei, V. Pintus, V. Pitthard, M. Schreiner, and G. Song. “Analytical characterization of lacquer objects excavated from a Chu tomb in China.” J. Archaeol. Sci. 38 (2011): 2667–2674. [Google Scholar]
- V. Pitthard, S. Wei, S. Miklin-Kniefacz, S. Stanek, M. Griesser, and M. Schreiner. “Scientific investigation of antique lacquers from a 17th century Japanese ornamental cabinet.” Archaeometry 52 (2010): 1044–1056. [Google Scholar]
- K. Hatada, T. Kitayama, T. Nishiura, A. Nishimoto, W.J. Simonsick, and O. Vogl. “Structural analysis of the component of Chinese lacquer Kuro–Urushi.” Macromol. Chem. Phys. 5 (1994): 1865–1870. [Google Scholar]
- T. Honda, R. Lu, N. Kitano, Y. Kamiya, and T. Miyakoshi. “Applied analysis and identification of ancient lacquer based on pyrolysis–gas chromatography/mass spectrometry.” J. Appl. Polymer Sci. 2 (2010): 897. [Google Scholar]
- N. André–Pallois. “L’Indochine: Un lieu d'échange culturel? ” Monographies n° 184; de L'Ecole Française d'Extrême Orient, Paris, 1997. [Google Scholar]
- J.-F. Hubert. L'Âme du Viêt Nam. Paris, France: Cercle d'Art, 1996. [Google Scholar]
- E. Daydé, N. André–Pallois, C. de Ménonville, D.P. Quynh, N. Trung, and P. Jorland. Paris–Hanoi–Saigon, L'Aventure de l'Art Moderne au Viêt Nam. PARIS musées, 1998. [Google Scholar]
- T.V. Can. Lacquer Paintings of Viet Nam. Hanoi, Vietnam: Foreign Languages Publishing House, 1977. [Google Scholar]
- “Raman Spectroscopic library. ” Available online: www.chem.ucl.ac.uk/ resources/raman/index.html (accessed on day June 2012).
© 2013 by the authors; licensee MDPI, Basel, Switzerland. This article is an open access article distributed under the terms and conditions of the Creative Commons Attribution license (http://creativecommons.org/licenses/by/3.0/).
Share and Cite
Colomban, P.; Mancini, D. Lacquerware Pigment Identification with Fixed and Mobile Raman Microspectrometers: A Potential Technique to Differentiate Original/Fake Artworks. Arts 2013, 2, 111-123. https://doi.org/10.3390/arts2030111
Colomban P, Mancini D. Lacquerware Pigment Identification with Fixed and Mobile Raman Microspectrometers: A Potential Technique to Differentiate Original/Fake Artworks. Arts. 2013; 2(3):111-123. https://doi.org/10.3390/arts2030111
Chicago/Turabian StyleColomban, Philippe, and Diana Mancini. 2013. "Lacquerware Pigment Identification with Fixed and Mobile Raman Microspectrometers: A Potential Technique to Differentiate Original/Fake Artworks" Arts 2, no. 3: 111-123. https://doi.org/10.3390/arts2030111
APA StyleColomban, P., & Mancini, D. (2013). Lacquerware Pigment Identification with Fixed and Mobile Raman Microspectrometers: A Potential Technique to Differentiate Original/Fake Artworks. Arts, 2(3), 111-123. https://doi.org/10.3390/arts2030111