Effect of Environmental Factors on Intra-Specific Inhibitory Activity of Carnobacterium maltaromaticum


Tasmanian Institute of Agriculture, Food Safety Centre, University of Tasmania, Private Bag 54, Hobart, Tasmania 7001, Australia
*
Author to whom correspondence should be addressed.
†
Current address: Agriculture and Agri-Food Canada, 6000 C&E Trail, Lacombe, AB T4L 1W1, Canada.
Microorganisms 2017, 5(3), 59; https://doi.org/10.3390/microorganisms5030059
Submission received: 26 June 2017
/
Revised: 6 September 2017
/
Accepted: 7 September 2017
/
Published: 14 September 2017
(This article belongs to the Special Issue Response of Microbial Communities to Environmental Changes)
Abstract
:Carnobacterium maltaromaticum is frequently associated with foods having extended shelf-life due to its inhibitory activity to other bacteria. The quantification of such inhibition interactions affected by various environmental factors is limited. This study investigated the effect of environmental factors relevant to vacuum-packaged beef on inhibition between two model isolates of C. maltaromaticum, D0h and D8c, specifically D8c sensitivity to D0h inhibition and D0h inhibitor production. The effects of temperature (−1, 7, 15, 25 °C), atmosphere (aerobic and anaerobic), pH (5.5, 6, 6.5), lactic acid (0, 25, 50 mM) and glucose (0, 0.56, 5.55 mM) on D8c sensitivity (diameter of an inhibition zone) were measured. The effects of pH, glucose, lactic acid and atmosphere on D0h inhibitor production were measured at 25 °C. Sensitivity of D8c was the highest at 15 °C, under aerobic atmosphere, at higher concentrations of undissociated lactic acid and glucose, and at pH 5.5 (p < 0.001). pH significantly affected D0h inhibitor production (p < 0.001), which was the highest at pH 6.5. The effect of lactic acid depended upon pH level; at relatively low pH (5.5), lactic acid decreased the production rate (arbitrary inhibition unit (AU)/mL/h). This study provides a quantitative description of intra-species interactions, studied in in vitro environments that are relevant to vacuum-packaged beef.
1. Introduction
Bacteria interact in any given niche, and these interactions may have a positive or negative impact on the involved species [1]. Bacteria compete by secreting defensive compounds, directly ‘scrambling’ for nutrients or performing contact-dependent inhibition [1,2,3,4]. A type VI secretion delivery system (T6SS) is found to be utilized by Pseudomonas aeruginosa to deliver bacteriolytic effectors to other Gram-negative bacterial cells [5]. Furthermore, this tubular system has been identified in >80 Gram-negative bacterial genomes, including many members of the family Enterobacteriaceae [6]. Conversely, some bacteria are able to cooperate by exchanging metabolic products or via quorum sensing systems [1,7,8,9]. For example, Bifidobacterium bifidum, a probiotic organism that is often found in human intestines, and Listeria monocytogenes, an opportunistic pathogen, mutually promote each other’s growth [10]. According to D'Onofrio et al. [11], previously uncultured bacteria from marine sediment grew on agar in the presence of readily-cultured bacteria due to the latter forming growth-promoting siderophores.
Bacterial interactions have been frequently reported in food-relevant environments. A few researchers have observed the inhibitory effect of natural microbiota of meat on the growth of pathogens, which has been defined as the ‘Jameson effect’ [12,13,14]. Nychas et al. [15] found that the growth rates of both Serratia marcescens and Pseudomonas fluorescens, the main spoilage organisms in pork, were increased by quorum sensing compounds in vitro. A large number of studies regarding interactions among food-sourced bacterial species mainly focus on the inhibitory activity of lactic acid bacteria (LAB) on pathogenic or spoilage bacteria in vitro or in situ within food [16,17,18]. Such interactions are important in influencing the microbial community structure, yet we have a very limited understanding about the quantitative nature of microbial interfaces, including the influence of the environment [19,20,21]. The information on the strength of bacterial interactions may help us to better utilize these interactions and further to control food safety, quality and food waste, which is particularly relevant for nutritious and perishable products such as meat.
Among the numerous microorganisms that contaminate food, Carnobacterium maltaromaticum is a dominant, and often preferred, LAB species. Numerous reports demonstrate that its presence is associated with foods having an extended shelf-life, including vacuum-packaged (VP) meat [16,22,23,24]. For example, in climax microbial communities, C. maltaromaticum may be represented by a single strain, and the effect is likely attributed to bacteriocins—inhibitory compounds that suppress other bacteria within the spoilage community [23].
Examining a broad spectrum of bacterial species isolated from VP beef produced at different abattoirs, we showed that cell-free supernatant (CFS) of C. maltaromaticum (e.g., strain D0h) inhibited a wide spectrum of species, including Serratia spp., Pseudomonas spp., Leuconostoc spp. and other Carnobacterium spp. [25]. Under aerobic conditions, most Pseudomonas spp. and two Bacillus spp. showed relatively large inhibitory activities. Interestingly, the CFS of a few Gram-negative bacteria including Pseudomonas spp. and Enterobacteriaceae also showed growth-promoting activity. That study has helped to understand bacterial interactions among a large variety of species related to VP beef. However, a more complete understanding of how populations of species and strains interact and compete requires a quantitative description of the effect(s) of environmental factors.
The present study describes intra-specific inhibitory activity between two model VP beef bacterial isolates, C. maltaromaticum D0h and D8c, specifically the effects of environmental factors relevant to VP beef. Firstly, a preliminary test was performed to investigate the production kinetics of inhibitory compounds by D0h, and then, D0h CFS with the highest level of inhibition was obtained to study the effects of pH, atmosphere, glucose, temperature and lactic acid on D8c sensitivity under an agar model system with the diameter of an inhibition zone measured. To better understand the inhibition between C. maltaromaticum D0h and D8c, the production of D0h inhibition in broth medium with various combinations of pH, atmosphere, glucose and lactic acid was also tested at 25 °C.
2. Materials and Methods
2.1. Bacterial Isolates
Effector and target strains of C. maltaromaticum, D0h and D8c, respectively, were isolated from VP beef [26,27] and stored at −80 °C. Isolates were cultured on tryptone soy agar (TSA, Oxoid Ltd., Thebarton, Australia) and then incubated separately in brain heart infusion broth (BHI, Amyl Media Ltd., Adelaide, Australia) at 25 °C for 24 h prior to experiments.
2.2. Production Kinetics of Inhibitory Compounds by C. maltaromaticum D0h
Carnobacterium maltaromaticum D0h was inoculated in BHI at an initial cell density of 105 CFU/mL and then incubated at 25 °C. Broth was sampled every 3 h for the first 9 h and then at 1.5-h intervals, and the optical density was measured at 600 nm (OD600) by a plate reader (SPECTROstar Nano Absorbance Reader, Ortenberg, Germany). D0h CFS was prepared by centrifuging cultures at 10,000× g for 5 min, followed by filtration through a 0.2 µm pore-sized membrane (Corning®, Berlin, Germany). The inhibitory activity of CFS was determined by an agar overlay assay reported by Aween et al. [28], with slight modification. Briefly, 24-h culture (25 °C) of D8c (indicator/target isolate) was adjusted to 108 CFU/mL (OD600, 0.10–0.15), and then 10 mL of melted TSA (0.7% agar, g/v; 50 °C) were mixed with 107 CFU D8c and poured into Petri dishes. After the agar had solidified, 10 µL of filter-sterilized CFS of D0h were spotted on the agar in triplicate using a micropipette. After incubation at 25 °C for 24 h, the diameter (mm) of inhibition (DI) was measured using ImageJ software (v1.49 (http://rsb.info.nih.gov/ij/index.html)).
2.3. Effect of Environmental Factors on the Sensitivity of C. maltaromaticum D8c to C. maltaromaticum D0h CFS
The sensitivity of the target isolate D8c to inhibitory activity of D0h CFS was tested under environmental conditions relevant to VP beef: temperature: −1, 7, 15 and 25 °C; atmosphere: aerobic and anaerobic; pH: 5.5, 6 and 6.5; lactic acid: 0, 25 and 50 mM; glucose: 0, 0.56 and 5.55 mM. A full factorial design (4 × 2 × 3 × 3 × 3) was used.
The agar overlay method was used with a basal medium of modified brain heart infusion (mBHI) broth, without glucose (AM 11-NG, Amyl Media, Ltd., Dandenong, Australia; mBHI contained 10 g blended peptone No. 1, 5 g sodium chloride, 17.5 g brain heart infusion solid and 2.5 g di-sodium hydrogen orthophosphate, per litre). L (+) lactic acid (Scharlab, Barcelona, Spain) and D (+) glucose (Sigma, St. Louis, MO, USA) were added into 27 variations of mBHI (Table 1). pH was adjusted to 5.5, 6 or 6.5 (±0.1) using 10 M NaOH or 10 M HCl (Table 1). Agar was added, the medium autoclaved and then the pH adjusted. To better understand the mechanism of the effect of lactic acid, undissociated lactic acid (UndisLA) was calculated as .
After cooling to 50 °C, 10 mL mBHI agar were mixed with 107 CFU D8c and added to Petri dishes; the dishes were previously prepared with a bottom layer containing 15 mL of the same mBHI agar used in the overlay.
Results showed that the highest levels of inhibitory compounds (DI, ~14 mm) in D0h broth cultures occurred between 19.5 and 22.5 h of incubation (Figure 1). Therefore, the CFS was harvested during this time interval, and three 10 µL aliquots were added to the agar surface as replicates for each agar plate. Three agar plates were used as triplicates for each combination of environmental factors.
After the CFS was absorbed into agar, Petri dishes were incubated at different temperatures both aerobically and anaerobically until inhibition zones were observed (Table 1 and Table 2).
Anaerobic conditions (<1.0% O2, ≥13% CO2) were produced using a GasPak EZ anaerobic pouch system (BD, Blackburn, Australia) in sealed jars. Incubation temperature was recorded during the experiment with data loggers (Thermochron iButton®, Warrnambool, Australia). At the end of the experiments, DI was measured and defined as D8c sensitivity.
2.4. Effect of PH, Lactic Acid, Glucose and Atmosphere on Inhibition Level of D0h CFS
A full factorial design (2 × 3 × 3 × 3) of atmosphere, lactic acid, glucose and pH was used in 54 combinations of the four environmental factors. Using BHI (without glucose) as the basal medium, 27 formulations of modified BHI broth medium (mBHI) were prepared, based on the factorial design (Table 1).
The 1.8 mL of mBHI broth were added to individual wells of a 24-well plate and then inoculated with 200 µL of C. maltaromaticum D0h 24-h culture, for an initial density of 105 CFU/mL. Two replicate wells were used for each test condition. Plates were incubated at 25 °C, aerobically and anaerobically, respectively. When culture OD600 reached 0.05, samples were collected at 2-h intervals until the bacteria reached the stationary phase. CFS was obtained by filtering the two replicate samples through 0.2-µm filters and serially diluted using BHI.
The level of inhibition in CFS was measured by the agar overlay method described above, with modification to increase detection sensitivity. Instead of TSA, agar medium (pH 6.5 ± 0.1) was made with 37 g/L BHI, 5.06 g/L L(+)-lactic acid and 15 g/L agar. Furthermore, the cell density of target bacteria, C. maltaromaticum D8c, was reduced to 104 CFU. A mixture of molten medium and target bacteria was poured over the solidified agar made from the same medium. After air-drying in a hood, 10 µL of each CFS dilution were spotted onto the solidified agar surface and incubated at 25 °C for 48 h. The highest dilution of CFS showing inhibition was defined as one arbitrary inhibition unit (AU) [29]. Each combination of the 54 conditions was performed twice. The relationship between sampling time (h) and concentration of inhibitory compounds (AU/mL) was calculated and the production rate (AU/mL/h) determined by linear regression in Excel® (v2010; Microsoft Corp., Redmond, WA, USA).
The inhibitor production at biomass level was also determined. Firstly, the bacterial cell density (log10 CFU/mL) of each sample was calculated according to a regression equation between cell density and log OD600: cell density = optical density*1.1168 + 9.4726 (R2 = 0.996), which was developed in a preliminary experiment (Figure S1). A linear regression between the concentration of inhibitory compounds and culture cell density was then determined in Excel®. The production of inhibitory compounds by D0h per log CFU was calculated from the slope of the regression line and designated as logAU/logCFU.
2.5. Data Analysis
The overall effect of environmental factors on D8c sensitivity and D0h inhibitor production (per hour and per log CFU) was evaluated using analysis of variance (ANOVA), employing the GLM (general linear model) procedure in SAS (v9.3; SAS, Inc., Rockville, MD, USA). If the p-value from the F-test was below 0.05, a Student t-test was then applied to identify significant (p < 0.05) pairwise differences. The correlation coefficient between undissociated lactic acid and DI and undissociated lactic acid and inhibitor production (AU/mL/h) was calculated via linear regression in Excel®.
3. Results
3.1. Kinetics of D0h Inhibitory Activity Production
Inhibitory activity (DI) of D0h CFS was detected between 6 and 9 h of incubation with a blurred inhibition zone; hence, DI was not determined for this time point (Figure 1). Inhibitory activity increased dramatically during the exponential phase of bacterial growth and then reached a maximum level (DI, 14.5 mm; 19.5 h) corresponding to the early stationary phase.
3.2. Environmental Effects on D0h Inhibitor Production
pH had a significant effect both on inhibitor production per hour and per biomass unit (CFU) (Table S1). The rate of inhibitor production per hour was inversely related to pH; pH 6.5: 112.8 AU/mL/h; pH 6: 94.9 AU/mL/h; pH 5.5: 32.0 AU/mL/h (Figure 2A). The inhibitor production per biomass unit was lowest at pH 5.5 (0.8 log AU/log CFU) and ≥1.2 logAU/logCFU at both pH 6 and 6.5 (Figure S2). Inhibitory activity was not detected in media containing 50 mM lactic acid at pH 5.5 under anaerobic conditions (Medium No. 7, 16 and 25 in Table S2) and at pH 5.5 in medium containing 25 mM lactic acid and 5.55 mM glucose incubated aerobically and anaerobically (Medium No. 22 in Table S2).
The effect of lactic acid on production rate (AU/mL/h) was heavily dependent on the pH level of a culture condition, with p = 0.0098 for the interaction of lactic acid with pH (Table S1). At pH 5.5, the production rate was the greatest with no lactic acid supplementation (50.2 AU/mL/h), followed by 25 and 50 mM lactic acid (21.7 and 24 AU/mL/h, respectively) (Figure 2B). Conversely, at pH 6.5, the production rate was the highest (144.6 AU/mL/h) in the presence of 50 mM lactic acid. At pH 6, lactic acid showed a rather different effect pattern compared to pH 5.5 and 6.5; the mean production rate produced in media containing 25 mM LA was statistically significantly lower than that produced in media containing 0 and 50 mM lactic acid according to the standard error of the mean calculated by ANOVA of pooled data. However, a review of the original data found that the experimental variation at pH 6 was large. For example, one replicate produced very low production rates in Medium No. 5 aerobically (21.74 AU/mL/h) and anaerobically (22.13 AU/mL/h), respectively, compared to the other replicate (110.14 and 76.88 AU/mL/h, respectively) (Table S2). Hence, we would conclude that the significance of the difference of mean production rate between pH 6 and pH 5.5 and 6.5 was false. The production rate as a function of the level of undissociated lactic acid is plotted in Figure 2C; the production rate decreases dramatically when the concentration of undissociated lactic acid reaches 0.56 mM and above. No effect of lactic acid on production per biomass unit (CFU) was observed (p = 0.588, Table S1).
The overall effect of glucose on production rate (AU/mL/h) was not significant (p = 0.404) (Table S1). At pH 6, the production rates in media with three glucose levels were not different; at pH 6.5, it fluctuated in a haphazard way; at pH 5.5, the mean production rate was the lowest (11.2 AU/mL/h) in the media with 5.55 mM glucose, which was likely the reason for the statistically-significant interaction of glucose with pH (p = 0.0017) (Figure S3). Further analysis of the data found that the lowest mean production rate at pH 5.5 was due to D0h failing to produce inhibitory compounds at a few culture conditions (anaerobic, Medium No. 19, 22 and 25; aerobic, Medium No. 22) (Table S2), which also explained the relatively overall lower mean production per CFU in media with 5.55 mM glucose (Figure S2C, Table S1). Hence, it was concluded that glucose did not have an effect on either the production per hour or per biomass unit.
In addition, inhibitor production was not significantly affected by atmosphere (p = 0.236 for production per hour and p = 0.731 for production per CFU, respectively) (Table S1), the production rates in aerobic (84.3 AU/mL/h) and anaerobic (75.5 AU/mL/h) atmospheres not being significantly different (Figure S3A).
3.3. Influence of Environmental Factors on D8c Sensitivity to D0h CFS
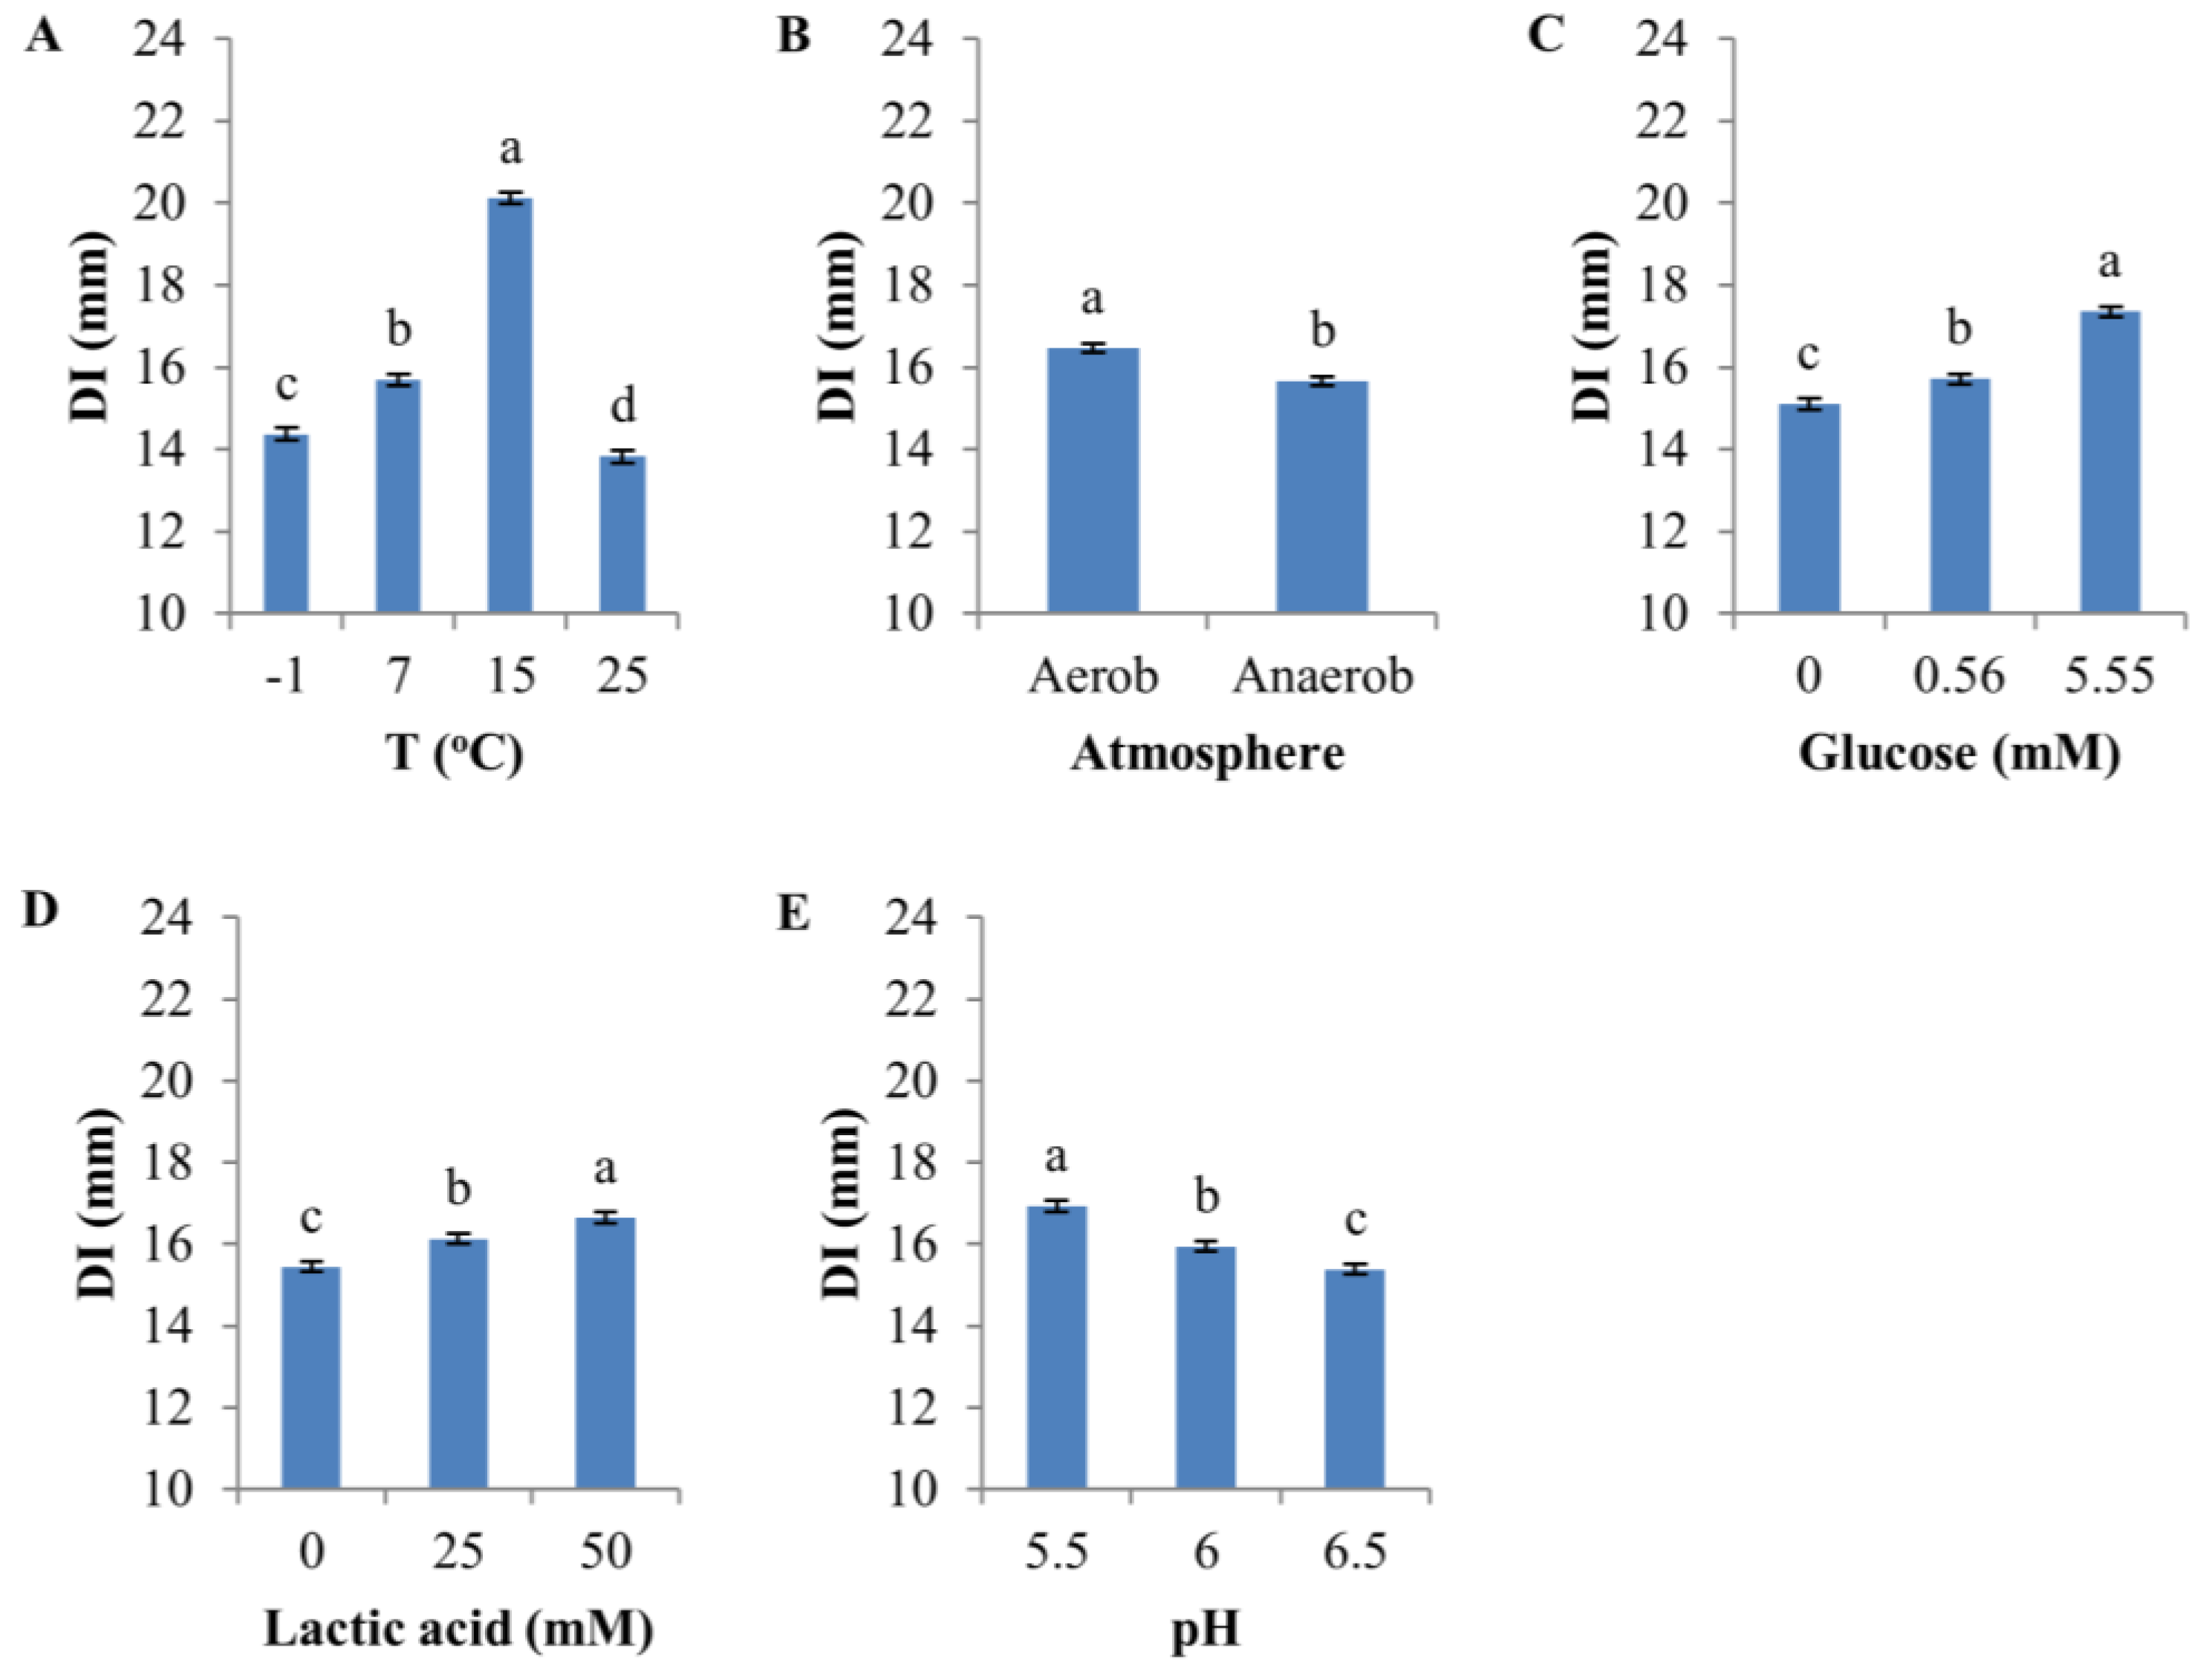
All environmental factors had a significant effect (p < 0.0001, F-test) on the sensitivity of D8c to D0h CFS (Figure 3). The highest temperature (25 °C) produced the lowest sensitivity (mean, 13.8 mm), whereas the greatest sensitivity (20.1 mm) occurred at 15 °C, followed by 7 and −1 °C (Figure 3A and Figure S4).
Overall, aerobic atmosphere only slightly increased sensitivity (mean DI = 16.5 mm) compared to anaerobic conditions (mean DI = 15.7 mm) (Figure 3B and Figure S5, and Table S3), but the difference was highly significant statistically (p < 0.0001, Table S3). Glucose and lactic acid both significantly increased DI (Figure 3C,D, Figures S6 and S7); on average, DI was 2.3 mm greater at 5.55 mM compared to no glucose supplementation, and lactic acid increased D8c sensitivity by 1.2 mm in the presence of 50 mM lactic acid compared with no lactic acid supplementation. Sensitivity was inversely related to pH (mean of DI, pH 6.5: 15.4 mm; pH 6.0: 15.9 mm; pH 5.5: 16.9 mm) (Figure 3E and Figure S8).
3.4. Interactions among Environmental Factors on D8c Sensitivity
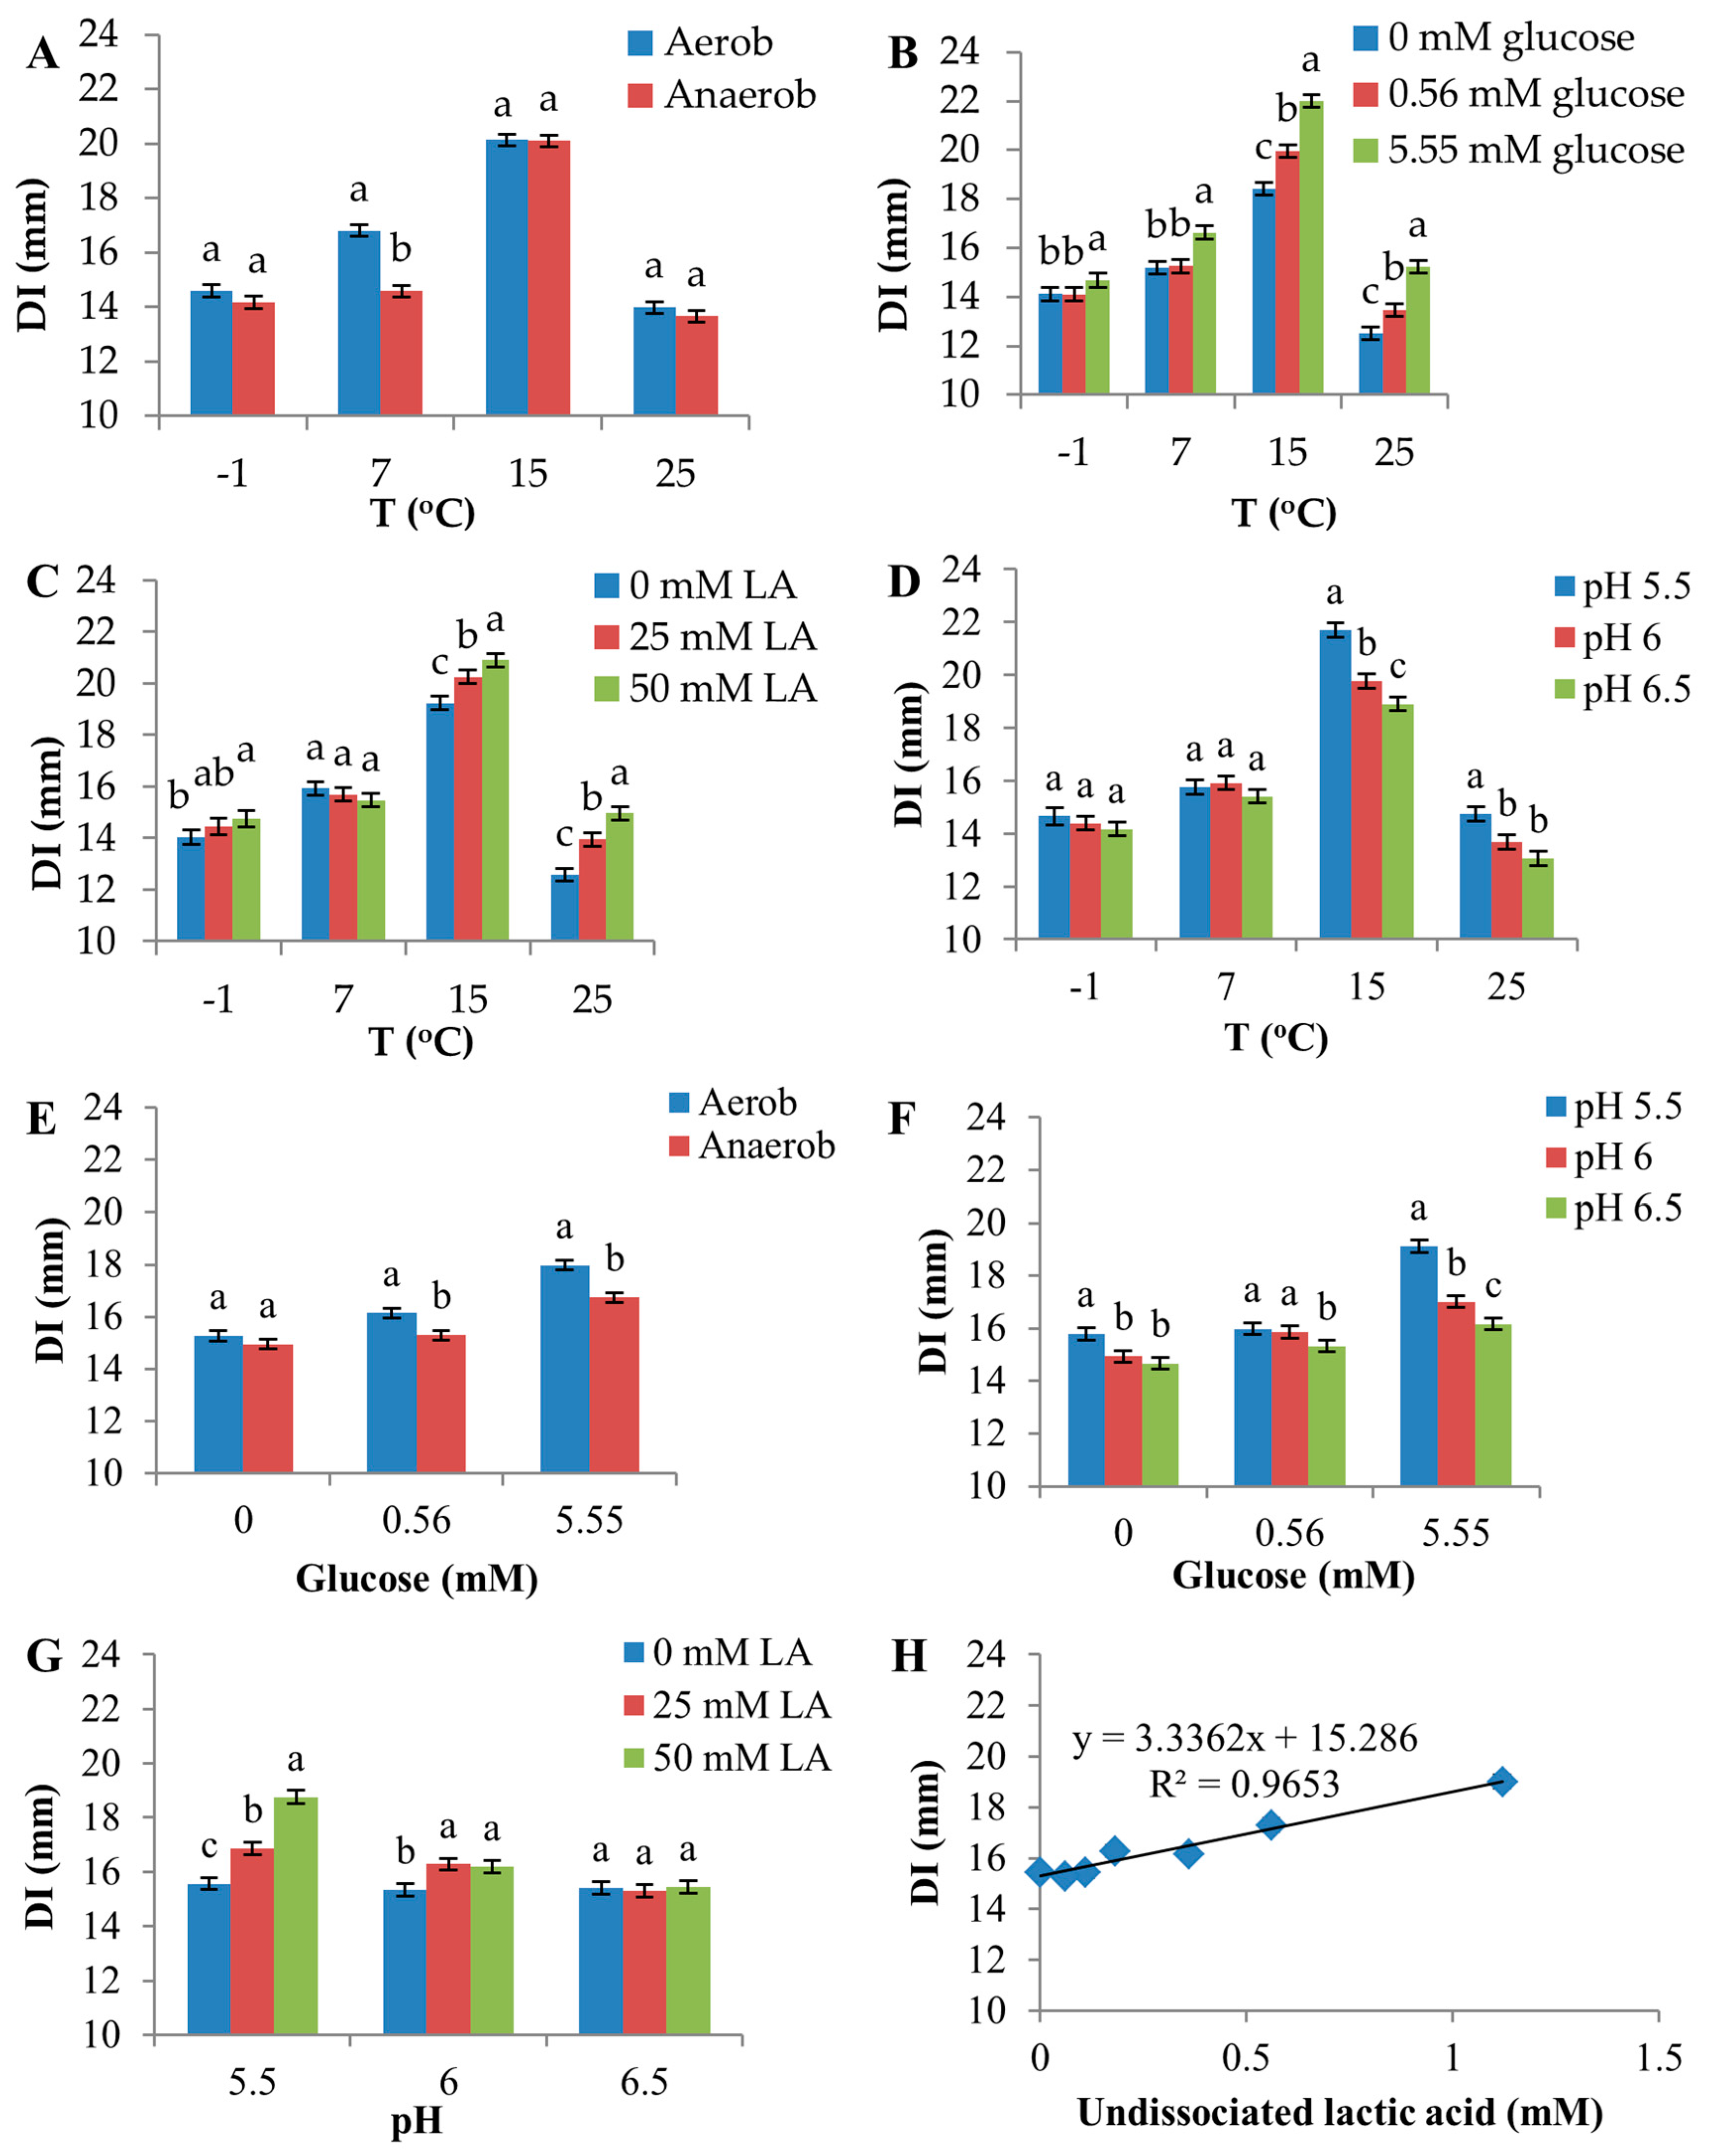
Significant interactions were observed between temperature and atmosphere, temperature and glucose, temperature and lactic acid, temperature and pH, glucose and pH and pH and lactic acid (Figure 4, Table S3). A slight interaction between glucose and atmosphere was observed, although it was not statistically significant (p = 0.0545).
Atmosphere produced a strong discriminating effect on D8c sensitivity at 7 °C, compared with other temperatures (Figure 4A), as the aerobic environment increased DI by 2.2 mm compared with the anaerobic environment at this temperature. In contrast, higher temperatures increased the inhibitory effect of glucose, lactic acid and low pH (Figure 4B–D). For example, at 15 and 25 °C, 5.55 mM glucose increased DI by 3.6 and 2.7 mm, respectively, compared with 0 mM glucose (Figure 4B). However, at −1 °C, DI increased by only 0.6 mm for this change in glucose.
The effects of atmosphere and pH on D8c sensitivity were greater in the presence of 5.55 mM glucose (Figure 4E,F, respectively). Furthermore, as a result of a relatively larger portion of the undissociated form of lactic acid added in media with low initial pH compared with high initial pH, 50 mM lactic acid increased DI by 3.2 mm compared to 0 mM lactic acid at pH 5.5, whereas at pH 6.0, the increase was only 0.9 mm, and at pH = 6.5, there was no measurable increase (Figure 4G). These responses are a consequence of the positive correlation between undissociated lactic acid and DI (R2 = 0.965) (Figure 4H).
4. Discussion
Bacterial interactions have long been investigated in culture media and food model systems. For example, Brochothrix thermosphacta was inhibited by the presence of LAB in agar media [30]. The presence of Pseudomonas spp. was found to enhance the survival of the pathogenic species Campylobacter jejuni in vitro and in poultry [31,32]. In this study, by using an agar model system, we have quantified the effects of the VP beef-related environmental factors, pH, lactic acid, glucose, temperature and atmosphere on the inhibitions between two C. maltaromaticum isolates, i.e., D8c sensitivity and D0h inhibitor production.
The pH of fresh VP beef ranges from approximately pH 5.5–6.5 [33,34,35]. C. maltaromaticum D8C sensitivity to D0h CFS, interpreted by DI, increased at lower pH, agreeing with Ganzle et al. [36], who reported that the inhibitory activity of nisin, sakacin P and curvacin A increased at low pH in broth media. Abriouel et al. [37] proposed that H+ affected bacteriocin activity via changes in the surface charge of target bacteria, thereby causing changes in conformation/oligomerization of bacteriocin peptides. Nisin is believed to have greater activity in acidic foods, due to increased solubility and stability [38]. It is also possible that a larger proportion of organic acids produced by C. maltaromaticum D0h is undissociated at low pH (5.5), which increased the overall inhibitory activity of D0h CFS. We found that D8c cell density in agar was reduced at lower pH (Figure S9A) and that D8c growth rate in mBHI broth (25 °C) decreased proportionally with lower pH (Figure S10). Therefore, larger inhibition zones at lower pH may have been influenced by a higher ratio of inhibitor per cell.
Lactic acid, well-known to inhibit the growth of pathogenic and spoilage bacteria and frequently applied as a food preservative [39,40,41], potentiated the sensitivity of D8c to D0h CFS. This effect is likely owing to the undissociated form of lactic acid, which has strong inhibitory activity due to lipophilic properties, enabling it to diffuse through bacterial membranes [39,42,43,44]. A significant interaction between lactic acid and pH on DI was observed, with lactic acid producing a greater effect at lower pH (Figure 4G) and showing a positive linear relationship between DI and undissociated lactic acid (Figure 4H). Hence, the effect of lactic acid likely results from the undissociated form. As with lower pH, greater levels of lactic acid in mBHI agar resulted in lower final D8c cell density (Figure S9B), indicating that DI could be influenced by a higher ratio of inhibitor compound per target cell.
Inhibitor activity was greater in the presence of 5.55 mM compared with 0.56 mM glucose and when mBHI agar was not supplemented with glucose (Figure 3C). C. maltaromaticum utilizes glucose and produces organic acids [45,46], resulting in 0.21 mole of L-lactic acid per mole of glucose [47]. To investigate the mechanism of the glucose effect on DI, pH change during incubation was measured for mBHI agar incubated at 15 °C. Average pH decreased 0.4 units in 5.55 mM glucose, which was greater than the pH decrease for 0 and 0.56 mM glucose, which were 0.09 and 0.1, respectively. Therefore, the enhancing effect of glucose on intra-specific inhibitory activity might be due to increased lactic acid, which decreased pH during D8c growth via glucose metabolism. This idea is consistent with interactions between glucose and pH (Figure 4F); with 5.55 mM glucose, D8c was more sensitive to pH change compared to 0 and 0.56 mM glucose. As with pH and lactic acid, final cell density was lower in mBHI agar containing higher glucose levels (Figure S9C). Other studies have shown that the inhibitory activity of two-component bacteriocins, such as lactocin 705 and lacticin 3147, is enhanced when target cells are energized due to the uptake of glucose [48,49].
Inhibition by D0h CFS was greater under aerobic versus anaerobic conditions (Figure 3B). According to Afzal et al. [46], glucose metabolism by C. maltaromaticum LMA28 is higher in the presence of oxygen, and consequently, the production of lactic acid increases under aerobic conditions. This is likely the case in our study, where enhanced antibacterial activity of D0h CFS may result from increased production of lactic acid. This may also explain the interaction observed between atmosphere and glucose, although it was only marginally significant (p = 0.055) (Figure 4E), with the difference of DI between aerobic and anaerobic conditions being greatest at 5.55 mM glucose.
Due to lower growth rates at −1, 7 and 15 °C, mBHI agar was incubated for longer time periods (Table 2) compared to 25 °C. Preliminary experiments demonstrated that DI did not increase with increased incubation time (Figure S11). Interestingly, inhibitory activity did not linearly correlate with temperature, where DI was higher at 15 °C, compared to −1, 7 and 25 °C (Figure 3A). We suggest that the sensitivity of D8c to D0h inhibition (DI) is dependent on the physiological state of D8c target cells, which may be influenced by temperature [50]. Bacteriocins are known to interact with the cytoplasmic membrane of sensitive bacteria [3,38,51,52,53], and Jacquet et al. [50] reported that the effect of class IIa bacteriocins depended on the physiological state of target bacteria. Henry et al. [54] reported that the lethal effect of carnocin CP5 was lower, but more prolonged, in the range of 7–30 °C; however, Stoffels et al. [55] found that a bacteriocin produced by C. maltaromaticum had no effect at 4 and 15 °C.
To understand inhibition between C. maltaromaticum D0h and D8c better, the effects of pH, glucose, atmosphere and lactic acid on inhibitor production by D0h were investigated at 25 °C. C. maltaromaticum D0h produced small or no detectable levels of inhibitory compounds in media with initial pH 5.5. This may result from a bacterial strategy to shift energy from biosynthesizing metabolites and translocating them to the external medium, to maintaining internal pH in high H+ environments [56,57]. Relatively high pH has been shown to be optimal for the production of bacteriocins by C. maltaromaticum [56,58]. As mentioned earlier, undissociated lactic acid can inhibit bacterial growth [44,59]; we found that CFS inhibitor production rate decreased when the concentration of undissociated lactic acid was above 0.56 mM (Figure 2C).
In our study, the inhibitory effect produced by D0h and the sensitivity of D8c to inhibition were studied separately. The effects of environmental factors were complicated, not only affecting inhibitor production, but also sensitivity and/or growth of D8c. Nevertheless, it is possible to estimate the effects of environmental factors on the net outcome of the bacterial interaction under a few conditions. For example, at 25 °C and pH 6, glucose increased D8c sensitivity, but did not significantly affect D0h inhibitor production (Figures S3D and S12A); hence, it is likely the overall D0h-D8c inhibition strength is higher in culture conditions with a relatively higher concentration of glucose. However, at pH 5.5, lactic acid increased D8c sensitivity (Figure S12B), but decreased D0h production rate (Figure 2B). In this instance, it is more difficult to predict the absolute additive effect of these factors on inhibition strength. Similarly, relatively low pH increased D8c sensitivity (Figure 4D), while decreasing the inhibitor production rate by D0h (Figure 2A), making it difficult to evaluate the overall effect of pH on inhibition strength between the C. maltaromaticum strains. Under aerobic conditions, the D8c sensitivity and D0h inhibitor production rate were both slightly higher (although not statistically significant) compared to an anaerobic environment (Figure 4A and Figure S3A). Therefore, D0h-D8c inhibition strength would likely be enhanced in the presence of O2. It is also possible that residual O2, especially at the beginning of the storage of VP beef, may benefit inhibitor strains of C. maltaromaticum to compete against sensitive strains.
This study focused on the effects of environmental conditions on the intra-specific inhibitory activity between two model bacteria, C. maltaromaticum strains, D0h vs. D8c. Experimental data were generated in vitro to define the effects of environmental factors more clearly, without the potential complicating factors of a complex meat matrix. These findings are an important first step to help to explain future research that will focus on monitoring the growth of a microbial community including different bacterial strains and/or species. Such bacteriological medium-based studies have been extensively used to understand how environments influence bacterial growth, resulting in predictive models [60,61,62,63], which are subsequently validated in food matrices.
Supplementary Materials
The following are available online at www.mdpi.com/2076-2607/5/3/59/s1, Figure S1: Linear regression between cell density and optical density of C. maltaromaticum D0h in culture medium, Figure S2: Effect of environmental factors on the production of inhibitory factor by C. maltaromaticum D0h per CFU, Figure S3: Effect of atmosphere, glucose, lactic acid and glucose*pH on C. maltaromaticum D0h inhibitor production (AU/mL/h), Figure S4: Representative pictures of the inhibition zone showing the effect of temperature on D8c sensitivity (diameter of inhibition zone), Figure S5: Representative pictures of the inhibition zone showing the effect of atmosphere on D8c sensitivity (diameter of inhibition zone), Figure S6: Representative pictures of the inhibition zone showing the effect of glucose on D8c sensitivity (diameter of inhibition zone), Figure S7: Representative pictures of the inhibition zone showing the effect of lactic acid on D8c sensitivity (diameter of inhibition zone), Figure S8: Representative pictures of the inhibition zone showing the effect of pH on D8c sensitivity (diameter of inhibition zone), Figure S9: Effect of pH, lactic acid and glucose on the final cell density (FCD) in the study of C. maltaromaticum D8c sensitivity, Figure S10: Effect of pH on the growth rate of C. maltaromaticum D8c, Figure S11: Effect of incubation time on the diameter of inhibition zone (DI) at different incubation days, Figure S12: Effect of interactions between pH and glucose and pH and lactic acid on the diameter of the inhibition zone (DI) at 25 °C, Table S1: Significance (p-value, F-test) of the effect of environmental factors on the production of inhibitory compounds by C. maltaromaticum D0h, Table S2: D0h inhibitor production in various culture conditions, Table S3: Significance (p-value, F-test) of the effect of environmental factors on C. maltaromaticum D8c sensitivity to C. maltaromaticum D0h CFS, Table S4: The sensitivity of C. maltaromaticum (diameter of inhibition zone (DI)) D8c to C. maltaromaticum D0h inhibition under aerobic conditions, Table S5: The sensitivity of C. maltaromaticum (diameter of inhibition zone (DI)) D8c to C. maltaromaticum D0h inhibition under anaerobic conditions, Table S6: Significance (p-value, F-test) of the effect of environmental factors on C. maltaromaticum D8c sensitivity to C. maltaromaticum D0h CFS at 25 °C.
Acknowledgments
We gratefully acknowledge funding support by Meat and Livestock Australia, North Sydney, Australia. The authors also express their gratitude to Chawalit Kocharunchitt for advice in experimental design and data analysis. Peipei Zhang acknowledges the scholarship support from Chinese Scholarship Council and Zhejiang University.
Author Contributions
Mark Tamplin, Peipei Zhang, David A. Ratkowsky, Mandeep Kaur and John P. Bowman conceived and designed the experiments; Peipei Zhang performed the experiments; Peipei Zhang and David A. Ratkowsky analysed the data; Mark Tamplin contributed reagents/materials/analysis tools; Peipei Zhang, Mark Tamplin, Mandeep Kaur and John P. Bowman wrote the paper.
Conflicts of Interest
The authors declare no conflict of interest. The funding sponsors had no role in the design of the study, in the collection, analyses, or interpretation of data, in the writing of the manuscript, and in the decision to publish the results.
References
- Faust, K.; Raes, J. Microbial interactions: From networks to models. Nat. Rev. Microbiol. 2012, 10, 538–550. [Google Scholar] [CrossRef] [PubMed]
- Hibbing, M.E.; Fuqua, C.; Parsek, M.R.; Peterson, S.B. Bacterial competition: Surviving and thriving in the microbial jungle. Nat. Rev. Microbiol. 2010, 8, 15–25. [Google Scholar] [CrossRef] [PubMed]
- Cotter, P.D.; Ross, R.P.; Hill, C. Bacteriocins—A viable alternative to antibiotics? Nat. Rev. Microbiol. 2013, 11, 95–105. [Google Scholar] [CrossRef] [PubMed]
- Hayes, C.S.; Koskiniemi, S.; Ruhe, Z.C.; Poole, S.J.; Low, D.A. Mechanisms and biological roles of contact-dependent growth inhibition systems. Cold Spring Harb. Perspect. Med. 2014, 4. [Google Scholar] [CrossRef] [PubMed]
- Russell, A.B.; Hood, R.D.; Bui, N.K.; LeRoux, M.; Vollmer, W.; Mougous, J.D. Type VI secretion delivers bacteriolytic effectors to target cells. Nature 2011, 475, 343–347. [Google Scholar] [CrossRef] [PubMed]
- Boyer, F.; Fichant, G.; Berthod, J.; Vandenbrouck, Y.; Attree, I. Dissecting the bacterial type VI secretion system by a genome wide in silico analysis: What can be learned from available microbial genomic resources? BMC Genom. 2009, 10, 104. [Google Scholar] [CrossRef] [PubMed]
- Pande, S.; Shitut, S.; Freund, L.; Westermann, M.; Bertels, F.; Colesie, C.; Bischofs, I.B.; Kost, C. Metabolic cross-feeding via intercellular nanotubes among bacteria. Nat. Commun. 2015, 6, 6238. [Google Scholar] [CrossRef] [PubMed]
- Buckling, A.; Harrison, F.; Vos, M.; Brockhurst, M.A.; Gardner, A.; West, S.A.; Griffin, A. Siderophore-mediated cooperation and virulence in Pseudomonas aeruginosa. FEMS Microbiol. Ecol. 2007, 62, 135–141. [Google Scholar] [CrossRef] [PubMed]
- Skandamis, P.N.; Nychas, G.J. Quorum sensing in the context of food microbiology. Appl. Environ. Microbiol. 2012, 78, 5473–5482. [Google Scholar] [CrossRef] [PubMed]
- Yang, D.; Wu, X.; Yu, X.; He, L.; Shah, N.P.; Xu, F. Mutual growth-promoting effect between bifidobacterium bifidum WBBI03 and Listeria monocytogenes CMCC 54001. J. Dairy Sci. 2017, 100, 3448–3462. [Google Scholar] [CrossRef] [PubMed]
- D’Onofrio, A.; Crawford, J.M.; Stewart, E.J.; Witt, K.; Gavrish, E.; Epstein, S.; Clardy, J.; Lewis, K. Siderophores from neighboring organisms promote the growth of uncultured bacteria. Chem. Biol. 2010, 17, 254–264. [Google Scholar] [CrossRef] [PubMed]
- Jameson, J.E. A discussion of the dynamics of Salmonella enrichment. J. Hyg. (Lond.) 1962, 60, 193–207. [Google Scholar] [CrossRef] [PubMed]
- Ross, T.; Dalgaard, P.; Tienungoon, S. Predictive modelling of the growth and survival of Listeria in fishery products. Int. J. Food Microbiol. 2000, 62, 231–245. [Google Scholar] [CrossRef]
- Moller, C.O.; Ilg, Y.; Aabo, S.; Christensen, B.B.; Dalgaard, P.; Hansen, T.B. Effect of natural microbiota on growth of Salmonella spp. In fresh pork—A predictive microbiology approach. Food Microbiol. 2013, 34, 284–295. [Google Scholar] [CrossRef] [PubMed]
- Nychas, G.J.; Dourou, D.; Skandamis, P.; Koutsoumanis, K.; Baranyi, J.; Sofos, J. Effect of microbial cell-free meat extract on the growth of spoilage bacteria. J. Appl. Microbiol. 2009, 107, 1819–1829. [Google Scholar] [CrossRef] [PubMed]
- Laursen, B.G.; Bay, L.; Cleenwerck, I.; Vancanneyt, M.; Swings, J.; Dalgaard, P.; Leisner, J.J. Carnobacterium divergens and Carnobacterium maltaromaticum as spoilers or protective cultures in meat and seafood: Phenotypic and genotypic characterization. Syst. Appl. Microbiol. 2005, 28, 151–164. [Google Scholar] [CrossRef] [PubMed]
- Zendo, T. Screening and characterization of novel bacteriocins from lactic acid bacteria. Biosci. Biotechnol. Biochem. 2013, 77, 893–899. [Google Scholar] [CrossRef] [PubMed]
- De Vuyst, L.; Leroy, F. Bacteriocins from lactic acid bacteria: Production, purification, and food applications. J. Mol. Microbiol. Biotechnol. 2007, 13, 194–199. [Google Scholar] [CrossRef] [PubMed]
- Wolfe, B.E.; Button, J.E.; Santarelli, M.; Dutton, R.J. Cheese rind communities provide tractable systems for in situ and in vitro studies of microbial diversity. Cell 2014, 158, 422–433. [Google Scholar] [CrossRef] [PubMed]
- Perez-Gutierrez, R.A.; Lopez-Ramirez, V.; Islas, A.; Alcaraz, L.D.; Hernandez-Gonzalez, I.; Olivera, B.C.; Santillan, M.; Eguiarte, L.E.; Souza, V.; Travisano, M.; et al. Antagonism influences assembly of a Bacillus guild in a local community and is depicted as a food-chain network. ISME J. 2013, 7, 487–497. [Google Scholar] [CrossRef] [PubMed]
- Blana, V.A.; Nychas, G.J. Presence of quorum sensing signal molecules in minced beef stored under various temperature and packaging conditions. Int. J. Food Microbiol. 2014, 173, 1–8. [Google Scholar] [CrossRef] [PubMed]
- Doulgeraki, A.I.; Ercolini, D.; Villani, F.; Nychas, G.J. Spoilage microbiota associated to the storage of raw meat in different conditions. Int. J. Food Microbiol. 2012, 157, 130–141. [Google Scholar] [CrossRef] [PubMed]
- Youssef, M.K.; Gill, C.O.; Tran, F.; Yang, X. Unusual compositions of microflora of vacuum-packaged beef primal cuts of very long storage life. J. Food Prot. 2014, 77, 2161–2167. [Google Scholar] [CrossRef] [PubMed]
- Leisner, J.J.; Laursen, B.G.; Prevost, H.; Drider, D.; Dalgaard, P. Carnobacterium: Positive and negative effects in the environment and in foods. FEMS Microbiol. Rev. 2007, 31, 592–613. [Google Scholar] [CrossRef] [PubMed]
- Zhang, P.; Baranyi, J.; Tamplin, M. Interstrain interactions between bacteria isolated from vacuum-packaged refrigerated beef. Appl. Environ. Microbiol. 2015, 81, 2753–2761. [Google Scholar] [CrossRef] [PubMed]
- Small, A.H.; Jenson, I.; Kiermeier, A.; Sumner, J. Vacuum-packed beef primals with extremely long shelf life have unusual microbiological counts. J. Food Prot. 2012, 75, 1524–1527. [Google Scholar] [CrossRef] [PubMed]
- Kaur, M.; Bowman, J.P.; Porteus, B.; Dann, A.L.; Tamplin, M. Effect of abattoir and cut on variations in microbial communities of vacuum-packaged beef. Meat Sci. 2017, 131, 34–39. [Google Scholar] [CrossRef] [PubMed]
- Aween, M.M.; Hassan, Z.; Muhialdin, B.J.; Eljamel, Y.A.; Al-Mabrok, A.S.; Lani, M.N. Antibacterial activity of Lactobacillus acidophilus strains isolated from honey marketed in malaysia against selected multiple antibiotic resistant (mar) gram-positive bacteria. J. Food Sci. 2012, 77, M364–M371. [Google Scholar] [CrossRef] [PubMed]
- Ghanbari, M.; Jami, M.; Kneifel, W.; Domig, K.J. Antimicrobial activity and partial characterization of bacteriocins produced by lactobacilli isolated from sturgeon fish. Food Control. 2013, 32, 379–385. [Google Scholar] [CrossRef]
- Russo, F.; Ercolini, D.; Mauriello, G.; Villani, F. Behaviour of Brochothrix thermosphacta in presence of other meat spoilage microbial groups. Food Microbiol. 2006, 23, 797–802. [Google Scholar] [CrossRef] [PubMed]
- Balamurugan, S.; Nattress, F.M.; Baker, L.P.; Dilts, B.D. Survival of Campylobacter jejuni on beef and pork under vacuum packaged and retail storage conditions: Examination of the role of natural meat microflora on C. Jejuni survival. Food Microbiol. 2011, 28, 1003–1010. [Google Scholar] [CrossRef] [PubMed]
- Hilbert, F.; Scherwitzel, M.; Paulsen, P.; Szostak, M.P. Survival of Campylobacter jejuni under conditions of atmospheric oxygen tension with the support of Pseudomonas spp. Appl. Environ. Microbiol. 2010, 76, 5911–5917. [Google Scholar] [CrossRef] [PubMed]
- Lavieri, N.; Williams, S.K. Effects of packaging systems and fat concentrations on microbiology, sensory and physical properties of ground beef stored at 4 +/− 1 °C for 25 days. Meat Sci. 2014, 97, 534–541. [Google Scholar] [CrossRef] [PubMed]
- Argyri, A.A.; Mallouchos, A.; Panagou, E.Z.; Nychas, G.J. The dynamics of the HS/SPME-GC/MS as a tool to assess the spoilage of minced beef stored under different packaging and temperature conditions. Int. J. Food Microbiol. 2015, 193, 51–58. [Google Scholar] [CrossRef] [PubMed]
- Jones, R.J. Observations on the succession dynamics of lactic acid bacteria populations in chill-stored vacuum-packaged beef. Int. J. Food Microbiol. 2004, 90, 273–282. [Google Scholar] [CrossRef]
- Ganzle, M.G.; Weber, S.; Hammes, W.P. Effect of ecological factors on the inhibitory spectrum and activity of bacteriocins. Int. J. Food Microbiol. 1999, 46, 207–217. [Google Scholar] [CrossRef]
- Abriouel, H.; Valdivia, E.; Galvez, A.; Maqueda, M. Influence of physico-chemical factors on the oligomerization and biological activity of bacteriocin AS-48. Curr. Microbiol. 2001, 42, 89–95. [Google Scholar] [CrossRef] [PubMed]
- Balciunas, E.M.; Martinez, F.A.C.; Todorov, S.D.; de Melo Franco, B.D.; Converti, A.; Oliveira, R.P.D. Novel biotechnological applications of bacteriocins: A review. Food Control. 2013, 32, 134–142. [Google Scholar] [CrossRef]
- Rosengren, A.; Lindblad, M.; Lindqvist, R. The effect of undissociated lactic acid on Staphylococcus aureus growth and enterotoxin a production. Int. J. Food Microbiol. 2013, 162, 159–166. [Google Scholar] [CrossRef] [PubMed]
- Balannec, B.; Bouguettoucha, A.; Amrane, A. Unstructured model for batch cultures without pH control of Lactobacillus helveticus—Inhibitory effect of the undissociated lactic acid. Biochem. Eng. J. 2007, 35, 289–294. [Google Scholar] [CrossRef]
- Wang, W.; Li, M.; Fang, W.; Pradhan, A.K.; Li, Y. A predictive model for assessment of decontamination effects of lactic acid and chitosan used in combination on Vibrio parahaemolyticus in shrimps. Int. J. Food Microbiol. 2013, 167, 124–130. [Google Scholar] [CrossRef] [PubMed]
- Shelef, L.A. Antimicrobial effects of lactates—A review. J. Food Prot. 1994, 57, 445–450. [Google Scholar] [CrossRef]
- Lindblad, M.; Lindqvist, R. Modelling time to growth of Escherichia coli as a function of water activity and undissociated lactic acid. Lett. Appl. Microbiol. 2010, 50, 308–313. [Google Scholar] [CrossRef] [PubMed]
- Biesta-Peters, E.G.; Reij, M.W.; Gorris, L.G.M.; Zwietering, M.H. Comparing nonsynergistic gamma models with interaction models to predict growth of emetic Bacillus cereus when using combinations of pH and individual undissociated acids as growth-limiting factors. Appl. Environ. Microbiol. 2010, 76, 5791–5801. [Google Scholar] [CrossRef] [PubMed]
- Mora, D.; Scarpellini, M.; Franzetti, L.; Colombo, S.; Galli, A. Reclassification of Lactobacillus maltaromicus (Miller et al. 1974) DSM 20342(T) and DSM 20344 and Carnobacterium piscicola (Collins et al. 1987) dsm 20730(T) and DSM 20722 as Carnobacterium maltaromaticum comb. Nov. Int. J. Syst. Evol. Microbiol. 2003, 53, 675–678. [Google Scholar] [CrossRef] [PubMed]
- Afzal, M.I.; Boulahya, K.A.; Paris, C.; Delaunay, S.; Cailliez-Grimal, C. Effect of oxygen on the biosynthesis of flavor compound 3-methylbutanal from leucine catabolism during batch culture in Carnobacterium maltaromaticum lma 28. J. Dairy Sci. 2013, 96, 352–359. [Google Scholar] [CrossRef] [PubMed]
- Borch, E.; Molin, G. The aerobic growth and product formation of Lactobacillus, Leuconostoc, Brochothrix, and Carnobacterium in batch cultures. Appl. Microbiol. Biotechnol. 1989, 30, 81–88. [Google Scholar] [CrossRef]
- Castellano, P.; Raya, R.; Vignolo, G. Mode of action of lactocin 705, a two-component bacteriocin from Lactobacillus casei crl705. Int. J. Food Microbiol. 2003, 85, 35–43. [Google Scholar] [CrossRef]
- McAuliffe, O.; Ryan, M.P.; Ross, R.P.; Hill, C.; Breeuwer, P.; Abee, T. Lacticin 3147, a broad-spectrum bacteriocin which selectively dissipates the membrane potential. Appl. Environ. Microbiol. 1998, 64, 439–445. [Google Scholar] [PubMed]
- Jacquet, T.; Cailliez-Grimal, C.; Francius, G.; Borges, F.; Imran, M.; Duval, J.F.; Revol-Junelles, A.M. Antibacterial activity of class IIa bacteriocin Cbn BM1 depends on the physiological state of the target bacteria. Res. Microbiol. 2012, 163, 323–331. [Google Scholar] [CrossRef] [PubMed]
- Diep, D.B.; Skaugen, M.; Salehian, Z.; Holo, H.; Nes, I.F. Common mechanisms of target cell recognition and immunity for class II bacteriocins. Proc. Natl. Acad. Sci. USA 2007, 104, 2384–2389. [Google Scholar] [CrossRef] [PubMed]
- Hechard, Y.; Sahl, H.G. Mode of action of modified and unmodified bacteriocins from gram-positive bacteria. Biochimie 2002, 84, 545–557. [Google Scholar] [CrossRef]
- Henning, S.; Metz, R.; Hammes, W.P. Studies on the mode of action of nisin. Int. J. Food Microbiol. 1986, 3, 121–134. [Google Scholar] [CrossRef]
- Henry, C.; Koumanov, F.; Ghezzi, C.; Mathieu, J.P.; Hamant, S.; De Leiris, J.; Comet, M. Experimental models, protocols, and reference values for evaluation of iodinated analogues of glucose. Nucl. Med. Biol. 1995, 22, 875–885. [Google Scholar] [CrossRef]
- Stoffels, G.; Nes, I.F.; Guthmundsdottir, A. Isolation and properties of a bacteriocin-producing Carnobacterium piscicola isolated from fish. J. Appl. Bacteriol. 1992, 73, 309–316. [Google Scholar] [CrossRef] [PubMed]
- Khouiti, Z.; Simon, J.P. Carnocin kz213 produced by Carnobacterium piscicola 213 is adsorbed onto cells during growth. Its biosynthesis is regulated by temperature, pH and medium composition. J. Ind. Microbiol. Biotechnol. 2004, 31, 5–10. [Google Scholar] [CrossRef] [PubMed]
- Papagianni, M.; Sergelidis, D. Chemostat production of pediocin SM-1 by Pediococcus pentosaceus mees 1934. Biotechnol. Prog. 2015, 31, 1481–1486. [Google Scholar] [CrossRef] [PubMed]
- Schillinger, U.; Stiles, M.E.; Holzapfel, W.H. Bacteriocin production by Carnobacterium piscicola LV 61. Int. J. Food Microbiol. 1993, 20, 131–147. [Google Scholar] [CrossRef]
- Aryani, D.C.; den Besten, H.M.; Hazeleger, W.C.; Zwietering, M.H. Quantifying strain variability in modeling growth of Listeria monocytogenes. Int. J. Food Microbiol. 2015, 208, 19–29. [Google Scholar] [CrossRef] [PubMed]
- Ross, T.; Ratkowsky, D.A.; Mellefont, L.A.; McMeekin, T.A. Modelling the effects of temperature, water activity, pH and lactic acid concentration on the growth rate of escherichia coli. Int. J. Food Microbiol. 2003, 82, 33–43. [Google Scholar] [CrossRef]
- Campos, D.T.; Marks, B.P.; Powell, M.R.; Tamplin, M.L. Quantifying the robustness of a broth-based Escherichia coli o157:H7 growth model in ground beef. J. Food Prot. 2005, 68, 2301–2309. [Google Scholar] [CrossRef] [PubMed]
- Mejlholm, O.; Gunvig, A.; Borggaard, C.; Blom-Hanssen, J.; Mellefont, L.; Ross, T.; Leroi, F.; Else, T.; Visser, D.; Dalgaard, P. Predicting growth rates and growth boundary of Listeria monocytogenes—An international validation study with focus on processed and ready-to-eat meat and seafood. Int. J. Food Microbiol. 2010, 141, 137–150. [Google Scholar] [CrossRef] [PubMed]
- Tienungoon, S.; Ratkowsky, D.A.; McMeekin, T.A.; Ross, T. Growth limits of Listeria monocytogenes as a function of temperature, pH, NaCl, and lactic acid. Appl. Environ. Microbiol. 2000, 66, 4979–4987. [Google Scholar] [CrossRef] [PubMed]
Figure 1.
Kinetics of inhibitory compound production by C. maltaromaticum D0h. DI, diameter of inhibition zone.
Figure 1.
Kinetics of inhibitory compound production by C. maltaromaticum D0h. DI, diameter of inhibition zone.
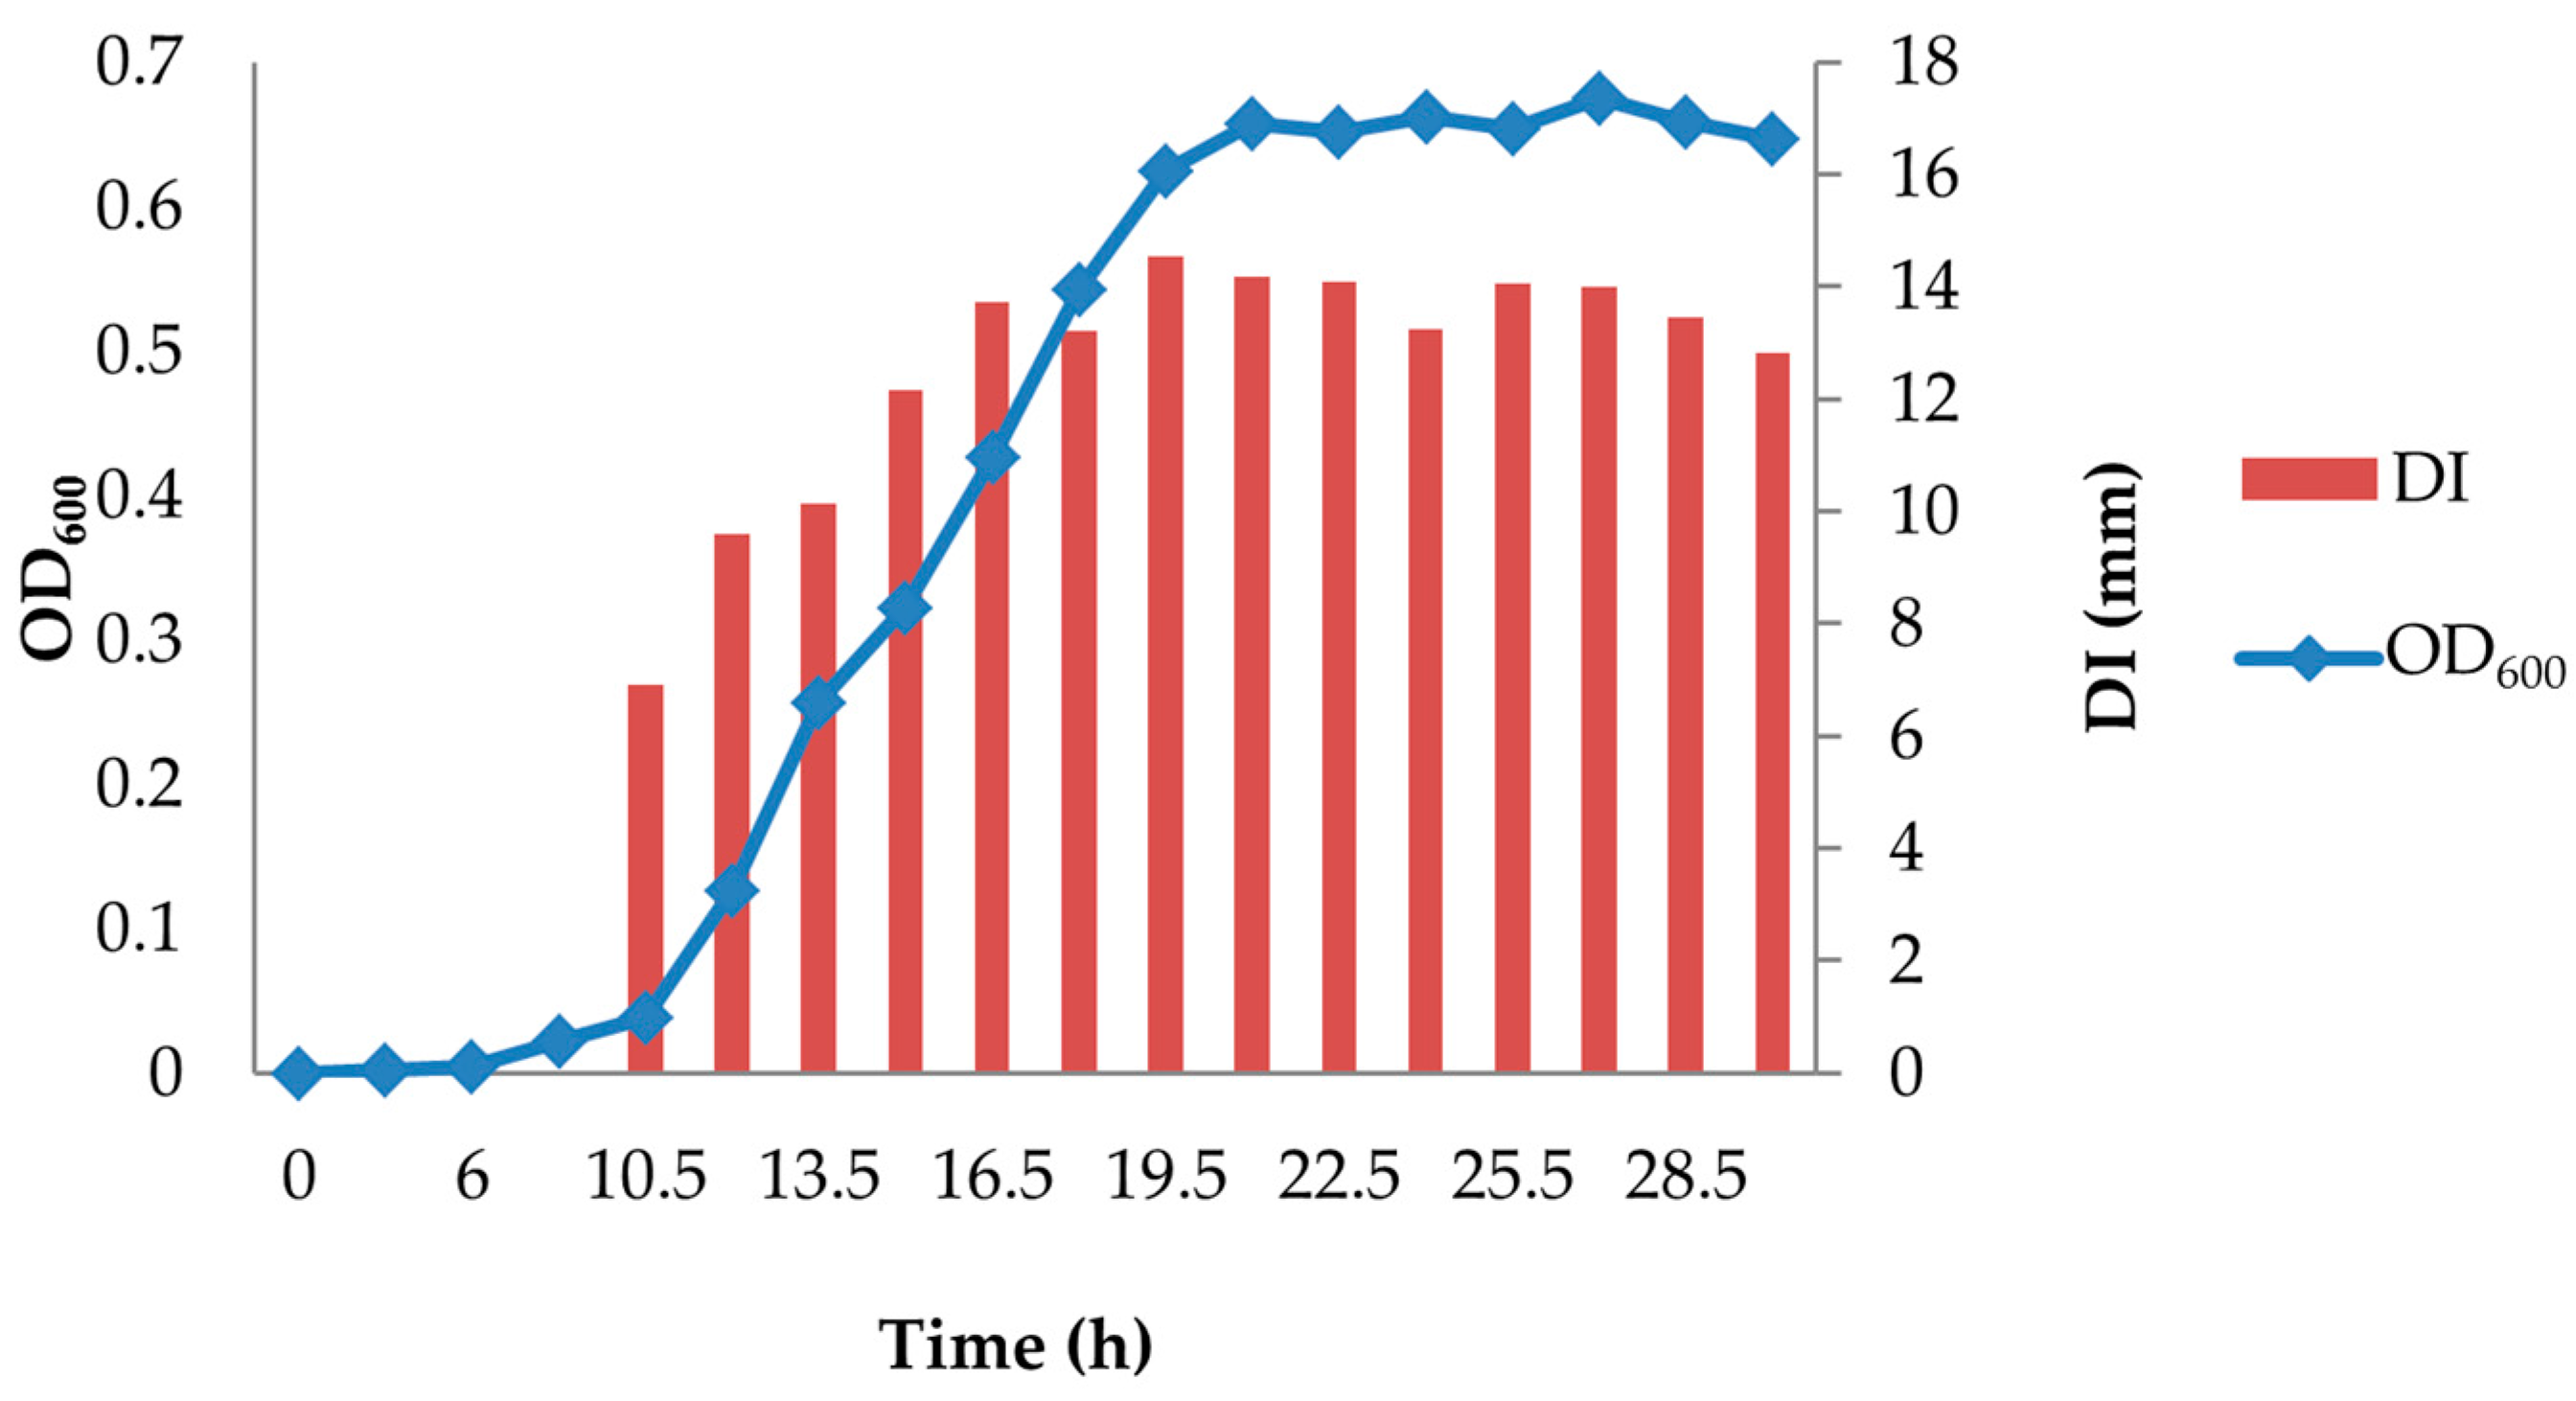
Figure 2.
Effect of pH and lactic acid on inhibitor production (AU/mL/h) by C. maltaromaticum D0h. In (A,B), the error bar represents the standard error of the mean; means with the same letters are not significantly different. In (B), means having the same level of pH, but differing amounts of total lactic acid were compared. (C) shows the production rates achieved from all culture conditions and grouped according to the calculated amount of undissociated lactic acid.
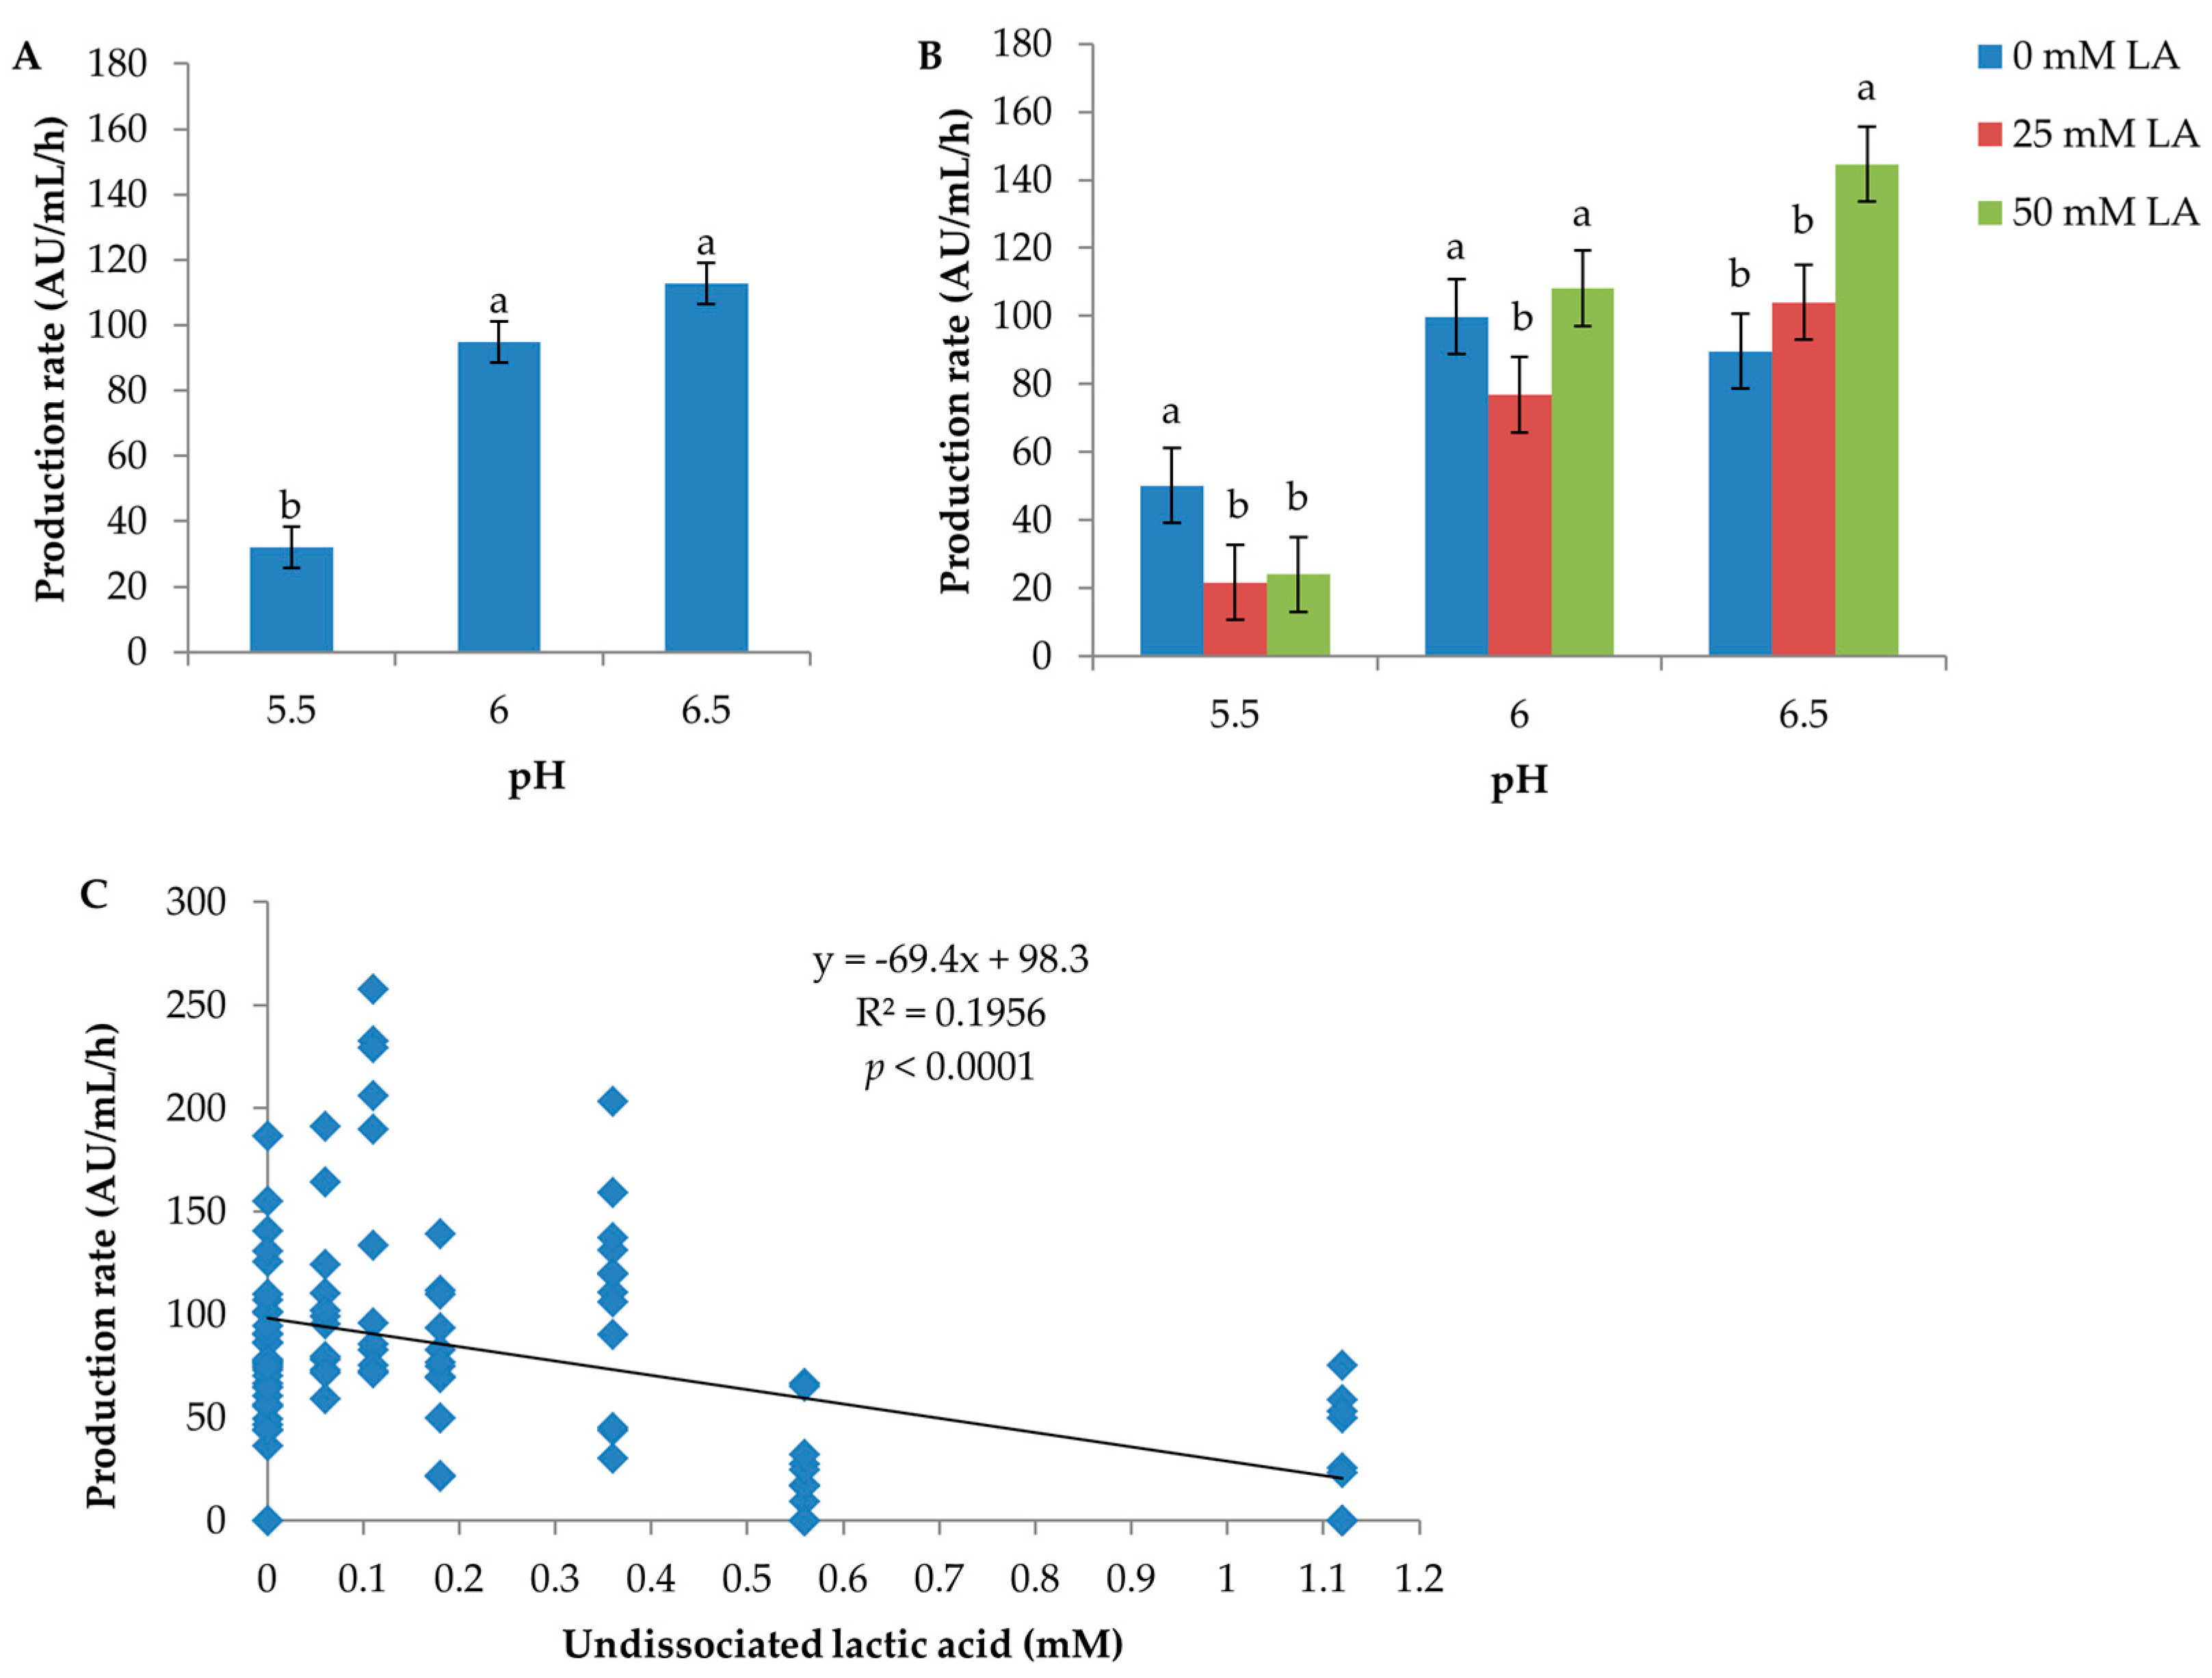
Figure 3.
Effect of environmental factors on the diameter of inhibition zone (DI). (A) Temperature; (B) Atmosphere (aerobic vs. anaerobic); (C) Glucose; (D) Lactic acid; (E) pH. The error bar represents the standard error of the mean. Means with the same letter in each panel are not significantly different.

Figure 4.
Effects of interactions among environmental factors on the diameter of inhibition zone (DI). In (A,E), Aerob signifies aerobic atmosphere; Anaerob signifies anaerobic atmosphere. The two-factor interactions shown in (A–D,F,G) were significant (F-test, p < 0.05). The interaction shown in (E) was not statistically significant (p = 0.055). (H) shows a linear regression between DI and undissociated lactic acid. Error bars are the standard error of the mean. Means within the same level of the factor shown on the x-axis were compared, and different letters indicate significant differences.


Table 1.
Levels of lactic acid, glucose and pH for modified brain heart infusion (mBHI) formulations.
Table 1.
Levels of lactic acid, glucose and pH for modified brain heart infusion (mBHI) formulations.
| Medium (No.) | Lactic Acid (mM) | Glucose (mM) | pH | UndisLA (mM) 1 |
|---|---|---|---|---|
| 1 | 0 | 0 | 5.5 | 0 |
| 2 | 0 | 0 | 6 | 0 |
| 3 | 0 | 0 | 6.5 | 0 |
| 4 | 25 | 0 | 5.5 | 0.56 |
| 5 | 25 | 0 | 6 | 0.18 |
| 6 | 25 | 0 | 6.5 | 0.06 |
| 7 | 50 | 0 | 5.5 | 1.12 |
| 8 | 50 | 0 | 6 | 0.36 |
| 9 | 50 | 0 | 6.5 | 0.11 |
| 10 | 0 | 0.56 | 5.5 | 0 |
| 11 | 0 | 0.56 | 6 | 0 |
| 12 | 0 | 0.56 | 6.5 | 0 |
| 13 | 25 | 0.56 | 5.5 | 0.56 |
| 14 | 25 | 0.56 | 6 | 0.18 |
| 15 | 25 | 0.56 | 6.5 | 0.06 |
| 16 | 50 | 0.56 | 5.5 | 1.12 |
| 17 | 50 | 0.56 | 6 | 0.36 |
| 18 | 50 | 0.56 | 6.5 | 0.11 |
| 19 | 0 | 5.55 | 5.5 | 0 |
| 20 | 0 | 5.55 | 6 | 0 |
| 21 | 0 | 5.55 | 6.5 | 0 |
| 22 | 25 | 5.55 | 5.5 | 0.56 |
| 23 | 25 | 5.55 | 6 | 0.18 |
| 24 | 25 | 5.55 | 6.5 | 0.06 |
| 25 | 50 | 5.55 | 5.5 | 1.12 |
| 26 | 50 | 5.55 | 6 | 0.36 |
| 27 | 50 | 5.55 | 6.5 | 0.11 |
1 UndisLA, the undissociated form of lactic acid (Materials and Methods, Section 2.3).
Table 2.
Incubation conditions for DI measurement.
| Temperature (°C) | Atmosphere | Medium No. 1 | Incubation Time (Days) | |
|---|---|---|---|---|
| Aerobic | Anaerobic | |||
| 25 | + | + | 1–27 | 10 |
| 15 | + | + | 1–27 | 19 |
| 7 | + | + | 1–27 | 45 |
| −1 | + | + | 1–3, 5, 6, 8–12, 14, 15, 17–21, 23, 24, 26, 27 | 145 |
| −1 | + | + | 13 | 263 |
| −1 | + | 4, 16, 22 | 263 | |
| −1 | + | + | 7, 25 | NG 2 |
| −1 | + | 4, 16, 22 | NG | |
1 Medium No. is described in Table 1. 2 NG, no visible growth of target bacterium was observed; diameter of inhibition zone not measured.
© 2017 by the authors. Licensee MDPI, Basel, Switzerland. This article is an open access article distributed under the terms and conditions of the Creative Commons Attribution (CC BY) license (http://creativecommons.org/licenses/by/4.0/).
Share and Cite
MDPI and ACS Style
Zhang, P.; Kaur, M.; Bowman, J.P.; Ratkowsky, D.A.; Tamplin, M. Effect of Environmental Factors on Intra-Specific Inhibitory Activity of Carnobacterium maltaromaticum. Microorganisms 2017, 5, 59. https://doi.org/10.3390/microorganisms5030059
AMA Style
Zhang P, Kaur M, Bowman JP, Ratkowsky DA, Tamplin M. Effect of Environmental Factors on Intra-Specific Inhibitory Activity of Carnobacterium maltaromaticum. Microorganisms. 2017; 5(3):59. https://doi.org/10.3390/microorganisms5030059
Chicago/Turabian StyleZhang, Peipei, Mandeep Kaur, John P. Bowman, David A. Ratkowsky, and Mark Tamplin. 2017. "Effect of Environmental Factors on Intra-Specific Inhibitory Activity of Carnobacterium maltaromaticum" Microorganisms 5, no. 3: 59. https://doi.org/10.3390/microorganisms5030059
Note that from the first issue of 2016, this journal uses article numbers instead of page numbers. See further details here.