Unusual Animal Behavior Preceding the 2011 Earthquake off the Pacific Coast of Tohoku, Japan: A Way to Predict the Approach of Large Earthquakes

Abstract
:Simple Summary
Abstract
1. Introduction
2. Material and Methods
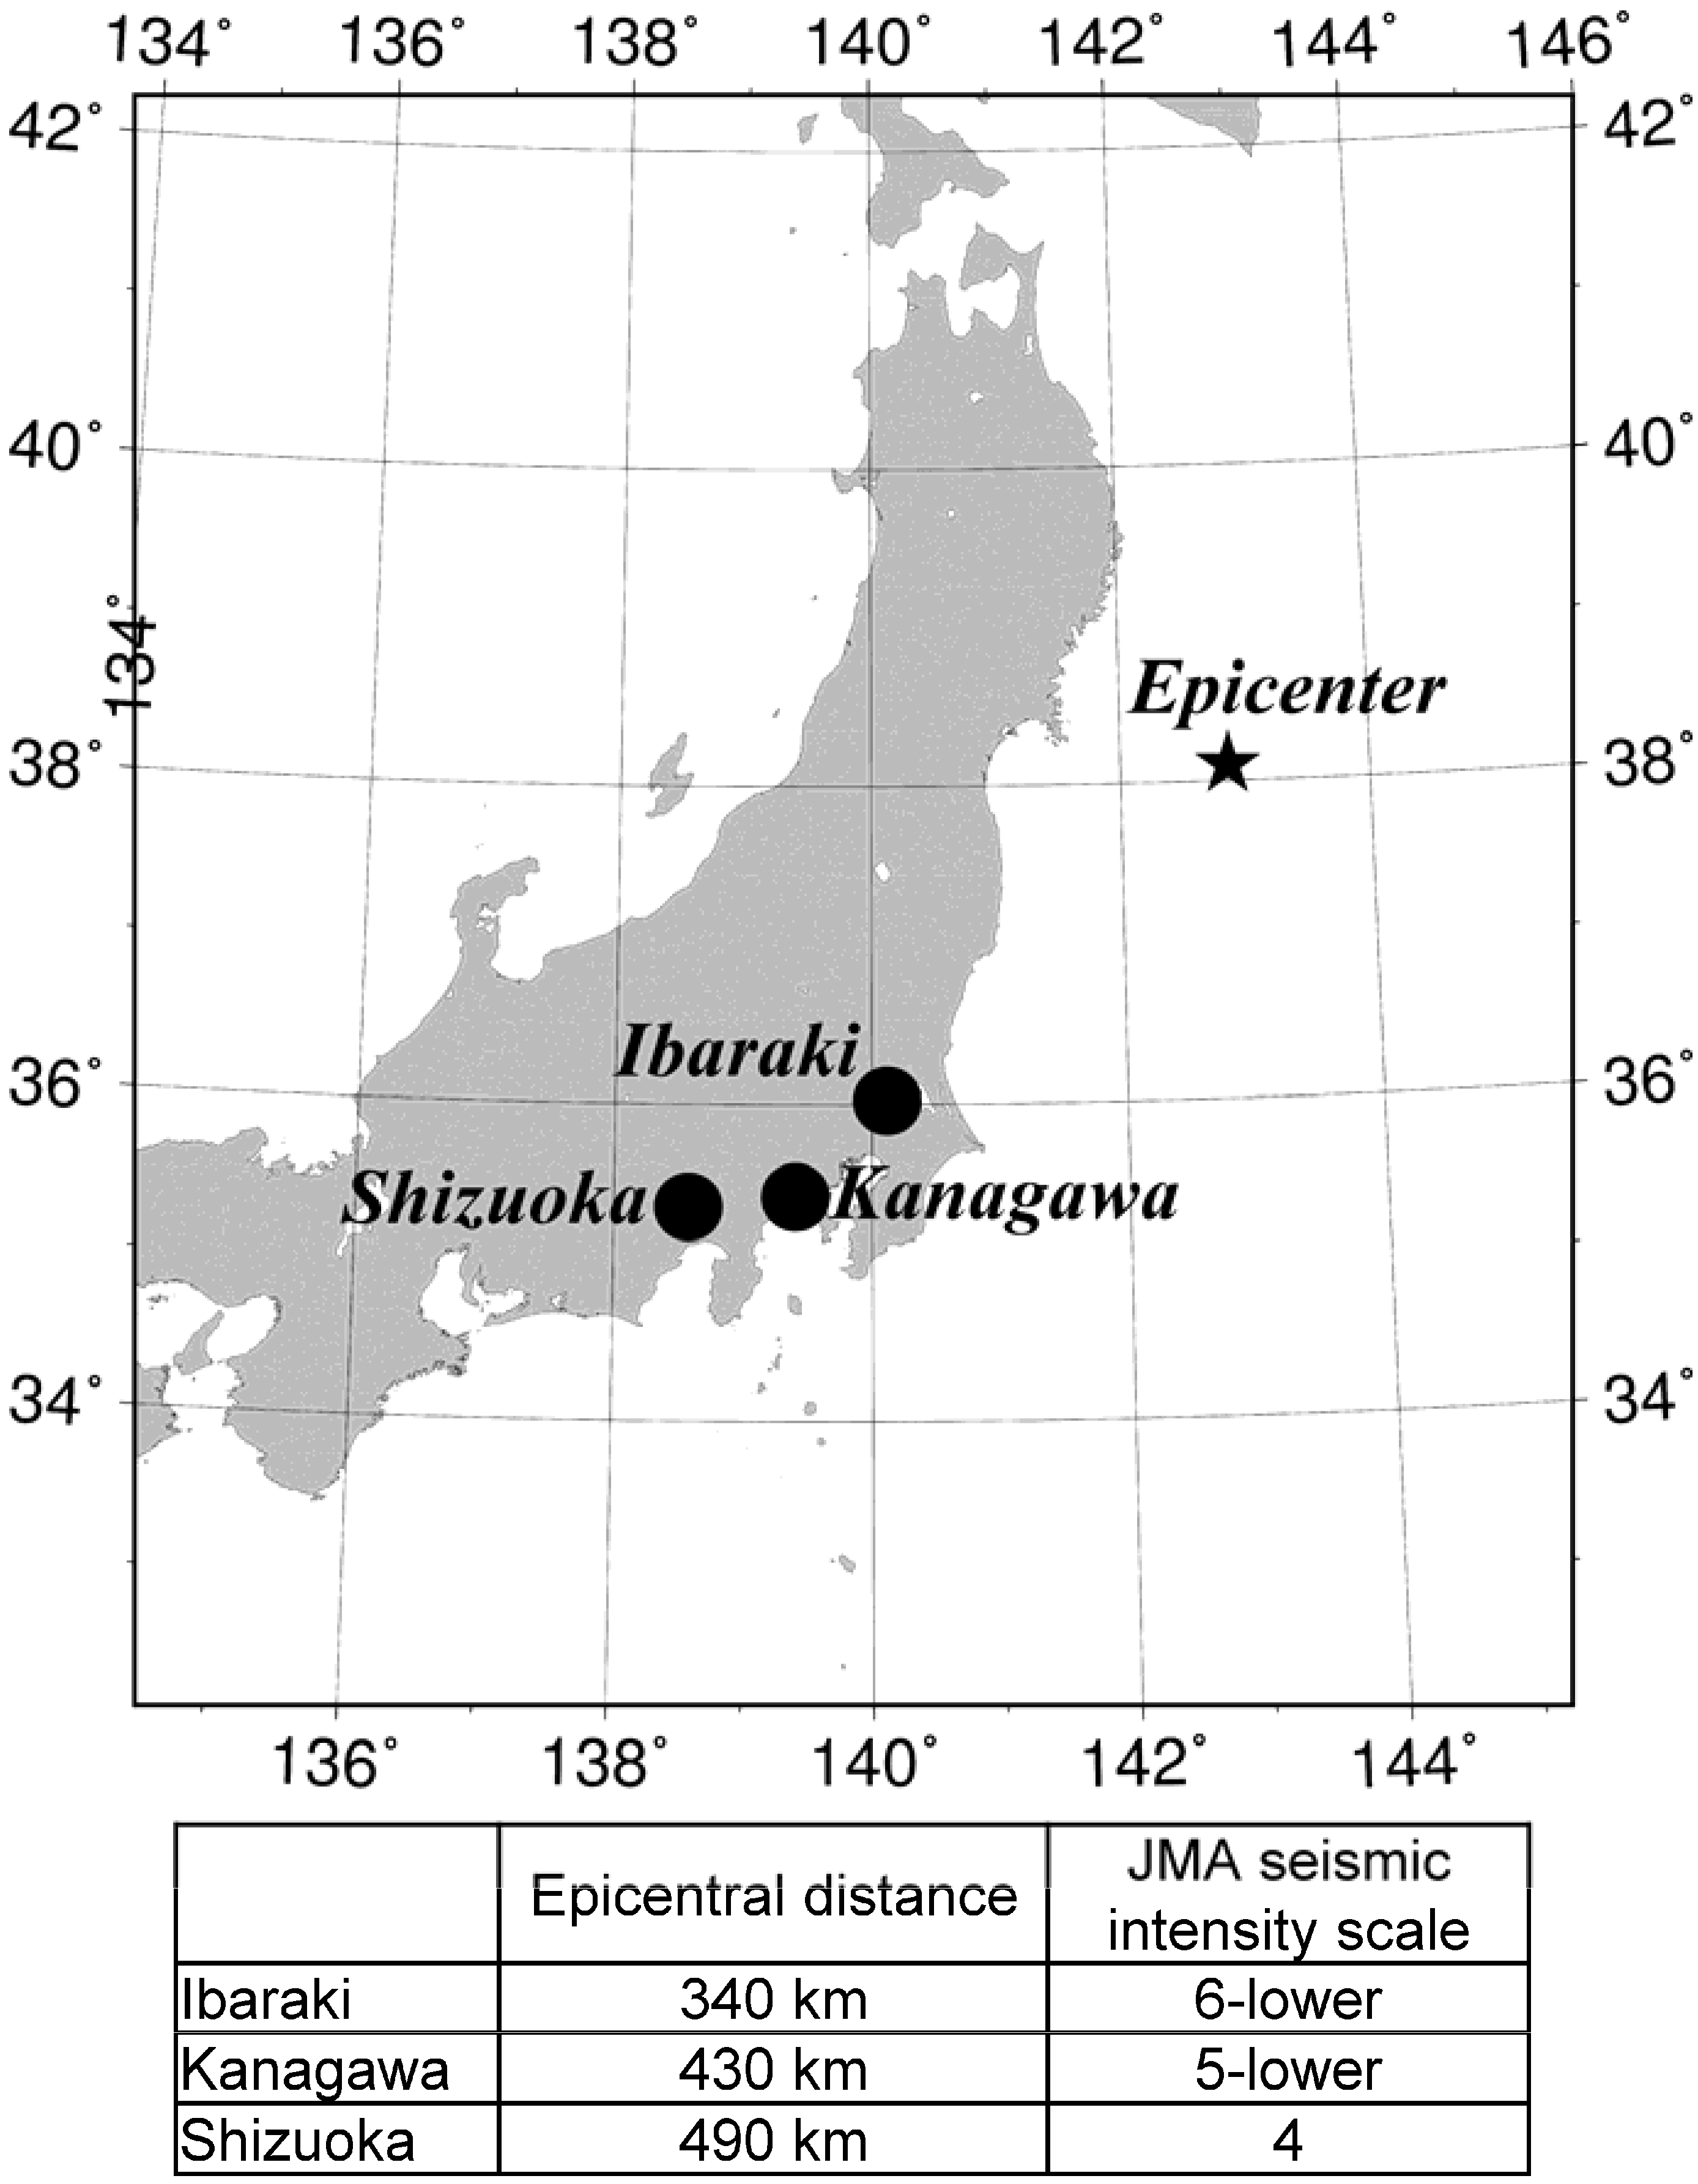
2.1. Seismic Data
2.2. UABs of Pets

| Abbreviations | Behavior types | |
|---|---|---|
| 1 | Escaped | Animals escaped their normal home environment (home or yard) |
| 2 | Frightened | Animals were frightened by something |
| 3 | Barked (dog) | Dogs barked more than usual |
| 4 | Howled (dog) | Dogs howled more than usual |
| 5 | Vocalized (cat) | Cats vocalized more than usual |
| 6 | Restless | Animals were restless |
| 7 | Trembling | Animal’s bodies were trembling |
| 8 | Shaking off | Animals were shaking off a lot |
| 9 | Hiding | Animals were in hiding somewhere |
| 10 | Different place | Animals wanted to be in a different place than usual |
| 11 | No appetite | Animals had no appetite |
| 12 | Diarrhea | Animals had diarrhea |
| 13 | Vomited | Animals vomited |
| 14 | Stuck | Animals stuck close to the owner |
| 15 | Aggressive | Animals became aggressive |
| 16 | Other | Other |
2.3. Milk Yields of Cows

2.4. Statistical Analysis
3. Results
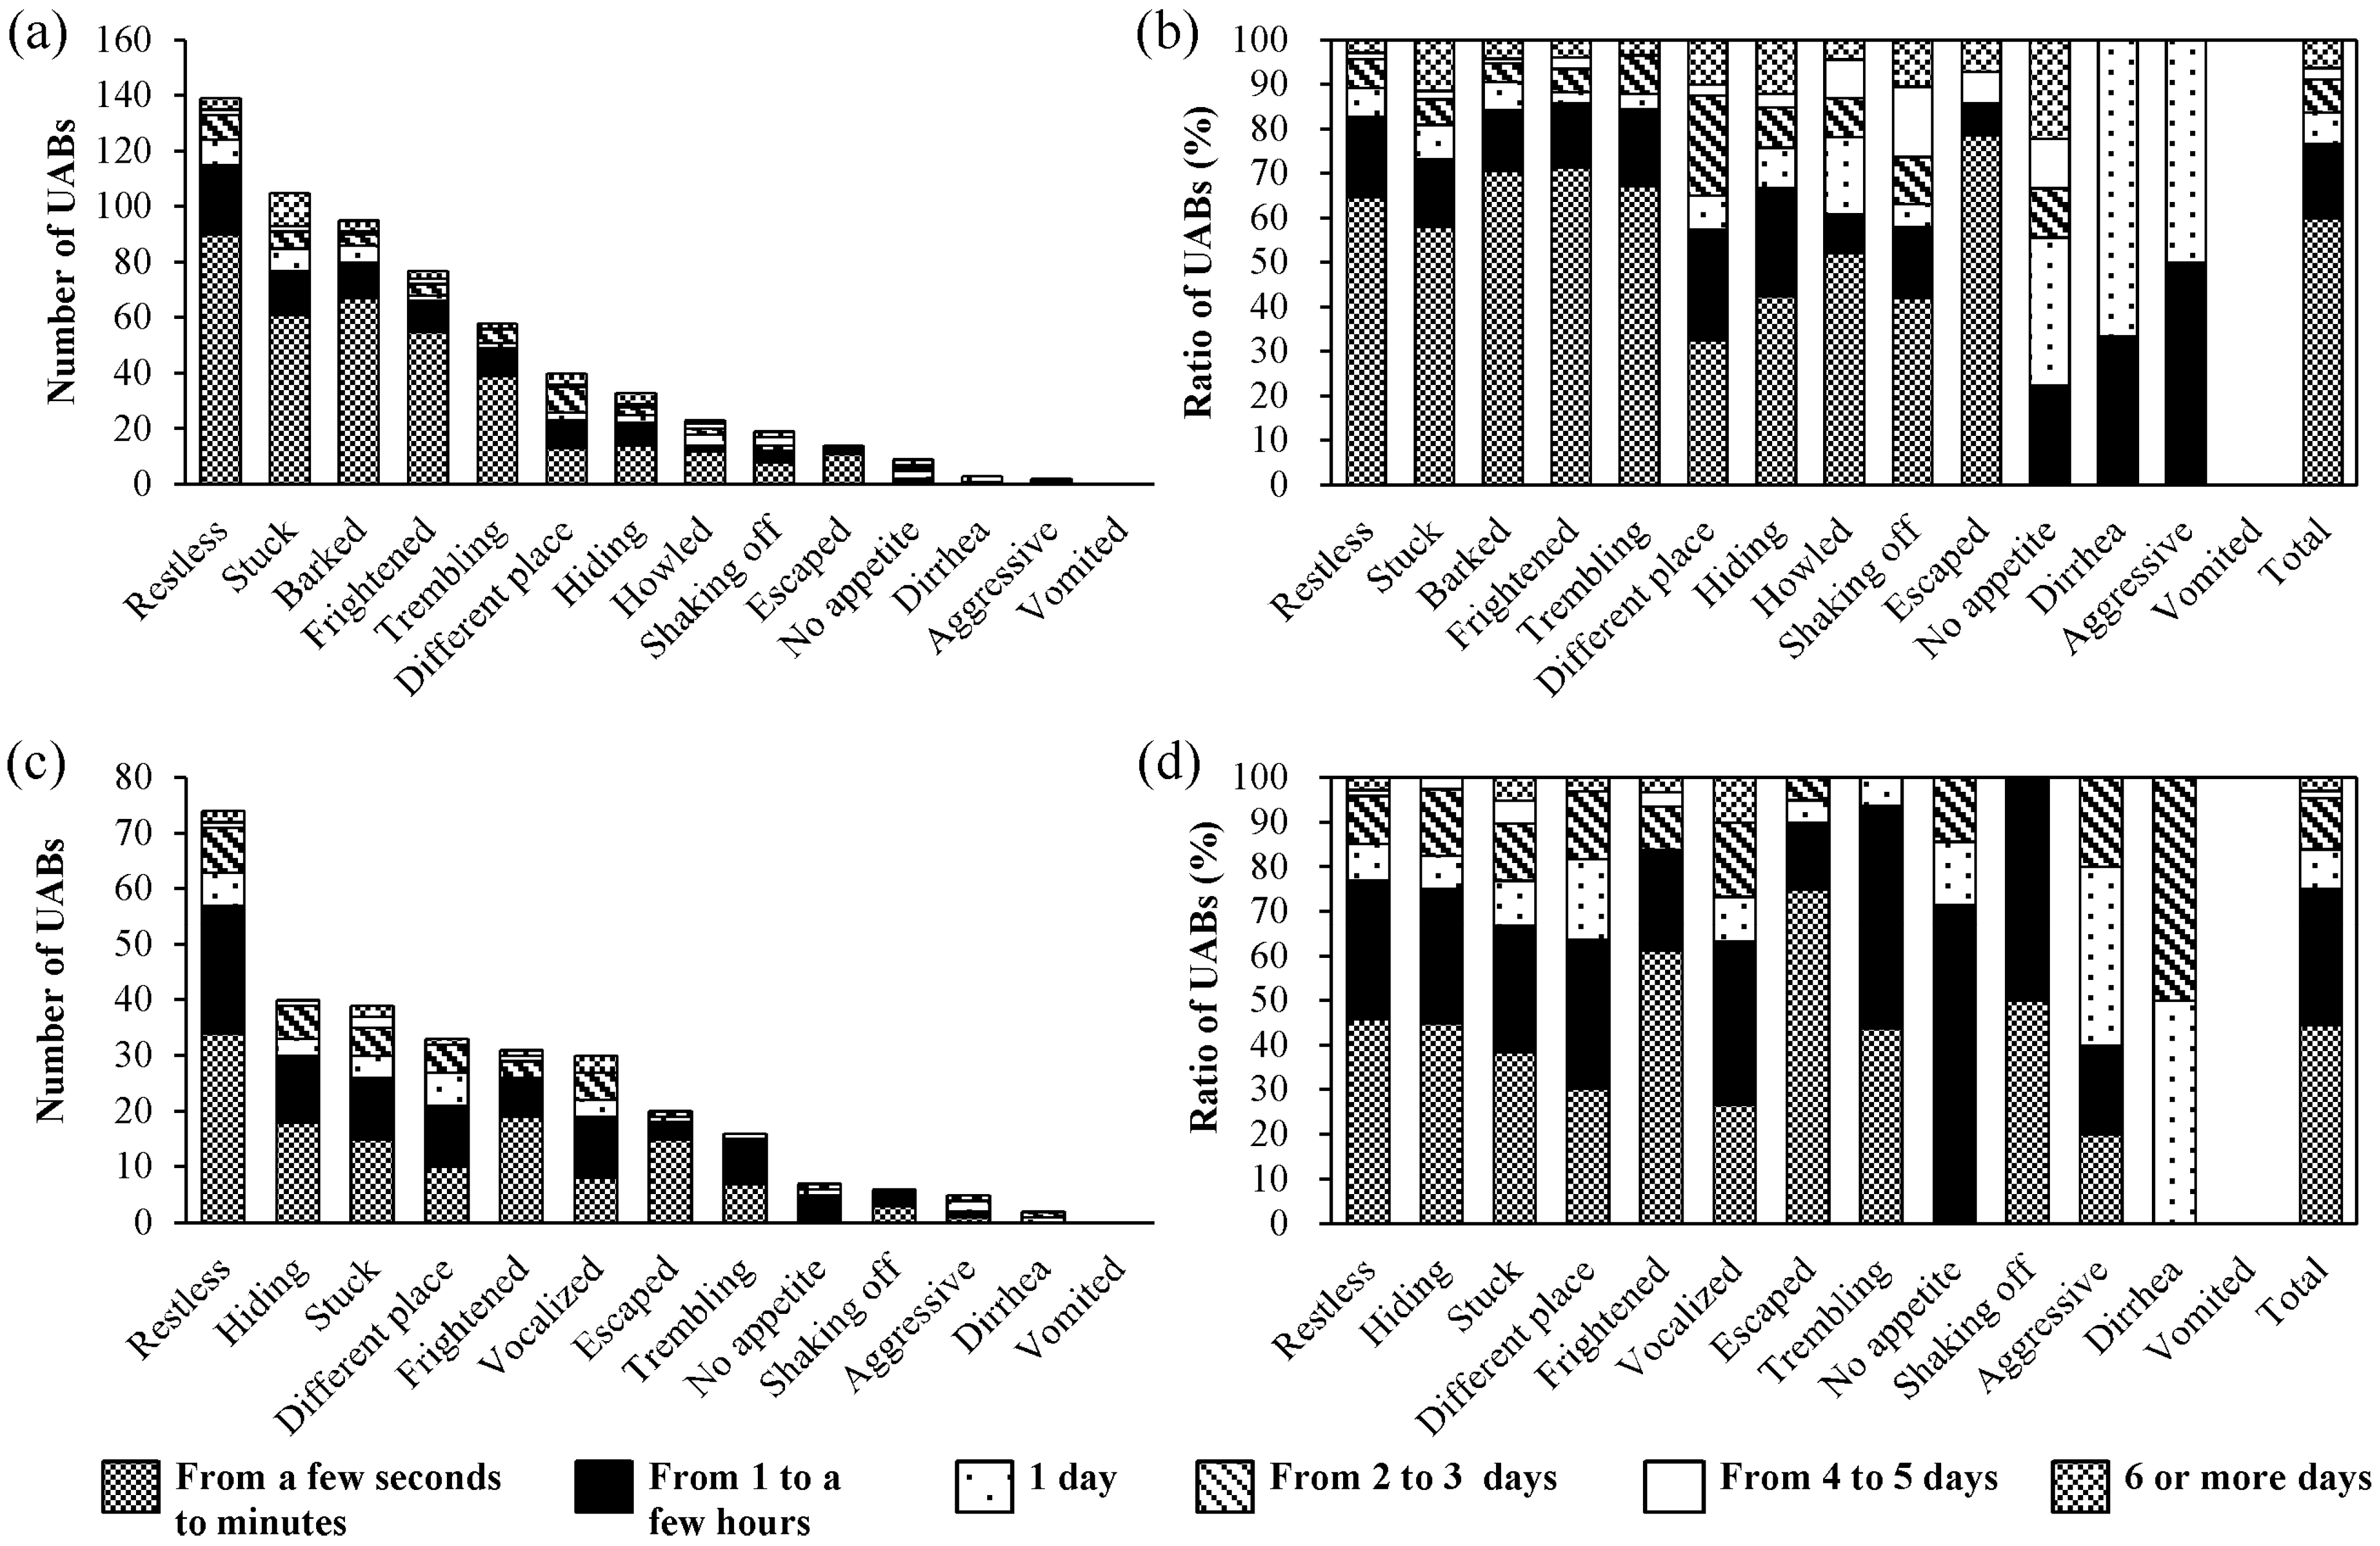
3.1. UABs of Pets
| Dogs | Cats | |
|---|---|---|
| n | 1259 | 703 |
| Sex | ||
| Male (intact) | 665 (329) | 373 (57) |
| Female (intact) | 589 (235) | 327 (41) |
| Unknown | 5 | 3 |
| Age (years old) | ||
| <1 | 69 | 34 |
| 1–3 | 372 | 249 |
| 4–6 | 303 | 144 |
| 7–9 | 261 | 88 |
| 10–12 | 163 | 76 |
| 13–15 | 63 | 44 |
| >16 | 13 | 46 |
| Unknown | 15 | 22 |
| Rearing place | ||
| Indoor | 1159 | 677 |
| Outdoor | 100 | 26 |
| Distance from epicenter (km; mean ± S.E.) | 527.5 ± 7.8 | 498.7 ± 9.7 |

| b | P value | Odds ratio | 95% CI | ||
|---|---|---|---|---|---|
| lower | upper | ||||
| From a few seconds to minutes | −2.021 | <0.001 | 0.149 | 0.067 | 0.326 |
| From 1 to a few hours | −1.605 | 0.020 | 0.225 | 0.062 | 0.824 |
| 1 day | −2.335 | 0.019 | 0.130 | 0.020 | 0.836 |
| From 2 to 3 days | −1.633 | 0.106 | 0.190 | 0.029 | 1.277 |
| From 4 to 5 days | 1.356 | 0.456 | 3.742 | 0.116 | 139.779 |
| 6 or more days | −4.408 | <0.001 | 0.014 | 0.001 | 0.128 |
| b | P value | Odds ratio | 95% CI | ||
|---|---|---|---|---|---|
| lower | upper | ||||
| From a few seconds to minutes | −0.848 | 0.155 | 0.428 | 0.132 | 1.373 |
| From 1 to a few hours | −1.281 | 0.071 | 0.278 | 0.068 | 1.111 |
| 1 day | 1.298 | 0.308 | 3.664 | 0.307 | 46.573 |
| From 2 to 3 days | −2.974 | 0.014 | 0.051 | 0.004 | 0.525 |
| From 4 to 5 days | −1.082 | 0.666 | 0.339 | 0.002 | 47.806 |
| 6 or more days | 0.174 | 0.905 | 1.190 | 0.069 | 21.144 |
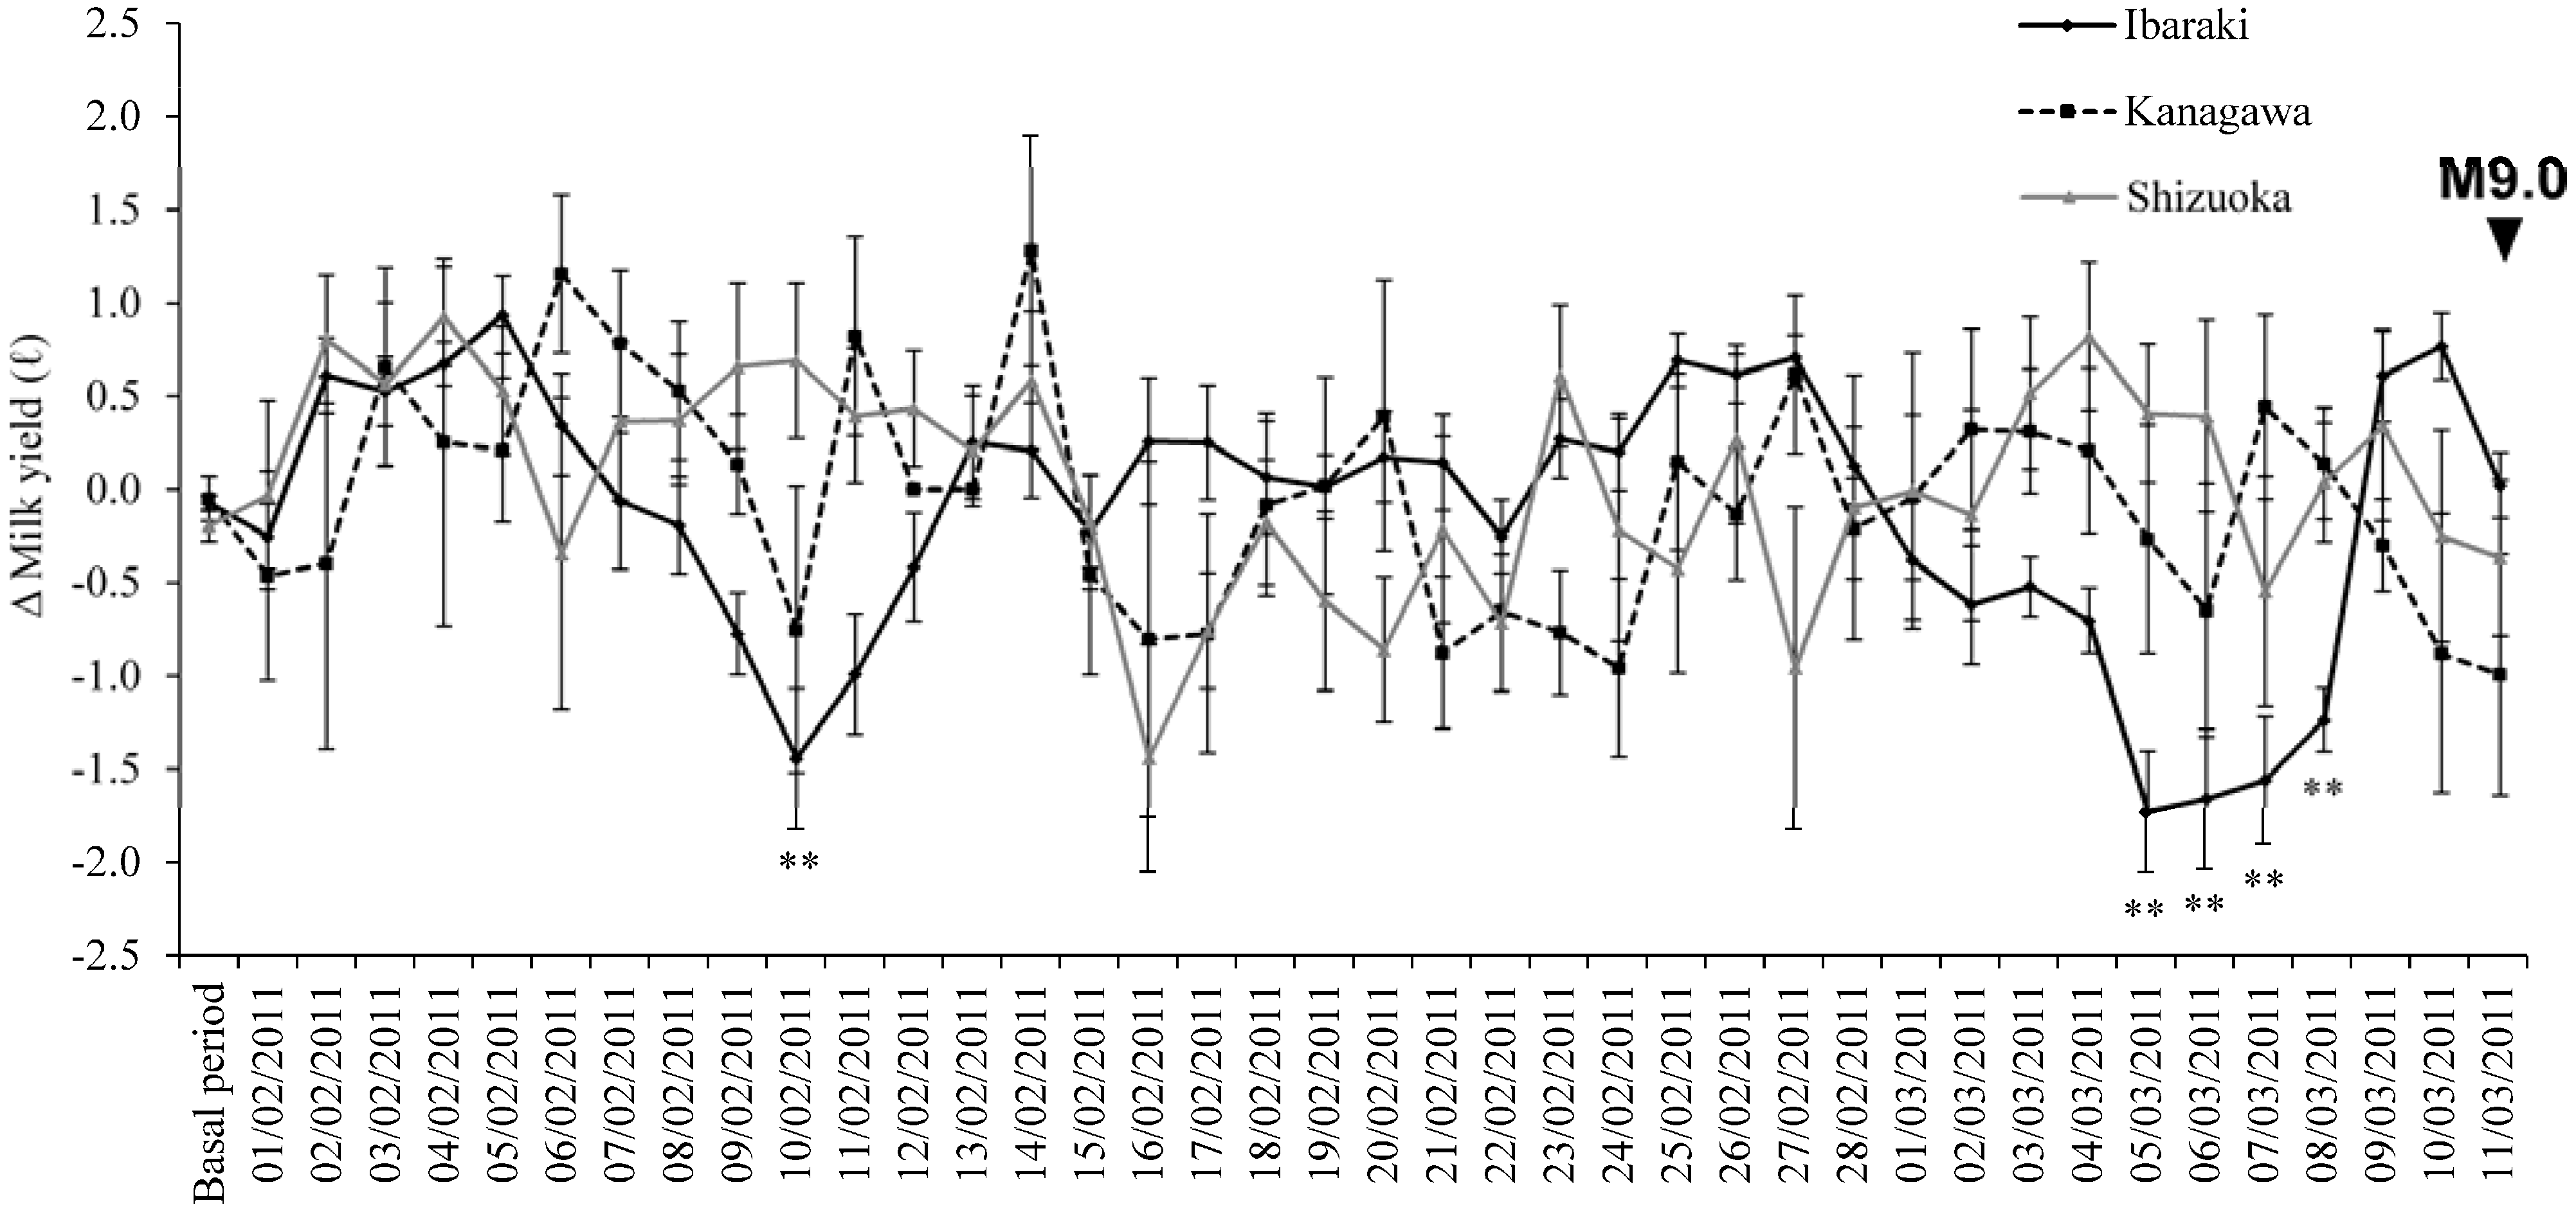
3.2. Milk Yields of Cows
| Date | Time | Distance from epicenters (km) | Dobrovolsky radius (km) | Depth (km) | Magnitude | ||
|---|---|---|---|---|---|---|---|
| Ibaraki | Kanagawa | Shizuoka | |||||
| 05/02/2011 | 10:56 | 140 | 130 | 190 | 170 | 64 | 5.2 |
| 10/02/2011 | 22:03 | 170 | 260 | 320 | 210 | 48 | 5.4 |
| 24/02/2011 | 14:36 | 30 | 110 | 170 | 40 | 73 | 3.6 |
| 26/02/2011 | 04:12 | 180 | 140 | 190 | 140 | 56 | 5.0 |
| 27/02/2011 | 02:18 | 240 | 190 | 140 | 140 | 4 | 5.0 |
| 27/02/2011 | 05:38 | 240 | 200 | 140 | 230 | 4 | 5.5 |
| 07/03/2011 | 15:13 | 90 | 30 | 70 | 40 | 140 | 3.8 |
| 09/03/2011 | 11:45 | 380 | 470 | 530 | 1380 | 8 | 7.3 |
| 09/03/2011 | 11:57 | 390 | 480 | 540 | 460 | 12 | 6.2 |
| 09/03/2011 | 11:58 | 370 | 460 | 520 | 380 | 21 | 6.0 |
| 09/03/2011 | 13:36 | 400 | 490 | 550 | 420 | 11 | 6.1 |
| 10/03/2011 | 03:16 | 350 | 440 | 500 | 570 | 29 | 6.4 |
| 10/03/2011 | 03:44 | 400 | 490 | 560 | 510 | 36 | 6.3 |
| 10/03/2011 | 06:22 | 360 | 460 | 520 | 510 | 18 | 6.3 |
| 10/03/2011 | 06:23 | 350 | 450 | 510 | 840 | 9 | 6.8 |
| 11/03/2011 | 14:46 | 430 | 340 | 490 | 7410 | 24 | 9.0 |

4. Discussion
5. Conclusions
Acknowledgements
Author Contributions
Conflicts of Interest
References
- Hayakawa, M.; Hattori, K.; Ohta, K. Monitoring of ULF (Ultra-Low-Frequency) Geomagnetic Variations Associated with Earthquakes. Sensors 2007, 7, 1108–1122. [Google Scholar] [CrossRef]
- Maekawa, S.; Horie, T.; Yamauchi, T.; Sawaya, T.; Ishikawa, M.; Hayakawa, M.; Sasaki, H. A Statistical Study on the Effect of Earthquakes on the Ionosphere, Based on the Subionospheric LF Propagation Data in Japan. Ann. Geophys. (Germany) 2006, 24, 2219–2225. [Google Scholar] [CrossRef]
- Wattananikorn, K.; Kanaree, M.; Wiboolsake, S. Soil Gas Radon as an Earthquake Precursor: Some Considerations on Data Improvement. Radiat. Measur. 1998, 29, 593–598. [Google Scholar] [CrossRef]
- Rikitake, T. Prediction and Precursors of Majour Earthquakes; Terra Scientific Publishing Company: Tokyo, Japan, 2003. [Google Scholar]
- Terada, T. On Luminous Phenomena Accompanying Earthquakes. Bull. Earthq. Res. Inst. Univ. Tokyo 1931, 9, 225–255. [Google Scholar]
- Tributsch, H. When the Snakes Awake: Animals and Earthquake Prediction; MIT Press: Cambridge, MA, USA, 1982. [Google Scholar]
- Igarashi, G.; Wakita, H.; Sato, T. Precursory and Coseismic Anomalies in Well Water Levels Observed for the February 2, 1992 Tokyo Bay Earthquake. Geophys. Res. Lett. 1992, 19, 1583–1586. [Google Scholar] [CrossRef]
- Wadatsumi, K. 1591 Witnesses Phenomena Prior to Earthquakes (in Japanese); Tokyo Publisher: Tokyo, Japan, 1995. [Google Scholar]
- Ulsoy, Ü.; Ikeya, M. Retrospective Statements of Earthquake Precursors by Eye-Witnesses. In Future Systems for Earthquake Early Warning; Ulsoy, Ü., Kundu, K.H., Eds.; Nova Science Publishers, Inc.: New York, NY, USA, 2008; pp. 3–53. [Google Scholar]
- Buskirk, R.E.; Frohlich, C.; Latham, G.V. Unusual Animal Behavior before Earthquakes: A Review of Possible Sensory Mechanisms. Rev. Geophys. 1981, 19, 247–270. [Google Scholar]
- Yokoi, S.; Ikeya, M.; Yagi, T.; Nagai, K. Mouse Circadian Rhythm before the Kobe Earthquake in 1995. Bioelectromagnetics 2003, 24, 289–291. [Google Scholar] [CrossRef]
- Li, Y.; Liu, Y.; Jiang, Z.; Guan, J.; Yi, G.; Cheng, S.; Yang, B.; Fu, T.; Wang, Z. Behavioral Change Related to Wenchuan Devastating Earthquake in Mice. Bioelectromagnetics 2009, 30, 613–620. [Google Scholar] [CrossRef]
- Rikitake, T. Biosystem Behaviour as an Earthquake Precursor. Tectonophysics 1978, 51, 1–20. [Google Scholar] [CrossRef]
- Ikeya, M. Earthquakes and Animals: From Folks Legends to Science; World Scientific: Singapore, 2004. [Google Scholar]
- Heffner, H.E. Auditory Awareness. Appl. Anim. Behav. Sci. 1998, 57, 259–268. [Google Scholar] [CrossRef]
- Shier, D.; Butler, J.; Lewis, R. Hole's Human Anatomy and Physiology, 10th ed; McGraw-Hill: Boston, MA, USA, 2004. [Google Scholar]
- Hart, B.L. Olfaction and Feline Behavior. Feline Pract. 1977, 7, 8–10. [Google Scholar]
- Beadle, M. The Cat: History, Biology, and Behavior; Simon and Schuster: New York, NY, USA, 1977. [Google Scholar]
- Halász, N. Vertebrate Olfactory System; Akaderniai Kiado: Budapest, Hungary, 1990. [Google Scholar]
- Krestel, D.; Passe, D.; Smith, J.; Jonsson, L. Behavioral Determination of Olfactory Thresholds to Amyl Acetate in Dogs. Neurosci. Biobehav. Rev. 1984, 8, 169–174. [Google Scholar]
- Passe, D.; Walker, J. Odor Psychophysics in Vertebrates. Neurosci. Biobehav. Rev. 1985, 9, 431–467. [Google Scholar] [CrossRef]
- Hayakawa, M. Possible Electromagnetic Effects on Abnormal Animal Behavior before an Earthquake. Animals 2013, 3, 19–32. [Google Scholar] [CrossRef]
- Lott, D.F.; Hart, B.L.; Verosub, K.L.; Howell, M.W. Is Unusual Animal Behavior Observed before Earthquakes? Yes and No. Geophys. Res. Lett. 1979, 6, 685–687. [Google Scholar] [CrossRef]
- Grant, R.A.; Halliday, T.; Balderer, W.P.; Leuenberger, F.; Newcomer, M.; Cyr, G.; Freund, F.T. Ground Water Chemistry Changes before Major Earthquakes and Possible Effects on Animals. Int. J. Environ. Res. Public Health 2011, 8, 1936–1956. [Google Scholar] [CrossRef]
- Freund, F. Earthquake forewarning—A Multidisciplinary Challenge from the Ground Up to Space. Acta Geophys. 2013, 61, 775–807. [Google Scholar] [CrossRef]
- Freund, F.; Stolc, V. Nature of Pre-Earthquake Phenomena and their Effects on Living Organisms. Animals 2013, 3, 513–531. [Google Scholar] [CrossRef]
- Singh, R.P.; Kumar, J.S.; Zlotnicki, J.; Kafatos, M. Satellite Detection of Carbon Monoxide Emission Prior to the Gujarat Earthquake of 26 January 2001. Appl. Geochem. 2010, 25, 580–585. [Google Scholar] [CrossRef]
- Rushen, J.; Munksgaard, L.; Marnet, P.; DePassillé, A. Human Contact and the Effects of Acute Stress on Cows at Milking. Appl. Anim. Behav. Sci. 2001, 73, 1–14. [Google Scholar] [CrossRef]
- Rigalma, K.; Duvaux-Ponter, C.; Barrier, A.; Charles, C.; Ponter, A.; Deschamps, F.; Roussel, S. Medium-Term Effects of Repeated Exposure to Stray Voltage on Activity, Stress Physiology, and Milk Production and Composition in Dairy Cows. J. Dairy Sci. 2010, 93, 3542–3552. [Google Scholar] [CrossRef]
- Fidani, C. Biological Anomalies around the 2009 L’Aquila Earthquake. Animals 2013, 3, 693–721. [Google Scholar] [CrossRef]
- Nikonov, A.A. Abnormal Animal Behaviour as a Precursor of the 7 December 1988 Spitak, Armenia, Earthquake. Nat. Hazards 1992, 6, 1–10. [Google Scholar] [CrossRef]
- Beaver, B.V. Feline Behavior; Elsevier Health Sciences: Philadelphia, PA, USA, 2003. [Google Scholar]
- Beaver, B.V. Canine Behavior: Insights and Answers; Elsevier Health Sciences: Philadelphia, PA, USA, 2009. [Google Scholar]
- Casey, R. Fear and Stress. In BSAVA Manual of Canine and Feline Behavioural Medicine; Horwitz, D., Mills, D., Eds.; British Small Animal Veterinary Association: Guarantee, UK, 2002; pp. 144–153. [Google Scholar]
- Chen, C.; Wen, S.; Liu, J.; Hattori, K.; Han, P.; Hobara, Y.; Wang, C.; Yeh, T.; Yen, H. Surface Displacements in Japan before the 11 March 2011 M9. 0 Tohoku-Oki Earthquake. J. Asian Earth Sci. 2014, 80, 165–171. [Google Scholar] [CrossRef]
- Whitehead, N.E.; Ulusoy, Ü.; Asahara, H.; Ikeya, M. Are any Public-Reported Earthquake Precursors Valid? Nat. Hazard. Earth. Sys. 2004, 4, 463–468. [Google Scholar] [CrossRef]
- Wood, P.D.P. Algebraic Model of the Lactation Curve in Cattle. Nature 1967, 216, 164–165. [Google Scholar] [CrossRef]
- National Oceanic and Atmospheric Administration. Livestock Hot Weather Stress.Operations Manual Letter C-31–76; Department of Commerce, NOAA, National Weather Service Central Region: Kansas City, MO, USA, 1976.
- Vitali, A.; Segnalini, M.; Bertocchi, L.; Bernabucci, U.; Nardone, A.; Lacetera, N. Seasonal Pattern of Mortality and Relationships between Mortality and Temperature-Humidity Index in Dairy Cows. J. Dairy Sci. 2009, 92, 3781–3790. [Google Scholar] [CrossRef]
- Dobrovolsky, I.P.; Zubkov, S.I.; Miachkin, V.I. Estimation of the Size of Earthquake Preparation Zones. Pure Appl. Geophys. 1979, 117, 1025–1044. [Google Scholar] [CrossRef]
- Liso, de G.; Fidani, C. Seismic Precursory Phenomenology in Unusual Animal Behaviour in Val Pellice, Western Piedmont, in Comparison with Anomalies of some Physical Parameters. Open J. Earthq. Res. 2014, 3, 30–42. [Google Scholar] [CrossRef]
- Whitehead, N.E.; Ulusoy, Ü. Macroscopic Anomalies before the September 2010 M = 7.1 Earthquake in Christchurch, New Zealand. Nat. Hazard. Earth. Syst. Sci. 2013, 13, 167–176. [Google Scholar]
- Kirschvink, J.L. Earthquake Prediction by Animals: Evolution and Sensory Perception. Acta Seismol. Sinica 2000, 90, 312–323. [Google Scholar]
- Hoshiba, M.; Iwakiri, K.; Hayashimoto, N.; Shimoyama, T.; Hirano, K.; Yamada, Y.; Ishigaki, Y.; Kikuta, H. Outline of the 2011 off the Pacific Coast of Tohoku Earthquake (Mw 9.0)-Earthquake Early Warning and Observed Seismic Intensity. Earth Planets Space 2011, 63, 547–551. [Google Scholar] [CrossRef]
- Hayakawa, M.; Hobara, Y.; Yasuda, Y.; Yamaguchi, H.; Ohta, K.; Izutsu, J.; Nakamura, T. Possible Precursor to the March 11, 2011, Japan Earthquake: Ionospheric Perturbations as seen by Subionospheric very Low frequency/low Frequency Propagation. Ann. Geophys. 2012, 55, 95–99. [Google Scholar]
- Heki, K. Ionospheric Electron Enhancement Preceding the 2011 Tohoku-Oki Earthquake. Geophys. Res. Lett. 2011, 38. Available online: http://hdl.handle.net/2115/48572 (accessed on 2 February 2014). [CrossRef]
- Ouzounov, D.; Pulinets, S.; Romanov, A.; Romanov, A.; Tsybulya, K.; Davidenko, D.; Kafatos, M.; Taylor, P. Atmosphere-Ionosphere Response to the M9 Tohoku Earthquake Revealed by Multi-Instrument Space-Borne and Ground Observations: Preliminary Results. Earthq. Sci. 2011, 24, 557–564. [Google Scholar] [CrossRef]
- Lott, D.F.; Hart, B.L.; Howell, M.W. Retrospective Studies of Unusual Animal Behavior as an Earthquake Predictor. Geophys. Res. Lett. 1981, 8, 1203–1206. [Google Scholar] [CrossRef]
© 2014 by the authors; licensee MDPI, Basel, Switzerland. This article is an open access article distributed under the terms and conditions of the Creative Commons Attribution license (http://creativecommons.org/licenses/by/3.0/).
Share and Cite
Yamauchi, H.; Uchiyama, H.; Ohtani, N.; Ohta, M. Unusual Animal Behavior Preceding the 2011 Earthquake off the Pacific Coast of Tohoku, Japan: A Way to Predict the Approach of Large Earthquakes. Animals 2014, 4, 131-145. https://doi.org/10.3390/ani4020131
Yamauchi H, Uchiyama H, Ohtani N, Ohta M. Unusual Animal Behavior Preceding the 2011 Earthquake off the Pacific Coast of Tohoku, Japan: A Way to Predict the Approach of Large Earthquakes. Animals. 2014; 4(2):131-145. https://doi.org/10.3390/ani4020131
Chicago/Turabian StyleYamauchi, Hiroyuki, Hidehiko Uchiyama, Nobuyo Ohtani, and Mitsuaki Ohta. 2014. "Unusual Animal Behavior Preceding the 2011 Earthquake off the Pacific Coast of Tohoku, Japan: A Way to Predict the Approach of Large Earthquakes" Animals 4, no. 2: 131-145. https://doi.org/10.3390/ani4020131