Article

Public Understanding and Attitudes towards Meat Chicken Production and Relations to Consumption

Centre for Animal Welfare and Ethics, School of Veterinary Science, University of Queensland, Gatton, Queensland 4343, Australia
*
Author to whom correspondence should be addressed.
Animals 2017, 7(3), 20; https://doi.org/10.3390/ani7030020
Submission received: 9 January 2017 / Revised: 13 February 2017 / Accepted: 2 March 2017 / Published: 9 March 2017

Abstract

:

Simple Summary

Public knowledge of meat chicken production and how it influences attitudes to birds’ welfare and consumer behaviour is poorly understood. We therefore conducted a survey of the public in SE Queensland, Australia, from which we determined that industry knowledge was limited. Where it existed, it related to an empathetic attitude towards chicken welfare and an increase in chicken consumption. This suggests that consumers who eat more chicken believe that they should understand the systems of production of the animals that they are consuming.

Abstract

Little is known about public knowledge of meat chicken production and how it influences attitudes to birds’ welfare and consumer behaviour. We interviewed 506 members of the public in SE Queensland; Australia; to determine how knowledge of meat chicken production and slaughter links to attitudes and consumption. Knowledge was assessed from 15 questions and low scores were supported by respondents’ self-assessed report of low knowledge levels and agreement that their knowledge was insufficient to form an opinion about which chicken products to purchase. Older respondents and single people without children were most knowledgeable. There was uncertainty about whether chicken welfare was adequate, particularly in those with little knowledge. There was also evidence that a lack of empathy towards chickens related to lack of knowledge, since those that thought it acceptable that some birds are inadequately stunned at slaughter had low knowledge scores. More knowledgeable respondents ate chicken more frequently and were less likely to buy products with accredited labelling. Approximately half of the respondents thought the welfare of the chicken was more important than the cost. It is concluded that the public’s knowledge has an important connection to their attitudes and consumption of chicken.

1. Introduction

Consumers’ selection of food is governed by many factors, including culture, religion, lifestyle, diet, knowledge, health concerns and food trends, often influenced by the media [1]. Because they are no longer intimately involved in the food production process, the public’s trust in the product is largely dependent on livestock producers having an empathetic approach to the animals used in the production of food [2]. This involves conforming to ethical standards throughout the breeding, growing and processing of the product. Two important concepts govern the intention to purchase animal-welfare-friendly products: consumer self-identification with ethical issues and Theory of Planned Behaviour, in which the attitudes, subjective norms and perceived level of behavioural control combine to influence the intention to purchase [3]. Self-identification is influenced by socio-demographic factors and the consumer’s animal-related experiences [3]. The latter may be closely linked to their understanding of production systems; we chose meat chicken production to investigate this as it is one of the areas in which there is major concern for animal welfare. It is also important to recognize that consumers may identify animal welfare as far from optimal, but continue to buy and eat meat [4]. This is only possible because of distancing themselves from the production process.
Little is known about the public’s sources of information on animal welfare, including the role of the media, with the associated problem of the accuracy of reporting. Their understanding of animal production systems may be anthropomorphic, an approach supported by some animal welfare scientists [5]. The media may particularly influence public opinion on contentious issues, such as the phasing out of battery cages [6,7]. Conversely, some possible developments in chicken production, such as breeding blind chickens, are not supported by the public because of their interference with bird integrity, even if they do appear to give welfare advantages in intensive production [8]. Many authors have attempted to alert the public to the welfare impact of intensifying production systems, starting with Ruth Harrison in the 1960s [6]. As production systems have intensified, it has become difficult for the public to assess the animals’ welfare [7]. Modern industrial chicken meat production practices are designed to provide low-cost meat to consumers, retailing at less than one-half the price of other meats [9]. Many consumers have a negative perception of intensive farming and say that they are willing to pay more for food produced where animal welfare standards are considered and followed [10,11,12]. However, many consumers do not purchase the products from animals kept in better welfare because of the high price [13].
Despite a belief that welfare is being sacrificed for industrial-scale production, the demand for chicken meat is increasing worldwide; for example, the Australian market has increased by 160% in the last 20 years and the consumption of chicken has exceeded the consumption of any other kind of meat [9]. As well as low cost, the chicken industry attributes the rapid increase of demand to the versatility and ease of handling and cooking chicken products, and the fact that they are a low-fat protein source [9]. However, some discriminatory buying by consumers is evidenced in their reluctance to buy meat produced from intensive systems if the quality of meat produced is perceived to be adversely affected by the way the animals have been treated [14].
The Australian chicken industry has a “vertically integrated” structure. Individual companies control almost all aspects of production: breeding farms, hatcheries, feed mills, supply of feed to contractors, broiler growing farms/units, medication, transport, and initial and further processing plants [9,15]. The management from day-old stock until the day of processing, including staffing, housing and equipment, is mostly contracted out to growers (for example, 800 growers in Australia produce 80% of meat chickens, nearly all under contract to just two integrated national companies [9]. Growers are paid a negotiated monetary return per 100 birds or per weight at the end of the growing cycle. The typical modern unit has 3–10 poultry sheds that are tunnel ventilated, each about 150 × 15 m, with a capacity of 40–60,000 birds [9,16]. Aspects of production that relate to welfare, such as stocking densities, lighting regime and general husbandry practices, are usually determined by the companies’ regulatory quality control systems or the industry code of practice [17]. Apart from contract rearing, other meat chickens are produced by large company farms, or on farms owned and managed by intermediary companies, where each is controlled by a manager who is contracted to a processing company. Breeding farms owned by the major chicken companies are strategically located across Australia, with a trend towards siting of great-grandparent and grandparent breeder farms in areas isolated from traditional poultry rearing places to reduce the risk of exposure to disease agents [9,16].
The aim of this study was to assess the public’s knowledge of chicken production systems and its influence on attitudes towards animal welfare and chicken consumption. We hypothesized that, in line with the Theory of Planned Behaviour, the knowledge of the public about chicken production systems would have an impact on attitudes and the way consumers choose chicken products, and that these would also be influenced by key demographic factors. We anticipated that low levels of knowledge would cause uncertainty in choosing chicken products and in attitudes towards chicken welfare.

2. Materials and Methods

We used a quantitative questionnaire that addressed (1) public knowledge of intensive chicken meat production, including transport and slaughtering systems; (2) the attitude of the public towards meat chicken welfare and (3) their choice of chicken products. Socio-demographic questions were also included, which were used to further explain consumer behaviour and identify potential market segments. The questionnaire was designed taking into account the literature on public knowledge and attitudes towards chicken production systems [18,19,20,21,22,23,24]. We defined knowledge as “facts, information, and skills acquired through experience or education; the theoretical or practical understanding of a subject” and attitude as a “relatively stable favourable or unfavourable feeling or belief about a concept, person, or object” [25].
A total of 2663 consumers were approached in a face-to-face survey conducted with respondents who were randomly selected from the public in shopping centres, social clubs, cultural events and professional gatherings in Brisbane CBD, Surfers Paradise on the Gold Coast and a suburb of north Brisbane (Strathpine) during April and May 2013. Locations were selected to obtain a broad spectrum of views, in order to most accurately determine the relationships between knowledge and attitudes/consumption. Only respondents aged 18 years and over were eligible to take part. Clearances were obtained from the Brisbane City Council and the University of Queensland Human Ethics Committee (reference number 2013000458).

2.1. Questionnaire Design

A pilot survey was conducted by randomly selecting 15 individuals in Brisbane on each of three successive days. Following this, adjustment was made to the order and language of some of the questions to avoid any possible bias or leading responses.
The final questionnaire focused on the public knowledge and attitude to meat chicken production systems and the consumption of chicken products. Demographic questions were included to determine the respondent’s gender, age, education level, place of residence, income, marital status and religion. Two initial questions addressed subjective knowledge, asking respondents about their level of knowledge about chicken production systems (options: expert, good, some, little or no knowledge) and how they gained it (formal qualifications, farm employment, personal interest, friends and acquaintances and all of these). Then the questions covered three topics specifically related to meat chicken production: (a) objective knowledge of common practices during rearing, transport and slaughter of broilers, how much knowledge they thought they had and whether it was sufficient for choosing which products to purchase, (b) attitudes towards the welfare of birds on farm and during transport and slaughter, and (c) frequency of consumption of different chicken products, their attitude towards labelling systems and willingness to pay more for accredited chicken products (defined as accredited by FREPA (Free Range Egg and Poultry Association), RSPCA approved farming, ACO (Australian Certified Organic) farming, NASAA (National Association for Sustainable Agriculture, Australia) or OGA (Organic Growers of Australia)). In total there were 15 knowledge questions (Appendix A), 13 attitude questions, four consumption questions and 10 demographic questions. In the knowledge section, there were eight initial questions, all of which were marked correct (score 1) or incorrect (score 0), except one which asked the normal distance that chickens travel from their place of rearing to the abattoir. Respondents were given a score of 1 for a distance of 5–100 km, this being normal in Australia, and 0.5 for a distance of 100–200 km. Respondents were also asked how long it takes intensively-reared meat chickens to reach a slaughter weight of 2 kg (1 point for 35–45 days; 0.5 point for 30–35 days, otherwise no score). We were also able to explore the relationship between knowledge score and respondents’ self-reported understanding of chicken production systems as a validity check. Participants were asked to express their three biggest welfare concerns during transport and in production barns, with each valid welfare concern given a score of one, up to a maximum of 3. The maximum score in the knowledge section was 15.

2.2. Statistical Analysis

The questionnaire data was analysed in Minitab Version 16. The demographic background of participants was matched to the categories of the most recent Queensland Census 2011. Knowledge scores (K score) were determined for each respondent by the total number of correct answers out of 15 questions. This assumes that each question was the most relevant to test information on this aspect of the production system and contributes equally to a respondent’s total knowledge. Numerical distribution of the K scores was examined and, to determine its influence on attitude and consumption, the total score was regressed against 21 predictors describing attitude and consumer behaviour using forwards backwards stepwise regression with alpha levels of 0.015 and fitted intercepts. Effects of the predictors found to be significantly (p ≤ 0.05) correlated with knowledge scores were entered into a General Linear Model to examine the differences between levels. For this purpose, Knowledge scores were transformed to square root to approximate a normal distribution of residuals. Both back-transformed and untransformed means are provided. Pairwise comparisons were carried out using Tukey’s test.
Logistic regression analyses (either binary, nominal or ordinal, as appropriate to the response structure) were used to analyse the effects of demographic variables and knowledge scores on the attitude and behaviour questions. For example, to evaluate whether place of residence influenced responses to attitude questions, urban residents were used as the referent base group and compared to the other three groups, acreage/large blocks, rural (country town) and rural (farming property) using nominal logistic regression. Referent base groups were selected as those with the most responses, except that males were used rather than females since either group can be chosen without affecting the analysis if there are only two. A principal component analysis was used to cluster responses to attitude (13 questions) and knowledge (15 questions) questions.

3. Results

Of the 2663 eligible participants approached, 506 answered the survey, a response rate of 19%. The average response time was estimated at 18 min. There were 205 males and 286 females, a higher female proportion compared with Queensland census data (Table 1). Fifteen respondents chose not to disclose their gender. The most common age bracket was 30–49 (50.7%), and the most common education level was to college or university degree level. Our respondents were more numerous in the 40–49 year old category and less numerous in the 60 and over category compared with the Queensland census data of 2011, and represented a more educated sample of the population. Most were urban dwellers (87%), with few rural town dwellers (6%) or acreage (large block) dwellers (5%). Respondents’ income status was similar to the Australian average of AUD $78,000/year [26]. Most (n = 305, 64%) were partnered with children, more than in the state of Queensland, and almost half (n = 234, 46%) were of the Christian religion, fewer than in the state.

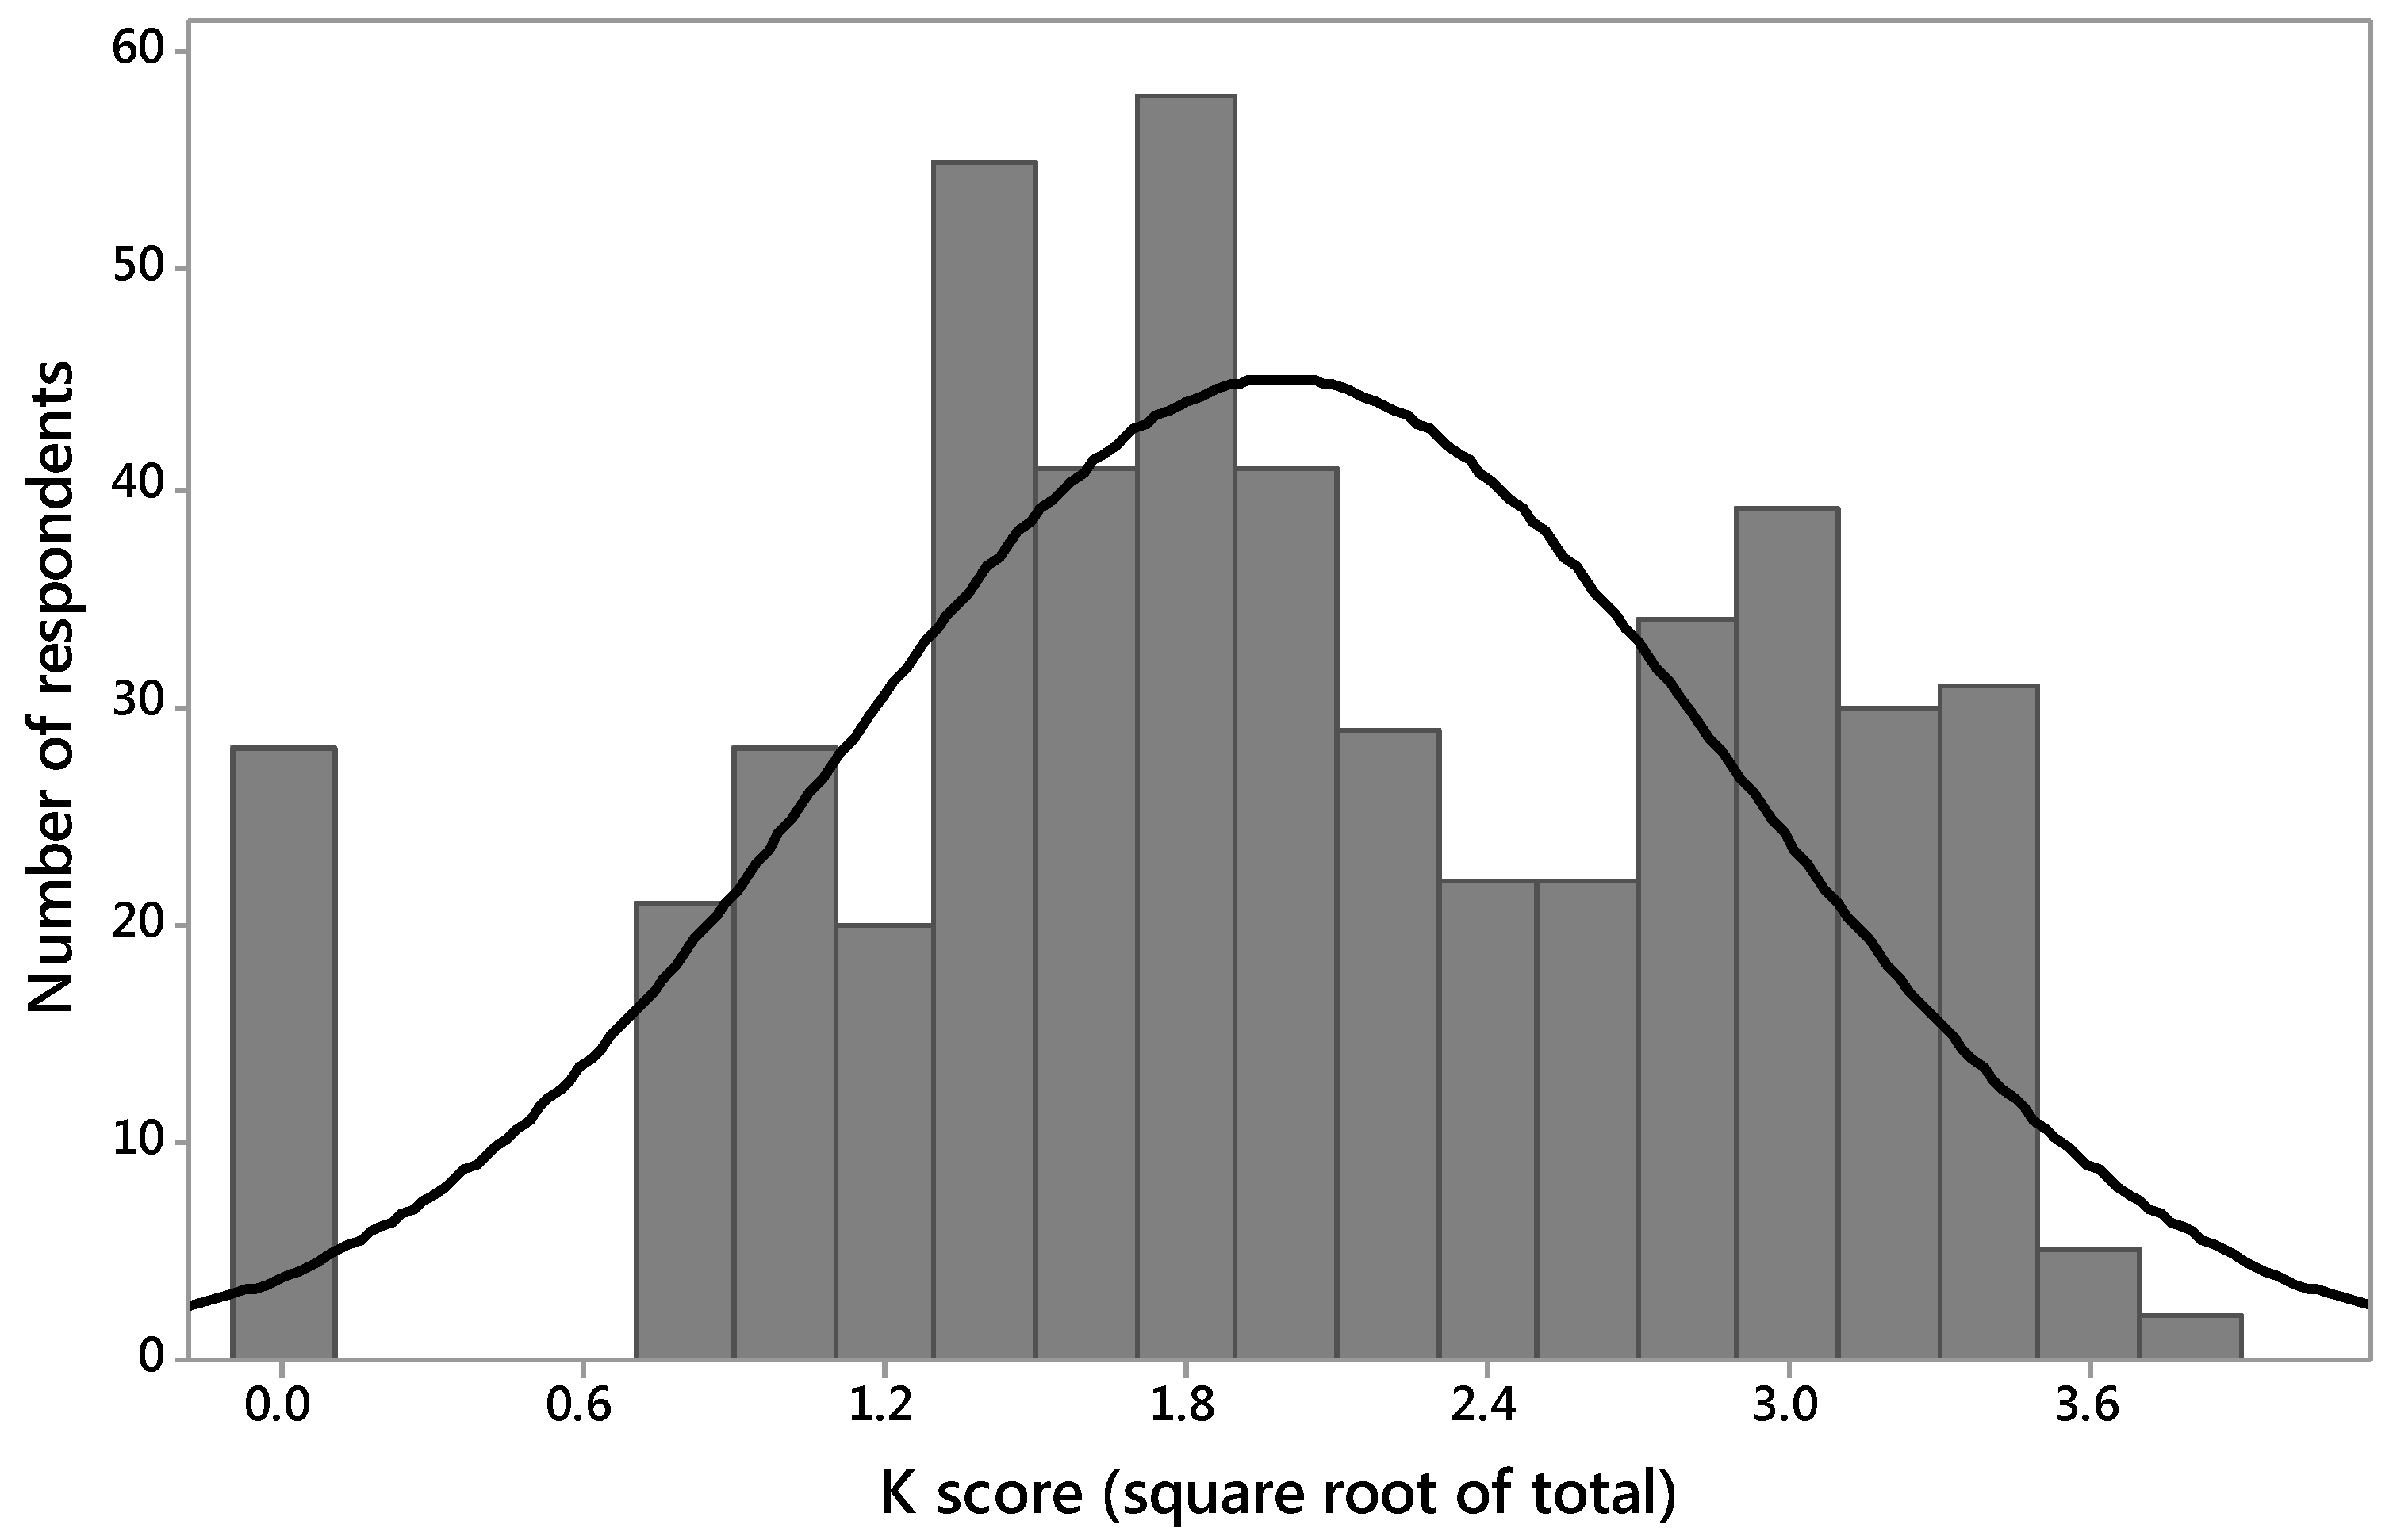
3.1. Respondents’ Knowledge

Respondents’ level of understanding of chicken production systems was most commonly reported as no, little or some knowledge, with fewer than 10% responding that their knowledge was good or expert (Table 2). Most gained their knowledge from the Internet and media, with a significant number gaining it from friends. Most had never visited a chicken farm, and, of the approximately one-third that had visited one before, it was not recent for most.
The distribution of K scores was not normal, but √K score approximated a normal distribution, except that there was a higher than expected number of zero values (n = 28) (Figure 1). The mean value for √K score was 1.99 (K score 3.96/15), median 2.0 (K score 4.0/15), with a Standard Deviation of 1.24. Given that the mean and medians were very similar, √K score values were used for analysis.
After eight knowledge questions (Appendix A), respondents were asked how long it takes for intensively-reared meat chickens to reach a slaughter weight of 2 kg. Only 47 respondents (9%) gave the correct answer of 35–45 days, 32 (6%) said 30–35 or 45–50 days and 427 (84%) gave answers outside of these choices. Respondents were asked, what are three of the biggest welfare problems for meat chickens in barns? A total of 156 respondents (31%) gave three valid responses, a further 65 respondents (13%) gave two valid responses and a further 48 respondents (9%) gave one valid response. The remaining 47% (n = 237) did not respond. The most common responses were poor lighting systems, too little space per bird, unable to reach feeders, unable to spread wings and too rapid growth. When the same question was asked for chickens in transport, 143 respondents (28%) gave three valid responses, a further 63 respondents (12%) gave two responses and a further 50 respondents (10%) gave one response. The most common responses were overcrowding, hot temperatures, odour, absence of food and water, and long distances.

3.2. Attitudes towards Welfare in Chicken Rearing System

A cluster analysis of the attitude questions produced 4 components with eigen values > 1, explaining 61% of the variation in total. A biplot of the first two components demonstrated that there were similar responses to questions about how good or bad animal welfare was on the farm, during transport and in the abattoir (Figure 2). Similar responses were observed at the opposite end of the scale for the first component for questions relating to attitudes to consumption, and to the two questions about chickens being conscious (religious slaughter and stunning acceptability). The first component appears to relate to purchasing issues, with Cost versus Animal Welfare (the cost of chicken meat is more important to me than the chicken’s welfare) at one end and willingness to pay more, including of accredited products, at the other end. The second component appears to relate to providing for animal welfare (most positive) versus pragmatic issues of cost and religious concerns (least positive).
Most respondents were unsure whether chickens reared in meat production systems are protected by government standards which ensure that the welfare of birds is adequate (Table 3). They were also either unsure what they thought about meat chicken welfare on farms and during transport, or they thought it was good, bad or neither good nor bad in approximately equal numbers. Very few thought it was very good or very bad. In the abattoir (Table 4) most were unsure, but many thought it was neither good nor bad and a significant proportion (17%) thought that it was good.
Most respondents (54%) felt that it was unacceptable or very unacceptable that 1% of birds do not get adequately stunned by normal abattoir practices (Table 4). A similar proportion (58%) felt that it was unacceptable that some Australian abattoirs are allowed to kill chickens that are conscious, for religious reasons (Table 4). Most respondents (83%) agreed or strongly agreed with the statement “Food must be produced and processed from chickens that are treated humanely” (Table 3).
There was no consensus among respondents about whether their knowledge of the welfare of meat chickens was sufficient to allow them to form an opinion about which chicken products they should purchase (Table 4), but 49% disagreed or strongly disagreed that the cost of chicken meat was more important to them than the chicken’s welfare, compared with only 27% agreeing or strongly agreeing (Table 3).

3.3. Consumption and Attitudes towards Labelling

The most common chicken products purchased were chicken pieces or whole chicken, not flavoured or processed products (Table 3). Free range chicken was the most common branded product purchased, followed by whole chicken and chicken portions (Table 3). Chicken was most commonly eaten weekly, and if not it was most likely to be eaten less than once a week (Table 4). Most bought it fresh (61.0%), not frozen (Table 4). Most respondents considered labelling of production systems important (Table 4), and an overwhelming majority (63%) wanted to see information regarding welfare wherever chicken products are sold (Table 3) and were specifically looking to buy accredited chicken products (Table 4). Just over half (56%) said that they were prepared to pay to set up animal welfare ratings but most commonly at the lowest option, $0.50 (AUD) per product item (Table 3), although some (14%) were willing to pay whatever it costs.

3.4. Relationships between Respondents’ Knowledge and:

3.4.1. Demographics

Respondents’ K scores increased with age from 1.9/15 for respondents ≤19 years to 5.5/15 for respondents aged 50–59 (Table 5). College certificate or diploma graduates had higher levels of knowledge than either respondents with high school certificates or university graduates. Acreage dwellers had higher knowledge scores than urban, rural town and other dwellers. K score was greatest for single people with no children.

3.4.2. Attitudes

When asked about the welfare of meat chickens at Australian abattoirs, respondents who rated it very bad or very good had higher K scores than those with intermediate ratings (Table 4). Those who were unsure had the lowest K score. When told that 1% of birds do not get adequately stunned by normal abattoir practices prior to slaughter, respondents who regarded the practice as unacceptable had high K scores of 4.58 compared with respondents with no strong feelings regarding the issue with a K score of 4.93. When asked if their knowledge about the welfare of meat chickens was sufficient to allow them to form an opinion about which chicken products to purchase, respondents who agreed had higher K scores than those who disagreed.

3.4.3. Consumption

Respondents’ K scores increased with the frequency of eating chicken, from <1/week to daily. However, those who did not eat chicken because they were vegetarian or they did not like chicken had intermediate K scores, lower than those with the highest consumption rate. Frozen chicken purchasers tended to have higher K scores than consumers who bought fresh products or a mixture of fresh and frozen (Table 4). Consumers who were willing to buy products with accredited labelling had lower K scores than those that were not. When told that some Australian abattoirs are allowed to kill chickens without them being unconscious for religious reasons, respondents who rated the practice as very unacceptable had a low K score of 2.99 (Table 5), compared with other acceptability ratings.

3.5. Relationships between K Score and Attitude/Consumption

In the stepwise regression, K scores were regressed against 21 predictors about attitudes to chicken meat production system, consumption of chicken and demographics (Appendix B). The final model included 13 significant predictors and had an R2 of 43%. The most important predictor was that as people said they had a greater understanding of chicken production systems, their K score increased. The second most important predictor was that high K scores were closely correlated with a self-reported low level of education, and the third most important predictor was that it was acceptable to kill chickens without stunning for religious purposes. Those with high K scores were more likely to be older, single with no children and agreeing that their knowledge is sufficient to form an opinion when purchasing chicken products. Of next importance was that they ate chicken frequently, they purchased frozen products and that they did not purchase chicken products with accredited labelling. They also regarded the welfare of meat chickens at the abattoir as good, and they were more likely to live in rural areas.

3.6. Gender Effects

3.6.1. Knowledge

For most questions females had the same level of understanding as males, however females were more likely to incorrectly identify food fed to chickens as not being of vegetable origin and more males than females thought that chickens’ diets would include grass and hay (Appendix C).

3.6.2. Attitudes

More females than males thought that the welfare of meat chickens at Australian abattoirs was bad (Table 6). Females considered it less acceptable than males that approximately 1% of chickens do not get adequately stunned at the abattoir and that some Australian abattoirs are allowed to kill chickens without them being unconscious for religious reasons. More females than males agreed with the statement “Food must be produced and processed from chickens that are treated humanely.”

3.6.3. Consumption

Females were less likely than males to regard the cost as more important than welfare in chicken production. Females were more likely than males to buy free range chicken products (143 compared to 70), whole chicken (108 compared to 79) and processed chicken products, e.g., chicken schnitzel (57 compared to 15). Females said that they ate chicken less frequently than males. Males were more interested than females in seeing information regarding the welfare of chickens at the point of sale and were more prepared to contribute to the cost of setting up animal welfare ratings on animal products, by paying extra for the product.

3.7. Place of Residence Effects

3.7.1. Knowledge

Compared to acreage dwellers, urban dwellers thought that birds in barns had greater space availability (Table 7). Participants living on acreage were more likely to be incorrect in questions about housing, gender determination and stunning, compared to urban dwellers. Rural dwellers were more likely to be correct in relation to gender determination, but incorrect in relation to housing systems, they were also more likely to believe that chickens travelled further to the abattoir, compared to urban dwellers.

3.7.2. Attitudes

Acreage dwellers more strongly agreed than urban dwellers that the welfare of chickens reared for meat production systems is inadequately protected by government standards to ensure the welfare of the birds. Urban respondents were more likely to believe that the welfare of meat chickens on the farm is bad. Acreage dwellers found the facts that 1% of birds are not adequately stunned and abattoirs slaughter birds without stunning for religious reasons more acceptable than did urban dwellers. They more strongly disagreed that chickens must be treated humanely, and agreed that their meat chicken welfare knowledge is adequate to form an opinion about purchases, compared with urban dwellers. They agreed more than urban dwellers that the cost of chicken was more important than chicken welfare.

3.7.3. Consumption/Labelling

Acreage and rural dwellers said that they were likely to eat chicken more often than urban dwellers. Rural dwellers considered product labelling less important than urban dwellers, and both acreage and rural dwellers were less interested in seeing information regarding the welfare of chickens at the point of sale or to seek to purchase chicken products with accredited labelling systems.

3.8. Marital Status Effects

3.8.1. Knowledge

Single respondents with no children thought that they had more limited understanding of chicken production systems than those who were partnered with no children, and were most likely to be correct for three questions (Table 8).

3.8.2. Attitudes

Respondents who were single with no children were more likely than partnered respondents with no children to agree that the welfare of meat chickens is adequately protected by government standards. Widowers rated meat chicken welfare on the farm and in the abattoir to be worse and during transport to be better than single respondents without children; they also were more accepting of inadequate stunning procedures than single respondents without children. Partnered respondents with children rated welfare during transport to be better as well but single respondents with children rated it worse. Partnered respondents without children rated welfare worse in the abattoir. Partnered respondents with no children found killing without stunning for religious reasons more acceptable than widowers and single respondents without children. Single respondents without children agreed more with the statement that food must be produced and processed from chickens that are treated humanely than single or partnered respondents with children.

3.8.3. Consumption

Single respondents with children agreed more than widowers that their welfare knowledge is sufficient for chicken product purchase, and they considered labelling information about chicken farming systems more important than did partnered respondents with children. They wanted information on welfare of chickens at point of sale more than any other group, and they, and widowers, were more likely than those without children to say that they would pay for the cost of setting up animal welfare ratings on products.

3.9. Religion Effects

3.9.1. Attitudes

Muslims thought that the fact that 1% of birds are not adequately stunned was more acceptable than Christians (Table 9). Jews and atheists found it less acceptable than did Christians. Muslims also found it much more acceptable to kill chickens without stunning for religious reasons than did Christians. Christians more than Muslims, Jews and atheists agreed with the statements that food must be from chickens that are treated humanely and that cost was more important than the chicken’s welfare more than Muslims, Jews and atheists. Compared to Muslims, atheists and Buddhists, Christians more strongly believed that their welfare knowledge about meat chickens was not sufficient for food purchasing, compared to Muslims, atheists and Buddhists.

3.9.2. Consumption/Labelling

Christians thought that product labels giving details of chicken rearing systems were more important when making purchases than did Muslims and atheists.

3.10. Age Effects

As age increased, respondents were willing to pay less for an animal welfare rating (Table 10); they were more likely to select products with a Heart Foundation approval and more likely to choose chicken portions or corn/whole grain-fed chickens.

3.11. Income Effects

As income increased, respondents were more likely to believe that the welfare of meat chickens on the farm (Regression Coefficient 0.16, OR 1.18, p = 0.04) and during transport (Regression Coefficient 0.16, OR 1.18, p = 0.04) was bad. They were also more likely to believe that chickens can be killed for religious reasons without stunning (Regression Coefficient 0.24, OR 1.27, p = 0.002) and to know that gender could be determined from feathers (Regression Coefficient −0.28, OR 0.75, p = 0.02) and to know the distance that chickens travelled to the abattoir (Regression Coefficient 0.35, OR 1.42, p < 0.0001). However, they were less likely to know that birds are usually stunned before slaughter (Regression Coefficient −0.32, OR 0.73, p < 0.0001).

4. Discussion

The response rate of 19% was similar to other farm animal welfare surveys [21]. Randomly approaching members of the public who were not aware of the nature of the survey helped to minimize any potential bias [28,29]. However, some selection bias is evident and in particular the higher education level of the respondents compared to the Australian population could potentially influence people’s understanding of chicken production systems. The preponderance of middle-aged respondents, compared with the Australian population, may have influenced our results on consumption (Table 9) and knowledge scores (Table 4). Most respondents indicated that they were urban dwellers, which is representative of the Australian population. Gaining contemporary knowledge about the industry was through the internet, journals, newspaper articles, television programmes and more noticeably, through friends and acquaintances. Further work on knowledge sources is warranted as the Australian public spends about $5.6 billion per year on poultry products [9].

4.1. Knowledge

K scores generally increased with self-rated knowledge of chicken welfare, adding validity that objective knowledge matched subjective knowledge assessment. The disproportionately high number of zero values in the knowledge score suggests that some respondents deliberately avoided answering all knowledge questions, but this may also have been because they genuinely did not know the answers. The majority of urban respondents (87%), compared with the Australian average of 63% [30], would be less likely than rural dwellers to be familiar with farming systems, which could contribute to low knowledge scores.
The knowledge questions demonstrated that public knowledge of chicken production systems was limited, with many participants possessing little or no knowledge of the industry and a median knowledge score of 4 out of 15, indicating that they answered four questions correctly out of 15, i.e., 27% (and mean of 3.96/15, Section 3.1). Bergman and Maller [20] studied the factors leading Australians to support or reject factory farming, especially poultry and pig productions, and concluded that Australian consumers knew little about these systems, there was significant confusion and scepticism about ‘organic’ & ‘free range’ labelling and limited trust in the RSPCA labelling systems. Napolitano et al. [18] examined the effect of information about animal welfare, expressed in terms of rearing conditions, on acceptability of lamb for consumption. Prior knowledge of rearing conditions influenced their perceived acceptability, with worse scores given to meat if they knew it had been reared artificially, rather than by their mother. According to Costell et al. [21], the hedonic acceptability of food items is related to whether our perception of food differs from the expected, which in turn may be influenced by understanding of production and processing systems involved in producing the food item.
Some responses indicated that chicken welfare problems become a banality as K score increases, for instance believing that it was acceptable to kill chickens without stunning for religious purposes. Although increasing K score was associated with increased self-reported knowledge of chicken meat production systems, it was associated with low levels of general education. The latter may indicate that high K score respondents lacked the broad education necessary to empathize with chickens in poor welfare conditions.

4.2. Attitudes

The attitude of 52% of respondents was that meat chicken welfare on the farm was neither good nor bad, or they were unsure, suggesting that there is a great deal of uncertainty about this issue. Similarly, 49 and 62% of respondents had no definite attitude regarding the welfare of meat chickens during transport or at the abattoir, respectively. By contrast, in Europe most (77%) of the public believe that improvement in animal welfare is needed, with meat chickens being one of the systems of production most in need of reform [31]. Similarly, there was little agreement about whether the existing Australian standards ensured that the welfare of reared meat chickens is adequate. Mench [32] and Sumner et al. [33] suggested that standards should not only minimise animal suffering during transport and slaughter but maintain quality of life for animals throughout their production life. Such uncertainty appeared to link to respondents’ lack of knowledge, with those that were unsure about the chickens’ welfare in abattoirs having lowest knowledge scores. Similarly those that had no strong feelings in relation to inadequate stunning, which may indicate uncertainty, also had low scores. Lowest scores in this question were given by those finding it very acceptable, giving some credence to a relationship between empathy towards the chicken and knowledge.

4.3. Consumption

With the exception of those that avoided chicken because they were vegetarian or they did not like it, K score increased considerably with the frequency of consumption, and more knowledgeable respondents were less likely to buy products with accredited labelling. The latter may be explained by those with knowledge believing accreditation to be unnecessary for their choice of chicken product. Regarding the frequency of chicken consumption, one possibility is that people consuming more chicken are interested to learn about the industry. Another is that people of higher socioeconomic status were more knowledgeable about farming systems and ate more chicken because they are more aware of its health benefits. However, the more knowledgeable respondents were less willing to pay for accredited labelling for chicken welfare, which would not be expected of high socioeconomic respondents. A third possibility is that the more knowledgeable, frequent chicken consumers were connected with the industry, however, we considered this unlikely as only 1% lived on a chicken farm, 5% had visited one in the last two years and 6% indicated that they had gained their knowledge as farm employees.
The type of chicken meat that respondents said they were most likely to buy was free range chicken products, whereas Australian free range chicken meat production accounts for only 10 to 15% of the total production [34]. This properly reflected an intention or desire, rather than actuality. Furthermore, a total of 63% of respondents sought to purchase a chicken product with accreditation, particularly if they had little knowledge about chicken production systems. This suggests that consumers are using accreditation as a means of ensuring products are of high welfare, replacing their limited knowledge, even though accredited labels exhibit no information regarding the conditions where birds were raised or processed and no reference to animal welfare [35]. Consumers have put pressure on retailers to properly label products and on producers, manufacturers and supermarkets to have an animal welfare labelling system [23] as well as the country of origin, production techniques [36] and conditions of rearing [19]. Fifty-six percent of respondents were prepared to contribute to the cost of setting up animal welfare ratings by paying extra for the products, particularly females, and the most common increase in cost that would be accepted was 2.5%. A study in Chile indicated a willingness to pay up to 15% more for meat produced to improved animal welfare standards [19]. European consumers have indicated their willingness to change their usual place of shopping to be able to purchase more animal-welfare-friendly products [37]. Consumers are also willing to pay more for natural or organic chicken [23], with the latter being perceived as safer, healthier and having fewer pesticides, hormones and antibiotics than other meat [38]. Labelling systems are based on transparency, informing consumers that the products have satisfied the welfare conditions where animals were reared, transported and processed [39].

4.4. Demographic Effects

On ethical issues, socio-demographics as explanatory variables of behaviour may be less influential than values, attitudes, motives and lifestyles. In our study we had major effects of gender and dwelling place on attitudes and consumption, whereas religion had the most influence on attitudes but little on consumption.

4.4.1. Gender

There was no evidence that females had a better understanding of the chicken production system than males. However, it is recognised elsewhere that females have greater knowledge of animal welfare concerns, with males being more traditional in their purchasing habits for animal products [40]. Females displayed greater sensitivity to chicken welfare than males, confirming much previous research [41,42]. Females were more ethical about their chicken consumption intentions, and reported being twice as likely to buy free range but only slightly more likely to buy whole chicken. They were also much more likely to buy processed products, which may reflect their role in managing the nutrition of children. They reported buying less chicken than males, confirming a Eurasian survey which found that female students reported that they ate poultry less commonly than male students [43]. Males’ showed greater interest than females in seeing information regarding the welfare of chicken at the point of sale than females and even being more prepared to pay for this conflicts with other studies [44,45] which found that females were willing to pay extra for certified food products. Females reporting less frequent consumption of chicken than did males probably reflects the fact that women show more health-related behaviours and considered attitudes towards food than men [46,47].

4.4.2. Place of Residence

Dwellers on acreage/large blocks were more knowledgeable than most other groups, but they were generally less sympathetic to chicken welfare than urban dwellers, in relation to stunning practices and treating birds humanely. The acreage or large block dwellers are more likely to keep chickens and gain their attitudes towards chicken welfare from this practice, rather than through the media, which would be the case for urban dwellers. Acreage/large block dwellers also ate more chicken than urban dwellers and were less interested in labelling about chicken welfare, even though they thought government standards were less than adequate to protect welfare. The latter suggests a better knowledge but less concern in acreage/large block dwellers, compared with urban dwellers.

4.4.3. Marital Status

Single respondents with children were most likely to want information on the welfare of chicken at point of sale, probably reflecting their limited time for shopping, and they considered this information more than some other groups. Other research has identified that single parents with children spend more of their food budget eating away from the home, compared to partnered respondents with children [48]. The study suggested that the most sympathetic consumers were single respondents without children, as they rated welfare worse on the farm and in the abattoir and agreed most that chickens must be treated humanely. They were also least accepting of inadequate stunning or avoiding stunning for religious reasons. Results for widowers should be treated with caution as they are confounded with age.

4.4.4. Religion

Muslims knew more about stunning than Christians and they were less likely to find it acceptable, reflecting their belief that animals must be alive when their throats are cut and must die from loss of blood [49]. Overall 54% of our respondents’ believed that the practice of slaughtering birds without adequate stunning was unacceptable, probably because of the welfare impact [50]. There was an apparent contradiction between Christians having greater regard for cost than an animal’s welfare but also requiring chicken to be from animals that are treated humanely, compared to Muslims, Buddhists and atheists.

4.4.5. Age, Income and Education

The reduced willingness to pay for animal welfare ratings as respondents aged may reflect reduced disposable cash for this purpose, or it may reflect changing attitudes, this not being a longitudinal study. Greater tolerance to not stunning the chicken for religious reasons was evident in higher income respondents, confirming previous findings in Chinese studies [43]. A greater willingness to recognise poor welfare on farm and during transport in high income respondents may reflect a greater ability to pay for high welfare products. Respondents with a low level of education had high K scores. This suggests that there was a cohort of poorly-educated respondents who had knowledge of the poultry industry.

5. Conclusions

Public knowledge of the Australian poultry production systems was limited. Most was indirectly gained from the media, and few respondents had direct experience with chicken farming. Our finding that knowledge related to an improved attitude towards chicken welfare is valuable, since it suggests that informing the public about chicken welfare could increase levels of concern. However, this was not associated with increased consumption of high-welfare products; in fact, high-level consumers had a natural suspicion of accreditation programmes that would make it difficult to improve animal welfare through this method. The observed positive relationship between chicken consumption and knowledge may derive from a belief in respondents who ate relatively more chicken that they should understand the systems of production of the animals that they are consuming. The connection between knowledge and attitudes suggests that educating consumers might help to improve their empathy towards meat chickens, but the lack of relationship between empathy and consumption and the suspicion of accreditation systems suggests that any increased empathy will not necessarily have an impact on the sales of high-welfare products.
More scientific studies are needed to support public demand for improving the welfare conditions of chickens, as they were at least willing to contribute a small amount (median about 5%) to establish labelling systems that take into account the welfare of birds. The study also identified those consumers who were most concerned about the welfare of chickens in this context: females, urban dwellers and relatively high-income respondents.

Acknowledgments

The authors are grateful to the volunteers who assisted in data collection.

Author Contributions

Both authors designed the survey. Ihab Erian organized the collection of data, which was analysed by Clive Phillips.

Conflicts of Interest

The authors declare no conflict of interest.

Appendix A.

Table A1. Number and % of respondents responding to eight knowledge questions (correct answer in italics).
Questions and Response OptionsNumber of Respondents% of Respondents
What type of housing is most commonly used to rear meat chickens in Australia?
Multi-tier battery cages in barns20749.3
No housing, free range on pasture is normal307.1
Single tier battery cages on the floor of barns8119.3
Loose in barns10224.3
How much space is it usual to give each bird in barns?
About 1 m216838.9
About the size of a piece of A4 paper [34]22451.9
About 5 m2255.8
About 2 m2153.5
Housing for egg production chickens is the same as for meat production chickens
True8416.7
False17935.5
Don’t know24147.8
The sex of a chicken is usually determined from the feathers on their wings
True6112.4
False13327.00
Don’t know29960.6
Chickens are usually fed food of vegetable origin
True19739.2
False10821.5
Don’t know19739.2
The usual feed for meat chickens in barns is:
Hay245.4
Pelleted cereal feed26659.9
Cut grass357.9
Household waste food153.4
All of these10423.4
What is the normal distance that chickens travel from their place of rearing to the abattoir?
Up to 5 km8520.8
5 to 100 km18745.7
100 to 200 km9222.5
200 to 500 km297.1
500 km or more163.9
Is it normal practice for meat chickens to be rendered unconscious (stunned) before slaughter?
Yes11623.9
No27957.4
Don’t know9118.7

Appendix B.

Table B1. Stepwise regression of 21 attitude, consumption and demographic predictors on √K score values for 378 respondents.
Step 1Step 2Step 3Step 4Step 5Step 6Step 7Step 8Step 9Step 10Step 11Step 12Step 13
Constant3.356.385.456.645.595.927.485.206.104.956.005.546.52
Self-rated understanding of chicken production systems1.611.741.651.601.521.501.231.201.191.271.241.231.17
t-Value8.409.188.968.808.428.616.346.256.266.686.576.556.18
p-Value0.0000.0000.0000.0000.0000.0000.0000.0000.0000.0000.0000.0000.000
Highest level of education −0.65−0.75−0.76−0.80−0.65−0.56−0.48−0.49−049−0.49−0.45−0.46
t-Value −4.43−5.20−5.40−5.74−4.68−3.99−3.43−3.47−3.57−3.58−3.21−3.30
p-Value 0.0000.0000.0000.0000.0000.0000.0010.0010.0000.0000.0010.001
Killing chickens that are conscious for religious reasons in Australian abattoirs 0.640.950.980.870.880.780.820.810.830.820.81
t-Value 5.046.436.696.066.225.385.695.695.825.805.77
p-Value 0.0000.0000.0000.0000.0000.0000.0000.0000.0000.0000.000
1% of birds do not get adequately stunned in abattoir practices −0.70−0.80−0.70−0.77−0.76−0.71−0.81−0.90−0.91−0.81
t-Value −3.91−4.46−4.01−4.42−4.41−4.13−4.72−5.11−5.21−4.42
p-Value 0.0000.0000.0000.0000.0000.0000.0000.0000.0000.000
Age 0.440.870.900.920.900.920.900.880.91
t-Value 3.465.816.076.246.136.336.236.086.26
p-Value 0.0000.0000.0000.0000.0000.0000.0000.0000.000
Marital status −0.80−0.83−0.83−0.87−0.89−0.94−0.97−0.98
t-Value −5.00−5.22−5.32−5.59−5.77−6.04−6.22−6.32
p-Value 0.0000.0000.0000.0000.0000.0000.0000.000
Self-rated knowledge of chicken welfare is enough to form opinion about buying chicken products −0.54−0.62−0.61−0.59−0.54−0.52−0.50
t-Value −3.17−3.62−3.59−3.52−3.21−3.09−2.96
p-Value 0.0020.0000.0000.0000.0010.0020.003
Number of times per week you eat chicken 0.640.600.630.650.630.62
t-Value 2.882.702.882.982.902.83
p-Value 0.0040.0070.0040.0030.0040.005
Type of chicken meat consumers buy −0.45−0.56−0.52−.55−0.59
t-Value −2.66−3.27−3.05−3.23−3.45
p-Value 0.0080.0010.0020.0010.001
Would you purchase a product with accredited labelling? 1.041.011.000.89
t-Value 3.133.043.022.64
p-Value 0.0020.0030.0030.009
Chicken welfare at the abattoir −0.22−0.22−0.22
t-Value −2.22−2.13−2.14
p-Value 0.0270.0340.033
Place of residence 0.430.48
t-Value 1.811.98
p-Value 0.0710.048
Australian meat chickens not protected by government welfare standards −0.32
t-Value −1.92
p-Value 0.056
S3.363.283.183.123.072.982.942.912.892.862.842.832.82
R-Sq15.8119.9925.0828.0330.2734.6736.4037.8038.9740.5641.3441.8742.45

Appendix C.

Significant differences (p < 0.05) in knowledge according to demographics that are not presented in the paper. Mean values are shown for the referent group and the comparative group, as well as Odds Ratio and p value for the differences.
Table C1. Significant differences between males and females.
MalesFemalesCoefficientOdds Ratiop Value
Space for each bird in barn, (1, 0.25 m2–4, 5 m2)1.611.88−0.710.490.006
Chickens are usually fed food of vegetable origin (1 T, 2 DK, 3 F)1.822.04−0.800.450.001
The usual feed for meat chickens in barns, those answering:
Cut grass0.520.25−1.890.150.001
Hay0.520.10−2.540.080.001
Pelleted Cereal food3.82.0−0.780.460.02
T = true, DK = Do Not Know, F = False.
Table C2. Significant differences according to marital status, between Single, no children (referent group, 1) and the comparative groups, single with children (group 2), married/de facto, no children (group 3), married/de facto with children (group 4) and widowed (group 5).
Single, no Children (Referent)Comparative GroupCoefficientOdds Ratiop Value
Knowledge
Space for each barn bird (1, 0.25 m2–4, 5 m2)1:1.794:1.570.722.000.049
Feather sexing of chicken (1 T, 2 DK, 3 F)1:2.032:2.45−1.950.140.001
Chicken food is of vegetable origin (1 T, 2 DK, 3 F)1:1.862:1.15
5:2.1
3.55
−2.69
34.82
0.02
0.001
0.003
Chicken travelling distance to abattoir 1 < 5 km–5500 km +1:2.622:2.16
3:1.94
4:2.20
1.59
1.02
4.87
2.77
0.004
0.03
Stunned meat chicken (1 yes, 2 DK, 3 no)1:2.275:2.701.10
−2.33
3.01
0.10
0.002
0.012
Table C3. Significant differences according to religion, between the Referent group: Christian, Group 1, compared with comparative groups, Jewish (Group 2), Hindu (Group 3), Buddhist (Group 4), Muslim (Group 5), Atheist (Group 6) and others (Group 7).
Christian (Referent)Comparative GroupCoefficientOdds Ratiop Value
Knowledge
Understanding chicken production systems1:1.136:1.00−0.720.490.037
Space for each barn bird (1, 0.25 m2–4, 5 m2)1:1.695:1.471.170.030.03
Housing the same for egg & meat production1:2.182:1.47
5:1.82
1.86
1.13
6.44
3.08
0.02
0.02
Chicken travelling distance to abattoir1:0.725:0.541.220.300.01
Meat chickens stunned1:0.215:0.501.193.30.01

References

  1. Popa, A.; Draghici, M.; Popa, M. Consumer choice and food policy: A literature review. J. Environ. Prot. Ecol. 2011, 12, 708–717. [Google Scholar]
  2. Fraser, D. Could animal production become a profession? Livest. Sci. 2014, 169, 155–162. [Google Scholar] [CrossRef]
  3. Gracia, A. The determinants of the intention to purchase animal welfare-friendly meat products in Spain. Anim. Welf. 2013, 22, 255–265. [Google Scholar] [CrossRef]
  4. Te Velde, H.; Aarts, N.; Van Woerkum, C. Dealing with ambivalence: Farmers’ and consumers’ perceptions of animal welfare in livestock breeding. J. Agric. Environ. Ethics 2002, 15, 203–219. [Google Scholar] [CrossRef]
  5. Korte, S.M.; Oliver, B.; Koolhaas, J.M. A new animal welfare concept based on allostasis. Physiol. Behav. 2007, 92, 422–428. [Google Scholar] [CrossRef] [PubMed]
  6. Sayer, K. Animal machines: The public response to intensification in Great Britain, c 1960—c 1973. Agric. Hist. 2013, 87, 473–501. [Google Scholar] [CrossRef]
  7. Daigle, C.L. Incorporating the philosophy of technology into animal welfare assessment. J. Agric. Environ. Ethics 2014, 27, 633–647. [Google Scholar] [CrossRef]
  8. Verrinder, J.; Phillips, C.J.C. Author’s Response: Response to Letter to the Editor, “The VetDIT and Veterinary Ethics Education”. J. Vet. Med. Educ. 2015, 42, 174–175. [Google Scholar] [CrossRef] [PubMed]
  9. Australian Chicken Meat Federation (ACMF) Inc. Industry Facts and Figures 2013. Available online: http://www.chicken.org.au/page.php?id=4 (accessed on 8 March 2016).
  10. Köbrich, K.; Maino, M.; Diaz, C. El bienestar animal como atributo de diferenciación en la compra de alimentos de origen animal. Econ. Agraria 2001, 6, 251–260. [Google Scholar]
  11. Maria, G.A. Public perception of farm animal welfare in Spain. Livest. Sci. 2006, 103, 250–256. [Google Scholar] [CrossRef]
  12. Bonamigo, A.; Bonamigo, C.B.S.S.; Molento, C.F.M. Broiler meat characteristics relevant to the consumer: Focus on animal welfare. Revista Brasileira Zootecnia-Braz. J. Anim. Sci. 2012, 41, 1044–1050. [Google Scholar] [CrossRef]
  13. Akaichi, F.; Revoredo-Giha, C. Consumers demand for products with animal welfare attributes—Evidence from homescan data for Scotland. Br. Food J. 2016, 118, 1682–1711. [Google Scholar] [CrossRef]
  14. Schröder, M.J.A.; McEachern, M.G. Consumer value conflicts surrounding ethical food purchase decisions: A focus on animal welfare. Int. J. Consum. Stud. 2004, 28, 168–177. [Google Scholar] [CrossRef]
  15. Kvaløy, O.; Tvetera, R. Cost structure and vertical integration between farming and processing. J. Agric. Econ. 2008, 59, 296–311. [Google Scholar] [CrossRef]
  16. Australian Chicken Meat Federation (ACMF) Inc. An Industry in Profile: ACMF 2011. Available online: http://www.chicken.org.au/industryprofile/downloads/The_Australian_Chicken_Meat_Industry_An_Industry_in_Profile.pdf (accessed on 7 March 2016).
  17. Robins, A.; Phillips, C.J.C. International approaches to the welfare of meat chickens. World Poultry Sci. J. 2011, 67, 351–369. [Google Scholar] [CrossRef]
  18. Napolitano, F.; Caporale, G.; Carlucci, A.; Monteleone, E. Effect of information about animal welfare and product nutritional properties on acceptability of meat from Podolian cattle. Food. Qual. Preference 2007, 18, 305–312. [Google Scholar] [CrossRef]
  19. Schnettler, B.M.; Vidal, R.M.; Silva, R.F.; Vallejos, L.C.; Sepúlveda, N.B. Consumer perception of animal welfare and livestock production in the Araucania region, Chile. Chile J. Agric. Res. 2008, 68, 80–90. [Google Scholar] [CrossRef]
  20. Bergmann, I.; Maller, C.J. What factors lead Australians to support or actively reject factory farming? In Presentation at the International Inaugural Minding Animals Conference, Newcastle University, Newcastle Civic Precinct, Newcastle, NSW, Australia, 13–18 July 2009.
  21. Costell, E.; Tárrega, A.; Bayarri, S. Food acceptance: The role of consumer perception and attitudes. Chemosens. Percept. 2009, 3, 42–50. [Google Scholar] [CrossRef]
  22. Prickett, R.W.; Norwood, F.B.; Lusk, J.L. Consumer preferences for farm animal welfare: Results from a telephone survey of US households. Anim. Welf. 2010, 19, 335–347. [Google Scholar]
  23. Sismanoglou, A.; Tzimitra-Kalogianni, I. Consumer perception of poultry meat in Greece. World. Poultry Sci. J. 2011, 67, 269–276. [Google Scholar] [CrossRef]
  24. Gifford, K.; Bernard, J.C. The effect of information on consumers’ willingness to pay for natural and organic chicken. Int. J. Consum. Stud. 2011, 35, 282–289. [Google Scholar] [CrossRef]
  25. Last, J.M. A Dictionary of Public Health; Oxford University Press: Oxford, UK, 2007. [Google Scholar]
  26. Zoethout, C.M. Ritual slaughter and the freedom of religion: Some reflections on a stunning matter. Hum. Rights Q. 2013, 35, 651–672. [Google Scholar] [CrossRef]
  27. Australian Bureau of Statistics 2011 Census QuickStats. Available online: http://www.censusdata.abs.gov.au/census_services/getproduct/census/2011/quickstat/SOS30?opendocument&navpos=220 (accessed on 8 March 2016).
  28. Manfreda, K.L.; Bosnjak, M.; Berzelak, J.; Haas, I.; Vehovar, V. Web Surveys versus Other Survey Modes: A Meta-Analysis Comparing Response Rates. Int. J. Market. Res. 2008, 50, 79–104. [Google Scholar]
  29. Fan, W.; Yan, Z. Factors affecting response rates of the web survey: A systematic review. Comput. Hum. Behav. 2010, 26, 132–139. [Google Scholar] [CrossRef]
  30. National Church Life Survey, 2016 Urban and Rural Dwellers. Available online: http://www.ncls.org.au/default.aspx?sitemapid=2294 (accessed on 6 March 2016).
  31. Martelli, G. Consumers’ perception of farm animal welfare: An Italian and European perspective. Ital. J. Anim. Sci. 2009, 8, 31–41. [Google Scholar] [CrossRef]
  32. Mench, J.A. Farm animal welfare in the U.S.A: Farming practice, research, education, regulation, and assurance programs. Appl. Anim. Behav. Sci. 2008, 13, 298–312. [Google Scholar] [CrossRef]
  33. Sumner, D.A.; Matthews, W.A.; Mench, J.A.; Rosen-Molina, T. The economics of regulations on hen housing in California. J. Agric. Appl. Econ. 2010, 42, 429–438. [Google Scholar] [CrossRef]
  34. Australian Chicken Meat Federation (ACMF) Inc. Media Release. 6 March 2015. Available online: http://www.chicken.org.au/files/ACMF%20Media%20Release%20-%20Chicken%20Meat%20Outlook%20-%206%20March%202015.pdf (accessed on 8 March 2016).
  35. Caswell, J.A.; Mojduszka, E.M. Using informational labelling to influence the market for quality in food products. Am. J. Agric. Econ. 1996, 78, 1248–1253. [Google Scholar] [CrossRef]
  36. Marian, L.; Thøgersen, J. Direct and mediated impacts of product and process characteristics on consumers’ choice of organic vs. conventional chicken. Food Qual. Preference 2013, 29, 106–112. [Google Scholar] [CrossRef]
  37. Velarde, A.; Dalmau, A. Animal welfare assessment at slaughter in Europe: Moving from inputs to outputs. Meat Sci. 2012, 92, 244–251. [Google Scholar] [CrossRef] [PubMed]
  38. Van Loo, E.; Caputo, V.; Nayga, M.; Rodolfo, J.; Meullenet, J.F.; Crandall, P.G.; Ricke, S.C. Effect of organic poultry purchase frequency on consumer attitudes towards organic poultry meat. J. Food Sci. 2010, 75, 384–397. [Google Scholar] [CrossRef] [PubMed]
  39. Tonser, G.T.; Olynk, N.; Wolf, C. Consumer preferences for animal welfare attributes: The case of gestation crates. J. Agric. Resour. Econ. 2009, 41, 713–730. [Google Scholar] [CrossRef]
  40. Beardworth, A.; Brynan, A.; Leil, T.; Goode, J.; Haslam, C.; Haslam, E. Women, men and food: The significant of gender for nutritional attitudes and choices. Brit. Food J. 2002, 104, 470–491. [Google Scholar] [CrossRef]
  41. Vanhonacker, F.; Verbeke, W.; Van Poucke, E.; Tuyttens, A.M. Do citizens and farmers interpret the concept of farm animal welfare differently? Livest. Sci. 2008, 116, 126–136. [Google Scholar] [CrossRef]
  42. Kendall, H.; Lobao, L.; Sharp, J. Public concern with animal well-being: Place, social structural location and individual experience. Rural Soc. 2006, 7, 399–428. [Google Scholar] [CrossRef]
  43. Phillips, C.J.C.; Izmirli, S.; Aldavood, S.J.; Alonso, M.; Choe, B.I.; Hanlon, A.; Handziska, A.; Illmann, G.; Keeling, L.; Kennedy, M.; et al. Students’ attitudes to animal welfare and rights in Europe and Asia. Anim. Welf. 2012, 21, 87–100. [Google Scholar] [CrossRef]
  44. Henson, S. Consumer willingness to pay for reductions in the risk of food poisoning in the UK. J. Agric. Econ. 1996, 47, 403–420. [Google Scholar] [CrossRef]
  45. Tsakiridou, E.; Tsakiridou, H.; Mattas, K.; Arvaniti, E. Effects of animal welfare standards on consumers’ food choices. Food Econ. Acta Agric. Scand. Sect. C 2010, 7, 234–244. [Google Scholar] [CrossRef]
  46. Harvey, J.; Erdos, G.; Challinor, S.; Drew, S.; Taylor, S.; Ash, R.; Ward, S.; Gibson, G.; Scarr, C.; Dixon, F.; et al. The relationship between attitudes, demographic factors and perceived consumption of meats and other proteins in relation to the BSE crisis: A regional study in the United Kingdom. Health Risk Soc. 2001, 3, 181–197. [Google Scholar] [CrossRef]
  47. Yen, S.T.; Huang, C.L. Cross-sectional estimation of US demand for beef products: A censored system approach. J. Agric. Resour. Econ. 2002, 27, 320–334. [Google Scholar]
  48. Ziol-Guest, K.M.; Deleire, T.; Kalil, A. The allocation of food expenditure in married and single-parent families. J. Consum. Aff. 2006, 40, 347–371. [Google Scholar] [CrossRef]
  49. Ozari, R. Rituelles Schlachten bei Juden (Schechita), Muslimen (Dhabḥ) und Sikhs (Jhatkā). Ph.D. Dissertation, Ludwig-Maximilians-Universität, München, Germany, 1984. [Google Scholar]
  50. Gregory, N.G.; von Wenzlawowicz, M.; Von Hollenben, K.; Fielding, H.R.; Gibson, T.J.; Mirabito, L.; Kolesar, L. Complications during Shechita and halal slaughter without stunning in cattle. Anim. Welf. 2012, 21, 81–86. [Google Scholar] [CrossRef]
Figure 1. Distribution of K scores (out of 15) approximated a normal distribution curve with a higher than expected number of zero values (n = 28). The mean value was 1.99 (K score 3.96/15), Standard Deviation 1.24, and Median Value 2.00 (K score 4/15).
Animals 07 00020 g001
Figure 2. Biplot of Principal Component Analysis of attitude questions, showing the first two components. The first component appears to relate to purchasing issues and the second to pragmatic issues of providing for animal welfare. AW = animal welfare.
Animals 07 00020 g002
Table 1. Demographics of respondents compared with data from Queensland, Australia (n = 506).
Number of Respondents% of Survey SampleQueensland Data, % *
GenderMale20541.749.6
Female28658.250.4
Age18–19367.427.0 **
20–296613.613.7
30–3911122.913.7
40–4913527.814.2
50–599820.212.7
60 & over398.018.7
EducationNo formal schooling000
Primary102.0629.7
Secondary7415.220.2
Technical College6112.56.2
University18437.913.5
Higher University Degree14129.030.4
Other163.3
DwellingUrban42186.6
Acreage265.3
Rural–town275.6
Rural–farm91.8
Other30.62
Annual IncomeLess than $20,0009522.3Mean $78,000
$20,000–$39,0004711.0
$40,000–$59,0007517.6
$60,000–$80,0008119.0
>$80,00012830
Marital StatusSingle, no children10020.939.2
Single, with children204.27.8
Married/De Facto439.06.0
no children
Married/De Facto30563.742.0
with children
Widowed112.35.0
ReligionChristian23446.164.8
Jewish122.40.1
Hindu10.20.7
Buddhist71.41.5
Muslim224.30.8
Atheist5310.522.1
Other367.110.0 ***
No response14127.9
* [26,27]; ** [26] lists only 15–19 years of age; *** Includes other religions and/or not stated.
Table 2. Number and % of respondents with answers to knowledge questions that were not significantly (p < 0.05) related to respondents’ knowledge (K score).
Questions and Response OptionsNumber of Respondents% of Respondents
Knowledge of chicken production systems
Self-rated understanding of chicken production system
Expert71.4
Good knowledge387.5
Some knowledge13426.5
Little knowledge19137.7
No knowledge13626.9
Source of knowledge
Formal qualifications—relevant degree, training course153.7
Farm employment—hands-on experience, relevant training course235.7
Personal interest, e.g., internet, journals, newspaper articles, television programmes22355.1
Friends and acquaintances13633.6
All of the above82.0
Visits to a chicken production farm?
Yes, in the last two years254.9
Yes, more than two years ago or on a school trip15330.2
I live on a chicken production farm40.8
Never32464.1
Table 3. Number and % of respondents in each category for attitudinal and consumption questions, for questions that were not significantly (p < 0.05) related to respondents’ knowledge (K score).
Questions and Response OptionsNumber of Respondents% of Respondents
Attitudes regarding chicken rearing systems
Australian meat chickens are not protected by government welfare standards
Strongly agree326.5
Agree8416.9
Neither agree nor disagree23347.0
Disagree13727.6
Strongly disagree102.0
Welfare of Australian meat chickens on the farm
Very good234.6
Good10520.8
Neither good nor bad12023.8
Bad9919.6
Very bad173.4
Unsure14127.9
Welfare of Australian meat chickens during transport
Very good153.0
Good10821.3
Neither good nor bad10120.0
Bad8917.6
Very bad448.7
Unsure14929.5
Killing chickens that are conscious for religious reasons in Australian abattoirs
Very unacceptable17336.1
Unacceptable10622.1
No strong feelings8918.5
Acceptable but with some reservations8016.7
Perfectly acceptable326.7
Food must be produced and processed from chickens that are treated humanely
Strongly agree25051.4
Agree15531.9
Neither agree nor disagree6413.2
Disagree153.1
Strongly disagree20.41
Cost of chicken meat is more important to me than the chicken’s welfare
Strongly agree326.6
Agree10120.7
Neither agree nor disagree11423.4
Disagree16634.1
Strongly disagree7415.2
Consumption of chicken products
What brands of chicken meat are you most likely to buy?
Free range21342.1
Corn or whole grain fed469.1
Cheapest/home brand/on special9518.8
Products from a known producer7114.0
Products with heart foundation tick418.10
Whole chicken18737.0
Chicken portions17735.0
Processed chicken products7214.2
What type of chicken products do you usually buy?
Whole chicken27554.4
Chicken pieces34367.8
Flavoured chicken meals7214.2
Processed chicken meat8416.6
Importance of rearing system on the product label when purchasing chicken products
Very important14429.3
Quite important16433.3
Neither important nor unimportant9719.7
Not very important6413.01
Not important at all234.7
Need for chicken welfare information wherever they are sold?
Yes30863.1
No8216.8
Not interested9820.1
Amount you would be willing to pay to set up animal welfare ratings on animal products
50 c/product if cost is ≤ $2011845.5
$1.00/product if cost is ≤ $204216.2
$2.00/product if cost is ≤ $20197.3
Whatever it costs to include3714.3
Should be done but I shouldn’t pay4316.6
Table 4. Number and % of respondents in each category for attitudinal and consumption questions, for those questions with significant relationship to knowledge (K) score, together with the K score for responders to each option and probability of these being different (Standard Error of the Difference between any two √K score means = 0.042).
Questions and Response OptionsNumber of Respondents% of Respondents√K ScoreK Score/15
Attitudes
Welfare of Australian meat chickens at the abattoir
Very good81.62.34 a5.47
Good8717.21.92 ab3.69
Neither good nor bad14127.91.87 b3.50
Bad6212.32.13 ab4.54
Very bad346.72.35 a5.52
Unsure17434.41.57 c2.46
p value 0.001
1% of birds do not get adequately stunned in abattoir practices
Very unacceptable9219.32.99 a6.15
Unacceptable16434.52.20 a4.84
No strong feelings13027.31.74 b3.03
Acceptable with reservation7014.72.21 a4.88
Very acceptable204.21.52 b2.31
p value 0.001
Killing chickens that are conscious for religious reasons in Australian abattoirs
Very unacceptable17336.01.73 b2.99
Unacceptable10622.12.14 a4.58
No strong feelings8918.52.22 a4.93
Acceptable with reservation8016.71.93 ab3.72
Very acceptable326.72.13 ab4.53
p value 0.007
Self-rated knowledge of chicken welfare is enough to form opinion about buying chicken products
Strongly agree357.32.14 ab4.58
Agree13828.62.39 a5.71
Disagree9118.92.04 b4.16
Strongly disagree377.71.73 b2.99
p value 0.001
Consumption/labelling
Number of times per week you eat chicken
Never/I’m vegetarian71.52.32 bc5.38
Never/Don’t like chicken214.41.79 bcd3.2
<1/Week13328.00.66 d0.43
Once/Week29963.01.74 c3.03
2 or 3/Week112.32.14 b4.58
Daily40.83.53 a12.46
p value 0.001
Type of chicken meat consumers buy
Fresh28860.81.93 ab3.72
Frozen378.82.26 a5.11
Mix of Both14931.41.90 b3.61
p value 0.05
Labelling—would you purchase a product with accredited labelling?
Yes30763.21.913.65
No17936.82.154.62
p value 0.002
Means with different superscripts differ significantly (p < 0.05) by the Tukey’s test. √K Score= square root of the K score.
Table 5. Number and % of respondents to questions with significant relationship to knowledge (K) score, together with the K score for responders to each option (Standard Error of the Difference between two means = 0.042) and probability of these being different.
Questions and Response Options√K ScoreK Score/15
Demographics
Age
≤191.39 c1.93
20–291.97 ab3.88
30–391.99 b3.96
40–492.30 a5.29
50–592.35 a5.52
≥602.18 ab4.75
p value<0.001
Highest level of education
Primary1.45 abc2.10
High school2.20 b4.84
Technical college certificate/diploma2.73 a7.45
College/university degree2.17 b5.88
Higher university degree2.31 b5.34
Other1.32 c1.74
p value0.001
Place of residence
Urban—city/town2.06 b2.24
Acreage/large block2.61 a6.81
Rural—country town1.88 b3.5
Rural—farming property2.06 ab4.24
Other1.45 b2.10
p value0.002
Marital status
Single, no children2.30 a5.29
Single, children1.82 ab3.31
Partnered/de facto, no children2.13 ab4.53
Partnered/de facto, children1.83 b3.35
Widowed2.08 ab4.32
p value0.001
Means with different superscripts differ significantly (p < 0.05) by the Tukey’s test.
Table 6. Significant differences in attitudes and consumer behaviour between the gender groups. Mean values are shown for the referent group for gender, male respondents, and the comparative group, female respondents, as well as Odds Ratio and p value for the difference.
Questions and Response OptionsMalesFemalesCoefficientOdds Ratiop Value
Attitudes
Chicken welfare at the abattoir, 1 vg–5 vb2.803.17−0.790.450.001
1% of birds do not get adequately stunned in abattoir practices, 1 vu–5 va2.662.380.571.770.007
Abattoirs slaughter birds without stunning, 1 vu–5 va2.492.260.912.490.001
Chicken must be treated humanely, 1 sa–5 sd1.781.630.631.870.007
Cost of chicken is more important than chicken’s welfare, 1 sa–5 sd3.093.46−0.740.480.001
Consumption/labelling
What chicken products do you buy?
Free Range (no. respondents)701430.902.460.001
Processed (no. respondents)1557−1.110.330.003
Whole (no. respondents)79108−0.530.590.004
Chicken consumption (1 never, 6 daily).3.673.620.6992.010.006
Need information on chicken welfare (1 yes, 2 dk, 3 no).1.601.490.531.690.04
Willing to pay more for animal welfare (1 yes, 2 no).1.491.41−0.430.650.04
vg = very good, vb = very bad, vu = very unacceptable, va = very acceptable, sa = strongly agree, sd = strongly disagree, dk = don’t know.
Table 7. The difference in attitudes towards meat chicken welfare according to dwelling place: urban (city/town) (referent group, 1), acreage/large block (AC) (group 2), rural (country town) (group 3), rural (farming property) (group 4) and other dwellers (group 5).
Questions and Response OptionsBase Line GroupComparative GroupCoefficientOdds Ratiop Value
Knowledge
Space for each bird in barn, (1, 0.25 m2–4, 5 m2)1: 1.612: 1.342.088.000.003
Housing the same for egg and meat production, 1 T, 2 DK, 3 F1: 2.142: 2.64−2.060.130.000
3: 2.32−2.520.080.003
Feather sexing of chicken, 1 T, 2 DK, 3 F1: 2.172: 2.41−0.940.390.47
3: 1.692.249.430.001
Chicken travelling distance to abattoir1: 2.233: 2.39−1.460.230.02
Normal practice for meat chickens to be stunned before slaughter? (1 yes, 2 Dk, 3 No)1: 1.922: 3.19−2.370.090.001
Attitudes
Chicken welfare not adequately protected by government standards, 1 sa–5 sda1: 2.962: 3.38−0.890.410.038
Chicken welfare on farm, 1 vg–5 vb1: 2.992: 2.691.484.340.001
Unstunned birds at abattoir, 1 vu–5 spa1: 2.442: 3.19−1.510.220.001
Abattoirs slaughter birds without stunning, 1 vu, 5 pa1: 2.342: 2.92−1.110.330.007
Chicken must be treated humanely, 1 sa, 5 sd–211: 1.692: 1.90−1.550.210.001
My chicken welfare knowledge is adequate, 1 sa, 5 sd1: 2.922: 3.27−1.350.260.001
Cost of chicken is more important than chicken’s welfare, 1 sa, 5 sd1: 3.332: 2.631.735.650.001
Consumption
Chicken consumption, 1 never, 6 daily1: 3.612: 3.93−1.060.350.049
3: 4.00−1.870.150.017
The importance of labelling chicken kept, 1 VI, 5 NI1: 2.264: 3.55−2.220.110.001
Need information on chicken welfare, 1 yes, 2 Dk, 3 no1: 1.492: 2.21−1.910.150.00
4: 1.88−1.640.190.013
Buy chicken with accredited labelling, 1 yes, 2 no1: 1.364: 1.661.675.280.025
Vg = very good, vb = very bad, vu = very unacceptable, va = very acceptable, sa = strongly agree, sd = strongly disagree, T = true (1), 2 = unsure/do not know (DK), F = False (3); VI = very important; NI = not important (5).
Table 8. Significant differences in attitudes of respondents towards meat chicken welfare and consumption of respondents according to marital status. Means are shown for single, no children (referent group, 1) and the comparative groups, single with children (group 2), married/de facto, no children (group 3), married/de facto with children (group 4) and widowed (group 5), as well as coefficients of the regression, odds ratios and p values.
Questions and Response OptionsSingle, no Children (Referent)Comparative GroupCoefficientOdds Ratiop Value
Knowledge
Understanding chicken production system (1 little K to 4 expert)1: 0.983: 1.60−1.390.250.001
Attitude
Chicken welfare not protected by government standards, 1 sa–5 sda1: 2.893: 2.231.173.220.009
Chicken welfare on farm, 1 vg–5 vb1: 2.955: 2.564.2268.260.001
Chicken Welfare during transport 1 vg–5 vb1: 4.362: 4.98−1.320.270.009
4: 3.550.712.030.023
5: 3.732.128.330.009
Abattoir welfare rating, 1 vg–5 vb1: 4.583: 4.21−1.170.310.01
5: 2.824.2670.890.001
Unstunned birds at abattoir, 1 vun–5 va1: 2.315:3.37−2.170.110.008
Abattoirs slaughter birds without stunning, 1 vun–5 va1: 2.413: 2.88−1.140.320.008
5: 1.502.027.550.03
Chickens must treated humanely, 1 sa–5 sd1: 1.482: 2.15−2.050.130.001
4: 1.72−1.120.330.003
Consumption
My chicken welfare knowledge sufficient 1 sa–5 sd1: 3.015: 2.002.198.900.009
Chicken consumption rate, 1 never, 6 daily1: 3.705: 3.273.6538.550.000
The importance of chicken rearing system on 1 vi–5 ni1: 2.064: 2.470.750.470.02
Information on chicken welfare 1 yes, 3 no1: 1.272: 2.00−3.490.030.001
3: 1.48−1.530.220.009
4: 1.63−1.640.190.001
5: 2.00−3.720.020.001
Willing to pay how much more for animal welfare rating, 1 no money–5 whatever it takes1: 2.332: 3.67−2.760.060.02
3: 3.32−1.690.180.07
4: 2.350.151.160.56
5: 5.00−22.30.000.00
Vg = very good, vb = very bad, vun = very unacceptable, va = very acceptable, sa = strongly agree, sd = strongly disagree, T = true (1), Unsure/Do Not Know (2), F = False (3); K = knowledge, vi = very important; ni = not important (5).
Table 9. Differences between religion groups (Christian, Group 1), compared with other groups, Jewish (Group 2), Hindu (Group 3), Buddhist (Group 4), Muslim (Group 5), Atheist (Group 6) and others (Group 7).
Questions and Response OptionsChristian GroupComparative GroupsCoefficientOdds Ratiop Value
Attitude
Chicken welfare on farm, 1 vg–5 vb1:5.225:3.545:−1.340.260.003
6:3.716:−0.836:0.436:0.019
Unstunned birds at abattoir, 1 vu–5 pa1:2.882:2.582.087.960.011
5:3.08−1.0090.360.020
6:2.780.952.590.005
Chicken welfare not protected by government standards, 1 sa–5 sd1:2.896:3.001.032.790.021
Chicken welfare during transport, 1 vg–5 vb, 6 us1:3.636:4.11−3.710.490.03
Abattoir welfare rating, 1 vg–5 vb, 6 us1:3.915:4.14−1.280.280.006
6:4.04−1.000.370.007
Abattoirs slaughter birds without stunning, 1 vu–5 pa1:2.885:3.78−1.800.160.001
Chicken must be treated humanely, 1 sa–5 sd1:1.432:1.042.3910.940.036
5:0.892.4111.120.002
6:0.981.795.970.001
My chicken welfare knowledge is sufficient for food choice, 1 sa–5 sd, 6 us1:2.454:2.45−2.270.100.045
5:2.091.524.620.001
6:2.181.424.160.001
Cost of chicken is more important than chicken’s welfare, 1 sa–5 sd, 6 us1:4.142:4.92−2.930.050.000
5:4.771.120.330.013
6:4.58−0.790.450.022
Consumption/labelling
The importance of labelling chicken kept, 1 vi–5 ni, 6 us1:1.975:1.292.6013.490.001
6:1.661.103.000.002
Ni, not important, vg = very good, vb = very bad, vi = very important, vu = very unacceptable, va = very acceptable, sa = strongly agree, sd = strongly disagree, us = unsure
Table 10. Significant effects of age on responses.
CoefficientOdds Ratiop Value
Willing to pay more for animal welfare rating, 1 yes, 2 no−0.390.680.0001
Which kind of chicken products are you most likely to buy: products with heart foundation tick−0.380.690.03
chicken portions−0.350.710.003
Corn- or whole grain-fed−0.360.700.0001

