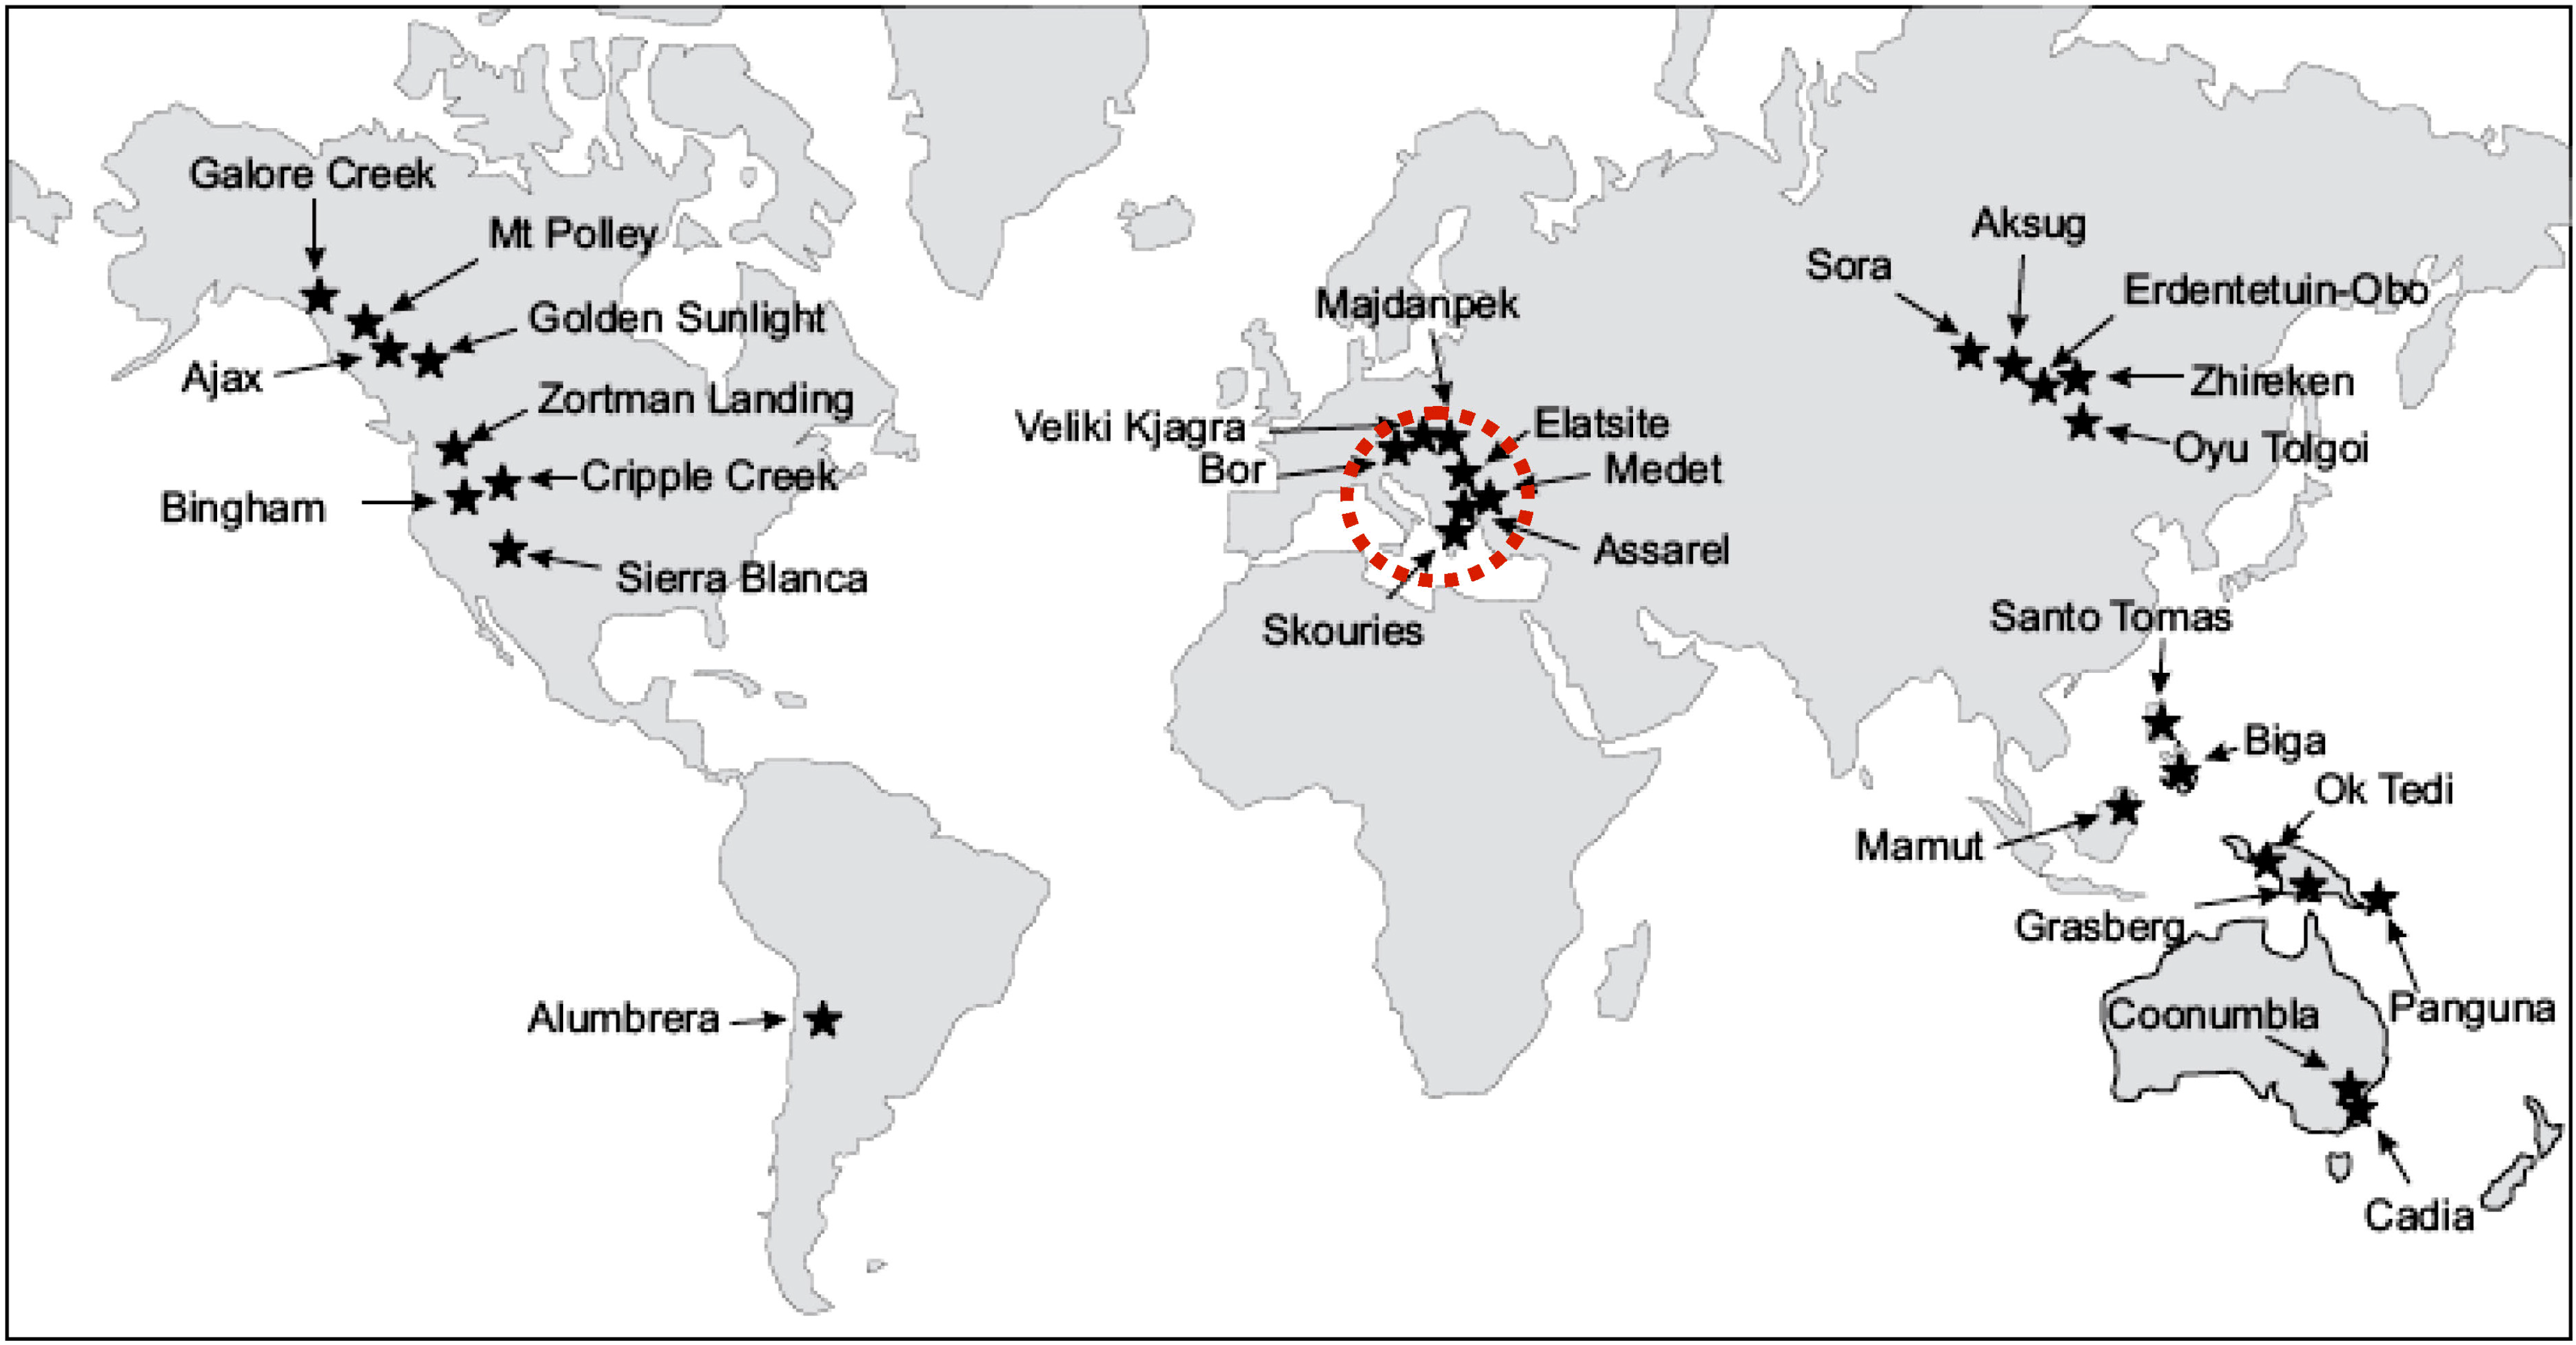
Critical Factors Controlling Pd and Pt Potential in Porphyry Cu–Au Deposits: Evidence from the Balkan Peninsula


Abstract
:1. Introduction

2. Analytical Methods
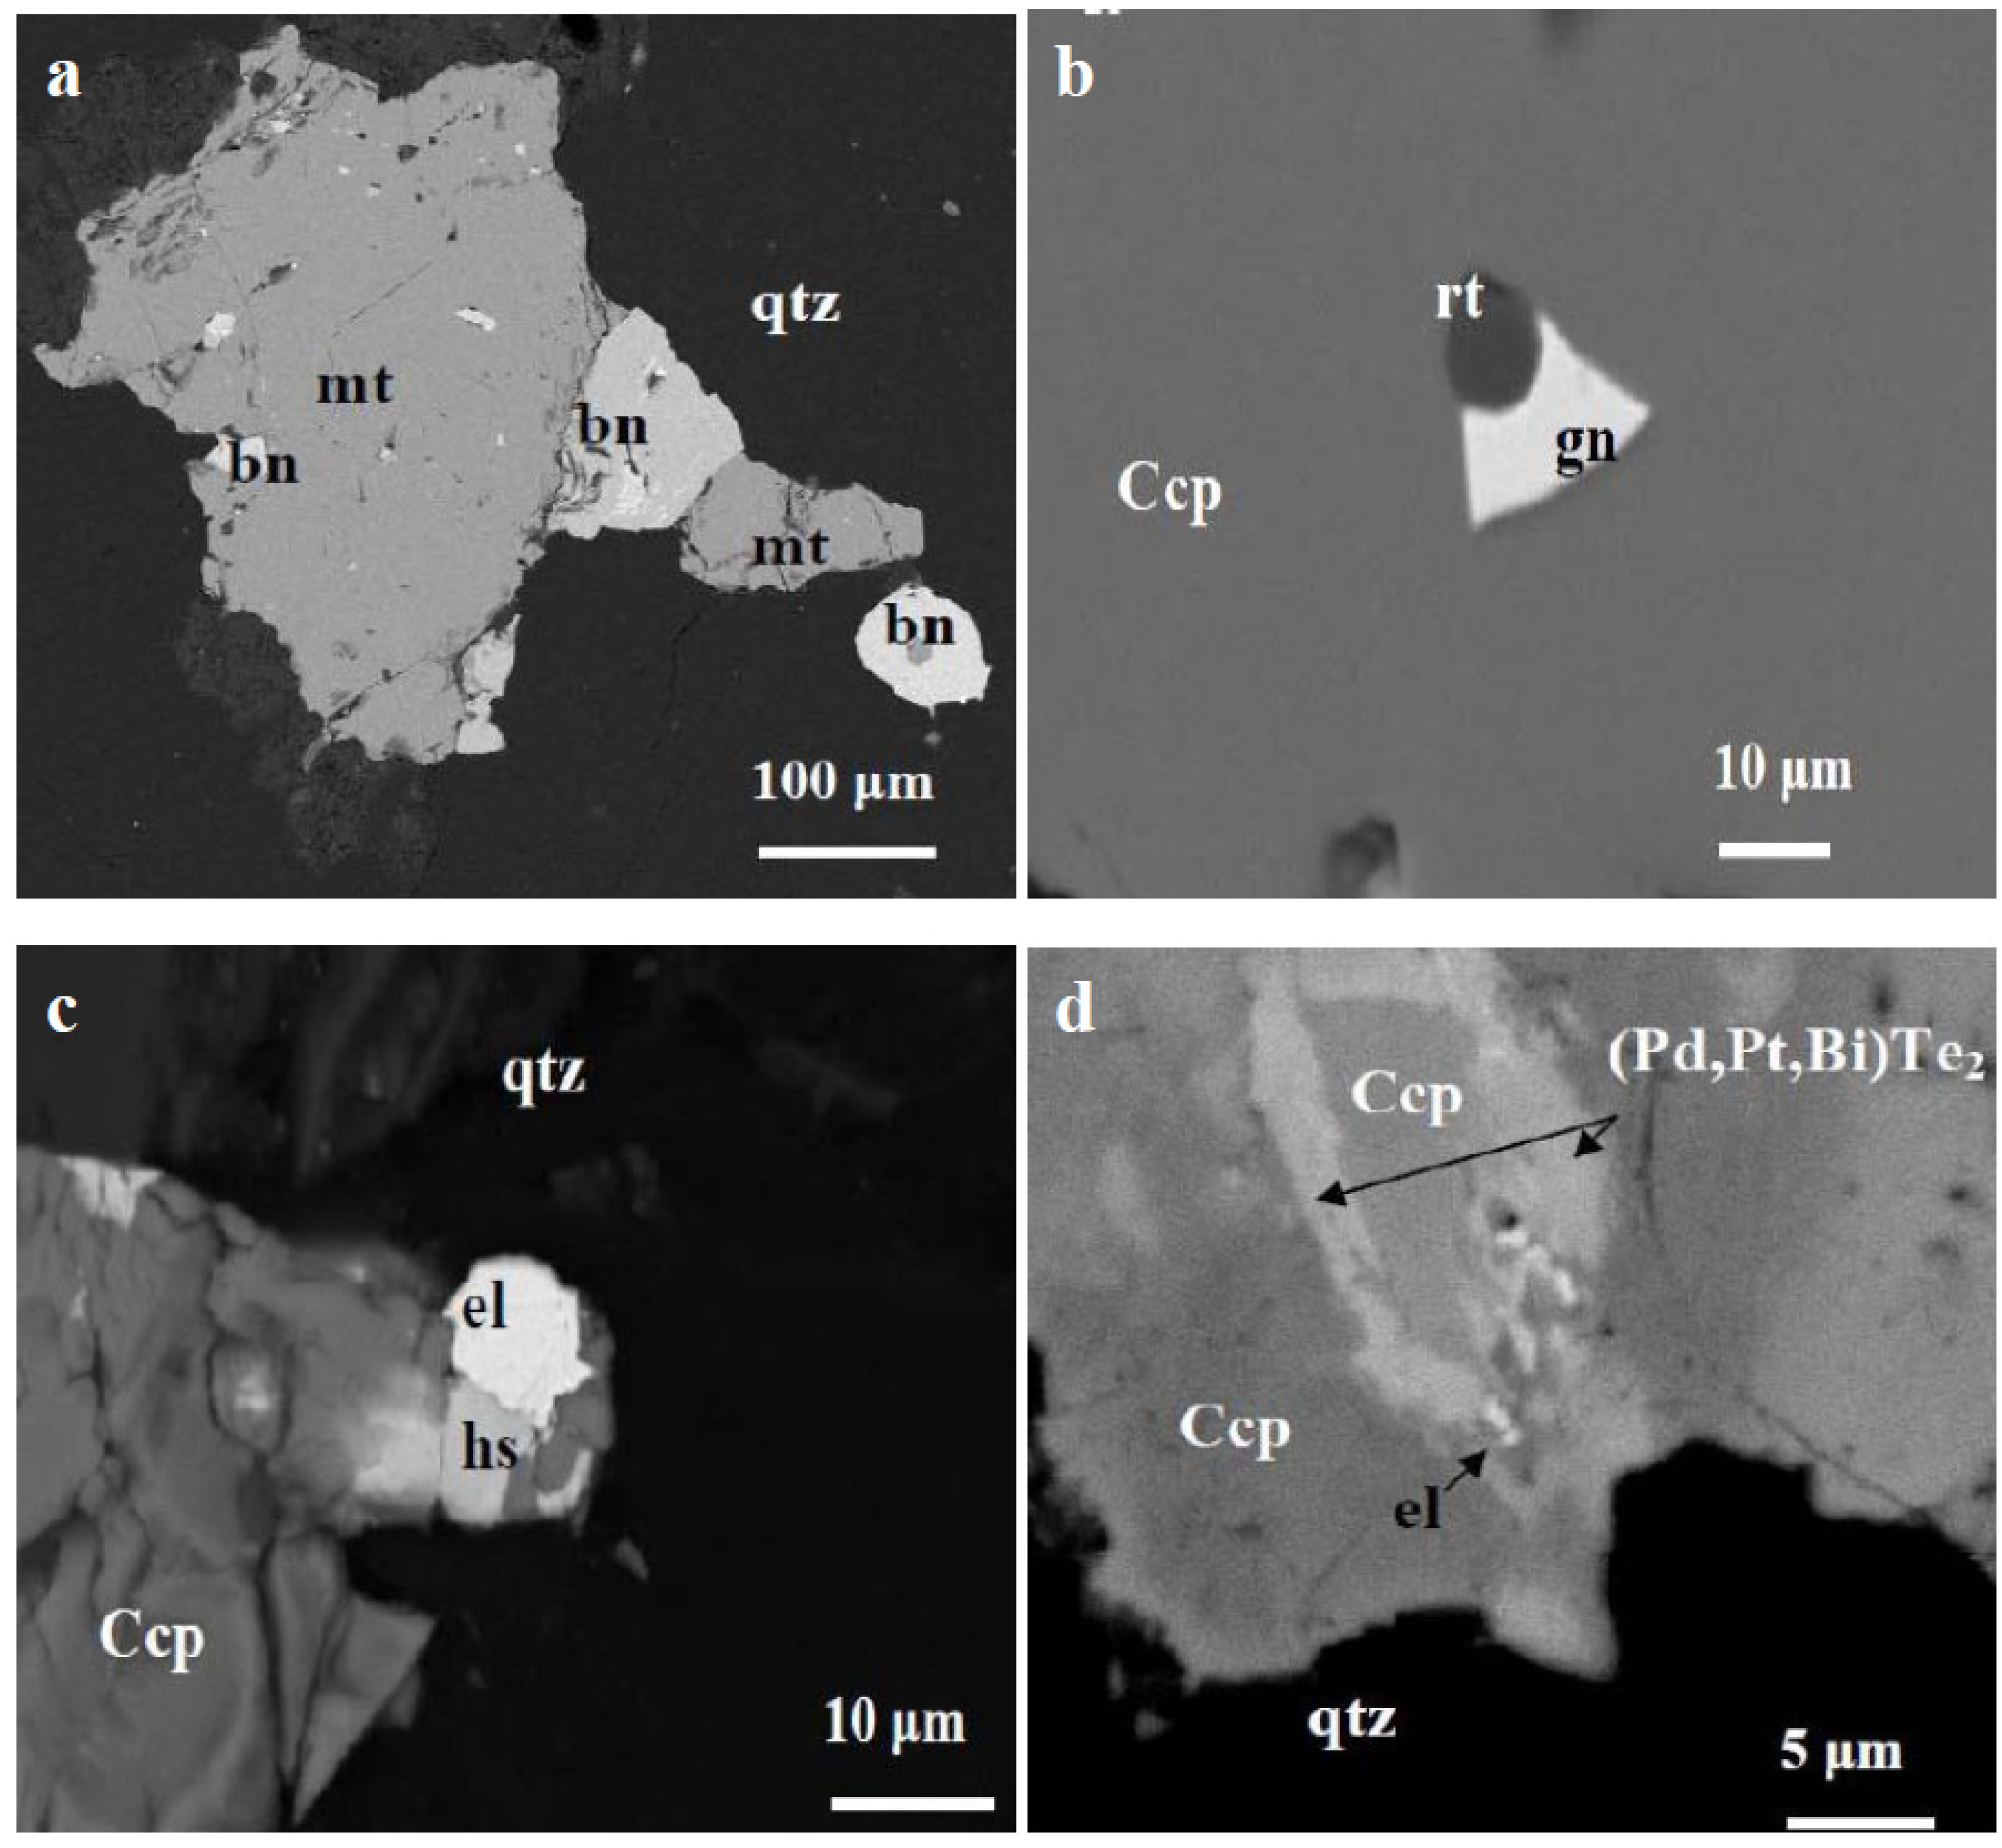
3. Characteristic Features and Results
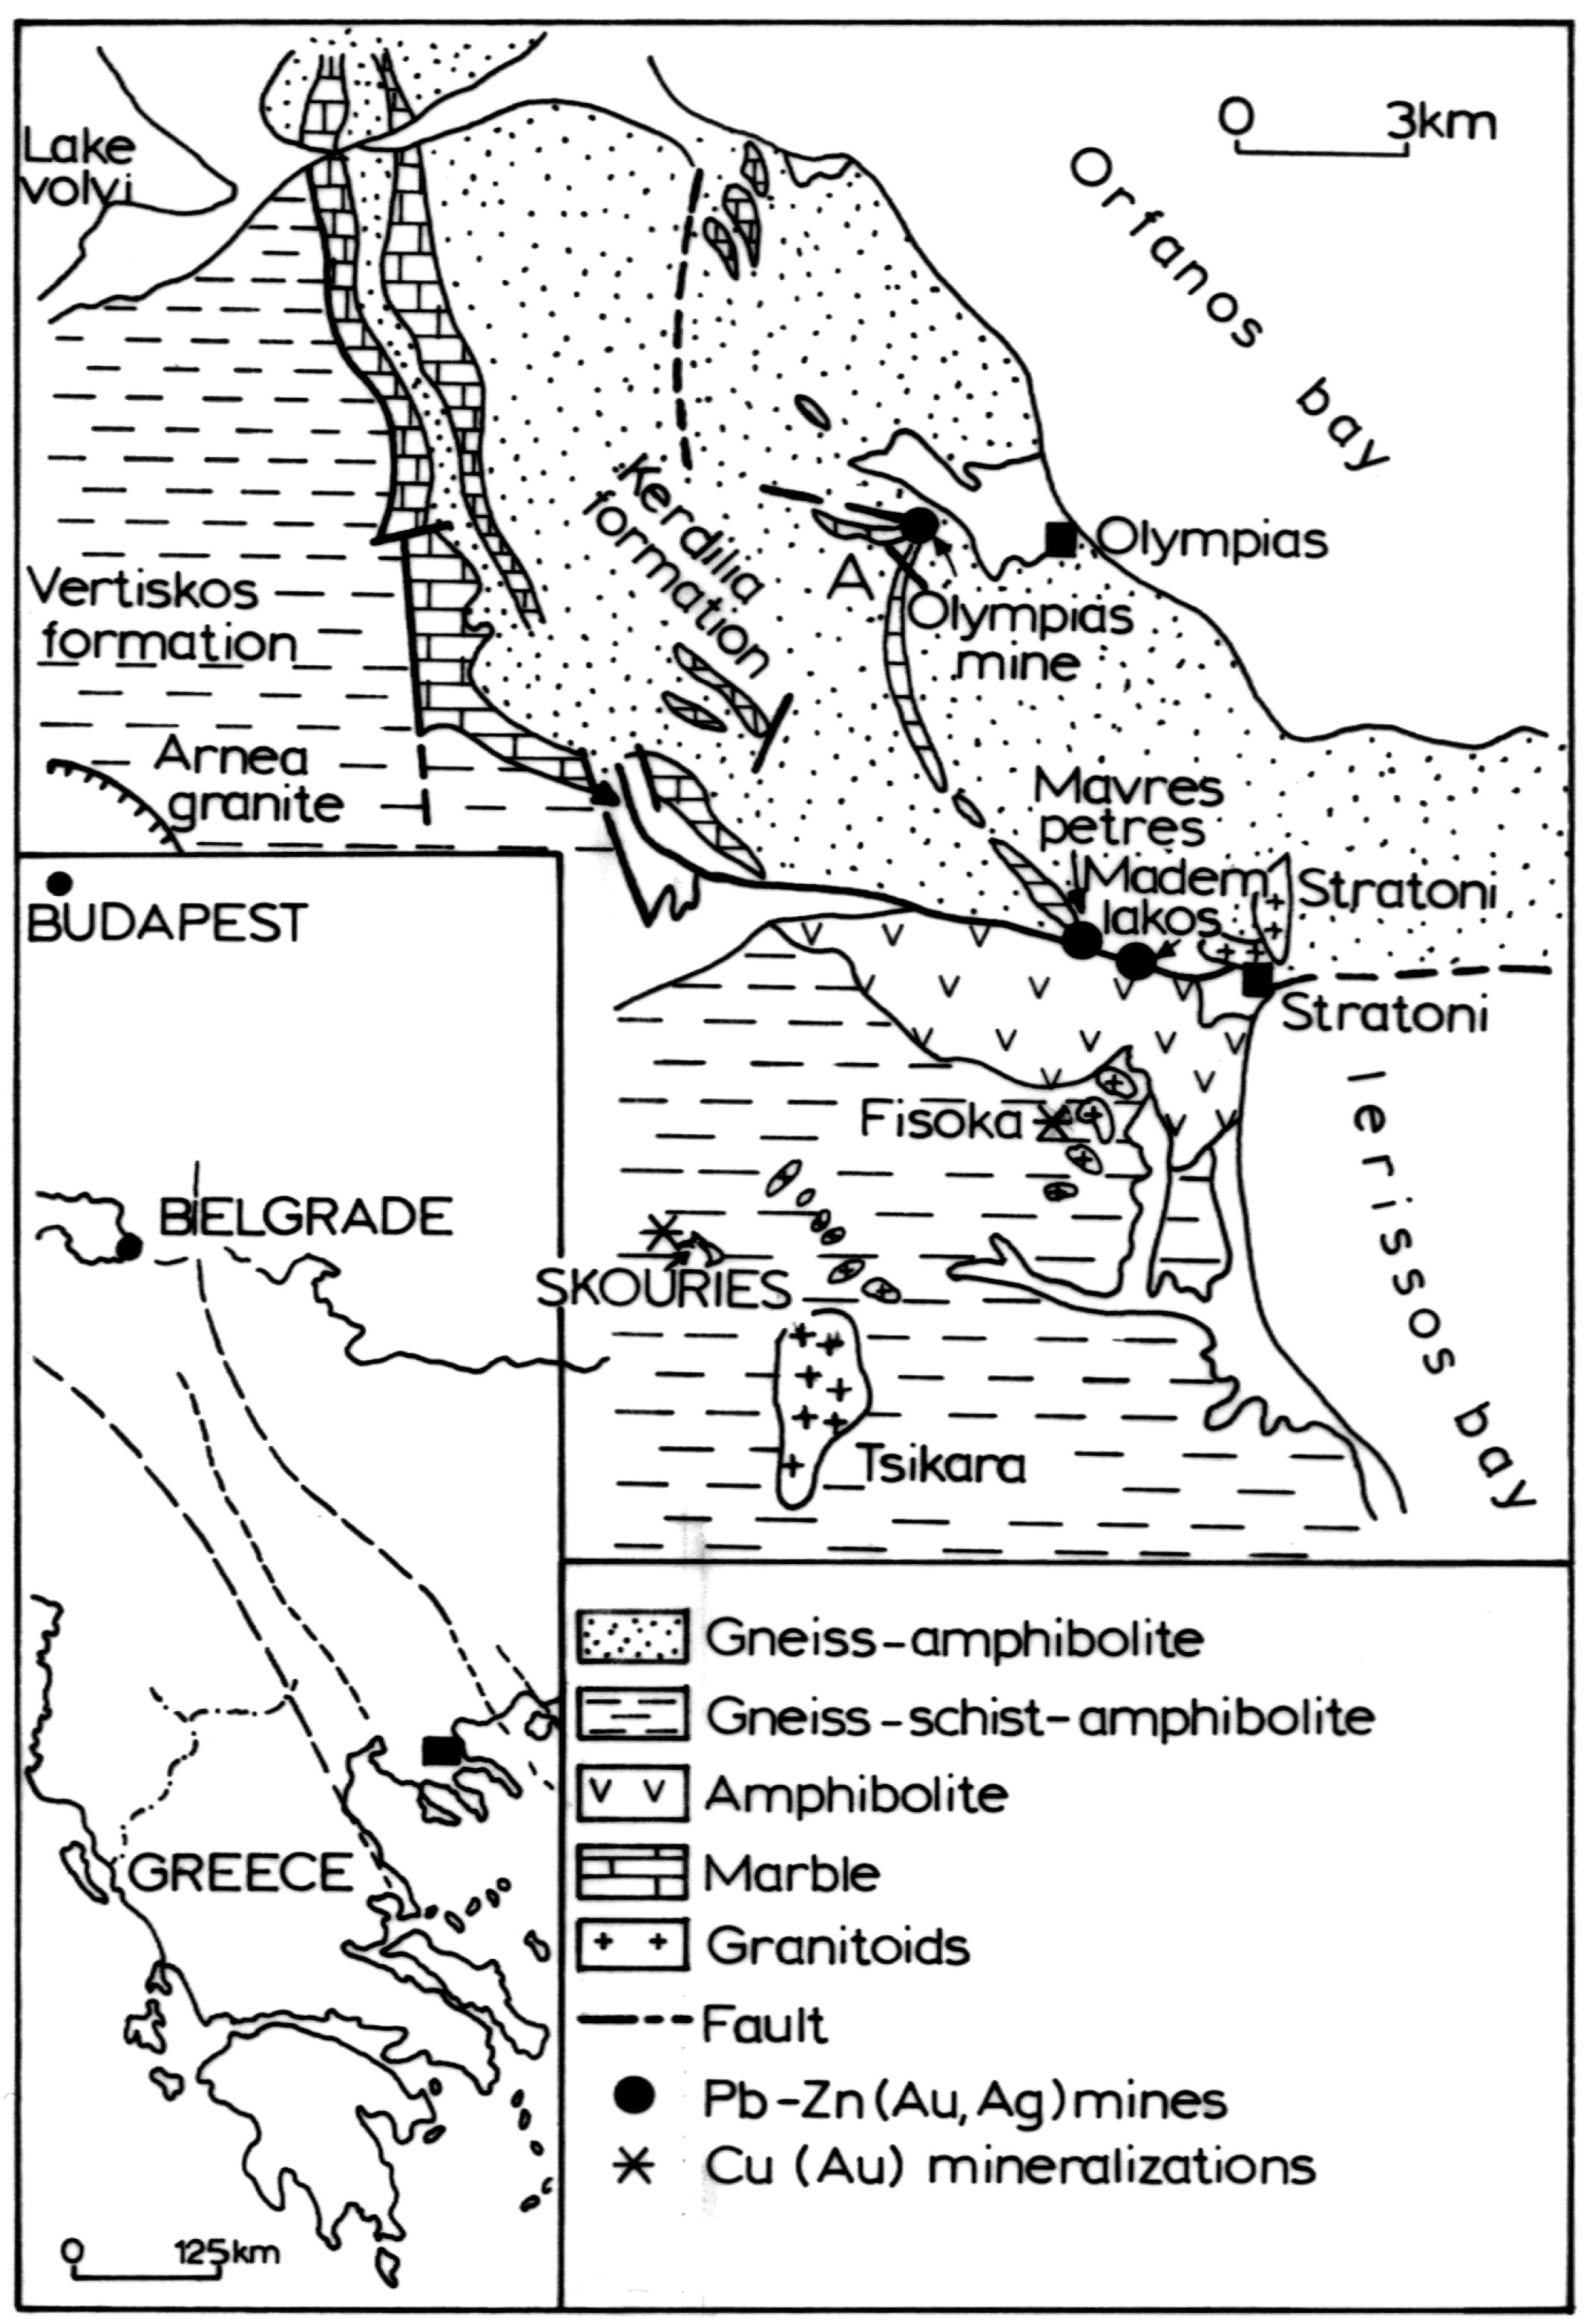
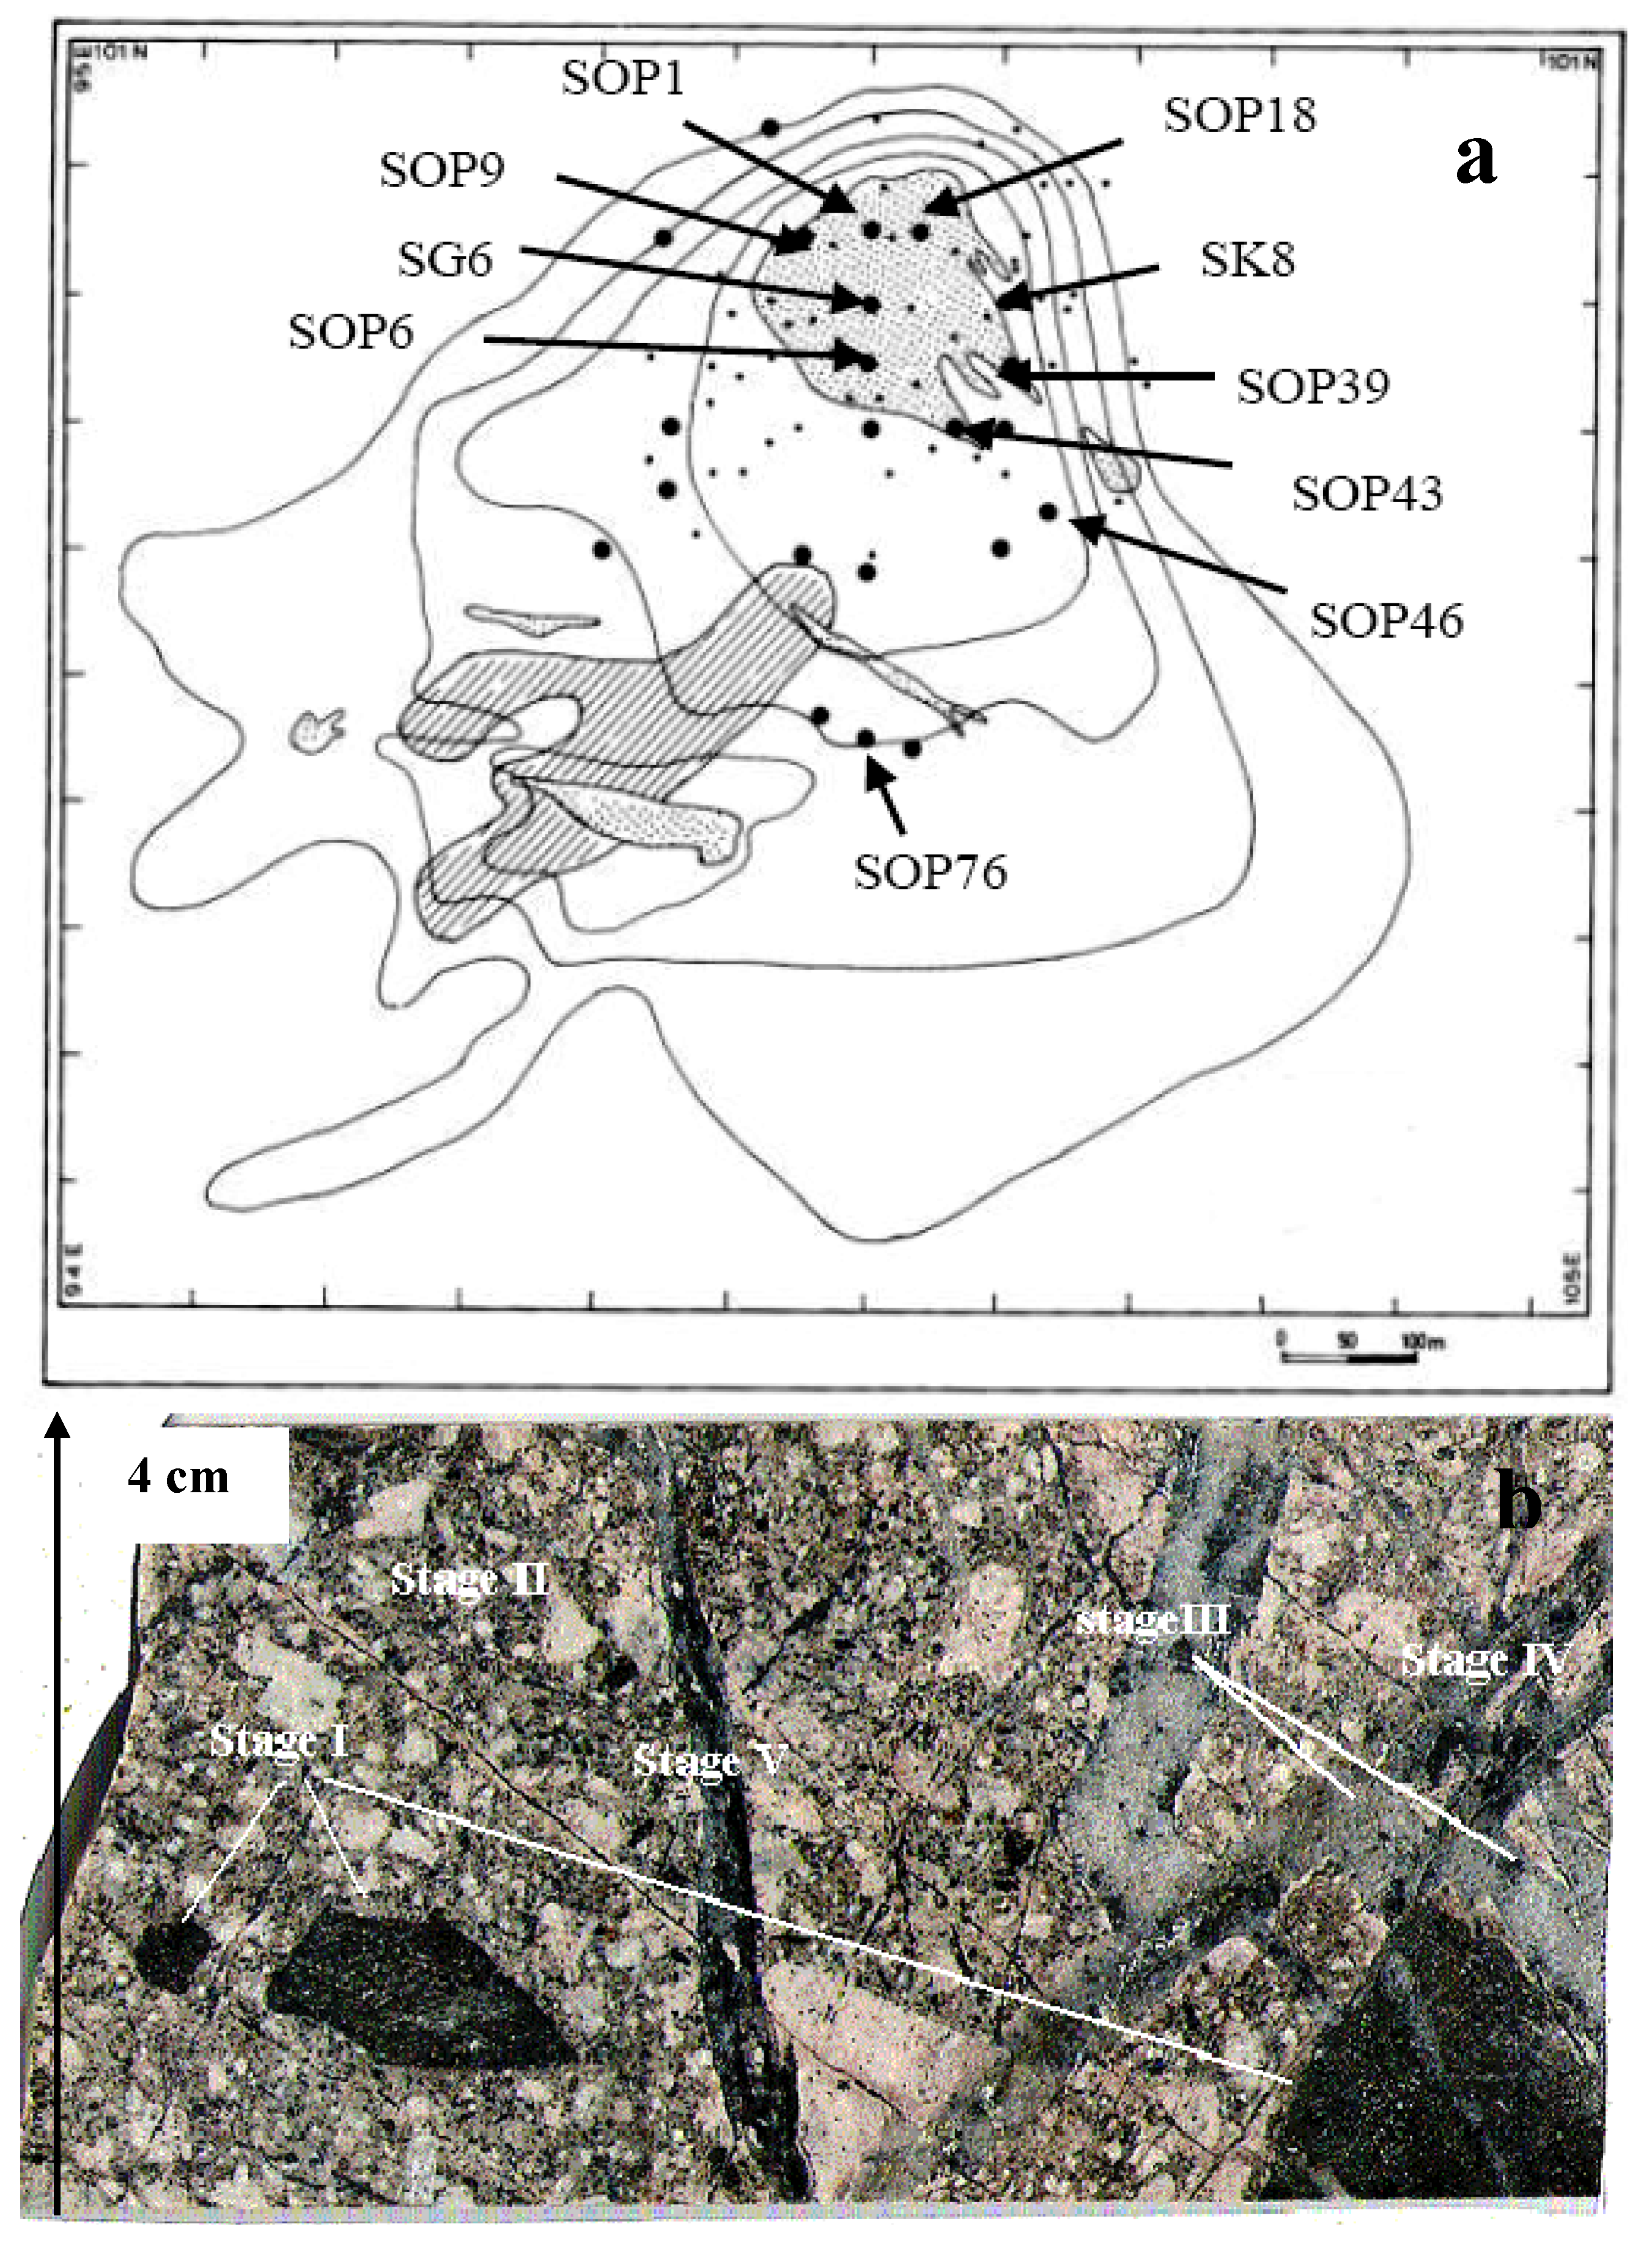
3.1. Skouries Deposit (Greece)


| Sample | Depth | Pd | Pt | Pd/Pt | Au | Ag | Cu | Zn | Pb | Cr | Ni | Co | Mo |
|---|---|---|---|---|---|---|---|---|---|---|---|---|---|
| m | ppb | ppb | ppb | ppm | wt % | ppm | ppm | ppm | ppm | ppm | ppm | ||
| Sk.PoF.C. | -- | 2,400 | 40 | 60 | 22,000 | 110 | 21 | 17,000 | 110 | 20 | 90 | 76 | 20 |
| *Sk.po. | -- | 76 | <10 | >7.6 | 910 | 3 | 0.5 | 150 | 25 | 30 | 38 | 25 | 2 |
| sku400 | surface | 30 | <10 | >3.0 | 2,210 | 4.1 | 1.3 | 50 | 30 | 30 | 40 | 20 | 2 |
| sku99 | 60 | 290 | 40 | 7.2 | 5,280 | 1.4 | 2.08 | 45 | 42 | 10 | 25 | 30 | 1 |
| sku8 | 280 | 400 | 81 | 4.9 | 7,550 | 3.9 | 1.58 | 30 | 20 | 9 | 28 | 41 | 2 |
| sku100 | 275 | 340 | 46 | 7.5 | 4,630 | 2.9 | 1.13 | 28 | 32 | 12 | 23 | 34 | 1 |
| SOP 01 | 219 | 27 | 28 | 0.96 | 1,170 | 2.3 | 1.29 | 80 | 64 | 160 | 140 | 24 | 2 |
| SOP 01 | 326 | 54 | 43 | 0.8 | 4,790 | 2.6 | 1.99 | 100 | 80 | 130 | 300 | 30 | 2 |
| SOP 01 | 328 | 53 | 42 | 0.8 | 4,930 | 7 | 1.47 | 97 | 40 | 110 | 250 | 25 | 1 |
| SOP 01 | 635 | 5 | <10 | >0.5 | 190 | <0.2 | 0.06 | 38 | 21 | 50 | 42 | 26 | 2 |
| SOP 01 | 636 | 3 | <10 | >0.3 | 50 | <0.2 | 0.06 | 32 | 15 | 60 | 71 | 21 | 8 |
| SOP 06 | 363 | 85 | 20 | 4.2 | 683 | 3.6 | 0.51 | 39 | 52 | 3 | 8 | 31 | 1 |
| SOP 06 | 365 | 49 | 49 | 1 | 3,880 | >10 | 1.27 | 80 | 60 | 10 | 210 | 24 | 2 |
| SOP 06 | 525 | 29 | 22 | 0.76 | 549 | 1.3 | 0.68 | 110 | 34 | 260 | 310 | 62 | 1 |
| SOP 06 | 527 | 6 | <10 | >0.6 | 120 | <0.2 | 0.14 | 77 | 32 | 80 | 224 | 38 | 4 |
| SOP 09 | 252 | 31 | 33 | 1.06 | 1,410 | <0.2 | 1.1 | 73 | 30 | 8 | 50 | 35 | 3 |
| SOP 18 | 142 | 42 | 64 | 1.52 | 3,850 | 2.4 | 1.52 | 75 | 84 | 4 | 50 | 22 | 2 |
| SOP 18 | 178 | 16 | 26 | 1.62 | 532 | 0.7 | 0.8 | 67 | 110 | 6 | 30 | 30 | 11 |
| SOP39 | 446 | 610 | 73 | 8.3 | 9,600 | 11.9 | 2.53 | 60 | 29 | 10 | 8 | 74 | 3 |
| SOP 43 | 200 | 15 | <10 | >1.5 | 1,520 | 11.77 | 1.56 | 130 | 13 | 484 | 560 | 56 | 1 |
| SOP 46 | 50 | 1 | <10 | >0.1 | 70 | <0.2 | 0.14 | 94 | 50 | 125 | 127 | 29 | 240 |
| SOP 76 | 170 | 2 | <10 | >0.2 | 590 | 0.6 | 0.71 | 180 | 12 | 690 | 504 | 41 | 100 |
| SG-6 | 30 | 360 | 31 | 11.6 | 3,050 | 3.3 | 3.1 | 50 | 23 | 17 | 13 | 27 | 7 |
| SG-6 | 110 | 28 | 10 | 2.8 | 850 | 0.5 | 0.39 | 66 | 71 | 6 | 17 | 62 | 2 |
| SG-6 | 465 | 410 | 26 | 15.8 | 5,280 | 3.2 | 1.89 | 46 | 31 | 7 | 7 | 41 | 1 |
| SG-6 | 494 | 420 | 150 | 2.8 | 12,900 | 3.4 | 2.84 | 60 | 21 | 17 | 10 | 43 | <1 |
| SK8 | 671 | 140 | <10 | >14 | 1,580 | 1.3 | 1.16 | 63 | 19 | 61 | 48 | 38 | 25 |

| Samples | Depth | Cr | (Pd+Pt) | Pd/Pt | Mineral (measured) | Water (calculated) | |
|---|---|---|---|---|---|---|---|
| m | ppm | ppb | δ18O(V-SMOW) (‰) | δD(V-SMOW) (‰) | δ18O(V-SMOW) (‰) | ||
| A-group | |||||||
| SOP06 | 525 | 260 | 51 | 0.76 | 9.7 | −73 | 4.33–6.53 |
| SOP43 | 200 | 480 | 24 | 1.6 | 9.6 | −110 | 4.33–6.43 |
| SOP01 | 326 | 130 | 55 | 0.96 | 9.7 | −96 | 4.43–6.53 |
| Average | 290 | 43 | 1.1 | 9.7 | −93 | 5.43 | |
| B-group | |||||||
| SOP09 | 479 | 8 | 64 | 1.1 | 12.6 | −74 | 7.33–9.45 |
| SOP18 | 178 | 4 | 42 | 1.6 | 11.3 | −99 | 6.03–8.13 |
| SG-6 | 465 | 7 | 436 | 16 | 9.6 | −100 | 4.33–6.43 |
| SOP06 | 367 | 10 | 98 | 1 | 9.6 | −89 | 4.33–6.43 |
| SOP39 | 446 | 10 | 679 | 8.3 | 10.9 | −99 | 5.63–7.73 |
| SKU99 | 60 | 10 | 328 | 7.2 | 11.5 | −101 | 6.23–8.33 |
| Average | 8.2 | 274 | 5.9 | 10.9 | −94 | 6.7 | |

3.2. Fissoka Group
4. Bulgaria

Elatsite
| Deposit | Samples | Description | Pd | Pt | Pd/Pt | Au | Cr | Cu |
|---|---|---|---|---|---|---|---|---|
| ppb | ppb | ppb | ppm | wt % | ||||
| Elatsite | PC-E | mt–bo–cp | 4,500 | 900 | 5 | 1,100 | 3 | 45.3 |
| Elatsite | PC-31 | mt–bo–cp | 5,000 | 1,050 | 4.8 | 970 | 4 | 44.8 |
| Elacite | PC-5 | Ccp–py | 4 | 20 | 0.2 | 100 | 10 | 12.8 |
| Elacite | PC-6 | Ccp–py | 10 | 8 | 1.2 | 39 | 25 | 0.06 |
| Elacite [18] | n = 6 | Ccp–py | 14 | 4.4 | 3.2 | 440 | n.a. | 0.64 |
| Elacite [18] | n = 21 | Ccp–py | 130 | 26 | 5 | 4,630 | n.a. | 12.2 |
| Elacite [18] | n = 8 | mt–bo–Ccp | 540 | 160 | 3.4 | 19,300 | n.a. | 20.3 |
| Elacite [19] | n = 10 | mt–bo–Ccp | 26 | 14 | 1.9 | 670 | 430 | 0.8 |
| Elacite [19] | EL-15 | mt–bo–Ccp | 3,440 | 320 | 11 | 1,820 | <1 | 37 |
| Elacite [19] | EL-26 | mt–bo–Ccp | 2,070 | 64 | 32 | 34,100 | <1 | 37 |
| Elacite [19] | EL-17 | mt–bo–Ccp | 980 | 350 | 2.8 | 7,800 | <1 | 33.2 |
| Elacite [19] | EL-18 | mt–bo–Ccp | 290 | 7 | 41 | 33,000 | <1 | 49 |
| Assarel | PC-2 | Ccp–py | 5 | 1.9 | 0.3 | 250 | 14 | 0.98 |
| Assarel | PC-A1 | Ccp–py | 3 | 9 | 0.33 | 19,500 | 110 | 1.2 |
| Assarel | PC-A2 | Ccp–py | 5 | 19 | 0.26 | 250 | 21 | 0.13 |
| Assarel | PC-A3 | Ccp–py | 10 | 33 | 0.3 | 140 | 35 | 3.2 |
| Medet | PC-4 | Ccp–py | 50 | 26 | 1.9 | 340 | 31 | 0.08 |
| Medet | Mo-M | Ccp–py | 33 | 47 | 0.7 | 35 | 6 | 0.17 |
| Medet | PC-M2 | Ccp–py | 2 | 8 | 0.25 | 360 | 130 | 0.45 |
| Medet | PC-M3 | Ccp–py | 50 | 26 | 1.8 | 340 | 31 | 2.15 |
| Medet | PC-M4 | Ccp–py | 30 | 9 | 3.3 | 160 | 14 | 0.3 |
| Tsar-Asen | PC-13 | cp–Cu | 49 | 51 | 0.96 | 95 | 100 | 0.93 |
| Pechorovo | PC-17 | Ccp–py | 2 | 9 | 0.22 | 26 | 89 | 0.19 |
| Pechorovo | PC-10 | Ccp–py | 2 | 8 | 0.25 | 20 | 11 | 0.18 |

5. Discussion
5.1. Precious/Base Metal Endowment in Parent Magma

5.2. Physico/Chemical Conditions
5.3. Fractionation in the Mineralized System
6. Conclusions
- Critical requirements for a significant base/precious metal potential in porphyry Cu+Au+Pd±Pt deposits are considered to be the geotectonic environment, controlling the precious/base metal endowment in the parent magma, the oxidized nature of parent magmas, that facilitate the capacity for transporting sufficient Au and PGE, and the degree of evolution of the mineralized system.
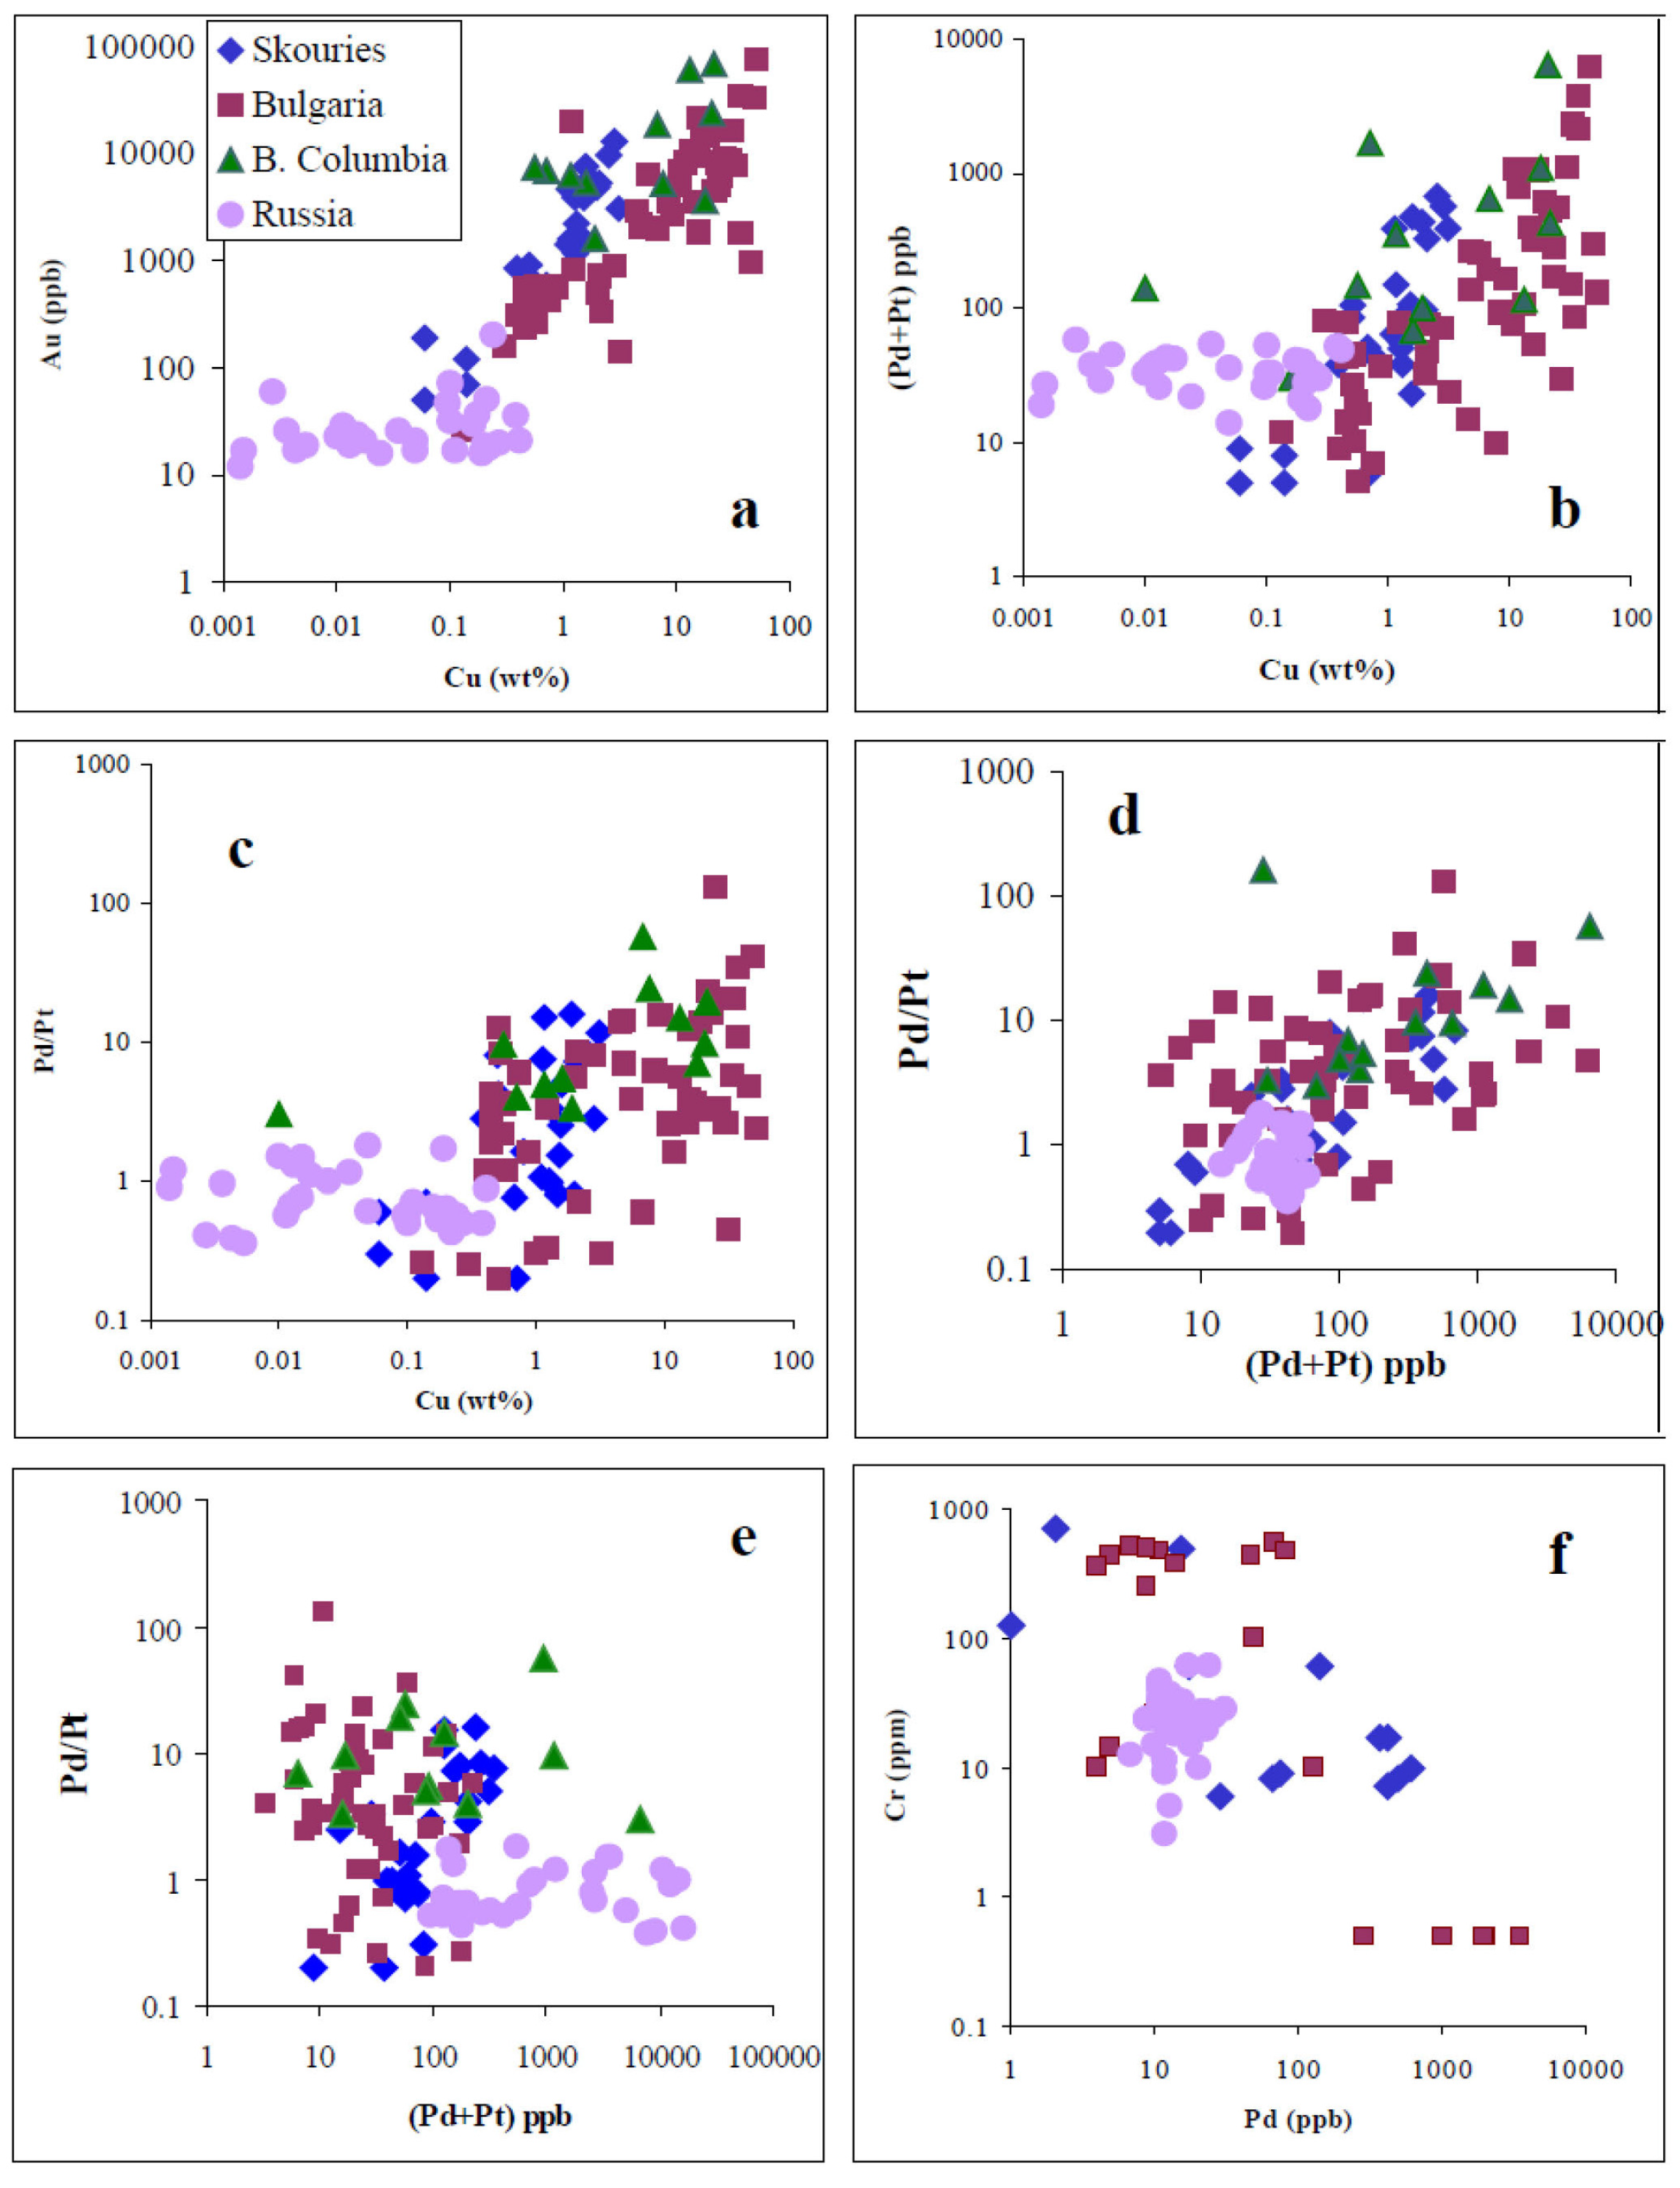
- The elevated contents (hundreds of ppm) in Cr, Co, Ni and Re in porphyry Cu–Au–Pd±Pt deposits of the Balkan Peninsula, in contrast to the porphyry Cu–Mo deposits of Russia and Mongolia are attributed to a direct mantle input by metasomatized asthenospheric mantle wedge.
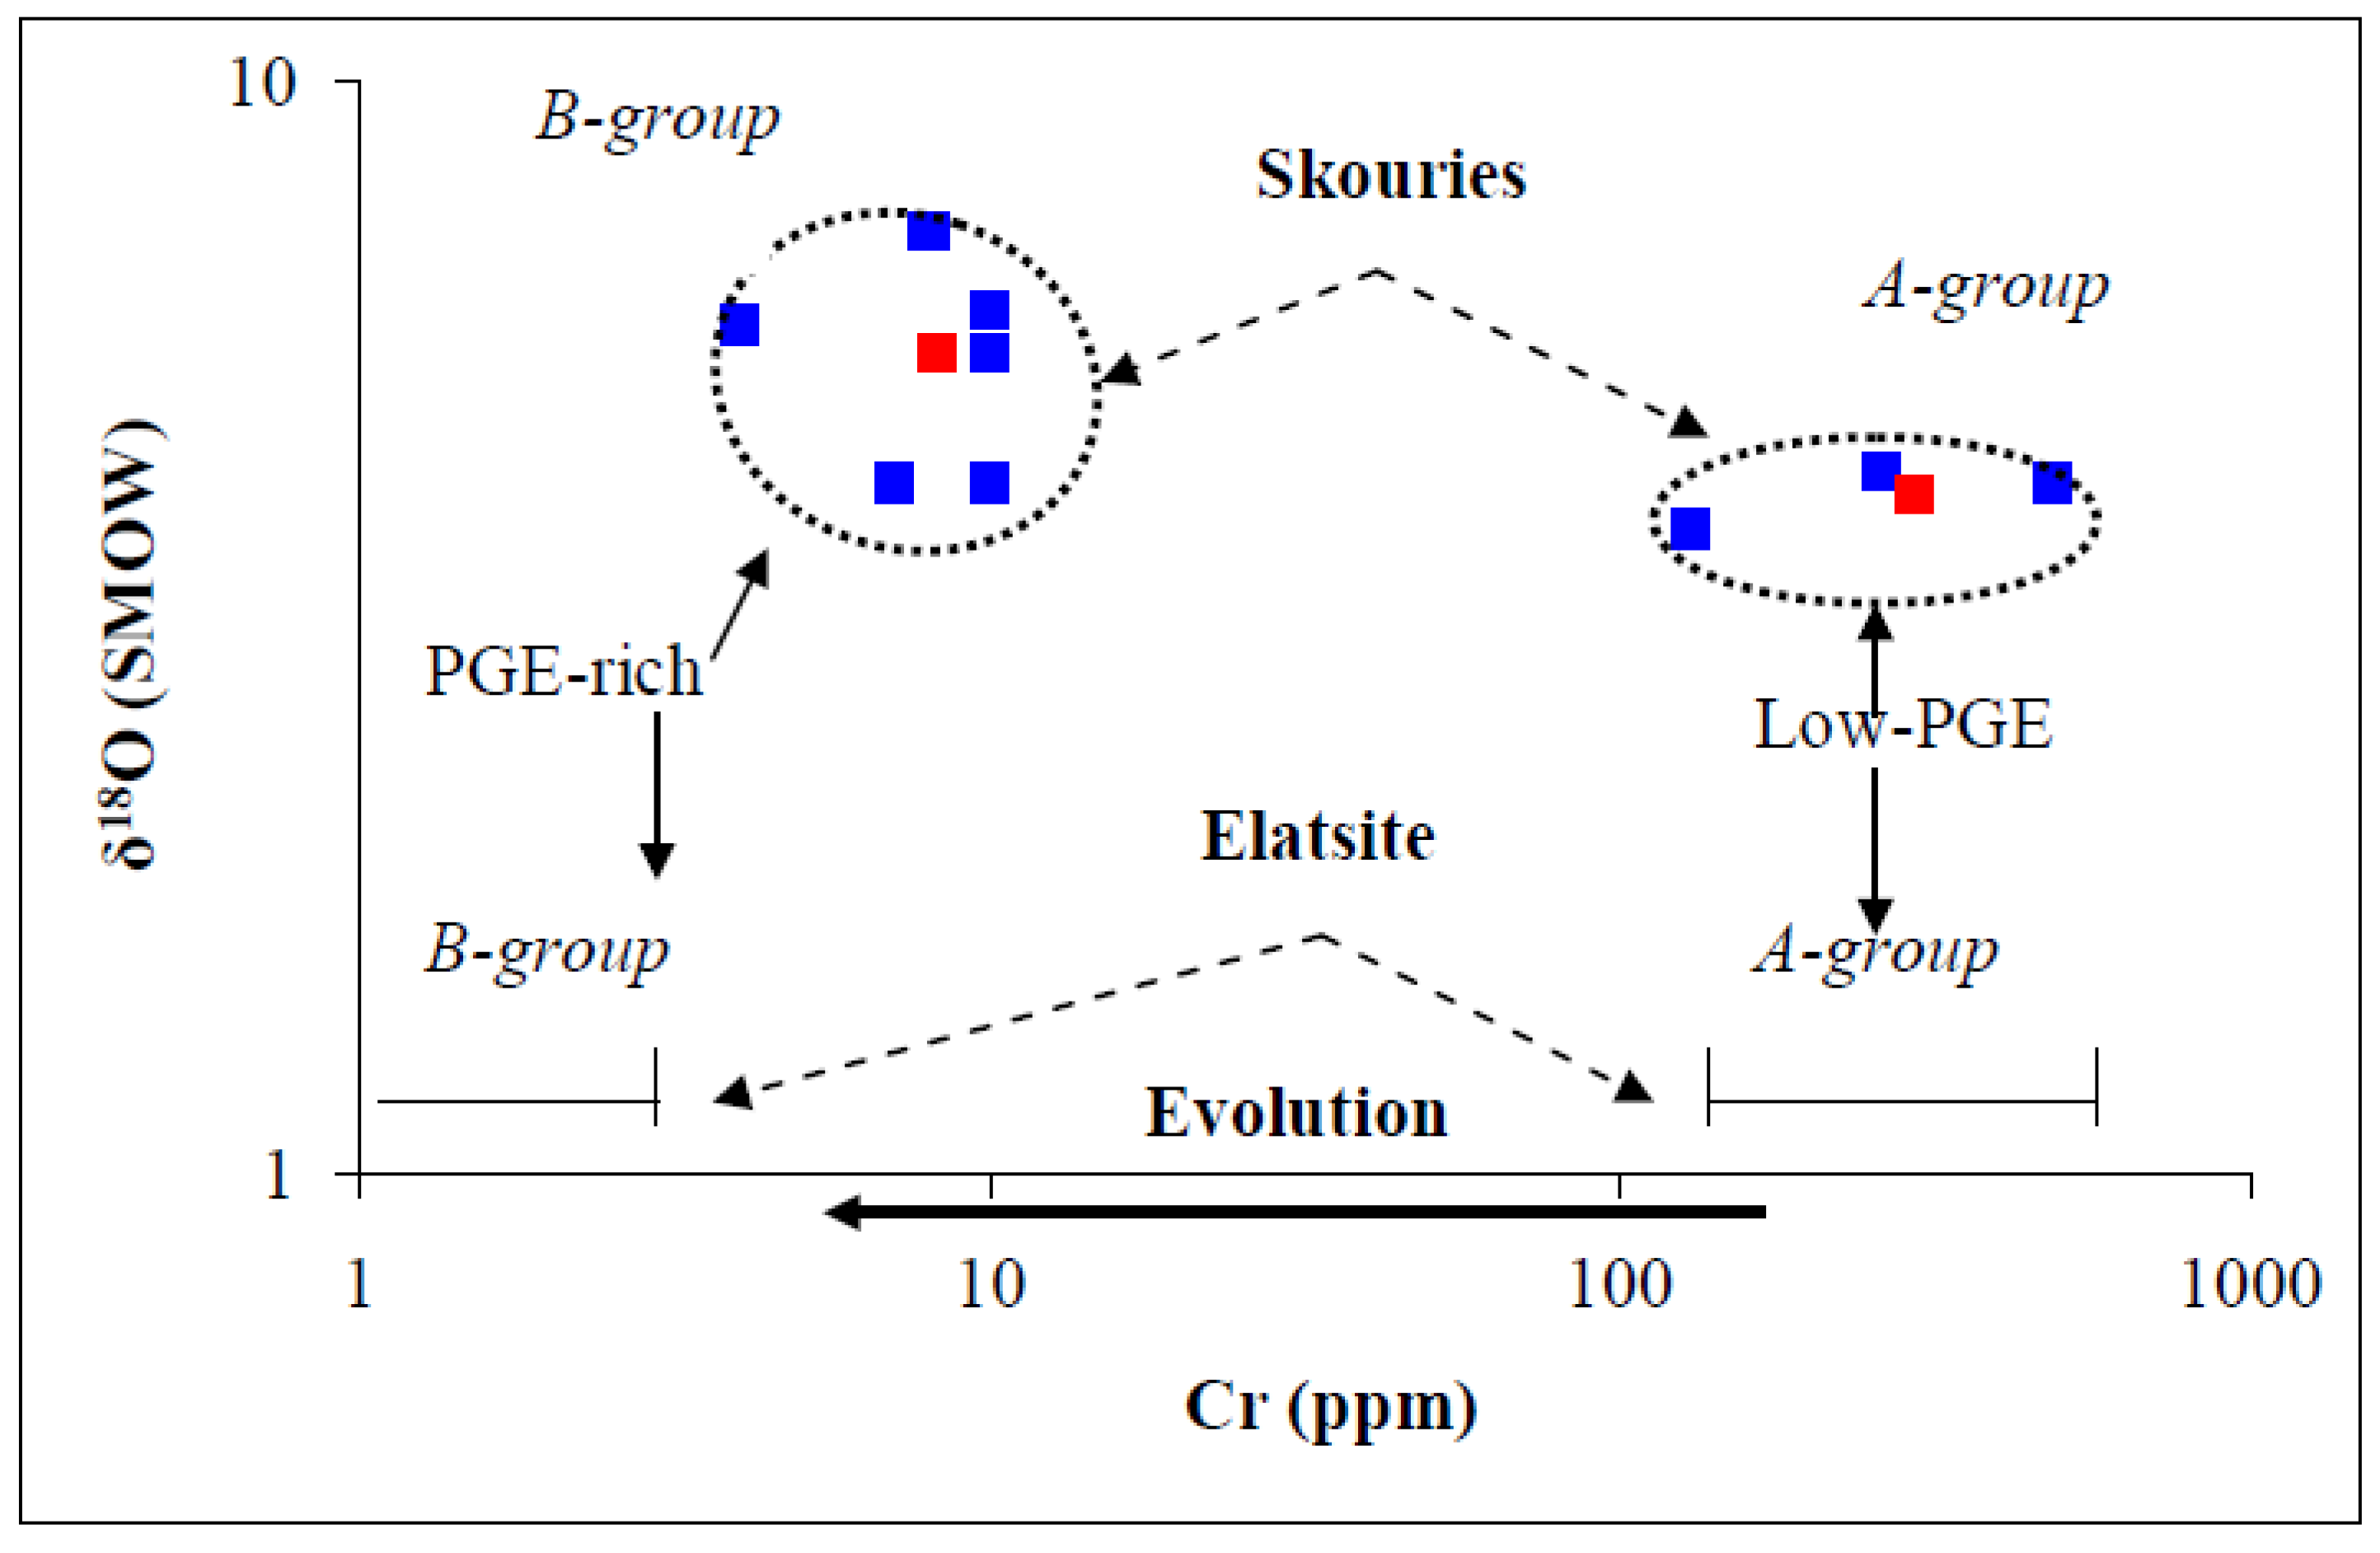
- The elevated values of the Pd/Pt ratios in porphyry deposits of the Balkan Peninsula, coupled with the extremely low Cr contents (<1 ppm) in high Cu–Pd–Pt-grade ores from Elatitse, and the negative correlation between Cr content and the Pd/Pt, δ18O values, support their genesis from more evolved mineralized fluids.
- The Pd and Pt upgrade in massive Cu-ore at the Elatsite porphyry deposit may point to the possibility for their concentration in “transitional” porphyry deposits, during late stages of the evolution of the hydrothermal systems.
- The estimated Pd, Pt and Au potential for certain porphyry-Cu deposits are consistent with the capacity of aqueous vapor and brine to scavenge sufficient quantities of Pt, and Pd, and hence porphyry Cu–Au–Pd–Pt deposits may contribute significantly to global PGE production.
Acknowledgments
Conflicts of Interest
References
- Kirkam, R.V.; Sinclair, W.D. Porphyry Copper, Gold, Molybdenum, Tungsten, Tin, Silver. In Geology of Canadian Mineral Deposit Types; Eckstrand, O.R., Sinclair, W.D., Thorpe, R.I., Eds.; Geological Survey of Canada: Ottawa, ON, Canada, 1996; pp. 421–446. [Google Scholar]
- Corbert, G.J.; Leach, T.M. Southwest Pacific Rim Gold-Copper Systems: Structural, Alteration and Mineralization; Society of Economic Geologists: Littleton, CO, USA, 1998. [Google Scholar]
- Bookstrom, A.A.; Carten, R.B.; Shannon, J.R.; Smith, R.P. Origins of bimodal leucogranite-lamprophyre suites, climax and red mountain porphyry molybdenum systems, Colorado: Petrologic and strontium isotopic evidence. Colo. Sch. Mines Q. 1988, 83, 1–22. [Google Scholar]
- Sillitoe, R.H. old-rich porphyry deposits; descriptive and genetic models and their role in exploration and discovery. Rev. Econ. Geol. 2000, 13, 315–345. [Google Scholar]
- Sillitoe, R.H.; Hedenquist, J. Linkages between volcanotectonic setting, ore-fluid compositions and epithermal precious metal deposits. Soc. Econ. Geol. 2003, 10, 315–343. [Google Scholar]
- Sillitoe, R.H. Porphyry copper systems. Econ. Geol. 2010, 105, 3–41. [Google Scholar] [CrossRef]
- Tosdal, R.M.; Richards, J.P. Magmatic and structural controls on the development of porphyry Cu±Mo±Au deposits. Rev.Econ. Geol. 2001, 14, 157–181. [Google Scholar]
- Brooks, C.K.; Tegner, C.; Stein, H.; Thomassen, B. Re–Os and 40Ar/30Ar ages of porphyry molybdenum deposits in the east Greenland volcanic-rifted margin. Econ. Geol. 2004, 99, 1215–1222. [Google Scholar]
- Richards, J.P. Tectono-magmatic precursors for porphyry Cu–(Mo–Au) deposit formation. Econ. Geol. 2003, 98, 1515–1533. [Google Scholar] [CrossRef]
- Zimmerman, A.; Stein, H.J.; Hannah, J.L.; Kozelj, D.; Bogdanov, K.; Berza, T. Tectonic configuration of the Apuseni–Banat–Timrok–Srednogorie belt, Balkans–South Carpathians, constrained by high precision Re–Os molybdenite ages. Miner. Depos. 2008, 43, 1–21. [Google Scholar] [CrossRef]
- Sutphin, D.; Hammarstrom, J.M.; Drew, L.J.; Large, D.E.; Berger, B.R.; Dicken, C.; DeMarr, M.W.; Billa, M.; Briskey, J.A.; Cassard, D.; et al. Porphyry Copper Assessment of Europe, Exclusive of the Fennoscandian Shield; U.S. Geological Survey: Reston, VA, USA, 2010.
- Werle, J.I.; Ikramuddin, M.; Mutschler, F.E. Allard stock, La Plata Mountains, Colorado—An alkaline rock hosted porphyry copper precious metal deposit. Can. J. Earth Sci. 1984, 21, 630–641. [Google Scholar] [CrossRef]
- Mutschler, F.E.; Griffin, M.E.; Scott, S.D.; Shannon, S.S. Precious metal deposits related to alkaline rocks in the north American Cordillera—An interpretive review. South Afr. J. Geol. 1985, 88, 355–377. [Google Scholar]
- Eliopoulos, D.G.; Economou-Eliopoulos, M. Platinum-group element and gold contents in the Skouries porphyry-copper deposit, Chalkidiki Peninsula, northern Greece. Econ. Geol. 1991, 86, 740–749. [Google Scholar] [CrossRef]
- Economou-Eliopoulos, M.; Eliopoulos, D.G. Palladium, platinum and gold concentrations in porphyry copper systems of Greece and their genetic significance. Ore Geol. Rev. 2000, 16, 59–70. [Google Scholar] [CrossRef]
- Eliopoulos, D.G.; Economou-Eliopoulos, M.; Strashimirov, S.; Kovachev, V.; Zhelyaskova-Panayotova, M. Gold, platinum and palladium content in porphyry Cu deposits from Bulgaria: A study in progress. Geol. Soc. Greece 1995, 5, 712–716. [Google Scholar]
- Tarkian, M.; Stribrny, B. Platinum-group elements in porphyry copper deposits: A reconnaissance study. Mineral. Petrol. 1999, 65, 161–183. [Google Scholar] [CrossRef]
- Tarkian, M.; Hunken, U.; Tokmakchieva, M.; Bogdanov, K. Precious-metal distribution and fluid-inclusion petrography of the Elatsite porphyry copper deposit, Bulgaria. Miner. Depos. 2003, 38, 261–281. [Google Scholar]
- Augé, T.; Petrunov, R.; Bailly, L. On the mineralization of the PGE mineralization in the Elastite porphyry Cu–Au deposit, Bulgaria: Comparison with the Baula-Nuasahi Complex, India, and other alkaline PGE-rich porphyries. Can. Mineral. 2005, 43, 1355–1372. [Google Scholar] [CrossRef]
- Piestrzynski, A.; Schmidt, S.; Franco, H. Pd-minerals in the Santo Tomas II porphyry copper deposit, Tuba Benguet, Philippines. Miner. Pol. 1994, 25, 12–31. [Google Scholar]
- Tarkian, M.; Koopmann, G. Platinum-group minerals in the Santo Tomas II (Philex) porphyry copper–gold deposit, Luzon Island, Philippines. Miner. Depos. 1995, 30, 39–47. [Google Scholar]
- Sheppard, S.M.F. Characterization and isotopic variations in natural waters. Rev. Mineral. Geochem. 1986, 16, 165–183. [Google Scholar]
- Tobey, E.; Schneider, A.; Alegria, A.; Olcay, L.; Perantonis, G.; Quiroga, J. Skouries Porphyry Copper/Gold Deposit, Chalkidiki, Greece. In Porphyry Hydrothermal Cu–Au Deposits; Porter, T.M., Ed.; PGC Publishing: Adelaide, Australia, 1998; pp. 159–168. [Google Scholar]
- Kockel, F.; Mollat, H.; Walther, H. Erlanterungan zur Geologischen Karte der Chalkidiki und Angrenzender Gebiete; Nord Griecheland: Hannover, Germany, 1977. scale 1:100,000. (in German) [Google Scholar]
- Perantonis, G. Genesis of Porphyry Copper Deposits in Chalkidiki Peninsula and W. Thrace, Greece. Ph.D. Thesis, University of Athens, Athens, Greece, 17 June 1982. [Google Scholar]
- Frei, R. Evolution of mineralizing fluid in the porphyry copper system of the Skouries deposit, Northern Chalkidiki (Greece): Evidence from combined Pb-Sr and stable isotope data. Econ. Geol. 1995, 90, 746–762. [Google Scholar] [CrossRef]
- Kroll, T.; Müller, D.; Seifert, T.; Herzig, P.M.; Schneider, A. Petrology and geochemistry of the shoshonite-hosted Skouries porphyry Cu–Au deposit, Chalkidiki, Greece. Miner. Depos. 2002, 37, 137–144. [Google Scholar] [CrossRef]
- Economou-Eliopoulos, M. Platinum-Group Element Potential of Porphyry Deposits. In Mineralogical Association of Canada Short Course 35; Mineralogical Association of Canada: Quebec, QC, Canada, 2005; pp. 203–245. [Google Scholar]
- Naldrett, A.J. Secular variation of magmatic sulfide deposits and their source magmas. Econ. Geol. 2010, 105, 669–688. [Google Scholar] [CrossRef]
- Tarkian, M.; Eliopoulos, D.G.; Economou-Eliopoulos, M. Mineralogy of precious metals in the Skouries porphyry copper deposit northern Greece. N. Jb. Miner. Mh. 1991, 12, 529–537. [Google Scholar]
- Taylor, H.P., Jr. Oxygen and Hydrogen Isotope Relationships in Hydrothermal Minerals Deposit. In Geochemistry of Hydrothermal Ore Deposits, 2nd ed.; Barnes, H.J., Ed.; John Wiley & Sons: Hoboken, NJ, USA, 1979; pp. 236–277. [Google Scholar]
- Popov, P.; Popov, K. General Geologic and Metallogenic Features of the Panagyurishte Ore Region. In Geology and Metallogeny of the Panagyurishte Ore Region (Srednogorie Zone, Bulgaria); Strashimirov, S., Popov, P., Eds.; ABCD-GEODE Workshop: Sofia, Bulgaria, 2000; pp. 1–7. [Google Scholar]
- Strashimirov, S.; Bogdanov, K.; Popov, K.; Kehanov, R. Porphyry Systems of the Panagyurishte Ore Region. In Cretaceous Porphyry-Epithermal Systems of the Srednogoric Zone, Bulgaria; Bogdanov, K., Strashimirov, S., Eds.; Society of Economic Geologists: Littleton, CO, USA, 2003. [Google Scholar]
- Strashimirov, S.; Petrunov, R.; Kanazirski, M. Mineral associations and evolution of hydrothermal systems in porphyry copper deposits from the Central Srednogorie zone (Bulgaria). Miner. Depos. 2002, 37, 587–598. [Google Scholar] [CrossRef]
- Bogdanov, K.; Filipov, A.; Kehayov, R. Au–Ag–Te–Se minerals in the Elatsite porphyry-copper deposit, Bulgaria. Geochem. Mineral. Petrol. 2005, 43, 13–19. [Google Scholar]
- Von Quadt, A.; Peytcheva, I.; Kamenov, B.; Fanger, L.; Heinrich, C.A.; Frank, M. The Elatsite Porphyry Copper Deposit in the Panagyurishte Ore District, Srednogorie Zone, Bulgaria: U-Pb Zircon Geochronology and Isotope-Geochemical Investigations of Magmatism and Ore Genesis. In The Timing and Location of Major Ore Deposits in an Evolving Orogen; Geological Society Special Publication Volume 204; Blundell, D.J., Neubauer, F., von Quadt, A., Eds.; Geological Society of London: London, UK, 2002; pp. 119–135. [Google Scholar]
- Kouzmanov, K. Genèse de la Concentration en Métaux de Base et Précieux de Radka et Elshitsa (Zone de Sredna Gora, Bulgarie): Une Approche Par l’étude Minéralogique, Isotopique et des Inclusions Fluids. Ph.D. Thesis, University of Orléans, Orléans, France, 12 May 2001. [Google Scholar]
- Thompson, J.F.H.; Lang, J.R.; Stanley, C.R. Platinum Group Elements in Alkaline Porphyry Deposits, British Columbia. In Geological Fieldwork 2001; British Columbia Geological Survey: Victoria, BC, Canada, 2001; pp. 57–64. [Google Scholar]
- Sotnikov, V.I.; Berzina, A.N.; Economou-Eliopoulos, M.; Eliopoulos, D.G. Palladium, platinum and gold distribution in porphyry Cu±Mo deposits of Russia and Mongolia. Ore Geol. Rev. 2001, 18, 95–111. [Google Scholar] [CrossRef]
- Li, C.; Naldrett, A.J. High chlorine alteration minerals and calcium-rich brines in fluid inclusions from the Strathcona Deep Copper Zone, Sudbury, Ontario. Econ. Geol. 1993, 88, 1780–1796. [Google Scholar] [CrossRef]
- Wood, S.A.; Mountain, B.W.; Pan, P. The aqueous geochemistry of platinum, palladium and gold: recent experimental constraints and a re-evaluation of theoretical predictions. Can. Mineral. 1992, 30, 955–982. [Google Scholar]
- Wood, B.W. The Aqueous Geochemistry of the Platinum-Group Elements with Applications to Ore Deposits. In Geology, Geochemistry, Mineralogy, Metallurgy and Beneficiation of Platinum-Group Elements; Cabri, L.J., Ed.; Canadian Institute of Mining, Metallurgy and Petroleum: Montreal, QC, Canada, 2002; pp. 211–249. [Google Scholar]
- Xiong, Y.; Wood, S.A. Experimental quantification of hydrothermal solubility of platinum-group elements with special reference to porphyry copper environments. Mineral. Petrol. 2000, 68, 1–28. [Google Scholar] [CrossRef]
- Hanley, J.J. The Aqueous Geochemistry of the Platinum-Group Elements (PGE) in Surficial, Low-T Hydrothermal and High-T Magmatic Hydrothermal Environments. In Exploration for Platinum-Group Element Deposits; Mungall, J.E., Ed.; Mineralogical Association of Canada: Quebec, QC, Canada, 2005; pp. 35–56. [Google Scholar]
- Simon, A.C.; Pettke, T. Platinum solubility and partitioning in a felsic melt-vapor-brine assemblage. Geochim. Cosmochim. Acta 2009, 73, 438–454. [Google Scholar] [CrossRef]
- Barnes, S.J.; Liu, B. Pt and Pd mobility in hydrothermal fluids: Evidence from komatiites and from thermodynamic modelling. Ore Geol. Rev. 2012, 44, 49–58. [Google Scholar] [CrossRef]
- McInnes, B.I.A.; Cameron, E.M. Carbonated, alkaline hybridizing melts from a sub-arc environment: Mantle wedge samples from the Tabar-Lihir-Tanga-Feni arc, Papua New Guinea. Earth Planet. Sci. Lett. 1994, 122, 125–141. [Google Scholar] [CrossRef]
- Keith, J.D.; Christiansen, E.H.; Maughan, D.T.; Waite, K.A. The Role of Mafic Alkaline Magmas in Felsic Porphyry-Cu and Mo Systems. In Mineralogical Association of Canada Short Course; Mineralogical Association of Canada: Quebec, QC, Canada, 1998; pp. 211–243. [Google Scholar]
- Moritz, R.; Kouzmanov, K.; Petrunov, R. Upper Cretaceous Cu–Au epithermal deposits of the Panagyurishte district, Srednogorie zone, Bulgaria. Swiss Bull. Mineral. Petrol. 2004, 84, 79–99. [Google Scholar]
- Chambefort, I. The Cu–Au Chelopech Deposit, Panagyurishte District, Bulgaria: Volcanic Setting, Hydrothermal Evolution and Tectonic Overprint of a Late Cretaceous High-Sulfidation Epithermal Deposit. Ph.D. Thesis, University of Geneve, Geneve, Switzerland, 9 May 2005. [Google Scholar]
- Kehayov, R.; Bogdanov, K.; Fanger, L.; von Quadt, A.; Pettke, T.; Heinrich, C. The Fluid Chemical Evolution of the Elatsite Porphyry Cu–Au–PGE Deposit, Bulgaria. In Mineral Exploration and Sustainable Development; Eliopoulos, D., Ed.; IOS Press: Amsterdam, The Netherlands, 2003; pp. 1173–1176. [Google Scholar]
- Economou-Eliopoulos, M.; Eliopoulos, D.G. Distribution of Rhenium (Re) in Molybdenites and Mo-Bearing Minerals of Greece and Its Economic Significance; Athens University: Athens, Greece, 1996; pp. 1–30. (in Greek) [Google Scholar]
- Berzina, A.N.; Sotnikov, V.I.; Economou-Eliopoulos, M.; Eliopoulos, D.G. Distribution of rhenium in molybdenite from porphyry Cu-Mo and Mo-Cu deposits of Russia (Siberia) and Mongolia. Ore Geol. Rev. 2005, 26, 91–113. [Google Scholar] [CrossRef]
- Voudouris, P.; Melfos, V.; Spry, P.G.; Bindi, L.; Moritz, R.; Ortelli, M.; Kartal, T. Extremely Re-rich molybdenite from porphyry Cu-Mo-Au prospects in northeastern Greece: Mode of occurrence, causes of enrichment, and implications for gold exploration. Minerals 2013, 3, 165–191. [Google Scholar] [CrossRef]
- Luck, J.M.; Allègre, C.J. The study of molybdenites through the 187Re–187Os chronometer. Earth Planet. Sci. Lett. 1982, 61, 291–296. [Google Scholar] [CrossRef]
- Meisel, T.; Walker, R.J.; Morgan, J.W. The osmium isotopic composition of the earth’s primitive upper mantle. Nature 1996, 383, 517–520. [Google Scholar] [CrossRef]
- Mathur, R.; Marschik, R.; Ruiz, J.; Munizaga, F.; Leveille, R.A.; Martin, W. Age of mineralization of the Candelaria Fe oxide Cu–Au deposit and the origin of the Chilean iron belt, based on Re-Os isotopes. Econ. Geol. 2002, 97, 59–71. [Google Scholar] [CrossRef]
- Stein, H.J.; Markey, R.J.; Morgan, J.W.; Du, A.; Sun, Y. Highly precise and accurate Re–Os ages for molybdenite from the East Qinling molybdenum belt, Shaanxi Province, China. Econ. Geol. 1997, 92, 827–835. [Google Scholar] [CrossRef]
- Ripley, E.M.; Lambert, D.D.; Frick, L.R. Re-Os, Sm-Nd, and Pb isotopic constraints on mantle and crustal contributions to magmatic sulfide mineralization in the Duluth Complex. Geochim. Cosmochim. Acta 1998, 62, 3349–3365. [Google Scholar] [CrossRef]
- Lambert, D.D.; Foster, J.G.; Frick, L.R.; Hoatson, D.M.; Purvis, A.C. Application of the Re-Os isotopic system to the study of Precambrian sulfide deposits of Western Australia. J. Earth Sci. 1998, 45, 265–284. [Google Scholar]
- Hart, G.L.; Johnson, C.M.; Shirey, S.B.; Clynne, M.A. Osmium isotope constraints on lower crustal recycling and pluton preservation at Lassen volcanic center, California. Earth Planet. Sci. Lett. 2002, 199, 269–285. [Google Scholar] [CrossRef]
- Mathur, R.; Ruiz, J.; Munizaga, F. Relationship between copper tonnage of Chilean base-metal porphyry deposits and Os isotope ratios. Geology 2000, 28, 555–558. [Google Scholar] [CrossRef]
- Mathur, R.; Ruiz, J.; Herb, P.; Hahn, L.; Burgath, K.P. Re–Os isotopes applied to the epithermal gold deposits near Bucaramanga, northeastern Colombia. J. South Am. Earth Sci. 2003, 15, 815–821. [Google Scholar] [CrossRef]
- Barra, F.; Ruiz, J.; Mathur, R.; Titley, S.; Schmitz, C.A. Re–Os study of sulfides from the Bagdad porphyry Cu-Mo deposit, northern Arizona, USA. Miner. Depos. 2003, 38, 585–596. [Google Scholar] [CrossRef]
- Janković, S.; Jelenković, R. Correlation between the Oraviţa-Krepoljin and the Bor-Srednjegorie metallogenic zones. Rom. J. Miner. Depos. 1997, 78, 57–70. [Google Scholar]
- Karamata, S.; Kneević, V.; Pécskay, Z.; Djordjević, M. Magmatism and metallogeny of the Ridanj–Krepoljin Belt (eastern Serbia) and their correlation with northern and eastern Analogues. Miner. Depos. 1997, 32, 452–458. [Google Scholar] [CrossRef]
- Spry, P.G.; Mathur, R.D.; Bonsall, T.A.; Voudouris, P.; Melfos, V. Re–Os isotope evidence for mixed source components in carbonate-replacement Pb–Zn–Ag deposits in the Lavrion district, Attica, Greece. Mineral. Petrol. 2013, 107. [Google Scholar] [CrossRef]
- Mungall, J.E.; Andrews, D.R.A.; Cabri, L.J.; Sylvester, P.J.; Tubrett, M. Partitioning of Cu, Ni, Au, and platinum-group elements between monosulfide solid solution and sulfide melt under controlled oxygen and sulphur fugacities. Geochim. Cosmochim. Acta 2005, 69, 4349–4360. [Google Scholar] [CrossRef] [Green Version]
- Sun, W.; Huang, R.; Liang, H.; Ling, M.; Li, C.; Ding, X.; Zhang, H.; Yang, X.; Ireland, T.; Fan, W. Magnetite–hematite, oxygen fugacity, adakite and porphyry copper deposits: Reply to Richards. Geochim. Cosmochim. Acta 2014, 126, 646–649. [Google Scholar] [CrossRef]
- Peach, C.L.; Mathez, E.A.; Keays, R.R. Sulphide melt-silicate melt distribution coefficients for the noble metals and other chalcophile metals as deduced from MORB: Implications for partial melting. Geochim. Cosmochim. Acta 1990, 54, 3379–3389. [Google Scholar] [CrossRef]
- Lefort, D.; Hanley, J.J.; Guillong, M. Sub-epithermal Au-Pd mineralization associated with an alkalic porphyry Cu–Au deposit, Mount Milligan, Quesnel Terrane, British Columbia, Canada. Econ. Geol. 2011, 106, 781–808. [Google Scholar] [CrossRef]
© 2014 by the authors; licensee MDPI, Basel, Switzerland. This article is an open access article distributed under the terms and conditions of the Creative Commons Attribution license (http://creativecommons.org/licenses/by/3.0/).
Share and Cite
Eliopoulos, D.G.; Economou-Eliopoulos, M.; Zelyaskova-Panayiotova, M. Critical Factors Controlling Pd and Pt Potential in Porphyry Cu–Au Deposits: Evidence from the Balkan Peninsula. Geosciences 2014, 4, 31-49. https://doi.org/10.3390/geosciences4010031
Eliopoulos DG, Economou-Eliopoulos M, Zelyaskova-Panayiotova M. Critical Factors Controlling Pd and Pt Potential in Porphyry Cu–Au Deposits: Evidence from the Balkan Peninsula. Geosciences. 2014; 4(1):31-49. https://doi.org/10.3390/geosciences4010031
Chicago/Turabian StyleEliopoulos, Demetrios G., Maria Economou-Eliopoulos, and Maria Zelyaskova-Panayiotova. 2014. "Critical Factors Controlling Pd and Pt Potential in Porphyry Cu–Au Deposits: Evidence from the Balkan Peninsula" Geosciences 4, no. 1: 31-49. https://doi.org/10.3390/geosciences4010031