1. Introduction
At the first order, the geography of a plate boundary is controlled by the lithospheric rheology of the two plates, their kinematics, the geometry of the boundary, the duration of relative plate motion, and the climatic regime to which they are subjected, e.g., [
1,
2,
3,
4,
5,
6]. Unravelling the controls on present day geography is facilitated by being able to observe the geography, geology, climatic regime, and tectonic driving forces first hand. Exploration and explanation of paleogeography requires consideration of the same factors although not all will necessarily be easy to constrain. For example, we may have to infer the climatic regime or the geometry of a now deformed plate boundary. Here, we examine the plate boundary through Southern New Zealand (
Figure 1), which in the Miocene was dominated by strike-slip tectonics [
7,
8]. While at the first order, strike slip plate boundaries are long linear or curved features with little significant topography, they often have localised topographic highs or lows associated with them, e.g., [
9]. These are most commonly attributed to releasing bends, which give rise to basins such as the Sea of Marmara along the Anatolian Fault and the Salton Sea along the San Andreas Fault [
9,
10], or restraining bends, which produce uplift, e.g., the Transverse Ranges in California [
9]. In this study we show that prolonged subsidence associated with the Southern New Zealand boundary was related to mid-crustal rheology rather than resulting from a releasing bend along the plate boundary.
Figure 1.
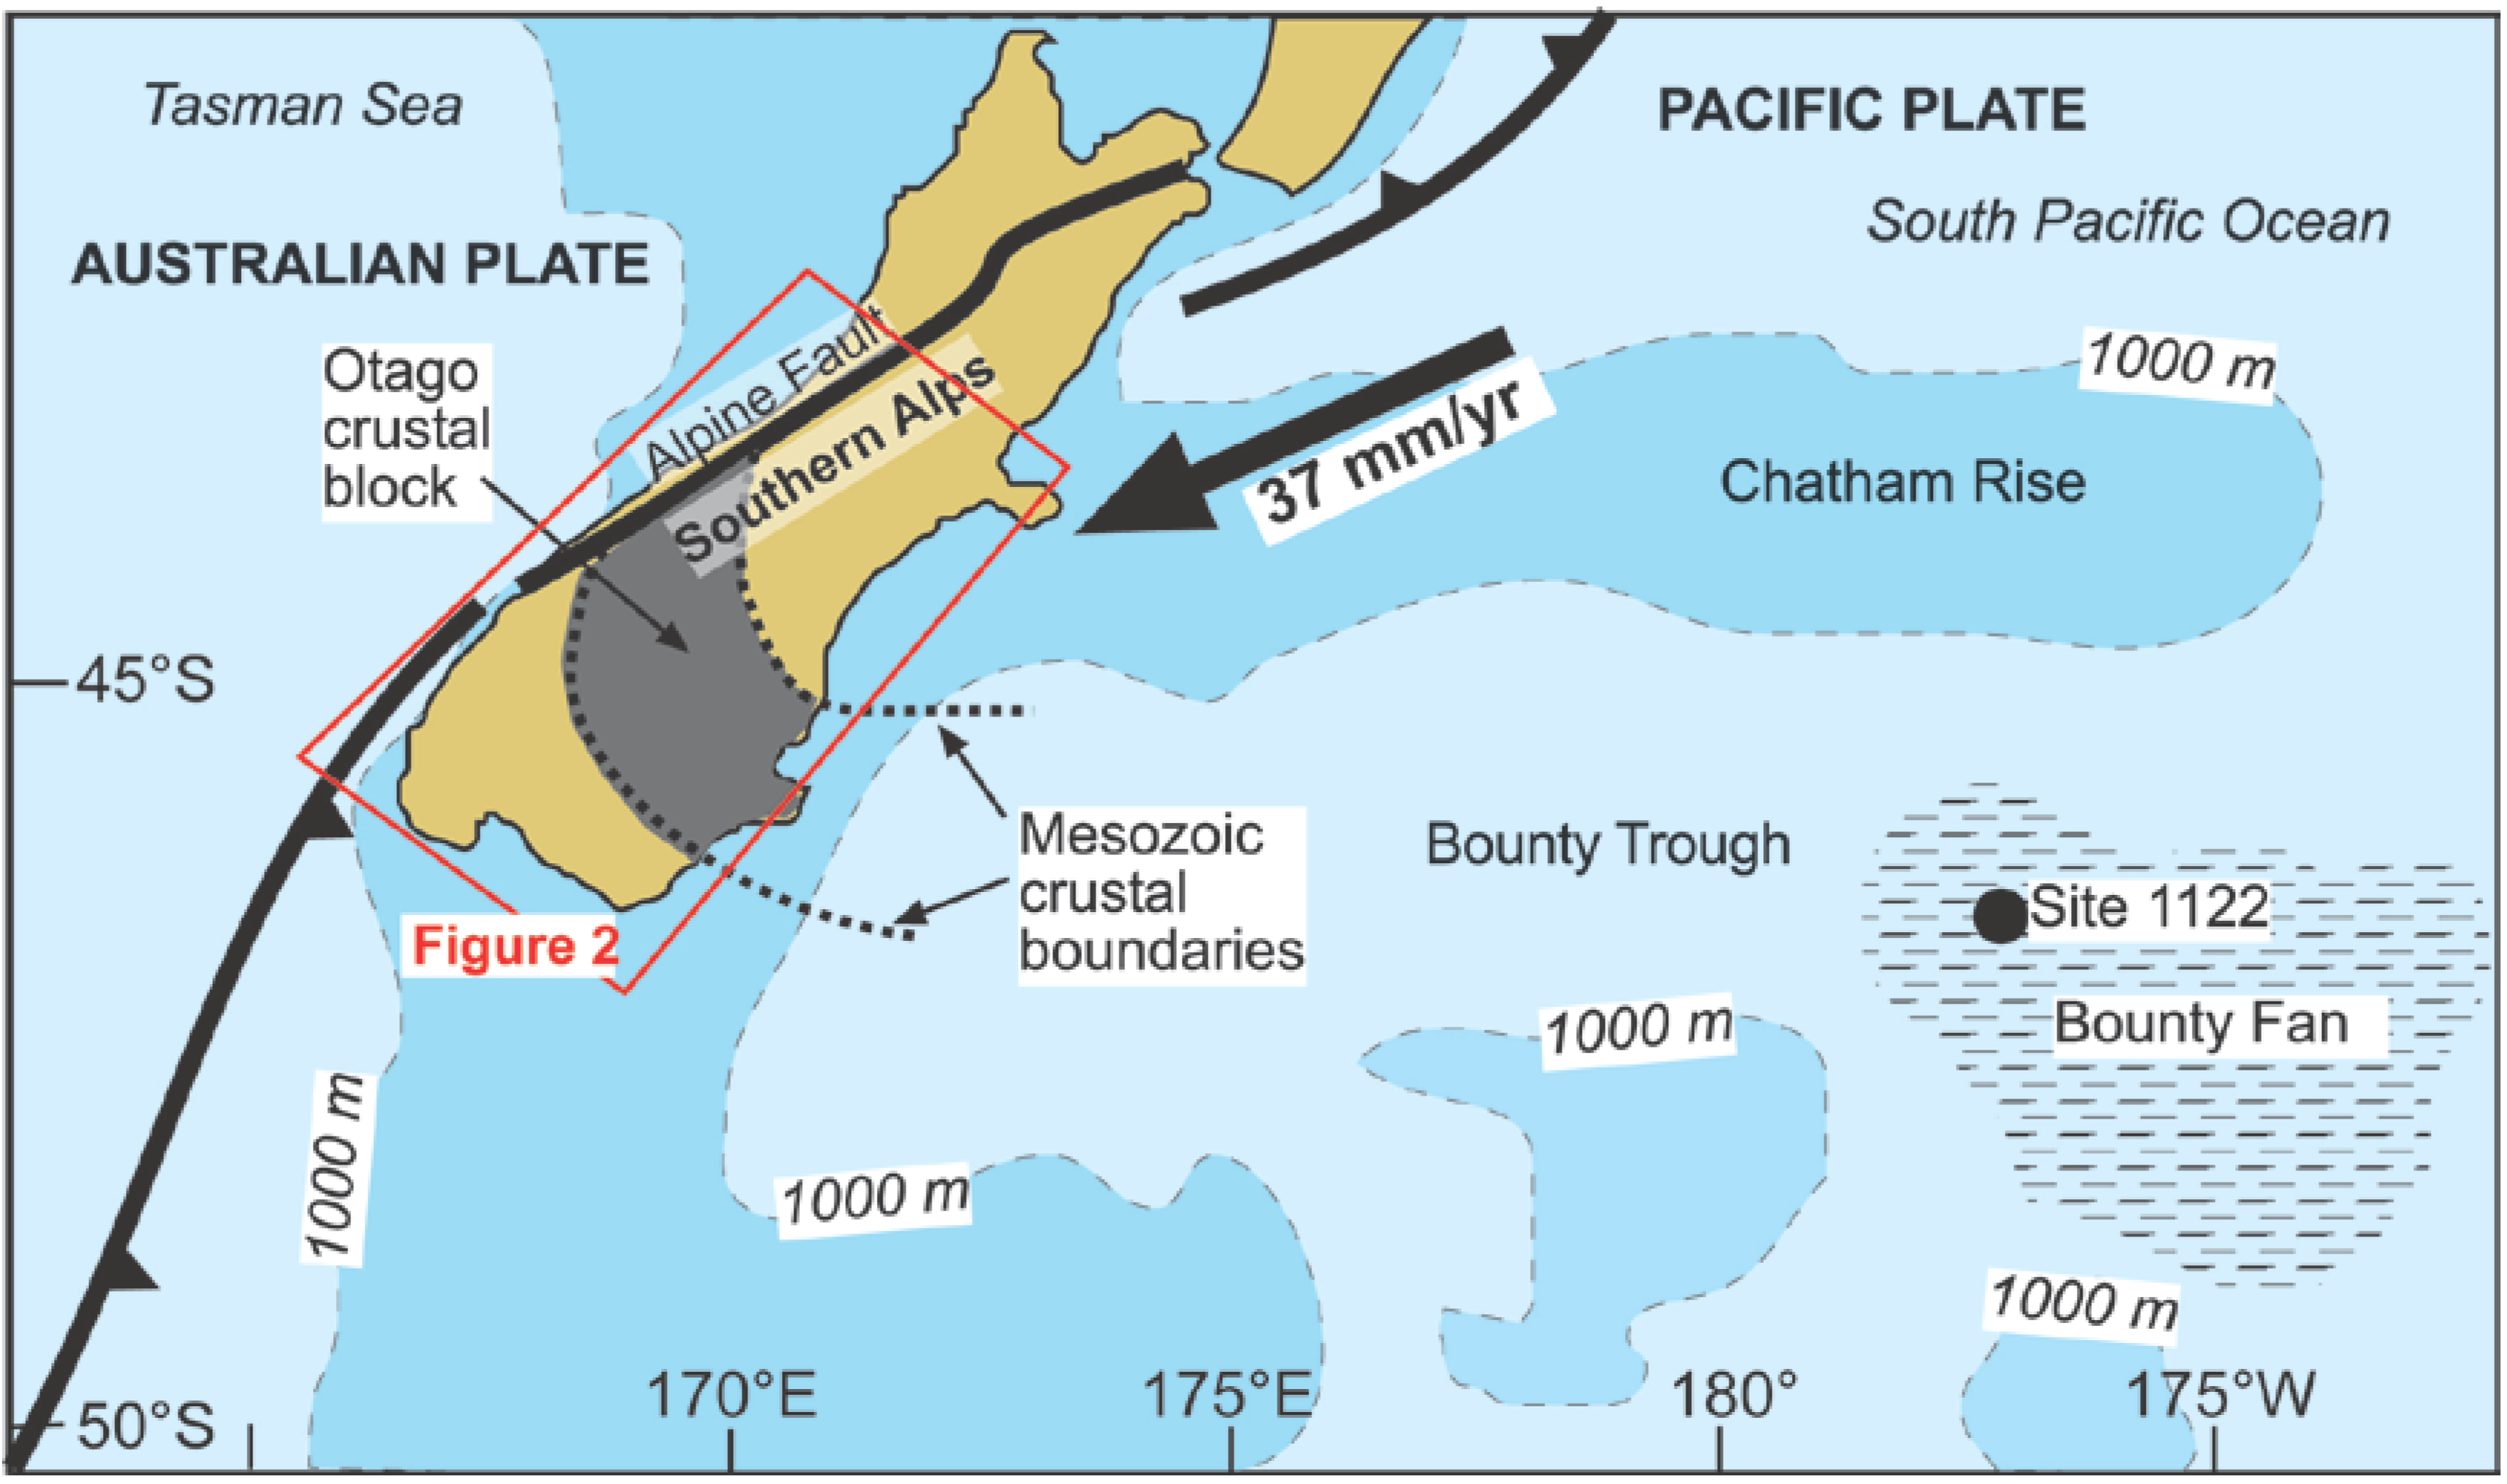
Tectonic setting of the Pacific/Australian plate boundary in Southern New Zealand. The relative plate motion vector is from DeMets
et al. [
11]. The Otago schist block is highlighted. ODP (Ocean Drilling Program) site 1122 is located on the Bounty Fan approximately 1200 km east of Otago.
Figure 1.
Tectonic setting of the Pacific/Australian plate boundary in Southern New Zealand. The relative plate motion vector is from DeMets
et al. [
11]. The Otago schist block is highlighted. ODP (Ocean Drilling Program) site 1122 is located on the Bounty Fan approximately 1200 km east of Otago.
During the Miocene, with strike-slip tectonics driving deformation in Southern New Zealand [
7,
8], stratigraphic evidence attests to two zones of subsidence: (a) a waning middle Cenozoic pull-apart basin, the Waiau Basin (
Figure 2 and
Figure 3) with proximal orogen parallel drainage; and (b) a distal and regionally extensive subsiding lake complex, Lake Manuherikia (
Figure 2) [
7,
12,
13,
14,
15,
16]. Unlike the Waiau Basin to the southwest, the large area of subsidence that led to the formation of Lake Manuherikia was not the result of a releasing bend on the strike slip proto-Alpine Fault. The lake was located to the east and distal to the main plate boundary structure where the majority of the relative plate motion was being accommodated [
7]. While the existence and the approximate extent of this lake has been well established in previous studies [
12,
13,
14,
16], no one has yet attempted to explain the tectonic origin of this large area of distal subsidence that dominated the regional topography for more than 10 million years as the plate boundary evolved. This paper addresses the problem of regional distal subsidence near a strike-slip plate boundary, as distinct from the more proximal subsidence features that are better understood [
7,
8,
9].
Figure 2.
(
a) Digital elevation model of the Southern South Island showing the current geography where the smooth ranges east of the Nevis-Cardrona Fault (N.C.F.) expose but retain the Waipounamu Erosion Surface [
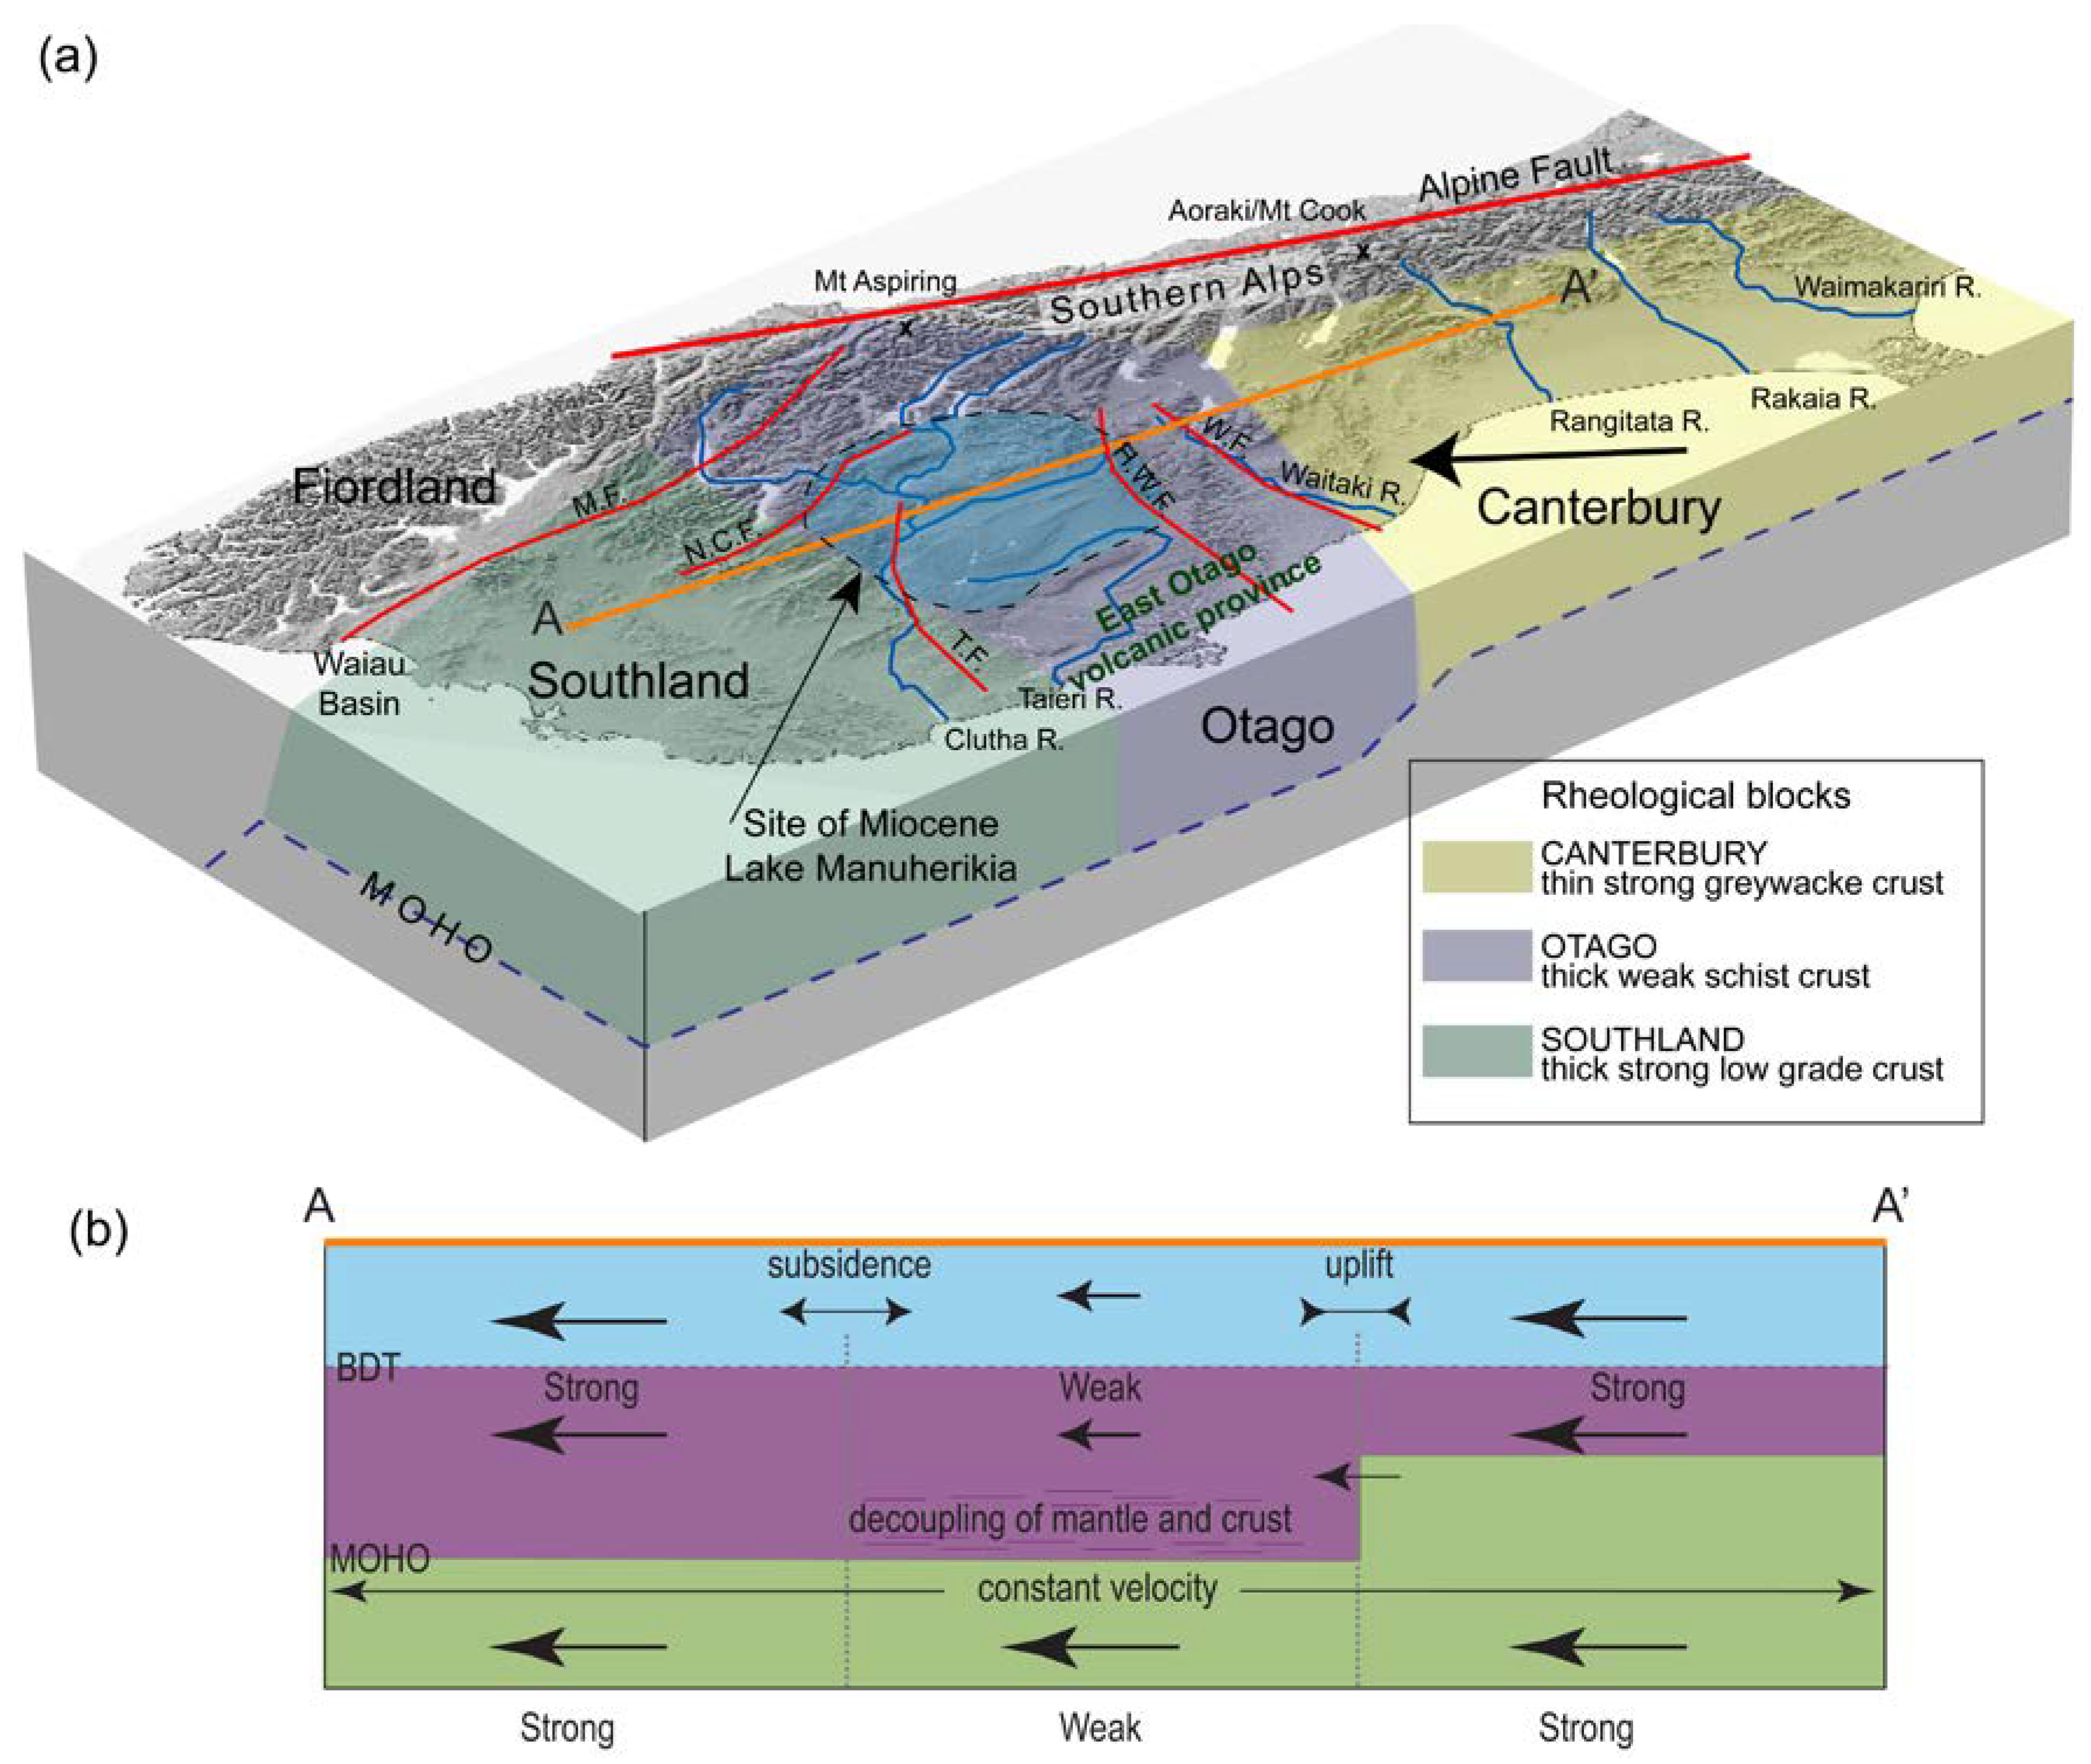
12]. The rheological blocks used in this study are shown as transparent overlays. The estimated extent of the Miocene Lake Manuherikia is shown by the light blue circle. Faults referred to in the text include the Moonlight Fault System (M.F.), the Tuapeka Fault (T.F.), Hawkdun/Waihemo Fault (H.W.F.) and the Waitaki Fault (W.F.). The location of the cross-section in (
b) is shown by the orange line. (
b) Conceptual model of how Lake Manuherikia and associated swamps formed as a result of strike slip deformation and a weak mid-crust beneath the Otago schist block showing the velocity distribution through the crust with the resultant strain and vertical displacements. Single headed arrows represent material movement. Double headed arrows represent relative movement between blocks with contraction = arrows facing and stretching = arrows facing in opposite directions. The crust and mantle are coupled where there is a strong mid-crust but are uncoupled beneath the weak lower crust. BDT: brittle ductile transition.
Figure 2.
(
a) Digital elevation model of the Southern South Island showing the current geography where the smooth ranges east of the Nevis-Cardrona Fault (N.C.F.) expose but retain the Waipounamu Erosion Surface [
12]. The rheological blocks used in this study are shown as transparent overlays. The estimated extent of the Miocene Lake Manuherikia is shown by the light blue circle. Faults referred to in the text include the Moonlight Fault System (M.F.), the Tuapeka Fault (T.F.), Hawkdun/Waihemo Fault (H.W.F.) and the Waitaki Fault (W.F.). The location of the cross-section in (
b) is shown by the orange line. (
b) Conceptual model of how Lake Manuherikia and associated swamps formed as a result of strike slip deformation and a weak mid-crust beneath the Otago schist block showing the velocity distribution through the crust with the resultant strain and vertical displacements. Single headed arrows represent material movement. Double headed arrows represent relative movement between blocks with contraction = arrows facing and stretching = arrows facing in opposite directions. The crust and mantle are coupled where there is a strong mid-crust but are uncoupled beneath the weak lower crust. BDT: brittle ductile transition.
![Geosciences 04 00093 g002]()
Figure 3.
(
a) Waipounamu Erosion Surface, Central Otago. The low-relief basement surface was cut by marine planation in the Cenozoic [
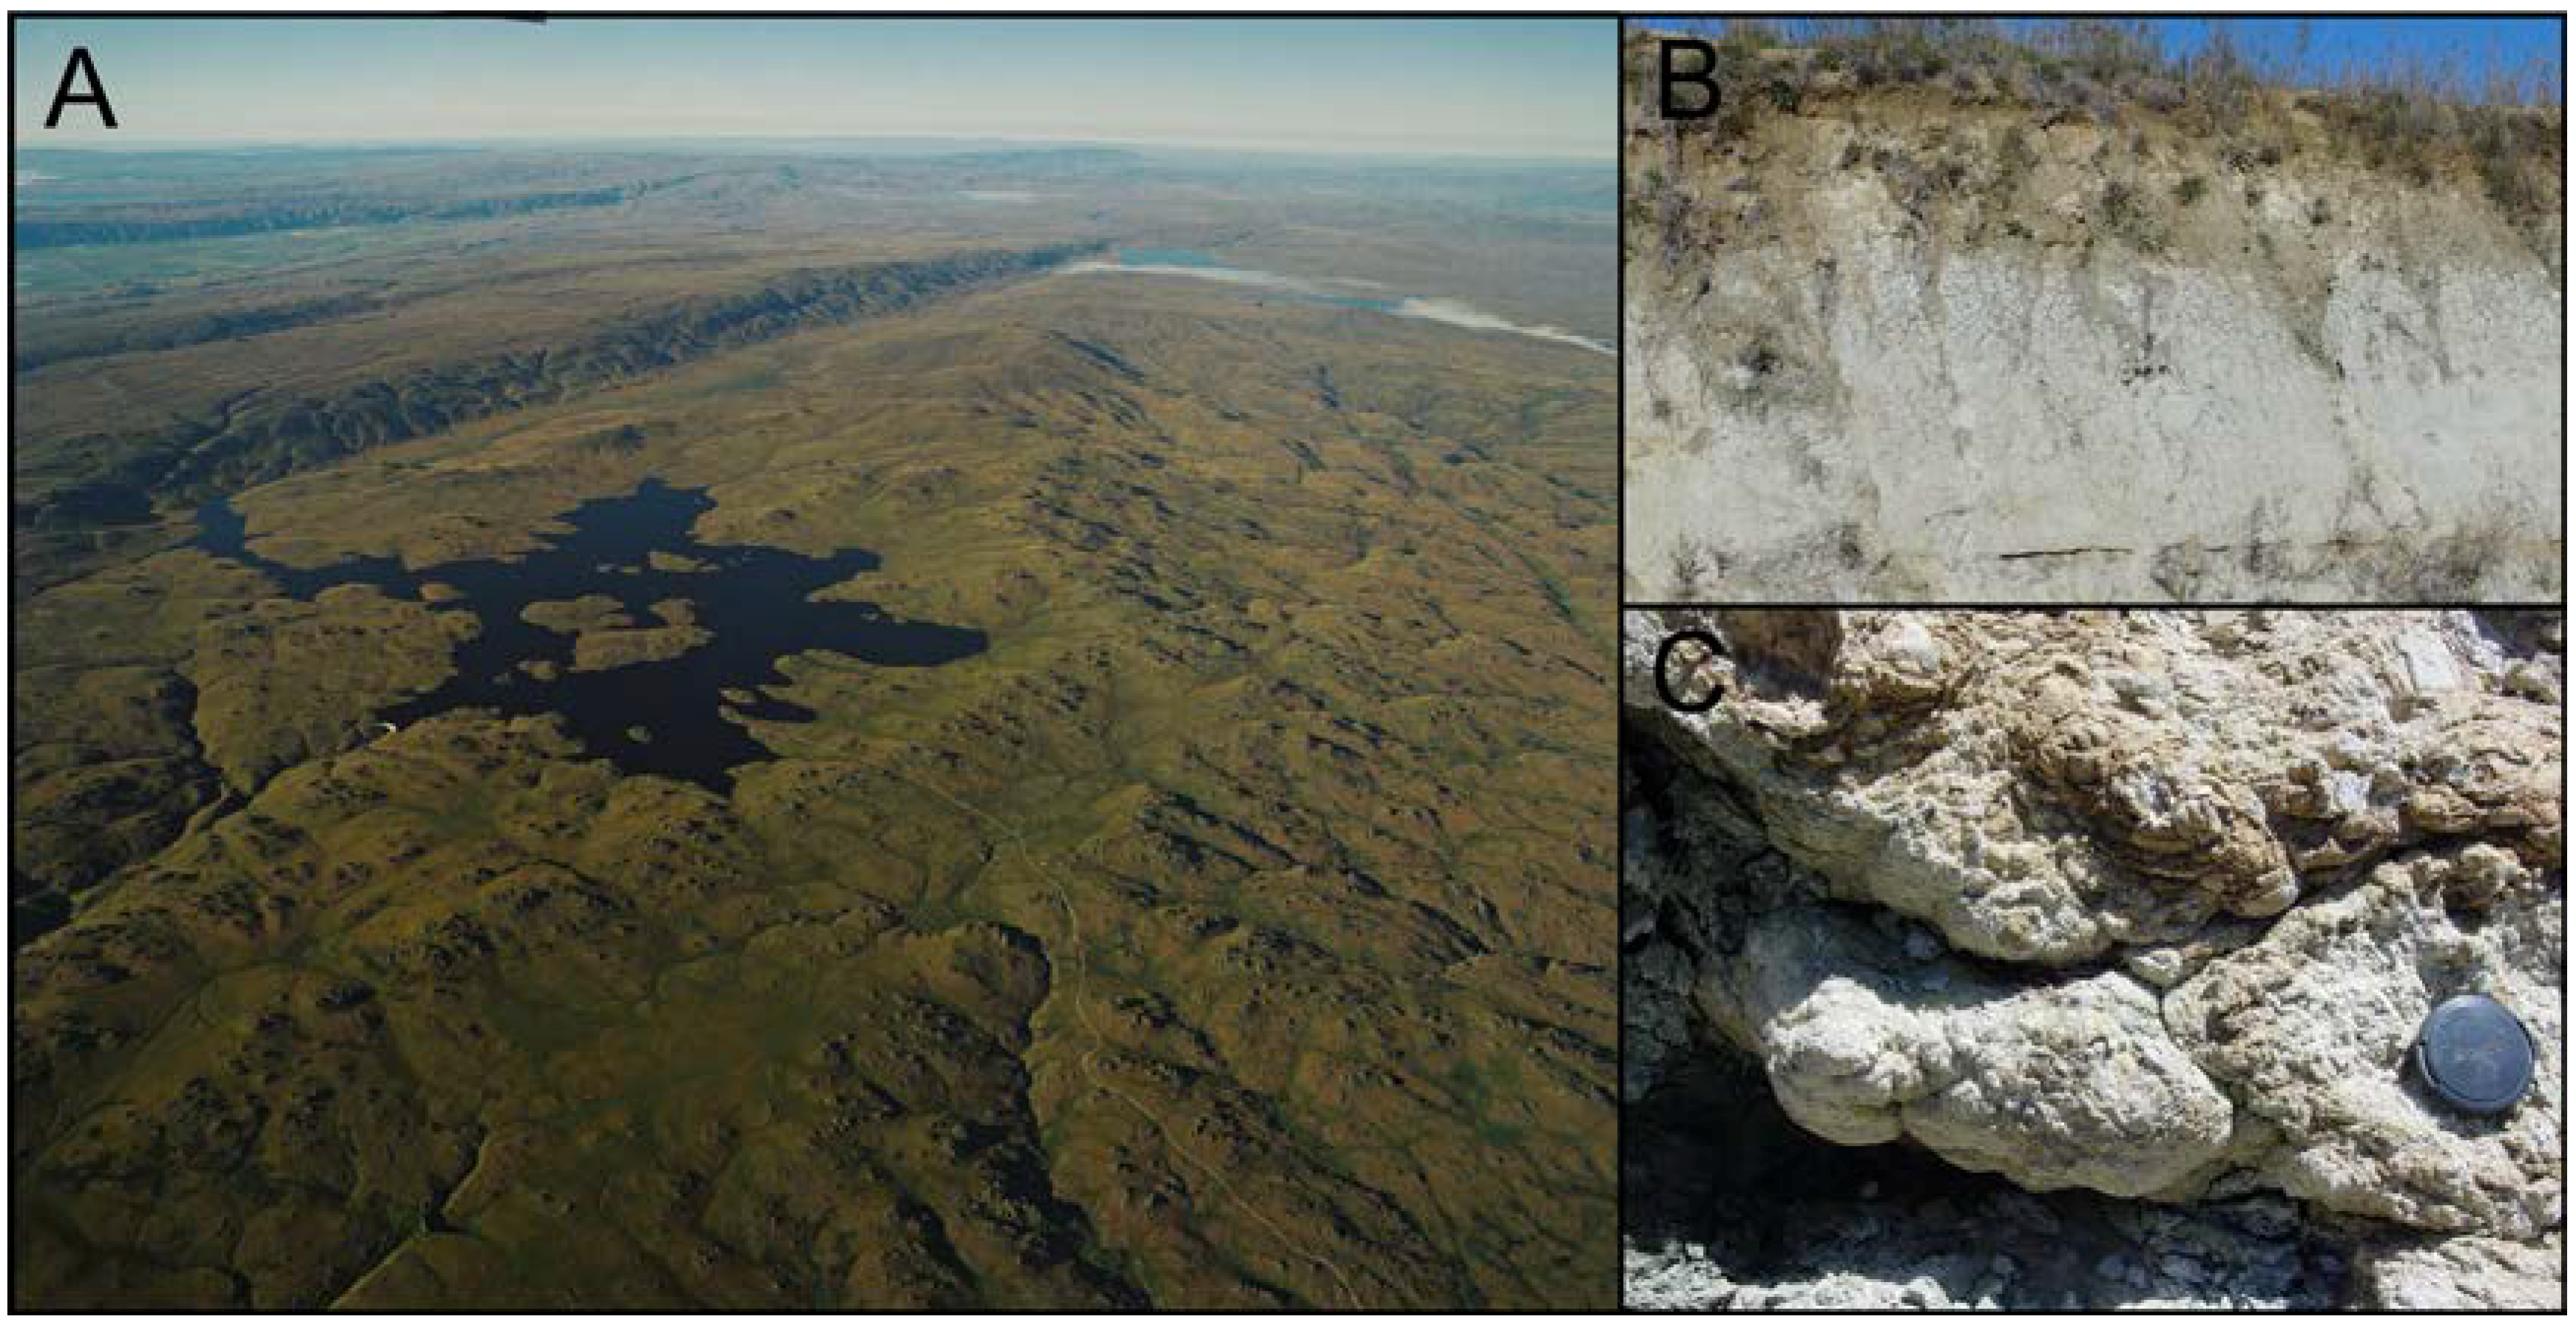
12], and has been weakly deformed and uplifted during Plio-Pleistocene transpression which is still on-going. Pleistocene antiformal ranges in upper left are separated by synformal basins containing remnants of Miocene sediments, including sediments deposited in Lake Manuherikia. Photo: Lloyd Homer GNS Science. (
b) Miocene lacustrine sediments (Lake Manuherikia) exposed in a three meter high roadcut in a synformal basin (top left, in (
a)). Tan-colored siltstone beds (top and bottom) are separated by a white clay-rich mudstone bed. (
c) Fossil stromatolites that grew on the northern shore of Lake Manuherikia.
Figure 3.
(
a) Waipounamu Erosion Surface, Central Otago. The low-relief basement surface was cut by marine planation in the Cenozoic [
12], and has been weakly deformed and uplifted during Plio-Pleistocene transpression which is still on-going. Pleistocene antiformal ranges in upper left are separated by synformal basins containing remnants of Miocene sediments, including sediments deposited in Lake Manuherikia. Photo: Lloyd Homer GNS Science. (
b) Miocene lacustrine sediments (Lake Manuherikia) exposed in a three meter high roadcut in a synformal basin (top left, in (
a)). Tan-colored siltstone beds (top and bottom) are separated by a white clay-rich mudstone bed. (
c) Fossil stromatolites that grew on the northern shore of Lake Manuherikia.
We know from previous studies that the present day topography of the Southern Alps is strongly influenced by the presence of a block of crust with a significantly weak mid-crustal section [
6]. This crustal block, the Otago Schist (
Figure 1 and
Figure 2), is spatially coincident with the area inferred to have been undergoing subsidence in the Miocene to produce Lake Manuherikia (
Figure 2). Thus, we pose the question: does the presence of a weak mid-crustal section beneath the Otago Schist also explain the existence of long-lived subsidence distal to the strike-slip plate boundary system in the Miocene? Our conceptual model is shown in
Figure 2b. With strike-slip relative plate motion approximately perpendicular to the rheological boundaries between weak and strong mid-crust, strong crust and mantle from the north pushes into weak Otago crust, producing uplift as previously documented [
6]. To the south, strong mid-crust pulls away from weak Otago mid-crust, where there is decoupling between the crust and mantle, and subsidence results.
We use three-dimensional geodynamic models to test this model. We integrate data and interpretations from the Southern South Island using a variety of geological and geophysical sources to constrain our models, including the stratigraphic record [
13,
14,
16], structural observations [
15,
17,
18,
19], observations of crustal velocity and thickness across the South Island [
20,
21,
22,
23,
24,
25] and previous modelling studies [
6,
26,
27,
28]. There has been only limited bedrock erosion across this region since the Miocene so that many aspects of the paleogeography are still preserved [
29]. We compare our model results with the first-order regional paleogeography. We then comment on how local, second-order topography has apparently been influenced by pre-existing brittle structural fabric, within the context of our regional modelling.
2. Geological Context
The basement of the Southern South Island is made up of a thick pile of Palaeozoic-Mesozoic metasedimentary rocks that were amalgamated along the Gondwana margin in the Mesozoic [
29,
30,
31,
32]. In the late Mesozoic, the New Zealand region separated from the rest of Gondwana resulting in a period of extension and then tectonic quiescence. Extensional deformation associated with Gondwana breakup in the Cretaceous resulted in both steep and gently dipping normal faults, oriented NE and NW, especially along the margins of the Otago crustal block [
33,
34]. Further extension in the early Cenozoic occurred along a newly developing plate boundary, and that extension continued through the Oligocene until New Zealand was essentially submerged below sea level [
12]. The diachronous unconformity, the Waipounamu Erosion Surface (
Figure 2 and
Figure 3a) formed through marine planation that accompanied the progressive submergence of the New Zealand region [
12,
35]. This erosion surface was not developed in the vicinity of the Waiau Basin, where more rapid and extensive subsidence occurred adjacent to the developing Cenozoic plate boundary, and there is little evidence of the erosion surface to the west of the Moonlight Fault System (
Figure 2 and
Figure 4a) that was part of the structural zone that formed the Waiau Basin [
36].
The current plate boundary through the South Island was initiated as a strike-slip system in the Miocene and evolved to transpression in the Pliocene [
7,
8]. The originally-marine Waipounamu Erosion Surface was uplifted above sea level during the late Oligocene and early Miocene, and has accumulated varying amounts of nonmarine sediments since then [
12,
13,
14,
15,
16]. The amounts of differential uplift, subsidence, and erosion that have occurred during the Miocene-Recent plate boundary deformation are defined by the present geometry of the Waipounamu Erosion Surface (
Figure 2 and
Figure 3a) [
12]. This surface is still recognizable on the crests and slopes of most of the mountain ranges in Otago and Southland, with only minor erosional modification (
Figure 3a), although tens to a few hundreds of meters of soft Cenozoic sediments have been removed from above the erosion surface at mountain range crests. The erosion surface persists beneath the intervening basins, at or near sea level, with only broad synformal deformation and minor fault disruption (
Figure 2a), and overlying Cenozoic sediments are variably preserved in these basins (
Figure 3b,c).
Figure 4.
Series of plate reconstructions for Southern New Zealand based on Sutherland
et al. [
37], Sutherland [
38], and King
et al. [
8]. (
a) Reconstruction for ~20 Ma with the present day coastline shown as a dashed line. To the south of New Zealand plate motion was being taken up along active transform faults with a likely step-over to the west onto the proto-Alpine Fault. Otago and Southland were low lying with coal measures being formed. The Moonlight Fault System (MFS) was active at this time; (
b) Reconstruction for ~11 Ma. Lake Manuherikia extended across much of Otago, Southland was still subsiding slowly with coal measures forming and local uplift on pre-existing structures produced lithic sedimentation in places. The Old Man Range (OMR) bounds the lake to the south; (
c) Reconstruction for ~5 Ma. Uplift of the Hawkdun-Kakanui Ranges (H-KR) produces lithic sediments that start to fill Lake Manuherikia from the north. The proto-Clutha river drains east Otago; (
d) Late Quaternary and present day. Uplift has developed across the whole of the Otago region with a series of NE-trending ranges. The Clutha River now drains nearly all of Otago cutting through NE-trending ranges [
39]. DMOB: Dun Mountain Ophiolite Belt [
40].
![Geosciences 04 00093 g004]()
Early Miocene sedimentation on the Waipounamu Erosion Surface was dominated by fluvial sediments and abundant lignite [
12,
13,
14,
16]. These sediments accumulated over much of Otago and Southland, although some uplifted ridges disrupted lateral stratigraphic continuity (
Figure 4a). Hence, the early Miocene topography was characterized by localized minor uplift and subsidence, with insufficient subsidence to permit marine incursion [
16]. More regional subsidence in Otago began in the middle Miocene (
Figure 4b), with development of Lake Manuherikia [
12,
13]. Lake sediments, dominated by siltstones and mudstones up to several hundred meters thick, accumulated on top of the early Miocene fluvial deposits over an area of more than 6000 km
2 (
Figure 2).
Manuherikia lake sediments are dominated by siltstones and mudstones (
Figure 3b), up to several hundred meters thick. This required sufficient subsidence to maintain the lake topography with its growing sediment pile, but insufficient subsidence to permit marine incursion, as in the early Miocene. The lake was bounded to the east by a low uplifted zone associated with an alkaline volcanic complex [
41] (
Figure 2), and to the south by a basement ridge (Old Man Range,
Figure 4b), which separated Otago lacustrine from Southland fluvial sedimentation [
16]. The locations and nature of other boundaries of the lake are unknown. Sedimentation in the lake was slow and fine-grained, with excellent preservation of vertebrate and plant fossils [
42]. Well-preserved fossil stromatolites from lake margins (
Figure 3c) attest to the low sedimentation rate and quiet depositional environment as well [
16,
43]. Climate-driven fluctuations in sedimentation rates undoubtedly occurred over the >5 million years of the lake’s existence, and the presence of numerous internal disconformities and paraconformities cannot be discounted but have not yet been identified.
Changes to more transpressional deformation along the plate boundary in the Pliocene resulted in uplift of numerous basement ridges in Otago and Southland, controlled by pre-existing Cretaceous structures [
44]. Erosion of the rising Otago mountain ranges in the Pliocene contributed abundant immature fluvial debris that eventually filled Lake Manuherikia (
Figure 4c), and regional uplift inverted parts of the lake basin as broad antiformal ranges grew beneath the site of the lake in the Quaternary (
Figure 4d) [
15]. Offshore sedimentary deposits, drilled in the Bounty Fan (
Figure 1), suggest that Lake Manuherikia intercepted most of the debris eroded from Southern New Zealand, to the east of the plate boundary, between 11 and 3 Ma [
13]. Coarse debris from rising mountains at the plate boundary to the west was transported via orogen-parallel rivers into the more proximal Waiau Basin (
Figure 4a–c) [
39,
44].
3. Models
One tool we can use to explore our hypothesis for subsidence is numerical modelling. We use three-dimensional mechanical modelling to explore uplift and subsidence patterns in strike-slip settings for a variety of boundary conditions and rheological scenarios based on the southern South Island. Our models are generic but designed to include certain features of the southern Australian/Pacific plate boundary in the Miocene. The models focus on larger-scale crustal structure and far-field plate tectonic driving forces. They are simplifications of a complex plate boundary aimed at unravelling components of the system. We do not attempt to recreate exact geometries, many of which are not well constrained for older time periods, but rather wish to explain why certain topographic features appear to have co-existed under certain far-field driving forces.
We start by modelling a symmetric strike-slip system with a block of weak lower crust across the centre of the model (
Figure 5a). We vary the orientation of the weak block so that it is orthogonal or oblique (±45) to the boundary. We then model an asymmetric strike-slip system, which more closely resembles the tectonic setting of the Southern New Zealand Australian/Pacific plate boundary in the Miocene when most of the deformation was taken up along the developing strike-slip Alpine Fault with some deformation extending out into the Pacific plate (
Figure 5b). It is the deformation extending into the Pacific plate that we are interested in.
Models were developed using the numerical code FLAC
3D Version 3.1 [
45]. FLAC
3D utilizes a modified Lagrangian finite difference technique and treats rock as a continua represented by average values of mechanical properties. The averages are defined by the size of the zones within the model, which, in this study, are on the order of km. When a force or velocity is applied to one or more of the model boundaries, the entire model grid and its constituent blocks will deform in a manner defined by the constituent rheologies. Deformation can be penetrative or will commonly localize into high strain zones which are either predefined zones of weakness (e.g., faults) or which develop during model runs. FLAC
3D treats these faults or shear zones as having continuous rather than discontinuous properties and our models are designed with this limitation in mind. FLAC
3D has been applied to many geological problems ranging from plate scale tectonics to consideration of material dynamics at the thin section scale and its use for solving geological problems is well established, see [
6,
46,
47,
48,
49].
Figure 5.
(a) Model set #1 geometry. Model is a two-layer crust, 30 km thick, overlying an elastic mantle with dimensions of 1600 km × 600 km × 50 km. Boundary conditions are imposed on the sides and on the base of the model, shown as black arrows. The width of strike-slip deformation zone at the base of the model is varied between 100 and 200 km. Models have an along strike strength variation with the mid-crustal section material of the central block being considerably weaker than the regions either side of it. The strike (shown by blue and green bands) and extent (shown by dashed lines) of the weak mid-crustal section are varied between the models; (b) Model set #2 geometry. Boundary conditions are asymmetric with a stationary backstop on the left hand side of the model and velocity conditions imposed on the right hand side and the base of the model. Strike of rheological variation is shown as in (a).
3.1. Model Crustal Rheology
Numerical modelling requires approximating the rheology of the material being modelled by a mathematical description of the stress/strain or stress/strain rate relationship. Our models employ a rheological model for the crust similar to the “jelly-sandwich” type [
50,
51], consisting of a pressure-dependent upper crustal material overlaying a Von-Mises plastic lower crust with flow parameters defined as an inverse function of temperature as calculated for a reference strain rate of 10
−14 s
−1 [
52,
53]. Although this rheological model is simplistic, it represents the overall structure of orogens remarkably well [
54] and has been employed by many modelling studies of the South Island [
26,
28,
55]. We model the mantle using an elastic rheology. The crustal rheology of the Otago schist block and the Canterbury region to the north have previously been defined by Upton and Koons [
26] and Upton
et al. [
6]. Using several lines of evidence, including (a) the presence of high grade schists exposed in Otago compared with low grade greywacke in Canterbury signifying considerably more pre-Cenozoic exhumation in Otago compare with Canterbury; (b) estimates of pre-collisional crustal thickness based on present-day crustal thickness at the edge of the continent being greater in Otago than Canterbury [
20,
21,
23]; and (c) consideration of thermal re-equilibration following Cretaceous thickening of the crustal pile in Otago and thinning of the Canterbury crust, they interpret strong thin (~20 km) crust in Canterbury compared with weak thick (30–35 km) crust in Otago, and their regional-scale model forms the basis of the simulation presented here. Recent work by Reyners
et al. [
25] suggests that Canterbury mid-crust is almost non-existent due to the presence of the subducted Hikurangi Plateau beneath all of Canterbury and implies an even stronger/thinner Canterbury block than previous proposed by Upton
et al. [
6] and we modify the models to take this into account giving Canterbury a crustal thickness of 15 km. The crust to the south of Otago is of a similar thickness to Otago [
22] but is stronger, and, thus, we model it using the same crustal strength profile as for Canterbury. Model parameters are listed in
Table 1.
Table 1.
Rheological parameters used in the models.
Table 1.
Rheological parameters used in the models.
| Region | Strong | Weak |
|---|
| Bulk Modulus (Pa) | 1 × 10¹⁰ | 1 × 10¹⁰ |
| Shear Modulus (Pa) | 3 × 10⁹ | 3 × 10⁹ |
| Density (kg m−3) | 2700 | 2700 |
| Cohesion | 10 MPa | 10 MPa |
| Friction angle (°) | 35 | 35 |
| 1 mid-crustal strength parameter kσ (Model set #1) | 1 × 10⁸–7 × 10⁸ | 1 × 10⁷–4 × 10⁷ |
| 1 mid-crustal strength parameter kσ (Model set #2) | 1 × 10⁸–7 × 10⁸ | 1 × 10⁷–4 × 10⁷ |
| Crustal thickness (Model set #1) | 30 km | 30 km |
| Crustal thickness (Model set #2) | 15 km (north), 35 km (south) | 35 km |
3.2. Geometry, Initial and Boundary Conditions (Table 1)
3.2.1. Model Set #1
The first set of models consists of a lithospheric block 50 km deep extending 1600 km along strike and 600 km across (
Figure 5a,
Table 1). A 300 km wide weak mid-crust is included in all the models of the set but its across model extent and its strike are varied (
Figure 5a). Strike slip boundary conditions are imposed such that a deforming zone runs down the centre of the model. We run two variations, one with a 100 km and a second with a 200 km wide deforming zone. The models have no initial topography and do not simulate surface processes. Velocity conditions of 12.5 mm/yr are imposed on each of the lateral boundaries, resulting in an overall relative velocity of 25 mm/yr.
3.2.2. Model Set #2
The second model set simulates an asymmetric strike slip setting and has crustal thicknesses that are based on Southern New Zealand (
Figure 5b,
Table 1). The eastern or right hand side of the model is pulled at a velocity of 25 mm/yr against the western or left hand side, which is kept stationary, simulating a backstop. As for Model set #1, a 300 km wide weak mid-crust is included in all the models, but based on Model set #1 results, we reduced the strength difference between the mid-crustal blocks (
Table 1) Its strike is varied as shown in
Figure 5b. The width of the deforming zone between the backstop and the rest of the model is varied. Initially all relative motion at the base of the models is constrained to occur on the interface between the backstop and the rest of the model. Then we model the relative motion at the base as distributed across 100 km, from the interface to the east.
5. Discussion
Both sets of models demonstrate that coincident subsidence and uplift, in the absence of releasing or restraining bends in the controlling fault, can result from purely strike-slip boundary conditions interacting with transitions from strong to weak to strong mid-crustal rheology. The pattern of subsidence and uplift that develop depends on the symmetry or asymmetry of the boundary conditions and the extent and orientation of the rheological transitions relative to the boundary conditions. Our model results do not depend on the peak stress residing in the mantle (“jelly-sandwich” model of lithospheric strength) rather than in the crust (“crème brûlée” model). A strong lower crust and weak mantle, such as recently proposed for the Mojave region in Southern California [
58], could produce subsidence as hypothesised here. In that case, the strong lower crust of the Mojave region would be playing the role of the strong mantle in our models (
Figure 2b), assuming a weak mid-crustal section above the strong lower crust.
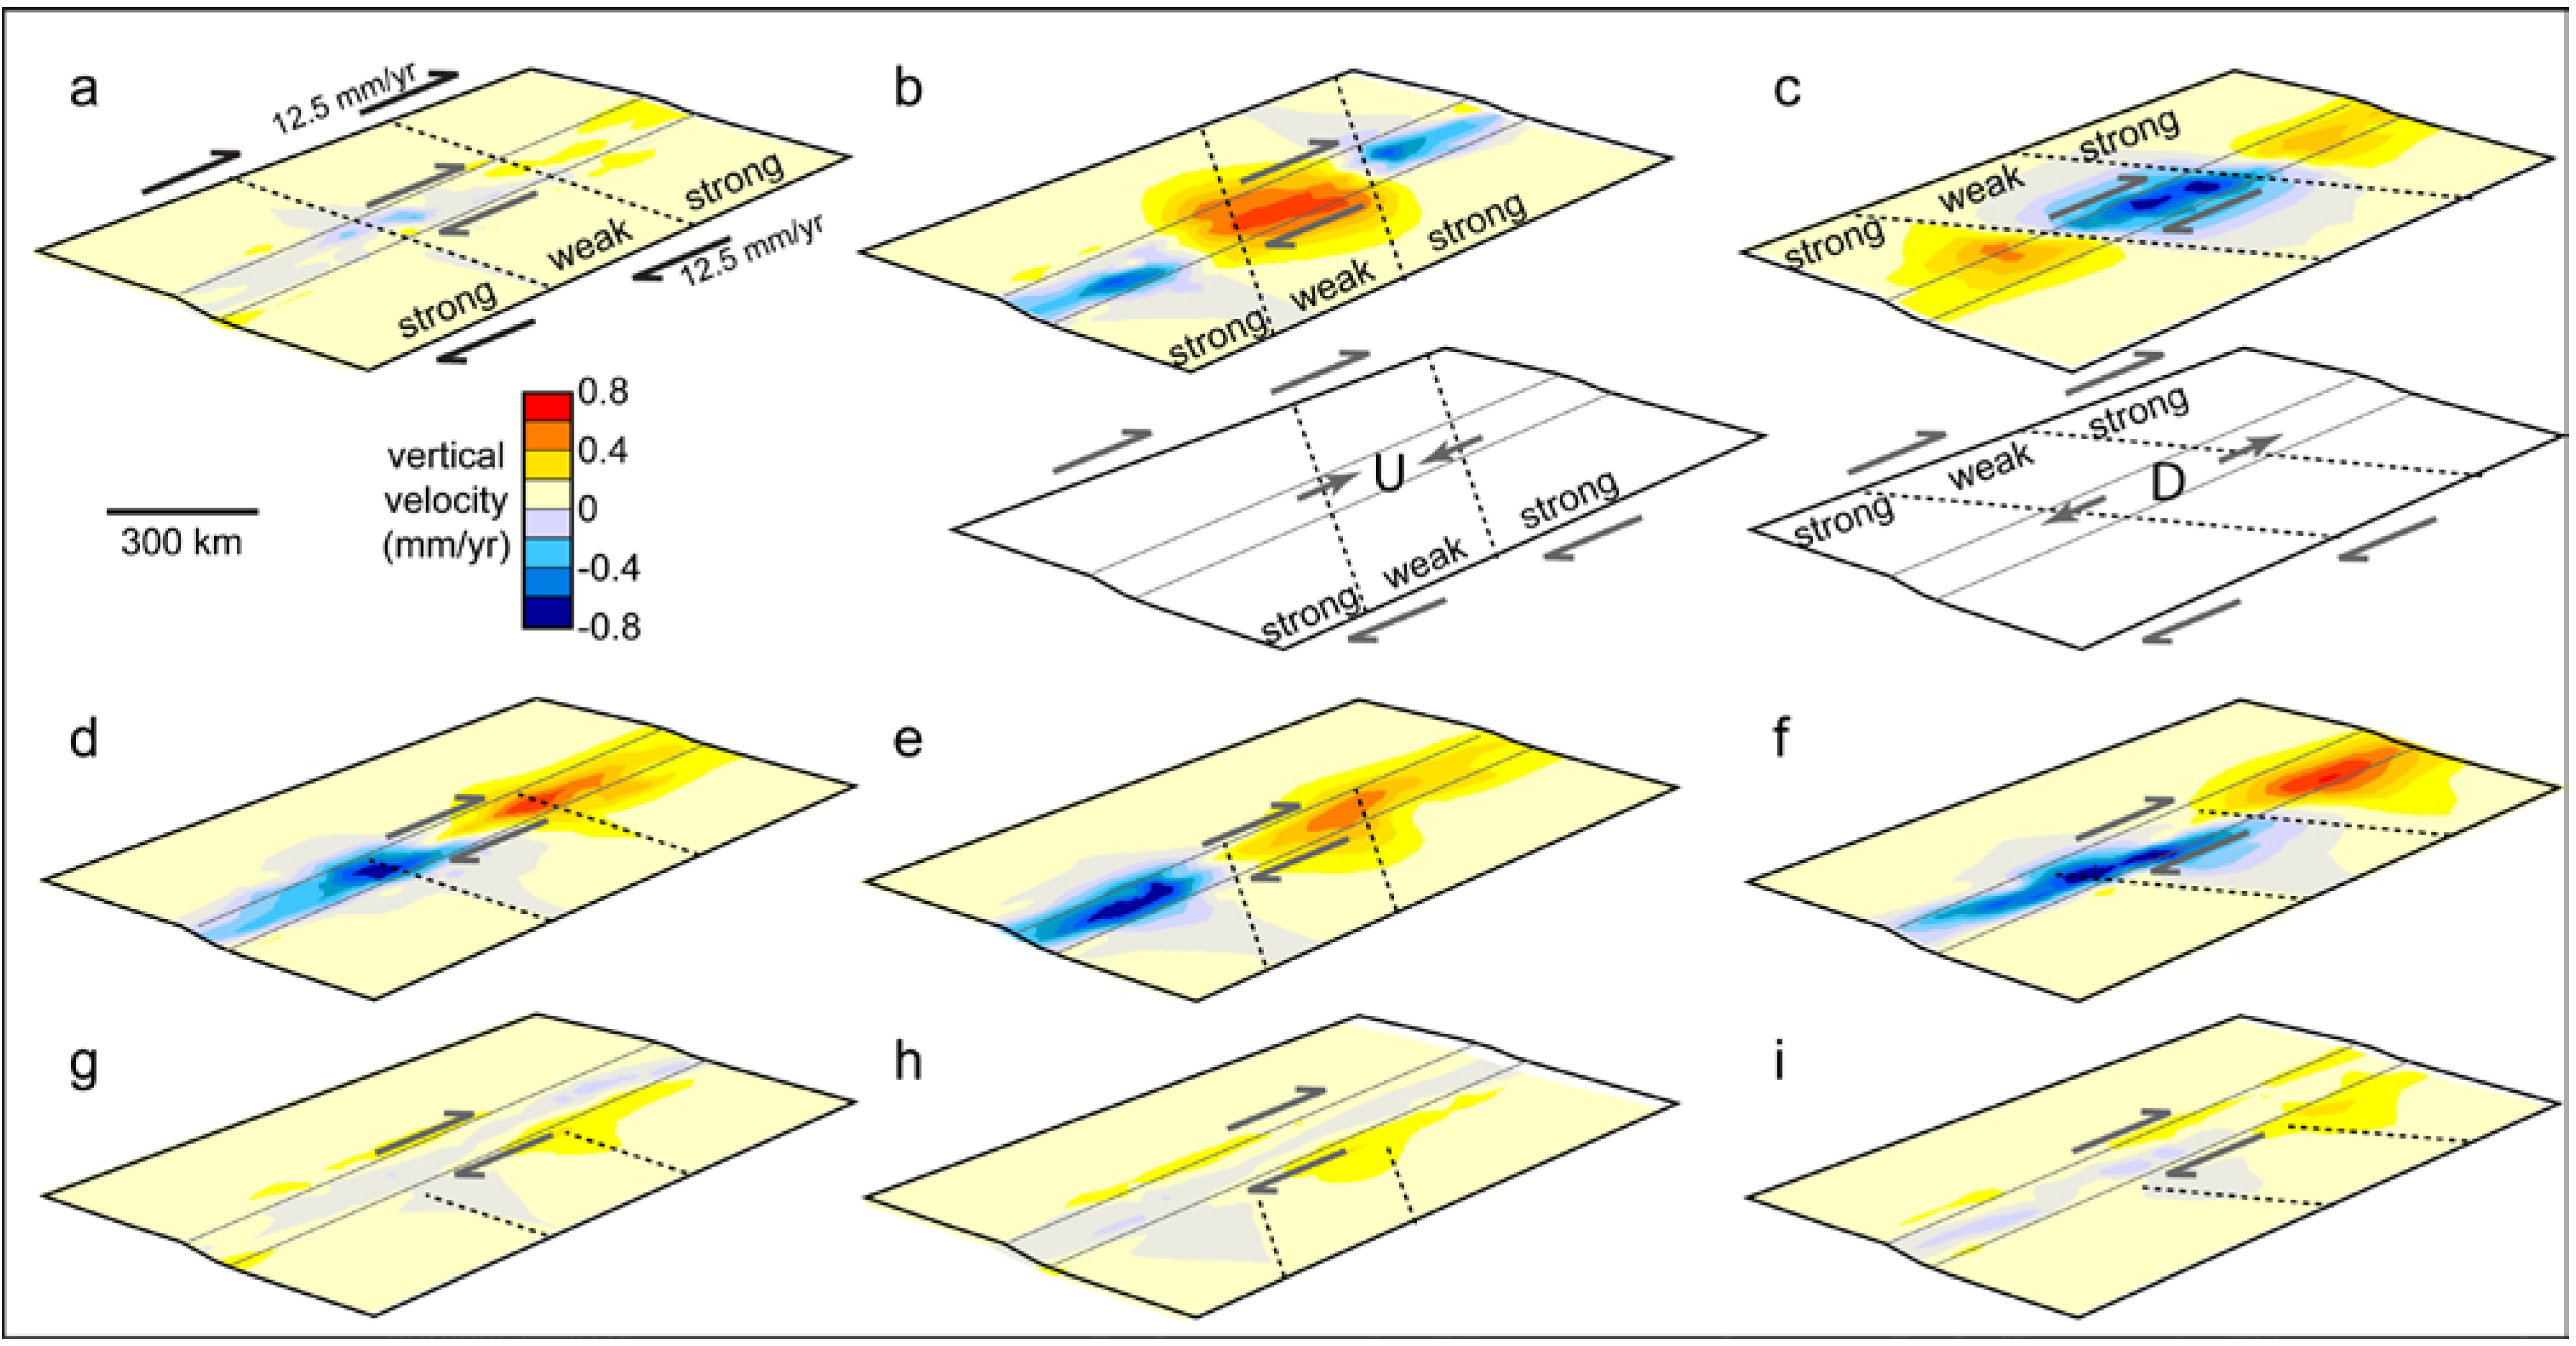
Model set #1 shows that for symmetric boundary conditions, vertical displacement is focused within the deforming zone and its form depends on how the rheological boundaries interact with the boundary conditions and hence the deforming zone. Rheological boundaries oblique to the boundary conditions produce either uplift or subsidence in the central region depending on how the rheological boundaries and the kinematic boundaries interact to distribute material.
The symmetric models do not produce vertical displacement distal to the main deforming zone of the model. In all cases (
Figure 6 and
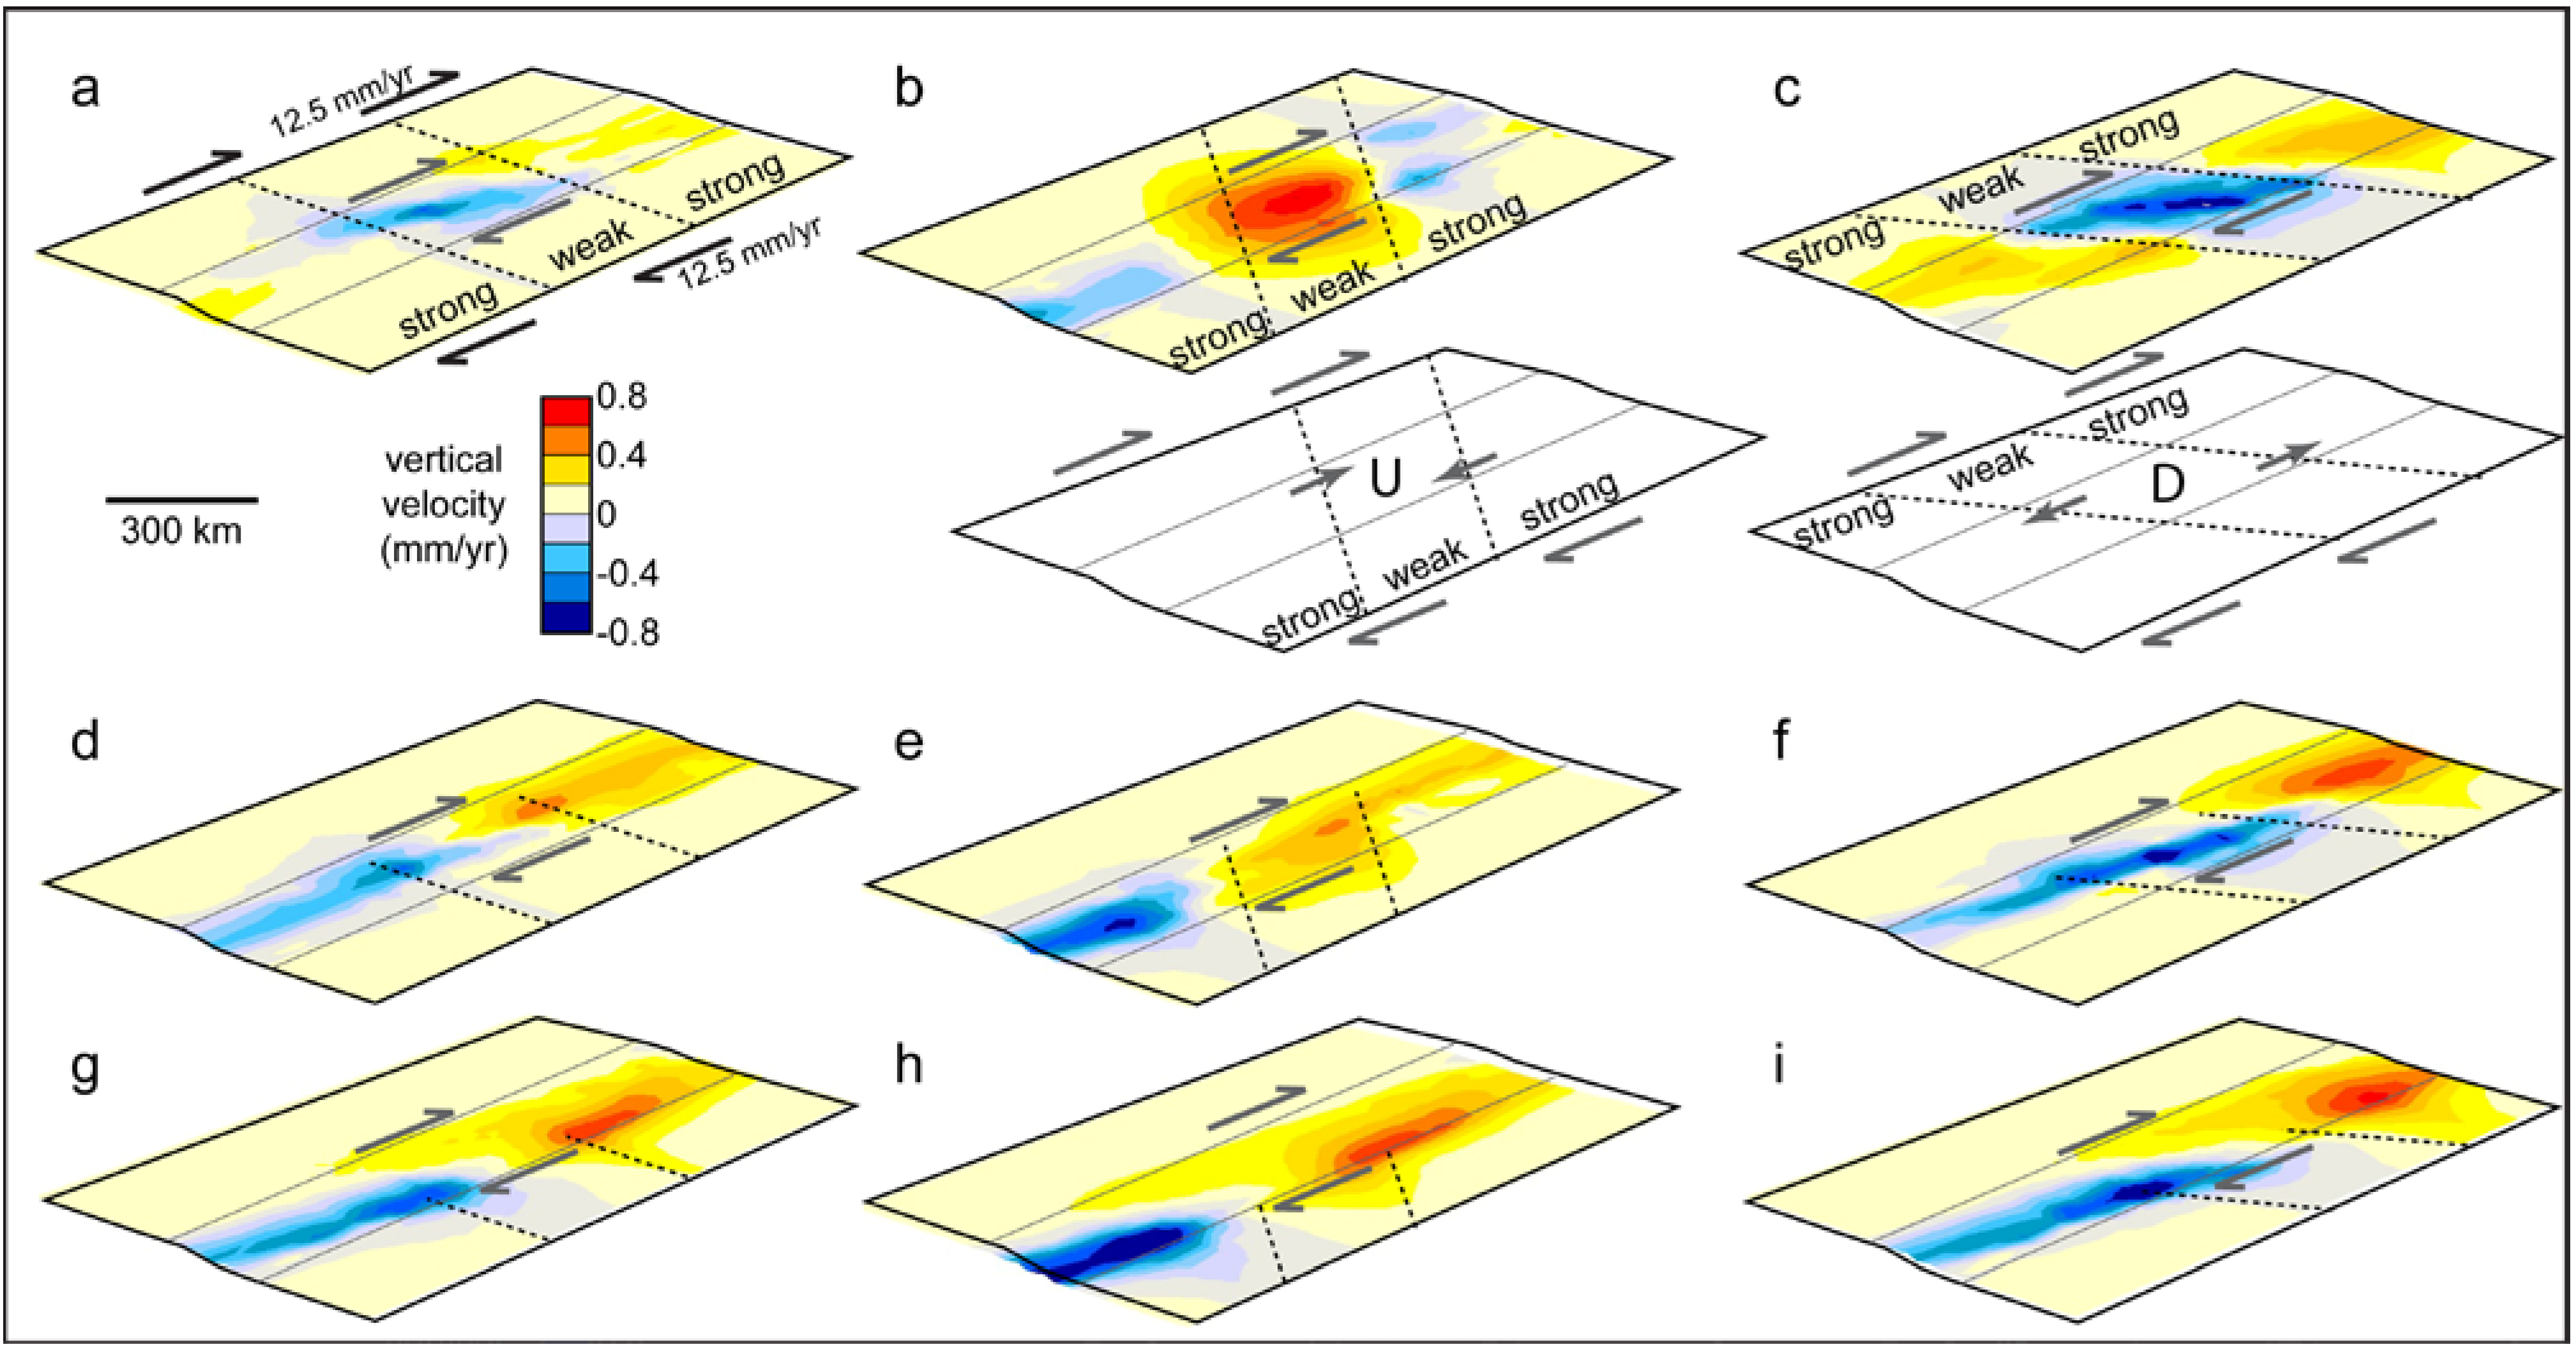
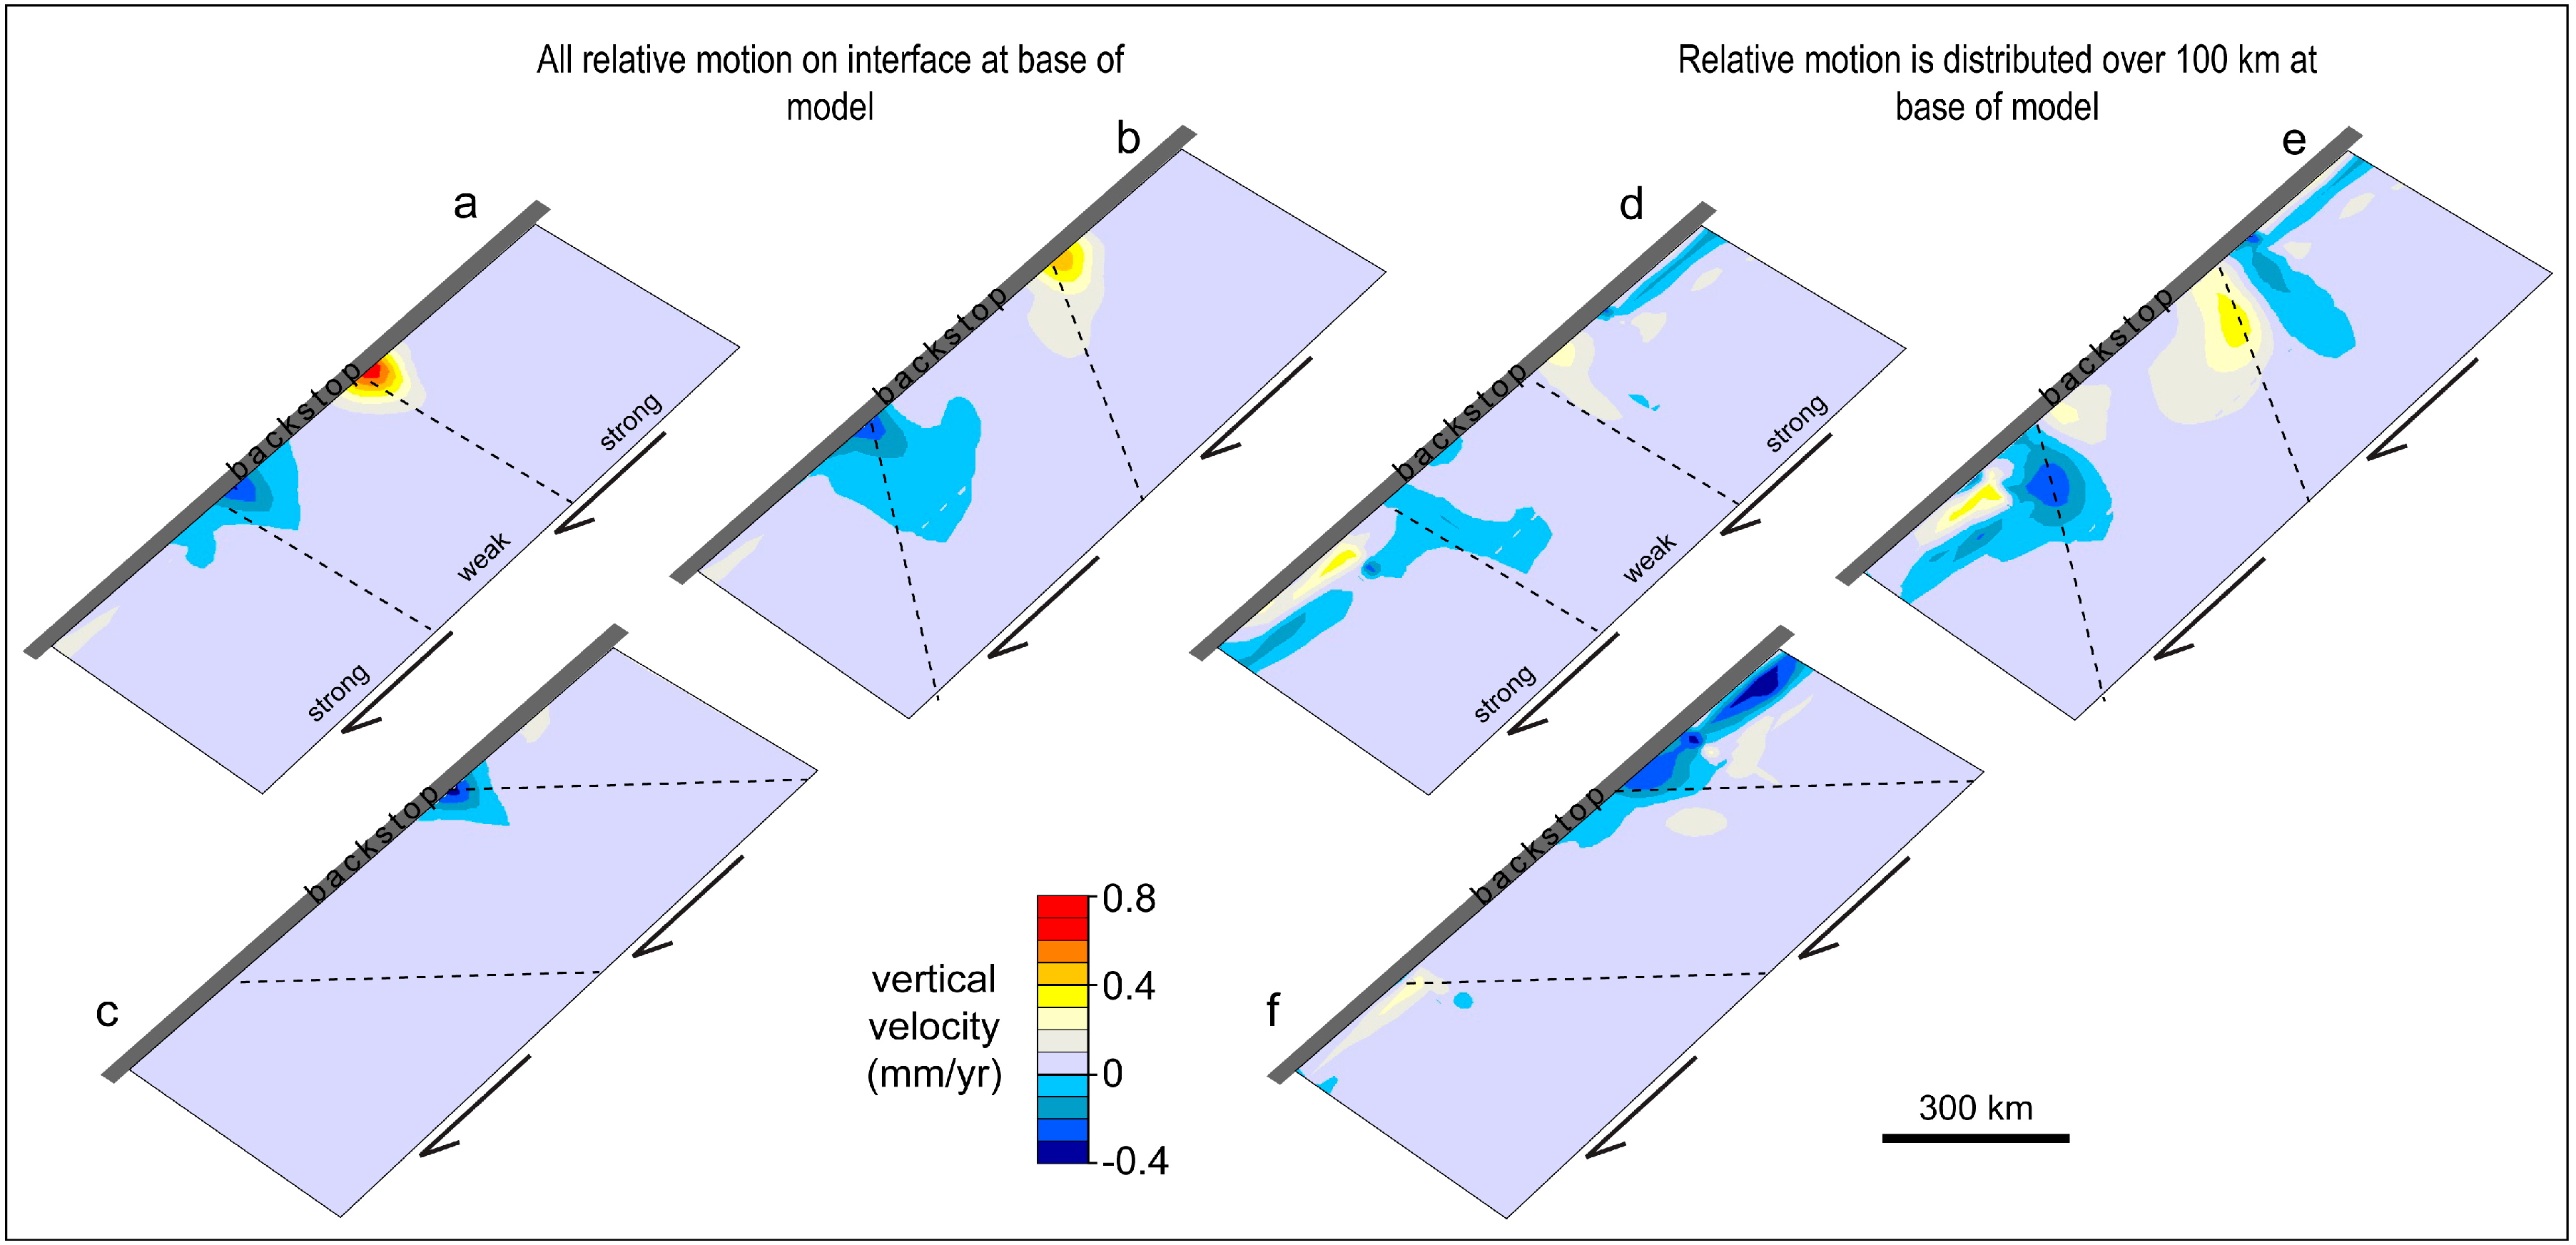
Figure 7), the uplift and subsidence predicted by the models are centred on the central deforming zone. Where the weak zone only extends across the eastern half of the models, some vertical displacement is observed off centre of the model but the majority is focused on the deforming zone. This is not the case for the asymmetric models. In Models 2a,b, a persistent region of subsidence develops above the transition from weak to strong mid-crust. It extends out >100 km from the boundary with the backstop, but the most rapid subsidence is located adjacent to the interface (
Figure 8a,b). In Models 2d,e, the persistent region of subsidence extends almost 200 km from the boundary and the greatest subsidence is located distal to the interface (
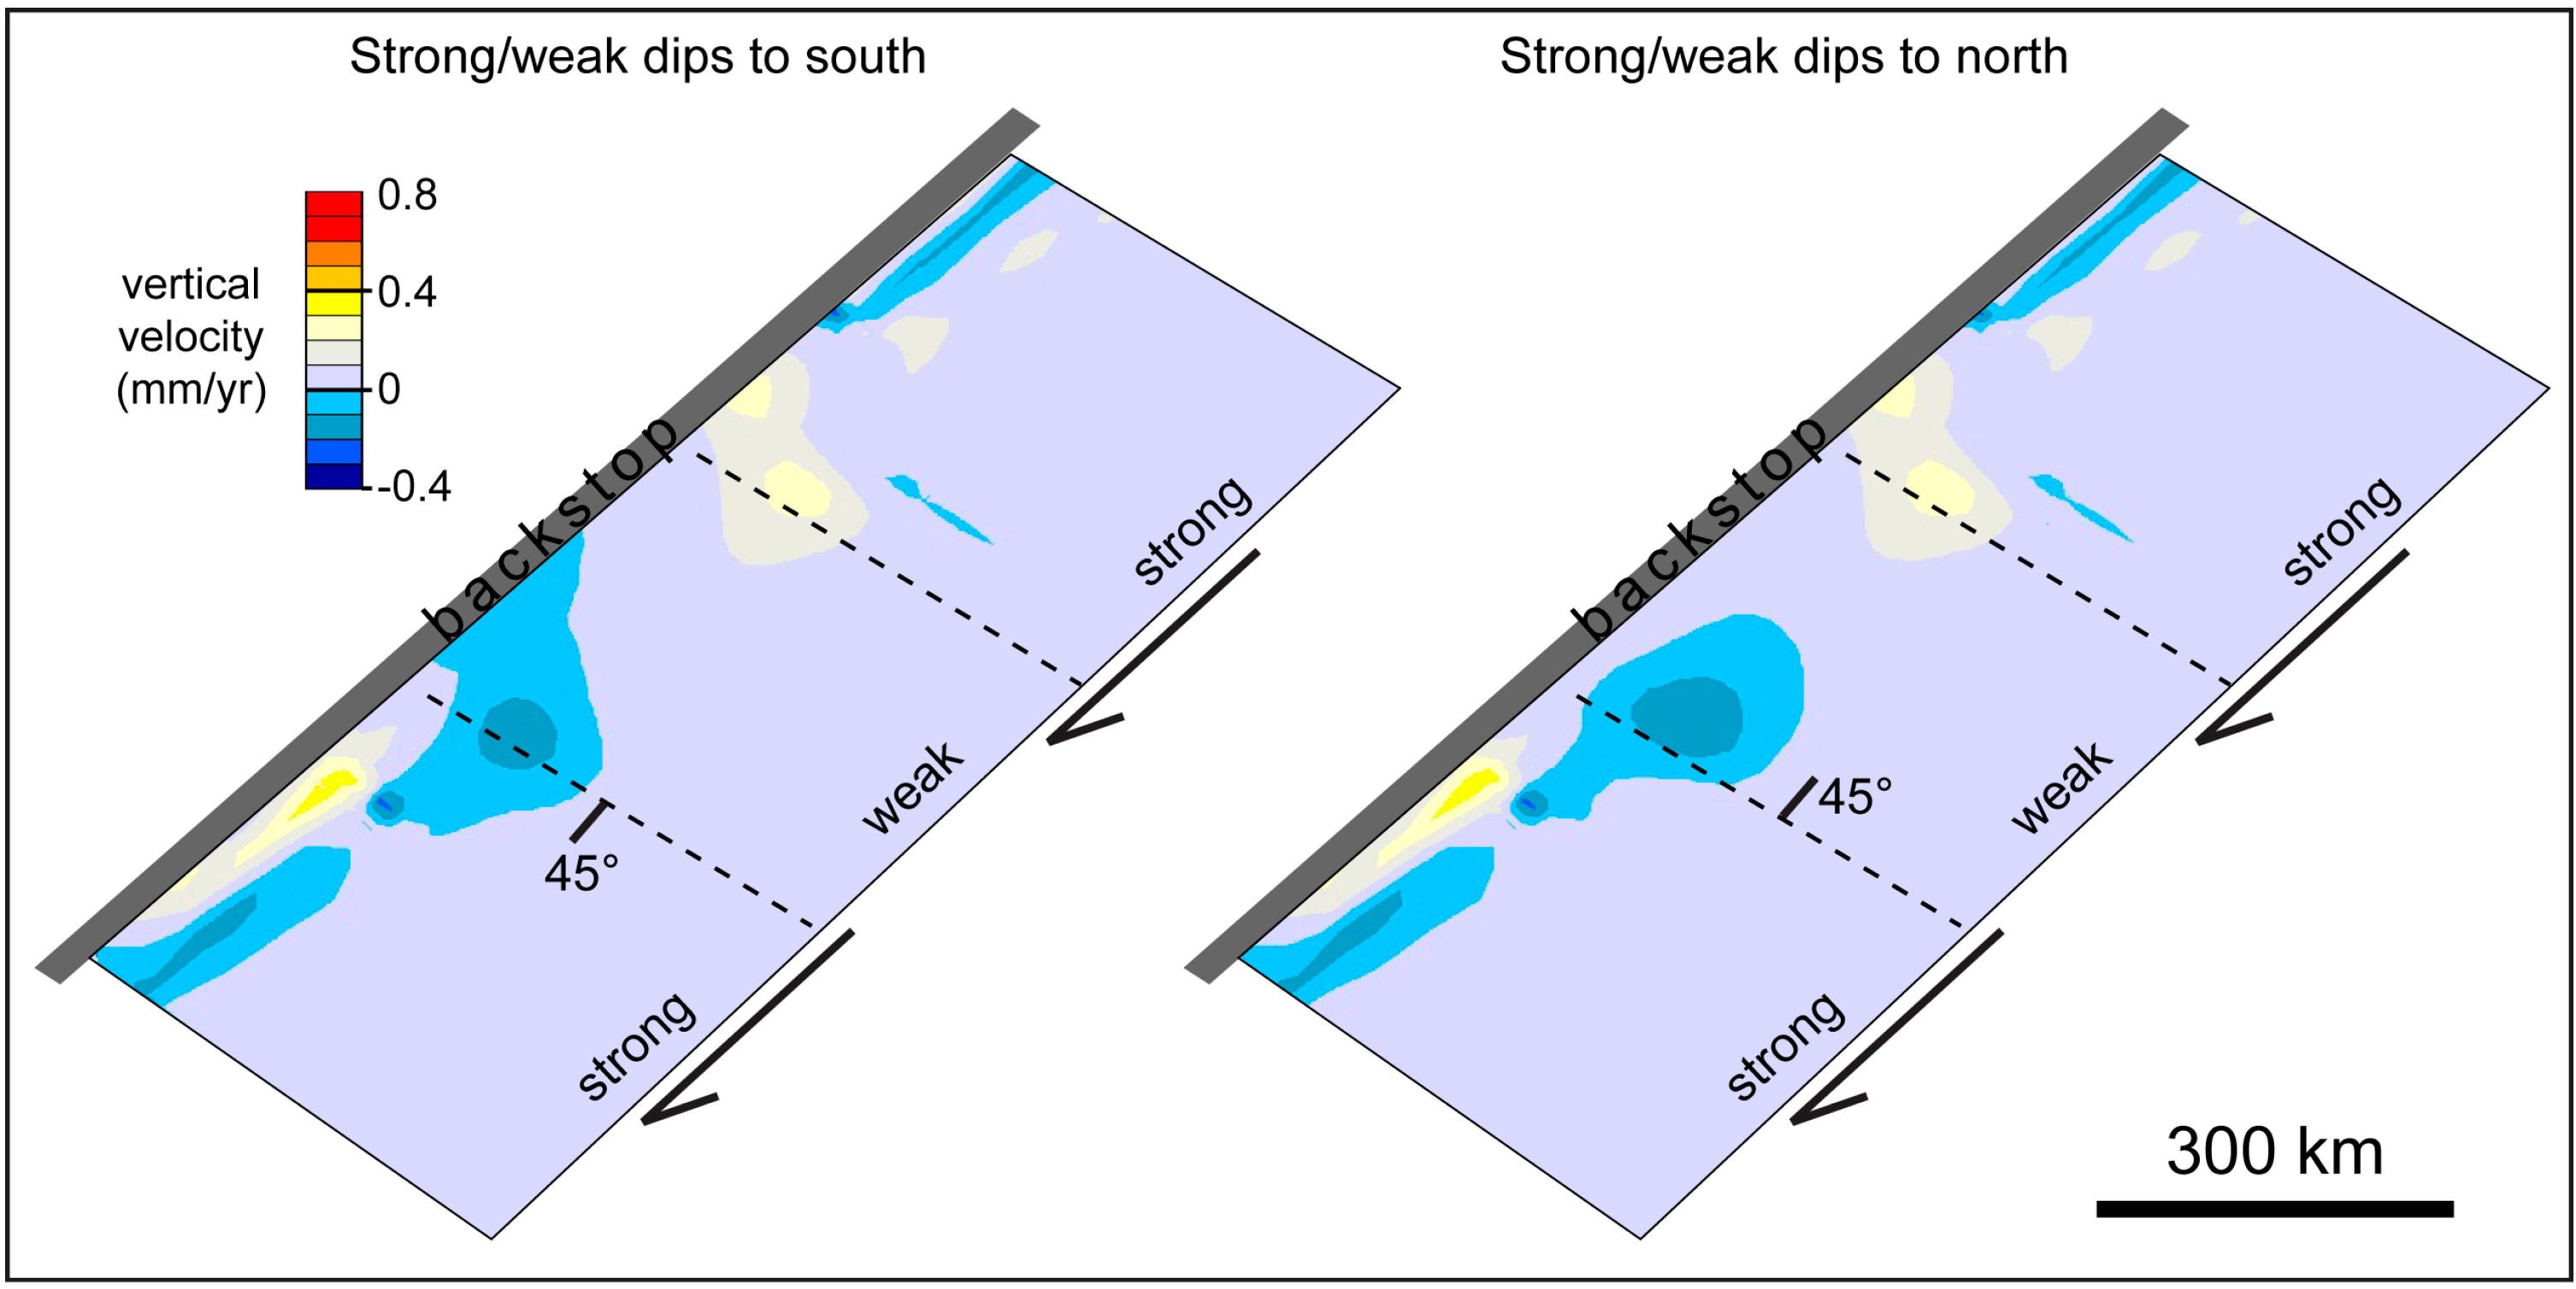
Figure 8d,e). The form of the region of subsidence varies with the strike and extent of the weak mid-crust but it a robust feature of models with a weak/strong transition that is perpendicular or acutely striking to the plate boundary (
Figure 8 and
Figure 9).
Models assume a relative plate motion of 25 mm/yr. Given this plate velocity, the models predict subsidence rates of generally <0.1 up to a maximum of ~0.2 mm/yr in the centre of the subsiding region. This corresponds to <1 km to ~2 km of tectonically driven subsidence over a 10 Ma time period. This value does not include an additional component of sediment loading. The maximum thickness of lacustrine sediments from Lake Manuherikia is poorly known because of subsequent deformation, but is on the order of 500 m [
13,
15]. In addition, the lake basin received up to 100 m of coarse fluvial debris in the Pliocene as nearby ranges rose [
14]. This sedimentary pile is a less than predicted by our models, but is not orders of magnitude different. Possible explanations include a more diffuse boundary between the Otago and Southland blocks which would spread out the subsidence, possible disconformities within the preserved lacustrine section or localised uplift interfering with regional subsidence as discussed below.
5.1. Localized Uplift During Regional Subsidence
While our models predict the large-scale observations of the first-order topographic development of the Southern South Island including the prolonged distal subsidence, there are features of the Otago/Southland paleogeography that the model cannot explain. These include localized uplift and volcanism along the East Otago Coast, and growing ranges in Southland starting in the Miocene [
44]. Diffuse volcanism occurred in East Otago from ~40 to ~11 Ma, and the large Dunedin Volcano was active from about 16–11 Ma [
41]. Hoernle
et al. [
59] suggest that the Miocene volcanism was caused by upwelling induced by small-scale lithospheric removal or detachment. It is likely that this upwelling was responsible for the mid-Miocene uplift rather than the evolving plate boundary to the west.
There is good stratigraphic evidence for coeval localised uplift and subsidence in Southland in the early Miocene. New basement ridges were shedding coarse lithic debris into subsiding lignite basins whose surfaces remained above sea level with fluvial sedimentation, but whose bases were, and still are, locally below sea level [
16]. Similar processes occurred at the boundary between Southland and Otago in the middle Miocene, where uplift of a basement ridge complex effectively separated Otago from eastern Southland drainage systems (
Figure 4b) [
14,
16,
44]. These second-order topographic features developed adjacent to reactivated Cretaceous faults, particularly the regional-scale Tuapeka Fault Zone (
Figure 2). These fine-scale pre-existing structures, which caused localised weakening of the crust, are too numerous and complex to be built into our models that are aimed at first-order topographic features only.
5.2. Significance for Offshore Sedimentary Basins
The source-to-sink concept has proved a useful tool when using offshore records to unravel the tectonic, climatic and other processes that shape the landscape with the goal of linking onshore drivers to the offshore record [
60,
61]. It has often been difficult to span long timescales with these studies because of the difficulty in reconstructing the landscape over long time periods. Comparison of our modelling results with interpretations of offshore records [
61] illustrates the importance of understanding a region’s tectonic, topographic, and fluvial history when studying terrestrially sourced oceanic records. The Otago region, the Clutha River, and the Bounty Fan, as shown through the cored record at Ocean Drilling Program Site 1122 (
Figure 1), provide a well-linked source-to-sink system over the past ~16 Ma.
Prior to hydroelectric development along its length, the Clutha River delivered ~2.9 Mt/yr of suspended sediment to the ocean [
62]. While a proto-Clutha River draining into Eastern Otago has probably existed through the Neogene, it is only in the last ~1 Ma that it has played such a large role in draining the Central Otago region [
39]. The core from Site 1122 on the levee of the Bounty Fan (
Figure 1), whose average sand composition closely matches that of the Clutha River [
61,
63], shows considerable variation in sedimentation rate over the last 16 Ma. From 16–11 Ma, sedimentation rate at this site was approximately 20 m/Myr. From the late Miocene to the Pliocene there is a hiatus in sedimentation, which has been argued to have resulted from a combination of decreased sediment supply owing to a combination of tectonic disruption of fluvial drainage and a simultaneous increase in bottom-current strength offshore [
61]. The tectonic disruption was the subsidence that led to formation of Lake Manuherikia in Central Otago (
Figure 4c). The lake trapped most of the sediment that was being shed from the slowly growing interior mountains, limiting discharge to the Bounty Fan (
Figure 1).
Sedimentation on the Bounty Fan picks up again in the Pliocene, with accumulation rates of ~100 m/Myr from 3.5 Ma to 1 Ma [
61]. Following the filling of Lake Manuherikia with sediment from the rising Pliocene mountains (
Figure 5d), sediment was once again being transported from central Otago to the Bounty Fan via the Clutha River. The sedimentation rate finally quadruples to ~400 m/Myr over the last 1 Ma, after cessation of the orogen-parallel drainage from the mountains along the plate boundary into the remnants of the Waiau Basin (
Figure 4d). At this time, the Clutha River became the principal channel for sediment transport from the plate boundary mountains to the sea in the east [
39].
6. Conclusions
Stratigraphic evidence from the Miocene of Southern New Zealand attests to the existence of two zones of subsidence during transcurrent tectonics: (a) a waning middle Cenozoic pull-apart basin, the Waiau Basin with proximal orogen parallel drainage; and (b) a distal and regionally extensive subsiding swamp and lake complex, Lake Manuherikia [
13,
14,
15,
16]. Unlike the Waiau Basin, the large area of subsidence filled by Lake Manuherikia developed distal and to the east of the strike-slip proto-Alpine Fault and was not the result of a releasing bend along the fault. This study addresses the origin of a distal subsidence near a strike-slip plate boundary using a multi-disciplinary approach including stratigraphic, structural, geophysical observations, and three-dimensional numerical modelling.
The Otago schist block is spatially coincident with the area inferred to have been undergoing subsidence in the Miocene and is characterized by a significantly weak lower crustal section than the regions to the north and south. Using the numerical modelling package FLAC
3D [
45], we built a series of models incorporating a block of weaker material to explore the controls on coincident uplift and subsidence pattern. We start by modelling a symmetric strike-slip system with a block of weaker crust across the centre of the model. We vary its extent and strike. These models produce both uplift and subsidence as a result of the rheology interacting with the imposed boundary conditions. Where the boundary conditions force strong material into weak, material uplift results. Conversely, when the boundary conditions force strong material to move away from weak, subsidence results as the weaker material decouples from the underlying mantle and is “left behind”. For the symmetric boundary conditions, vertical displacement is focused within the deforming zone and is thus not distal to the plate boundary as we infer for Southern New Zealand in the Miocene. The second model set simulates an asymmetric strike slip setting, similar Miocene New Zealand. These models produce subsidence for two cases, when the rheological boundary is orthogonal to the plate boundary and when it is angled in the direction of the relative motion. When relative plate motion is all focused at the base of the model on the interface between the two plates, the maximum subsidence is predicted to occur adjacent to that interface. However, when the basal boundary condition distributes the relative motion over a width of 100 km, the locus of maximum subsidence is shifted distal to the interface. For a relative plate motion of 25 mm/yr, the models predict tectonically driven subsidence rates of ~0.1 mm/yr, which corresponds to ~1 km of subsidence over 10 Ma. These rates are more rapid but comparable to those from Southern New Zealand. The maximum thickness of sediments that accumulated in and beneath Lake Manuherikia is poorly constrained because of subsequent deformation but is on the order of 500 m.
Our models predict the first order observation of prolonged subsidence distal to a strike-slip plate boundary but there are features of the paleogeography that these models cannot explain. The first is localized uplift and volcanism along the East Otago Coast that resulted from upwelling induced by small-scale lithospheric removal or detachment. Secondly, stratigraphic evidence suggests coeval localized uplift and subsidence in Southland in the early Miocene and at the Otago/Southland boundary in the middle Miocene. These second-order topographic features overprint the regional subsidence and developed next to reactivated Cretaceous faults. These pre-existing structures weakened the crust locally but were not included in our model, which was focused on the regional signal. Offshore sedimentation rates from ODP (Ocean Drilling Program) site 1122 on the Bounty Fan record a hiatus in sedimentation from the late Miocene to the Pliocene. Lake Manuherikia, formed from subsidence controlled by crustal rheology and a strike-slip plate boundary, trapped most of the sediment that was being shed from slowly growing interior mountains, limiting sediment supply to the Bounty Fan during that time period.


 = Aσne(−Q/RT). A is a pre-exponential factor, σ is the differential stress (MPa), n is the power-law exponent, Q is the activation energy, R the universal gas constant and T is temperature (K). A, Q and n are determined from extrapolation of laboratory creep experiments on wet synthetic quartzite [56]. A = 6.5 × 10⁻⁸ MPa−n s−1; Q = 135 KJ mol−1; n = 3.1. In the lower crust the rheology is that of diabase, A = 2 × 10⁻⁴ MPa−n s−1; Q = 260 KJ mol−1; n = 3.4 [57]. kσ is determined from the calculated differential stress, kσ = 0.5σ.


