1. Introduction
The Neolithic period in Europe is widely considered as an important period because migrant hunters and gatherers gave way to permanent agrarian societies preoccupied with the cultivation of food-crops and animal husbandry for sustenance. Neolithic dwellers conceptualized their surroundings for the first time in durable architectural forms as a community in flat extended settlements, but most notably on large habitation mounds—or combining the above two.
The southern Balkan Peninsula served as a gateway for the Neolithization of Europe [
1]. In particular, early farming communities appeared on an extensive scale in Thessaly, Greece and provided the seeds for a new cultural landscape. The early chronology and high density of Neolithic tell-settlements (locally called
magoules) make Thessaly a key area for understanding the pathways in which the Neolithic emerged and spread towards the continent.
In consideration of the significance of the region, the IGEAN (Innovative Geophysical Approaches for the study of Early Agricultural villages of Neolithic Thessaly) (
http://igean.ims.forth.gr) [
2] project investigated the intra-site patterns of Neolithic settlements using a suite of multi-scalar geospatial methodologies. Furthermore, the project surpasses conventional remote sensing studies, deviating from the recent multi-sensor practice and adopting a manifold approach [
3]. As a result of this strategy, Thessaly now provides a wide range of instrumental datasets and makes it possible to pose key questions related to: potential geographical factors behind the establishment of early farming communities, the spatial development of agriculturalist villages, the variations in the use of space and land-use patterns, the internal organization of structures, the differences in types of settlements, and the functions of settlement enclosures.
The IGEAN Project focused on numerous prehistoric sites in Thessaly. Due to the nature of geospatial practice, it is rarely possible to determine exact periods of habitation. In order to have better chronological control over archaeological information inferred from geospatial data, this paper solely focuses on five settlements with only Early Neolithic and Middle Neolithic habitation phases. Among these sites, Almyros 2, Karatsantagli, Perdika 2, and PerivleptoKastraki 2 are dated to both periods, whereas Kamara is dated only to the Middle Neolithic.
2. Background
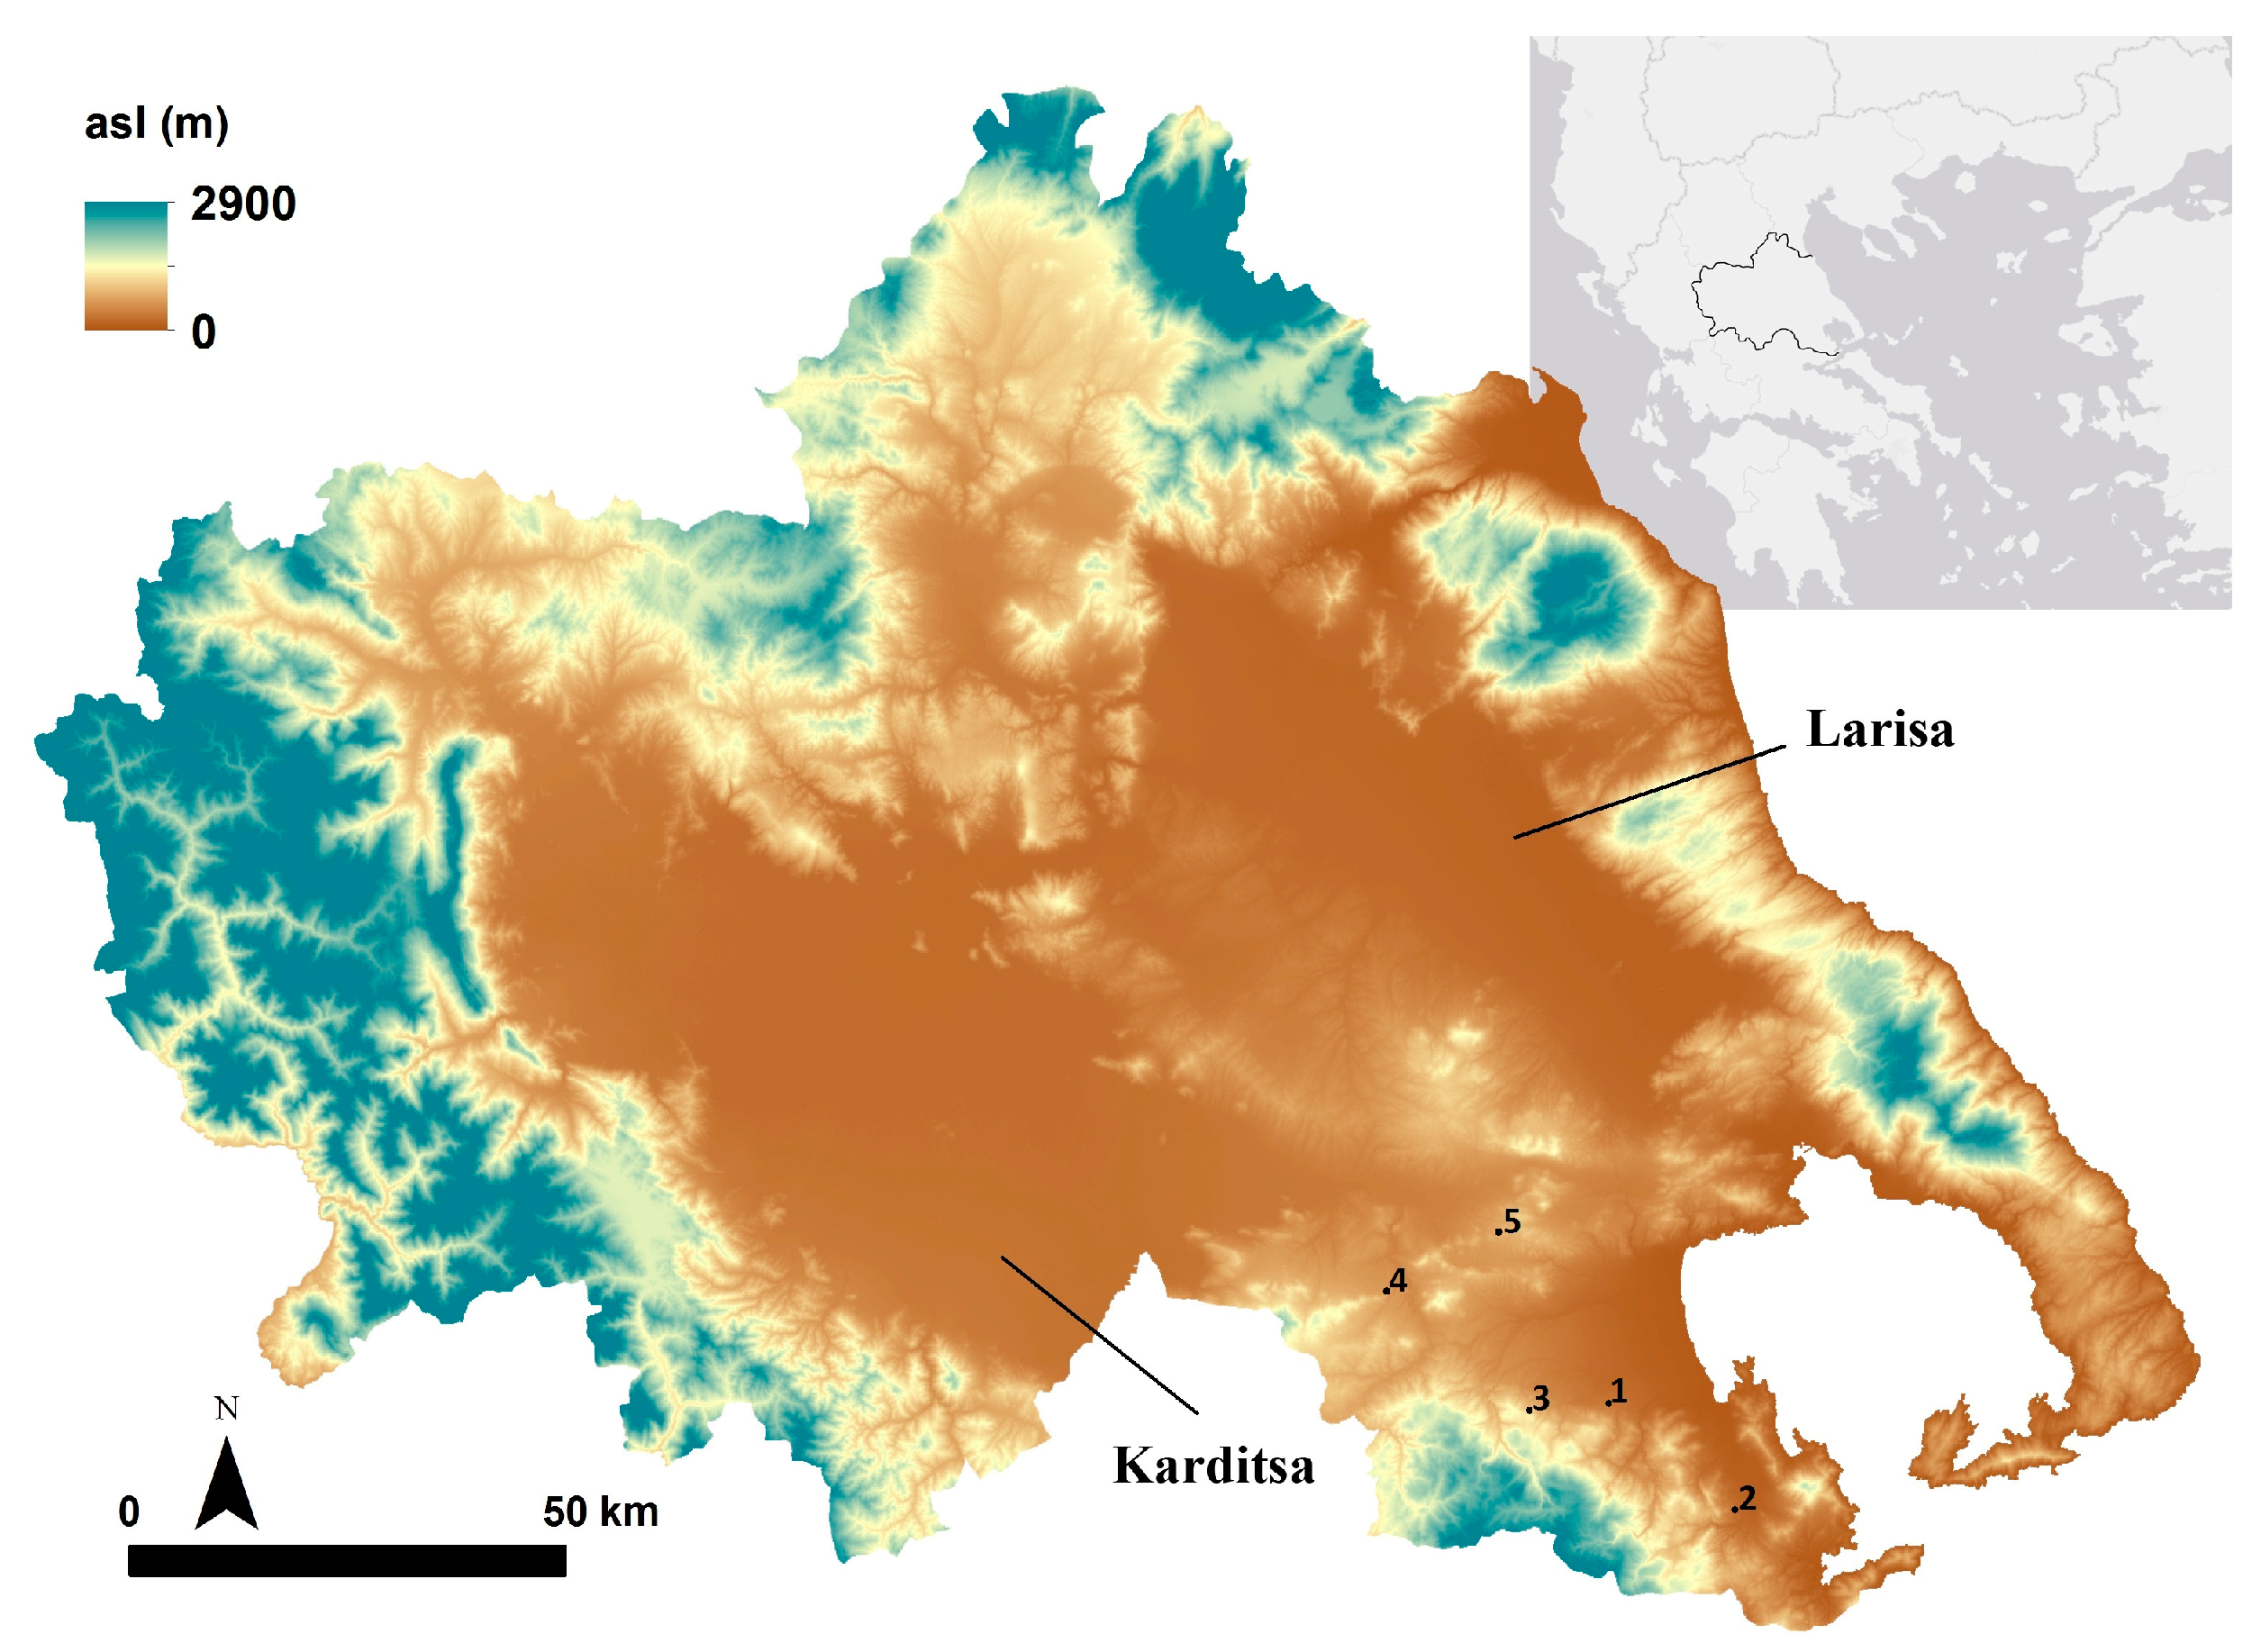
Thessaly is a lowland area located in Central Greece (
Figure 1). It isa closed geographic region with mountainous borders on three sides. Karditsa Basin in the west and Larisa Basin in the east cover most of Thessaly [
4]. These major basins are elongated in northwest–southeast and are divided by low ridges. Sometime during the Plio-Quaternary, lakes filled in the submerged basins, but the land was eventually formed again with uplifting. Despite its dynamic tectonic evolution, Thessaly is a relatively smooth-relief area. Specifically, in Larissa Basin, the maximum altitude difference does not exceed 50 m [
5].
The Pineios River is the bearer of the active hydrographic network of Thessaly. It runs about 200 km and empties into the Aegean Sea while forming a delta [
6].The Pineios River and its tributaries have been important features in shaping the landscape and the human activities since the prehistoric times; alluviation as well as periods of pedogenesis must have heavily affected the locations of prehistoric habitations [
7]. In consideration of episodic floods for every 25 to 50 years [
6], one can further argue that the Pineios River had greatly influenced agricultural production since the onset of early farming communities.
Thessaly contains remarkable evidence of continuous habitation in all phases of the Neolithic period, mainly in the form of
magoules of which almost 350 have been identified to date. These habitation mounds have attracted the interest of scientific inquiries since the beginning of the twentieth century. The major source of information is due to the early excavations carried out at Sesklo and Dimini [
8]. Wace and Thompson [
9] added further scholarly contributions and their work is still widely referenced today. This fortunate and early initiation of scientific work, however, also created a “Thessalocentrism”, transforming Thessaly into a homogenous cultural core and currently shaping the archaeology of neighboring regions [
10].
During the 1980s (and onwards), the research in Neolithic Thessaly was geared towards the identification of new sites, understanding environmental contexts, and constructing settlement patterns. Halstead [
11] suggested that Neolithic settlements were established within a wide range of micro-environments, rather than on exclusively arable lands. Gallis [
12] produced the first catalogue of the
magoules and provided information about their physical characteristics, extent, and chronological framework. The analysis carried out by Van Andel and Runnels [
13] proposed that Neolithic communities were built on floodplains in order to take advantage of spring floodwater farming. Perlès [
1] examined the distribution of Early Neolithic sites and argued that they were not concentrated near water sources, but instead were clustered in territories, resulting in variations in site densities as well as distances between sites.
A rejuvenated approach to Neolithic Thessaly has been emerging around the discussions on formation of agencies [
14], detecting complexities in social organizations [
15], and negotiating identities [
16]. These studies make use of existing rich datasets thanks to the long research history of the Neolithic Thessaly while providing in-depth discussions on Neolithic praxis. Recent advancements in computational technologies tacked with theoretical paradigms also provide means for an understanding of the everyday life in Neolithic Thessaly [
17].
3. Aims
Within a new scientific framework of investigating Neolithic cultures, the GeoSatReSeArch Lab of the Foundation of Research & Technology, Hellas (FORTH) initiated from 2013 to 2015 a multi-year geophysical and remote sensing campaign to study the physical landscape and living dynamics of Neolithic settlements within the coastal hinterlands of eastern Thessaly. The IGEAN project is the first systematic and extensive geophysical survey of Neolithic magoules in Thessaly. A suite of innovative multi-technique (manifold approach), multi-sensor geophysical instruments and geospatial technologies (magnetometry, ground penetrating radar (GPR), electromagnetics, Remotely Piloted Aerial Systems (RPAS), and historic aerial imagery as well as very high resolution satellite data) has revealed massive information related to the spatial characteristics of Neolithic settlements. It is anticipated that the results of this study will assist to achieve further archaeological inferences. The focus of this study is two-fold. Methodologically, it shows the importance of following manifold geospatial approach to draw a complete or close-to-complete picture of past habitations. The claim is that only using various sensors/approaches the actual settlement biographies can be achieved. Deploying a single type of sensor/techniques (ground-based, airborne, or space-borne) may not only provide deficient information, but it may also lead into erroneous inferences about the past use of space.
From an archaeological point of view, the study aims to reveal significant spatial variations between Neolithic settlements while emphasizing peculiar commonalities in the Neolithic use of space. This holistic approach is an important step towards a better understanding of everyday life in Thessalian farming communities. These differences and shared traits can only derive through an integrated geoinformatics methodology that has advantages over traditional excavations.
4. Methodology
4.1. Aerial Photography and Satellite Remote Sensing
For the broader exploration of prehistoric settlements and the documentation of their environmental contexts, the IGEAN Project employed satellite and aerial remote sensing. Very high-resolution (VHR) data from GeoEye-1 and WorldView-2 platforms covered the target sites. The spatial resolution of these sensors (panchromatic: ~0.5 m and multispectral: ~2.0 m) enables the detection of small details on the ground. Following the orthorectification process, pansharpeningfurther increased the spatial resolution of multispectral bands for a more detailed representation of sites and their immediate surroundings.
In addition, 26 historical aerial photographs were acquired from the Hellenic Military Geographical Service (GYS). Historic imagery was georeferenced using available higher accuracy spatial data. Furthermore, the IGEAN Project also used the orthophotography archive of the National Cadastre and Mapping Agency (Ktimatologio). These images covered the time spam between 2007 and 2009.
A Droidworx CX4 RPAS (Remotely Piloted Aerial System), also referred as UAV (Unmanned Aerial Vehicle), was used for the acquisition of visible light imagery of Neolithic settlements. Moreover, thanks to the capability of collecting data from the near-infrared portion of the electromagnetic spectrum, the system provided information on archaeological proxy data. Finally, high-resolution high-accuracy digital elevation models (DEMs) of settlements created from the RPAS assisted in making archaeological interpretations and broader inferences.
4.2. Geophysical Prospection
The manifold geophysical research of the IGEAN consists of single and multi-sensor geomagnetic prospection, Ground Penetrating Radar (GPR) surveys, and multi frequency Electromagnetic Induction (EMI) investigations. Details of instrument sampling parameters and approximate depth of investigations are given in
Table 1. The integrated approach drastically increases the efficiency of detection of subsurface archaeological features, and thus, provides a more complete picture of past occupation [
18].
Sensorik & Systemtechnologie (SENSYS) MX Compact Survey System was used for the geomagnetic data collection. The SENSYS MX is a multi-channel measurement system equipped with FGM600 magnetometers. The selected sensor configuration was an 8-sensor setup with 50 cm separation in order to optimize between prospection coverage and investigation resolution. A Javad Triumph 1 Global Navigation Satellite System (GNSS) receiver was used for the positioning of the multi-channel system. A custom data processing methodology was developed for the analysis of magnetic data [
19].
The rugged Mediterranean topography does not always make it possible to conduct a geomagnetic survey with a wide array system. Tall and sturdy bushes, orchards, vineyards, and rock outcrops create obstacles so that it is sometimes necessary to employ single sensor gradiometers. Bartington G601 gradiometers replaced the SENSYS MX array when such challenging areas were encountered.
For the GPR data collection, a Noggin system with a 250 MHz antenna was used. For the prospection, grids were designated to the areas of interest and data were collected in parallel transects. Data were recorded along each line of every grid with a constant step of 0.025 m, along parallel transect 0.5 m apart. The transects that derived from GPR were processed using EKKO View Deluxe, GFP Edit4, EKKO Mapper4, and EKKO Project 2 by Sensors and Software.
A broadband multi-frequency Geophex GEM-2 electromagnetic sensor was operated at five different frequencies (5010, 13,370, 22,530, 31,290, and 40,050 Hz). The instrument is carried at a height of approximately 0.3 m above the ground surface. The acquisition frequency was set to 1 Hz. A custom-built Python script allowed the transformation of the EM data into magnetic susceptibility and electromagnetic conductivity based on vertical electric sounding (VES) measurements for instrument calibration [
18].
5. Results
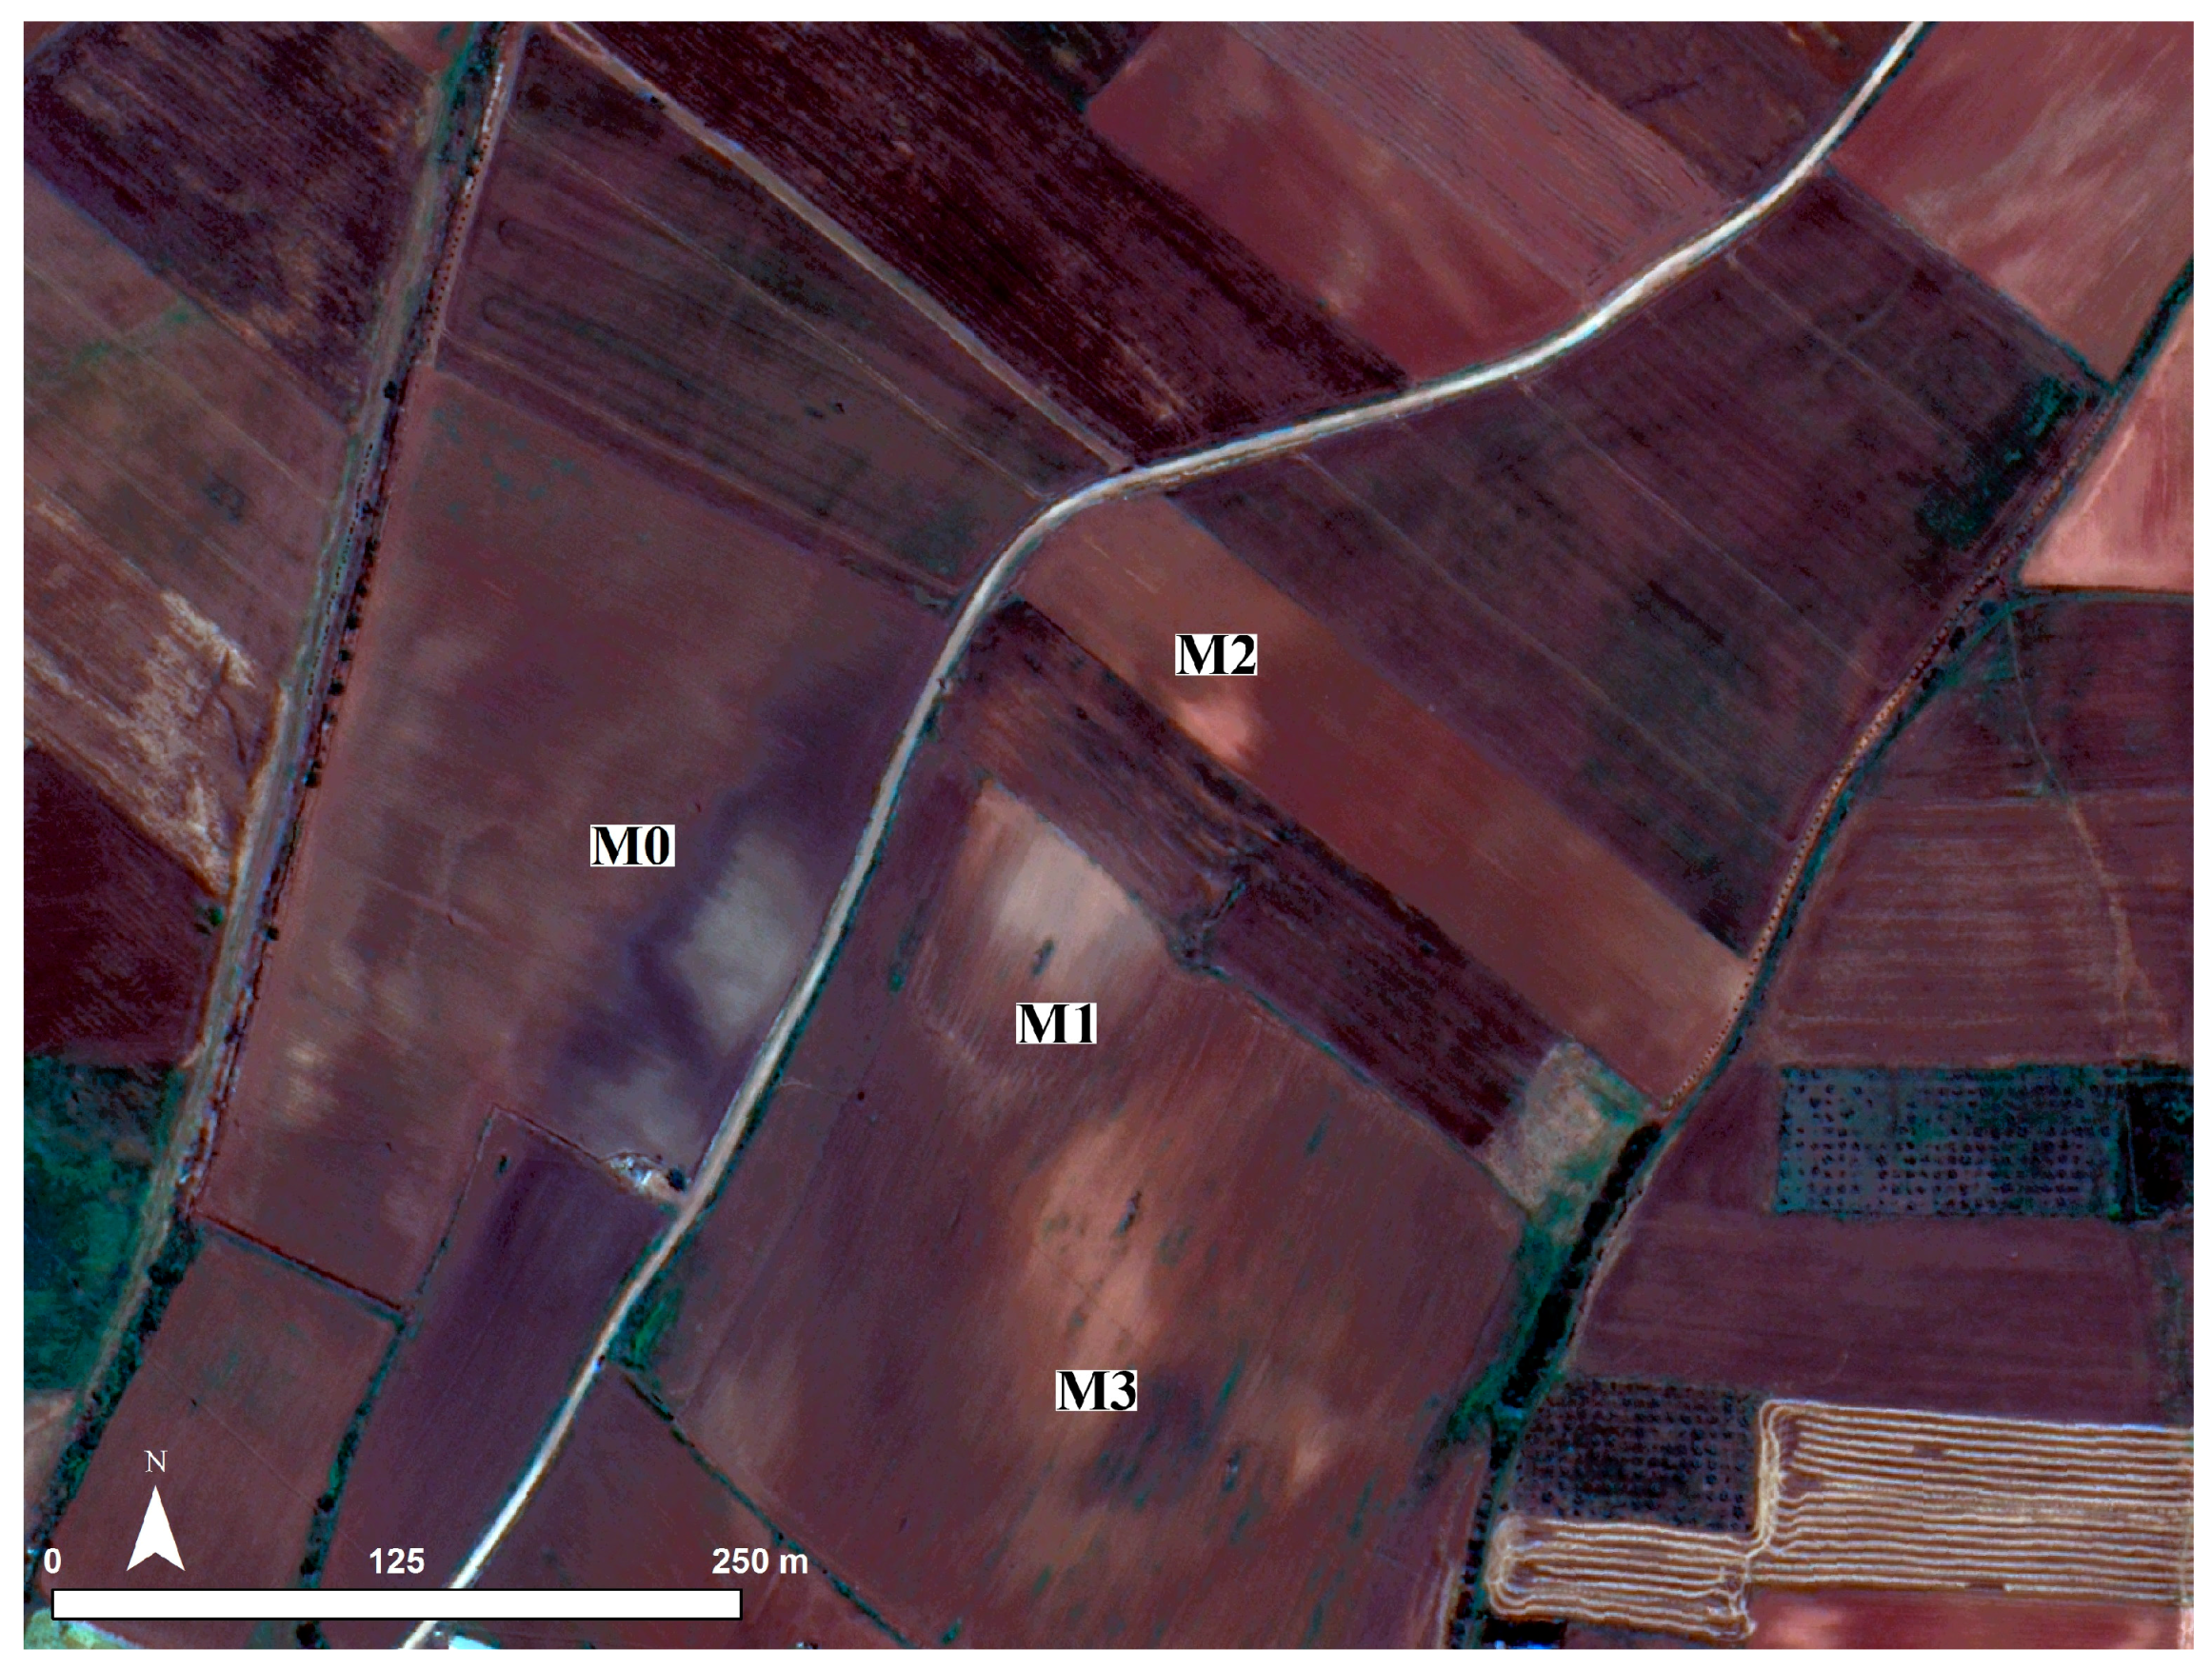
5.1. Almyros 2 (22.736° E, 39.168° N)
The WorldView-2 image (acquisition date: 4 June 2012) reveals four major soil marks related to the site (
Figure 2). M0 is located to the east of the proposed location of the settlement. It may be due to past human activities. The grey colored patch is surrounded by a darker rectilinear feature in the west and the south. Due to the sharp turn it makes, this feature is less likely to be related to a Neolithic ditch, but later occupational phases cannot be ignored. M1 represents the extent of Almyros 2. The brighter core of M1 overlaps with the core of the settlement and the circular shape of the soil mark coincides with the extent of the site. At a first glance, M2 seems to be unrelated to M1. However, geomagnetic survey (see below) suggests M2 was also bounded by a settlement enclosure, and thus, must have been of anthropogenic origin (suggesting two neighboring tell sites?). To the south of Almyros 2, M3 has also the potential to represent past human activity. On the other hand, the geomagnetic survey results over M3 indicate the opposite, and, thus, M3 must be a natural soil formation. These two opposing cases between M2 and M3 marks suggest the need for the cautious interpretation of aerial and satellite imagery of archaeological features.
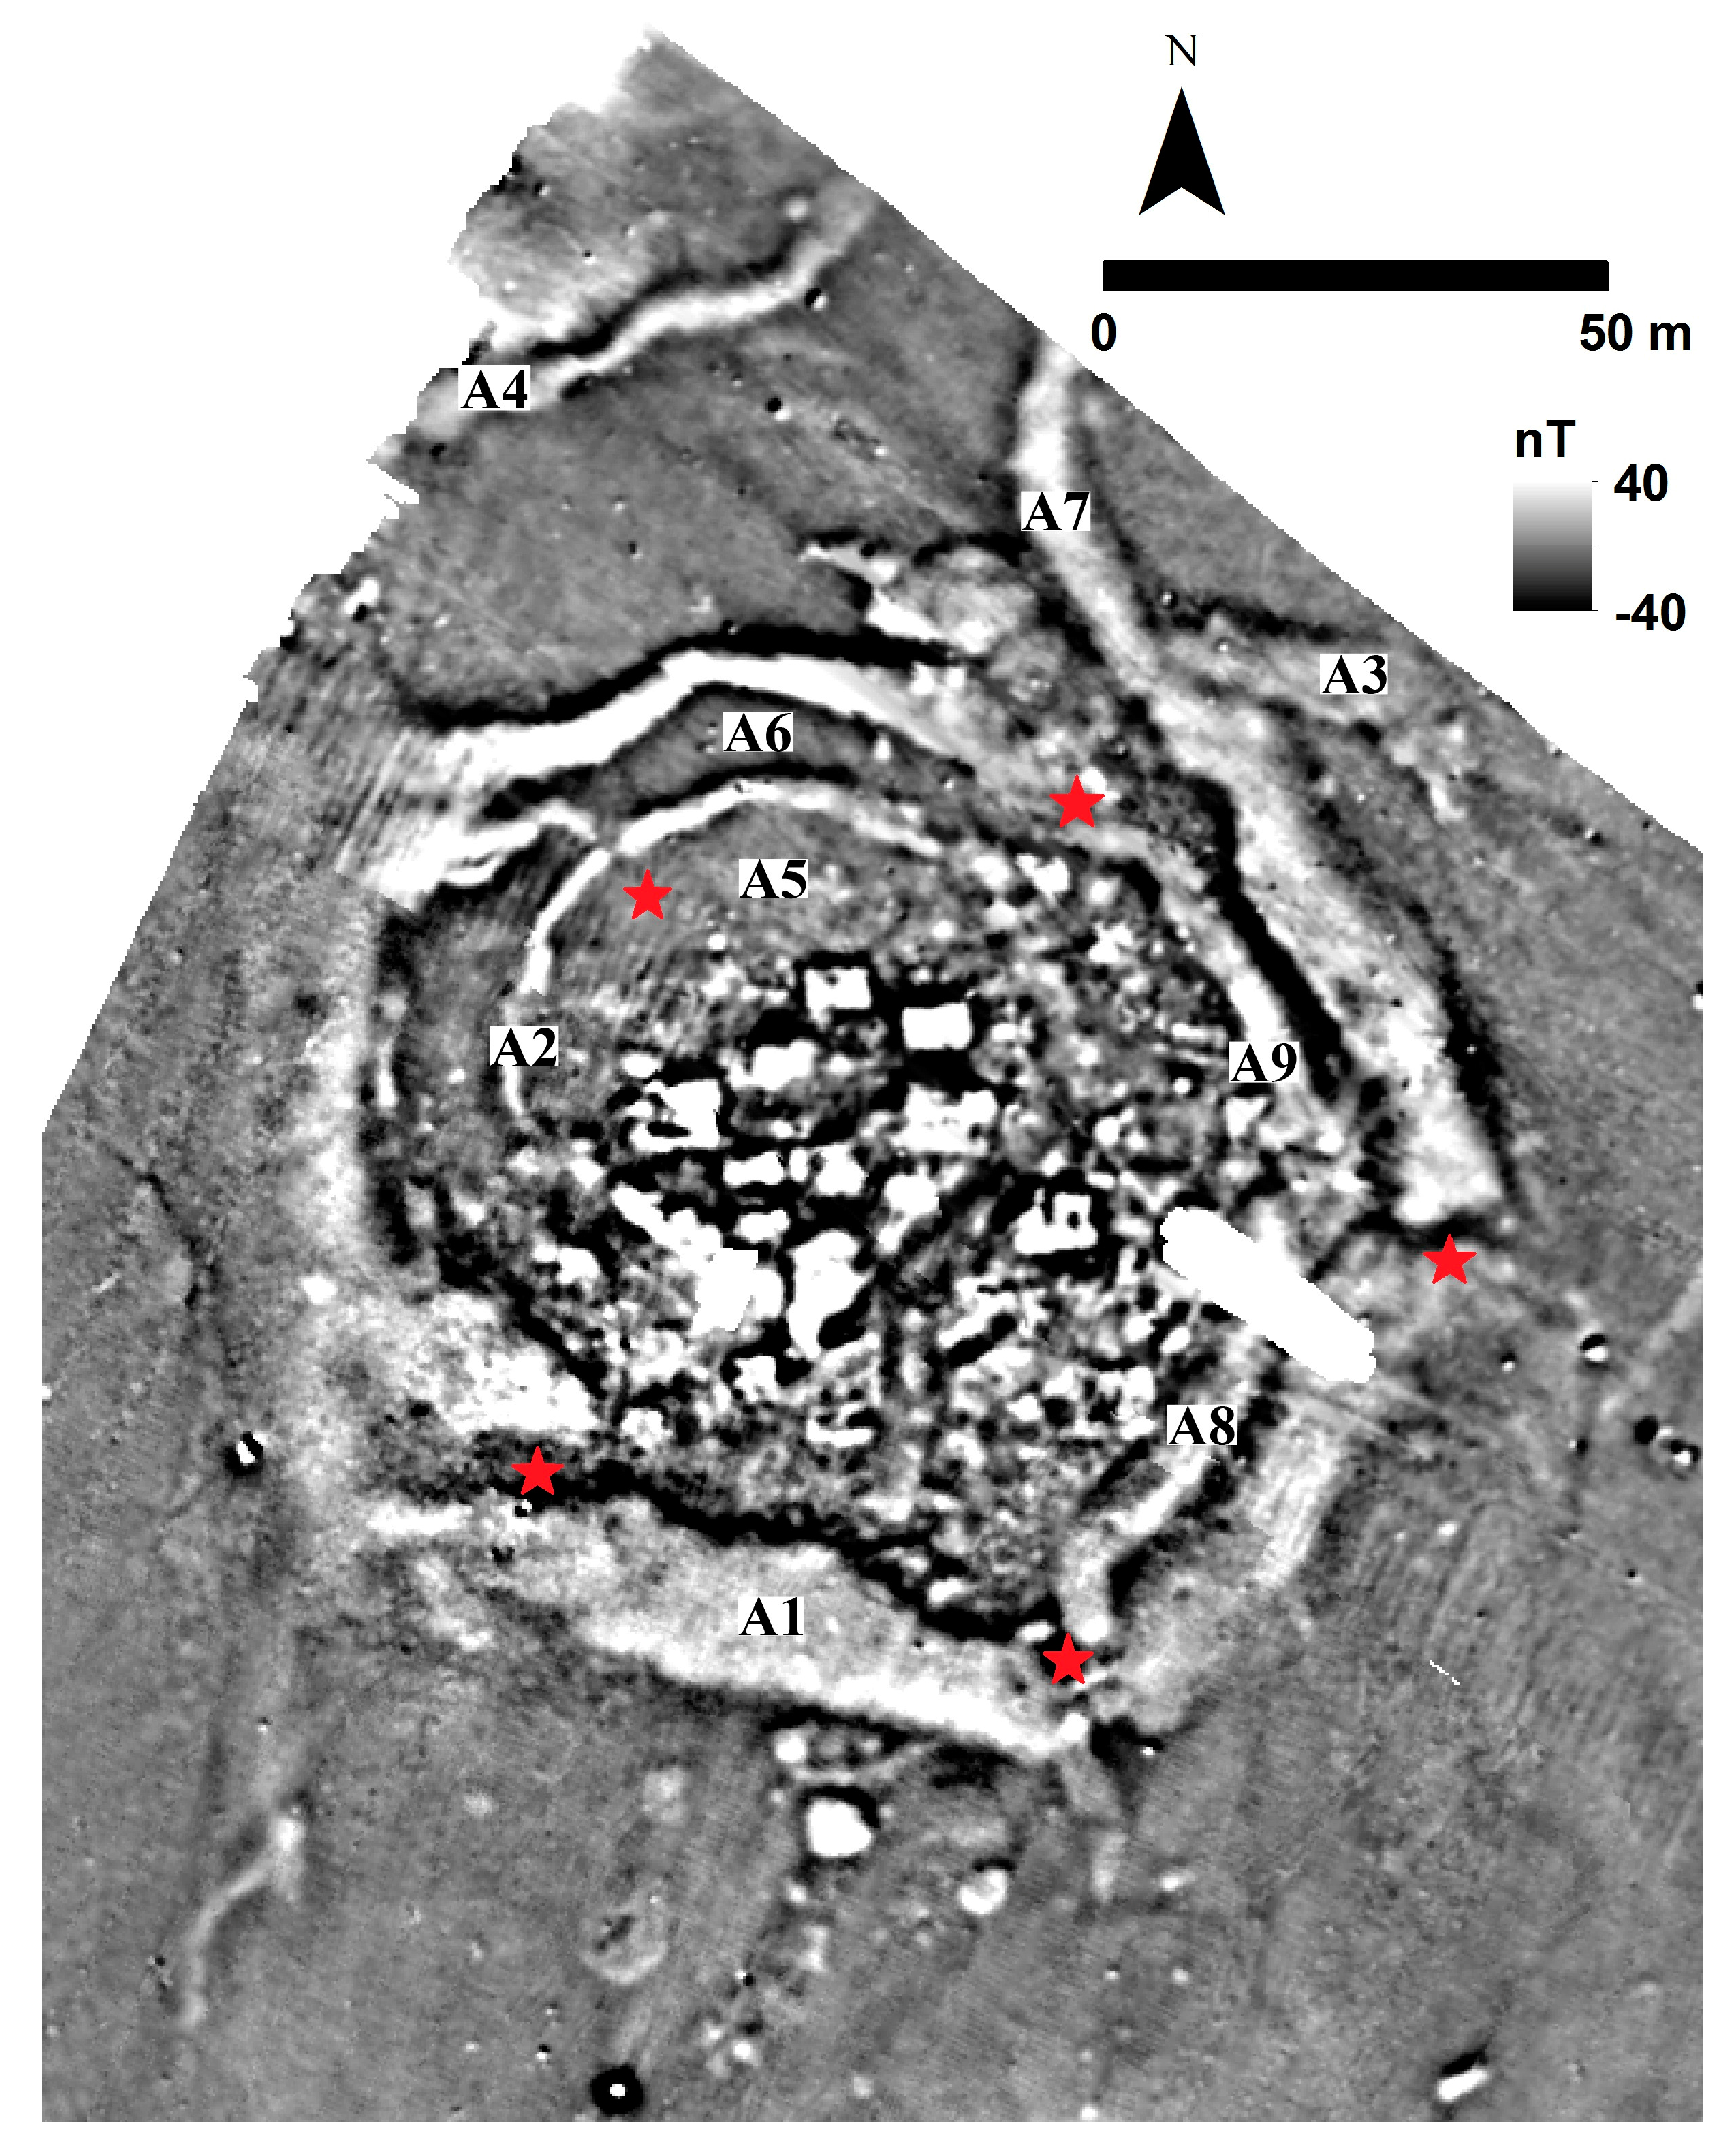
5.1.1. Geomagnetic Survey
Geomagnetic data reveal a wide enclosure (A1) running around the settlement (
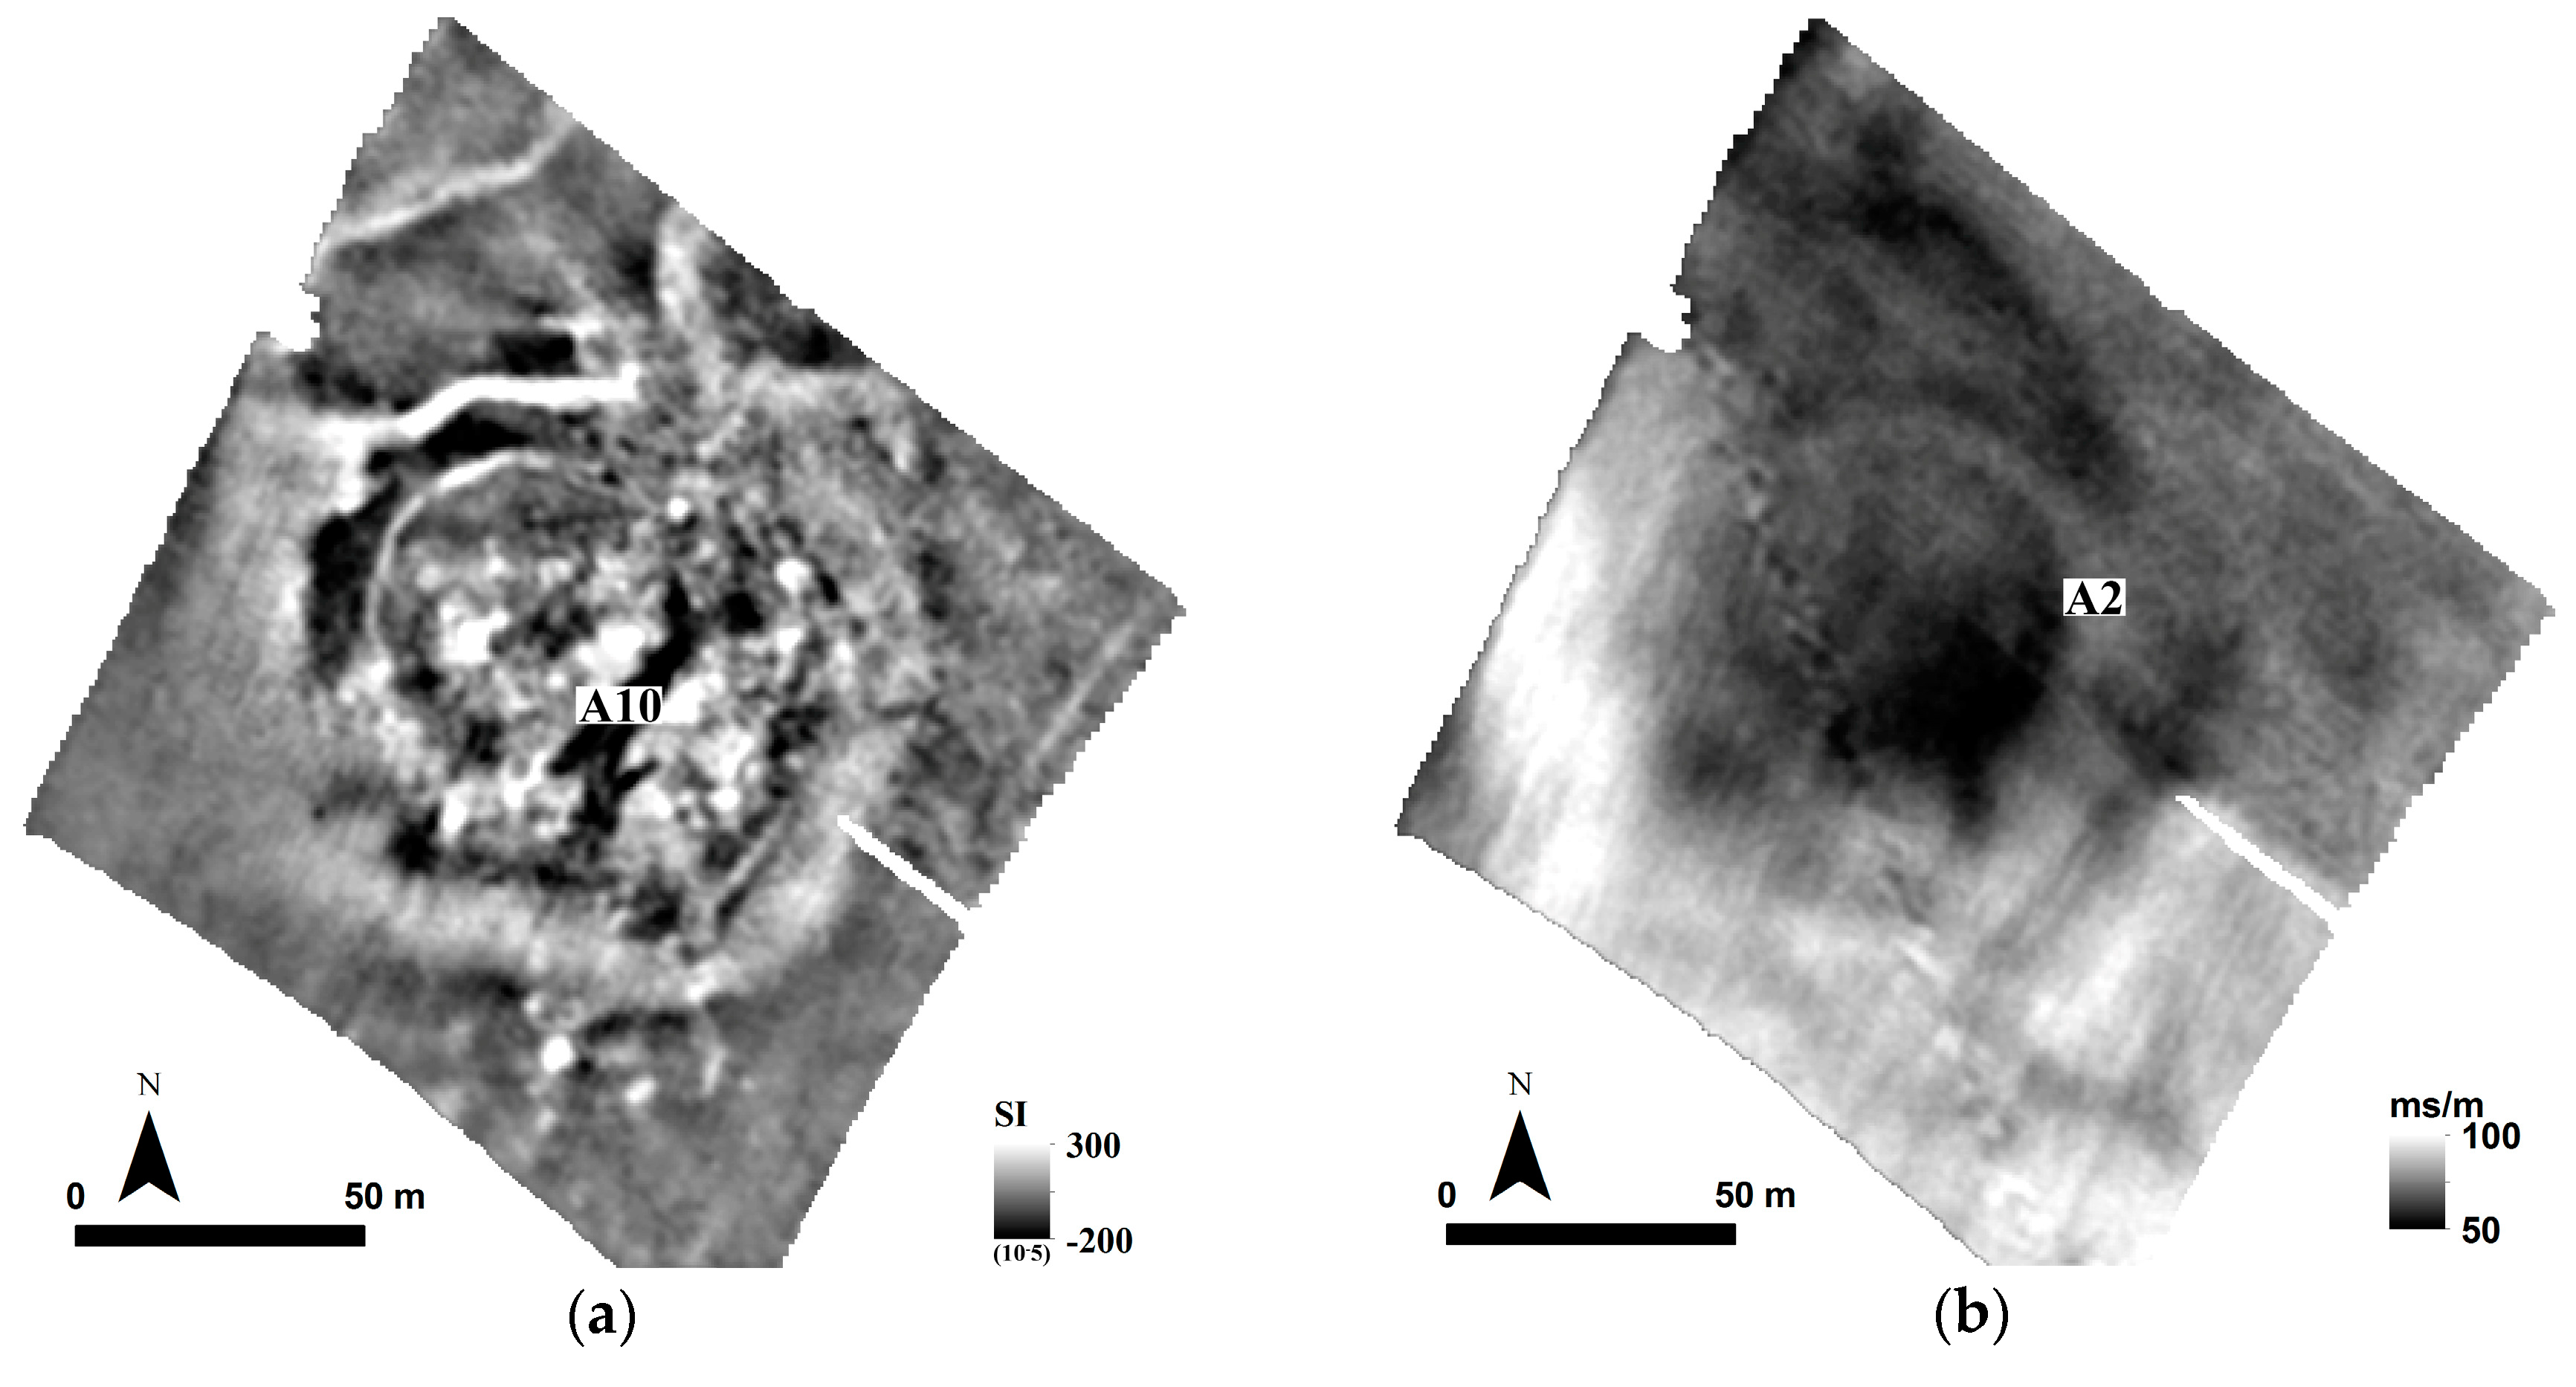
Figure 3). A secondary and thinner enclosure is located closer to the core of the settlement supporting the outer one in the eastern section. In consideration of their shapes and positive magnetic signatures, they were most likely to be ditches. A2 is another similar feature encircling the core of the settlement. Even though not complete in its shape, the feature is much thinner and better defined than other documented enclosures. In addition, taking into account well-defined openings/gates in A2, it is highly possible that the feature was a (mudbrick) wall-enclosure rather than a ditch.
Of additional interest is the enclosure formed by (A3) and (A7) where its half-circular shape suggests a smaller neighboring site. Even though the geomagnetic data coverage is not complete, satellite data provide evidence for its extent and size as a soil-mark. Due to the nature of the geophysical data, it is not possible to comment on the contemporaneity of habitation or use. However, considering the relatively large size of A3 with respect to the small-scale site, which it is bounded, one may suggest this “settlement” had some significant meaning for the Neolithic dwellers of Almyros 2. A similar possible enclosure (A4) is located to the north of Almyros 2. Unlike A3, it lacks context and useful geophysical information for further analysis. Thus, the feature is excluded from the final interpretation.
Geomagnetic data also reveal information on a series of buildings at the core of the settlement which are primarily aligned in East–West direction. Their signatures suggest these features were mainly made of stone walls and possibly clay floors. Even though it seems like they suffered a burning event the buildings remained intact in most of the cases. This is also to say that their destruction must have been minimal and maybe so in control. The wall-enclosure (A2) further complicates the settlement pattern. In consideration of its circular shape and spanning area, A2 divides the distribution of the buildings into two spatial clusters. When investigated with this division in mind, it becomes clear that in their interior buildings are better defined and their shape and orientation are more consistent. It is harder to delineate buildings outside of A2, suggesting different architectural structures or a different treatment during and after use.
Finally, an empty zone (A5) to the north of the core of the settlement attracts attention. The zone is magnetically quiet suggesting a decision for keeping the area free of human occupation; or a “cleaning” prior to the destruction/abandonment of the settlement. A similar observation can be made for the arching space between the outer ditch (A6) and the wall-enclosure (A2).
5.1.2. Electromagnetic Induction Survey
The magnetic susceptibility map confirms the circular shape of the settlement (
Figure 4a). The ditch system and the wall-enclosure are also clearly defined in the data. Overall, the susceptibility increases towards the core and south of the settlement, most probably of the anthropogenic activities in the particular sections of it. The empty zone also traced in the geomagnetic data (A5, A6) further contributes to this separation.
Investigated in relation to geomagnetic data (
Figure 5), susceptibility map may be used to distinguish architectural, if not cultural phases in Almyros 2. Although the settlement phasing cannot be proposed in an absolute certainty, there is reasonable doubt thanks to different penetration depths of instruments; magnetic susceptibility (due to in-phase component of the electromagnetic induction) measures features shallower than geomagnetic measurements. Under the assumption that shallower features belong to a later phase of occupation the spatial shifts of archaeological features (as one progresses from one depth to another) indicate a change in the layout of settlement pattern.
In the geomagnetic data, the end point of feature A7 (the earlier phase) joins with the end point of A3, closing the space for the secondary site. In magnetic susceptibility map the terminal of A7 (the later phase) was shifted and was bent towards the Almyros 2, suggesting that the secondary site was linked to the main settlement at a later period.
The second phasing information is related to the eastern portion of the ditch system. In the geomagnetic data (the earlier phase), there is clear evidence for a double ditch system; the main outer ditch and the secondary inner ditch. In the magnetic susceptibility map (the later phase), the secondary inner ditch (A8 and A9) mostly disappears and only its highly magnetic portions remain visible.
Specific areas with low magnetic susceptibility values require elaboration. The first is the smaller site bounded by the ditch (A3 andA7). Susceptibility values are in contrast with the main settlement, suggesting low level of human presence; at least for the area covered by the EMI survey. The second is the arching space (A6). Susceptibility values reveal that the space contained almost no anthropogenic activities. The only exception for this is the break with relatively higher susceptibility values due to the gate in the wall-enclosure A2. Next, the linear feature (A10) running on northeast–southwest direction seems to be a later intrusion to the site, as it cuts through a series of geomagnetic features. If A10 indeed depicts an event, which cleared the marks of past anthropogenic activities, abovementioned archaeological areas with low susceptibility values indicate excessive clearing during the habitation of the site or just prior to its abandonment. Finally, minimal human activity alongside the ditch-system is evident through documented lower susceptibility values. Particularly, it is significant to encounter these areas at critical gateways of the ditch.
Electrical conductivity map shows a clear distinction between the northeast (resistive) and southwest (conductive) surroundings of the settlement (
Figure 4b). As expected, the site itself is part of the high resistivity section, related to the compaction of the soil, due to intensive human activities of the past. It is possible that anthropogenic soils “spilled” towards northeast; or there was another locus of habitation in this area, as already suggested by the geomagnetic data.
The conductivity data further expose the circular shape of the Neolithic settlement. Its shape is particularly well defined in the north and east thanks to higher conductivity area between the wall-enclosure (A2) and the main ditch system. This layout further supports the reconstruction of the circular wall-enclosure to the south. Finally, resistivity values further increase towards the south where structural remains appear to be denser in contrast with the north of settlement.
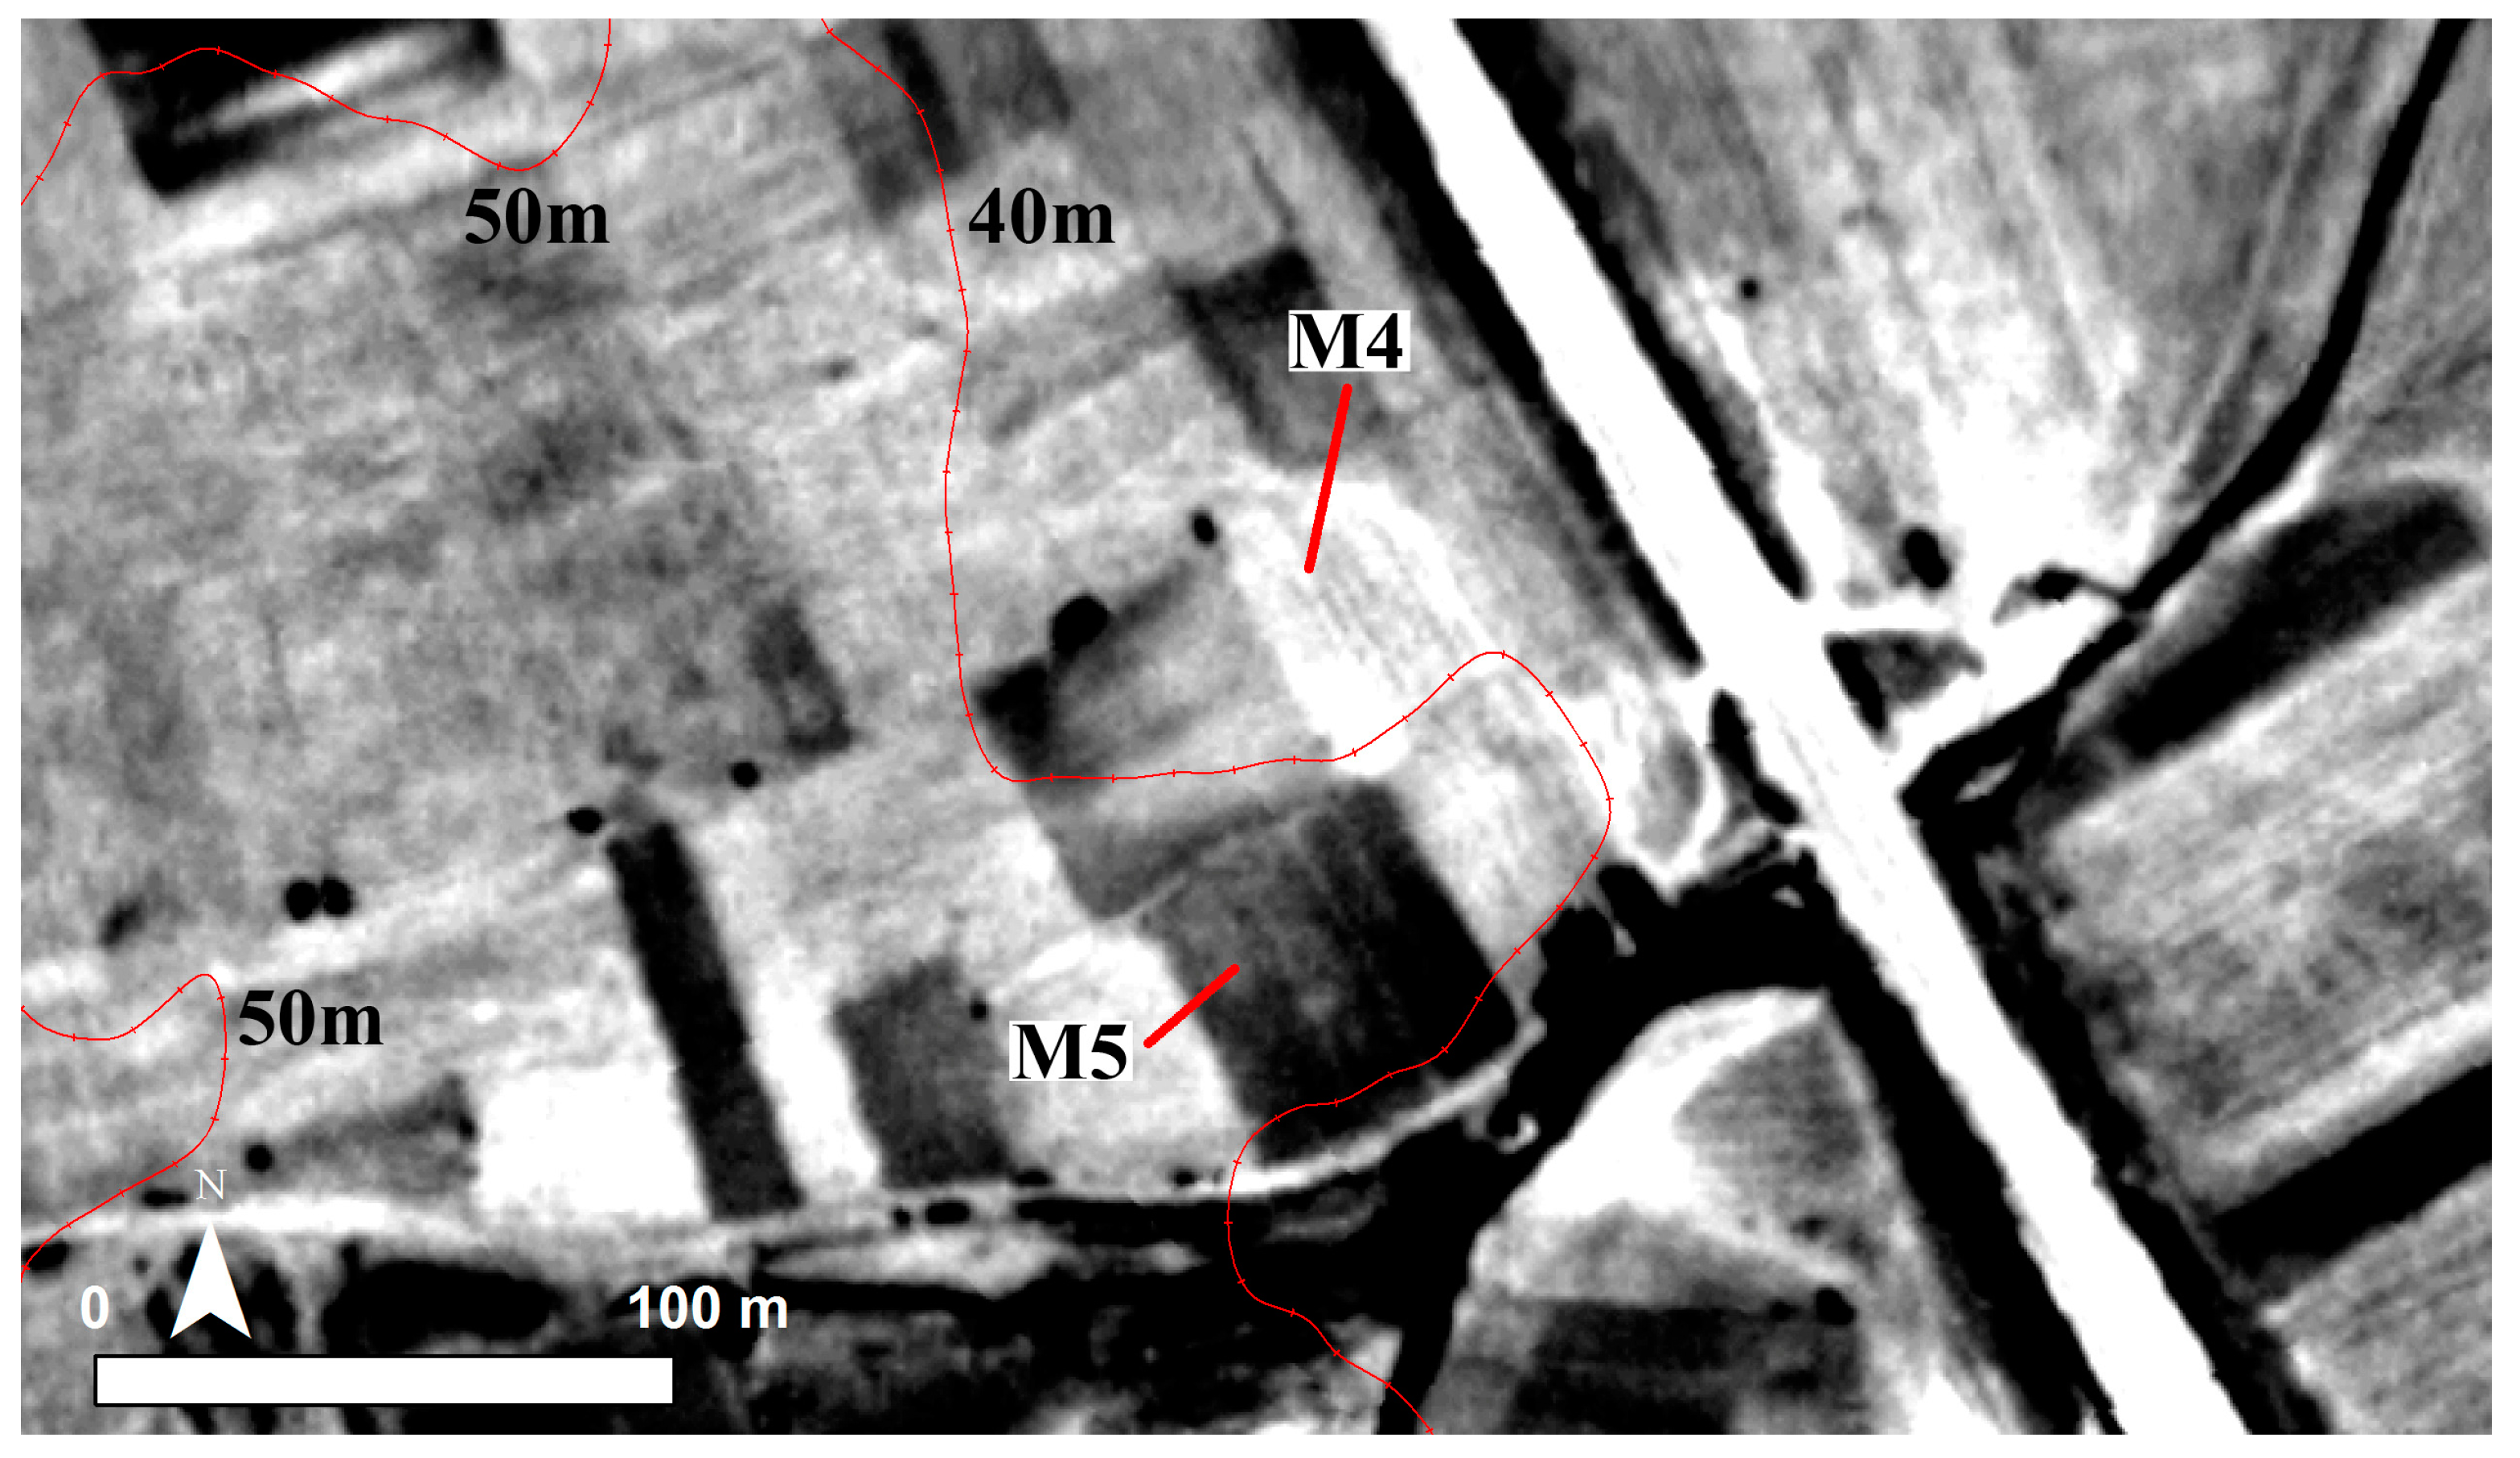
5.2. Kamara (22.880° E, 39.078° N)
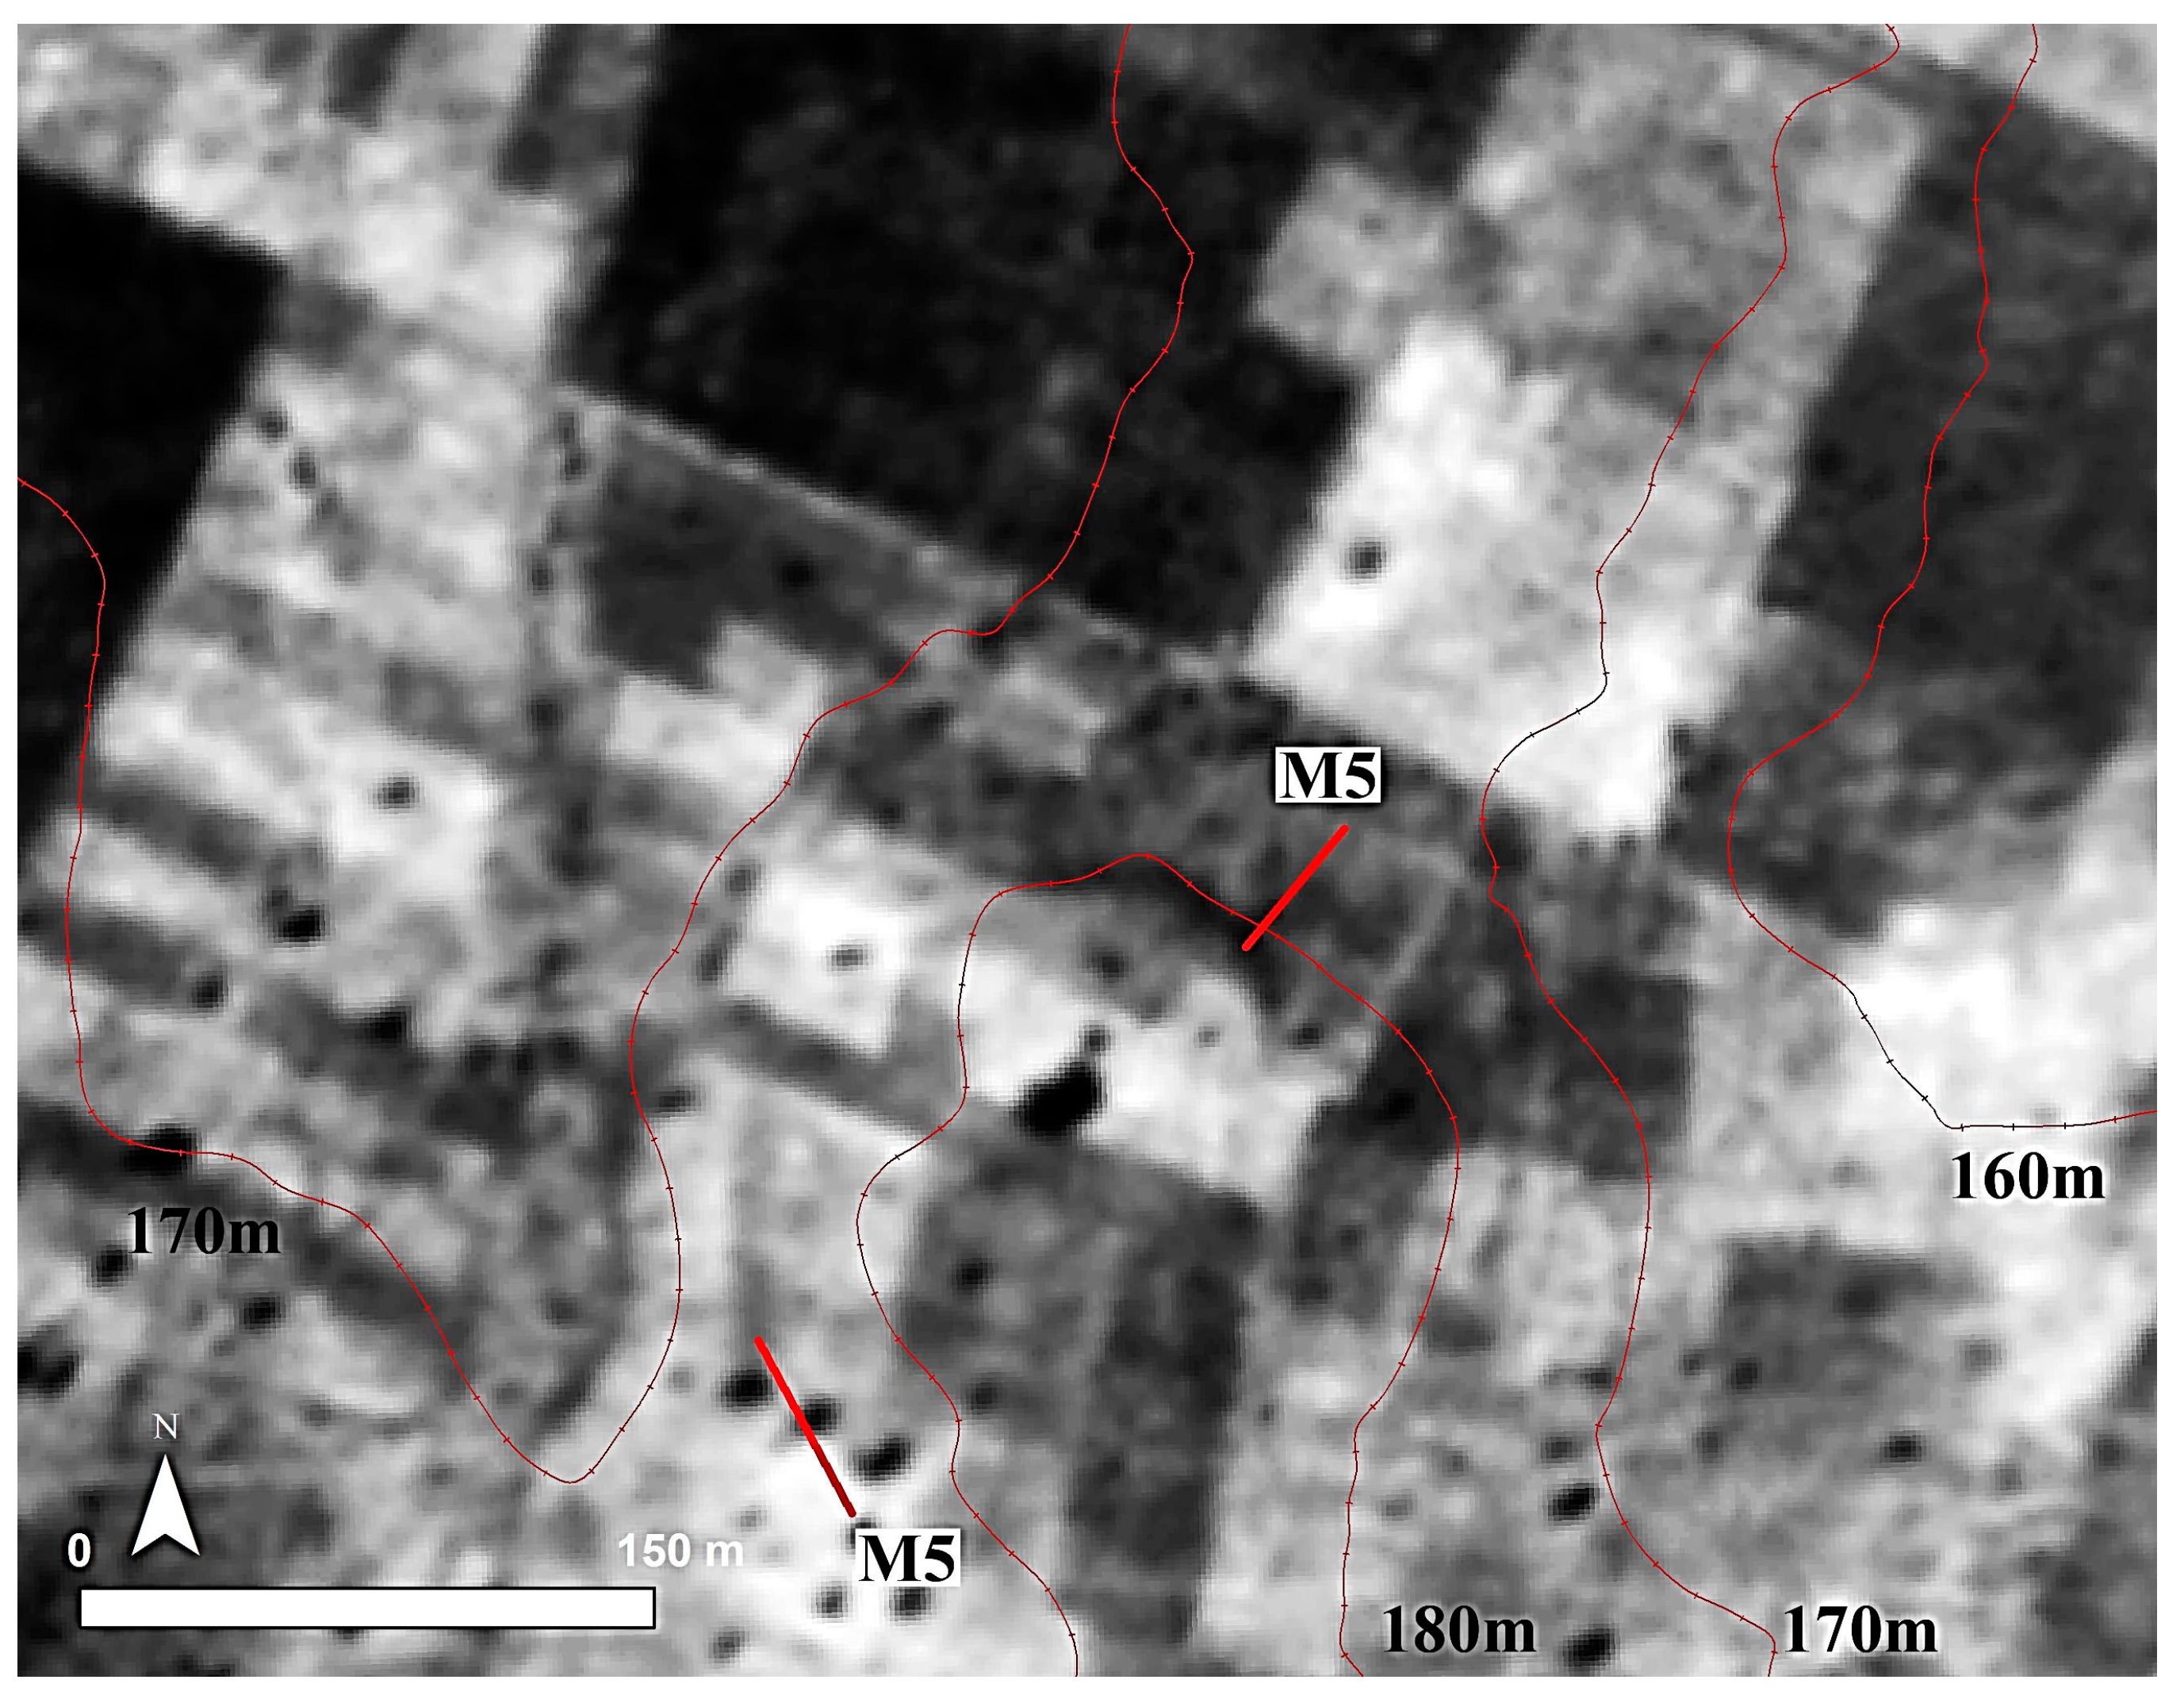
The most informative high-altitude view of Kamara comes from a 1971 aerial photograph (
Figure 6). Recent intrusions, including a mid-size construction on the site, hinder a complete evaluation. This transformation of the landscape emphasizes the importance of historic imagery, especially for the areas witnessing industrial scale agriculture and urbanization. The remnants of the main settlement are visible after the soil mark M4. Feature M5 further suggests that Kamara was also extended towards the south. The geophysical prospection could not cover this southern portion due to modern obstacles, and, thus, the aerial photography remains in use for determining the possible extent of the site.
Geomagnetic Survey
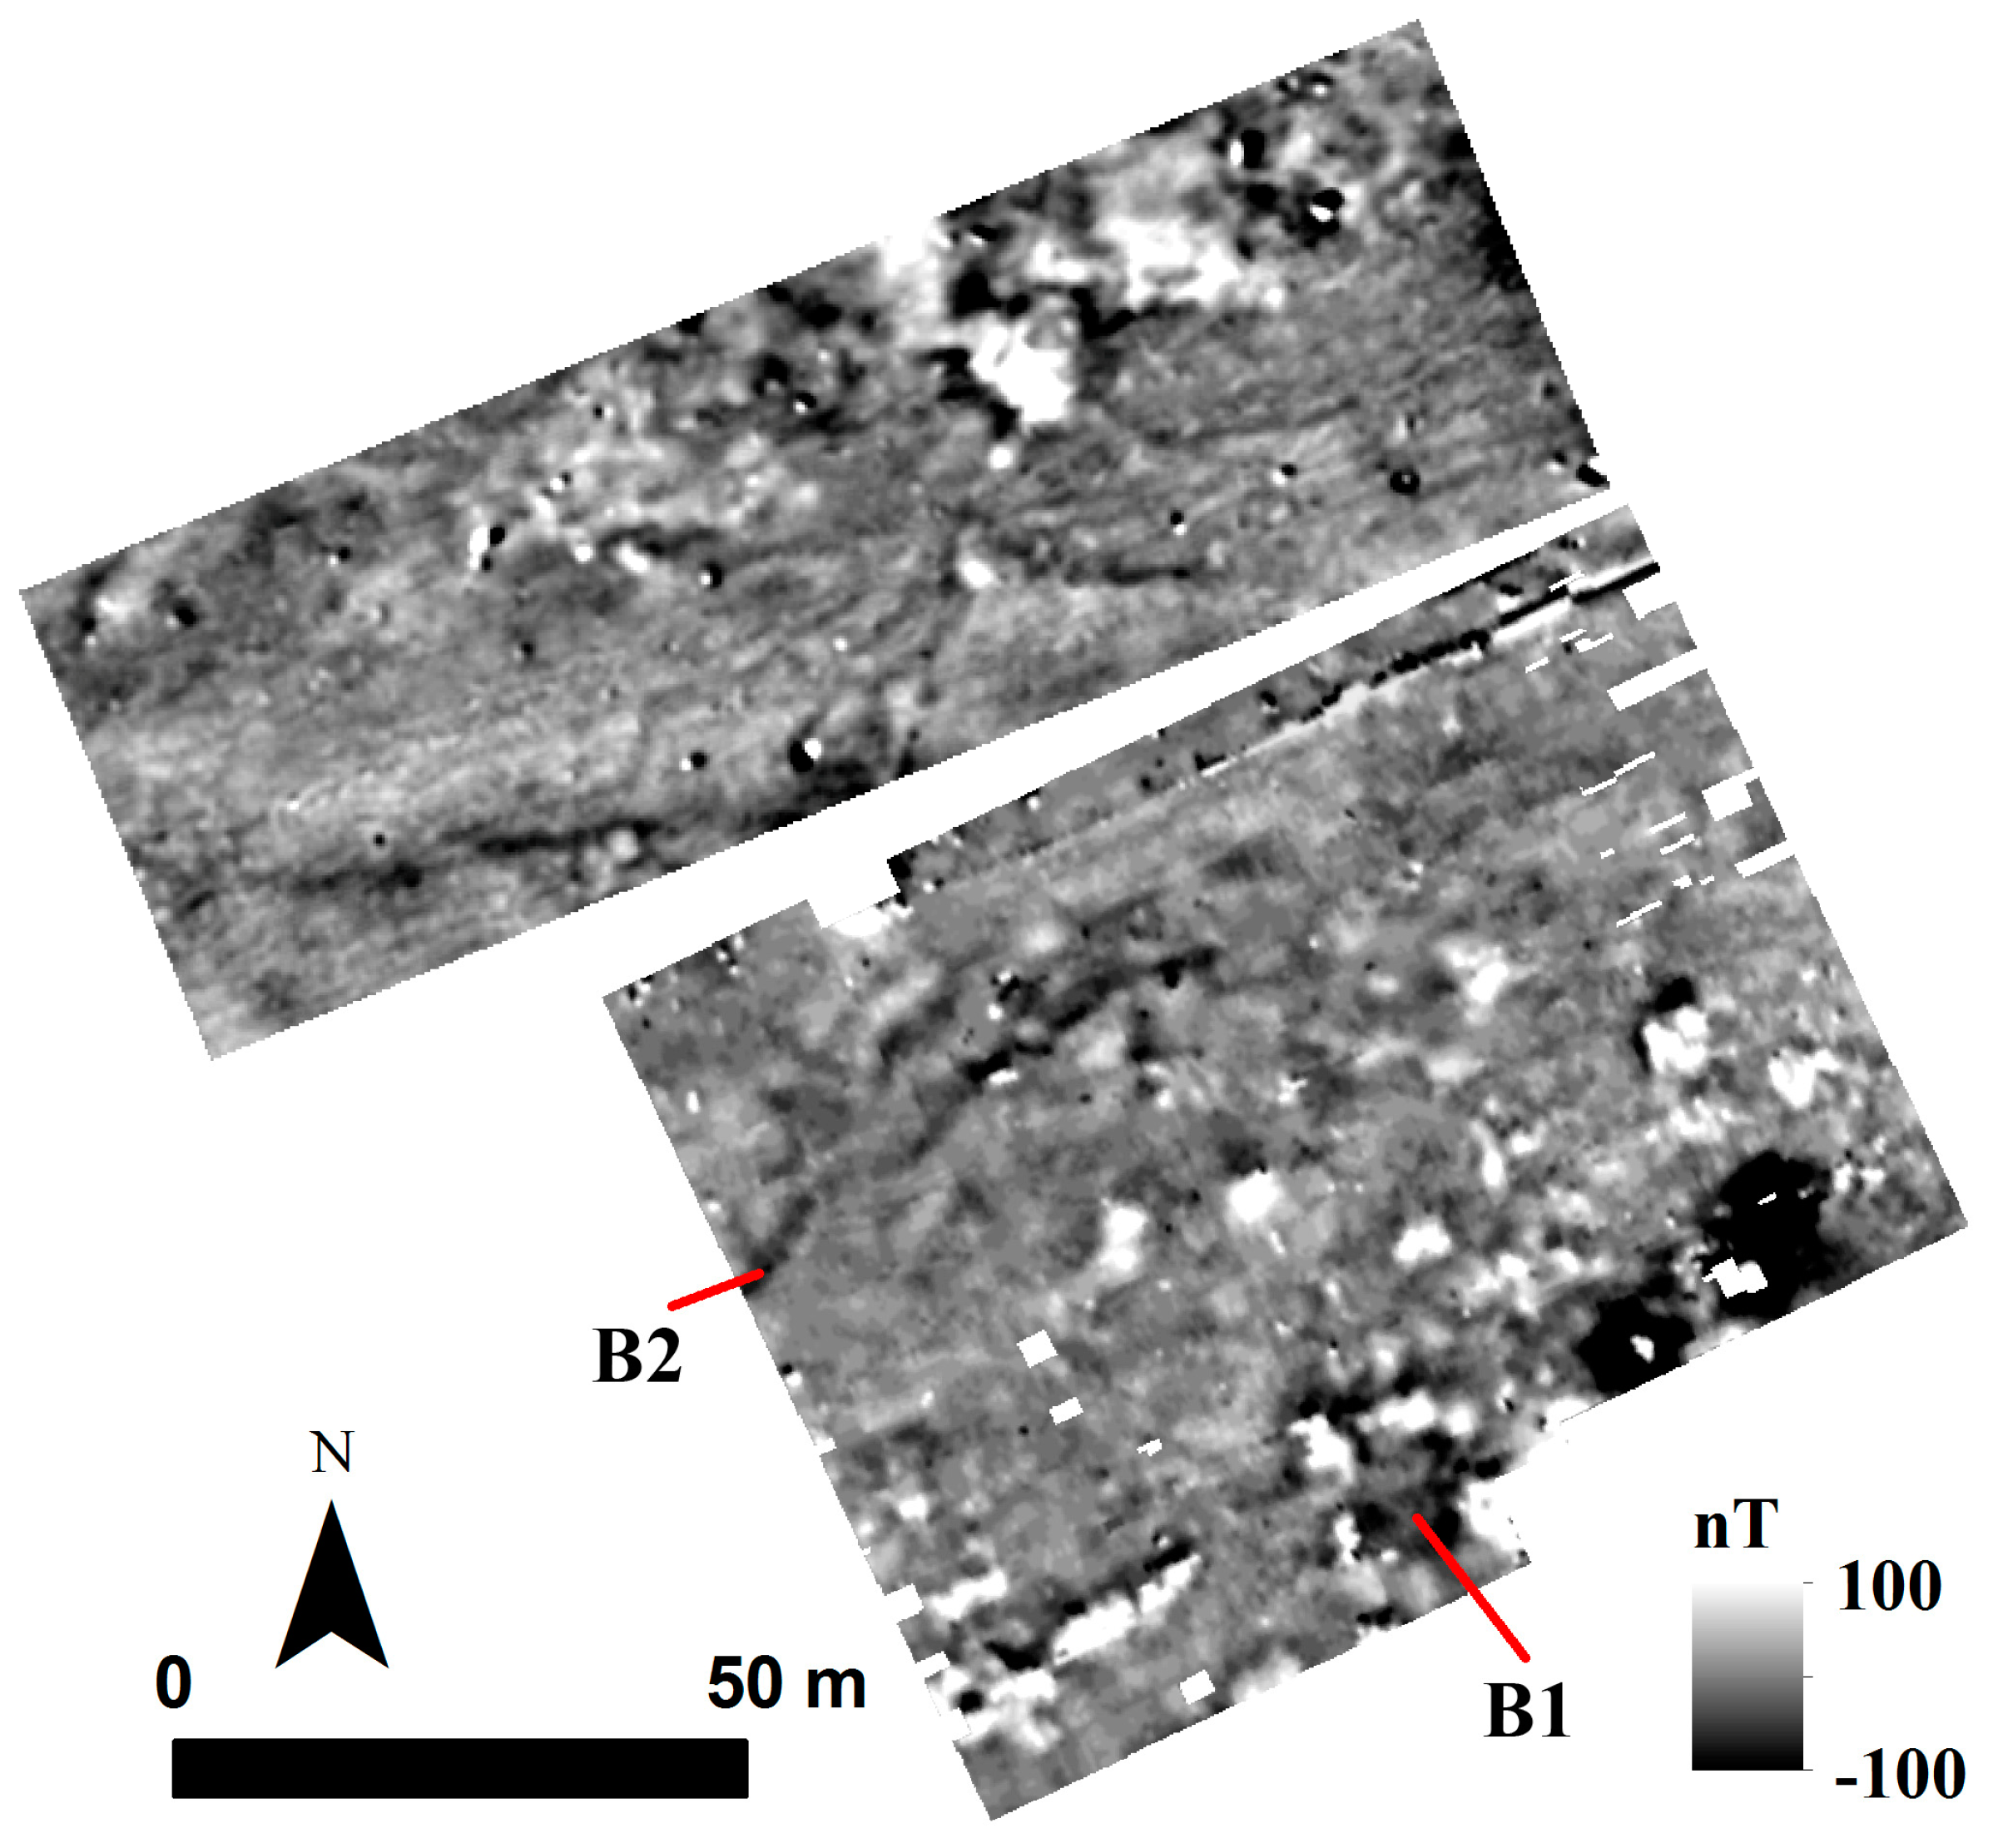
Geomagnetic data from Kamara reveal the location and sizes of architectural features related to potentially Neolithic houses (
Figure 7). They are not well preserved and there is indication of collapse. Nevertheless, their geomagnetic signatures suggest they were rather rectangular in shape and were mainly built by clay rich material. Considering its compact layout and relatively heterogeneous magnetic distribution in comparison to the rest of the settlement, B1 might have been the core of the site.
Other rectangular magnetic features are detected in the north. They are separated from the rest of the Neolithic settlement with a distance of ~80 m. These northerly features do not bear a similar soil mark in historic aerial photography and their sizes are significantly larger than the architectural features of Kamara. Therefore, it can be suggested that they were most probably dated to a later period than Middle Neolithic Period.
There is no indication of a settlement enclosure in the form of a ditch or a circuit wall. If the soil mark on the historic aerial imagery is an accurate indicator for the size of the settlement, the enclosure should have been encountered immediately to the north of the soil mark. A weak candidate for an enclosure is B2. However, its magnetic signature (negative magnetic gradient) is contra to the well-established signatures (positive magnetic gradient) of other surveyed Neolithic settlements. A wall-enclosure may be ruled out due to the irregular shape of the feature. Therefore, B2 must have been a formation with natural origins.
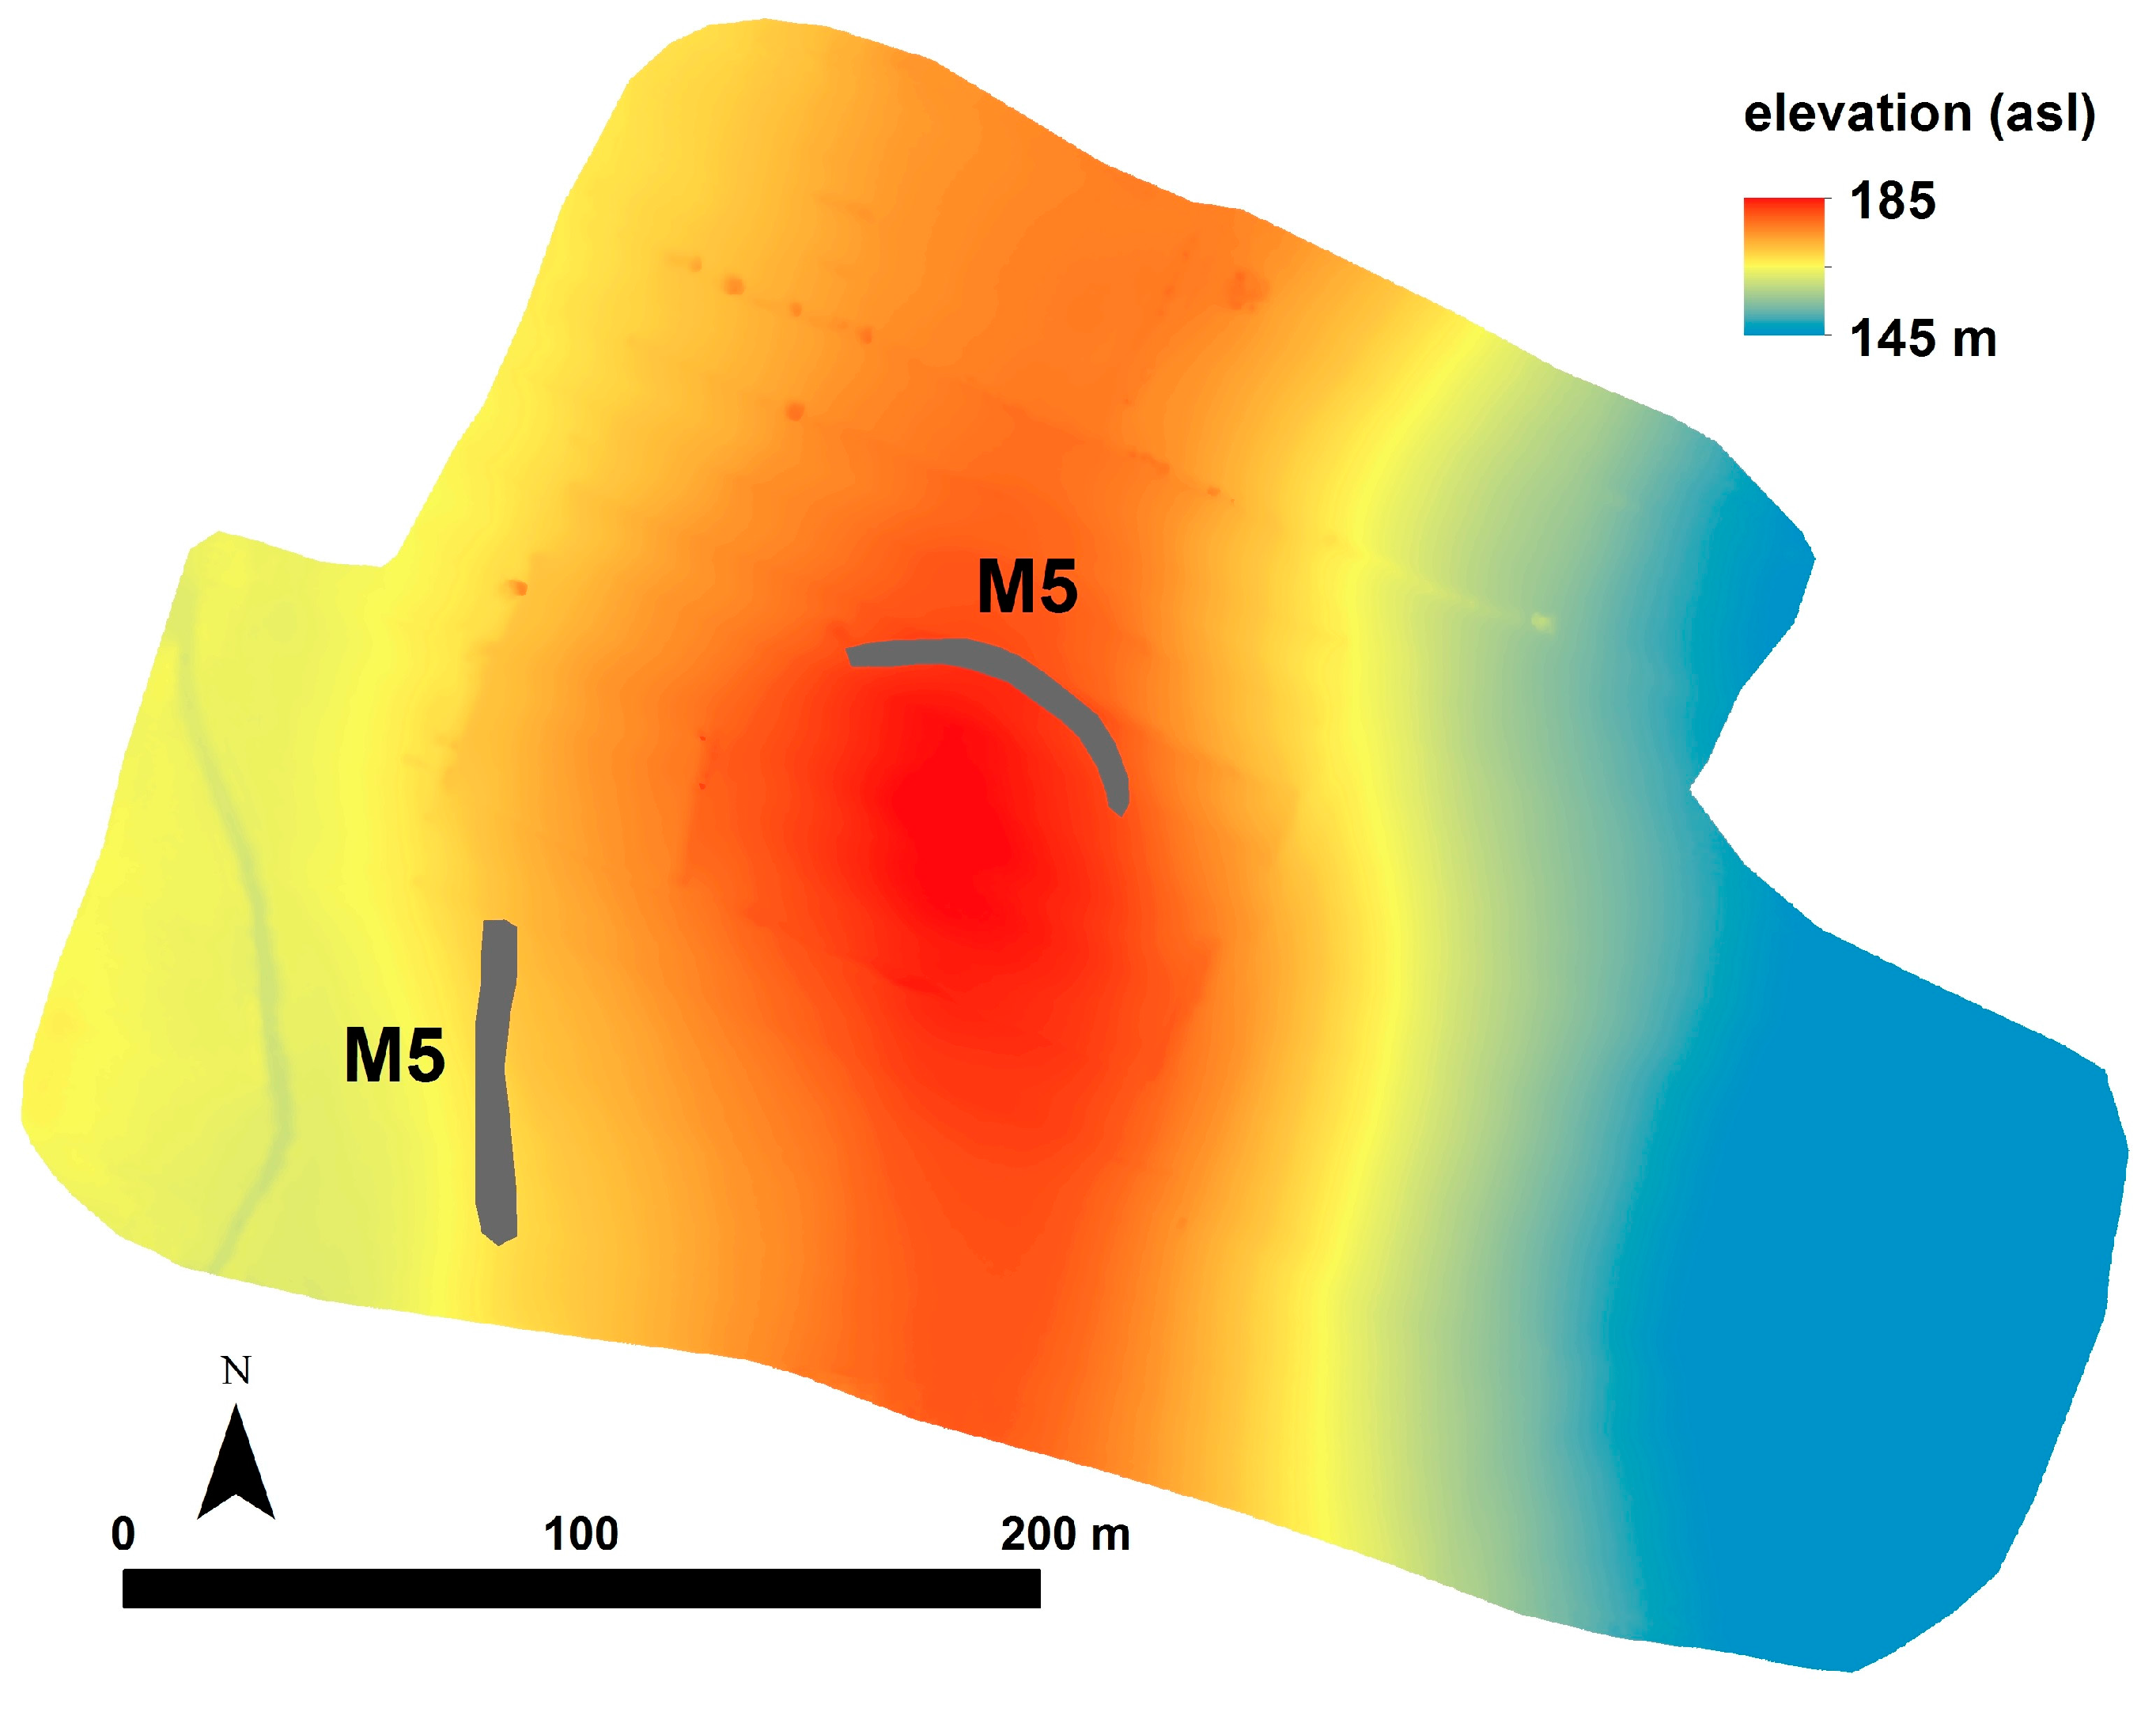
5.3. Karatsantagli (22.701° E, 39.161° N)
Historic aerial photography from 1945 shows two features (possibly enclosures) which are most probably related with the site (
Figure 8). M5 (north) is a semi-arc bounding the settlement in the north. A high resolution Digital Terrain Model (DTM) acquired from the RPAS additionally supports the claim that M5 (north) was built in part of the site as the elevation contour of the settlement succinctly traces this feature (
Figure 9). Furthermore, the extent of the site to the east and to the south as documented by the geomagnetic prospection (see below) merges with this feature, providing a better representation of the limits of the site.
North–south running anomaly M5 (south) must delineate the limit of the site in the west. The feature slightly cuts the elevation counters, and thus, raises a doubt for its prehistoric origins. Nevertheless, the feature appears to be the continuation of the ditch-enclosure (C2) as documented in the geomagnetic dataset. Evaluated together, geophysics data, historic aerial photography, and RPAS imagery offer the most complete picture.
5.3.1. Geomagnetic Survey
Geomagnetic data show a clear separation between anthropogenic and non-anthropogenic areas (
Figure 10). This is most evident in the southern and eastern side of the settlement where there is a drastic increase in the homogeneity of the readings. In the west, a wide (~3 m) and highly magnetic feature (C1) is probably a ditch-enclosure and tightly bounds the settlement. Further to the west of C1, the remnants of a curvilinear feature (C2) with a larger span might have been another enclosure, but poorly preserved. Magnetically homogenous area in between C1 and C2 suggests minimum anthropogenic activity. Neither of these ditch features are detected in the south and in the east, but rather the settlement terminates abruptly without any specific architectural marker.
Within the habitation limits of the site, there are architectural features with visible internal partitions. Their magnetic signatures indicate that they had stone wall foundations and probably mudbrick walls and/or clay floors. A clear evidence for the former comes from C3 where the walls have apparent negative magnetic gradient within the clay rich soil, as suggested by the high magnetic susceptibility values of the background. Feature C4 provides evidence for burning; high magnetic values after burning with respect to the background indicates the architectural use of magnetically rich material, i.e., clay.
5.3.2. Electromagnetic Induction Survey
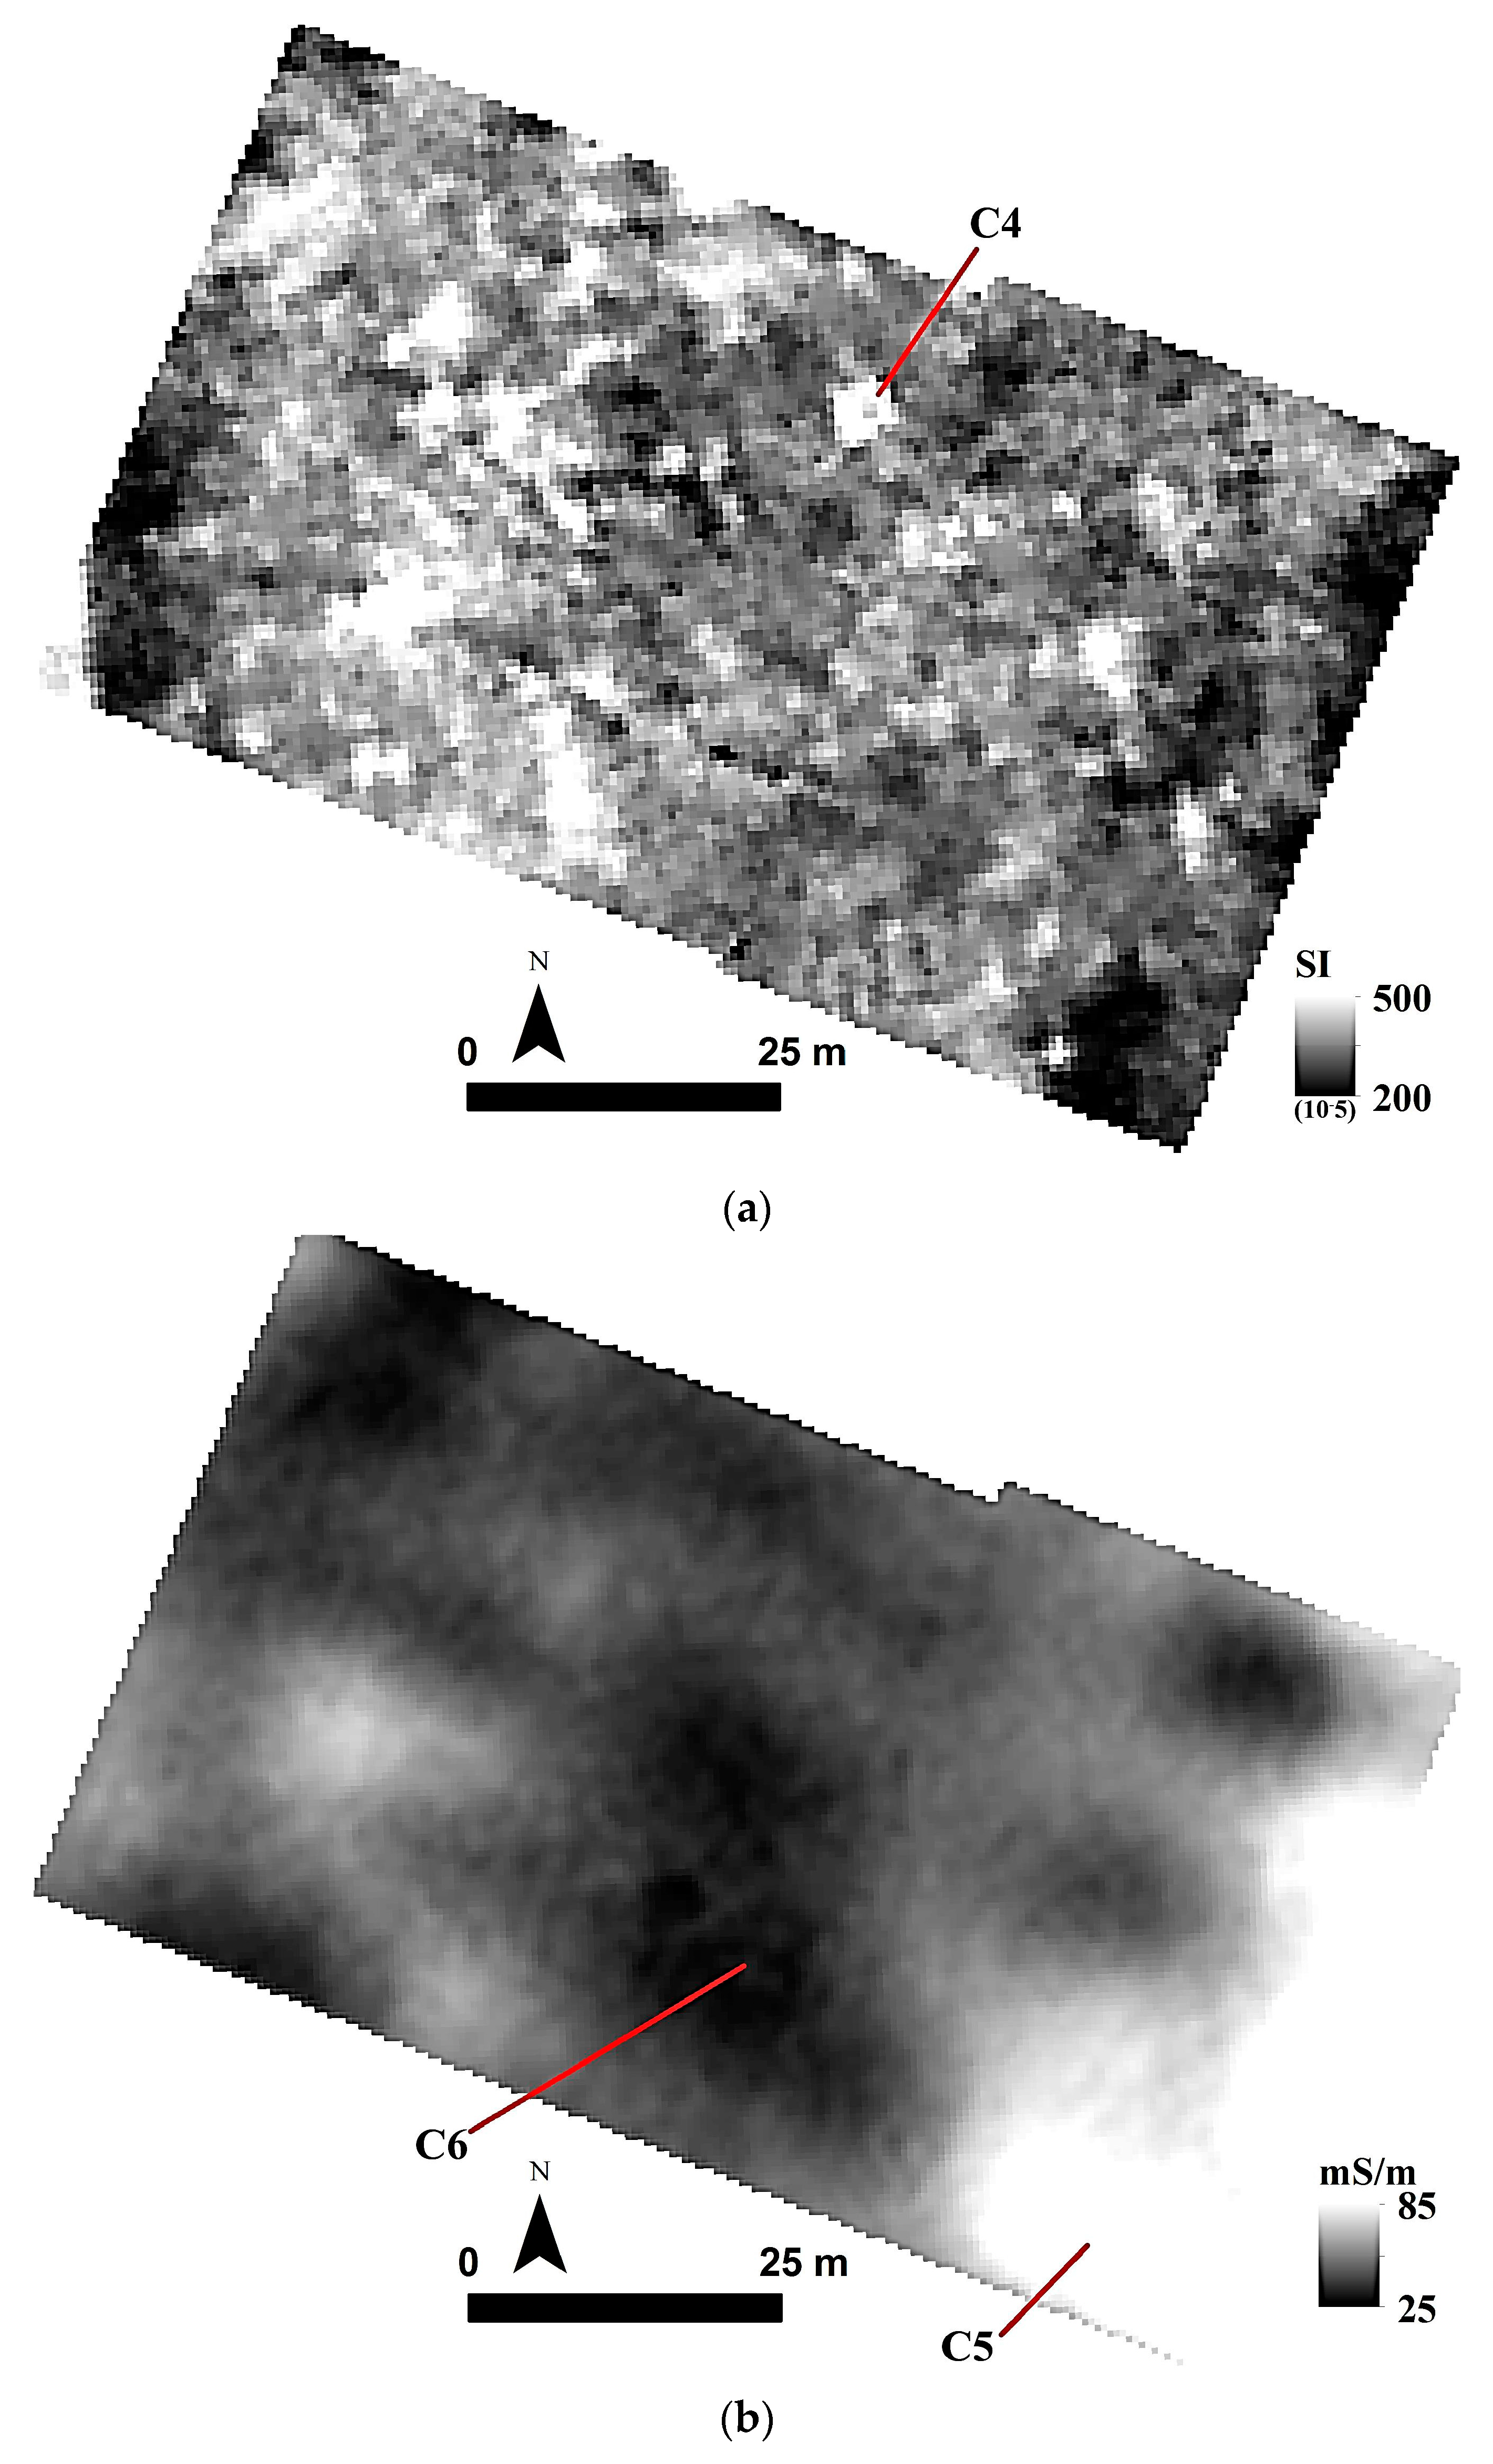
Magnetic susceptibility values are high and exhibit a close correlation with magnetic results (
Figure 11a). The proposed ditch-enclosure (C1) has high susceptibility values, further supporting the hypothesis for its use. Further to the west of the C1, high susceptibility values highlight the core of the settlement. In the eastern edge of the survey area, values are lower than the average susceptibility readings, and thus, further marking the end of habitation. Another low susceptibility area is detected abutting the ditch-enclosure C1. Like in the case of Almyros 2, the area might be indicating minimal anthropogenic activity around the opening of the ditch.
Due to its lower spatial resolution, the EMI survey does not provide architectural details of domestic dwellings. However, it further helps to discriminate buildings which faced pyro activities and their variable intensities. This is the most visible for the burnt structure, C4.
Electrical conductivity dataareanother evidence for the separation between the site (lower-conductivity) and off-site (C5) (higher conductivity) (
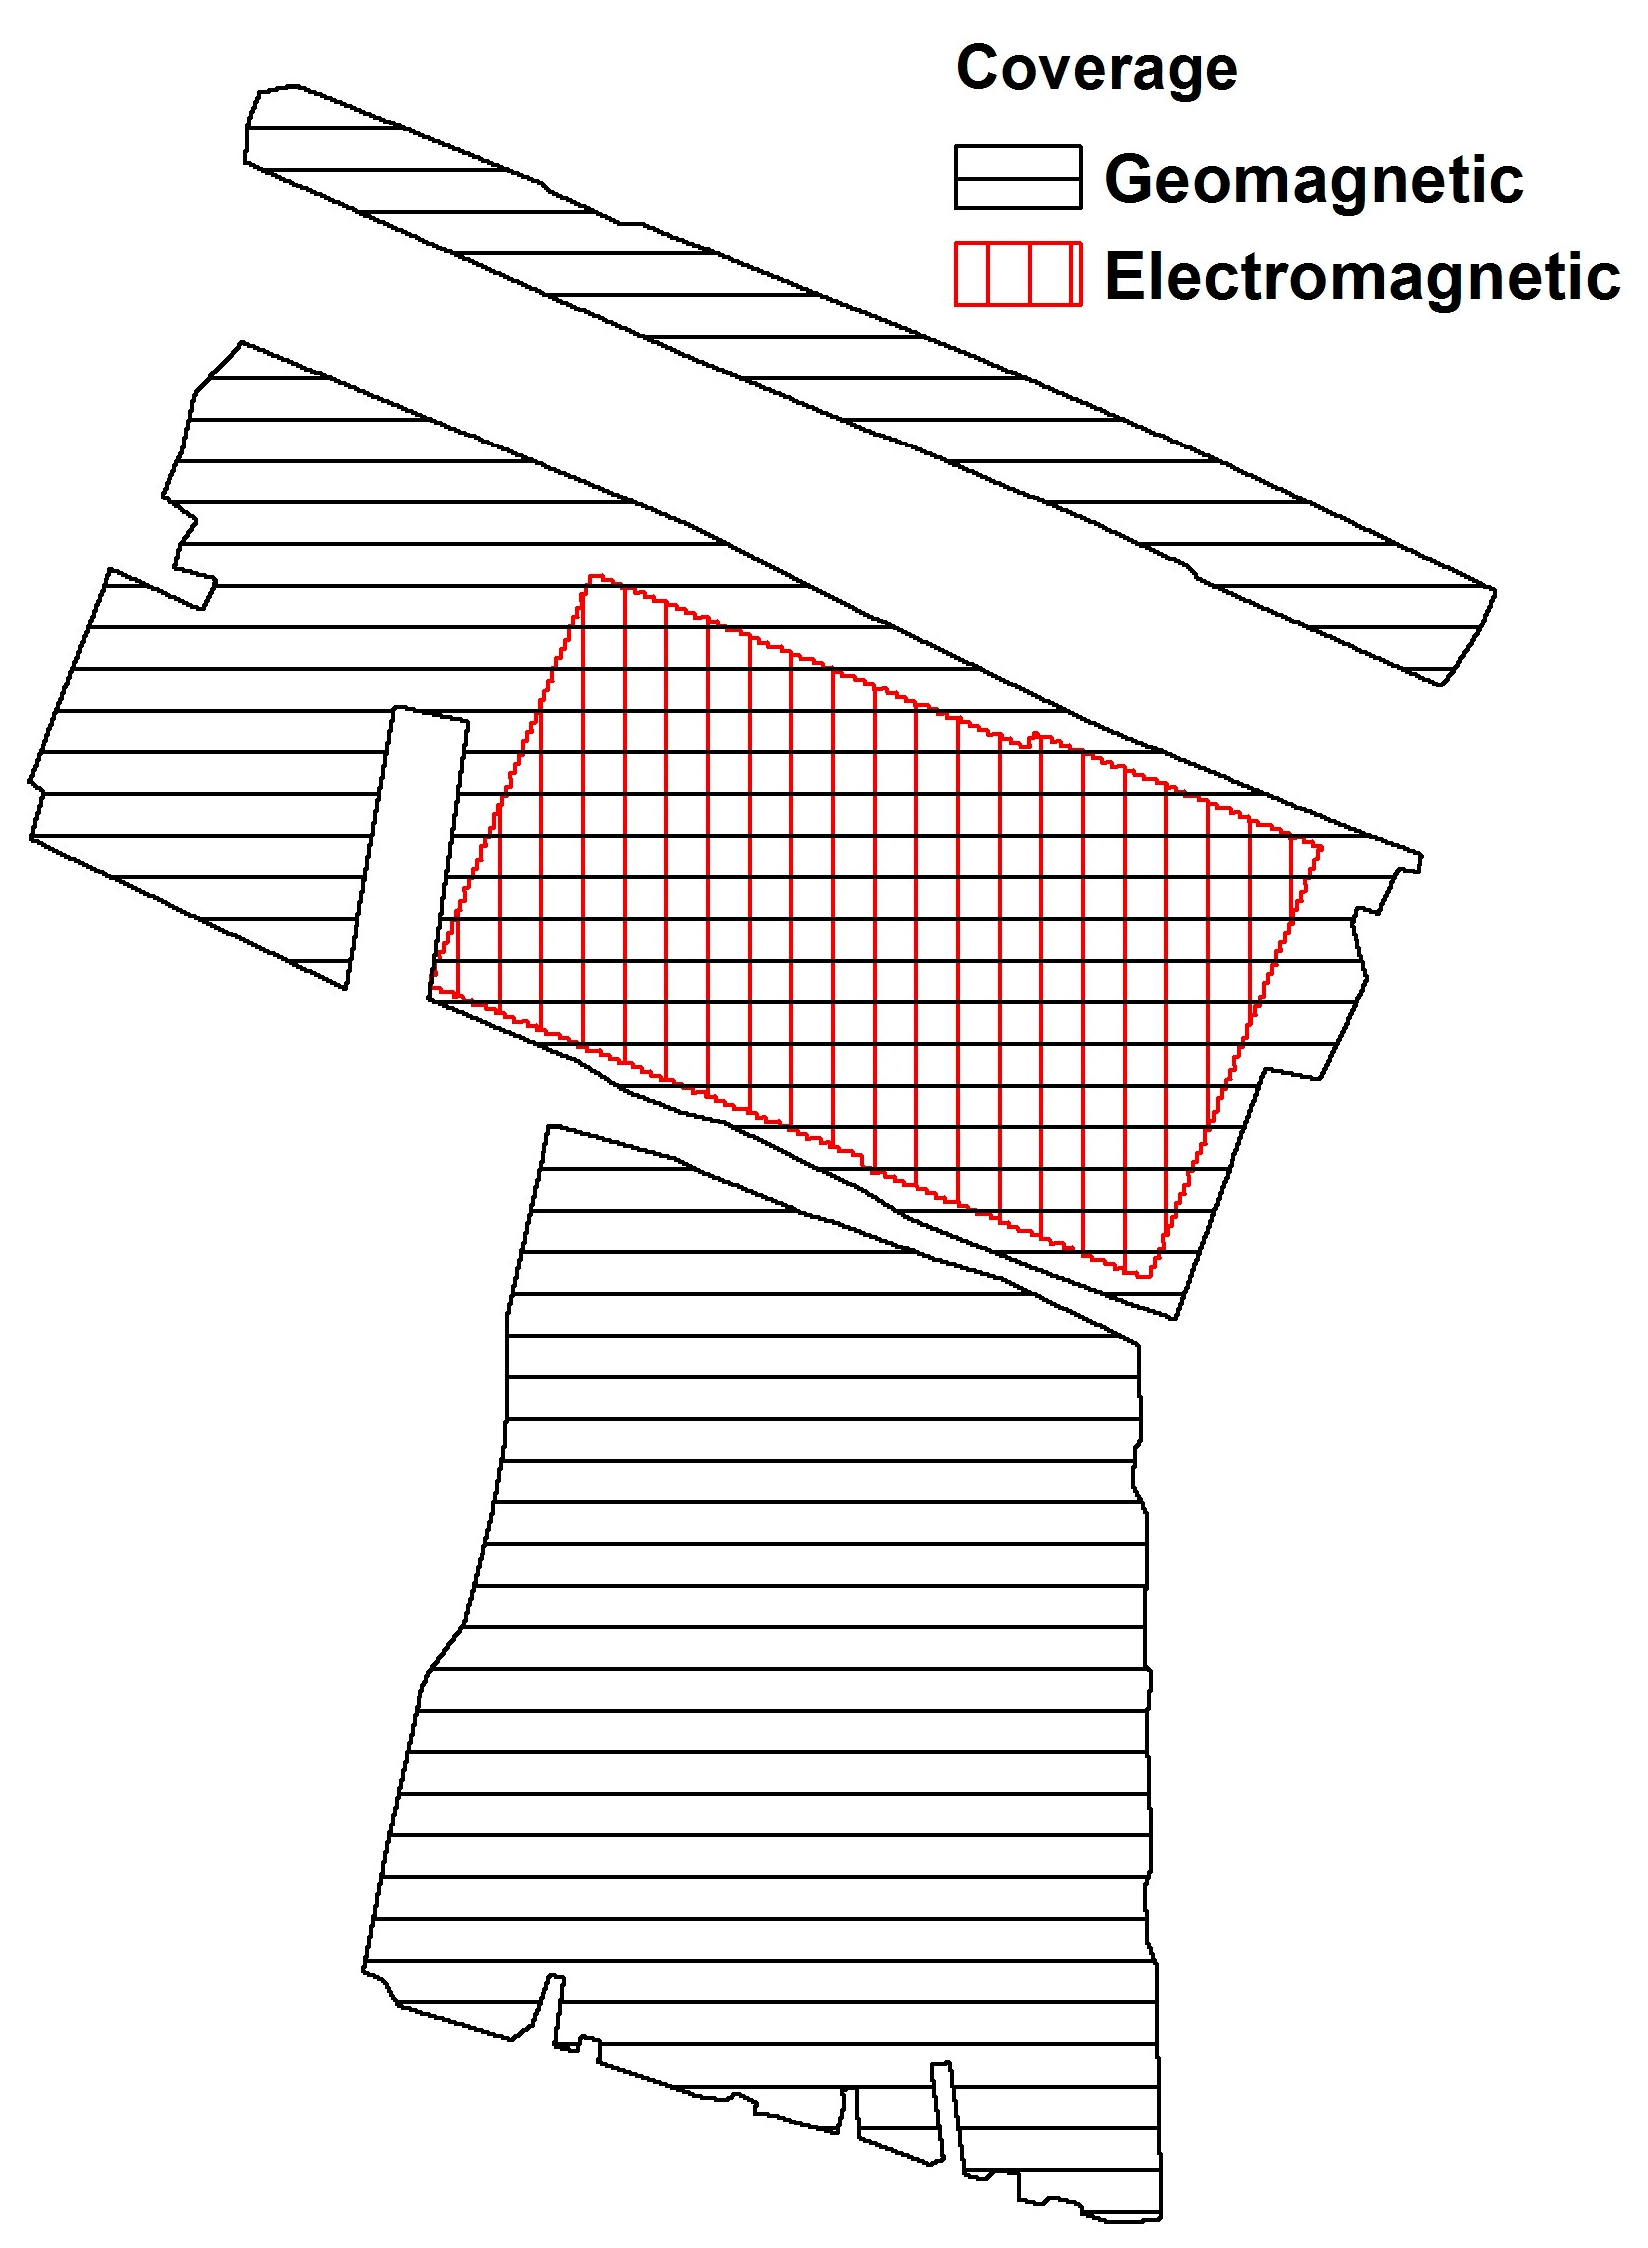
Figure 11b). A sizeable area at the center of the site (C6) has the lowest conductivity values as a hint towards built environment. Geomagnetic data, however, do not reveal any structures for the same area (
Figure 10; also see
Figure 12 for an overlay of extent). Therefore, it is probable that the area was devoid of buildings, but had a very compact surface, suggesting C6 was devoted to specialized activities.
5.4. Perdika 2 (22.613° E, 39.245° N)
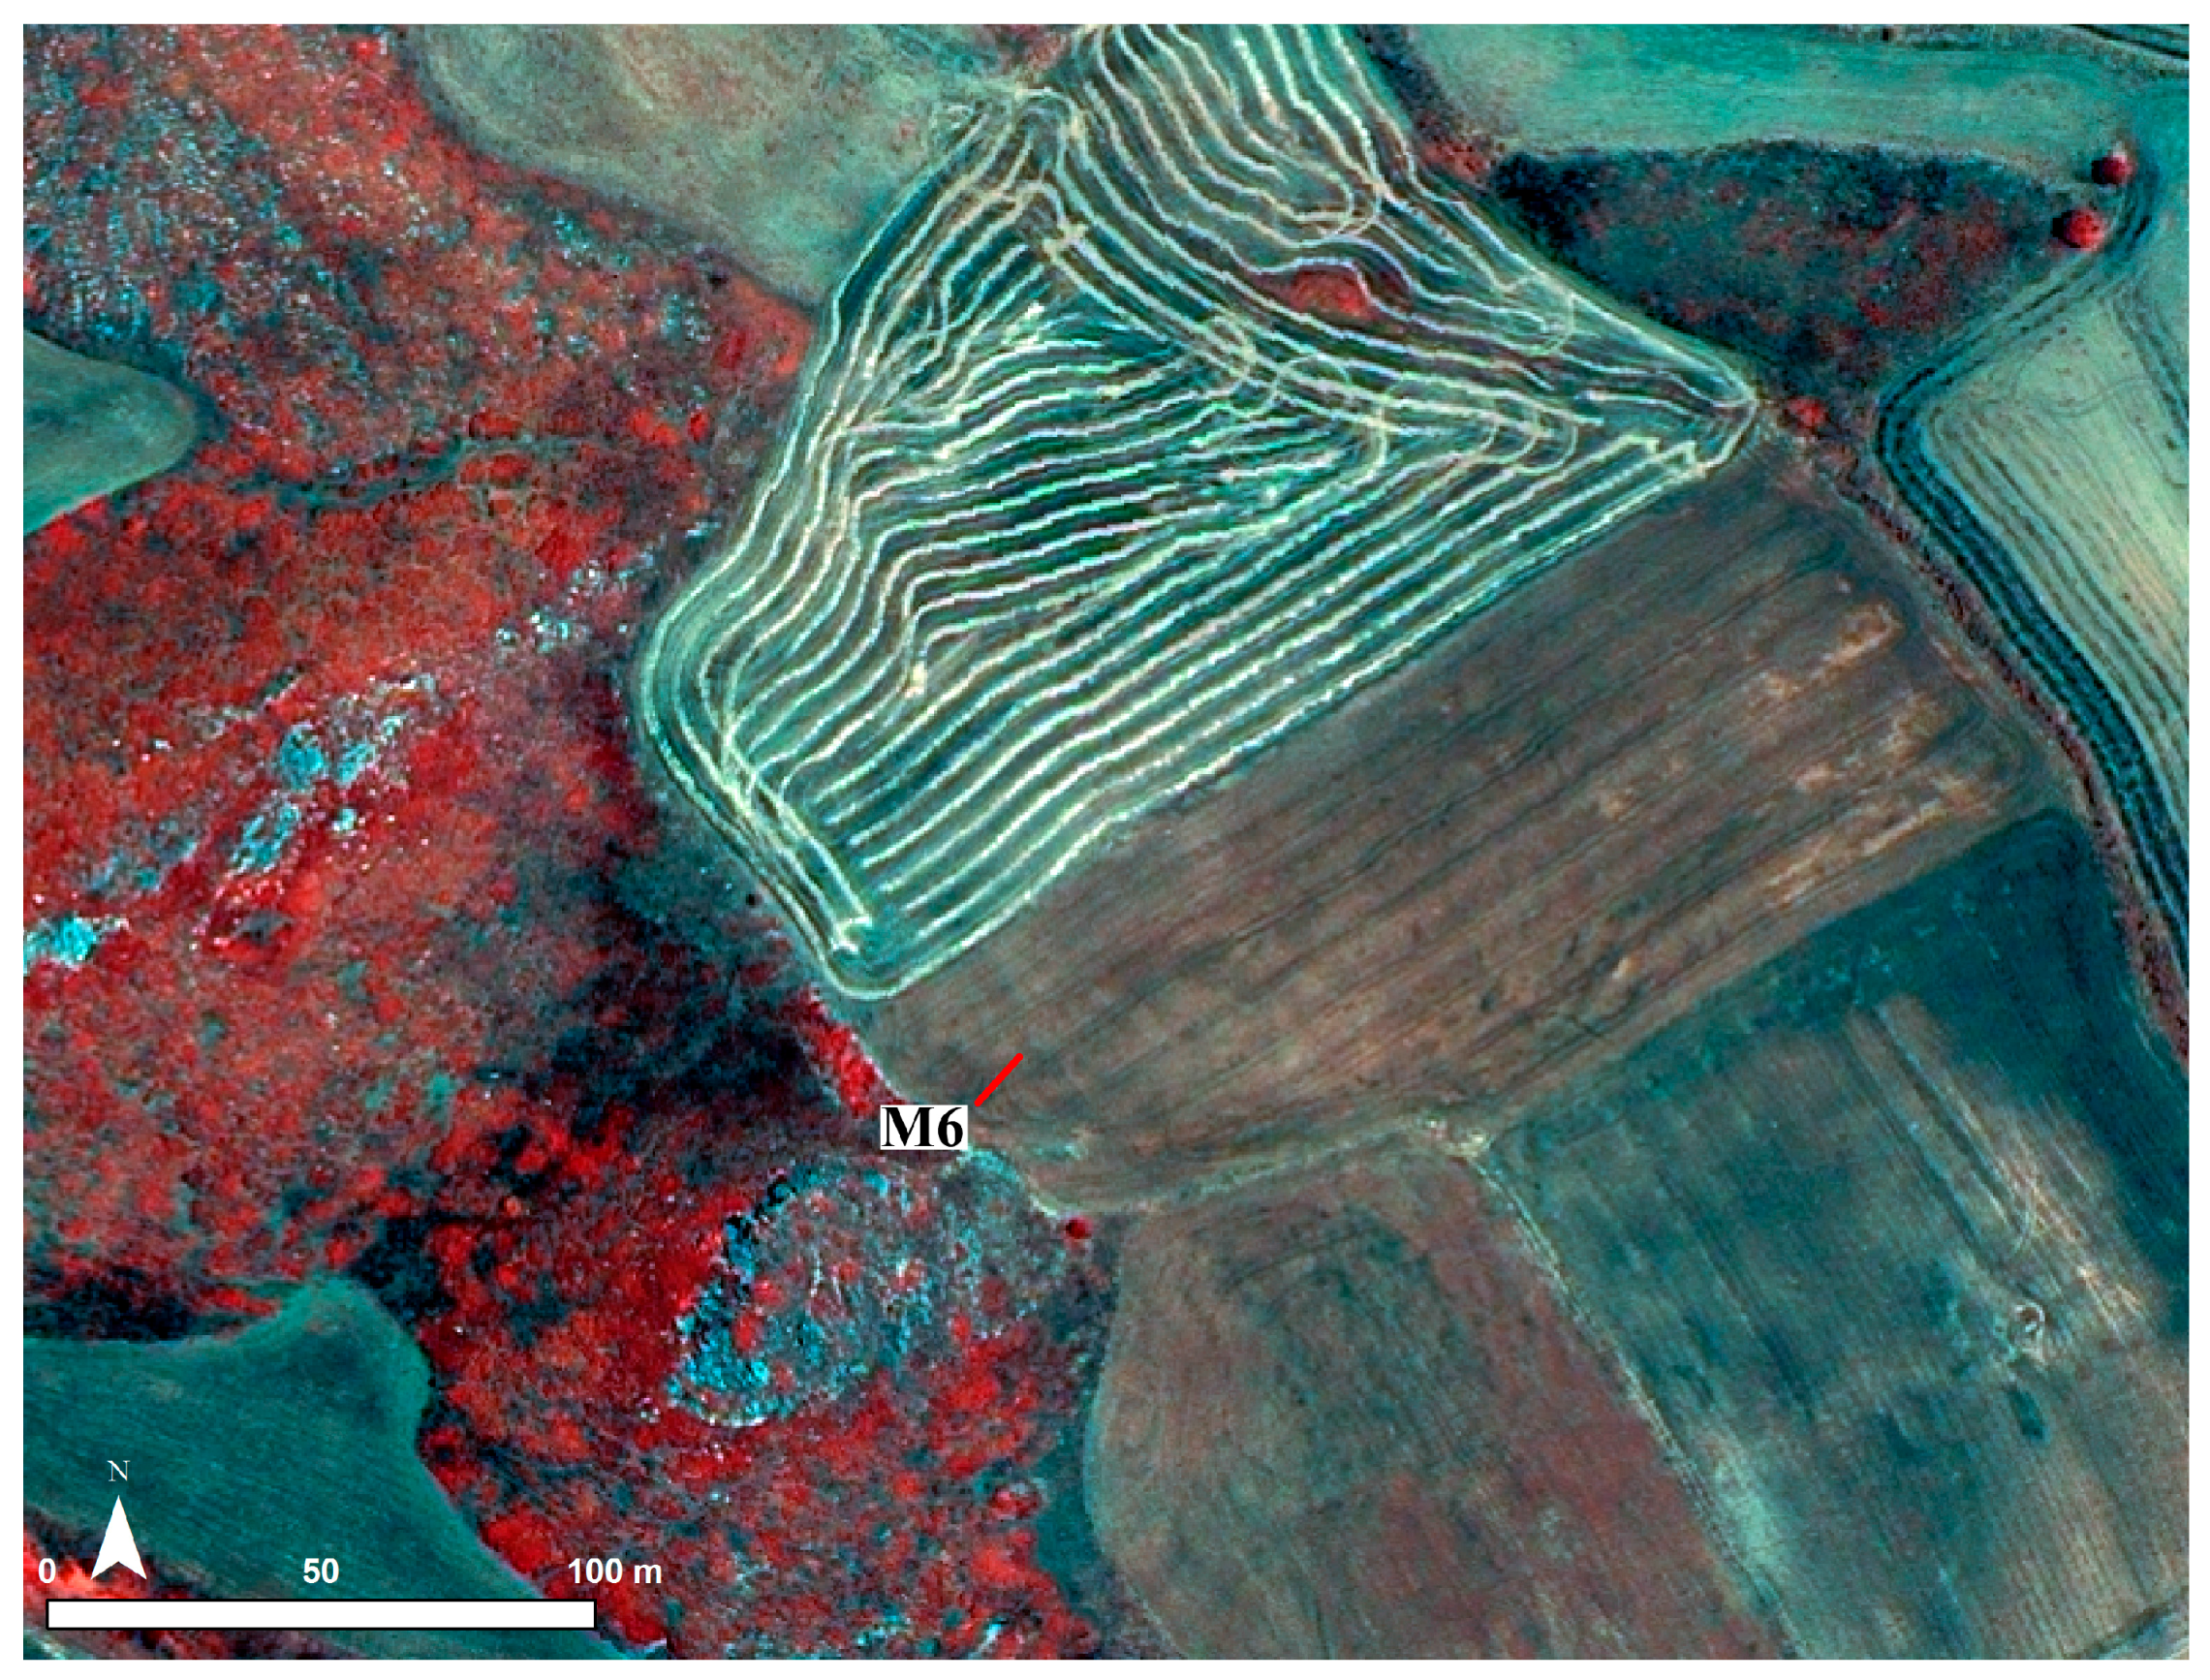
GeoEye-1 imagery (acquisition date: 3 June 2010) provides the most useful information when viewed in false color (bands 4-2-1) (
Figure 13). Due to limited vegetation coverage on site, the use of near-infrared part of the electromagnetic spectrum is not optimal. Nevertheless, this band combination is still useful for emphasizing the soil marks. For instance, northwest–southeast running M6 is identified as a ditch-enclosure and the shape and the extent of Perdika 2 is visible in the south.
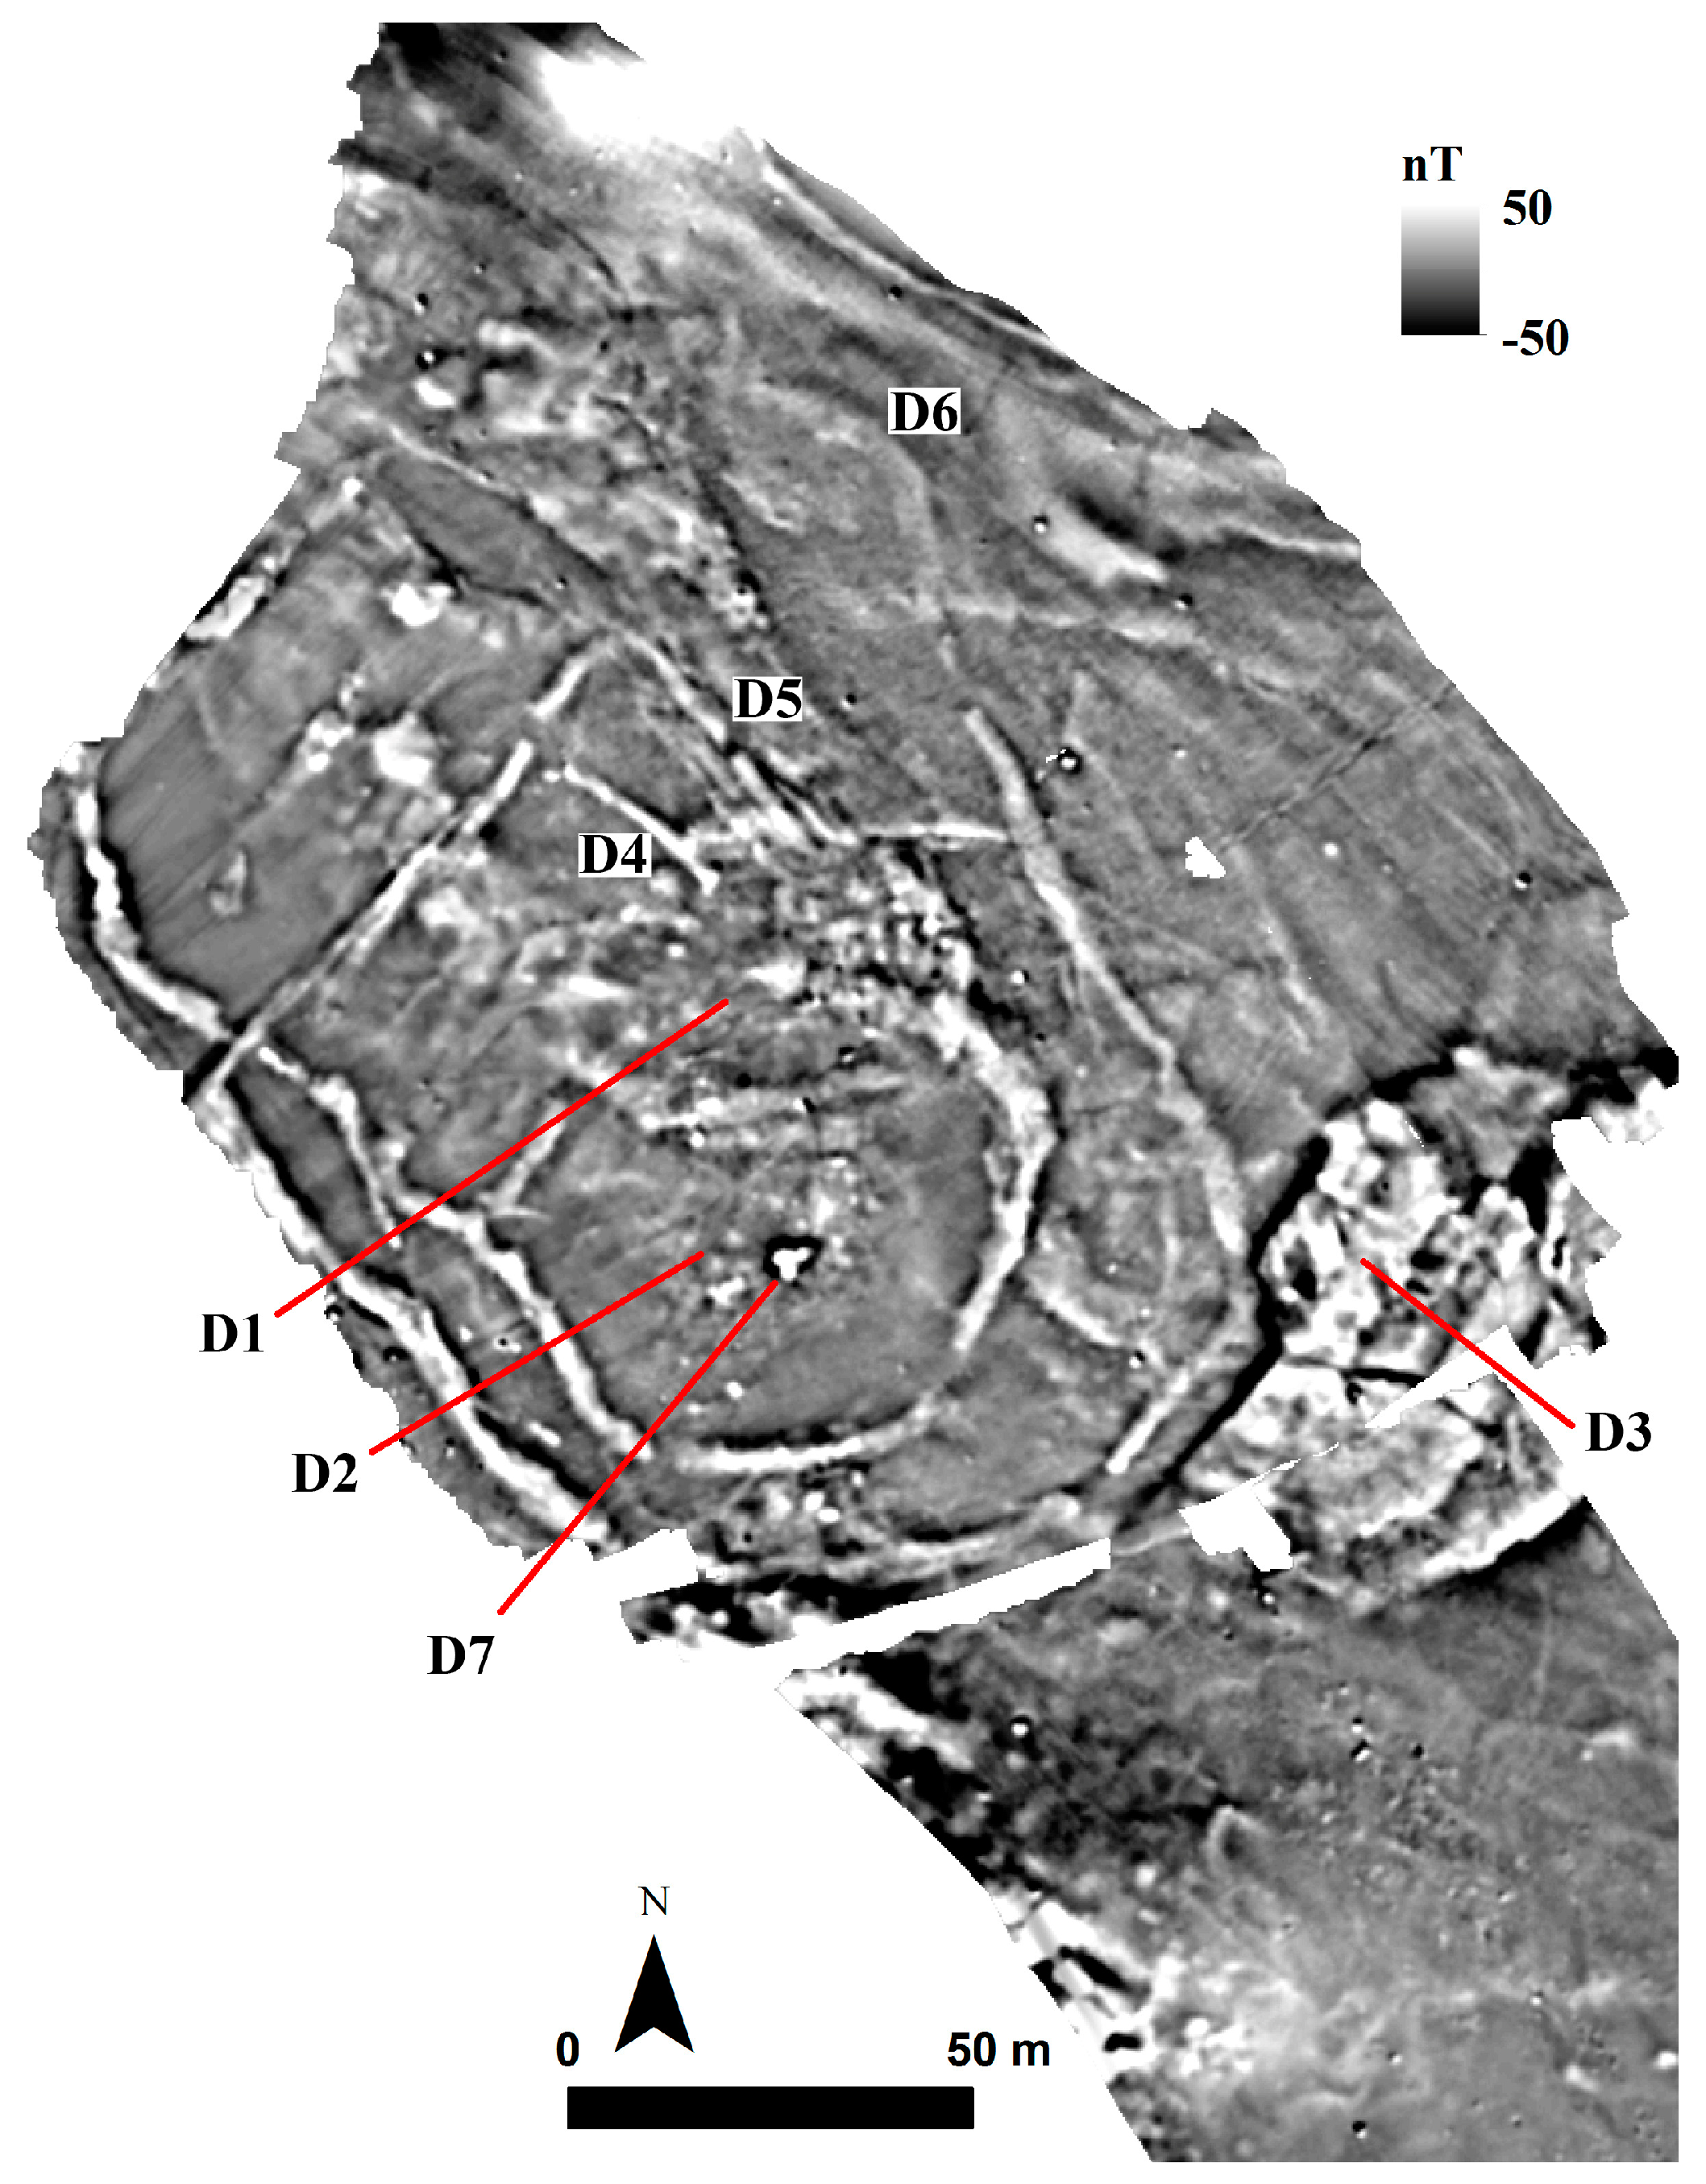
5.4.1. Geomagnetic Survey
Geomagnetic data reveal a complex site layout (
Figure 14). Multiple settlement cores and enclosures indicate various architectural and even cultural phases. It is almost impossible to provide secure chronologies of features due the nature of geophysical prospection. On the other hand, superimposition of magnetic signatures can be tentatively used to define the occupational history of Perdika 2.
Survey results suggest three settlement cores. Cluster D1 appears to be the oldest core that most probably had expanded towards the east acquiring its ellipsoidal shape. The expansion of ditch-enclosures, first D4, then D5, and finally D6 supports this hypothesis. As such, we can say that Perdika 2 was initially a smaller settlement and eventually expanded, in both its core and the area bounded by its ditch-system.
Cluster D2 must have been a later core since its primary enclosing ditch (D6) cuts the core D1. The secondary ditch makes use of northern section of D1 and expands the settlement area. If the proposed reconstruction and superimposition of D2 system is correct, the outermost ditch of D2 must have made use of existing southern ditch of D1. This also suggests that the previous layout of the site was known to its new inhabitants, further suggesting little to no hiatus in between the phases.
The third and the youngest core (D3) is the largest and bears no spatial relationship with the first two. It was built on top of the outermost ditch of D2 and thus can be dated to a later period than the largest extent of D2. There are no immediately visible architectural elements in D3, but the heterogeneity and the strength of geomagnetic data suggest that the area was the host for concentrated anthropogenic, and probably domestic activities.
Geomagnetic data provide limited information on architectural environment and this is valid for all three proposed phases. Even though it is possible to map areas of occupation (e.g., settlement cores) and to detect targets as potential structures (e.g., D7), there is no visible settlement pattern within the bounds of ditch-enclosures.
5.4.2. Electromagnetic Induction Survey
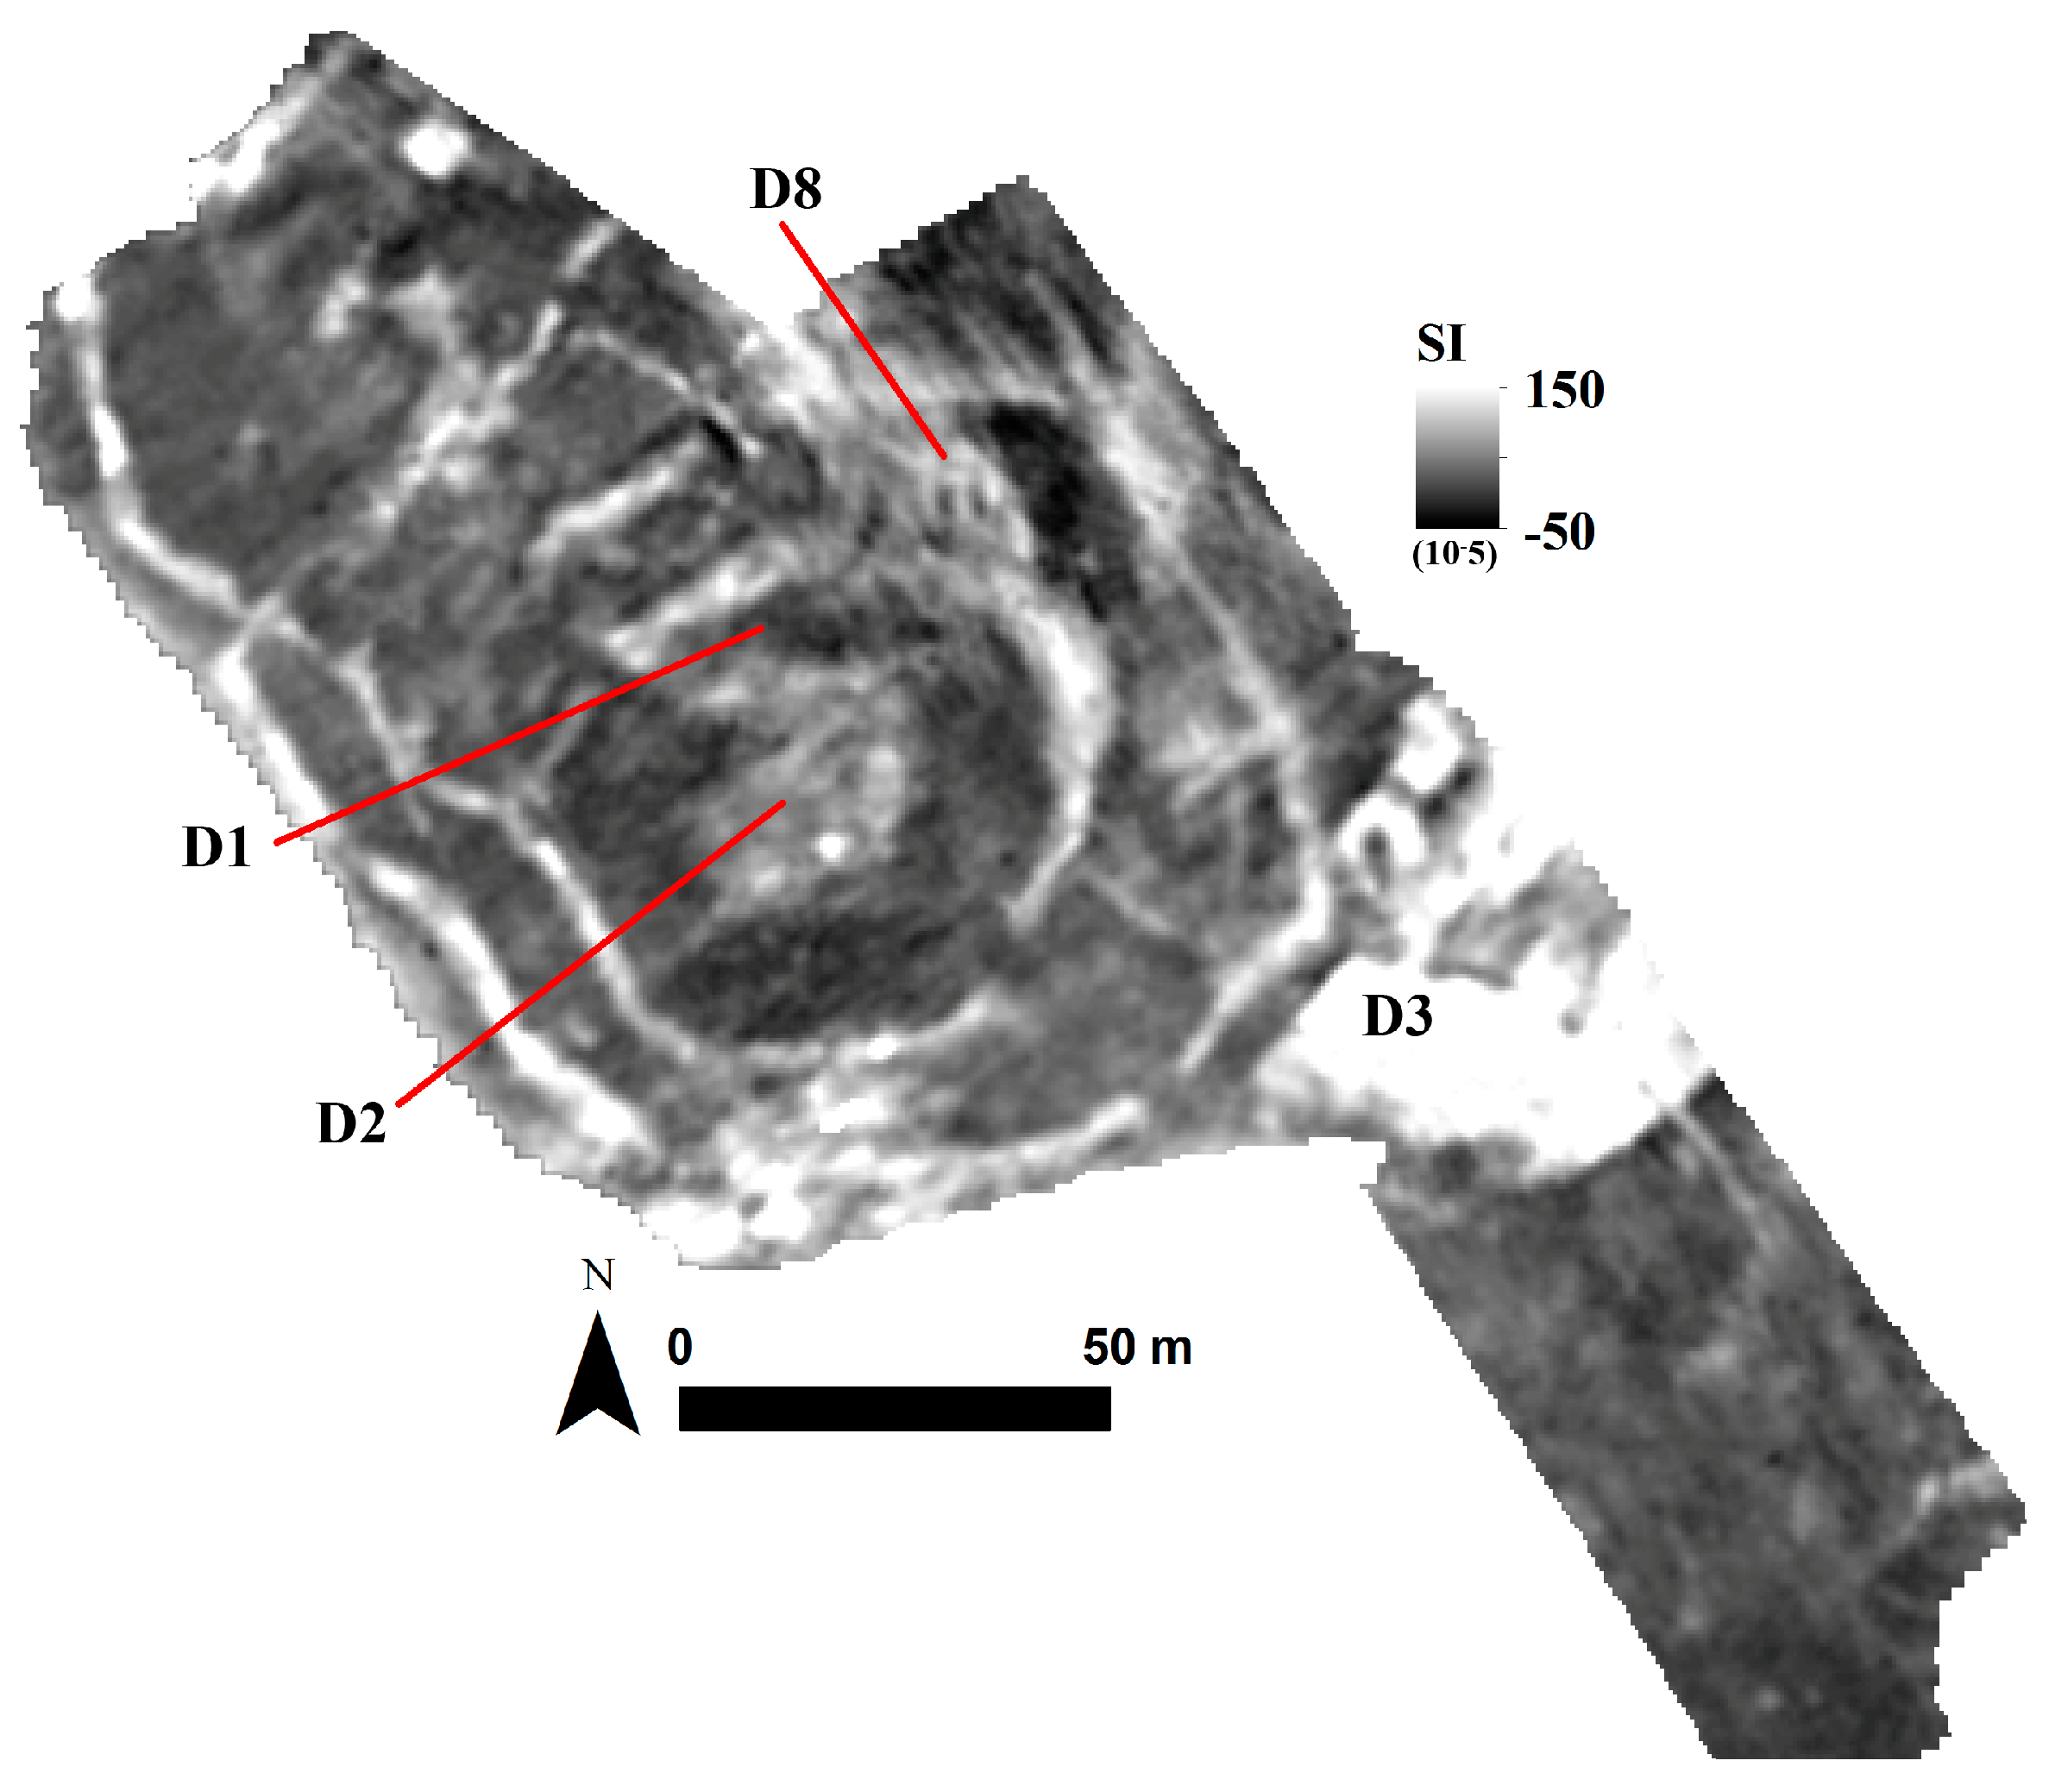
Magnetic susceptibility map confirms the multifaceted ditch system as well as the location and extent of settlement cores (D1, D2, and D3) (
Figure 15). Both of these feature sets are characterized by high susceptibility values. There are areas of low susceptibility values within the bounds of the settlement, suggesting relatively constricted anthropogenic use. There is no evidence for architectural features other than a possible two roomed building (D8) within core D1.
Electrical conductivity data show pockets of high conductivity (low resistivity) areas (
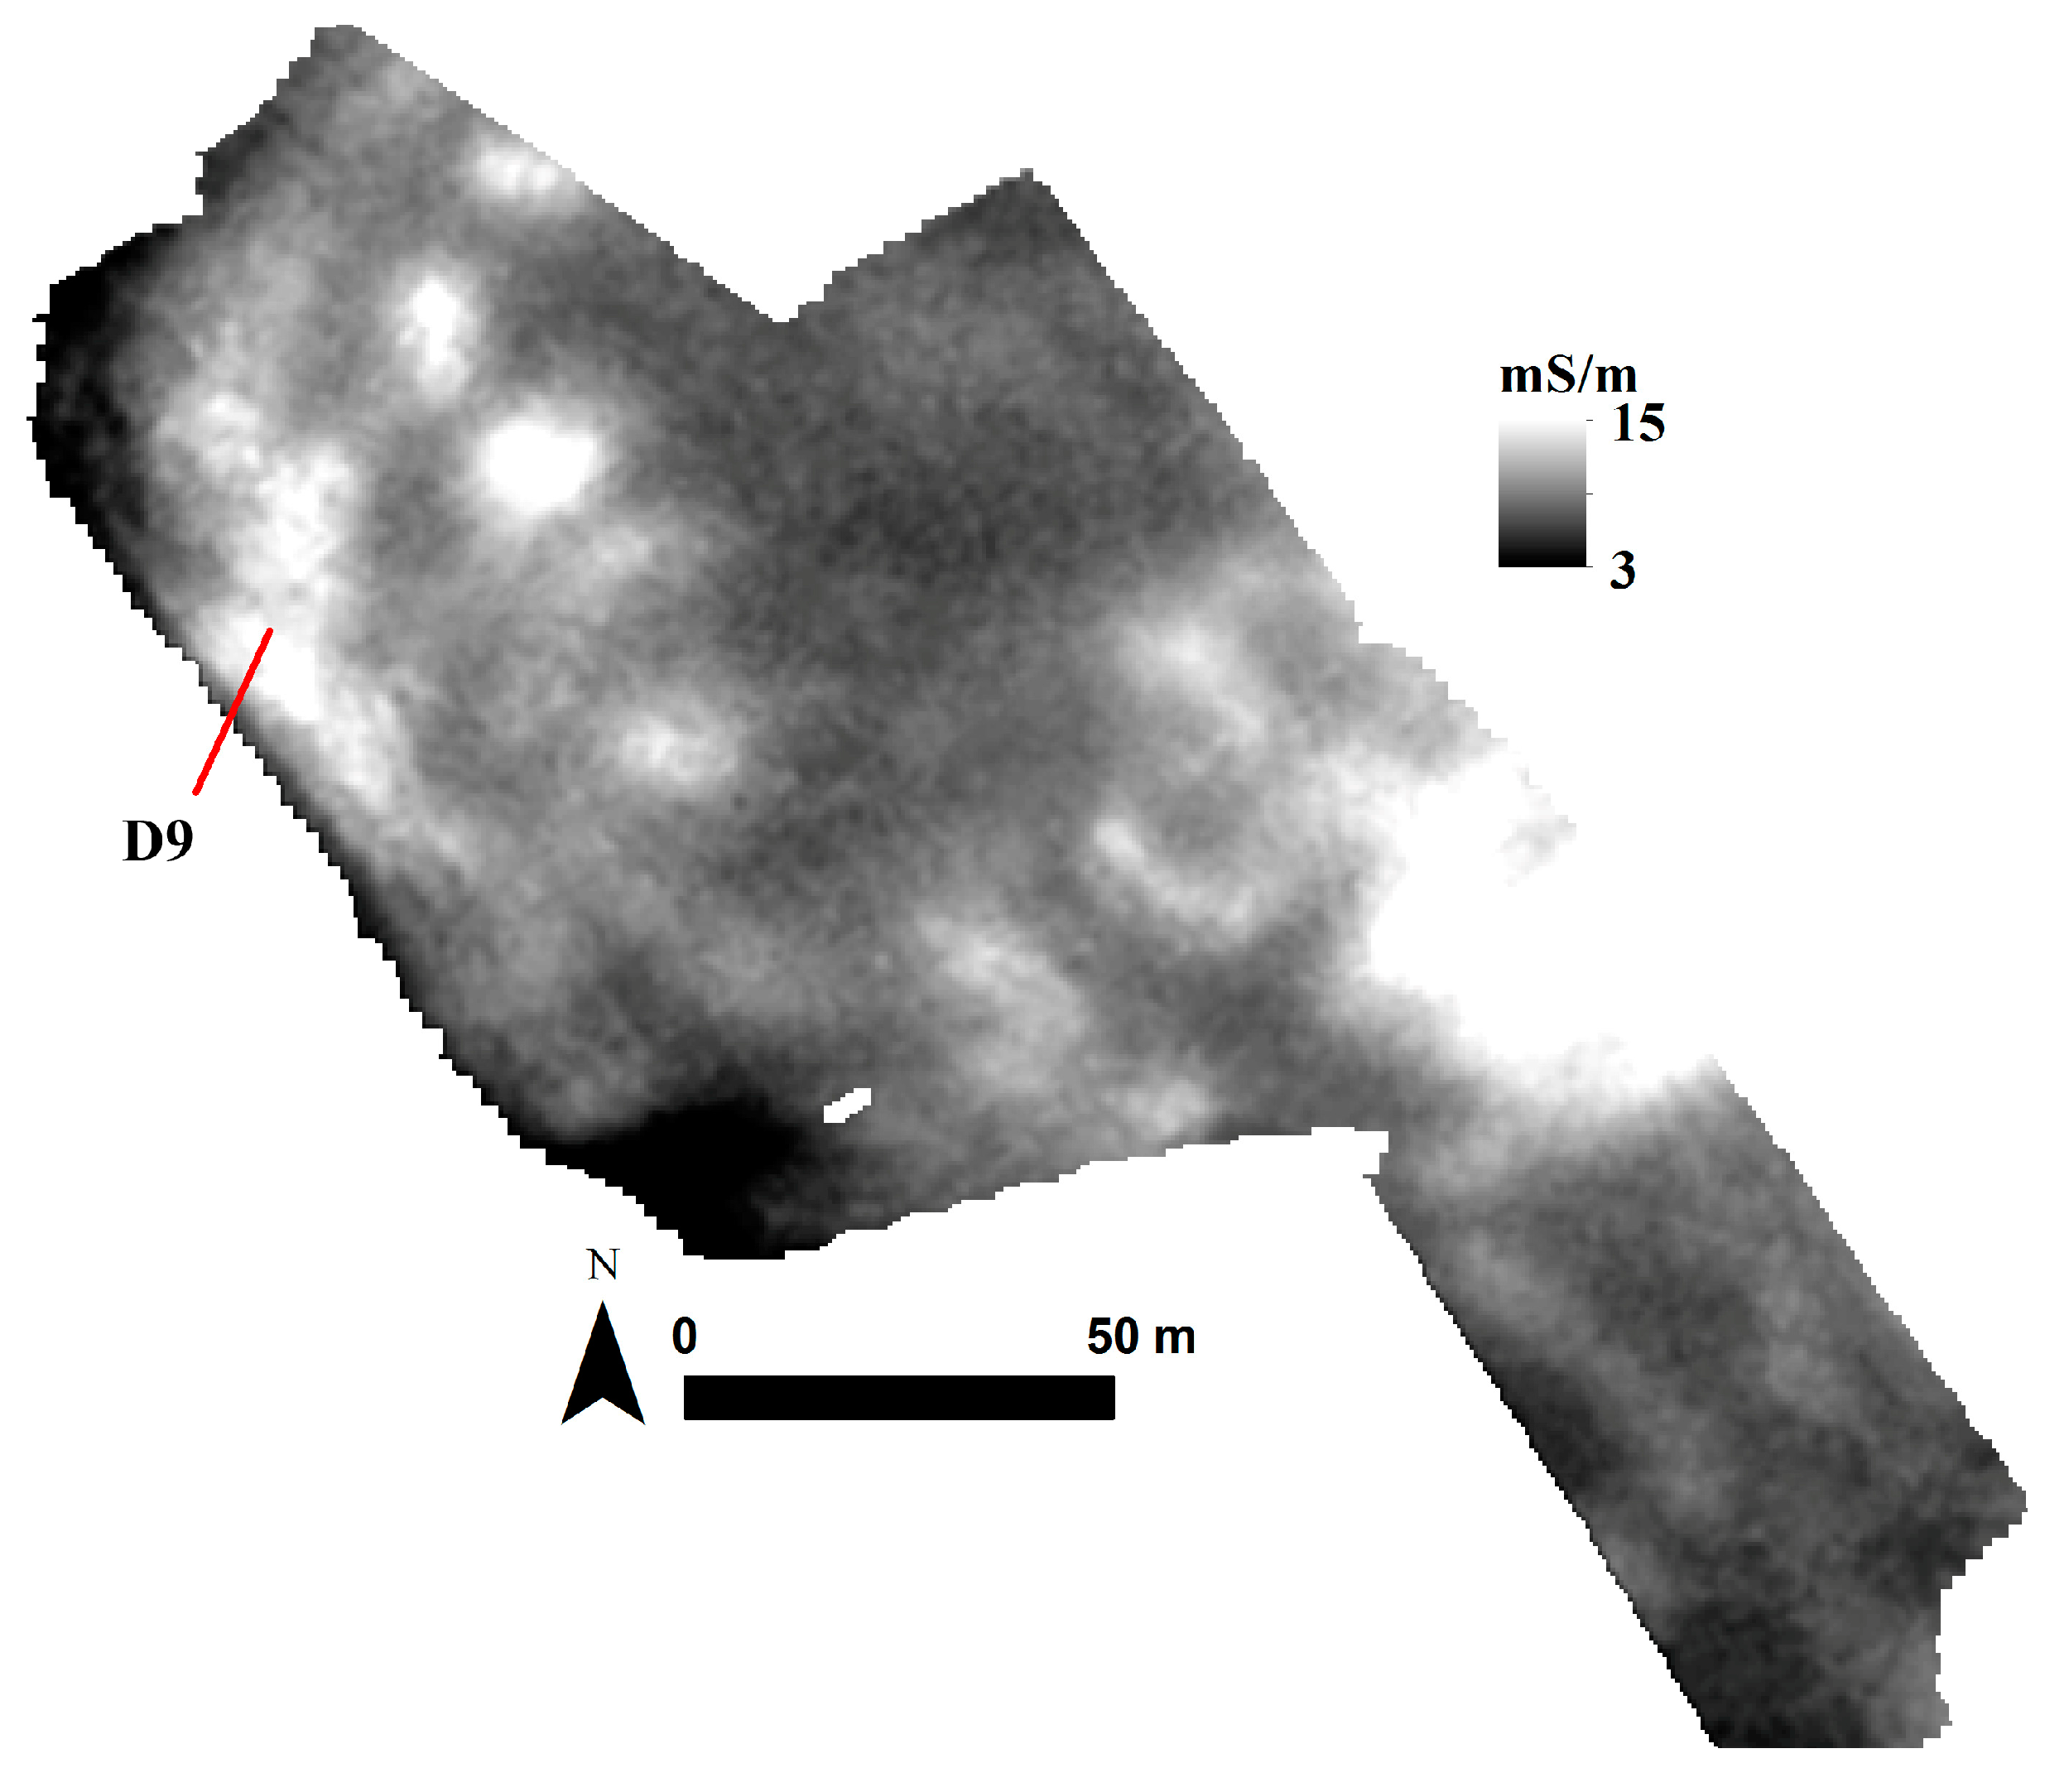
Figure 16). These pockets do not form a major pattern. Nevertheless, the cluster in the north (D9) mimics the orientation of outermost enclosure of D2, albeit with a slight rotation. The major high conductivity area is the core D3 itself.
5.4.3. Ground Penetrating Radar Survey
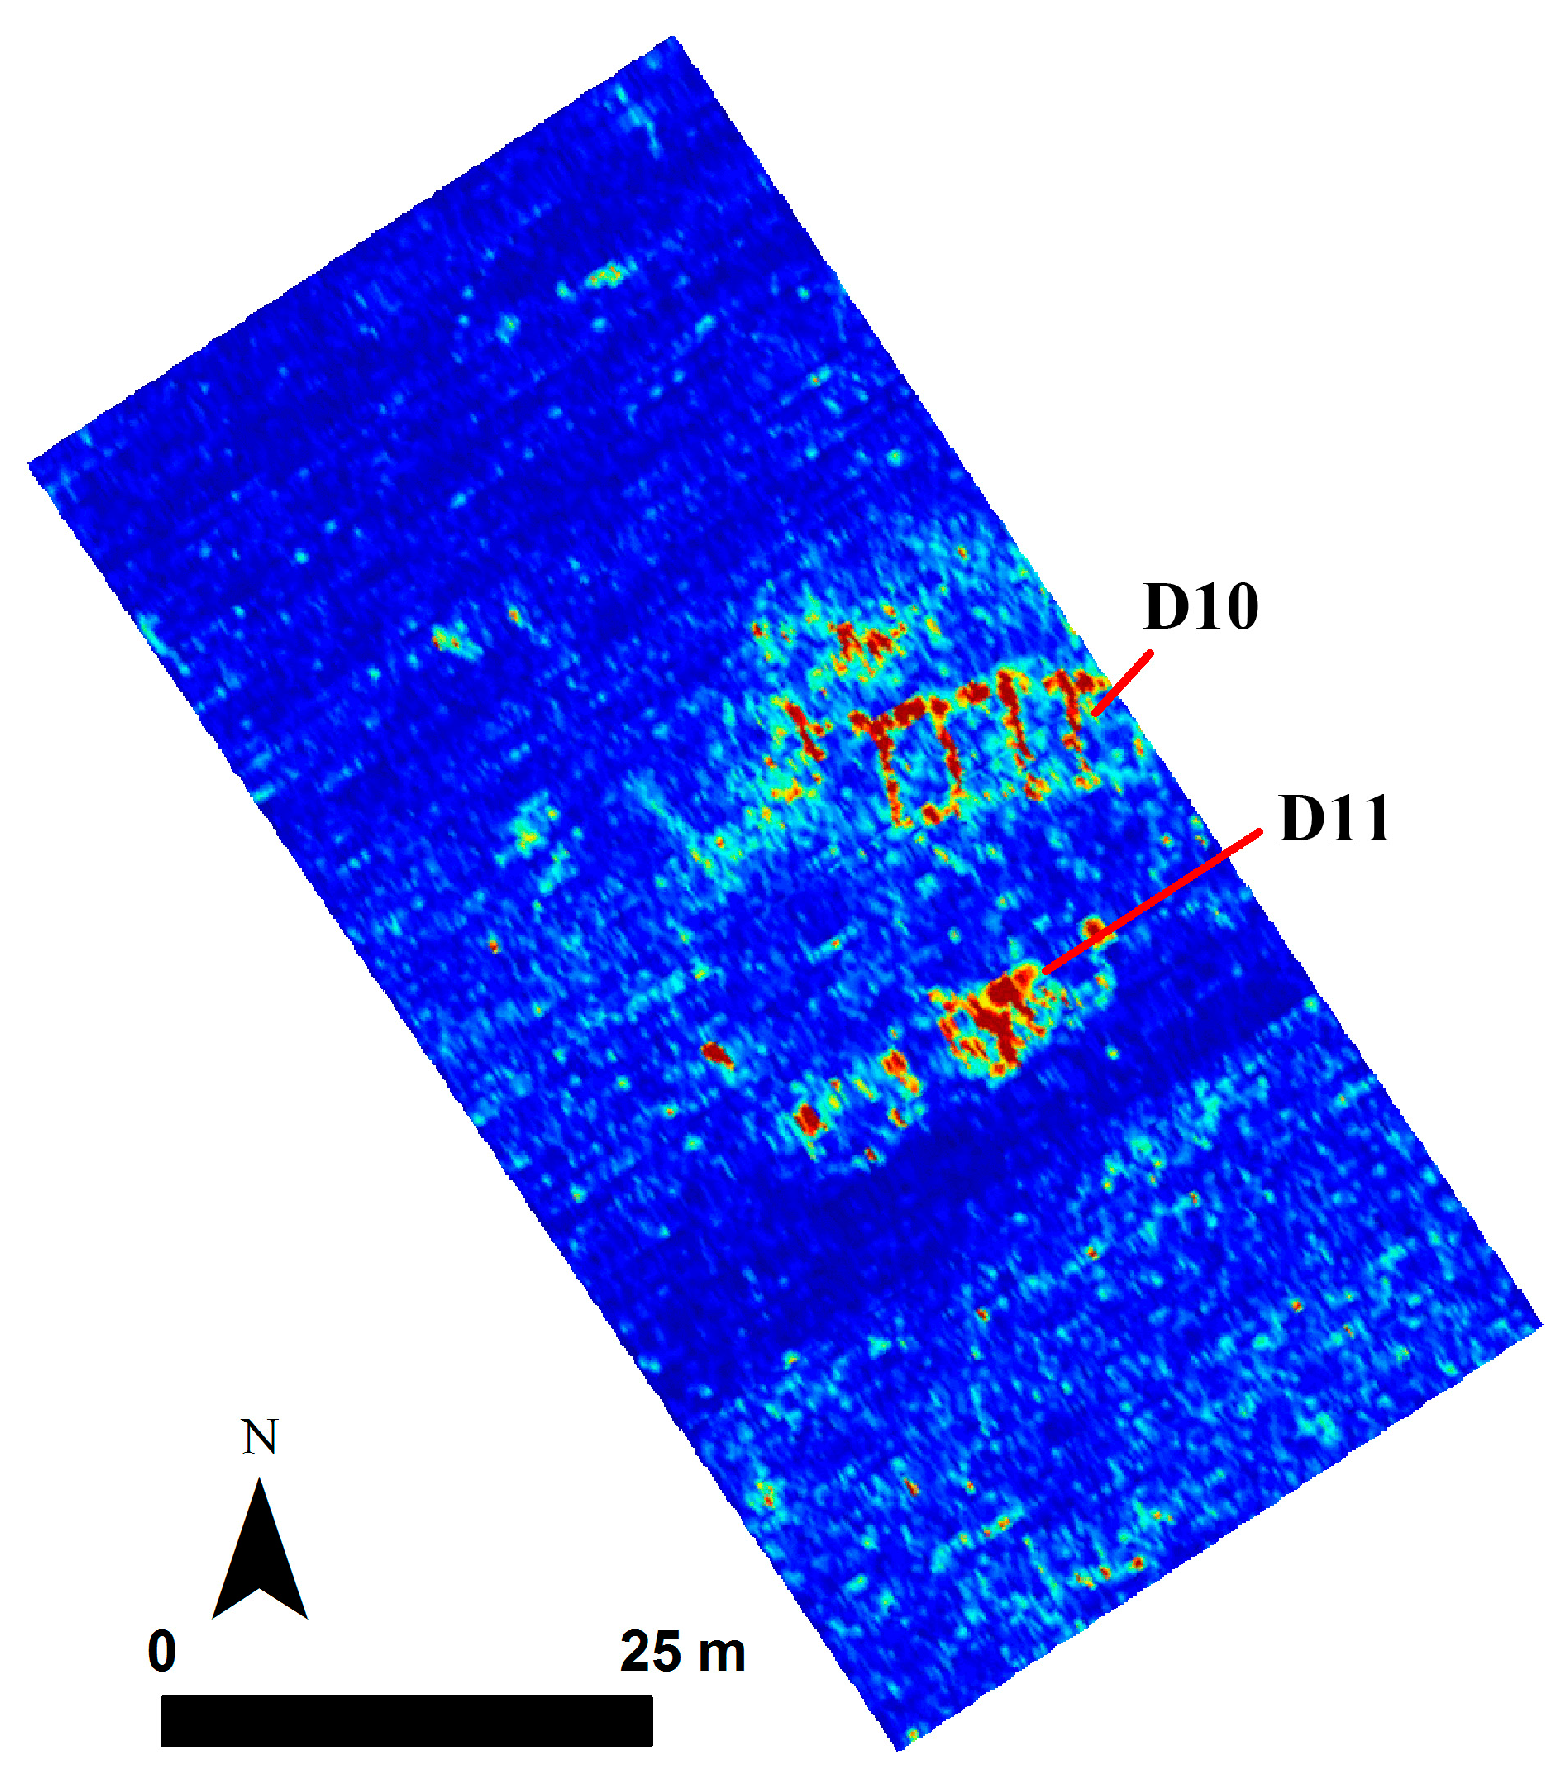
GPR signals document a structure with multiple rooms aligned in east–west direction (D10) and located at ~70–80 cm below the surface (
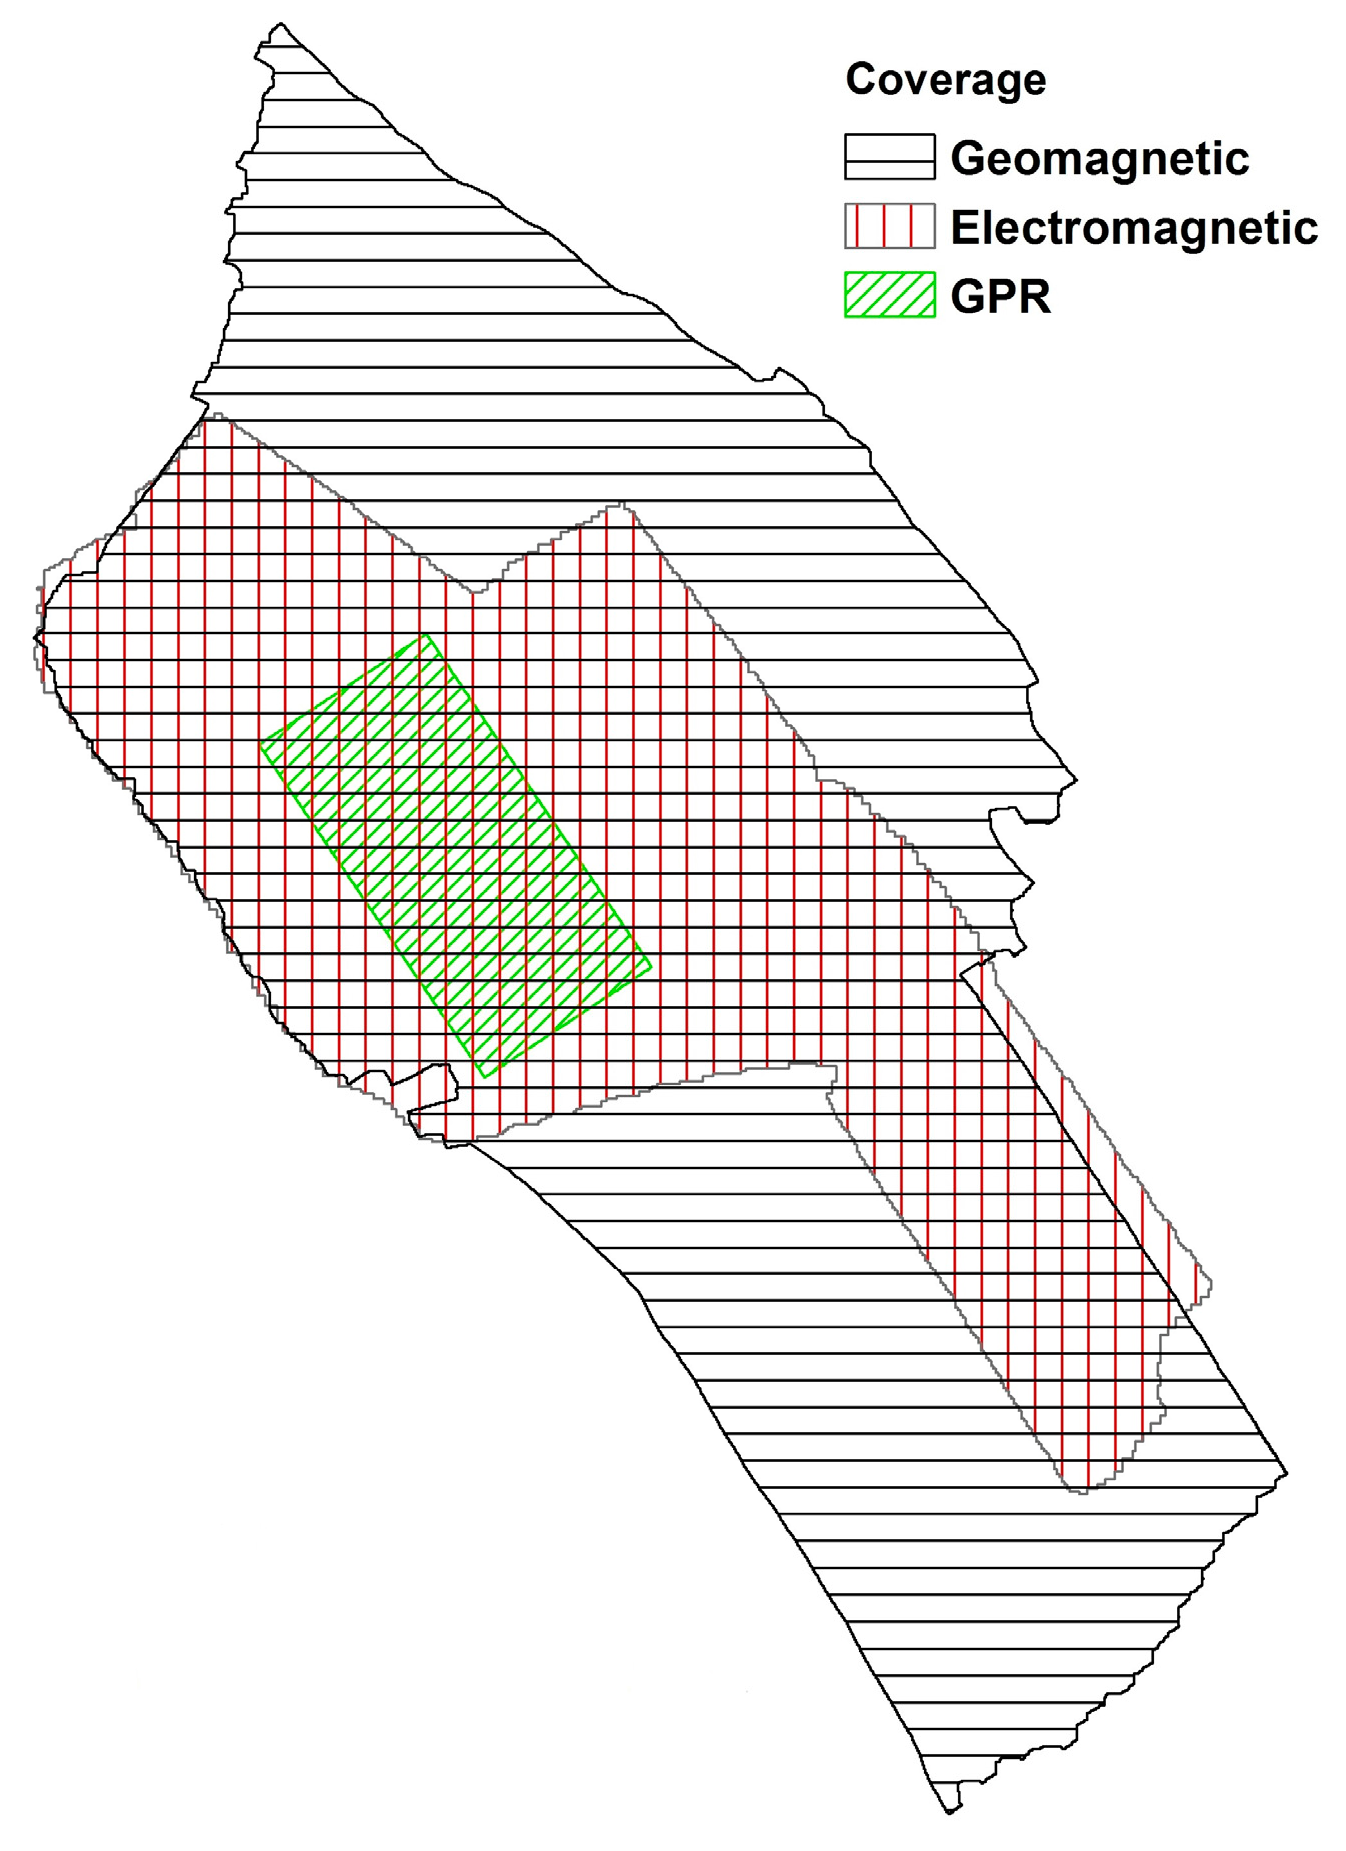
Figure 17). The particular structure is located at the central section of the site, which was the locus of the GPR survey (
Figure 18). The fact that this multi-room building is vaguely visible in magnetic data suggests intact, non-burnt architecture with substantial stone wall foundations. To the south of D10, there are indications of another structure (D11) with little to no preservation. This structure appears to be smaller than D10, but is still within the bounds of settlement core D2. There is no substantial evidence for built environments outside of the D2. This is particularly important for relative dating of the D1 with respect to D2. GPR signals do not pick up building material even at deeper levels within D1, supporting the hypothesis that D1 is dated to an earlier period than D2 and its associated ditch enclosures.
The enclosures are completely absent in the GPR data. The lack of high reflections in the form of building materials further supports the hypothesis that these enclosures were ditches rather than circuit walls. Therefore, GPR data compliment other geophysical prospection methodologies for the determination of building materials making these enclosures (
Figure 18).
5.5. Perivlepto/Kastraki 2 (22.707° E, 39.296° N)
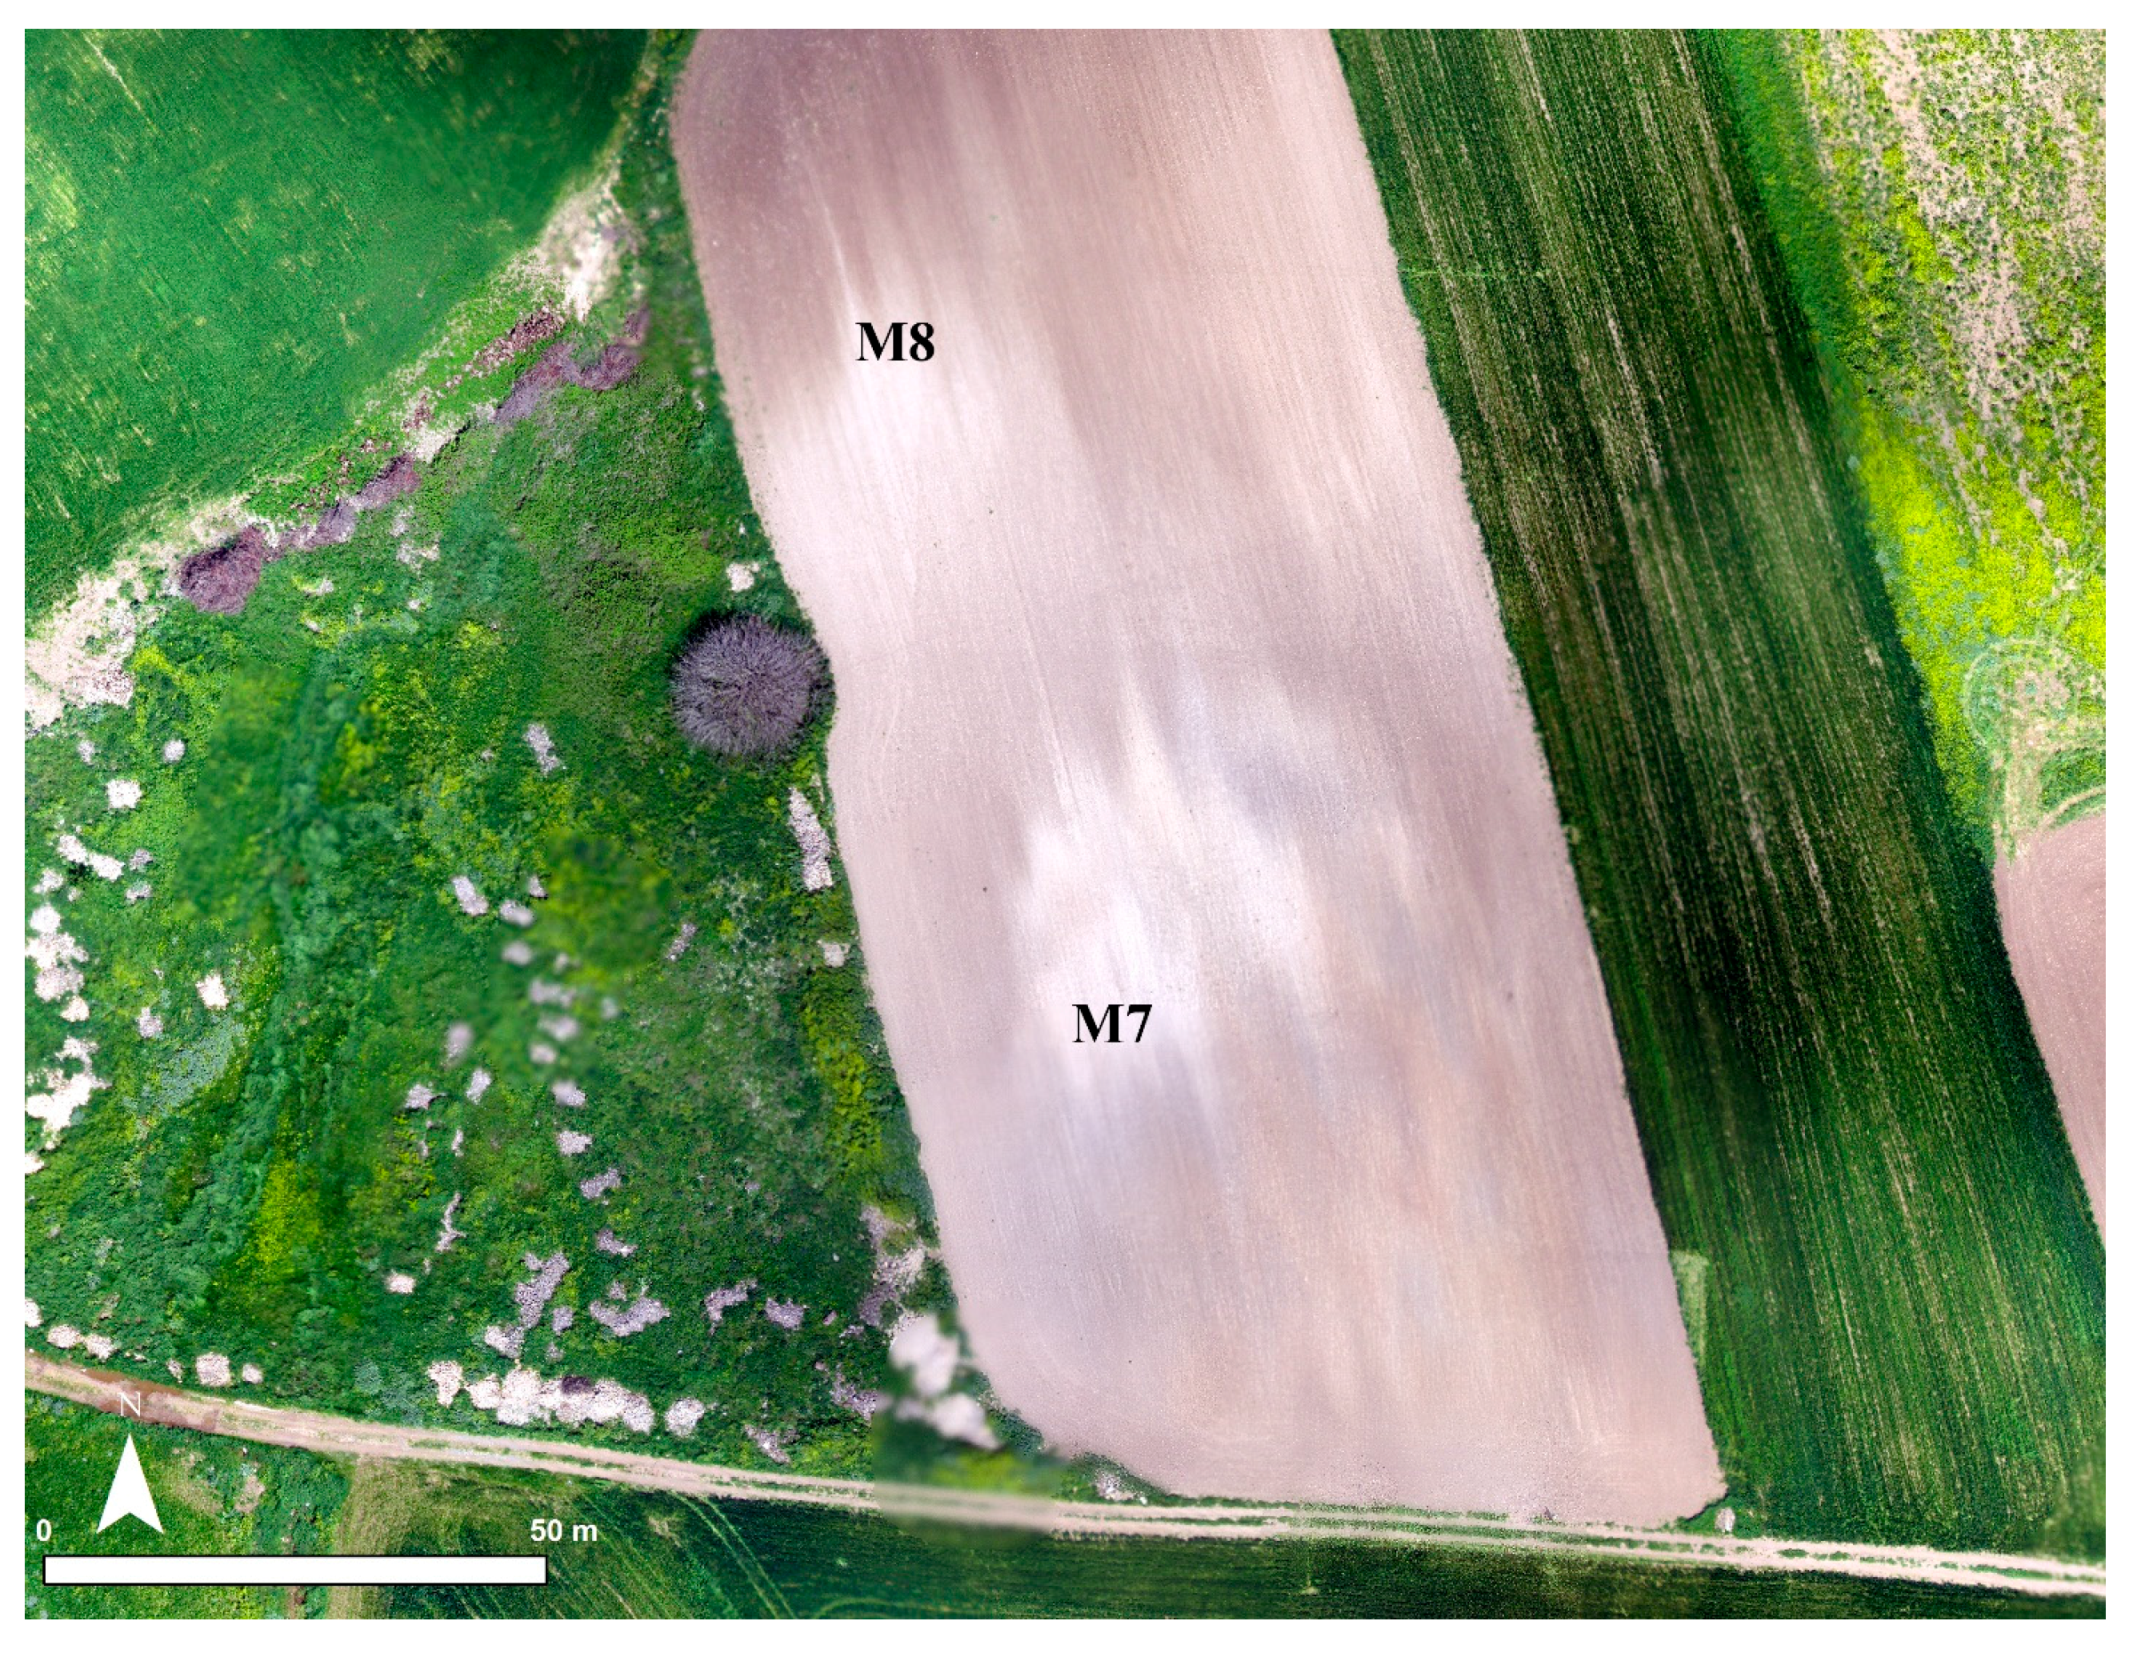
Droidworx RPAS imagery reveals two circular soil marks. Feature M7 represents the Perivlepto/Kastraki 2 (
Figure 19). The southern circular core and two arching marks to the northeast match with the results of geophysical prospection (see below). The jagged edges in the north reveals the impact of modern plowing and raises concerns for the preservation of material culture. Feature M8 is an unexpected extension to the site. The separation further suggests a dual occupation at Kastraki 2, M7 representing the main habitation.
5.5.1. Geomagnetic Survey
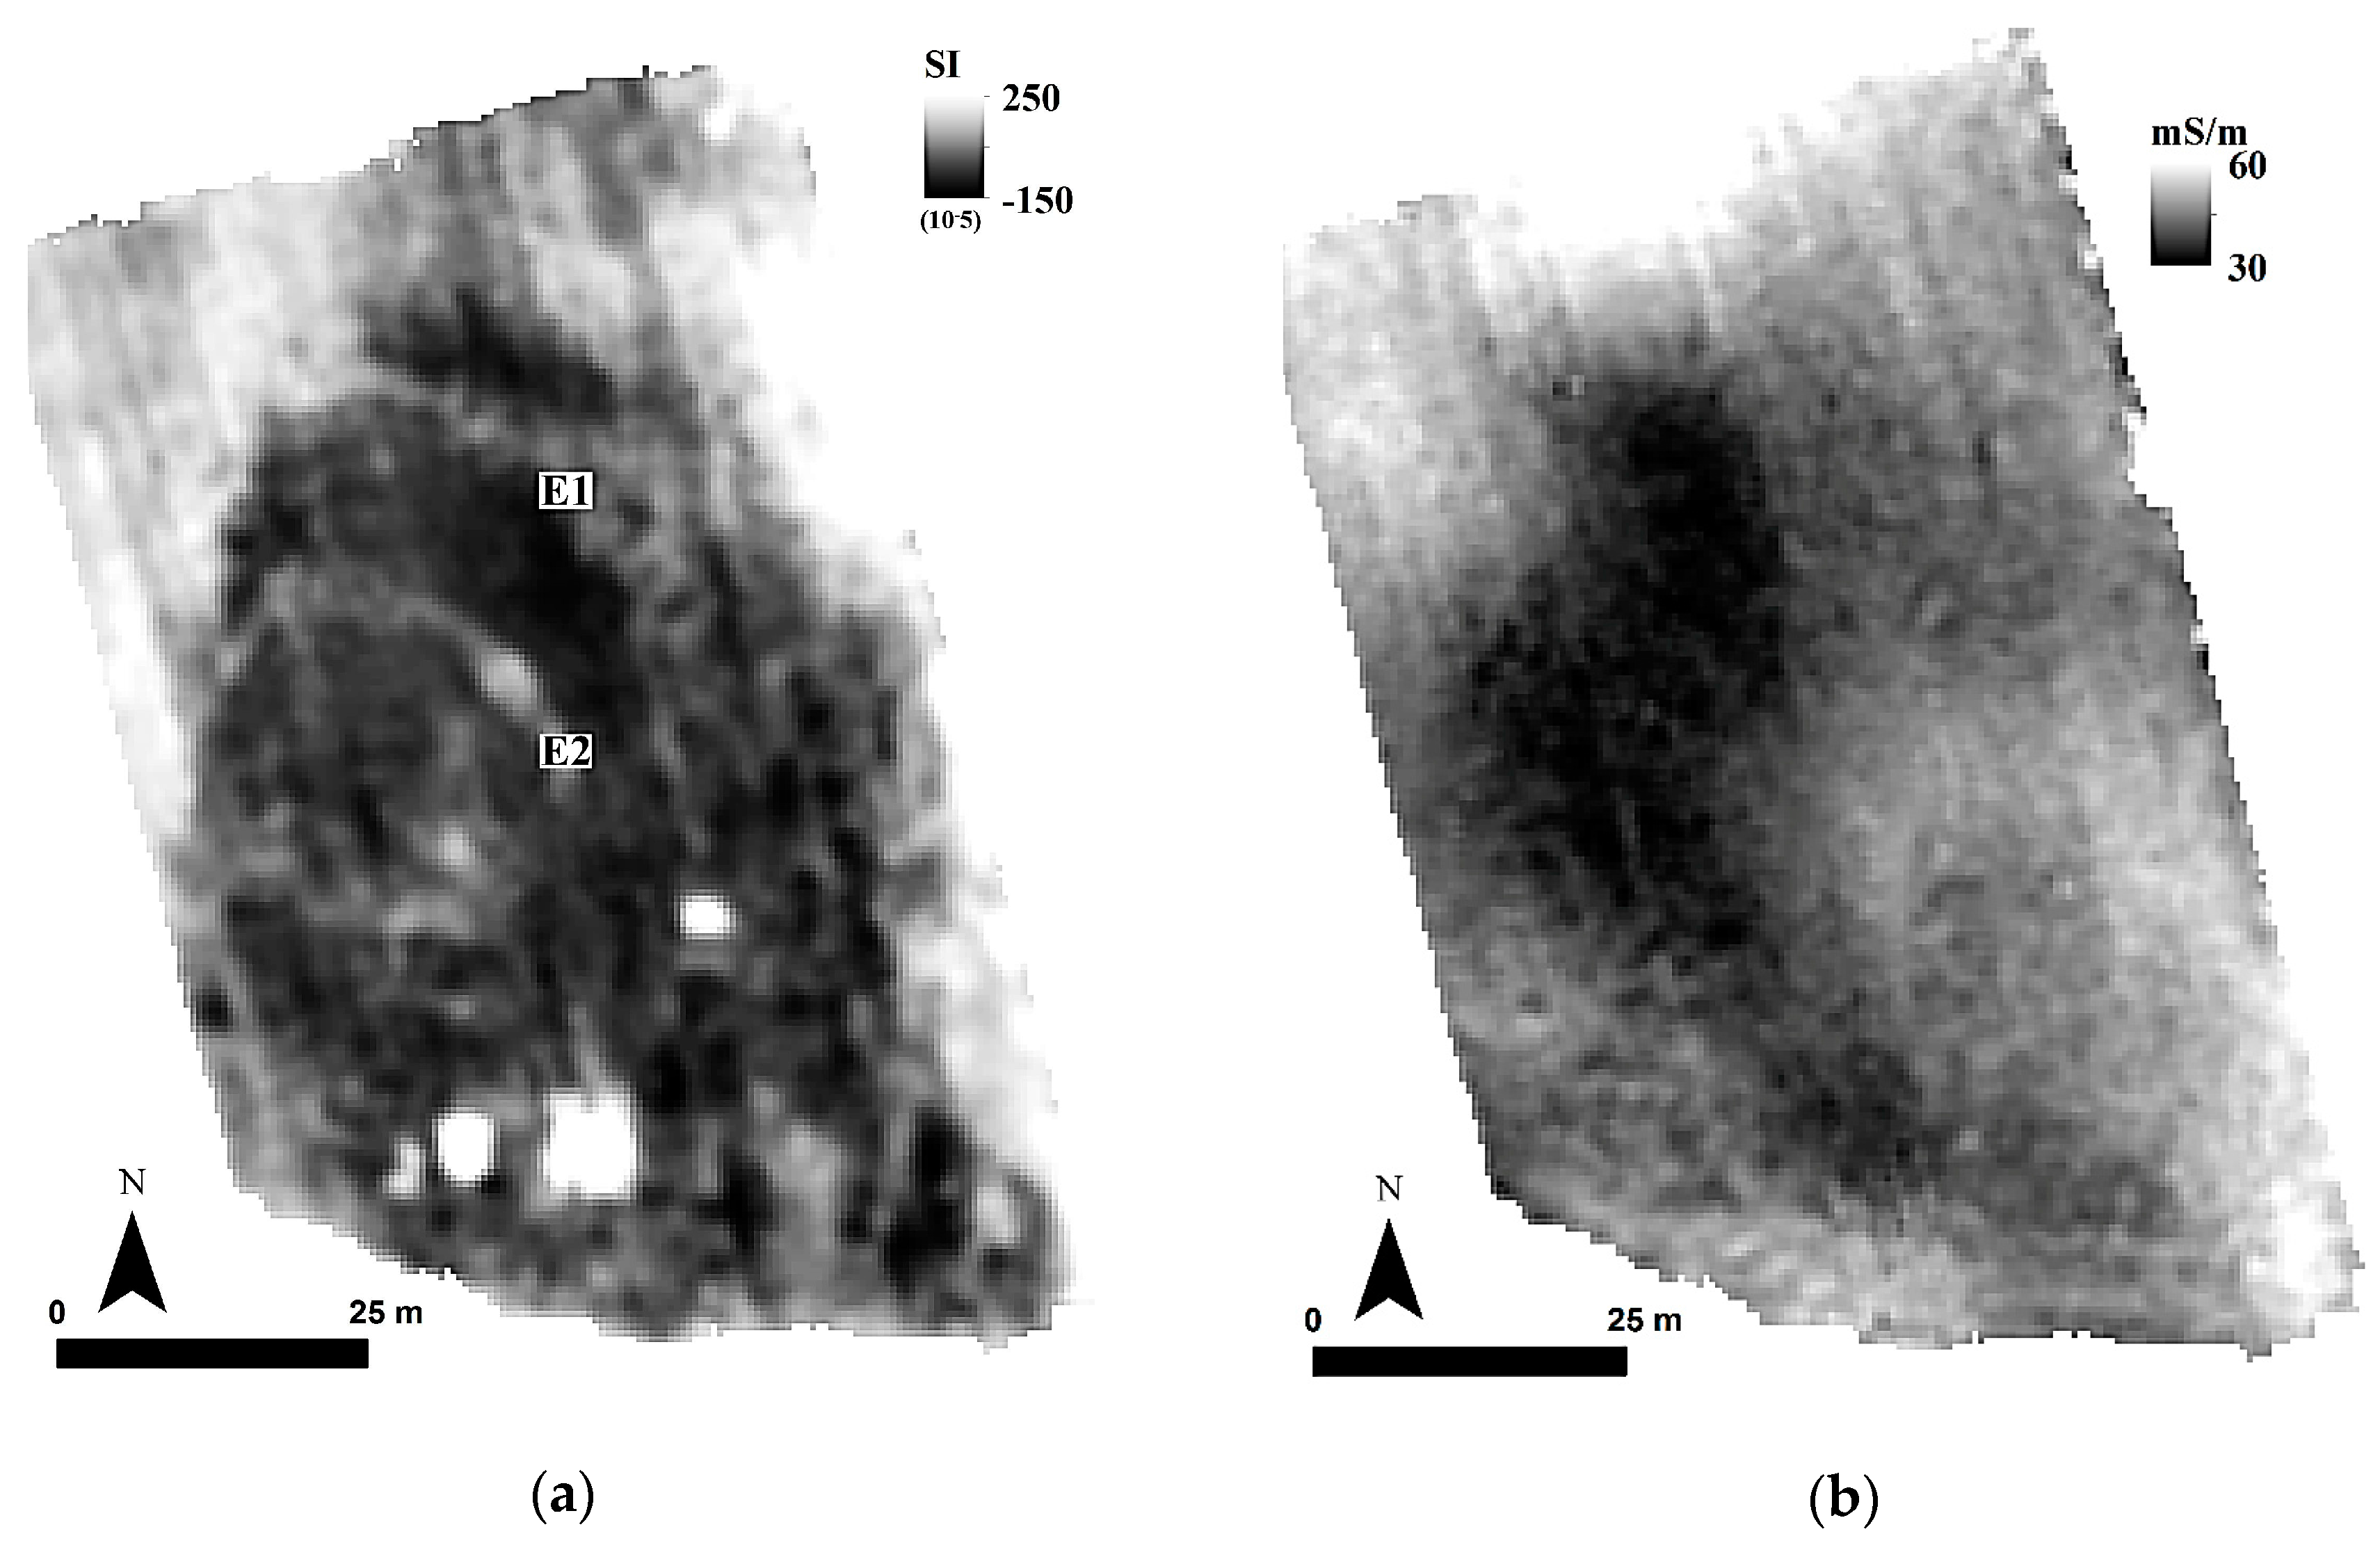
Traces of enclosures are visible surrounding the core of the settlement (
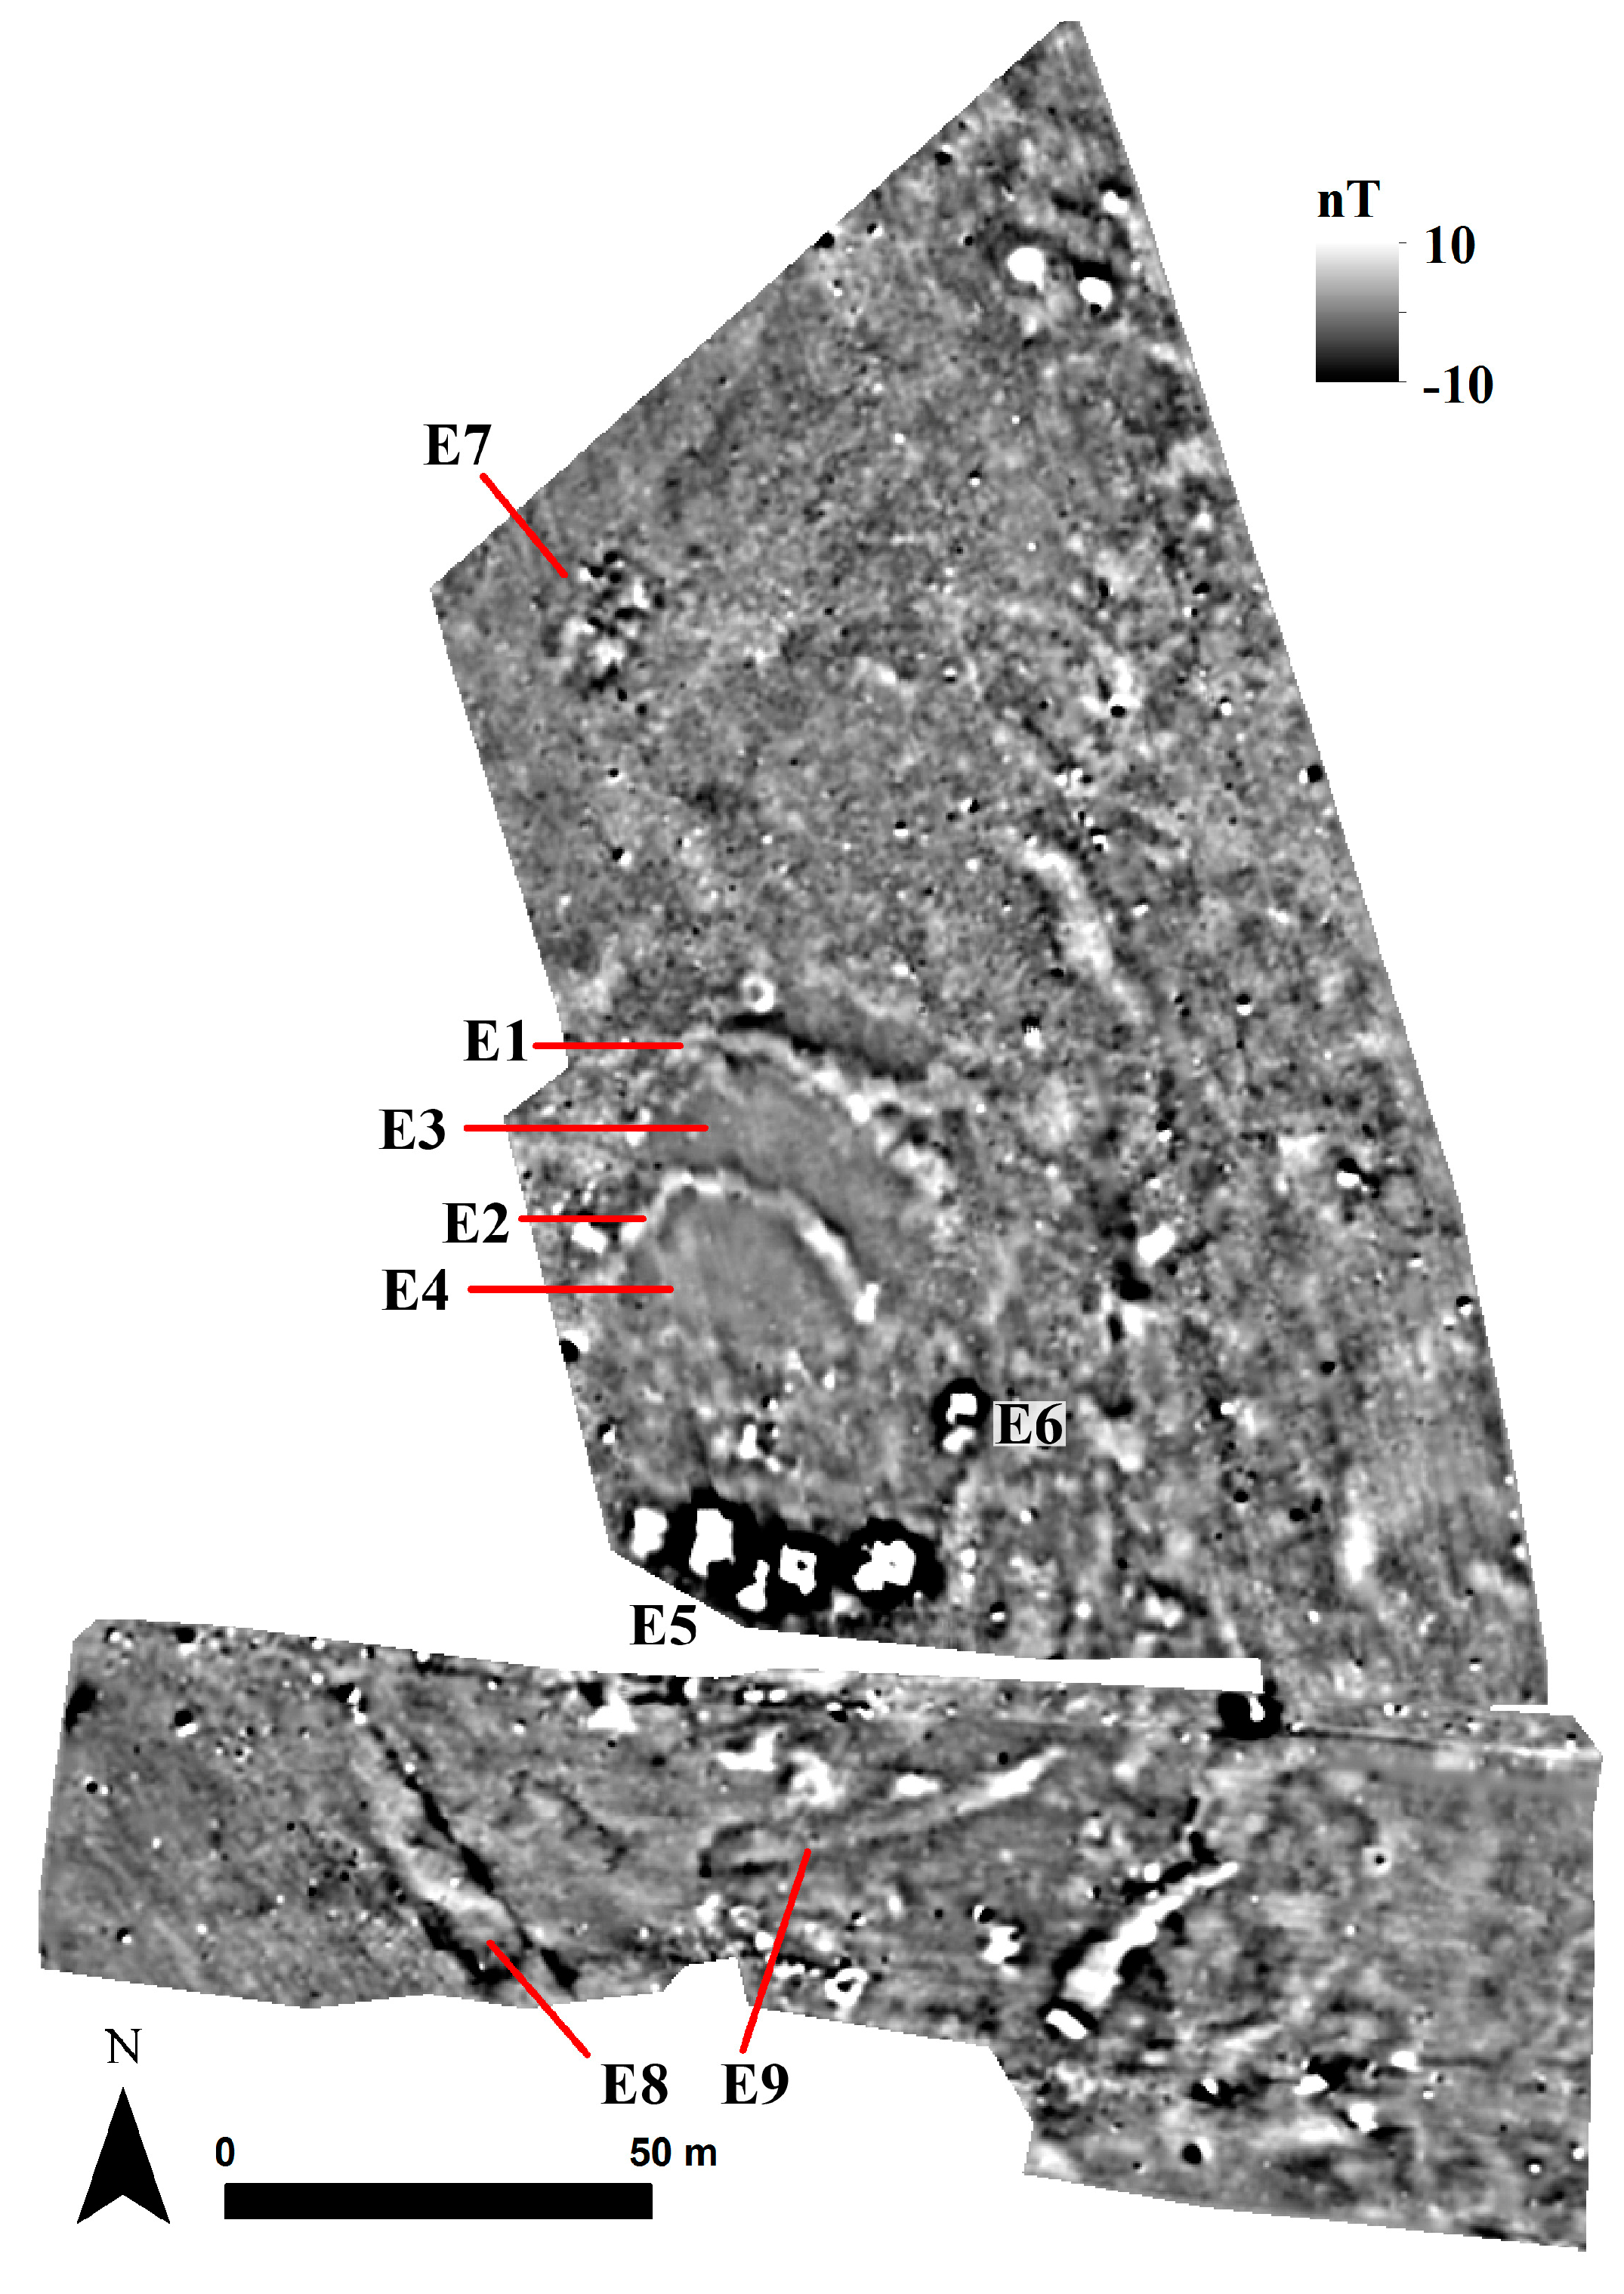
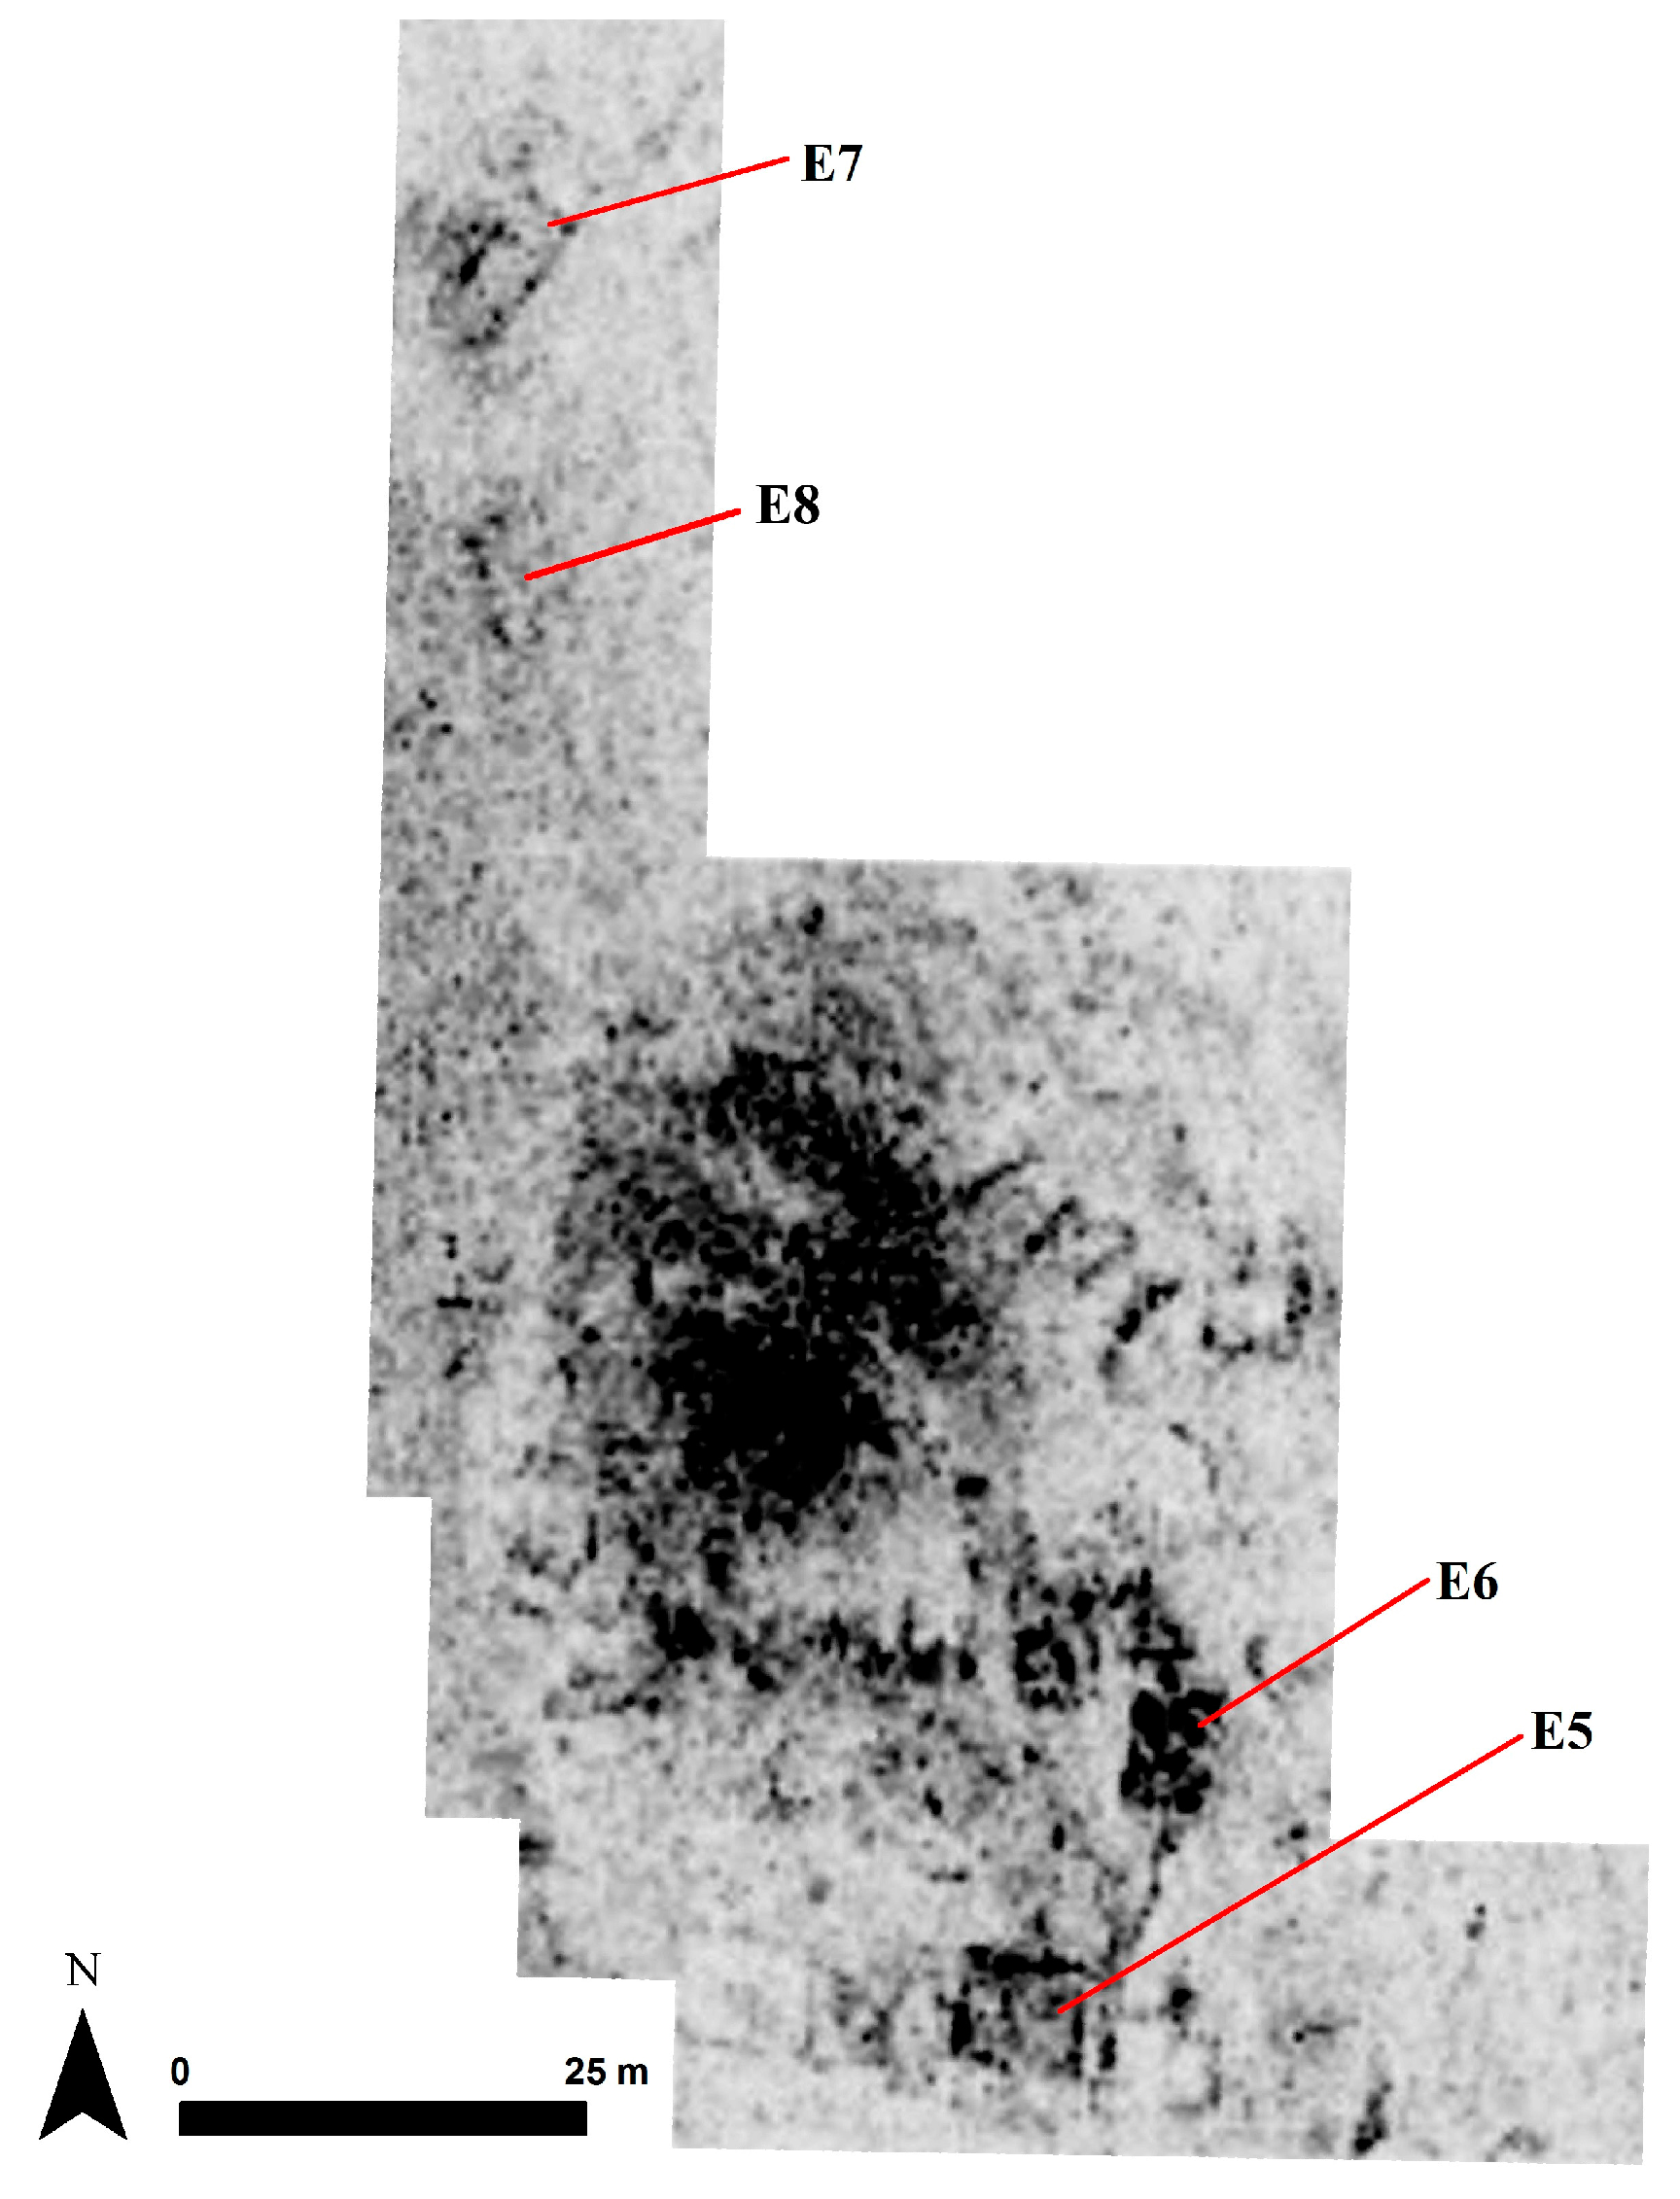
Figure 20). Their higher magnetic values and shapes suggest these enclosures were probably ditches. Immediately, to the north of the core, the half-circular features E1 and E2 bound the settlement. It is not certain if these ditches were initially complete enclosures, but filled/destroyed later or if they were purposefully built as such. There is a similar setting in the southern portion of the settlement. Ditches bound the site, but are only visible in parts (E8 and E9). In consideration of their spanning angles, enclosures in the north (E1, E2) and in the south (E8, E9) were not built to meet. Therefore, it is possible to argue that Kastraki 2 never had a complete ditch running around the site, but they were opportunistically located in order to serve for specific uses.
Southern portions of E1 and E2 are magnetically empty. In comparison to the rest of the data, these two areas (E3 and E4) must have contained very limited number of features and must have hosted a different kind of human use of space, but not habitation. The prospection further reveals highly burnt structures to the south of the settlement (E5). They are aligned on east–west axis except for the one located further north from this cluster (E6). Their magnetic signatures suggest intensive burning and mask any visible internal partition.
To the north of the settlement, and 50 m away from the northernmost, there exist indications of habitation in the form of free standing buildings (E7). Moreover, in consideration of the documented soil mark on satellite imagery, a secondary site to the Kastraki 2 is also a possibility. It is speculative to suggest their contemporaneity. However, if their habitations had overlapped sometime during the Neolithic, this layout of spilled-over buildings outside of the bounds of Kastraki 2 remains as a curious case.
5.5.2. Electromagnetic Induction Survey
Magnetic susceptibility confirms locations and extent of ditch-enclosures (E1 and E2) in the north (
Figure 21a). Furthermore, E3 and E4 have lower magnetic susceptibilities indicating minimal cultural transformation of soils. Only three of the structures in cluster E5 show up as high magnetic susceptibility localities. This might be explained by differential post-deposition of structures or initial variations in terrace levels.
The conductivity map reveals an area with high resistivity values, initially suggesting the concentration of architectural elements (
Figure 21b). Contrary to the expectations, however, structures are located at the fringes of this area. Furthermore, areas E3 and E4 show low level of human activity and no architectural features as revealed in magnetic susceptibility and geomagnetic datasets. These contrasting observations can be resolved by suggesting that these areas were compacted surfaces for particular use(s) and were devoid of major built features.
5.5.3. Ground Penetrating Radar Survey
GPR successfully maps a series of structures (
Figure 22). The survey provides further details of the east–west aligned building cluster (E5). To the north of this cluster, a group of scattered buildings is visible. Geomagnetic and magnetic susceptibility data (
Figure 20,
Figure 21a and
Figure 23) do not suggest a firing event for this second group, suggesting a different treatment of architectural features in close vicinities. Within the bounds of the site, GPR supports the hypothesis of significant surface compaction for the areas of E1 and E2. High reflectance zones overlap with high resistivity and low magnetic susceptibility values. The soil mark on RPAS imagery (M7) succinctly describes this compaction as well.
GPR survey adds E8 to the building inventory. In consideration of the soil mark on satellite imagery, the E7–E8 group further increases the possibility of a secondary site in the north. In this secondary site, the buildings surround the soil mark as in the case for Kastraki 2. Therefore, one may claim a similar use of space.
6. Discussion
6.1. Methodological Advancements
The IGEAN Project emphasized the importance of integrated geospatial methodologies for the solution of archaeological problems. Through the manifold approach, the limitation of one sensor is compensated by another. Therefore, a more complete picture of past use of space can be drawn. This case became especially evident for Almyros 2; geomagnetic prospection and electromagnetic induction surveys were helpful in exploring the changes in settlement pattern in two consequent architectural (or cultural) phases. Despite the power of this approach, it would be naïve to suggest geospatial technologies will eventually substitute the norm of archaeological surveys and excavations.
Site enclosures, locations of houses, preservation conditions, pyro-activities, deliberately avoided areas within sites and many other spatial and attribute data were gathered thanks to the workhorse of archaeological geophysics, i.e., the magnetometer. Furthermore, multi-sensor (multi+) geomagnetic prospection provided large area coverage due to instrument’s high data collection efficiency. It is now possible to explore geomagnetic landscapes and locate archaeological features in much wider contexts [
20]. On the other hand, one can further argue that it is only possible through the manifold approach (multiple methods) to truly investigate differences and commonalities in inter-site settlement patterns.
Electromagnetic induction proved to be useful both for providing information on variations in use-of-space within and between settlements and for complementing the results of geomagnetic prospection. In particular, the evaluation of magnetic susceptibility in relation to geomagnetism made it possible to observe architectural transitions from one phase to another. Electrical conductivity data reveal possibly compacted surfaces within sites and differentiate between ditches and fortification walls. The study of architectural plans further supported the existence of these open spaces, hinting at a peculiar use of space in Early and Middle Neolithic settlements in Thessaly.
GPR survey exposed features that were not detected by other geophysical instruments, refining the shape and extent of buildings that were documented with other methods, and provided further proof for land-use practices. Specifically, the GPR, in tandem to magnetic survey, was instrumental in discriminating between types of building materials, mudbrick or stone foundations. Finally, the methodology offered means to understand the structure of ditch-enclosures.
Despite their strengths, geophysical sensors also have intrinsic limitations. These limitations are further pronounced in Neolithic contexts where the detection of prehistoric anthropogenic activities requires high resolution and highly sensitive data collection. Especially, electromagnetic induction surveys tend to have low spatial resolutions, hindering a finer delineation of Neolithic use of space. Furthermore, the major raw material of the Neolithic period, i.e., the clay, presents opportunities and obstacles for the collection and interpretation of geophysical data. Magnetic features located closer to the surface tend to mask anomalies of a lower magnetization or deeper strata [
21]. This magnetic superimposition creates a bias for the interpretation of geomagnetic maps and over emphasizes the use of materials with mudbrick content; a Neolithic fact one can enthusiastically accept. The same setting, however, works against the favor of GPRs where high clay content tend to attenuate GPR signals. Overall, these Neolithic limitations are minimized using manifold methodology.
Integration of aerial and space-borne systems to the ground arsenal is now almost a standard procedure. RPAS is becoming an ordinary tool in archaeological projects and very high resolution satellite imagery is more available due to an increase in the number of space platforms. Furthermore, online data repositories keep providing invaluable spatial datasets. The IGEAN project capitalized over these advancements and complimented the results of geophysical prospection while contextualizing settlements in their larger environmental settings.
6.2. Archaeological Advancements
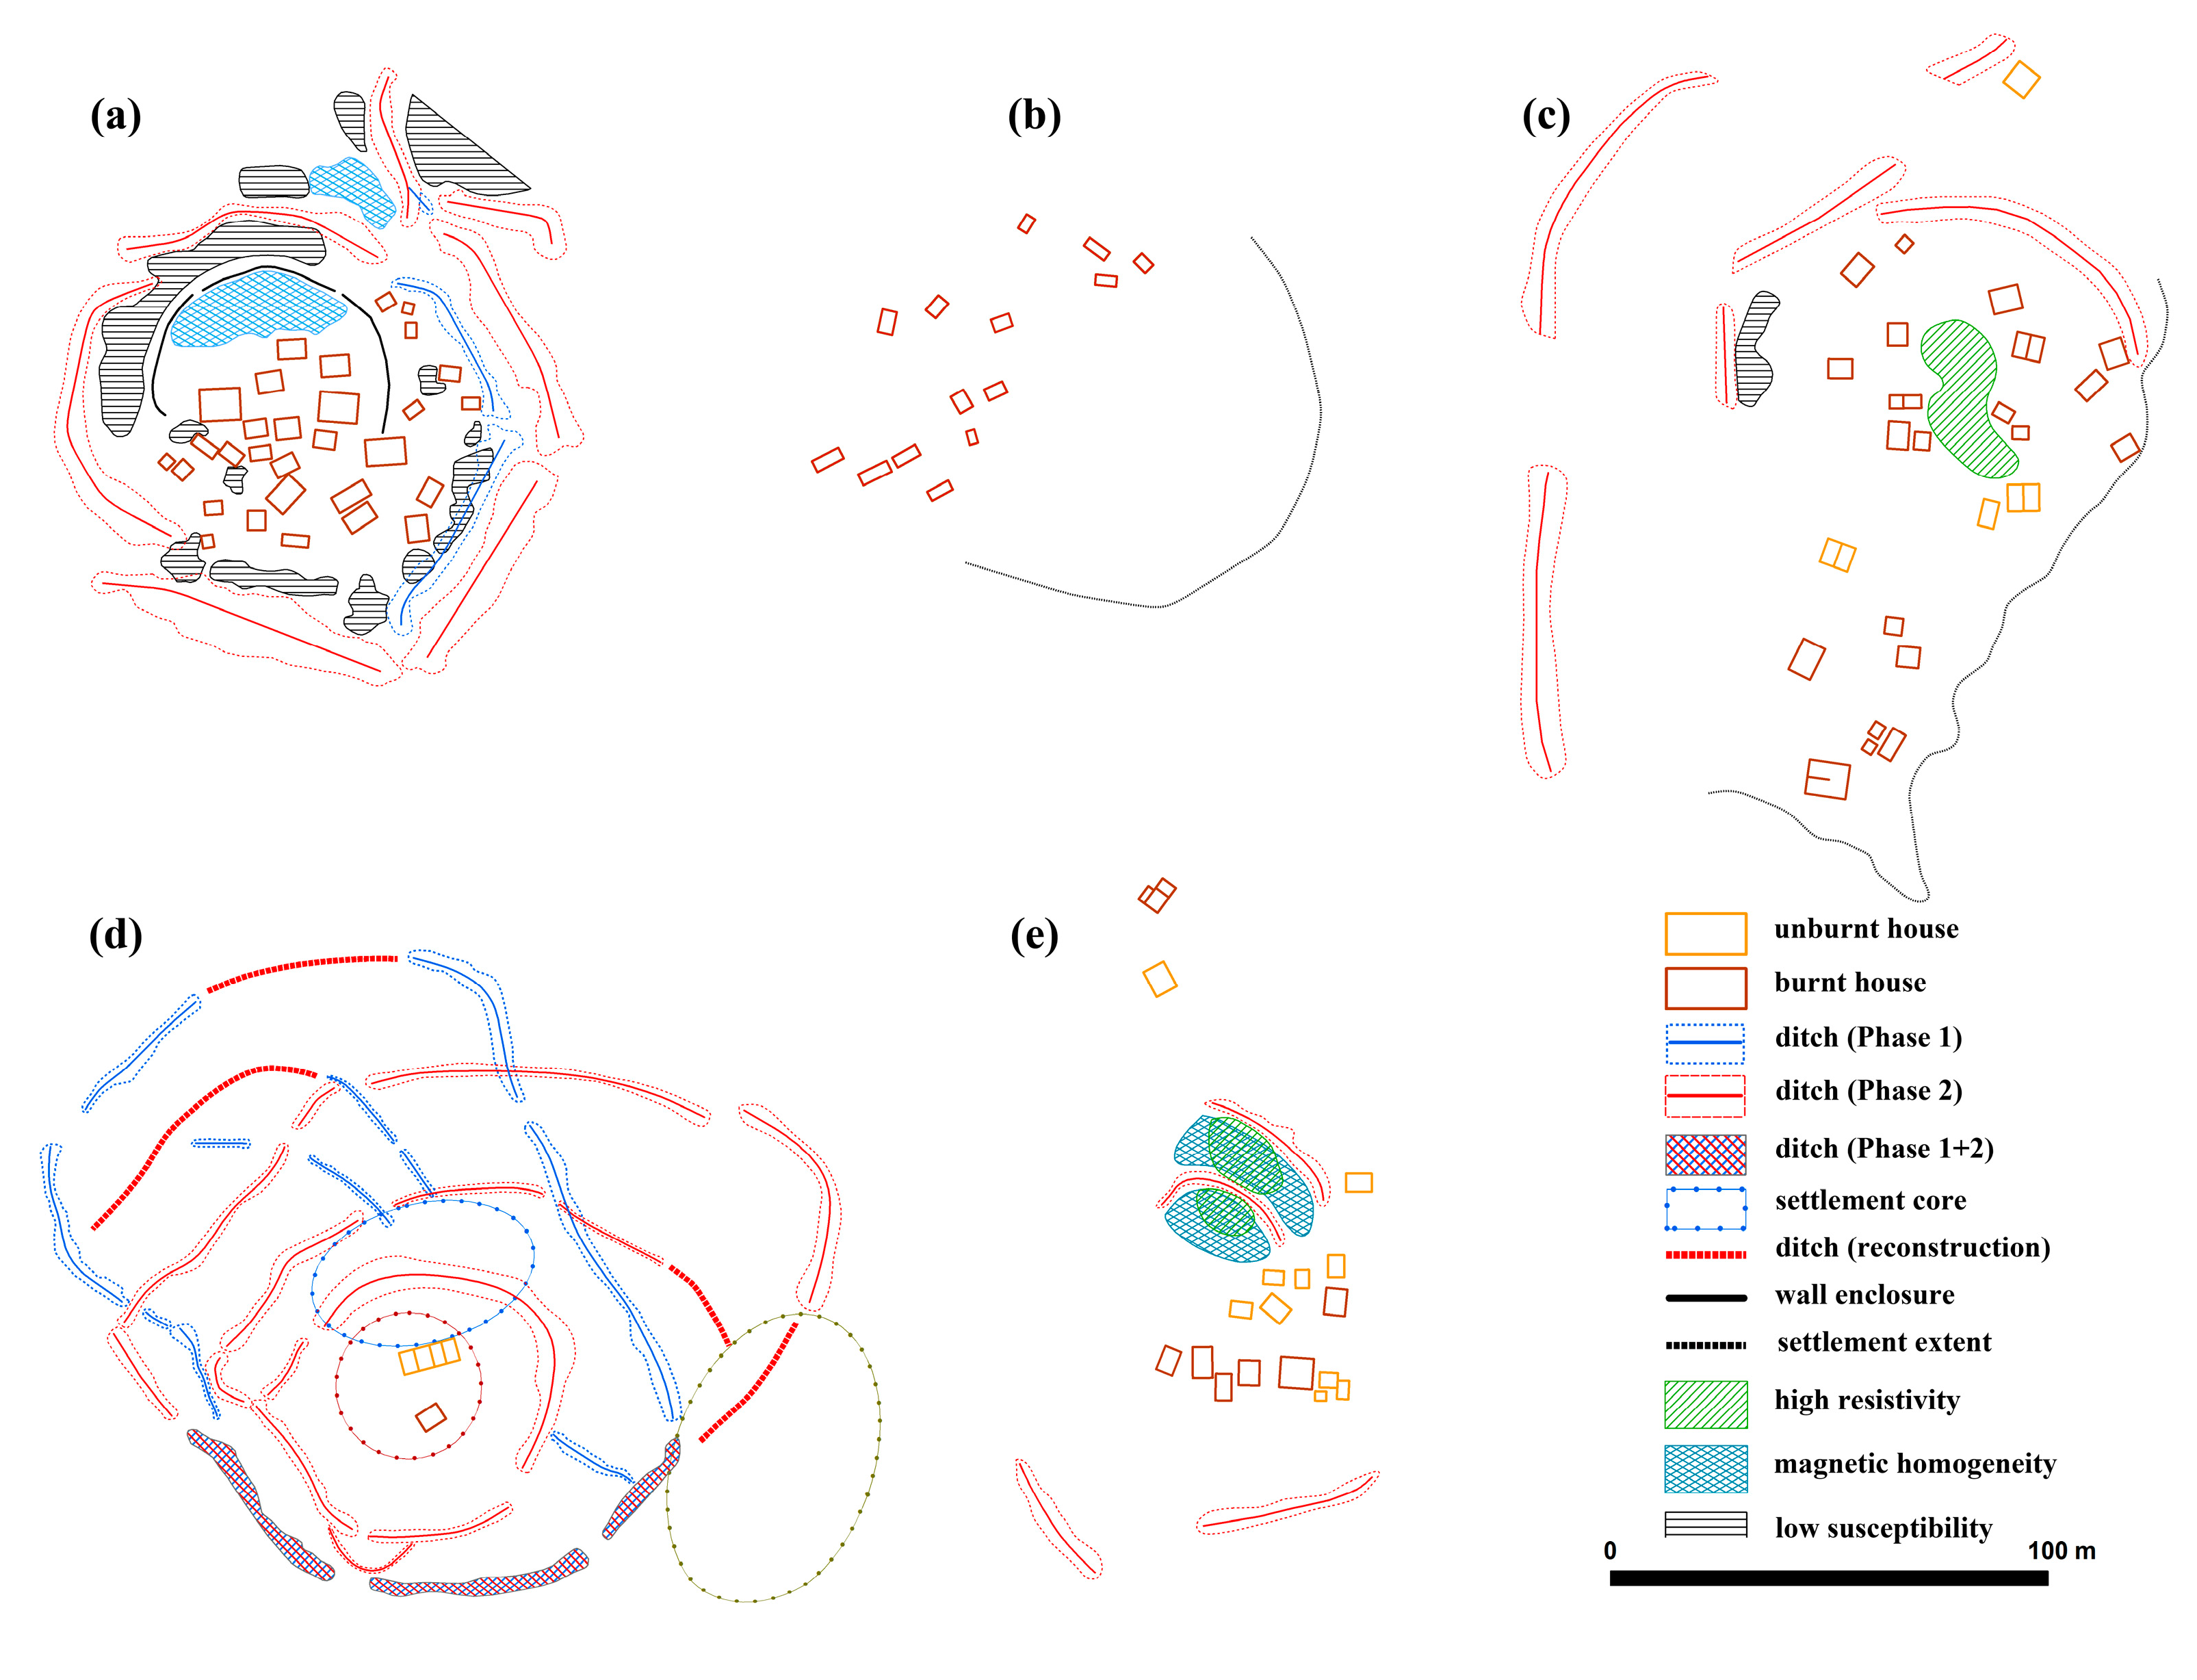
The IGEAN project produced comparable Early and Middle Neolithic settlement layouts. These plans are invaluable for revealing variations and commonalities between settlements in great clarity (
Figure 24). Discrimination between ditch-enclosures and circuit walls, investigating the reasons behind “incomplete” ditch features, observing the dynamics of enclosure evolution, resolving burnt and unburnt buildings, delineating highly compacted surfaces within the settlements, locating the areas with minimum anthropogenic activities all contribute for a better understanding of everyday life in Neolithic Thessaly.
It appears that settlement agglomeration resulted in a clear separation of inside from the outside world. The demarcation is the most evident when there is an enclosure around a Neolithic settlement as the results of the IGEAN project suggest. The interpretation of enclosures which amounts to a growing presence in recent archaeological data, directly affects the image of the relations between communities (e.g., warfare [
22]) or within the community (e.g., neighbors [
23]). Second, it is now clear that ditch-enclosures were not static features despite their monolithic sizes, but they were part of the settlement dynamics. In this regard, they were not the determinants of the Neolithic inside/outside binary opposition, but were signifiers of it.
The separation between burnt and unburnt buildings is a complex one. At Almyros 2 and Kamara, all documented structures were burnt, accidentally or deliberately. In addition, in consideration of the data from Karatsantagli and Kastraki 2, deliberate burning might have been the case, as suggested by Stevanović for Neolithic domestic architecture [
24]. Under the assumption of contemporaneity, the IGEAN Project reveals selective burning of the houses within the same settlement.
Finally, the IGEAN Project is instructive for details of use of space. It seems like Neolithic inhabitants provided extra care to minimize activities around enclosure entrances. This must have been necessary for the ease of movement between the site and the off-site. This is most evident at Almyros 2. Similarly, open air surfaces within settlements might be hinting towards a specific economic activity or indicating the bounds of ceremonial spaces or communal gathering places.
7. Conclusions
This study explores Early and Middle Neolithic settlements in Thessaly, Greece using a manifold geospatial approach. Integration of satellite, aerial, and ground remote sensing methodologies fully exploit individual sensor capabilities to hypothesize “close-to-complete” settlement layouts. Therefore, it is now possible to highlight variations and commonalities between these settlements and provide a grounded speculation of a “Neolithic way of use of space”.
First, settlement enclosures show a greater variation than previously anticipated. There is convincing evidence for ditches thatare not fully encircling settlements. This suggests that these features were not always necessarily built for warfare. Second observation is related to the openings in these enclosures. Successive cleaning of doorways appears to be a societal habit of Neolithic dwellers. Third, clean and compacted Neolithic surfaces inside settlements point towards a specialized use of space. It is not possible to further comment on these features without archaeological excavations, but the lack of anthropogenic markers speculatively suggests exclusionary/prohibitionary use. Finally, discriminatory house burning may be indicating social differentiation.


