Article

Efficiency of Geographically Weighted Regression in Modeling Human Leptospirosis Based on Environmental Factors in Gilan Province, Iran

Faculty of Geodesy and Geomatics Engineering, K. N. Toosi University of Technology, Tehran 19967-15433, Iran
*
Author to whom correspondence should be addressed.
Geosciences 2017, 7(4), 136; https://doi.org/10.3390/geosciences7040136
Submission received: 22 September 2017 / Revised: 10 December 2017 / Accepted: 13 December 2017 / Published: 19 December 2017

Abstract

:
It is of little debate that Leptospirosis is verified as the most important zoonosis disease in tropical and humid regions. In North of Iran, maximum reports have been dedicated to Gilan province and it is considered as an endemic problem there. Therefore, modeling or researching about different aspects of it seems indispensable. Hence, this paper investigated various models of Geographically Weighted Regression (GWR) approach and impacts of seven environmental variables on modelling leptospirosis in Gilan. Accordingly, counts of patients were considered as dependent variable during 2009–2011 at village level and environmental variables were utilized as independent variables in the modelling. In addition, performance of two Kernels (Fixed and Adaptive), two Weighting Functions (Bisquare and Gaussian) and three Bandwidth Selection Criteria (AIC (Akaike Information Criterion), CV (Cross Validation) and BIC (Bayesian information criterion)) were compared and assessed in GWR models. Results illustrated: (1) Leptospirosis and effective variables vary locally across the study area (positive and negative); (2) Adaptive kernel in comparison to Fixed kernel, Bisquare weighting function to Gaussian, and also AIC to CV and BIC (due to R2 and Mean Square Error (MSE) validation criteria); (3) Temperature and humidity were founded as impressive factors (include higher values of coefficients); Finally, contain more reliable results consecutively. However, the provided distribution maps asserted that central villages of Gilan not only are more predisposed to leptospirosis prevalence, but also prevention programs should focus on these regions more than others.

1. Introduction

Leptospirosis is a common zoonotic disease mostly in tropical and humid climate regions [1,2,3,4]. Statistics about this disease have been underestimated and that is why WHO knows leptospirosis as a neglected tropical disease worldwide. In other words, more research should be performed to investigate its epidemiological characteristics and disadvantages on public health [5]. Moreover, it is known as a multi-faceted disease globally and lack of diagnosis or on-time treatment would lead to fatality [4,6]. Major cause of leptospirosis occurrence, a kind of bacteria (leptospira), dwells in bodies of different domestic and wild animals (such good examples of reservoirs are rats and dogs), and thus would be transmitted into the environment by their urine. Anyway, it can be transferred to human body via skin wounds or contact with polluted soil, water and animals [6,7]. In summary, contact with contaminated animal, water and soil would lead to infection. Although activities like agriculture, livestock, slaughter, water activities, poverty, travelling to tropical regions boost the vulnerability to leptospirosis occurrence, it is more widespread among rice farmers and anglers [3,8]. Considering what is mentioned above, “Environment” plays a major role in leptospirosis propagation across urban and rural areas [9].
North of Iran, in particular the Caspian Sea coastline, is an appropriate bed for leptospirosis prevalence due to humid climate, vast plain grounds, using surface waters or rivers (as water resources of farms) and livestock activities [10]. Regarding the volume of rice production, Gilan leads second (after Mazandaran) in this area and a large number of villages and workers contribute to this stage. Moreover, it burdens annually the maximum precipitation among provinces of Iran (especially the City of Rasht). However, inability to work (exactly at planting and harvesting time), high medical costs and casualties are disadvantages that introduce leptospirosis as a serious problem in this region (especially to rural inhabitants).
A large number of papers have been published on communicable [11,12], non-communicable [13,14] and zoonotic diseases [15,16,17,18] using GIS tools. They can be classified into three groups including zoning [19,20,21,22], prediction [23,24,25] and modelling [26].
Authors of [17] analyzed impacts of parameters such as proximity to rivers, waste disposal sites and slum locations on leptospirosis prevalence in Sao Paolo, Brazil, using GIS. Results showed that proximity to rivers adversely affected the disease prevalence.
Authors of [27].studied animal type of leptospirosis using GIS in Trinidad. They proved that cows were more prone to disease in comparison to rats and dogs. Furthermore, they demonstrated higher rate of transmission to humans.
However, investigations verified that the preceding studies about leptospirosis often used to investigate medical perspectives of leptospirosis [28,29,30] and animal type aspects [20,21]. Thus, rarely has research been done about human type of leptospirosis using spatial analysis and GIS tools [31,32,33]. Thus, several were explained as follows:
Authors of [28] examined human leptospirosis correlation with social, geographical and environmental variables using statistical methods during 2004–2012 in Malaysia. Results showed that patients aged 30–39 years, especially men, were more at risk compared to others.
Authors of [31] provided human leptospirosis maps in Colombia with limitations as no detailed, municipality-level and epidemiological maps existed at the Coffee-triangle region. In addition, ethical considerations were taken into account and the fact that the data used did not include patients’ names or something to that effect. Innovations of this paper was an occupational issue and that it developed five thematic maps using Linear Regression approach during 2007 and 2011. As a result, 33.3% were investigated as agriculture workers in harvested areas, and the agriculture variable denoted significant relation with leptospirosis incidence (R2 = 0.48).
Authors of [34] verified that outbreaks of human leptospirosis were statistically related to nine environmental and ecological variables in China. They predicted potential risk area of leptospirosis distribution using Logistic Regression and Maxent approaches. Temperature and precipitation were concluded as the most effective variables and seven provinces included 403 (Logistic regression) and 464 (Maxent) counties introduced respectively as potential areas.
Authors of [35] evaluated relevant environmental and socioeconomic variables at different geographical scales in Brazil. Utilizing Data Analysis in GIS, they concluded that the strongest correlations existed at local scale, though there were no significant correlations at municipal levels.
Authors of [33] used Modifiable Areal Unit Problem to select correct spatial unit and detected spatial pattern of leptospirosis in Mazandaran province during 2011–2013. Sari, Qaemshahr and Amol were recognized as risky areas significantly (p < 0.05) and men as common targets of this disease.
GIS development in recent years has led to the invention of beneficial and efficient methods [36,37,38] such as GWR to identify spatial patterns and modelling of communicable and non-communicable diseases [11]. GWR performance is based on spatial variation of relationships between dependent and independent variables (in spite of ordinary regressions). Two kernels (fixed and adaptive) include different structures (bandwidth or number of neighbors) that play a role in implementing GWR and investigating effect of neighbors spatially. Although bandwidth is a constant distance in fixed kernel, it varies in an adaptive one regarding density distribution of neighbors (larger in high density areas and smaller in dense regions) [39].
To the best of our knowledge, studies about leptospirosis often have assumed a spatially constant relationship of the disease and environmental variables across the study area. As a result, local variations would be ignored in this way and may conclude unreliable results. Therefore, the role of approaches such as GWR becomes highlighted, which capability has been confirmed in comparison to various methods [40,41]. Moreover, it is the first study on leptospirosis performed in Gilan province that uses GIS approaches, and especially GWR. To wrap it all up and because of the aforementioned reasons, this study was conducted to evaluate spatial heterogeneity of leptospirosis and local relationships across the study area. Although related surveys evaluated GWR results with different approaches, we investigated the capabilities of GWR internally regarding its various bandwidths, selection criteria, etc.
This paper has been done in three stages to compare effectiveness of fixed and adaptive kernels in modeling human leptospirosis using GWR. First, patients’ statistics were collected from the National Ministry of Health and Treatment of Iran (NMHT) and checked to exclude cases without address. At the second step, data of seven environmental variables and satellite images were obtained and processed to input modelling. At the end, efficiency of Fixed and Adaptive kernel, two weighting functions Gaussian and Bisquare, and three bandwidth selection criteria AIC, CV and BIC were compared and assessed in modelling.

2. Materials and Methods
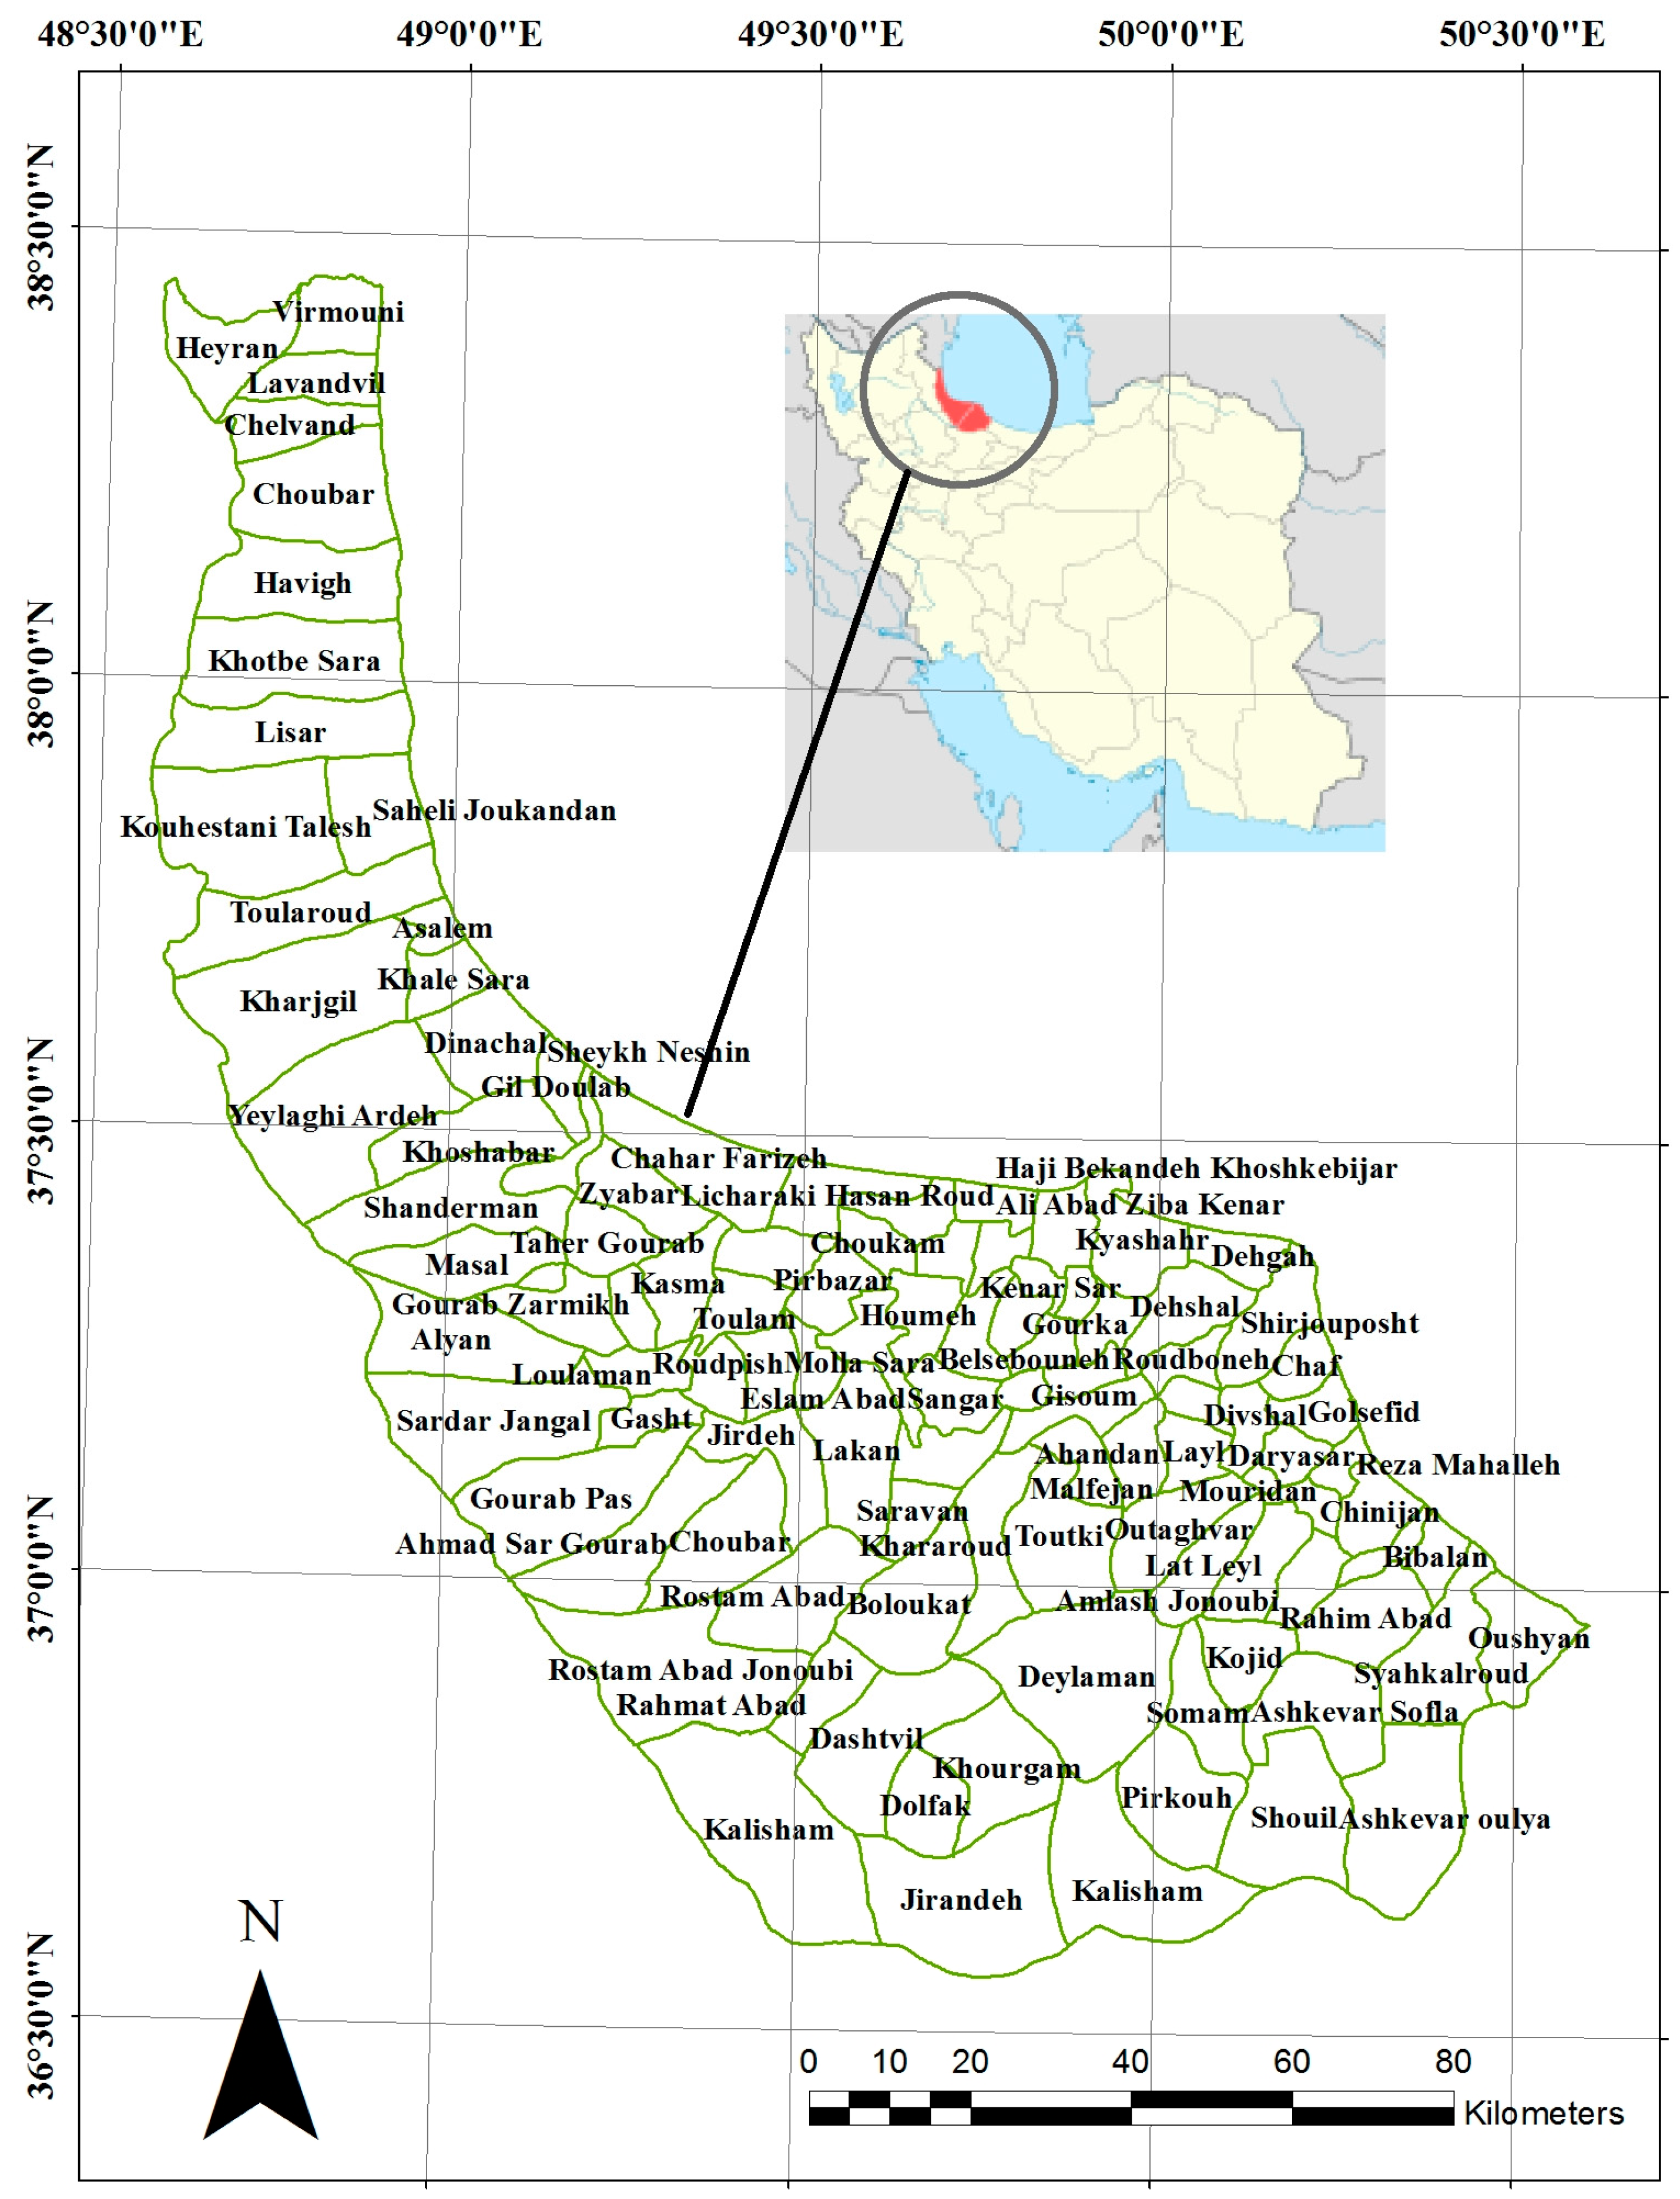
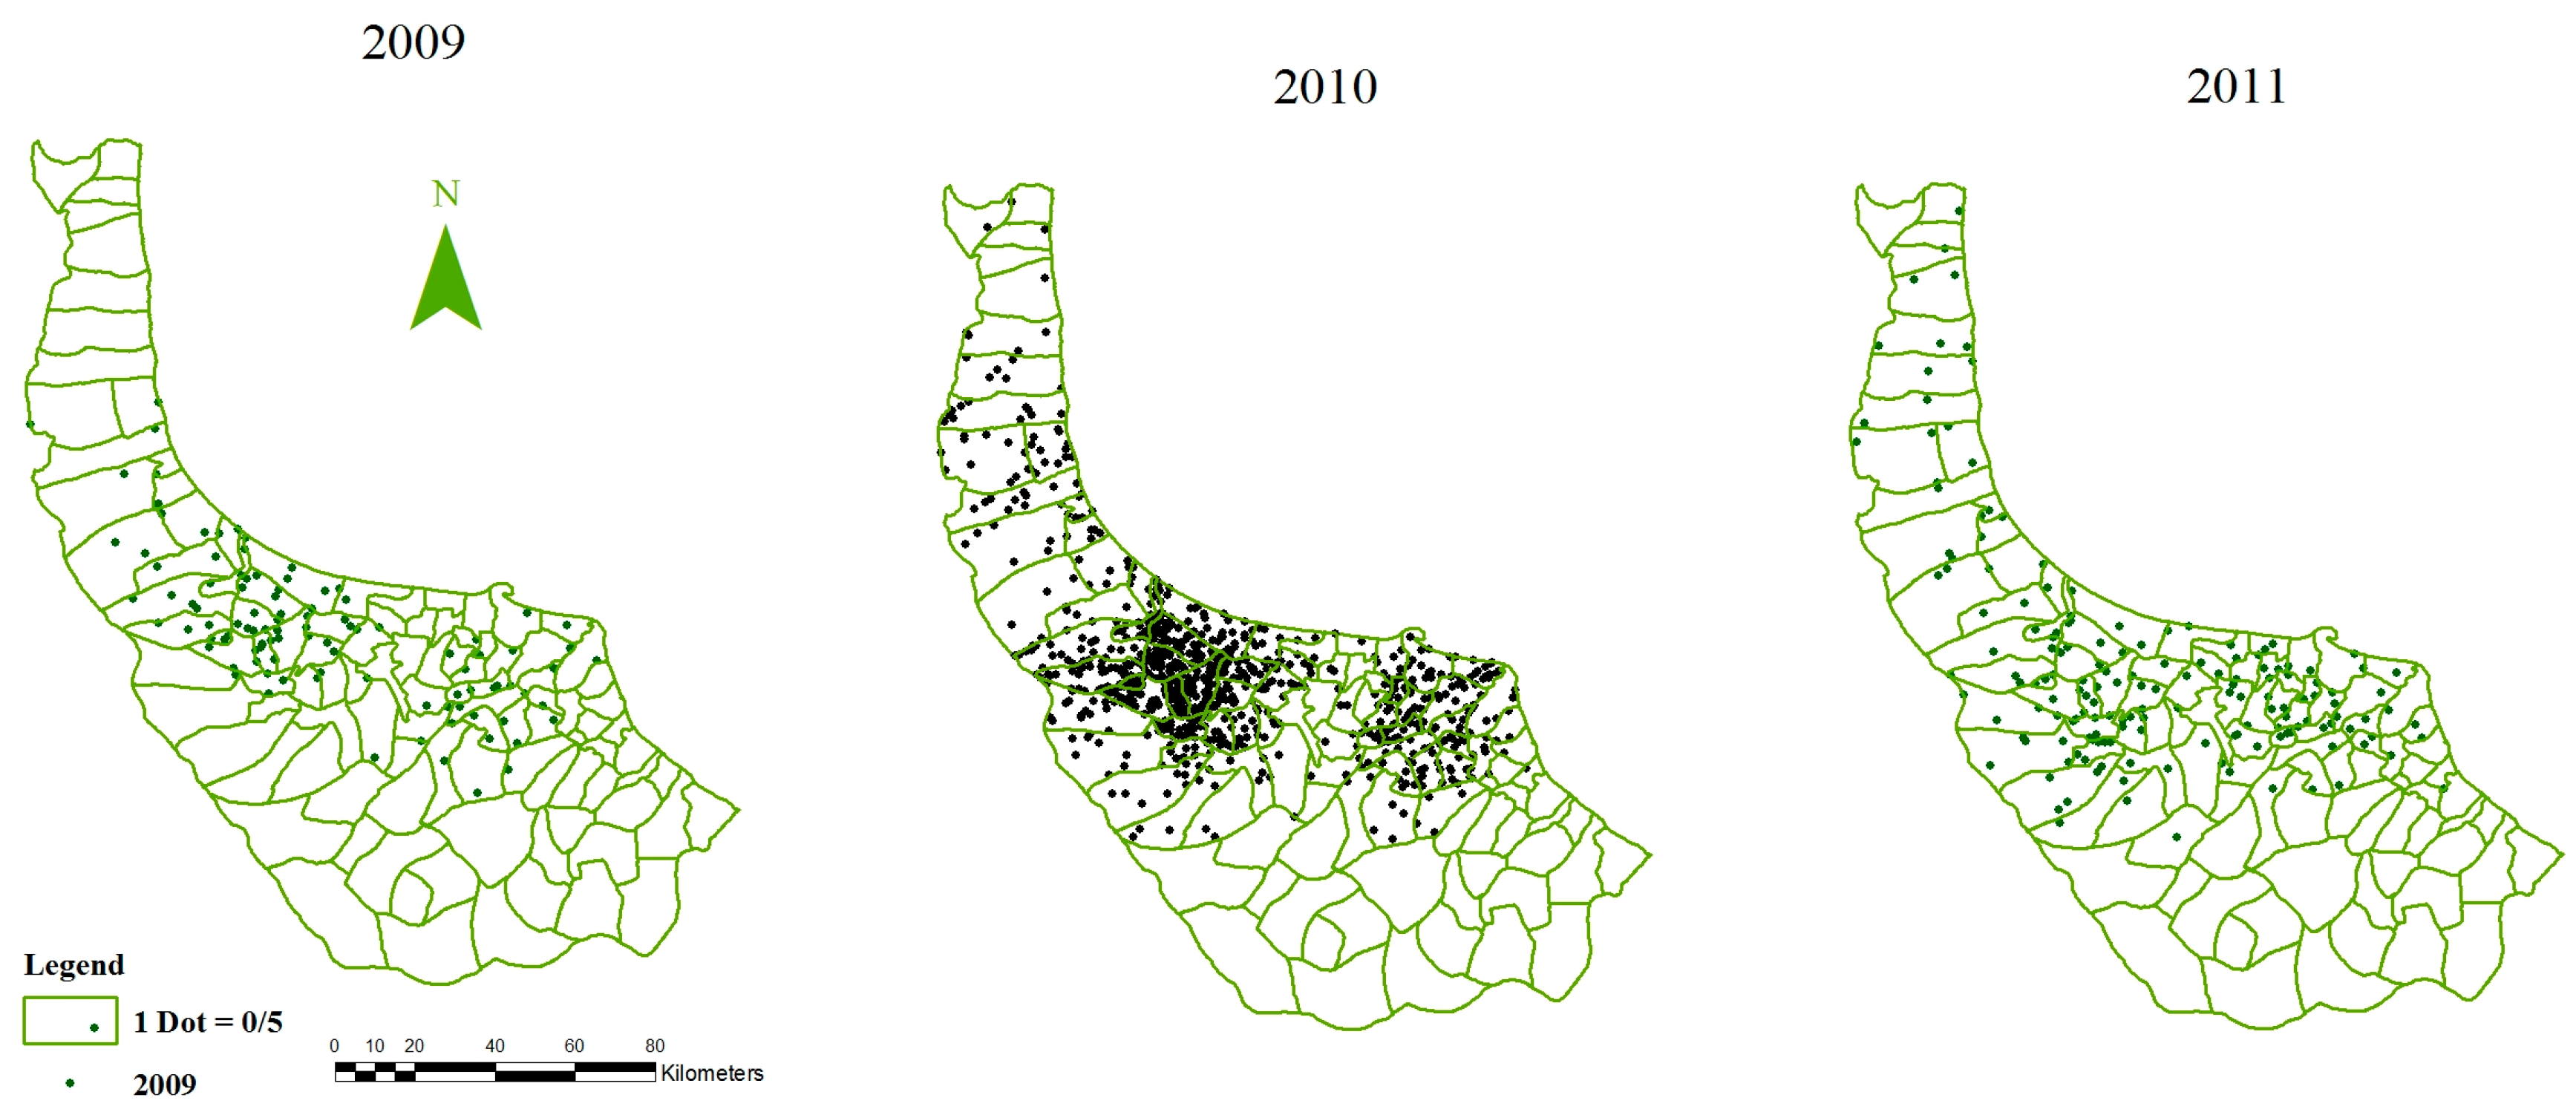
2.1. Study Area

Having analyzed previous studies and used the contribution of experts in the selection of the study area, we chose Gilan province for investigating leptospirosis distribution and effects of seven environmental variables. One promising reason is that it burdens annually a large number of leptospirosis patients (preceding Mazandaran and Golestan provinces consecutively) since the beginning of the Leptospirosis Gathering System (LGS) in 2009. In addition, it is known as the 2nd province according to rice cultivation and production volumes, which play a crucial role in distribution of this disease. Likewise, the Statistical Center of Iran (SCI) counted it among provinces that include vast rural areas (40% rural and 60% urban), which is an important factor as leptospirosis is prevalent in rural areas rather than urban ones. Besides, the high rate of environmental variables such as humidity and precipitation due to adjacency to the Caspian Sea afforded appropriate circumstances for leptospirosis prevalence in this area. Figure 1 presented the Boundary of study area and rural districts of the province.

2.2. Data and Preprocessing

Data were originally gathered and prepared in order to input the model as follows:
Disease’s counts: characteristics of daily reported patients (Name, Sex, Address, etc.) were collected from the Management Center of Zoonotic diseases in NMHT, which were confirmed by positive values of ELISA (A medical test for investigating human leptospirosis assigns) tests during 2009–2011. Then, any deficiencies in patients’ addresses were eliminated completely, to not contribute to the model, and analysis became more and more accurate. At the end, incidence rates of leptospirosis were calculated for every village using demographics (Figure 2).
Meteorological inputs: twelve synoptic stations throughout Gilan provided daily average temperature (°C), precipitation (mm), humidity (%) and vapor pressure (mm) values. Then, IDW (Inverse Distance Weighting) interpolation technique was used to create continuous surfaces of variables as it is easy to use and popular in disease modelling.
Elevation and Slope: extracting DEM (Digital Elevation Model) raster from SRTM (Shuttle Radar Topography Mission) data include 30 m spatial resolution; it was used for investigating the effect of topography and calculating the altitude of villages. In addition, slope of villages were calculated using slope analysis toolbox in ArcGIS 10.5 (Environmental Systems Research Institute, Redlands, CA, USA).
Vegetation: satellite images of MODIS (Moderate Resolution Imaging Spectroradiometer, Adecco Group North America, Jacksonville, FL, USA) for every 16 days and 250 m spatial resolution during 2009–2011 were provided. For completely covering the study area, two rasters were acquired and mosaicked using the ability of ENVI (Environment for Visualizing Images) 4.8 Software (‎Exelis Visual Information Solutions, Boulder, CO, USA). Therefore, NDVI (Normalized Difference Vegetation Index) values were calculated for each village.
As the data are in different formats and the village level is considered for the investigations, we used the toolbox of ArcGIS software to extract values of variables and assign them to each village for further analysis. That is, the centroid of the rural polygon was attributed to the base for analysis. Then, these prepared values were aggregated as inputs for the GWR model and thus outputs were concluded.

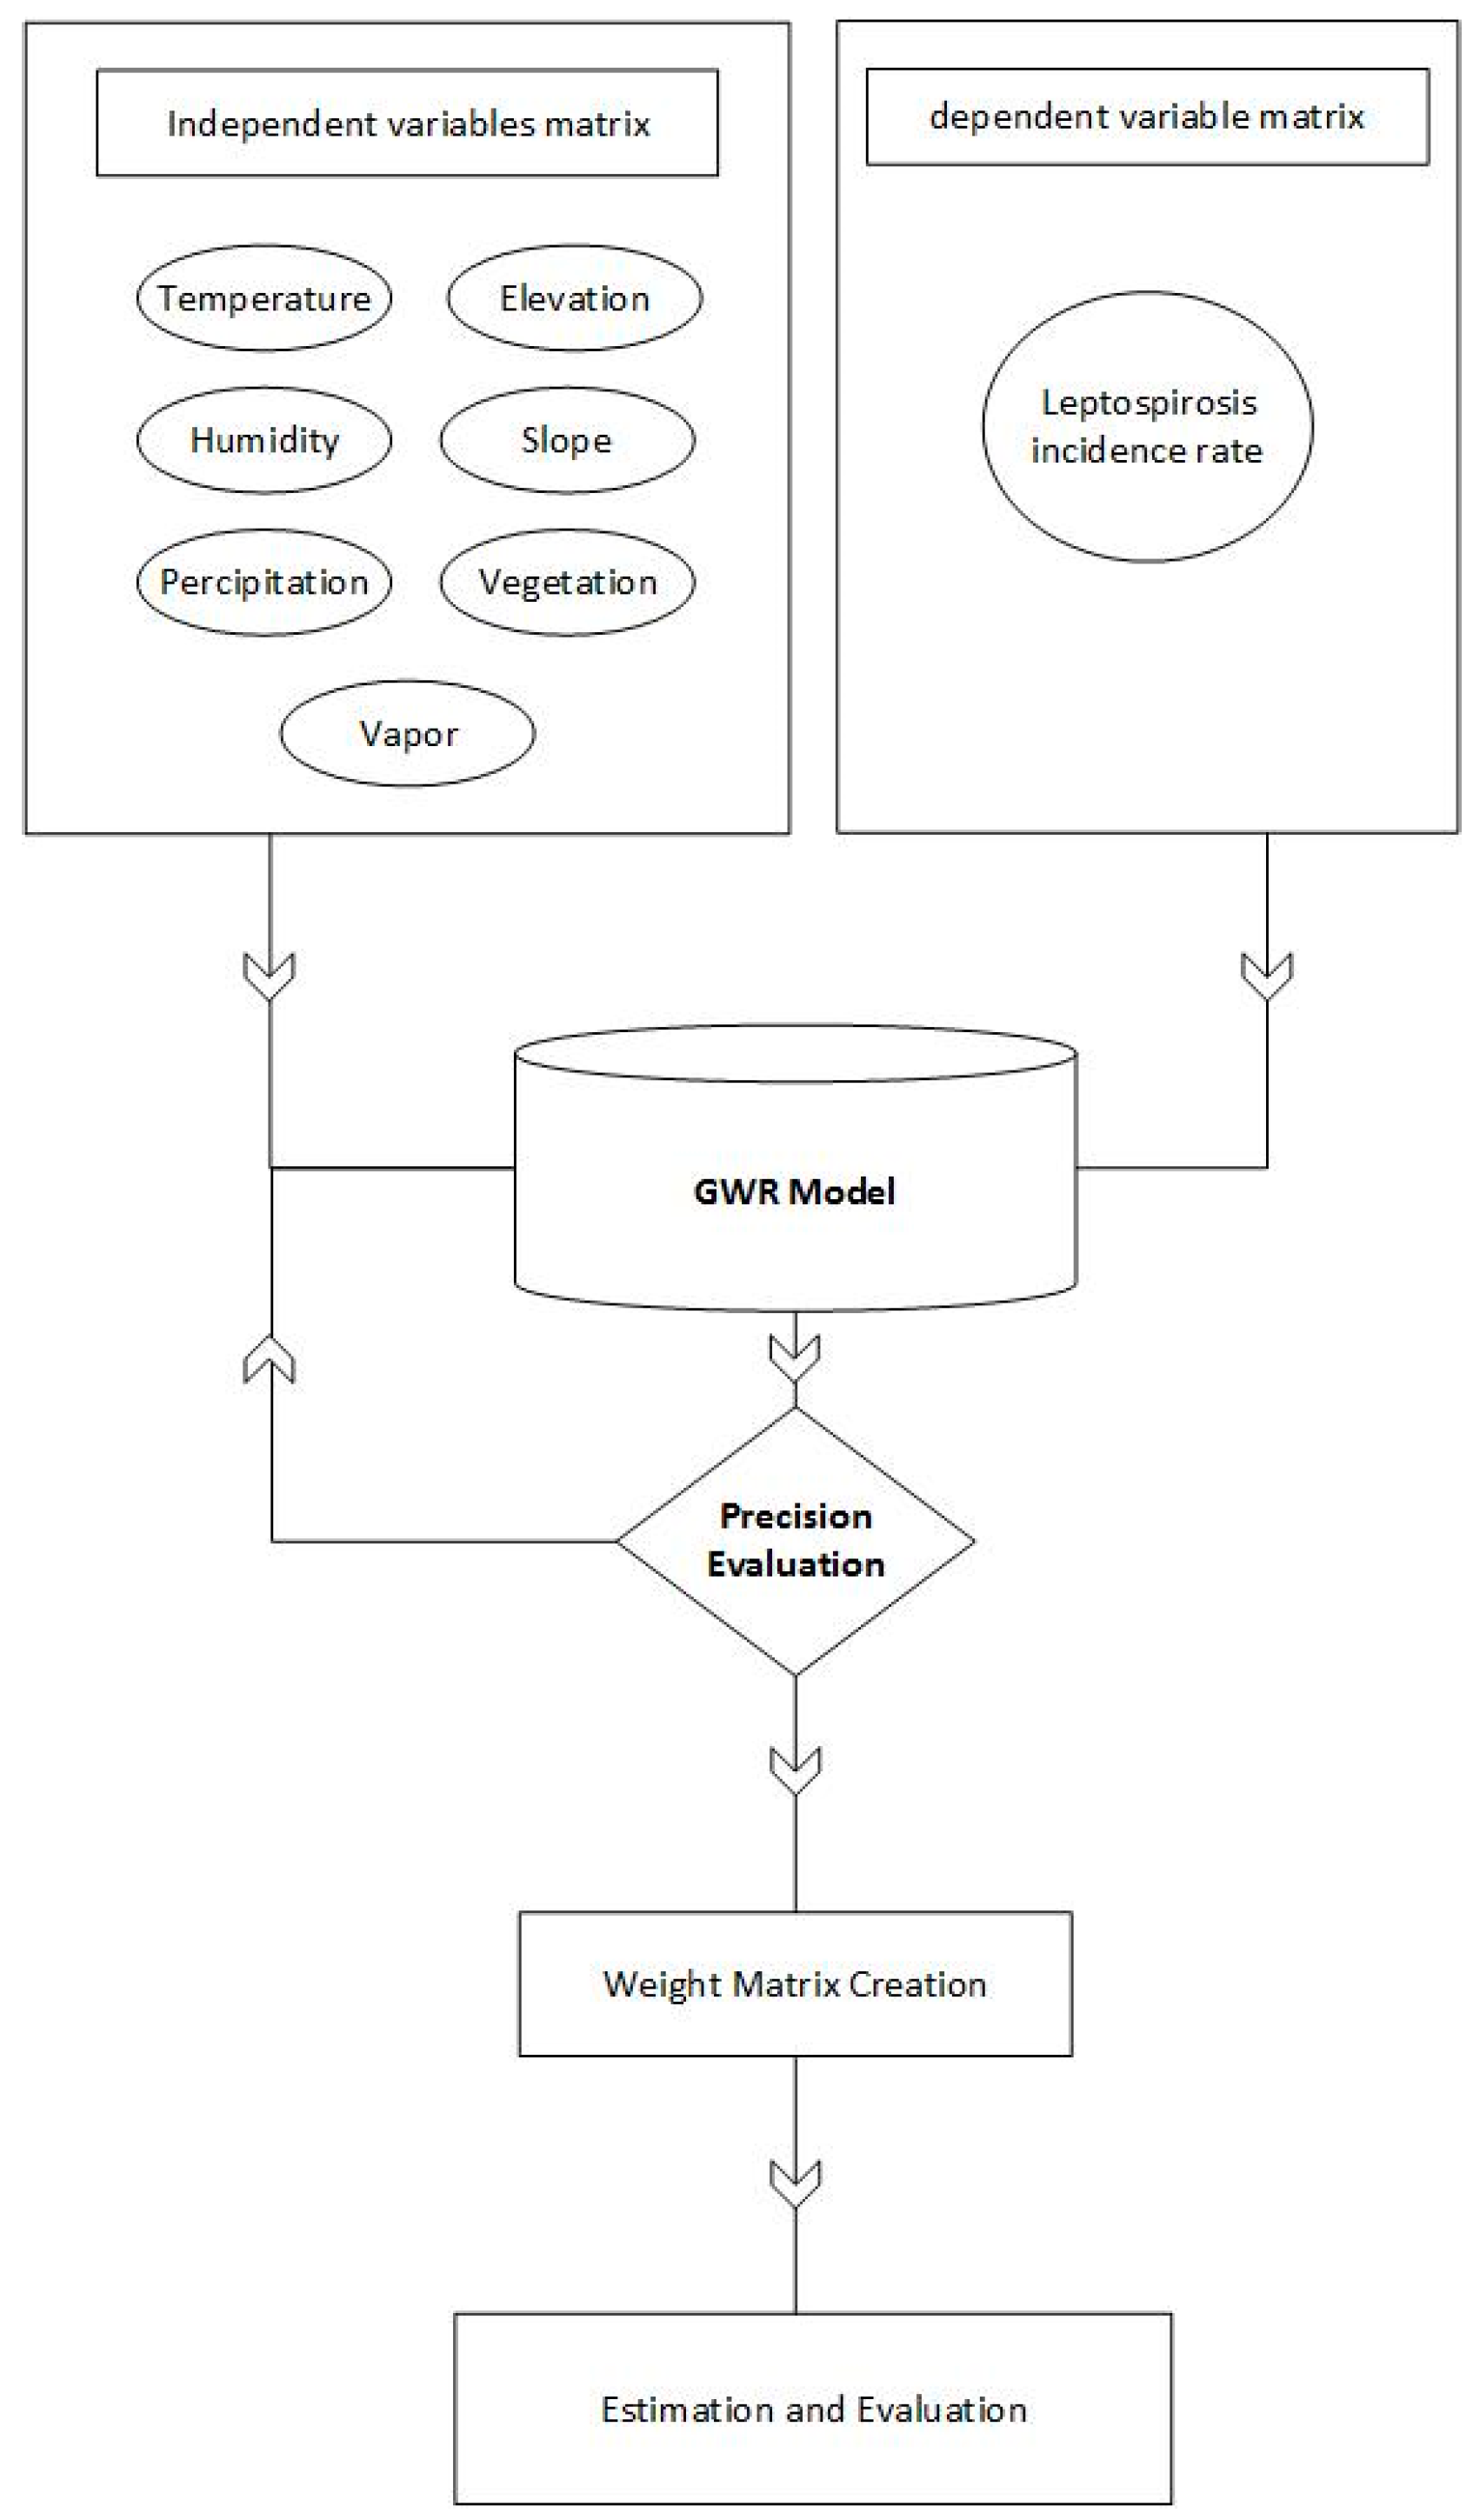
2.3. Structure of Study
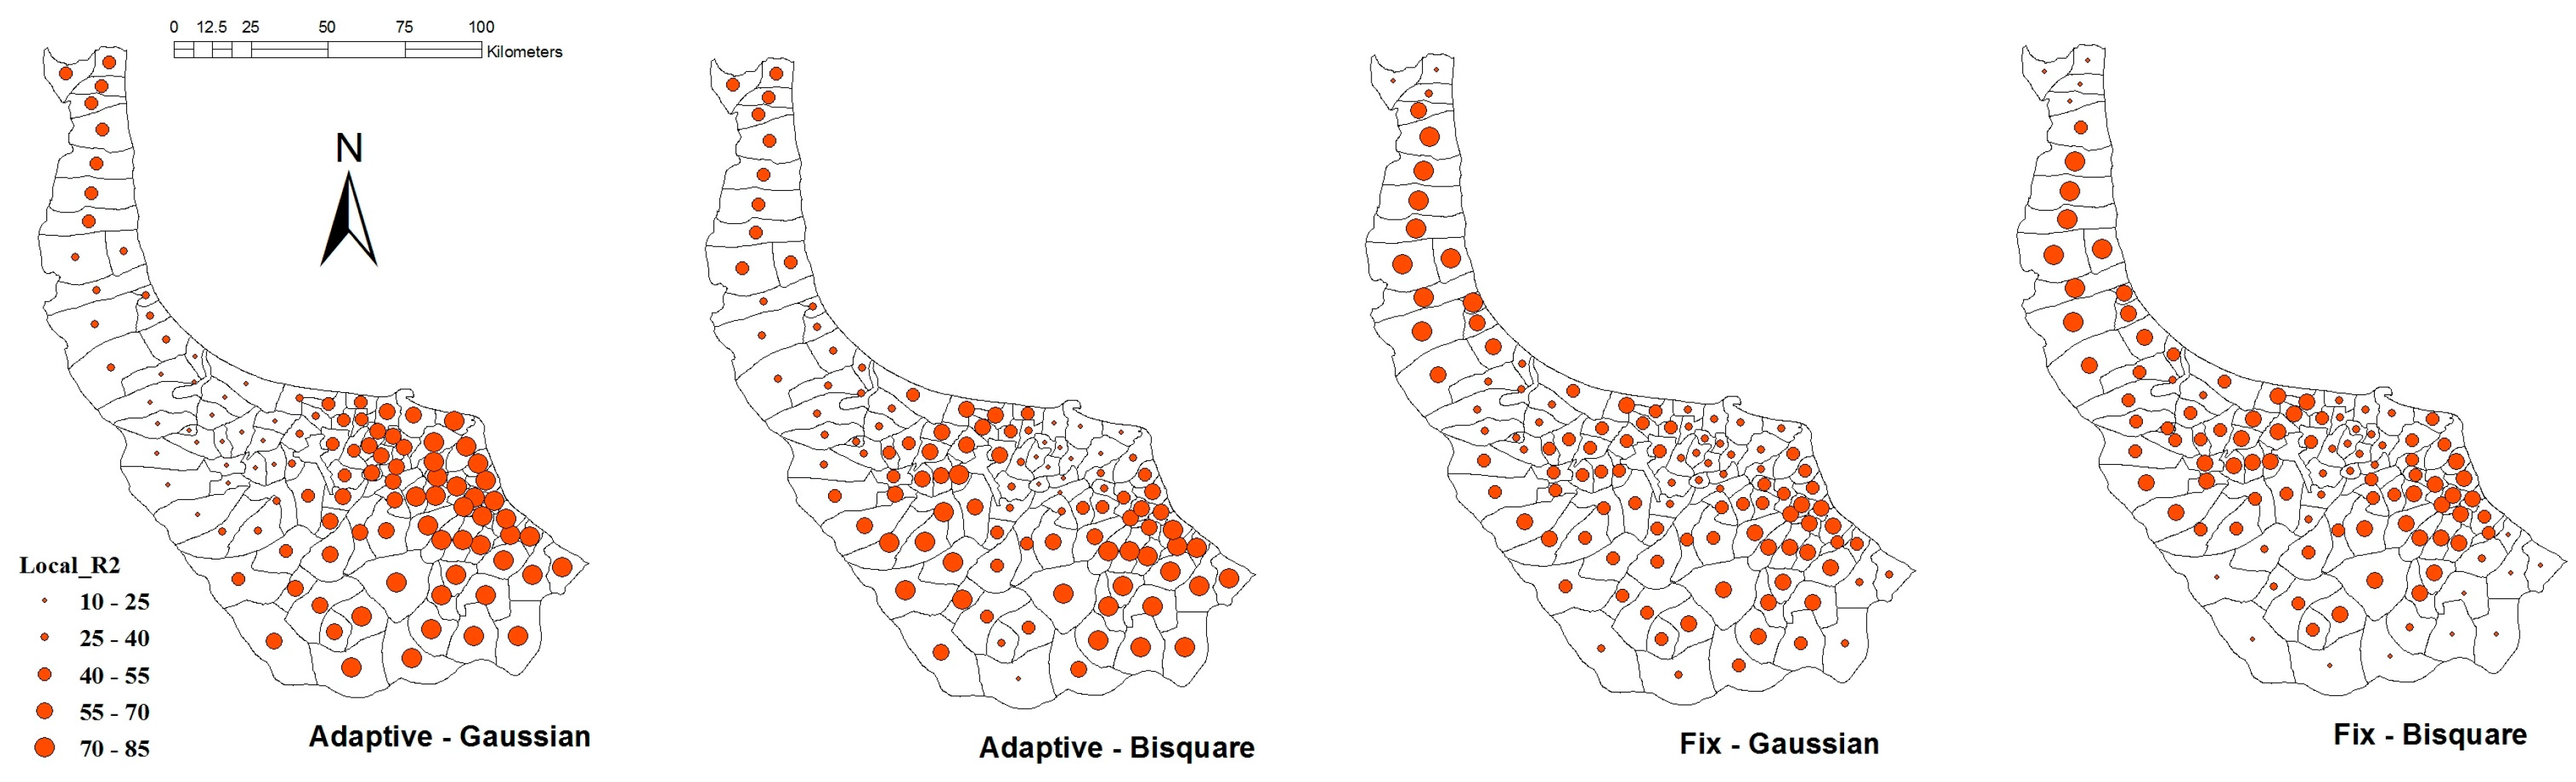
To achieve the objectives of this paper, a GWR model was implemented and briefly outlined (Figure 3). First of all, patients’ counts and values of dependent variables were prepared to input the GWR model. Then, different scenarios of the model including different kernels, weighting functions and bandwidth selection criteria were run and tested. Hence, estimation values of leptospirosis incidence rates were dedicated to each village. Finally, estimations and observed values of leptospirosis incidence rates were evaluated by R2 and MSE (Mean Square Error).

2.4. GWR

One of the most significant steps in regression approaches with several independent variables is estimating dependent variable as much as possible by selecting the most beneficial combination of independent variables. Indeed, we should examine different models and scenarios for estimating the independent variable in order to achieve the best results. Traditional regressions such as OLS (Ordinary Least Squares) consider mere stationary relationship between dependent and independent variables, which may lead to turning a blind eye to spatial autocorrelation and heterogeneity. In order to mask this bias, novel approaches like GWR were developed to solve non-stationary as follows:
y i = β 0 ( u i ,   v i ) +   k β j ( u i ,   v i ) x i j + ε
where ( u i ,   v i ) is the location of the village and β j ( u i ,   v i ) coefficients estimated by weighting function for any village. Due to the key role of weighting functions in modelling, Bisquare and Gaussian were developed as below [42]:
w i j = e x p [ 1 / 2 ( d i j / b ) 2 ]
w i j = ( 1   ( d i j / b ) 2 ) 2 i f   d i j < b elsewhere = 0
where b is bandwidth value which limits kernels to be only affected by nearby observations and d i j is distance between villages i and j . In other words, great bandwidth value introduces GWR as a global regression [43]. However, so important is selection of appropriate bandwidth that Akaike Information Criterion (AIC) [44], Cross Validation (CV) [45] and Bayesian Information Criterion (BIC) [42] were proposed:
CV =   i = 1 n [ y i   y ^ i   ( b ) ] 2
AIC = 2   l o g   ( L ) + 2 k
BIC = ln ( n ) k + 2 ln ( n )
where y ^ is estimated value of y (observation value which is excluded from regression model), k is number of independent variables plus intercept and L is maximum likelihood. According to the concepts of these three criteria, minimum values of each equation must be considered as the best bandwidth [45].
In order to assess and compare the results, we tested five criteria:
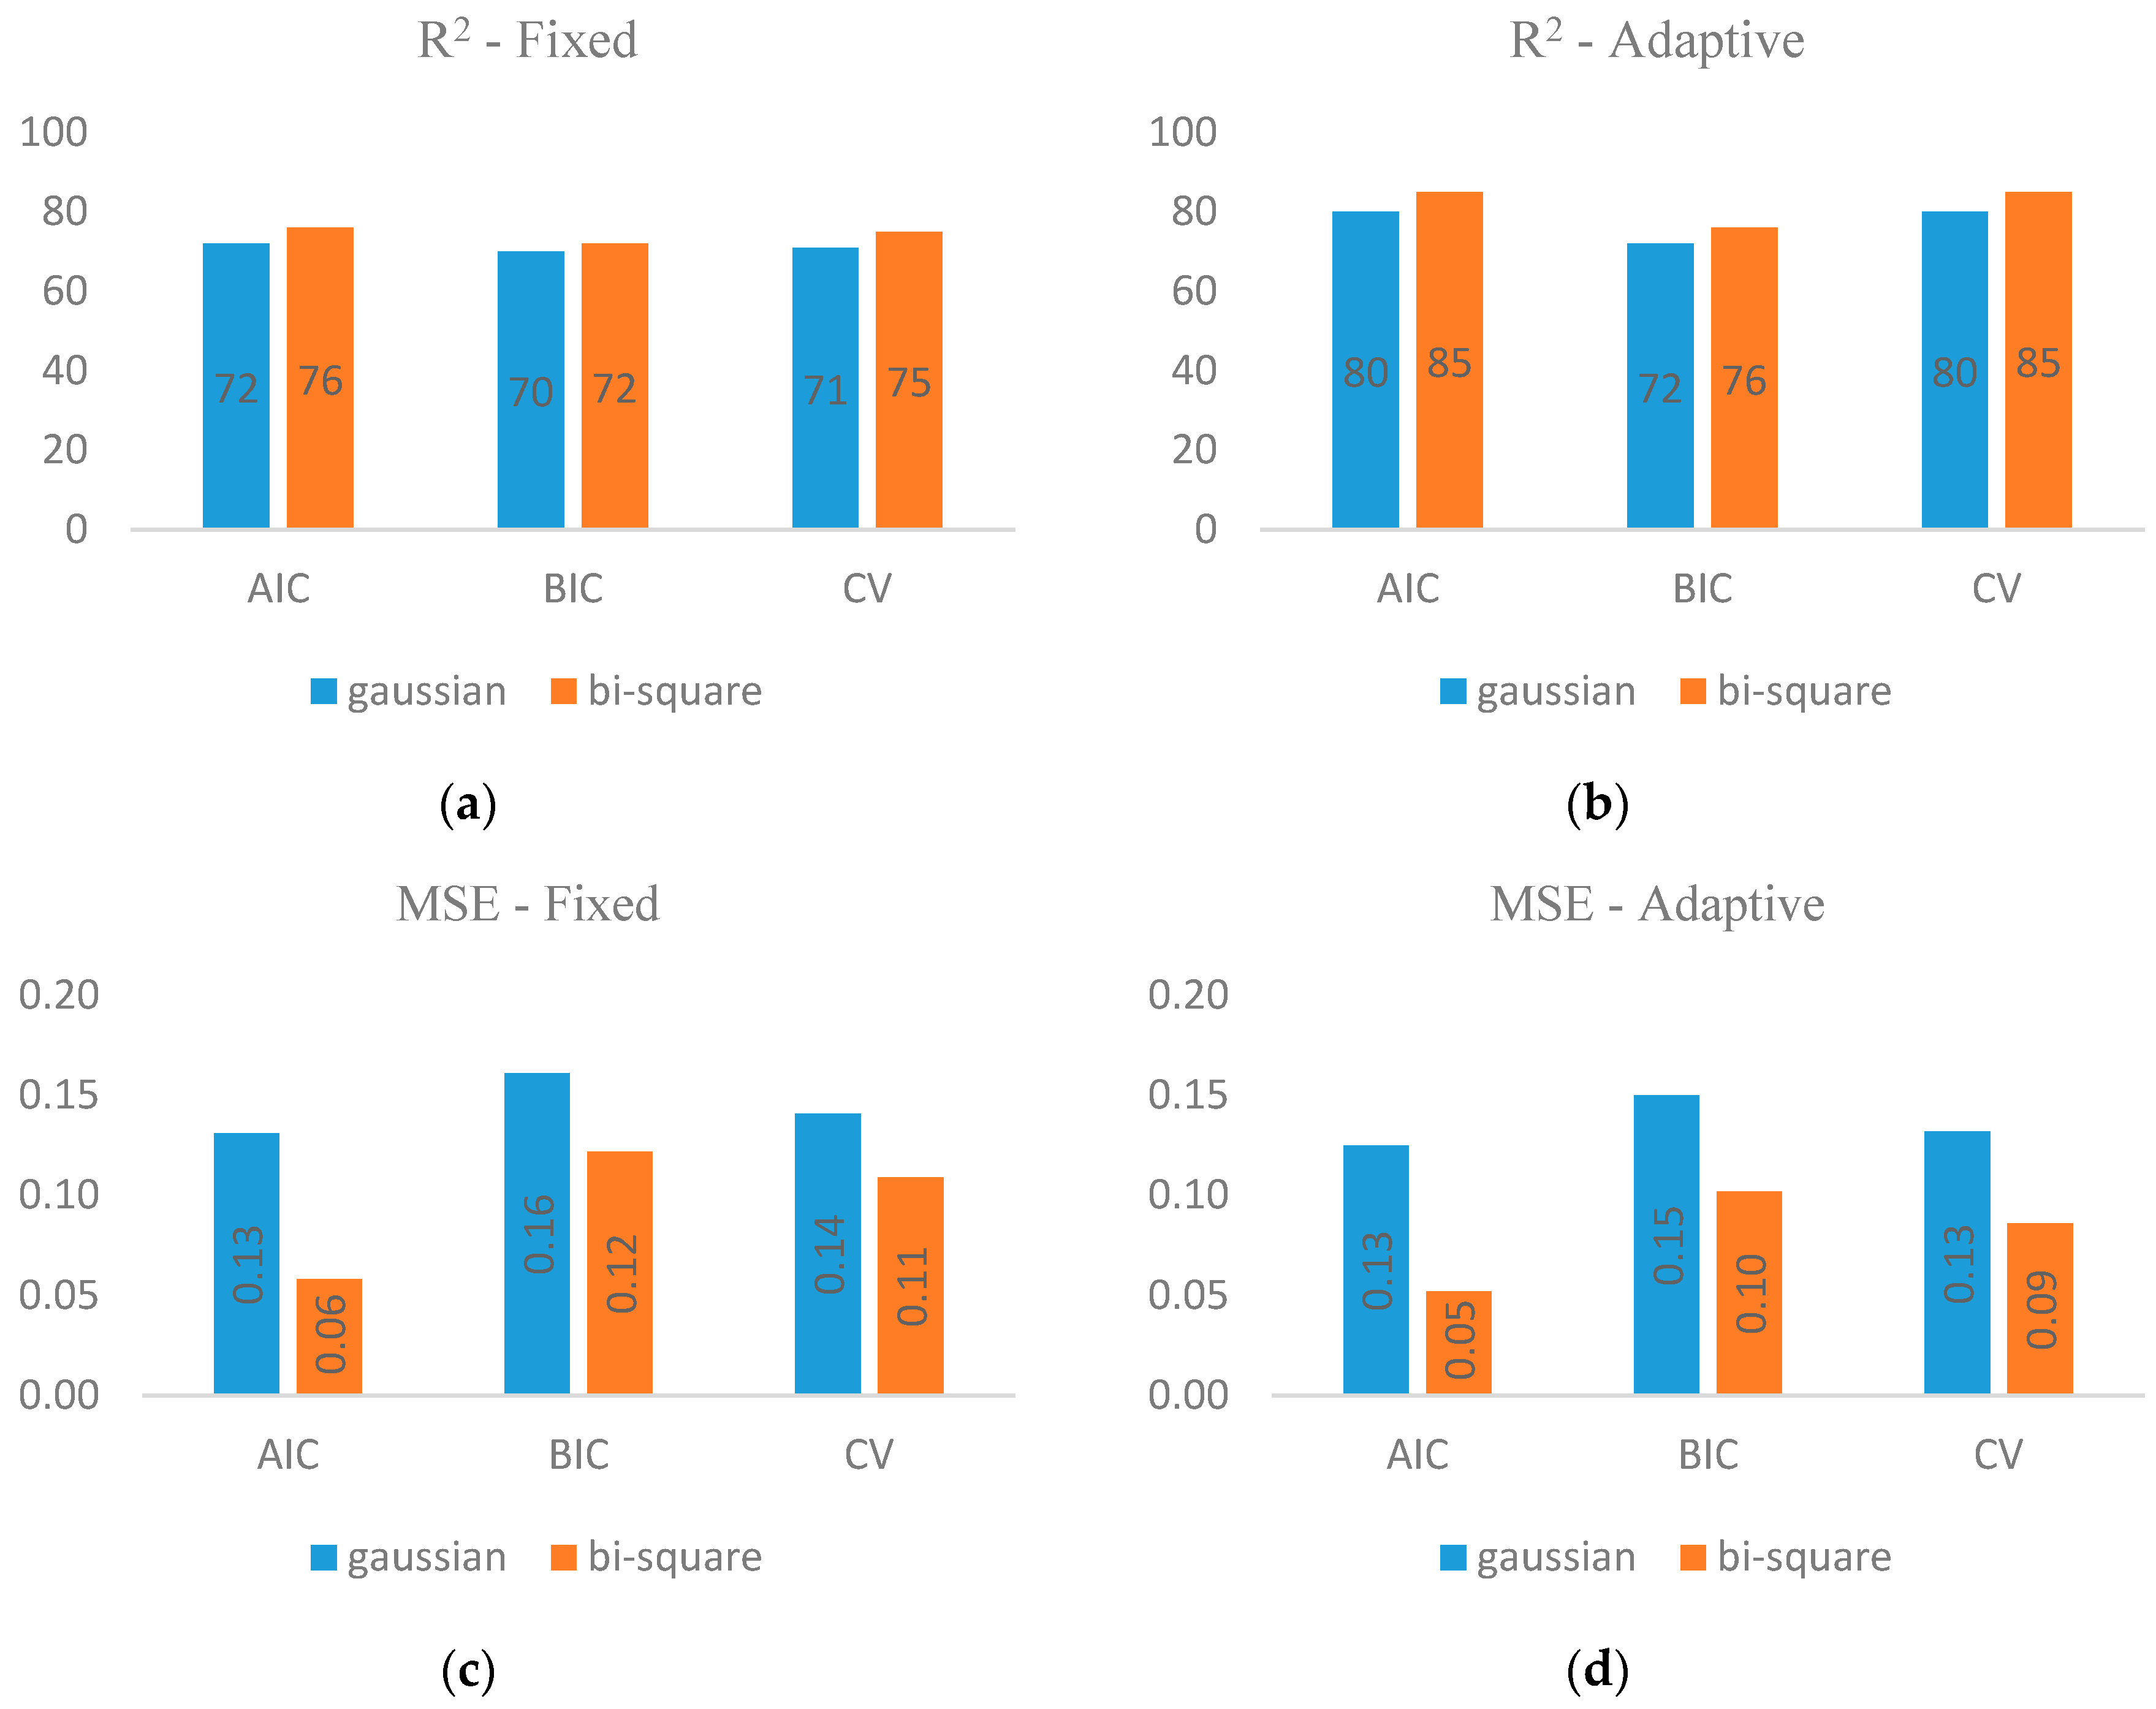
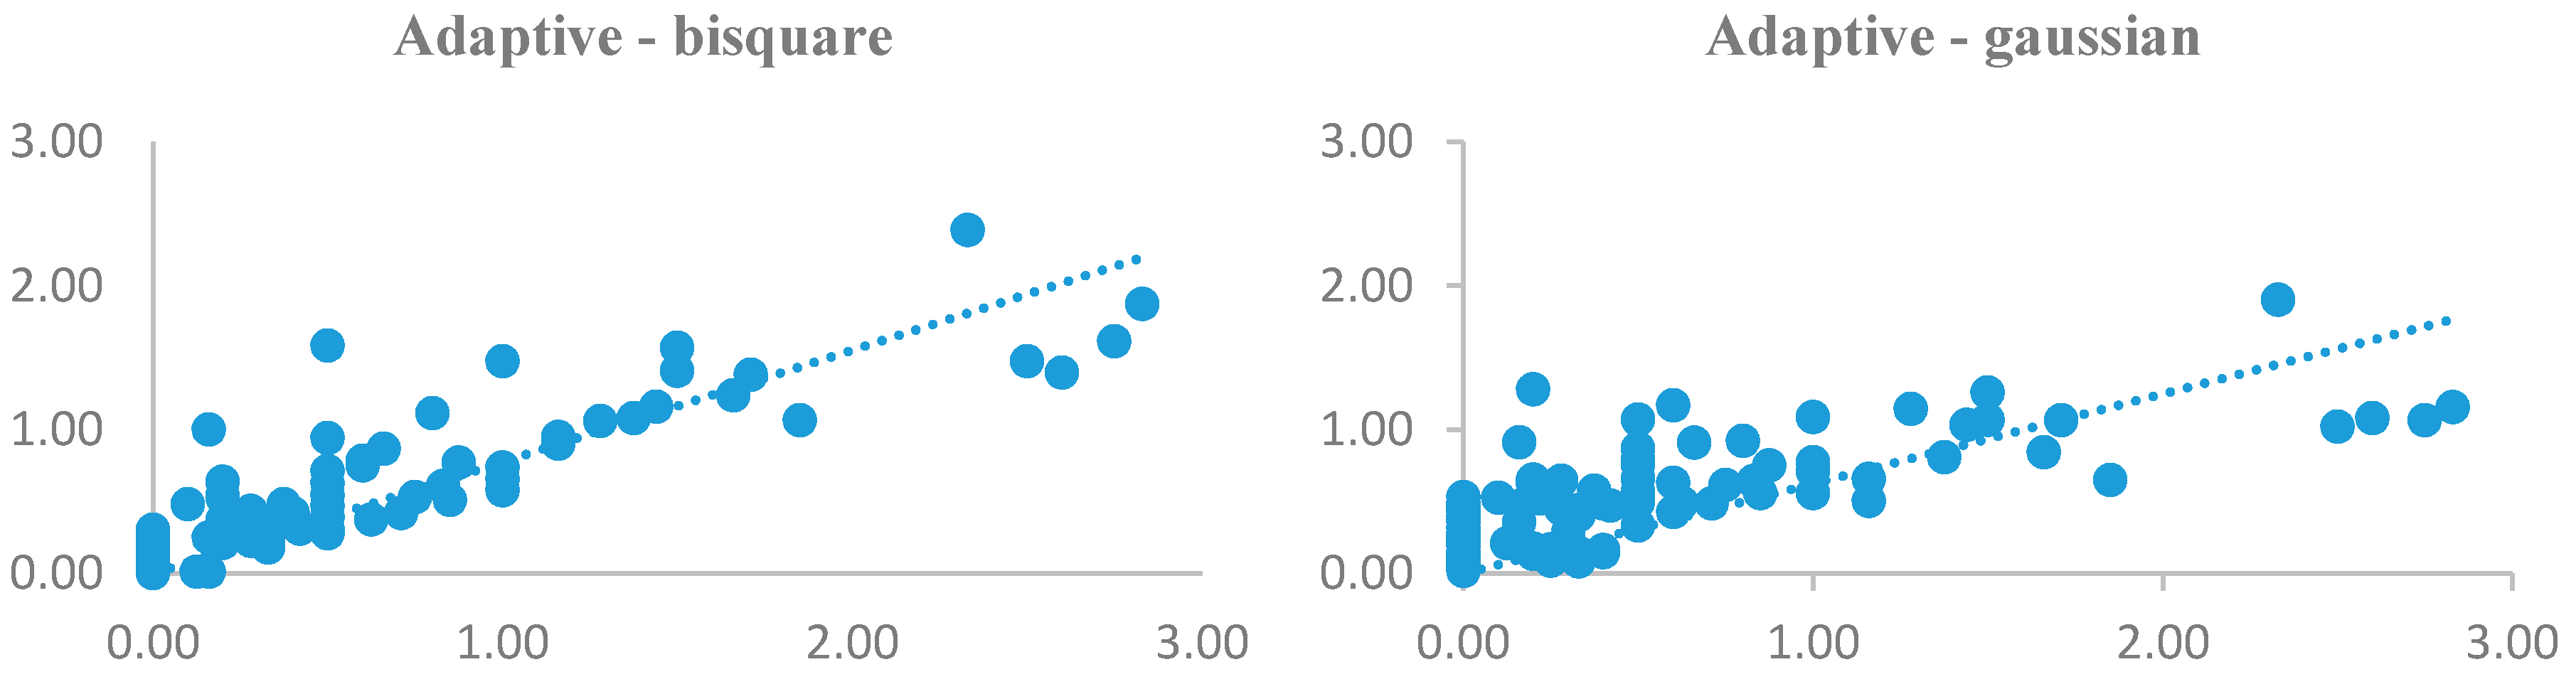
  • R2, which illustrates goodness of fit in model, were calculated for all models.
  • MSE were calculated for evaluating the differences between observed and estimated values. p-values of coefficients were considered as significance levels more than 5 percent.
  • Variance Inflation Factor (VIF) was considered less than 7.5 to ignore multicollinearity among independent variables.
  • Jarque–Bera statistic greater than 0.1 was chosen to verify normality of residuals.
  • Spatial autocorrelation more than 0.1 was selected to reject null hypothesis in residuals of Moran’s Index (positive Moran’s I = clustering trend, negative = random pattern).

3. Results and Discussion

Table 1 presents values of bandwidths and selection criteria for fixed and adaptive kernels. As mentioned before, one can compare the results of models using their values of bandwidth criteria. Considering this issue and having a look at the results shown in Table 1, we can safely conclude that AIC, CV and BIC presented respectively lower values of bandwidth criteria. In addition, investigating the results of three criteria accurately, we found that AIC and CV performed almost the same due to analogous values. Notwithstanding, BIC values were higher. Moving on to the results of kernels, except in two cases, adaptive kernel often concluded lower values of bandwidth criteria while fixed kernel did a little higher. This shed light on the perspective that results of adaptive kernel in modelling leptospirosis distribution across the study area were more reliable. Aside, results of different models that utilized adaptive kernel pointed out almost 56 neighbors as the reputable number for selecting adjacent villages to model the distribution of leptospirosis for each village. Another point worth perusing is the results of weighting functions. Although Bisquare and Gaussian weighting functions concluded approximately the same number of neighbors, using adaptive kernel, they reacted to the presence of fixed kernel distinctly. This is inasmuch as Gaussian versus Bisquare not only did propose very little bandwidth (about 20 km), but also resulted, relatively, in the same values of bandwidths criteria (104~125). Yet, as the bandwidth criteria is a yardstick for assessment of various scenarios, Bisquare results were considered more dependable in this study rather than Gaussian. In sum, Adaptive kernel, AIC bandwidth criterion and Gaussian weighting function represented more trustworthy results in comparison to others during the analysis of models.
According to the coefficients that were concluded by running all models and scenarios, temperature, precipitation, humidity and vapor had positive relation with disease while elevation and vegetation showed negative correlation. Totally, humidity and temperature included the most effect, variation range and standard deviation among other variables.
Figure 4 demonstrates separately R2 and MSE values as the evaluation criteria of models. Considering R2, it can be understood that models that used adaptive kernel were successful to reach higher values (max = 0.85), while those that utilized fixed kernel concluded often lower ones (max = 0.75). We guess that this superiority would be originated from the fact that adaptive kernel structurally considers flexible and appropriate bandwidths for modelling based on the density of villages in Gilan boundary. Nevertheless, fixed kernel applies constant bandwidths that do not vary throughout the study area. Regardless of utilizing fixed or adaptive kernel, values of R2 using AIC (max = 0.76 and 0.85) and CV (max = 0.75 and 0.85) hold the view that their performance in modelling leptospirosis seems similar. However, when it comes to comparison of BIC values (max = 0.72 and 0.76) with AIC and CV, we would like to mention that they are less reliable. Another imperative point deserving some mention here is that Bisquare results displayed higher values of R2 (max = 0.85) rather than Gaussian (max = 0.80). This would be answered supposedly due to the exponential form of the Bisquare equation and its higher values. That is why we bring up Bisquare as a preferable criterion to Gaussian. However, the above scenarios repeated in the pattern of MSE criteria which were addressed in Figure 4. As the last point, MSE values which are closer to zero conclude dependable results, though as we all know, in all models there are always some sources of deficiency which deviate the estimation from observations.
As there were a lot of models to be displayed, only the results of AIC criteria were shown (Figure 5) due to its more reliability among criteria. As can be seen, results of both kernels were analogous with little differences. In other words, both kernels were successful in modeling leptospirosis distribution across the study area. As the scatterplots compare the estimated and observed values pairwise, it can be noticed that, apart from some villages and the selected kernels, outcomes of models nearly match with the reality and follow the same trend.
Figure 6, illustrates local R2 which explains the capability of GWR predictions across the study area. Bigger red spots in the center of the province showed that predictions in central villages of Gilan were significantly reliable in comparison to other areas, and thus the results were consistent with the real distribution of leptospirosis.

4. Conclusions

For modelling leptospirosis, different variables were used such as temperature, precipitation, humidity, vapor, elevation, slope and vegetation. In addition, different scenarios of GWR were examined, and thus R2 and MSE emphasized high capability of GWR approach as evaluation criteria. Results of different weighting functions and bandwidth selection criteria used in this study indicated that adaptive kernel performed superior to a fixed one due to high values extracted from evaluation criteria; 56–68 neighbors and 20,973–58,884 m were selected as the most appropriate bandwidth values for modelling leptospirosis in Gilan. In addition, Bisquare was selected as weighting function that concludes more reliable results in comparison to Gaussian. Likewise, AIC, CV and BIC showed consecutively dependable results as bandwidth selection criteria. To summarize the whole, we intend to compare GWR with other linear regressions or nonlinear algorithms such as artificial neural network in the future work.
As the last point, all papers have several limitations or deficiency and our paper is not an exception of all. This paper confronted two kinds of limitations: data and model. First off, so important is quality of data that we must consider it as the foundation of the analysis in order to establish more reliable survey. Quality of data in this paper is based on the records of patients and environmental factors gathered by related organizations. Acquisition of leptospirosis data is based on patients’ information who were referred to the hospitals and health centers, and thus may consist of wrong addresses (due to mistakes employees of health centers and NMHT might have made when registering in computers or specific forms). Another point is that, as no model is complete and contains fault in the structure, GWR suffers from a statistical inference and framework which means that confidence intervals of coefficients should be investigated for reliability. Thus, such issues would target the reliability of results and should be declined as much as possible.

Acknowledgments

We greatly appreciate the contributions of workers at the National Ministry of Health and Mereology Organization as they did their best to provide the precise and up-to-date data used in this paper. In addition, we would like to thank the comments and suggestions of the editor and reviewers who contributed to the improvement of the paper.

Author Contributions

A.M. and A.A. conceived, designed and performed the experiments; they analyzed the data and wrote the paper with contribution from B.S.; the manuscript was discussed and reviewed by all of authors as they manipulated the context with sufficient references.

Conflicts of Interest

The authors declare no conflict of interest.

References

  1. Holt, J.; Davis, S.; Leirs, H. A model of leptospirosis infection in an African rodent to determine risk to humans: Seasonal fluctuations and the impact of rodent control. Acta Trop. 2006, 99, 218–225. [Google Scholar] [CrossRef] [PubMed]
  2. Tassinari, W.S.; Pellegrini, D.C.; Sá, C.B.; Reis, R.B.; Ko, A.I.; Carvalho, M.S. Detection and modelling of case clusters for urban leptospirosis. Trop. Med. Int. Health 2008, 13, 503–512. [Google Scholar] [CrossRef] [PubMed]
  3. Lau, C.L.; Smythe, L.D.; Craig, S.B.; Weinstein, P. Climate change, flooding, urbanisation and leptospirosis: Fuelling the fire? Trans. R. Soc. Trop. Med. Hyg. 2010, 104, 631–638. [Google Scholar] [CrossRef] [PubMed]
  4. Brown, P.; McKenzie, M.; Pinnock, M.; McGrowder, D. Environmental risk factors associated with leptospirosis among butchers and their associates in Jamaica. Int. J. Occup. Environ. Med. 2010, 2, 47–57. [Google Scholar]
  5. World Health Organization (WHO). Human Leptospirosis: Guidance for Diagnosis, Surveillance and Control; World Health Organization: Geneva, Switzerland, 2003; Available online: http://www.who.int/zoonoses/resources/Leptospirosis/en/ (accessed on 22 September 2017).
  6. Honarmand, H.; Eshraghi, S. Detection of Leptospires serogroups, which are common causes of human acute leptospirosis in Gilan, Northern Iran. Iran. J. Public Health 2011, 40, 107–114. [Google Scholar] [PubMed]
  7. Fonzar, U.J.V.; Langoni, H. Geographic analysis on the occurrence of human and canine leptospirosis in the city of Maringá, state of Paraná, Brazil. Rev. Soc. Bras. Med. Trop. 2012, 45, 100–105. [Google Scholar] [CrossRef] [PubMed]
  8. Bharti, A.R.; Nally, J.E.; Ricaldi, J.N.; Matthias, M.A.; Diaz, M.M.; Lovett, M.A.; Levett, P.N.; Gilman, R.H.; Willig, M.R.; Gotuzzo, E.; et al. Leptospirosis: A zoonotic disease of global importance. Lancet Infect. Dis. 2003, 3, 757–771. [Google Scholar] [CrossRef]
  9. McBride, A.; Athanazio, D.; Reis, M.; Ko, A. Leptospirosis. Curr. Opin. Infect. Dis. 2005, 18, 376–386. [Google Scholar] [CrossRef] [PubMed]
  10. Honarmand, H. A decade, the incidence of leptospirosis in Gilan. Iran. J. Infect. Dis. 2009, 47, 47–53. [Google Scholar]
  11. Liu, C.; Liu, Q.; Lin, H.; Xin, B.; Nie, J. Spatial analysis of dengue fever in Guangdong Province, China, 2001–2006. Asia Pac. J. Public Health 2014, 26, 58–66. [Google Scholar] [CrossRef] [PubMed]
  12. Mollalo, A.; Alimohammadi, A.; Shahrisvand, M.; Shirzadi, M.R.; Malek, M.R. Spatial and statistical analyses of the relations between vegetation cover and incidence of cutaneous leishmaniasis in an endemic province, northeast of Iran. Asian Pac. J. Trop. Dis. 2014, 4, 176–180. [Google Scholar] [CrossRef]
  13. Sadat, Y.K.; Karimipour, F.; Sadat, A.K. Investigating the Relation between Prevalence of Asthmatic Allergy with the Characteristics of the Environment Using Association Rule Mining. Int. Arch. Photogramm. Remote Sens. Spat. Inf. Sci. 2014, 40, 169–174. [Google Scholar] [CrossRef]
  14. Martinez, A.N.; Mobley, L.R.; Lorvick, J.; Novak, S.P.; Lopez, A.M.; Kral, A.H. Spatial analysis of HIV positive injection drug users in San Francisco, 1987 to 2005. Int. J. Environ. Res. Public Health 2014, 11, 3937–3955. [Google Scholar] [CrossRef] [PubMed]
  15. Guptill, S.C.; Moore, C.G. Investigating Vector-Borne and Zoonotic Diseases with Remote Sensing and GIS, in Essentials of Medical Geology; Springer: Berlin, Germany, 2013; pp. 647–663. [Google Scholar]
  16. Saksena, S.; Fox, J.; Epprecht, M.; Tran, C.C.; Castrence, M.; Nong, D.; Spencer, J.; Nguyen, L.; Finucane, M.; Vien, T.D.; et al. Role of Urbanization, Land-Use Diversity, and Livestock Intensification in Zoonotic Emerging Infectious Diseases. Available online: https://www.eastwestcenter.org/system/tdf/private/ephwp006.pdf?file=1&type=node&id=34816 (accessed on 22 September 2017).
  17. Ferreira, M.; Ferreira, M. Influence of topographic and hydrographic factors on the spatial distribution of leptospirosis disease in são paulo county, brazil: An approach using geospatial techniques and gis analysis. Int. Arch. Photogramm. Remote Sens. Spat. Inf. Sci. 2016, 41, 197–201. [Google Scholar] [CrossRef]
  18. Mohammadinia, A.; Alimohammadi, A.; Habibi, R.; Shirzadi, M.R. Spatial and Statistical Analysis of Leptospirosis in Gilan Province, Iran. Int. Arch. Photogramm. Remote Sens. Spat. Inf. Sci. 2015, 40, 497–502. [Google Scholar] [CrossRef]
  19. Khoshdel, A.; Noori Fard, M.; Pezeshkan, R.; Salahi-Moghaddam, A. Mapping the Important Communicable Diseases of Iran. J. Health Dev. 2012, 1, 31–46. [Google Scholar]
  20. Ghaedamini Asadabadi, R.; Tofighi, S.; Ghaedamini, H.; Azizian, F.; Amerieon, A.; Shokri, M. A review of some infectious diseases distribution based on geographic information system (GIS) in the area of Chahar Mahal and Bakhtiari. J. Police Med. 2012, 1, 113–124. [Google Scholar]
  21. Aliyu, Y.; Shebe, M. Using GIS in the Management of health infrastructure within Kaduna Metropolis, Nigeria. Mediterr. J. Soc. Sci. 2013, 4, 125. [Google Scholar] [CrossRef]
  22. Charandabi, N.K.; Alesheikh, A. Risk Zoning of Cardiac Arrest in the Framework of the GIS and Metaheuristic Algorithms based on the Context Information. J. Geomat. Sci. Technol. 2015, 4, 109–122. [Google Scholar]
  23. Rai, P.K. Application of Multiple Linear Regression Model through GIS and Remote Sensing for Malaria Mapping in Varanasi District, India. Available online: http://www.hsj.gr/medicine/application-of-multiple-linear-regression-model-through-gis-and-remote-sensing-for-malaria-mapping-in-varanasi-district-india.pdf (accessed on 22 September 2017).
  24. Fleming, G.; Van der Merwe, M.; McFerren, G. Fuzzy expert systems and GIS for cholera health risk prediction in southern Africa. Environ. Model. Softw. 2007, 22, 442–448. [Google Scholar] [CrossRef]
  25. Simón, L.; Afonin, A.; López-Díez, L.I.; González-Miguel, J.; Morchón, R.; Carretón, E.; Montoya-Alonso, J.A.; Kartashev, V.; Simón, F. Geo-environmental model for the prediction of potential transmission risk of Dirofilaria in an area with dry climate and extensive irrigated crops. The case of Spain. Vet. Parasitol. 2014, 200, 257–264. [Google Scholar] [CrossRef] [PubMed]
  26. Karami, J.; Delfan, S.; Shamsoddini, A. Role of Time in Spatial Analysis of Diseases in Tehran. J. Geomat. Sci. Technol. 2016, 5, 227–238. [Google Scholar]
  27. Suepaul, S.; Carrington, C.V.; Campbell, M.; Borde, G.; Adesiyun, A.A. Seroepidemiology of leptospirosis in dogs and rats in Trinidad. Trop. Biomed. 2014, 31, 853–861. [Google Scholar] [PubMed]
  28. Benacer, D.; Thong, K.L.; Min, N.C.; Verasahib, K.B.; Galloway, R.L.; Hartskeerl, R.A.; Souris, M.; Zain, S.N.M. Epidemiology of human leptospirosis in Malaysia, 2004–2012. Acta Trop. 2016, 157, 162–168. [Google Scholar] [CrossRef] [PubMed]
  29. Hennebelle, J.H.; Sykes, J.E.; Carpenter, T.E.; Foley, J. Spatial and temporal patterns of Leptospira infection in dogs from northern California: 67 cases (2001–2010). J. Am. Vet. Med. Assoc. 2013, 242, 941–947. [Google Scholar] [CrossRef] [PubMed]
  30. Azimullah, A.; Aziah, B.; Fauziah, B. The rise of leptospirosis in Kelantan 2014: Characteristics, geographical pattern and associated factors. Int. J. Public Health Clin. Sci. 2016, 3, 52–62. [Google Scholar]
  31. García-Ramírez, L.M.; Giraldo-Pulgarin, J.Y.; Agudelo-Marín, N.; Holguin-Rivera, Y.A.; Gómez-Sierra, S.; Ortiz-Revelo, P.V.; Velásquez-Bonilla, N.J.; Caraballo-Arias, Y.; Mondragon-Cardona, A.; Lozada-Riascos, C.O.; et al. Geographical and occupational aspects of leptospirosis in the coffee-triangle region of Colombia, 2007–2011. Recent Pat. Anti-Infect. Drug Discov. 2015, 10, 42–50. [Google Scholar] [CrossRef]
  32. Shojaee, J.; Hosseini, A.; Abedi, G.; Bayatani, A.; Yazdani Cherati, J.; Kaveh, F.; Ramezankhani, R.; Rostami, F. Spatial Pattern and Distribution of Leptospirosis in Mazandaran Province Using Geographic Information System. J. Mazandaran Univ. Med. Sci. 2015, 25, 151–154. [Google Scholar]
  33. Mardenta, R.N.; Nirmalawati, T.; Sulistyawati, S. Spatial Analysis of Leptospirosis Disease in Bantul Regency Yogyakarta. KEMAS Jurnal Kesehatan Masyarakat 2016, 12, 111–119. [Google Scholar]
  34. Zhao, J.; Liao, J.; Huang, X.; Zhao, J.; Wang, Y.; Ren, J.; Wang, X.; Ding, F. Mapping risk of leptospirosis in China using environmental and socioeconomic data. BMC Infect. Dis. 2016, 16, 343. [Google Scholar] [CrossRef] [PubMed]
  35. Gracie, R.; Barcellos, C.; Magalhães, M.; Souza-Santos, R.; Barrocas, P.R.G. Geographical scale effects on the analysis of leptospirosis determinants. Int. J. Environ. Res. Public Health 2014, 11, 10366–10383. [Google Scholar] [CrossRef] [PubMed]
  36. Habibi, R.; Alesheikh, A.A.; Mohammadinia, A.; Sharif, M. An Assessment of Spatial Pattern Characterization of Air Pollution: A Case Study of CO and PM2.5 in Tehran, Iran. ISPRS International. J. Geo-Inf. 2017, 6, 270. [Google Scholar]
  37. Saeidian, B.; Mesgari, M.S.; Ghodousi, M. Optimum allocation of water to the cultivation farms using Genetic Algorithm. Int. Arch. Photogramm. Remote Sens. Spat. Inf. Sci. 2015, 40, 631–638. [Google Scholar] [CrossRef]
  38. Saeidian, B.; Mesgari, M.S.; Ghodousi, M. Evaluation and comparison of Genetic Algorithm and Bees Algorithm for location–allocation of earthquake relief centers. Int. J. Disaster Risk Reduct. 2016, 15, 94–107. [Google Scholar] [CrossRef]
  39. Fotheringham, A.S.; Brunsdon, C.; Charlton, M. Geographically Weighted Regression: The Analysis of Spatially Varying Relationships; John Wiley & Sons: Hoboken, NJ, USA, 2003. [Google Scholar]
  40. Kala, A.K.; Tiwari, C.; Mikler, A.R.; Atkinson, S.F. A comparison of least squares regression and geographically weighted regression modeling of West Nile virus risk based on environmental parameters. PeerJ 2017, 5, e3070. [Google Scholar] [CrossRef] [PubMed]
  41. Bhowmik, A.K.; Alamdar, A.; Katsoyiannis, I.; Shen, H.; Ali, N.; Ali, S.M.; Bokhari, H.; Schäfer, R.B.; Eqani, S.A.M.A.S. Mapping human health risks from exposure to trace metal contamination of drinking water sources in Pakistan. Sci. Total Environ. 2015, 538, 306–316. [Google Scholar] [CrossRef] [PubMed]
  42. Brunsdon, C.; Fotheringham, A.S.; Charlton, M.E. Geographically weighted regression: A method for exploring spatial nonstationarity. Geogr. Anal. 1996, 28, 281–298. [Google Scholar] [CrossRef]
  43. Propastin, P.A. Spatial non-stationarity and scale-dependency of prediction accuracy in the remote estimation of LAI over a tropical rainforest in Sulawesi, Indonesia. Remote Sens. Environ. 2009, 113, 2234–2242. [Google Scholar] [CrossRef]
  44. Akaike, H. Likelihood of a model and information criteria. J. Econom. 1981, 16, 3–14. [Google Scholar] [CrossRef]
  45. Bowman, A.W. An alternative method of cross-validation for the smoothing of density estimates. Biometrika 1984, 71, 353–360. [Google Scholar] [CrossRef]
Figure 1. Boundary of Gilan and rural districts.
Geosciences 07 00136 g001
Figure 2. Incidence rates of leptospirosis in villages of Gilan.
Geosciences 07 00136 g002
Figure 3. Structure of study.
Geosciences 07 00136 g003
Figure 4. Estimated R2 using fixed (a) and adaptive (b) kernels, calculated MSE using fixed (c) and adaptive (d) kernels.
Geosciences 07 00136 g004
Figure 5. Scatterplots of observed and estimated values of GWR model using AIC.
Geosciences 07 00136 g005aGeosciences 07 00136 g005b
Figure 6. Local R2 (%) of GWR model using AIC.
Geosciences 07 00136 g006
Table 1. GWR results using fixed and adaptive kernels during 2009–2011.
Weighting FunctionBandwidth CriteriaFixed KernelAdaptive
Bandwidth *Bandwidth CriteriaBandwidth **Bandwidth Criteria
BisquareAIC42,2961115691
BIC58,88414164171
CV41,94711156114
GaussianAIC20,97311456104
BIC28,37519068177
CV20,97313056125
* Values are in meters. ** Values are based on number of neighbors.

