Article

3D Point Clouds in Archaeology: Advances in Acquisition, Processing and Knowledge Integration Applied to Quasi-Planar Objects

1
Geomatics Unit, University of Liège (ULiege), Quartier Agora, Allée du six Août, 19, 4000 Liège, Belgium
2
Institute of civilizations (Arts and Letters), University of Louvain (UCL), Rue du Marathon 3, 1348 Louvain-la-Neuve, Belgium
*
Author to whom correspondence should be addressed.
Geosciences 2017, 7(4), 96; https://doi.org/10.3390/geosciences7040096
Submission received: 20 July 2017 / Revised: 22 September 2017 / Accepted: 25 September 2017 / Published: 30 September 2017
(This article belongs to the Special Issue Remote Sensing and Geosciences for Archaeology)

Abstract

:
Digital investigations of the real world through point clouds and derivatives are changing how curators, cultural heritage researchers and archaeologists work and collaborate. To progressively aggregate expertise and enhance the working proficiency of all professionals, virtual reconstructions demand adapted tools to facilitate knowledge dissemination. However, to achieve this perceptive level, a point cloud must be semantically rich, retaining relevant information for the end user. In this paper, we review the state of the art of point cloud integration within archaeological applications, giving an overview of 3D technologies for heritage, digital exploitation and case studies showing the assimilation status within 3D GIS. Identified issues and new perspectives are addressed through a knowledge-based point cloud processing framework for multi-sensory data, and illustrated on mosaics and quasi-planar objects. A new acquisition, pre-processing, segmentation and ontology-based classification method on hybrid point clouds from both terrestrial laser scanning and dense image matching is proposed to enable reasoning for information extraction. Experiments in detection and semantic enrichment show promising results of 94% correct semantization. Then, we integrate the metadata in an archaeological smart point cloud data structure allowing spatio-semantic queries related to CIDOC-CRM. Finally, a WebGL prototype is presented that leads to efficient communication between actors by proposing optimal 3D data visualizations as a basis on which interaction can grow.

1. Introduction

Gathering information for documentation purposes is fundamental in archaeology. It constitutes the groundwork for analysis and interpretation. The process of recording physical evidence about the past is a first step in archaeological study for a better understanding of human cultures. In general, the goal is to derive spatial and semantic information from the gathered and available data. This is verified in various sub-disciplines of archaeology that rely on archaeometry [1]. In this setting, remote sensing is particularly interesting as a means to not only safely preserve artefacts and their context for virtual heritage [2], but also to complement or replace techniques presenting several limitations [3].
An archaeological breakthrough given by this technique is the moving of interpretation from the field to a post-processing step. The possibility to gather massive and accurate information without transcripts interpretation or in situ long presence is a revolution in archaeological workflows. It started with stereo-vision and photogrammetry to derive 3D information, but recent development deepened the representativity of digital 3D data through higher resolution, better accuracy and possible contextualization [4]. The study of materials is often linked with on-site related information, forever lost if not correctly transmitted. Digital preservation is therefore necessary to document a state of the findings, and this at different accessible temporal intervals. Visions shared by [5,6] for the digital documentation and 3D modelling of cultural heritage states that any project should include (1) the recording and processing of a large amount of 3D multi-source, multi-resolution, and multi-content information; (2) the management and maintenance of the 3D models for different applications; (3) the visualization of the results to share the information with other users allowing data retrieval “through the Internet or advanced online databases”; (4) digital inventories and sharing “for education, research, conservation, entertainment, walkthrough, or tourism purposes”. In this paper, we propose such a solution.
The information as we see it is mostly 3D: “when we open our eyes on a familiar scene, we form an immediate impression of recognizable objects, organized coherently in a spatial framework” [7]. Therefore, tools and methods to capture the 3D environment are a great way to document a 3D state of the archaeological context, at a given time. Analogous to our visual and cognitive system, 3 steps will condition the completeness of the surveyed object. First, the perception, i.e., how the visual system processes the visual information to construct a structured description of the shape of the object/scene. Second, the shape recognition or how the product of the perceptual treatment will contact stored representations in the form of known objects (it will construct a perceptual depiction that will be a representation of the same nature stored in memory). Finally, the identification (labelling), i.e., when a stored structural representation is activated, it will in turn activate the unit of meaning (concept) that corresponds to it, located in the semantic system. Sensors are the analogue to our perception, and aim at extracting the visual stimuli it is sensitive to (spatial information, colour, luminance, movement, etc.). At this stage, neither the information on the shape of the object nor the label is extracted. In the case of 3D remote sensing, the quality of observation is therefore critical to enable high quality and relevant information extraction about the application. As such, the sensory perceptive processing capable of extracting visual primitives must be as objective and complete as possible, making sensors for point cloud generation favourable. Constituted of a multitude of points, they are a great way to reconstruct environments tangibly, and enabling further primitive’s extractions (discontinuity, corners, edges, contour,, etc.) as in our perceptive visual system (described in [7]). However, their lack of semantics makes them a bona-fide [8] spatial representation, thus of limited value if not enhanced.
Deriving semantic information is fundamental for further analysis and interpretation. This step is what gives a meaning to the collected data, and allows to reason on sites or artefacts. All this information must be retained and structured for a maximum interoperability. In an archaeological context, many experts must share a common language and be able to exchange and interpret data through ages, which necessitate the creation of formalized structure to exchange such data. Multiple attempts were made, and the CIDOC Conceptual Reference Model (CRM) is a formalization that goes in this direction. “It is intended to promote a shared understanding of cultural heritage information by providing a common and extensible semantic framework that any cultural heritage information can be mapped to. It is intended to be a common language for domain experts and implementers to formulate requirements for information systems and to serve as a guide for good practice of conceptual modelling. In this way, it can provide the semantic glue needed to mediate between different sources of cultural heritage information, such as that published by museums, libraries and archives”. It is used in archaeology such as in [9] and provides semantic interoperability. Ontologies offer considerable potential to conceptualize and formalize the a-priori knowledge about gauged domain categories [10] that relies primarily on expert’s knowledge about real world objects. If correctly aggregated and linked to spatial and temporal data, digital replicas of the real world can become reliable matters of study that can survive through times and interpretations, which reduces the loss or degradation of information related to any site study in archaeology.
However while promising structures and workflow provide partial solutions for knowledge injection into point clouds [11,12], the integration, the maturation state as well as the link between semantic and spatial information is rudimentary in archaeology. Concepts and tools that simplify this process are rare, which complicates the merging of different experts’ perceptions around cultural heritage applications. Being able to share and exchange contextual knowledge to create a synergy among different actors is needed for planning and analysis of conservation projects. In this context, we explore ways to (1) better record physical states of objects of interest; (2) extract knowledge from field observations; (3) link semantic knowledge with 3D spatial information; (4) share, collaborate and exchange information.
This paper is structured in a dual way to provide both a background of 3D used techniques in archaeology, and technical details of the proposed point cloud workflow for quasi-planar heritage objects.
In the first part, we carefully review the state of the art in digital reconstruction for archaeology. This serves as a basis to identify research perspectives and to develop a new methodology to better integrate point clouds within our computerized environment.
Secondly, we propose a framework to pre-process, segment and classify quasi-planar entities within the point cloud based on ontologies, and structure them for fast information extraction. The methodology is illustrated on the case of the mosaics of Germigny-des-Prés (France) and then applied to other datasets (façade, hieroglyphs). Finally, the results are presented, and we discuss the perspectives as well as data visualisation techniques and WebGL integration.

2. Digital Reconstruction in Archaeology: A Review

3D digital exploration and investigations are a proven way to extract knowledge from field observations [13,14]. The completeness and representativity of the 3D data gathered by sensors are critical for such digitalization. Equally, methodologies, materials and methods to “clone” a scene are important for the extensiveness of any reconstruction. The 3D-capturing tools and software drastically evolved the last decade; thus, we review the current state of the art in digital reconstruction for archaeology.

2.1. Archaeological Field Work

Even if an increasing number of archaeological contributions deal with 3D and related management of information, archaeologists are still sceptical about 3D technologies and often use manual drawings for cautious observations and first analyses on the field [15]. The literature gravitates around a controversial or diverging hypothesis which illustrates this reticence to adopt new technologies in remote sensing [14,16]. During an empirical recording of monuments or sites, measurements are taken (by hand), taking distances between characteristic points on the surface of the monument. The definition of the coordinates is done on an arbitrary coordinate system on a planar surface of the structures. The method is simple, reproducible and low-cost but limiting factors such as limited accuracy, time demand and necessary direct contact makes it unfavourable in many scenarios including for inaccessible areas. However, archaeologists will often use such an approach over remote sensing to gather insights that are otherwise considered incomplete. The 3D methods are frequently regarded as intricate, expensive and not adapted to archaeological issues [17]. On most sites, for buildings studies or in excavations, the data gathering and acquisition are made with drawings and pictures in 2D. In some cases, 3D can come after the analyses process and is used as a “fancy” means to present results and rebuilt a virtual past. As noticed by Forte [18]: “there was a relevant discrepancy between bottom-up and top-down processes. The phase of data collecting, data-entry (bottom-up) was mostly 2D and analogue, while the data interpretation/reconstruction (top-down) was 3D and digital”. However, the new possibilities given by 3D remote sensing extend the scope of possible conservation and analysis for digital archaeology, and can progressively move to post-processing a part of the interpretation process, making the underlying data (if complete) the source on which different reading and conclusions can be mined. Yet, such techniques cannot replace a field presence when complementary semantics (from other senses such as hearing, taste, smell, touch) are necessary.
The different data types from these remote sensing platforms played a vast role in complexifying the diversification in methodologies to derive the necessary information from the data (data-driven). However, the 3D spatial data extracted from the bottom-up layer for most of these techniques are surveyed points, in mass, creating point clouds. They are driven by the rapid development of reality capture technologies, which become easier, faster and incur lower costs. Use cases in archaeology show the exploration and acceptation of new techniques, which are assessed not only in regard to their accuracy, bust mostly in accordance to their fit to a specific context, and the associated costs. Following the categorization defined in [16], we distinguish “(1) the regional scale, to record the topography of archaeological landscapes and to detect and map archaeological features, (2) the local scale, to record smaller sites and their architecture and excavated features, and (3) the object scale, to record artefacts and excavated finds”. In their article, the authors reviewed some passive and active sensors for 3D digitization in archaeology at these different scales. They conclude that the principal limiting factor for the use of the different remote sensing technologies reviewed (Synthetic Aperture Radar (SAR) interferometry, Light Detection and Ranging (LiDAR), Satellite/Aerial/Ground imagery, Terrestrial Laser Scanning (TLS), Stripe-projection systems) is the ratio added value of a digital 3D documentation over the time and training that inexperienced users must invest before achieving good results. In their paper, [19] state that 3D recording is the first step to the digitization of objects and monuments (local and object scales). They state that a 3D recording method will be chosen depending on the complexity of the size and shape, the morphological complexity (Level of Detail—LoD), and the diversity in materials. While this is accurate looking purely at a technical replication, other factors such as user experience, available time or budget envelope will constrain the instrument or technique of choice. They propose a 9-criteria choice selection as follows: cost; material of digitization subject; size of digitization subject; portability of equipment; accuracy of the system; texture acquisition; productivity of the technique; skill requirements; compliance of produced data with standards. While this extends the global understanding and 3D capture planning, it lacks a notion of time management (implied in productivity) or constraints in line with contextual laws and regulations (no contact survey only, etc.). Although they separate “accuracy” from “texture acquisition”, both can be related, as well as additional features provided by the sensors (e.g., intensity) that can extend the criterion table.
We note a large discrepancy between scales of the remote sensing and related costs/methods tested for point cloud generation.
At a regional scale, airborne LiDAR is sparsely used in archaeology, mostly as a 2.5 D spatial information source for raster data analysis. It is a powerful tool to analyse past settlement and landscape modification at a large scale. Use cases such as in [20,21,22,23] helped remove preconceptions about settlements size, scale, and complexity by providing a complete view of the topography and alterations to the environment, but while it provided new research and analysis directions, the LiDAR data did not leverage 3D point clouds considered too heavy and too raw to provide a source of information.
At both the local scale and the object scale, several use cases exploit active sensoring, specifically terrestrial laser scanners (TLS) using phase-based and time-of-flight technologies [24]. Archaeological applications vary such as in [25] to reconstruct a high-resolution 3D models from the point cloud of a cave with engravings dating back to the Upper Palaeolithic era, in [26] to study the damage that affected the granitic rock of the ruins of the Santo Domingo (Spain), or in [27] for the 3D visualization of an abandoned settlement site located in the Central Highlands (Scotland). More recent procedures make use of TLS to reconstruct the Haut-Andlau Castle (France) [28], or in [29] to map the Pindal Cave (Spain). These showed that to capture fine geometric details, laser-scanning techniques provide geometric capabilities that have not yet been exceeded by close-range photogrammetry, especially when concave or convex forms need to be modelled. Rising from the static concept, Mobile laser scanning (MLS) [30] has scaled up the data rate generation of TLS by allowing dynamic capture using other sensors including GNSS position and inertial measurements for rapid street point cloud generation and public domain mapping. New concepts and technology including Solid State LiDAR and simultaneous localization and mapping (SLAM) have pushed dynamic acquisition for quickly mapping with a lower accuracy the surroundings, extending cases using HMLS (Hand-held mobile laser scanning) [31], MMS (Mobile Mapping System) [32], or more recently MMBS (Mobile Mapping Backpack System) [33]. At the object scale, active sensors namely for active triangulation, structured light and computer tomography for 3D modelling is widely used due to its high precision, and adaptation to small isolated objects [34]. Moving to ground technologies, surveys are precise in detecting sub-surface remains. Different geophysical processing techniques and equipment (such as ground penetrating radar (GPR), magnetometry and resistivity) are usually integrated together, to increase the success rate of uncovering archaeological artefacts, for example in [35] to delineate the extent of the remains of a small town that has been submerged (Lake Tequesquitengo, Mexico).
Passive sensing gained a lot of attention in the heritage community following terrestrial use cases and image crowdsourcing, allowing a wide range of professionals and non-expert to recreate 3D content from 2D poses (exhaustive software list from [36,37,38,39,40,41,42,43,44,45,46]). The rapidly growing interest for light aerial platforms such as UAV (Unmanned Aerial Vehicle) based solutions and software based on multi-view dense image matching [47,48] and structure from motion [49] swiftly provided with an alternative to active sensoring. Use cases for 3D archaeological and heritage reconstruction are found at the object scale through terrestrial surveys [4,14,50,51] and the local scale through light aerial platforms, making this technique a favourable way to obtain quick and colour balanced point clouds. Moreover, the cost and accessibility (hardware and software) of dense-image matching reconstruction workflows have allowed its spread in archaeological studies. For example, in the Can Sadurní Cave (Spain), Nunez et al. [52] successfully reconstructed an object via dense-image matching and georeferenced the obtained 3D model using TLS point cloud data of the Cave. They state that capture from different positions is fundamental to generate a complete model that does not lack important information.
While reconstruction accuracy is increasing [53], remote sensing via active sensors is favoured in the industry for local scales. There are discussions in which computer vision would replace LiDAR [28,54]; however, practical cases tend to a merging of both (Reconstruction of the Amra and Khar-anah Palaces (Jordan) [55], the castle of Jehay (Belgium) [56]), and predilection applications for each techniques, combining strength of natural light independence with low-cost and highly visual image-based reconstruction [56]. Particularly in the case of mosaics, decorations and ornaments, the combination of features from sensors generating accurate and complementary attributes permits the overcoming of limits arising from a small set of features. Indeed, use case such as in [57] results in a high richness of detail and accuracy when combining TLS and close range photogrammetry which was not achievable otherwise. Thus, multisensory acquisition provides an interesting method that will be investigated.
The high speed and rate generation of 3D point clouds has become a convenient way to obtain instant data, constituting datasets of up to Terabytes, so redundant and rich that control operation can take place in a remote location. However, they often go through a process of filtering, decimation and interpretation to extract analysis reports, simulations, maps, 3D models considered as deliverables. A common workflow in archaeology concerns the extraction of 2D profiles and sections, 2D raster to conduct further analysis or to create CAD deliverables, particularly looking at ornaments, mosaics or façades. This induces several back and forth movements within the pipeline, and the general cohesion, storage system often lack extensibility. This challenge is particularly contradictory, and a solution to automate recognition such as [58] in the context of mosaics would therefore provide very solid ground for tesserae detection, extended to 3D by combining many more sets of features. This will be specifically studied in Section 3.
While all the reviewed literature specifically points out the problems linked with data acquisition and summarize the strength and weakness of each regarding the recorded spatial information, few specifically link additional semantic information. Gathered in situ or indirectly extracted from the observation, the measurements often rely on specific interest points. While this is handy looking at one specific application for one archaeologist, this practice is dangerous regarding the problematic of curators and conservation. Indeed, preserving at a later stage the interpretation through sketches, drawings, painting or text description based on interest points makes any possible data analysis impossible from the raw source. Therefore, 3D point selectivity should not arise at the acquisition step, but in a post-processing manner, to benefit of the flexibility given by 3D data archives, which was impossible before the emergence of automatic objective 3D capturing devices.
We postulate that when designing data processing workflow, specific care must be given to the objectivity linked with the spatial data, which multisensory systems and point clouds specifically answer. As such, they can constitute the backbone of any powerful spatial information system, where the primitive is a 0-simplex [59]. Their handling in archaeology, however, is a considerable challenge (often replace by 3D generalization such as meshes, parametric models, etc.) and thus presents many technical as well as interpretation difficulties.

2.2. Integration of 3D Data

As demonstrated in [60], the evolution of remote sensing for archaeological research and the acceptance in archaeology has grown linearly since 1999 looking at the number of publications (Sources SCOPUS, ScienceDirect & Web of Science search engines) related to remote sensing per year. While this provides new possibilities, the reliability and heterogeneity of the spatial information are issues in heritage for the conservation, interoperability and storage of data. 3D GIS linked to archaeological databases have been thought and proposed for the management of this information at different scales and on different type of sites such as large excavated sites [61,62,63,64]. In their paper [62], the authors discuss the possibility and the ultimate goal of having a complete digital workflow from 3D spatial data, to efficiently incorporate the information into GIS systems while relying on formal data model. After stating the limits and difficulties of integrating efficiently 3D data (as well as time variations), they interestingly express the domain specifications and formalization through ontologies. Within a knowledge system, standards and procedures are key to warrant the consistent meaning of collective contents and to trace the “history” of the processed data [63]. In their use case, they create a 3D model segmented regarding semantic information to allow the independent manipulation as well as GIS query between elements. They claim to provide new standards in 3D data capture to be usable by all archaeologist, but their method is empirically defined and the integration of knowledge sources is blurry regarding segmentation and semantic injection. Building archaeology is also a field where 3D applications are used mainly for conservations purpose [65,66,67]. In these contributions, the authors highlight two characteristics of archaeological cases: the heterogeneity of data and the difficulty of processing 3D spatial entities from irregular archaeological objects (artefacts, buildings, layers, etc.). Several solutions have been offered in the mentioned papers and specific software have been designed (see [68] for a relevant 3D GIS use case and [69] for the most recent summary). In these studies, the definition of archaeological facts rests on their representation as raster data, specific point of interest, polygons and 3D shapes, but never the direct source of spatial information: point clouds.
At this step, several criterions should be considered to choose the most suitable spatial data model. Many researchers proposed 3D grid representation (voxels) as the most appropriate data format for handling volumetric entities and visualizing continuous events [70,71]. Generalizing point cloud entities by volume units such as a voxels allows 3D GIS functionalities such as object manipulation, geometry operations and topology handling regarding [72]. Although Constructive Solid Geometry (CSG) and 3D Boundary representations (B-rep) can roughly depict a spatial entity, the level of generalization of the underlying data has an impact on the accuracy and representativity of GIS functionalities’ results. Thus, point cloud brings an additional flexibility by giving the possibility to recover the source spatial data information. The limits with available commercial and open source database GIS systems (which are mostly used by archaeologist) made point clouds a secondary support information for primarily deriving 3D model generalizations. This of course limits the conservation potential of archaeological findings, as the interpretation behind data modelling workflows is unique and irreversible (one-way). As such, to our knowledge, no 3D archaeological GIS system is directly based on 3D point cloud. They are rather considered heavy and uninterpretable datasets. Furthermore, the constitution and leveraging of knowledge sources is still limited, with some experiences by manual injection reviewed in [61,62,63,64]. This of course constitutes a major issue that needs to be addressed for scaling up and generalizing workflows. The different literature involved in the constitution of 3D GIS delineates the need of standardization, especially regarding the variety of data types. In this direction, one specific use case in [62] demonstrated that the main advantage of the 3D GIS methodology is the link between attribute information to discrete objects defined by the archaeologist. Their implementation is done regarding the CIDOC-CRM ISO 21127 standard and the design patterns from the ontological model of the workflow of the Centre for Archaeology to achieve semantic compatibility. As opposed, the approach presented in [73] allows linking of 3D models of buildings and graph-based representation of terms. It describes its domain-linked morphology to provide new visual browsing possibilities. In this approach, one expert creates a graph for one specific application. This allows the comparison of semantic descriptions manually established by experts with divergent perspectives but lacks extensibility to match general rules. Indeed, while the description flexibility within one field can benefit from this, it can lead to interoperability problems when a formalization needs to be established, especially regarding geometrical properties or for structuring the semantics according to a pattern. Even though there are several works dedicated to ontology-based classifications of the real-world entities, the ontologies developed so far are rarely integrated with the measurements data (physical data). As such, [74] proposes an observation-driven ontology that plays on ontological primitives automatically identified in the analysed data through geo-statistics, machine-learning, or data mining techniques. These provide a great standpoint to semantic injection and will be further studied. In particular, the possibility to specialize the ontology through extensions such as CIDOC CRMba (an extension of CIDOC CRM to support buildings archaeology documentation) or CIDOC CRMgeo (an extension of CIDOC CRM to support spatiotemporal properties of temporal entities and persistent items) provides new solutions for higher interoperability.
The literature review showed a shift at an acquisition phase toward better means to record physical states of an environment, an object. TLS and dense-image matching showed an increase in popularity, and their combination provide new and promising ways to record archaeological artefacts and will thus be investigated. However, both methods generate heavy point clouds that are not joined directly with knowledge sources or structured analogously to GIS systems. Rather, their use is limited to providing a reference for other information and deliverables (2D or 3D). While this is a step forward toward higher quality documentation regarding other reviewed field methods, this is not a long-term solution when we look at the evolution of the discipline, the quantity of generated data and the ensuing ethics. The identified problem concerns the link between domain knowledge and spatial information: it evolves in parallel, partially intersects or is hardcoded and manually injected. Moreover, the flexibility regarding possible analysis is often null due to interpreted documents that force a vision over elements that no longer physically exist, or which were poorly recorded. Therefore, a strong need for ways to integrate knowledge to point clouds is essential. This “intelligence spring” is categorized regarding 3 sources as identified in [11], being device knowledge (i.e., about tools and sensors), analytic knowledge (i.e., about algorithms, analysis and their results) and domain knowledge (i.e., about a specific field of application). Their rapprochement to point clouds is, however, a bottleneck that arises early in the processing workflow. If we want to better integrate point clouds as intelligent environments [75], we must correctly assemble knowledge sources with the corresponding “neutral” spatial information. This relies on different procedures to (1) pre-process the point cloud; (2) detect the entities of interest within the initial point clouds and (3) attach the knowledge to classify and allow reasoning based on the classification. As such, our work proposes to leverage the use of ontologies as knowledge sources, as well as defining a workflow to directly process and integrate point clouds within 3D GIS systems, creating virtual heritage [2]. In the next part, we describe our technical method for integrating knowledge within reality based point-clouds from TLS and close-range photogrammetry. While the following methodology can be extended to different applications with examples such as in Section 5, it is illustrated and applied to quasi-planar objects of interest.

3. Materials and Methods

The applied workflow of object detection and classification is organized as follows: in the data pre-processing step, the different point clouds are treated using the procedure described in Section 3.1 (Step 1, Figure 1). Subsequently, point cloud descriptors as well as object descriptors such as the extent, shape, colour and normal of the extracted components are computed (Step 2, Figure 1) and imported into the next classification procedure using a converter developed in this study (Step 3, Figure 1). In the last step, the objects are classified based on the features formalized in the ontology (Step 4, Figure 1).
The process to identify features of interest within the signal is the foundation for the creation of multi-scale ensembles from different datasets. The work described in [76] extensively reviews data fusion algorithms defined by the U.S department of Defense Joint Directors of Laboratories Data Fusion Subpanel as “a multilevel, multifaceted process dealing with automatic detection, association, correlation, estimation and combination of data and information from single and multiple sources to achieve refined position and identify estimates, and complete and timely assessments of situations and threats and their significance”. The combination of different sensors generating complementary signatures provides pertinent information without the limitations of a single use and creates a multisensory system [77]. Thus, following the postulate of the state of the art, we decide to adopt a multi-sensory workflow for maximizing information (Section 2.1).

3.1. Point Cloud Data Acquisition and Pre-Processing

A pre-processing step is necessary to obtain a highly representative signal of the value measured as defined in [78]. Indeed, to avoid external influential sources that degrade the information, this step demands adapted techniques to minimize errors including noise, outliers and misalignment. Filtering the data strongly depends on device knowledge [11].
Several sets of data from various contexts were acquired to perform different tests. The Carolingian church located in Germigny-des-Prés (Loiret, France) houses ancient mosaics dating from the 9th century, composed of about one hundred thousand tesserae (the average surface of a tessera is 1 cm2, square of 1 cm by 1 cm). The preserved works offer a unique opportunity for the study of mosaics and glass. Indeed, the tesserae that composes it are mainly made in this material, which is rare in the archaeological context of the early Middle Ages [79]. However, part of the mosaic was restored in the 19th century; therefore, tesserae are from two periods; thus, we must first distinguish the different tesserae types (based on their age) for accessing alto-medieval glass information. The study could reveal important predicates, considering each tessera taken independently or by analysing different properties, while conjecturing with expert’s domain knowledge. The mosaic of the vault culminates at 5402 m above the ground, presenting many challenges for 3D capture from active and passive sensors. The dome is protected, and the limited accessibility tolerates only a light scaffolding, too narrow for the positioning of tripods, illustrating the need to adapt means to the context Figure 2.
The first sample was acquired using a phase-based calibrated terrestrial laser scanner: the Leica P30. The different scans were registered using 1338 reflective targets, of which 127 were shot by a total station (Leica TCRP1205, accuracy of 3 mm + 2 ppm) and used for indirect georeferencing afterwards. The mean registration error is 2 mm, and the mean georeferencing deviation is 2 mm (based on available georeferenced points measured from the total station). Two point cloud segments of the same zone (mosaic) were extracted: one unified point cloud that includes measurements from 8 different positions with varying range and resolutions, and one high resolution point cloud (HPC) from one optimized position by using an extended mounted tribrach. A comparison emphasized the influence of the angle of incidence and the range over the final resolution, precision and intensity of the point cloud. Thus, we chose the HPC for its higher representativity (Figure 3).
The TLS was operated at 1550 nm for a maximum pulse energy of 135 NJ. Initial filtering was conducted such as deletion of intensity overloaded pixels (from highly retro-reflective surfaces) and mixed pixels to flag problematic multi-peak scan lines and keep the right return via full-waveform analysis. The final accuracy of a single point at 78% albedo is 3 mm. The final HPC is composed of 30,336,547 points with intensity ranging from 0.0023 to 0.9916, and covers solely the mosaic. Several pictures were taken at different positions to obtain a 3D point cloud of the mosaic. These pictures were shot using a Canon EOS 5D mark III camera equipped with a 24–105 mm lens. In total, 286 pictures of 5760 × 3840 in RAW, radiometrically equalized and normalized, were used to reconstruct the photogrammetric point cloud (Figure 4).
The knowledge around the acquisition methodology provides important information as missing/erroneous data, misadjusted density, clutter and occlusion are problems that can arise from an improper or impossible capture configuration on the scene [80], resulting in a loss of transmitted information or data quality. Combining different sensors with diverse acquisition methodologies allows the overcoming of this challenge and provides a better description of the captured subject through (1) higher quality features (i.e., better colour transcription, better precision, etc.); (2) specific and unique attribute transfer; (3) resolution and scale adaptation, sampling or homogenizing [81]. The knowledge extracted from a device, analytical knowledge or a domain formalisation constitutes the fundamental information repository on which a multi-level data structure is constructed (Section 3.2).
The first step is therefore to correctly reference point clouds, known as data registration. The method is derived from previous work to perform accurate attribute transfer [56]. The main idea is that a priority list processing is established and influences data fusion regarding knowledge. When combining different point clouds, their geometry and attributes in overlapping areas are then properly addressed. The complementary information needs to be combined from the different available sources if relevant, keeping the most precise geometry as a structure. Avoiding heterogeneous precisions is essential, leading to point deletion rather than point caching and fusing. Once correctly registered, every point cloud data source goes through a pixel and attribute level fusion (if not previously fused at the sensory level).

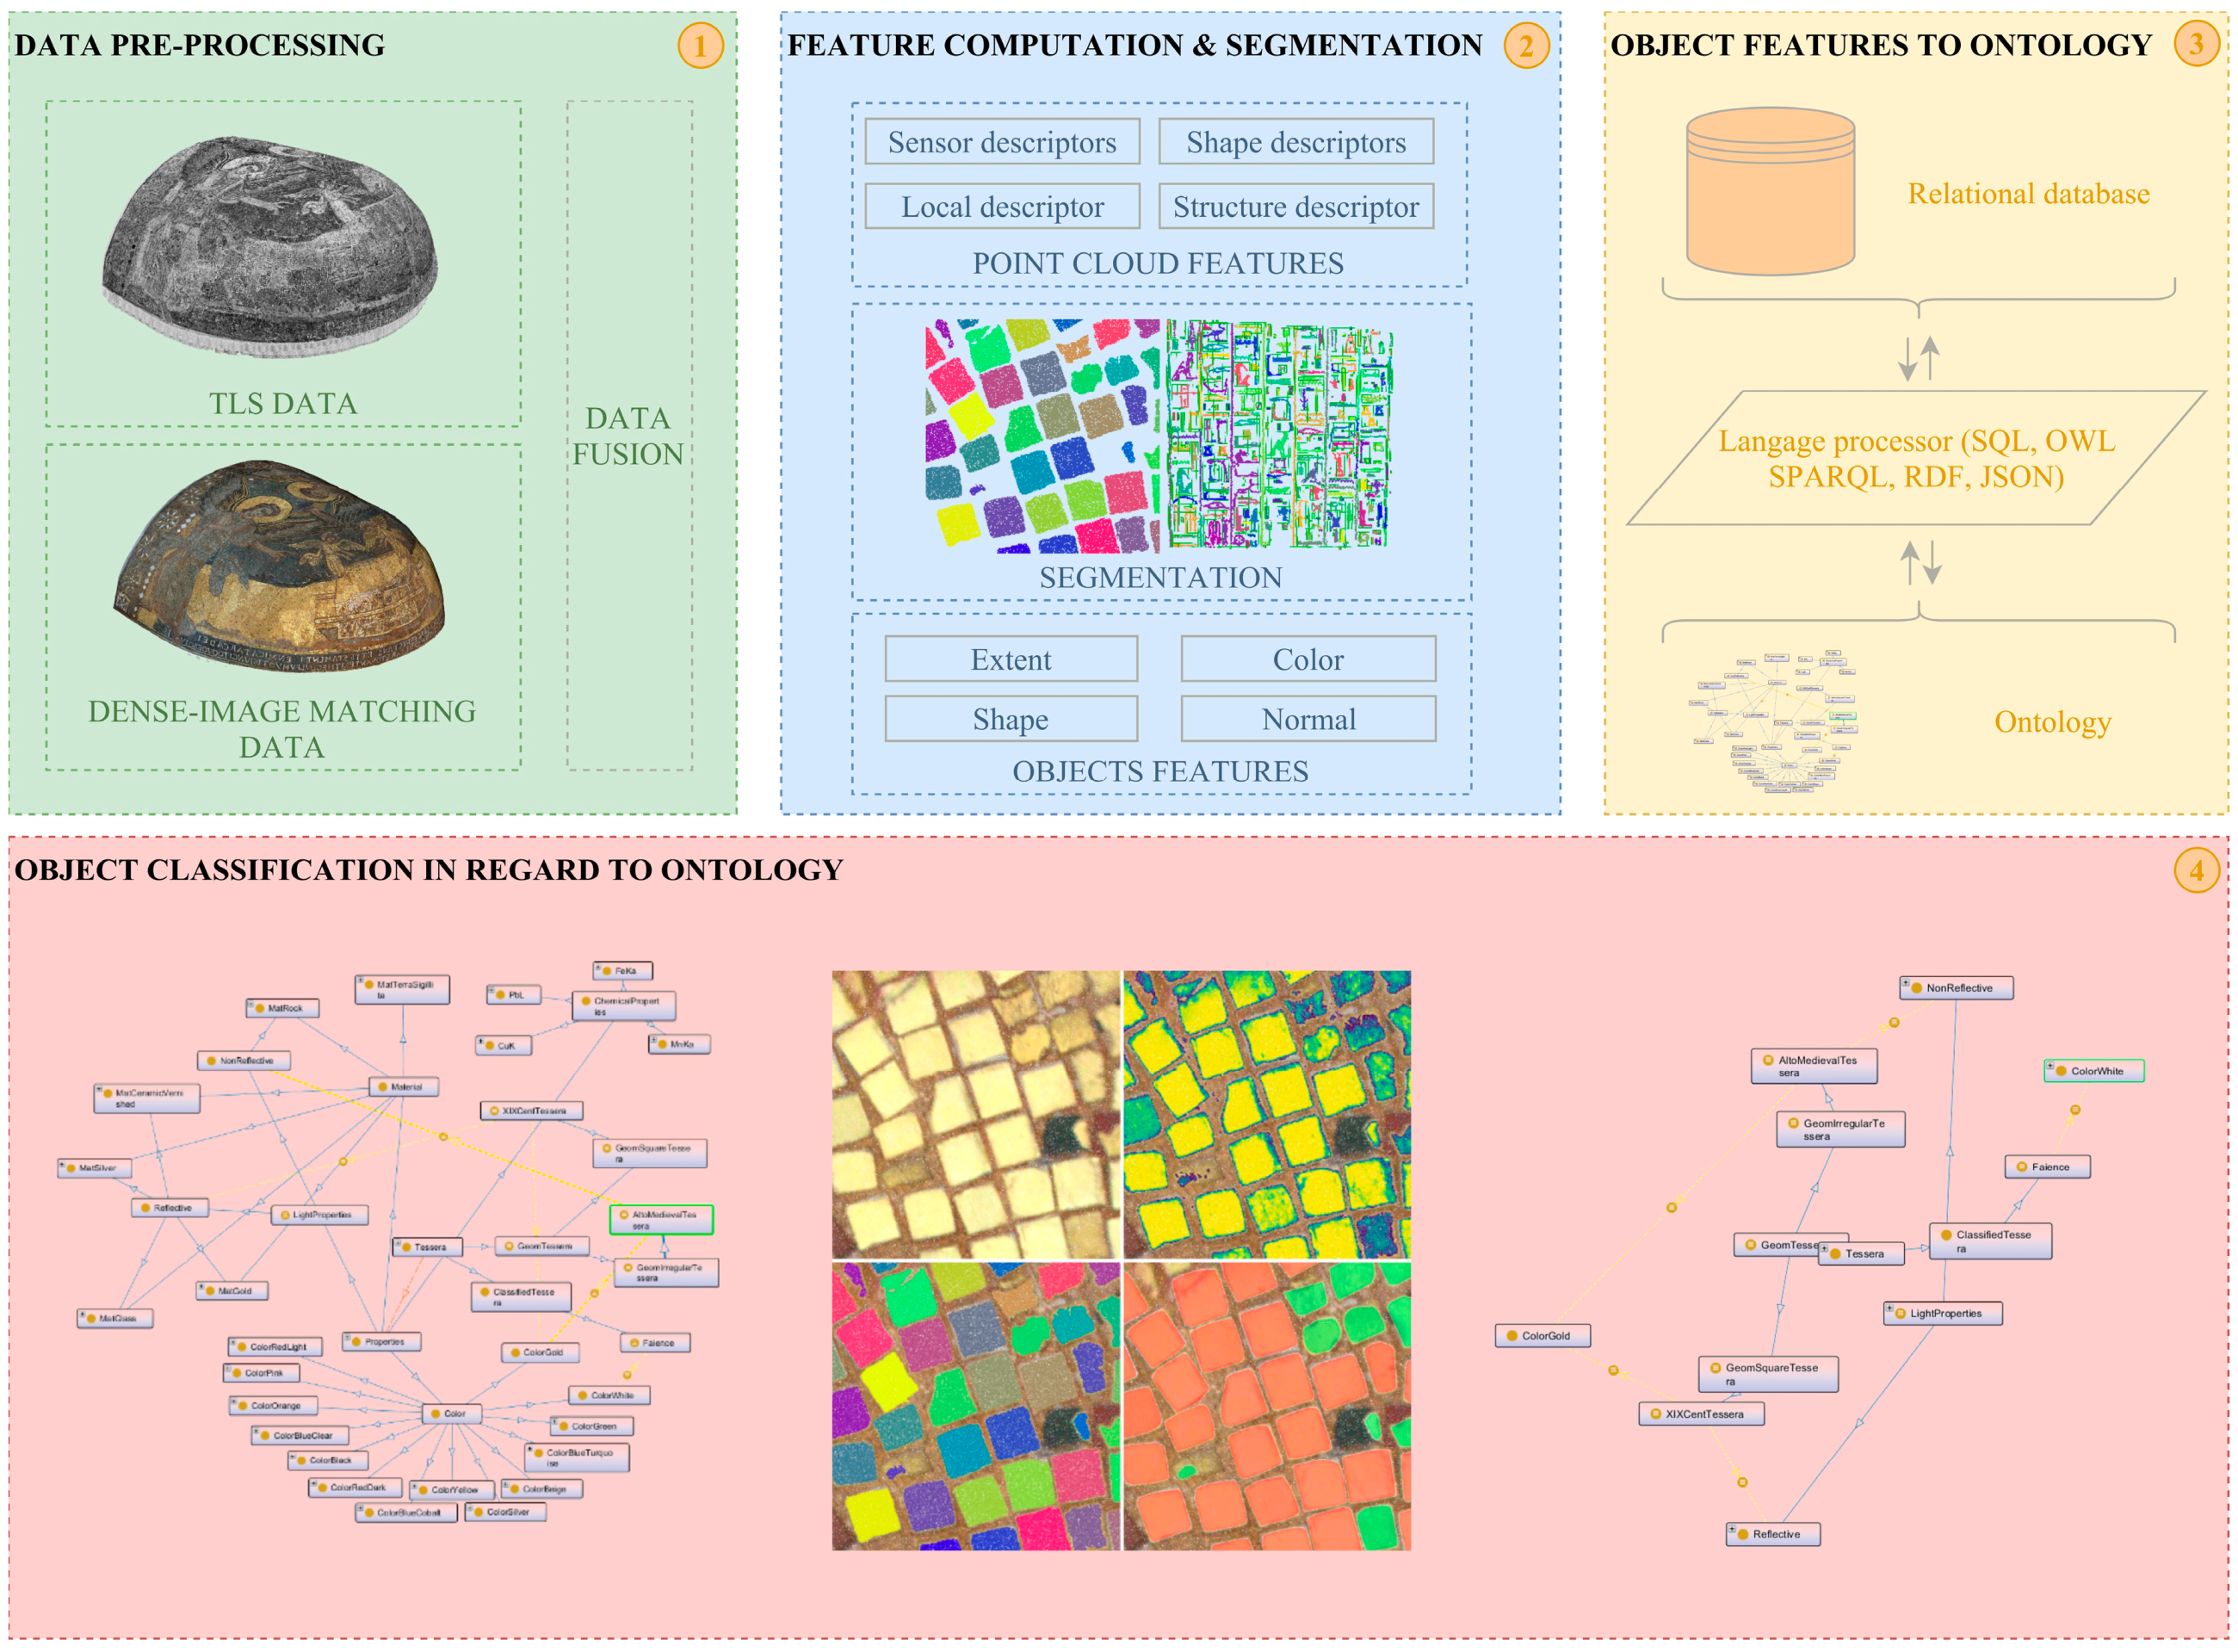
3.2. Knowledge-Based Detection and Classification

Our approach for object extraction relies on domain knowledge that relays through point cloud features. Segmentation [82] and feature extraction are well studied areas within point cloud processes. However, the integration of knowledge is still rare, with few example of hybrid pipelines [83,84]. Our proposed approach constitute a hybrid method inspired by previous work in shape recognition [85,86,87,88], region growing pipelines [80,89,90] and abstraction-based segmentation [91,92,93,94,95] relying on 3D connected component labelling and voxel-based segmentation. As such, different features presented in Table 1 constitute the base for segmentation.
The point cloud data processing was implemented using the programming interfaces and languages MATLAB, Python, SQL, SPARQL, OWL, Java as well as the C++ Library CCLib from CloudCompare [93] and the software Protégé [99].
First, the point cloud is segmented regarding available colour information by referring to the database table containing float RGB colour ranges for each material composing the dataset. Then, the gap is enhanced by superimposing intensity values over colour information (this allows us to refine and better access point filtering capabilities) as in Equation (1).
R e   =   R   ×   I ,   G e   =   G   ×   I ,   B e   =   B   ×   I
A statistical outlier filter based on the computation of the distribution of point to neighbour distances in the input dataset similarly to [100] is applied to obtain a clean point cloud. This step can be avoided if the colour range and the datasets are perfectly in line.
The segmentation developed is a multi-scale abstraction-based routine that decomposes the 3D space in voxels at different abstraction levels and by constructing an octree structure to speed up computations. The three-dimensional discrete topology (3DDT) proposed by [101] generates a voxel coverage by intersection with another representation model (parametric or boundary) of an object. This is possible by playing on the different configurations of voxel adjacencies. A voxel has 6 neighbour voxels by one face, 18 neighbour voxels by a face or an edge and 26 neighbours by a face, an edge or a vertex. Our approach is based on a 26-connectivity study that groups adjacent voxels if not empty (i.e., voxels containing points). It is conditioned by the analytical knowledge where the density information constrains the initial bounding-box containing the point cloud. An initial low-level voxel structure is then computed, retaining the number of points as attribute. Let v i     3 be a voxel. Let v i be its neighbour voxel. We define V CEL as the connected element (segment) as in Equation (2):
  v i R 3 ,     v j = n ( v i )   |   V CEL = [ v i ,   v j ] v j
where n ( v i ) is the neighbour voxel of and vi, V CEL is the group segment from a 26-connectivity adjacency study.
The topological grouping also permits us to clean the remaining noise N from difficult colour extraction regarding the equations Equations (3) and (4). Let p n   3 be the n-th point of V CEL . There exists P CEL as follows:
  p 1 ,   ,   p n 3 ,     P CEL   |   P CEL = { p 1 ,   ,   p n } 1
P CEL   =   N     S Number _ CEL < d ( P CEL ) × min ( S m )   &   S Size _ CEL   < min ( V m ) 2
1 where p is a point (x, y, z) in space, 2 where N is the remaining noise, SNumber_CEL is the number of points in P CEL , d ( P CEL )   is the point density of P CEL , min ( S m ) is the minimum of the surface of the material S m , SSize_CEL is the voxel volume occupancy of the CEL, min ( V m ) is the minimum of the volume of the material V m ; therefore, N is the group composed of fewer points than the knowledge-based assumption from the density achievable from the sensor, the minimum surface of the object and the minimum volume of the object.
Then, our multi-scale iterative 3D adjacency algorithm at different octree levels recursively segments under-segmented groups (detected by injecting analytical knowledge regarding minimum bounding-box size of processed material as in Equation (4)), refining the voxel-based subdivision until the number of generated voxels is inferior to the density-based calculation of estimated voxel number. When subgroups dimensions correspond to material’s available knowledge, segments are added to the “Independent Tesserae” segments. Otherwise, a convolution bank filter is applied regarding the longest side of the calculated best fit P.C.A Bounding Box. For absorbent materials or objects sensitive to the sensor emitting frequency (implies low intensity, thus high noise), the 3D distance map as in Table 1 is used to detect points that belong to each object of interest. The accuracy of the extracted segments is assessed by ground truth manual counting of different samples.
Then, on each detected segment, every point is projected on the RANSAC best fit plane, and we extract the 2D outline through the convex hull of the projected points p i to constrain the plane. Let P pCEL be the projected points of P CEL onto the best fit plane. Then, we obtain Conv ( P pCEL ) as in Equation (5):
Conv ( P pCEL ) = { i = 1 | P pCEL | α i × p i |     p i P pCEL ,     α i 0 )   : i = 1 | P pCEL | α i = 1 }
where Conv(PpCEL) is the convex polygon of P CEL as a finite point set (x, y) in R2 (x, y, z). It can be extended to 3D, nD if necessary.
We calculate the compactness (CS) and complexity (CP) of the generated polygon in regard to the work of [102], as well as its area, and its statistically generalized (gaussian mixture) colour (Table 2).
The final classification of the delineated objects is based on the available and constituted domain ontology of point cloud features for archaeology. The idea behind the ontology is that the integrated cultural information from a variety of sources is brought together into an integrated environment where we can ask broader questions than we can ask from individual pieces.
Ontologies can be expressed using different knowledge representation languages, such as the Simple Knowledge Organization System (SKOS), the Resource Description Framework (RDF), or the Web Ontology Language 2 (OWL2) specification. These languages contrast in terms of the supported articulateness. The SKOS specification, for instance, is widely used to develop thesauri, the CIDOC CRM is mainly used for describing heritage sites, the Basic Formal Ontology [103] at a higher conceptualization level to incorporates both 3D and 4D perspectives on reality within a single framework. The OWL2 ontology language is based on the Description Logics (DL) for the species of the language called OWL-DL. DL thus provides the formal theory on which statements in OWL are based and then statements can be tested by a reasoner. The OWL semantics comprise three main constructs: classes, properties and individuals. Individuals are extensions of classes, whereas properties define relationships between two classes (Object Properties), an individual and a data type (Data Properties).
We used the OWL and the RDF languages to define ontologies for their high flexibility and interoperability within our software environment (Protégé & Java). As for the study of mosaics, the ontology is set upon the point cloud data and its attributes, thus indirectly leveraging domain ontologies. Indeed, sensor related knowledge is needed to understand the link between features and their representativity. The following meta-model is formalised in UML and provides a conceptual definition for implementations. We therefore used the model to provide a clear vision and comprehension of the underlying system, but the ontology creation slightly differs from privilege performances; therefore, adaptations are made at the relation scheme modelling level.
The characterization (knowledge representation and data modelling) in Figure 5 is a Level-2 domain meta-model, that can plug to a Smart Point Cloud structure [104]. The general idea is that different hierarchical levels of abstraction are constituted to avoid overlapping with existing models and to enhance the flexibility and opening to all possible formalized structure. The core instruction is that the lower levels are closer to a domain representation than higher levels (level-0 being the higher level), but they impose their constraints. The overall structure is a pyramidal assembly, allowing the resolution of thematic problems at lower levels with reference to constraints formally imposed by the higher levels.
The ontology implementation was structured as triplets. Each triplet corresponds to a relation (subject, predicate and object), which expresses a concept. The end goal is to reason based on the constituted ontology to extract information about the tessera geometric regularity, its material and temporal classification (ClassifiedTessera) as in Figure 6.
The ontology is then populated with the domain knowledge as detailed in Figure 7, and the different predicates are established to obtain a final classification of the point cloud. Note that a tolerance of 20% regarding the definition of geometries was used to allow relative variations within one tesserae family. Analogously, any quasi-planar object may be substituted and described by the afore-mentioned properties, thus extending the provided ontology.
The different results allow to classify the point cloud, after determining the regularity of the 2D outline regarding different constraints (examples in Table 3).
The domain knowledge including size, geometry and spatial distribution leads to object classification. For enhancing its interoperability, the developed DSAE (Digital Survey-based Architectural Element) ontology can directly be extended using the well-established CIDOC-CRM formal ontology. Indeed, the CIDOC-CRM is purely descriptive, and does provide only “factual” tests (a node is linked to an arc, which is linked to another node). The provided DSAE ontology can reason based on complex declaration of conditions (such as AND, OR, ONLY, etc.), thus is much more structured than the CIDOC-CRM, and allows to reason. As such, it permits automatic classification that can be plugged to the CIDOC-CRM enabling archaeologists to better understand the underlying point cloud data. In the case of tesserae, each tessera material is then considered as a E57 Material specialization which comprises the concept of materials (Specialization of E55 Type), LightProperties and Color can be seen as S9 Property (it describes in a parametric way what kind of properties the values are) and Area, CP and CS as SP15 Geometry attributes (which comprises the union of geometric definitions and the linked declarative places) from the extension CIDOC-CRMgeo (based on the ontology GeoSPARQL), as in Figure 8.
Finally, semantic information is transferred to the point cloud that can be used for information extraction. Once extracted semantics have been successfully linked to the spatial information, we address structuring for interaction purposes. The data structuration is made in regard to [104]. The main idea is that the structure is decomposed in three meta-models acting at three different conceptual levels to efficiently manage massive point cloud data (and by extension any complex 3D data) while integrating semantics coherently. The Level-0 describes a meta-model to efficiently manage and organise pure point cloud spatial data information. The Level-1 is an interface between the level-0 and the level 2 (specific domain-based knowledge). As such, the data integration methodology relies on incorporating the point cloud data in the Smart Point Cloud data structure [104] in regard to the workflows described in Section 3. The structuration therefore follows the object decomposition, where points of each object are grouped together to form world objects (i.e., Independent Tesserae) once concepts and meaning have been linked. This constitutes the entry point of the ontology which acts as a Level-2 specialization to inject relevant knowledge. To facilitate the dissemination of information, query results from specific queries need to be visualized properly. For users to access and share a common viewpoint result of a semantic query, we enhanced the approach in [105] by applying over each object (i.e., tessera) one unique colour per instance for each class (e.g., faience pieces); all non-requested tesserae are coloured in black as in Figure 9.
For each class of object, we compute a bounding box and we locate its centre. The bounding box centre becomes the centre of the sphere on which the camera will move to determine the optimal camera position. The coordinates of the camera on the sphere are computed according to the following formulae [105]:
X = x center + r × cos ( ϕ ) × cos ( θ ) ,   Y = y center + r × sin ( ϕ ) ,   Z = z center + r × cos ( ϕ ) × sin ( θ ) 1
1 where X, Y and Z are the camera coordinates, xcenter, ycenter and zcenter are the coordinates of the centre of the sphere, r is the radius of the sphere, ϕ is the vertical angle, θ is the horizontal angle.
From each camera position, we compute the number of visible tesserae from the user request observed in the produced image. Since each instance of one sort of tesserae is coloured uniquely, the algorithm performs by counting the number of different pixels colours. Hence, the number of distinct colours in the image corresponds to the number of tesserae seen from this camera position. The camera position that maximises the view of requested tesserae corresponds to the optimal viewpoint. If two camera locations present the same number of observed tesserae, we apply a maximisation criterion regarding the pixels to determine the optimal camera position.

4. Results

We tested the method on different samples from different zones of the mosaic to identify the influence of the segmentation and the classification in different scenarios, as well as another point cloud from terrestrial laser scanner captured in Jehay (Belgium). To assess the quality of the segmentation, knowledge-based tessera ground truth was extracted from the point cloud and compared to the segmentation method extracts. Results (Table 4) show an average 95% segmentation accuracy for point cloud gold tesserae, 97% for faience tesserae, 94% for silver tesserae and 91% for coloured glass.
The tesserae recognition pipeline including segmentation, classification and information extraction was conducted over 3 different representative zones of the point cloud to be exhaustive and to be able to count manually each tessera for assessing the results. In the first zone containing 12,184,307 points, three types of tesserae were studied: 138 Gold tesserae from the 19th century renovation (NG), 239 ancient gold (AG) and 11 faience pieces (FT) (Figure 10). The automatic segmentation correctly recognized all FT (100% accuracy) and 331 golden tesserae (GT) (88% accuracy), remaining ones being 5% of under-segmentation (in groups of 2/3 tesserae), 7% of tesserae not detected. The classification correctly labelled respectively 100% FT, 98% NG, and 99% AG.
In the second zone containing 12,821,752 points, 313 gold tesserae (195 NG and 118 AG) and 269 silver tesserae (ST) were processed. In total, 284 (91%) golden tesserae were correctly segmented, of which 93% were correctly labelled NG and 95% AG, and 93% of ST were correctly segmented, of which 87% were correctly labelled. The third larger sample composed of 34,022,617 points includes 945 gold tesserae and 695 CG (coloured glass) tainted in black. The other tesserae in the sample had an insufficient resolution for ground truth generation. In total, 839 (89%) golden tesserae were correctly segmented, of which 86% were correctly labelled NG and 95% AG. Concerning CG, (494) 71% were correctly segmented, and 98% were correctly labelled. While classification results are very high, segmentation is heavily influenced by the quality of the data; hence, CG shows lower results because of its harsh sensor representation (tesserae are not easily discernible).
Globally, 59,028,676 points and 2610 tesserae were processed; 2208 (85%) were correctly detected and segmented, of which 2075 (94%) were correctly labelled (Table 5).
The full workflow was also conducted over a point cloud acquired using a TLS at a local scale to detect specific stones and openings of the façade of the castle of Jehay (Belgium). The point cloud comprises around 95 million points and has an uneven density due to the acquisition set-ups. The segmentation allowed us to correctly detect calcareous stones as in Table 6, as well as openings regarding the surface of reference (best fit plane through convolutional bank filter) and the full limestone bay frames.
The same reasoning engine was used based on the DSAE ontology. The DSAE-based classification first studied the material Limestone (related to the property colour, same as S9 from CIDOC-CRM) and the geometry regularity (related to SP15 attribute from geometry) in regard to CS, CP and Area (in the case of 3D objects, the area was extended to a volume feature by taking into account every spatial dimension.), then differentiated openings through dimension-based predicates (SP15 Geometry) as presented in Figure 11. The CIDOC-CRM and its extension CIDOC-CRMba [106] provide an added descriptive value for archaeologists that can be directly plugged as in Figure 11.
The detected segments are classified, with 85% accuracy for independent calcareous stones, and 100% for woodworking openings (differentiated by size and geometric regularities) and limestone bay frames. The results over the Renaissance façade recognition pipeline are illustrated in Figure 12. We notice the fine detection for each element and the irregularity for some stones due to the uneven quality of the point cloud colorization. Calcareous stones classification was largely impacted by the segmentation inaccuracy within certain zones that led to over-segmentation and thus incorrect labels due to shape irregularity. These influential factors are discussed in Section 5.
It is interesting to note that the DSAE ontology can be further used for distinguishing wide woodworking openings from smaller ones based on Area (or Volume) properties, and their geometric regularity. However, their label is considered weak for archaeological purposes, and extending the ontology as in Section 5 would provide a better automatic characterization for archaeological analysis.
The established data infrastructure gravitate around a client-server protocol that allows maximum flexibility and extensibility in regard to the 4 prerequisites of digital archaeology as defined in [5,6]. The platform can scale up to multiple simultaneous connexions and handles multi-source datasets. Every client that connects to the server as in Figure 13 benefits of functionalities from both the ontology reasoner and SQL statements (e.g., in Section 4). The implementation was made using PostgreSQL DBMS enhanced with plugins (PostGIS and pgPointCloud). The software Protégé alongside the programming toolkit JENA (Java) was also used to create and link ontologies.
As for the client-side, it was constructed to be as open and accessible as possible. As such, the World Wide Web is a democratized way to share and exchange information. It constitutes a long-term means to collaborate, and is independent of the location which is very important considering the need to be able on site to work with digital copies. Indeed, an application accessible anywhere and by multiple users at the same time is key for an archaeological 3D platform. Thus, we implemented the application in WebGL, a JavaScript API for rendering 3D graphics within any compatible web browser. We used Three.js, a cross-browser JavaScript library which uses the WebGL framework and enhances it. By a simple interaction with the GUI, the users can access and share a common viewpoint result of a semantic query. Figure 14 presents the optimal viewpoint for two classes of tesserae similarly to [12].
The complete workflow therefore us allows to (1) pre-process multi-sensory point cloud data, (2) compute features of interest, segment and classify the point cloud according to domain knowledge formalized in ontologies; (3) structure the data in a server-side SPC point cloud 3D GIS; (4) disseminate the information through a client-side app built upon WebGL with a specific visual processing engine to provide optimal viewpoints from queries.

5. Discussion

The democratization of TLS and dense-image matching in archaeological workflows makes them a preferred way to record spatial information. Point clouds are very interesting for their objectivity and flexibility in interpretation processes. If the acquisition is complete, they transcript every visual element that was observed on the field. However, other components that can arise to our other senses such as mechano-reception (touching, hearing) or chemo-reception (taste, smell) are not captured by these remote sensors. However, their integration and link to the point clouds can be important as they constitute another source for better comprehension of the observed subject. Sensors that can capture such information as objectively as possible would be another step toward a possible better acquisition automatization. Today, archaeologists rely mostly on field-work to extract necessary information from human senses, eventually with the use of other sensors to detect additional patterns (e.g., x-fluorescent characterization in Germigny-Des-Prés). Exploring combination of multisensory surveys with sensor-level data fusion provides a great opportunity for further research and to keep a record of a more complete context. Indeed, archaeological studies deal with more and more information including archaeological observations but also data coming from other sciences (e.g., geology, chemistry, physics, etc.) and all these must be organized and considered together for an optimal understanding of the site. To avoid loss of information, recording of the fact and interpretation must be integrated in the same process [18] and specific tools should be investigated.
Regarding spatial information, 3D point clouds constitute a very exhaustive source for further archaeological investigations. However, their lack of integration in workflows narrows the possibilities and interpretation work. We identified their main weakness to propose better handling and combinatory potential between different information sources: how to coherently aggregate semantics, spatial (and temporal information in a later stage). With respect to the number of observations (points), autonomous processing is very important. When dealing with thousands of archaeological objects of interest (composed of millions of points) in a scene (composed of billions of points), manually segmenting and classifying would be a very time consuming and an error prone process. In this paper, we presented an effective approach to automate tesserae recognition from terrestrial laser scanning data and dense image-matching. Knowledge-based feature constraints are defined to extract gold, silver, coloured glass and ceramic tesserae from a hybrid point cloud. Then convex hull polygons are fitted to different segment separately. Knowledge is introduced again to generate assumptions for problematic parts. Finally, all polygons, both directly fitted and assumed, are combined to classify and inject semantics into the point cloud. Tests on three datasets showed automated classification procedures and promising results (Figure 15).
The developed method tackles data quality challenges including heterogeneous density, surface roughness, curvature irregularities, and missing, erroneous data (due to reflective surfaces for example). We see that in zones where the colour quality is good and blur is low, classification results exceeds 95% accuracy. However, the method is very sensitive to 3D capture conditions and representativity such as colour, intensity, resolution and sharpness. Therefore, segmentation will fail when the input data does not allow correct feature extraction and abstraction-based connectivity estimation. More complete tesserae knowledge will help to better understand and detect complex shapes and patterns. While the classification results using domain knowledge are promising, the full point cloud labelling scheme could be enhanced by improving specifically the segmentation step. The data quality influences the final results. As illustrated, a challenge is brought about by varying densities and poor point-feature quality that can lead to over-segmentation when predominant features rely on point-proximity/density criterions. While this is not an issue for dense point clouds that describe continuous surfaces, it can constitute a hindrance for heterogeneous density or uneven datasets. Equally, colour/intensity that create imprecise colorization/featuring leads to rough classification. A solution would be to move the colour-based segmentation to the DSAE ontology to provide new discriminative possibilities. Also, the combination of dense image matching with laser data and 3D distance map improves the outline generation in a later stage, and allows a better shape estimation (Figure 16). Yet, an efficient registration is mandatory for accurate results. To improve the classification results, the segmentation can be enhanced using a watershed algorithm as well as obtaining higher representativity colour attribute for example. These are research directions that will be investigated. Also, to improve the robustness of the segmentation, a region-growing from a seed point located at every centroid of each detected connected element potentially provides a solution to under-segmentation, and investigations are necessary in this direction.
The constituted ontology provides a reasoning engine based on available information that can be further enhanced to integrate new triple stores. As such, an acquisition campaign using a portable X-ray Fluorescent device was carried out to quantify the relative quantity of chemical component within some tesserae. Integrating this semantic information could provide new reasoning capabilities such as detecting every gold tesserae that contain a quantity X of Plumb. The method will also be refined and extended to the full point cloud by implementing a machine learning framework using obtained labelled data as training data. First results are encouraging using supervised classification [107], and other approaches such as reinforcement learning will be investigated for they high reasoning potential and complementarity to ontologies. However, the computer memory-demand of point clouds may impose a link to 2D projective raster’s and to leverage existing training datasets (e.g., DeepNet).
The data structure relies on PostgreSQL RDBMS while indirectly integrating ontology reasoning results. It allows specific queries over the classified point cloud to extract spatial, semantic or a combination of both information. The blend of SPARQL and SQL allows us to combine efficiently the strength of both the relational database structuration and block-wise storage capabilities with the powerful reasoning proficiencies provided by ontologies. Different queries are therefore available, which are big leap forward regarding point cloud processing for archaeology (e.g., in Table 7).
However, while the temporal integration was inferred, only static intervals and fixed point in time were treated. Better integration such as continuous data or the storage and reasoning over datasets covering one location at different time intervals has yet to be further investigated. Indeed, new descriptors emerging from change detection could provide new insights and possibilities for cultural heritage conservation.
The proposed methodology (described in Section 3) was as general as possible to be extended to other use cases, at the object and local scales. It provides a potential solution for bringing intelligence to spatial data, specifically point clouds as seen in [104]. For example, we tested a point cloud from dense-image matching captured in Denmark (Ny-Calsberg Museum) and processed using Bentley ContextCapture (Figure 17). It constitutes an interesting object scale dataset where the interest lies in deciphering the hieroglyphs.
The methodology was applied, and each hieroglyph was successfully detected independently. As the spatial context is conserved, we can locate the relative position of each hieroglyph regarding the others, and using a lexicon or a structured ancient hieroglyph ontology, each sign could be detected by shape matching (e.g., RANSAC), and a reading order extracted as in [108]. Thus, the methodology is suitable to reason from information extraction, and possibilities are very encouraging. Deepening the classification through well-established ontologies such as CIDOC-CRMba as illustrated in Section 4 is possible, and the extension to other use cases requires us to identify specific specializations and the level of detail within the tree depth. If we consider the Renaissance façade of the castle of Jehay, the CIDOC-CRM ontology as well as the CIDOC-CRMba and the CIDOC-CRMgeo add flexibility for moving deduction capabilities from the analytic part to the ontology. This is very interesting as it maximizes the DSAE reasoning capabilities instead of determining analytically discriminative features (such as bounding-box “is contained in” relationship from coordinates). As an example, the classification of the façade can be related to the specialization levels from B1 to B5 of the CIDOC-CRMba, and directly plugged as in Figure 12. Then, specifically looking at full limestone bay frames (same as B5 Stratigraphic Building Unit), an element that is contained within a limestone bay frame is classified as an empty section regarding Figure 18. The topological relations are introduced with the use of the well-known GeoSPARQL ontology to allow the detection of openings based on a AP12 “contains” relationship.
Therefore, by integrating attributes such as Color and ProjectedArea of the different elements (as well as topological “is Within” test), the ontology can be used for reasoning. Based on general axioms, it semantically recognises building parts of a façade as in Table 8.
It is interesting to note that further reasoning is made possible due to extended knowledge over Renaissance-style mullioned windows. Indeed, double mullioned openings are a complex architectural element present over this façade. They are 2 mullioned openings where the separation by stones is inexistent. Each can be described regarding CIDOC CRMba as: 1 frame (B5) and 6 openings (B4 Empty morphological Building Section). Thus, an extended ontology can recognize double mullioned windows and a reason such as the one presented in [109] would provide extended automatization.
The final step for the visualization and presentation of the results is to share and distribute the information to other users and relies on virtual environments with specific interaction. The perception in 3D spaces is a dynamic phenomenon and concerns firstly behaviours and effects [110]. Data visualization is important to explore the data, to obtain some idea of what they contain, and therefore, to develop some intuitions about how to go about solving a problem from that data, determining what features are important and what kinds of data are involved. Visualization is also important when looking at the output of data science systems: data summarization for creating useful exploratory statistics, essential to understanding what was collected and observed. Although used before for tackling models and algorithms to avoid missing crucial information, data visualization is important for translating what might be interpretable only to a specialist for a general audience. In the context of point cloud, semantics and domain can highly influence the type of rendering used to directly transmit the correct information in a correct way to the end user. New ways of interacting with the data—Virtual reality, augmented reality, real time exploration and collaboration, holograms—are redefining possible interactions and exploration. Remondino, 2003 [111] list different surface representations that can be used to represent and use a point cloud, including parametric modelling, implicit and simplicial representation, approximated and interpolated surfaces. The time-consuming task of accurate 3D surface reconstruction from point cloud requires many steps of pre-processing, topology determination, triangular mesh generation, post-processing and assessing. For example, Hussain, 2009 [112] propose two simplification algorithms for LoD generation by decimating and simplifying meshes, thus reducing accuracy and quality. The development of an Internet browser-based solution allows maximum flexibility regarding theses identified problems, including data indexation vis-à-vis [113] to provide streaming capabilities independently of the size of the dataset.
Based on the algorithm developed by [105], we manage the 3D viewpoint so as to determine an optimal position and orientation of the camera for the visualisation of three kinds of tesserae distinguished by their material: faience, gold and silver. Through the previous steps of recognition and semantization described, we are now able to exploit the semantically rich point cloud data structure [11] to visualise efficiently the different sorts of tesserae. To achieve this, we performed a pre-processing step, totally transparent to users, in which we compute the optimal camera positions on a 3D COLLADA model of the mosaic which is constituted of the minimum convex hull of each tesserae information stored in the database. This technical implementation will be enhanced to enable more direct integration of the geometry generalizations from the database. The algorithm looks at the pixels of the computational display which avoids the under-object recognition phenomenon. It also allows us to directly work on the final rendering of the 3D model which already integrates the use of an algorithm to process hidden faces. Finally, it can be used on any kind of 3D data structure (vector, raster or point cloud). It is worth mentioning that additional viewpoints could be computed which depends on the initial query. For instance, we can calculate multiple optimal camera positions for one specific sort of tesserae, depending on a needed surface, distance to rotation center, density estimate, etc. The latest could be particularly interesting for the golden tesserae since they are quite scattered in space. Furthermore, we can also investigate the impact of the statistical parameter used when two viewpoints present the same number of objects (maximum, average, etc.).
To integrate the semantically rich point cloud and the viewpoint management of queried tesserae, we developed web software using jQuery, Three.js, Potree (an Open Source JavaScript library for point cloud rendering) and tween.js. The platform includes a tool to directly allow semantic extraction and visualisation of pertinent information for the end users. It enables efficient information relay between actors. The web application is accessible on any HTML5-compatible browser. It enables real time point cloud exploration of the mosaics in the Oratory of Germigny-des-Prés, and emphasises the ease of use as well as performances. However, the integration of a natural language processor would allow us to extend the possibilities for users to formulate queries that are translated into SQL and SPARQL analogues.

6. Conclusions

In this paper, we first reviewed the state of the art in digital archaeology. We pointed out gaps in the integration of spatial information with semantic components and the limited management of 3D point clouds within 3D GIS. The recording and processing of 3D multi-source complex data were addressed, as well as their management, conservation, visualization and presentation for different users. In this paper, we propose a new solution to integrate archaeological knowledge within point cloud processing workflows. Specifically, we decompose point clouds regarding available features and estimated geometric properties that generate ontologies to classify and reason based on information extraction. We developed a data-driven ontology for point cloud analysis to facilitate interoperability to other formal ontologies such as the CIDOC-CRM, and applied the workflow over different point clouds. Quasi-planar objects (doors, windows, tesserae, calcareous stones, hieroglyphs) were successfully detected, and an HTML-5 cross-platform web application was created to facilitate the knowledge dissemination such as ancient mosaic located in the oratory of Germigny-des-Prés. Then, we extracted the necessary requested information from the semantically rich point cloud data to efficiently visualise user’s request based on computed optimal camera positions and orientations that maximise the visibility of requested objects (e.g. tesserae). Then, the optimal viewpoints are dynamically rendered to users through the platform on which interactions can grow.

Supplementary Materials

The ontology is available online at: http://www.geo.ulg.ac.be/nyspoux/.

Acknowledgments

This project was financed by “prix de la fondation Comhaire”—lauréate L. Van Wersch, FRS-FRNS. The authors would like to thank the anonymous reviewers for their in-depth suggestions.

Author Contributions

Florent Poux conceived and designed the experiments, validated the algorithms and documented their formulas, acquired and processed the images and laserscan data, performed various analyses of the data and wrote most of the paper. Line Van Wersch introduced ceramic and glass knowledge for this study as well as archaeological insights. Gilles-Antoine Nys designed the specific ontologies and participated in their integration within the workflows. Romain Neuville designed the visual query engine. Roland Billen participated in ontological reasoning and interpretation of the results. All the authors participated in proof-reading and reviewing of the paper.

Conflicts of Interest

The authors declare no conflict of interest. The founding sponsors had no role in the design of the study; in the collection, analyses, or interpretation of data; in the writing of the manuscript, and in the decision to publish the results.

References

  1. Leute, U. Archaeometry: An Introduction to Physical Methods in Archaeology and the History of Art; VCH Verlagsgesellschaft mbH: Weinheim, Germany, 1987; ISBN 3527266313. [Google Scholar]
  2. Koller, D.; Frischer, B.; Humphreys, G. Research challenges for digital archives of 3D cultural heritage models. J. Comput. Cult. Herit. 2009, 2, 1–17. [Google Scholar] [CrossRef]
  3. Joukowsky, M. Field archaeology, tools and techniques of field work for archaeologists. In A complete Manual of Field Archaeology: Tools and Techniques of Field Work for Archaeologists; Prentice Hall: New York, NY, USA, 1980; ISBN 0-13-162164-5. [Google Scholar]
  4. Remondino, F. Heritage Recording and 3D Modeling with Photogrammetry and 3D Scanning. Remote Sens. 2011, 3, 1104–1138. [Google Scholar] [CrossRef] [Green Version]
  5. Tucci, G.; Bonora, V. GEOMATICS & RESTORATION—Conservation of Cultural Heritage in the Digital Era. In Proceedings of the ISPRS—International Archives of the Photogrammetry, Remote Sensing and Spatial Information Sciences, Florence, Italy, 22–24 May 2017; Volume XLII-5/W1, p. 1. [Google Scholar]
  6. Patias, P. Cultural heritage documentation. In Proceedings of the International Summer School “Digital recording and 3D Modeling”, Crete, Greece, 24–29 April 2006; pp. 24–29. [Google Scholar]
  7. Treisman, A.M.; Gelade, G. A Feature-Integration of Attention. Cogn. Psychol. 1980, 136, 97–136. [Google Scholar] [CrossRef]
  8. Smith, B.; Varzi, A. Fiat and bona fide boundaries. Philos. Phenomenol. Res. 2000, 60, 401–420. [Google Scholar] [CrossRef]
  9. Binding, C.; May, K.; Tudhope, D. Semantic interoperability in archaeological datasets: Data mapping and extraction via the CIDOC CRM. In Lecture Notes in Computer Science (Including Subseries Lecture Notes in Artificial Intelligence and Lecture Notes in Bioinformatics); Springer: Berlin/Heidelberg, Germany, 2008. [Google Scholar]
  10. Lüscher, P.; Weibel, R.; Burghardt, D. Integrating ontological modelling and Bayesian inference for pattern classification in topographic vector data. Comput. Environ. Urban Syst. 2009, 33, 363–374. [Google Scholar] [CrossRef] [Green Version]
  11. Poux, F.; Hallot, P.; Neuville, R.; Billen, R. Smart point cloud: Definition and remaining challenges. ISPRS Ann. Photogramm. Remote Sens. Spat. Inf. Sci. 2016, IV-2/W1, 119–127. [Google Scholar] [CrossRef]
  12. Poux, F.; Neuville, R.; Hallot, P.; Van Wersch, L.; Luczfalvy Jancsó, A.; Billen, R. Digital Investigations of an Archaeological Smart Point Cloud: A Real Time Web-Based Platform To Manage the Visualisation of Semantical Queries. Int. Arch. Photogramm. Remote Sens. Spat. Inf. Sci. 2017, XLII-5/W1, 581–588. [Google Scholar] [CrossRef]
  13. Pieraccini, M.; Guidi, G.; Atzeni, C. 3D digitizing of cultural heritage. J. Cult. Herit. 2001, 2, 63–70. [Google Scholar] [CrossRef]
  14. Remondino, F.; Rizzi, A. Reality-based 3D documentation of natural and cultural heritage sites—Techniques, problems, and examples. Appl. Geomat. 2010, 2, 85–100. [Google Scholar] [CrossRef]
  15. Hartmann-Virnich, A. Transcrire l’analyse fine du bâti: Un plaidoyer pour le relevé manuel dans l’archéologie monumentale. In La Pierre et sa Mise en Oeuvre Dans L’art Médiéval: Mélanges d’Histoire de L’art Offerts à Eliane Vergnolle; Gallet, Y., Ed.; Brepols Publishers: Turnhout, Belgium, 2011; pp. 191–202. [Google Scholar]
  16. Lambers, K.; Remondino, F. Optical 3D Measurement Techniques in Archaeology: Recent Developments and Applications. In Layers of Perception, Proceedings of the 35th International Conference on Computer Applications and Quantitative Methods in Archaeology (CAA), Berlin, Germany, 2–6 April 2007; Posluschny, A., Ed.; Habelt: Bonn, Germany, 2008; pp. 27–35. [Google Scholar]
  17. Boto-varela, G.; Hartmann-virnich, A.; Nussbaum, N.; Reveyron, N.; Boto-varela, P.D.D.G.; Hartmann-virnich, A.; Nussbaum, N. Archéologie du bâti: Du mètre au laser. Perspectives 2012, 2, 329–346. [Google Scholar]
  18. Forte, M.; Dell’Unto, N.; Di Giuseppantonio Di Franco, P.; Galeazzi, F.; Liuzza, C.; Pescarin, S. The virtual museum of the Western Han Dynasty: 3D documentation and interpretation. In Space, Time, Place, Third International Conference on Remote Sensing in Archaeology; Archaeopress: Oxford, UK, 2010; Volume 2118, pp. 195–199. [Google Scholar]
  19. Pavlidis, G.; Koutsoudis, A.; Arnaoutoglou, F.; Tsioukas, V.; Chamzas, C. Methods for 3D digitization of Cultural Heritage. J. Cult. Herit. 2007, 8, 93–98. [Google Scholar] [CrossRef]
  20. Chase, A.F.; Chase, D.Z.; Weishampel, J.F.; Drake, J.B.; Shrestha, R.L.; Slatton, K.C.; Awe, J.J.; Carter, W.E. Airborne LiDAR, archaeology, and the ancient Maya landscape at Caracol, Belize. J. Archaeol. Sci. 2011, 38, 387–398. [Google Scholar] [CrossRef]
  21. Chase, A.F.; Chase, D.Z.; Fisher, C.T.; Leisz, S.J.; Weishampel, J.F. Geospatial revolution and remote sensing LiDAR in Mesoamerican archaeology. Proc. Natl. Acad. Sci. USA 2012, 109, 12916–12921. [Google Scholar] [CrossRef] [PubMed]
  22. Evans, D.H.; Fletcher, R.J.; Pottier, C.; Chevance, J.-B.; Soutif, D.; Tan, B.S.; Im, S.; Ea, D.; Tin, T.; Kim, S.; et al. Uncovering archaeological landscapes at Angkor using lidar. Proc. Natl. Acad. Sci. USA 2013, 110, 12595–12600. [Google Scholar]
  23. Coluzzi, R.; Lanorte, A.; Lasaponara, R. On the LiDAR contribution for landscape archaeology and palaeoenvironmental studies: The case study of Bosco dell’Incoronata (Southern Italy). Adv. Geosci. 2010, 24, 125–132. [Google Scholar] [CrossRef]
  24. Reshetyuk, Y. Self-Calibration and Direct Georeferencing in Terrestrial Laser Scanning. Ph.D. Thesis, Royal Institute of Technology (KTH), Stockholm, Sweden, 2009. [Google Scholar]
  25. Lerma, J.L.; Navarro, S.; Cabrelles, M.; Villaverde, V. Terrestrial laser scanning and close range photogrammetry for 3D archaeological documentation: The Upper Palaeolithic Cave of Parpallo as a case study. J. Archaeol. Sci. 2010, 37, 499–507. [Google Scholar] [CrossRef]
  26. Armesto-González, J.; Riveiro-Rodríguez, B.; González-Aguilera, D.; Rivas-Brea, M.T. Terrestrial laser scanning intensity data applied to damage detection for historical buildings. J. Archaeol. Sci. 2010, 37, 3037–3047. [Google Scholar] [CrossRef]
  27. Entwistle, J.A.; McCaffrey, K.J.W.; Abrahams, P.W. Three-dimensional (3D) visualisation: The application of terrestrial laser scanning in the investigation of historical Scottish farming townships. J. Archaeol. Sci. 2009, 36, 860–866. [Google Scholar] [CrossRef]
  28. Grussenmeyer, P.; Landes, T.; Voegtle, T.; Ringle, K. Comparison methods of terrestrial laser scanning, photogrammetry and tacheometry data for recording of cultural heritage buildings. In Proceedings of the International Archives of the Photogrammetry, Remote Sensing and Spatial Information Sciences, Beijing, China, 15 October 2008; Volume XXXVI, pp. 213–218. [Google Scholar]
  29. Gonzalez-Aguilera, D.; Muñoz-Nieto, A.; Rodriguez-Gonzalvez, P.; Menéndez, M. New tools for rock art modelling: Automated sensor integration in Pindal Cave. J. Archaeol. Sci. 2011, 38, 120–128. [Google Scholar] [CrossRef]
  30. Barber, D.; Mills, J.; Smith-Voysey, S. Geometric validation of a ground-based mobile laser scanning system. J. Photogramm. Remote Sens. 2008, 63, 128–141. [Google Scholar] [CrossRef]
  31. James, M.R.; Quinton, J.N. Ultra-rapid topographic surveying for complex environments: The hand-held mobile laser scanner (HMLS). Earth Surf. Process. Landf. 2014, 39, 138–142. [Google Scholar] [CrossRef]
  32. Thomson, C.; Apostolopoulos, G.; Backes, D.; Boehm, J. Mobile Laser Scanning for Indoor Modelling. ISPRS Ann. Photogramm. Remote Sens. Spat. Inf. Sci. 2013, II-5/W2, 289–293. [Google Scholar]
  33. Lauterbach, H.; Borrmann, D.; Heß, R.; Eck, D.; Schilling, K.; Nüchter, A. Evaluation of a Backpack-Mounted 3D Mobile Scanning System. Remote Sens. 2015, 7, 13753–13781. [Google Scholar] [CrossRef]
  34. Sansoni, G.; Carocci, M.; Rodella, R. Calibration and performance evaluation of a 3-D imaging sensor based on the projection of structured light. IEEE Trans. Instrum. Meas. 2000, 49, 628–636. [Google Scholar] [CrossRef]
  35. Galindo Domínguez, R.E.; Bandy, W.L.; Mortera Gutiérrez, C.A.; Ortega Ramírez, J. Geophysical-Archaeological Survey in Lake Tequesquitengo, Morelos, Mexico. Geofísica Int. 2013, 52, 261–275. [Google Scholar] [CrossRef]
  36. Pix4D Terrestrial 3D Mapping Using Fisheye and Perspective Sensors—Support. Available online: https://support.pix4d.com/hc/en-us/articles/204220385-Scientific-White-Paper-Terrestrial-3D-Mapping-Using-Fisheye-and-Perspective-Sensors#gsc.tab=0 (accessed on 18 April 2016).
  37. Bentley 3D City Geographic Information System—A Major Step Towards Sustainable Infrastructure. Available online: https://www.bentley.com/en/products/product-line/reality-modeling-software/contextcapture (accessed on 26 September 2017).
  38. Wenzel, K.; Rothermel, M.; Haala, N.; Fritsch, D. SURE—The ifp Software for Dense Image Matching. In Photogrammetric Week 2013; Institute for Photogrammetry: Stuttgart, Germany, 2013; pp. 59–70. [Google Scholar]
  39. Agisoft Agisoft Photoscan. Available online: http://www.agisoft.com/pdf/photoscan_presentation.pdf (accessed on 26 September 2017).
  40. nFrames GmbH, nFrames. Available online: http://nframes.com/ (accessed on 26 September 2017).
  41. Capturing Reality, RealityCapture. Available online: https://www.capturingreality.com (accessed on 26 September 2017).
  42. Wu, C. VisualSFM. Available online: http://ccwu.me/vsfm/ (accessed on 26 September 2017).
  43. Moulon, P. openMVG. Available online: http://imagine.enpc.fr/~moulonp/openMVG/ (accessed on 26 September 2017).
  44. Autodesk, Autodesk: 123D Catch. Available online: http://www.123dapp.com/catch (accessed on 26 September 2017).
  45. EOS Systems Inc. Photomodeler. Available online: http://www.photomodeler.com/index.html (accessed on 26 September 2017).
  46. Profactor GmbH, ReconstructMe. Available online: http://reconstructme.net/ (accessed on 26 September 2017).
  47. Remondino, F.; Spera, M.G.; Nocerino, E.; Menna, F.; Nex, F. State of the art in high density image matching. Photogramm. Rec. 2014, 29, 144–166. [Google Scholar] [CrossRef]
  48. Haala, N. The Landscape of Dense Image Matching Algorithms. Available online: http://www.ifp.uni-stuttgart.de/publications/phowo13/240Haala-new.pdf (accessed on 26 September 2017).
  49. Koenderink, J.J.; van Doorn, A.J. Affine structure from motion. J. Opt. Soc. Am. A 1991, 8, 377. [Google Scholar] [CrossRef] [PubMed]
  50. Nex, F.; Remondino, F. UAV for 3D mapping applications: A review. Appl. Geomat. 2014, 6, 1–15. [Google Scholar] [CrossRef]
  51. Guarnieri, A.; Remondino, F.; Vettore, A. Digital photogrammetry and TLS data fusion applied to cultural heritage 3D modeling. In International Archives of Photogrammetry and Remote Sensing; Maas, H.-G., Schneider, D., Eds.; ISPRS: Dresden, Germany, 2006; Volume XXXVI. [Google Scholar]
  52. Nunez, M.A.; Buill, F.; Edo, M. 3D model of the Can Sadurni cave. J. Archaeol. Sci. 2013, 40, 4420–4428. [Google Scholar] [CrossRef]
  53. Novel, C.; Keriven, R.; Poux, F.; Graindorge, P. Comparing Aerial Photogrammetry and 3D Laser Scanning Methods for Creating 3D Models of Complex Objects. In Capturing Reality Forum; Bentley Systems: Salzburg, Austria, 2015; p. 15. [Google Scholar]
  54. Leberl, F.; Irschara, A.; Pock, T.; Meixner, P.; Gruber, M.; Scholz, S.; Wiechert, A. Point Clouds: Lidar versus 3D Vision. Photogramm. Eng. Remote Sens. 2010, 76, 1123–1134. [Google Scholar] [CrossRef]
  55. Al-kheder, S.; Al-shawabkeh, Y.; Haala, N. Developing a documentation system for desert palaces in Jordan using 3D laser scanning and digital photogrammetry. J. Archaeol. Sci. 2009, 36, 537–546. [Google Scholar] [CrossRef]
  56. Poux, F.; Neuville, R.; Hallot, P.; Billen, R. Point clouds as an efficient multiscale layered spatial representation. In Proceedings of the Eurographics Workshop on Urban Data Modelling and Visualisation, Liège, Belgium, 8 December 2016. [Google Scholar]
  57. Koch, M.; Kaehler, M. Combining 3D laser-Scanning and close-range Photogrammetry—An approach to Exploit the Strength of Both methods. In Proceedings of the Computer Applications to Archaeology, Williamsburg, VA, USA, 22–26 March 2009; pp. 1–7. [Google Scholar]
  58. Stanco, F.; Battiato, S.; Gallo, G. Digital Imaging for Cultural Heritage Preservation: Analysis, Restoration, and Reconstruction of Ancient Artworks; CRC Press: Boca Raton, FL, USA, 2011; ISBN 1439821739. [Google Scholar]
  59. Billen, R. Nouvelle Perception de la Spatialité des Objets et de Leurs Relations. Ph.D. Thesis, University of Liège, Liege, Belgium, 2002. [Google Scholar]
  60. Agapiou, A.; Lysandrou, V. Remote sensing archaeology: Tracking and mapping evolution in European scientific literature from 1999 to 2015. J. Archaeol. Sci. Rep. 2015, 4, 192–200. [Google Scholar] [CrossRef]
  61. Rollier-Hanselmann, J.; Petty, Z.; Mazuir, A.; Faucher, S.; Coulais, J.-F. Développement d’un SIG pour la ville médiévale de Cluny. Archeol. Calc. 2014, 5, 164–179. [Google Scholar]
  62. Katsianis, M.; Tsipidis, S.; Kotsakis, K.; Kousoulakou, A. A 3D digital workflow for archaeological intra-site research using GIS. J. Archaeol. Sci. 2008, 35, 655–667. [Google Scholar] [CrossRef]
  63. Apollonio, F.I.; Gaiani, M.; Benedetti, B. 3D reality-based artefact models for the management of archaeological sites using 3D Gis: A framework starting from the case study of the Pompeii Archaeological area. J. Archaeol. Sci. 2012, 39, 1271–1287. [Google Scholar] [CrossRef]
  64. Galeazzi, F.; Callieri, M.; Dellepiane, M.; Charno, M.; Richards, J.; Scopigno, R. Web-based visualization for 3D data in archaeology: The ADS 3D viewer. J. Archaeol. Sci. Rep. 2016, 9, 1–11. [Google Scholar] [CrossRef]
  65. Stefani, C.; Brunetaud, X.; Janvier-Badosa, S.; Beck, K.; De Luca, L.; Al-Mukhtar, M. Developing a toolkit for mapping and displaying stone alteration on a web-based documentation platform. J. Cult. Herit. 2014, 15, 1–9. [Google Scholar] [CrossRef]
  66. De Reu, J.; Plets, G.; Verhoeven, G.; De Smedt, P.; Bats, M.; Cherretté, B.; De Maeyer, W.; Deconynck, J.; Herremans, D.; Laloo, P.; et al. Towards a three-dimensional cost-effective registration of the archaeological heritage. J. Archaeol. Sci. 2013, 40, 1108–1121. [Google Scholar] [CrossRef]
  67. Scianna, A.; Gristina, S.; Paliaga, S. Experimental BIM applications in archaeology: A work-flow. In Lecture Notes in Computer Science (Including Subseries Lecture Notes in Artificial Intelligence and Lecture Notes in Bioinformatics); University of Illinois at Urbana-Champaign: Champaign, IL, USA, 2014; Volume 8740, pp. 490–498. ISBN 978-3-319-13695-0; 978-3-319-13694-3. [Google Scholar]
  68. Campanaro, D.M.; Landeschi, G.; Dell’Unto, N.; Leander Touati, A.M. 3D GIS for cultural heritage restoration: A “white box” workflow. J. Cult. Herit. 2016, 18, 321–332. [Google Scholar] [CrossRef]
  69. Soler, F.; Melero, F.J.; Luzon, M.V. A complete 3D information system for cultural heritage documentation. J. Cult. Herit. 2017, 23, 49–57. [Google Scholar] [CrossRef]
  70. Lieberwirth, U. 3D GIS Voxel-Based Model Building in Archaeology. In Proceedings of the 35th International Conference on Computer Applications and Quantitative Methods in Archaeology (CAA), Berlin, Germany, 2–6 April 2007; Volume 2, pp. 1–8. [Google Scholar]
  71. Orengo, H.A. Combining terrestrial stereophotogrammetry, DGPS and GIS-based 3D voxel modelling in the volumetric recording of archaeological features. J. Photogramm. Remote Sens. 2013, 76, 49–55. [Google Scholar] [CrossRef]
  72. Clementini, E.; Di Felice, P. Approximate topological relations. Int. J. Approx. Reason. 1997, 16, 173–204. [Google Scholar] [CrossRef]
  73. Moscati, A.; Lombardo, J.; Losciale, L.V.; De Luca, L. Visual browsing of semantic descriptions of heritage buildings morphology. In Proceedings of the Digital Media and its Applications in Cultural Heritage (DMACH) 2011, Amman, Jordan, 16 March 2011; pp. 1–16. [Google Scholar]
  74. Janowicz, K. Observation-Driven Geo-Ontology Engineering. Trans. GIS 2012, 16, 351–374. [Google Scholar] [CrossRef]
  75. Novak, M. Intelligent Environments: Spatial Aspects of the Information Revolution; Droege, P., Ed.; Elsevier: Amsterdam, The Nederland, 1997; ISBN 0080534848. [Google Scholar]
  76. Klein, L.A. Sensor and Data Fusion: A Tool for Information Assessment and Decision Making; SPIE Press: Bellingham, WA, USA, 2004; ISBN 0819454354. [Google Scholar]
  77. Petrie, G. Systematic oblique ae using multiple digitarial photography i frame cameras. Photogramm. Eng. Remote Sens. 2009, 75, 102–107. [Google Scholar]
  78. Otepka, J.; Ghuffar, S.; Waldhauser, C.; Hochreiter, R.; Pfeifer, N. Georeferenced Point Clouds: A Survey of Features and Point Cloud Management. Int. J. Geoinf. 2013, 2, 1038–1065. [Google Scholar] [CrossRef] [Green Version]
  79. Van Wersch, L.; Kronz, A.; Simon, K.; Hocquet, F.-P.; Strivay, D. Matériaux des Mosaïques de Germigny-Des-Prés. Germigny-des-prés. Available online: http://pointcloudproject.com/wp-content/uploads/2017/01/Unknown-Van-Wersch-et-al.-Mat%C3%A9riaux-des-mosa%C3%AFques-de-Germigny-des-Pr%C3%A9s.pdf (accessed on 26 September 2017).
  80. Dimitrov, A.; Golparvar-Fard, M. Segmentation of building point cloud models including detailed architectural/structural features and MEP systems. Autom. Constr. 2015, 51, 32–45. [Google Scholar] [CrossRef]
  81. Poux, F.; Neuville, R.; Billen, R. Point cloud classification of tesserae from terrestrial laser data combined with dense image matching for archaeological information extraction. ISPRS Ann. Photogramm. Remote Sens. Spat. Inf. Sci. 2017, IV-2/W2, 203–211. [Google Scholar] [CrossRef]
  82. Weinmann, M.; Jutzi, B.; Hinz, S.; Mallet, C. Semantic point cloud interpretation based on optimal neighborhoods, relevant features and efficient classifiers. J. Photogramm. Remote Sens. 2015, 105, 286–304. [Google Scholar] [CrossRef]
  83. Pu, S.; Vosselman, G. Knowledge based reconstruction of building models from terrestrial laser scanning data. J. Photogramm. Remote Sens. 2009, 64, 575–584. [Google Scholar] [CrossRef]
  84. Ben Hmida, H.; Boochs, F.; Cruz, C.; Nicolle, C. Knowledge Base Approach for 3D Objects Detection in Point Clouds Using 3D Processing and Specialists Knowledge. Int. J. Adv. Intell. Syst. 2012, 5, 1–14. [Google Scholar]
  85. Schnabel, R.; Wahl, R.; Klein, R. Efficient RANSAC for Point Cloud Shape Detection. Comput. Graph. Forum 2007, 26, 214–226. [Google Scholar] [CrossRef]
  86. Lin, H.; Gao, J.; Zhou, Y.; Lu, G.; Ye, M.; Zhang, C.; Liu, L.; Yang, R. Semantic decomposition and reconstruction of residential scenes from LiDAR data. ACM Trans. Graph. 2013, 32, 1. [Google Scholar] [CrossRef]
  87. Ochmann, S.; Vock, R.; Wessel, R.; Klein, R. Automatic reconstruction of parametric building models from indoor point clouds. Comput. Graph. 2016, 54, 94–103. [Google Scholar] [CrossRef]
  88. Chaperon, T.; Goulette, F. Extracting cylinders in full 3D data using a random sampling method and the Gaussian image. In Computer Vision and Image Understanding; Academic Press: San Diego, CA, USA, 2001; pp. 35–42. [Google Scholar]
  89. Nurunnabi, A.; Belton, D.; West, G. Robust Segmentation in Laser Scanning 3D Point Cloud Data. In Proceedings of the 2012 International Conference on Digital Image Computing Techniques and Applications, Fremantle, Australia, 3–5 December 2012; IEEE: Fremantle, WA, USA, 2012; pp. 1–8. [Google Scholar]
  90. Rusu, R.B.; Blodow, N. Close-range scene segmentation and reconstruction of 3D point cloud maps for mobile manipulation in domestic environments. In Proceedings of the IEEE/RSJ International Conference on Intelligent Robots and Systems (IROS 2009), St. Louis, MO, USA, 10–15 October 2009. [Google Scholar]
  91. Samet, H.; Tamminen, M. Efficient component labeling of images of arbitrary dimension represented by linear bintrees. IEEE Trans. Pattern Anal. Mach. Intell. 1988, 10, 579–586. [Google Scholar] [CrossRef]
  92. Girardeau-Montaut, D.; Roux, M.; Thibault, G. Change Detection on points cloud data acquired with a ground laser scanner. In ISPRS Workshop Laser Scanning; ISPRS: Enschede, The Netherlands, 2005. [Google Scholar]
  93. Girardeau-Montaut, D. Détection de Changement sur des Données Géométriques Tridimensionnelles; Télécom ParisTech: Paris, France, 2006. [Google Scholar]
  94. Douillard, B.; Underwood, J. On the segmentation of 3D LIDAR point clouds. In Proceedings of the 2011 IEEE International Conference on Robotics and Automation (ICRA), Shanghai, China, 9–13 May 2011; pp. 2798–2805. [Google Scholar]
  95. Aijazi, A.; Checchin, P.; Trassoudaine, L. Segmentation Based Classification of 3D Urban Point Clouds: A Super-Voxel Based Approach with Evaluation. Remote Sens. 2013, 5, 1624–1650. [Google Scholar] [CrossRef]
  96. Sapkota, P. Segmentation of Coloured Point Cloud Data; International Institute for Geo-Information Science and Earth Observation: Enschede, The Netherlands, 2008. [Google Scholar]
  97. Fischler, M.A.; Bolles, R.C. Random sample consensus: A paradigm for model fitting with applications to image analysis and automated cartography. Commun. ACM 1981, 24, 381–395. [Google Scholar] [CrossRef]
  98. Poux, F.; Hallot, P.; Jonlet, B.; Carre, C.; Billen, R. Segmentation semi-automatique pour le traitement de données 3D denses: Application au patrimoine architectural. XYZ Rev. L’Assoc. Fr. Topogr. 2014, 141, 69–75. [Google Scholar]
  99. Knublauch, H.; Fergerson, R.W.; Noy, N.F.; Musen, M.A. The Protégé OWL Plugin: An Open Development Environment for Semantic Web Applications. Proceeings of the 3rd International Semantic Web Conference (ISWC2004), Hiroshima, Japan, 7–11 November 2004; pp. 229–243. [Google Scholar]
  100. Point Cloud Library (PCL). Statistical Outlier Fliter. Available online: http://pointclouds.org/documentation/tutorials/statistical_outlier.php (accessed on 26 September 2017).
  101. Kaufman, A.; Yagel, R.; Cohen, D. Modeling in Volume Graphics. In Modeling in Computer Graphics; Springer: Berlin/Heidelberg, Germany, 1993; pp. 441–454. [Google Scholar]
  102. Brinkhoff, T.; Kriegel, H.; Schneider, R.; Braun, A. Measuring the Complexity of Polygonal Objects. In Proceedings of the 3rd ACM International Workshop on Advances in Geographic Information Systems, Baltimore, MD, USA, 1–2 December 1995; p. 109. [Google Scholar]
  103. Arp, R.; Smith, B.; Spear, A.D. Building Ontologies with Basic Formal Ontology; The MIT Press: Cambridge, MA, USA, 2015; ISBN 9788578110796. [Google Scholar]
  104. Poux, F.; Neuville, R.; Hallot, P.; Billen, R. Model for reasoning from semantically rich point cloud data. ISPRS Ann. Photogramm. Remote Sens. Spat. Inf. Sci. 2017, in press. [Google Scholar]
  105. Neuville, R.; Poux, F.; Hallot, P.; Billen, R. Towards a normalized 3D geovizualisation: The viewpoint management. ISPRS Ann. Photogramm. Remote Sens. Spat. Inf. Sci. 2016, IV-2/W1, 179–186. [Google Scholar] [CrossRef]
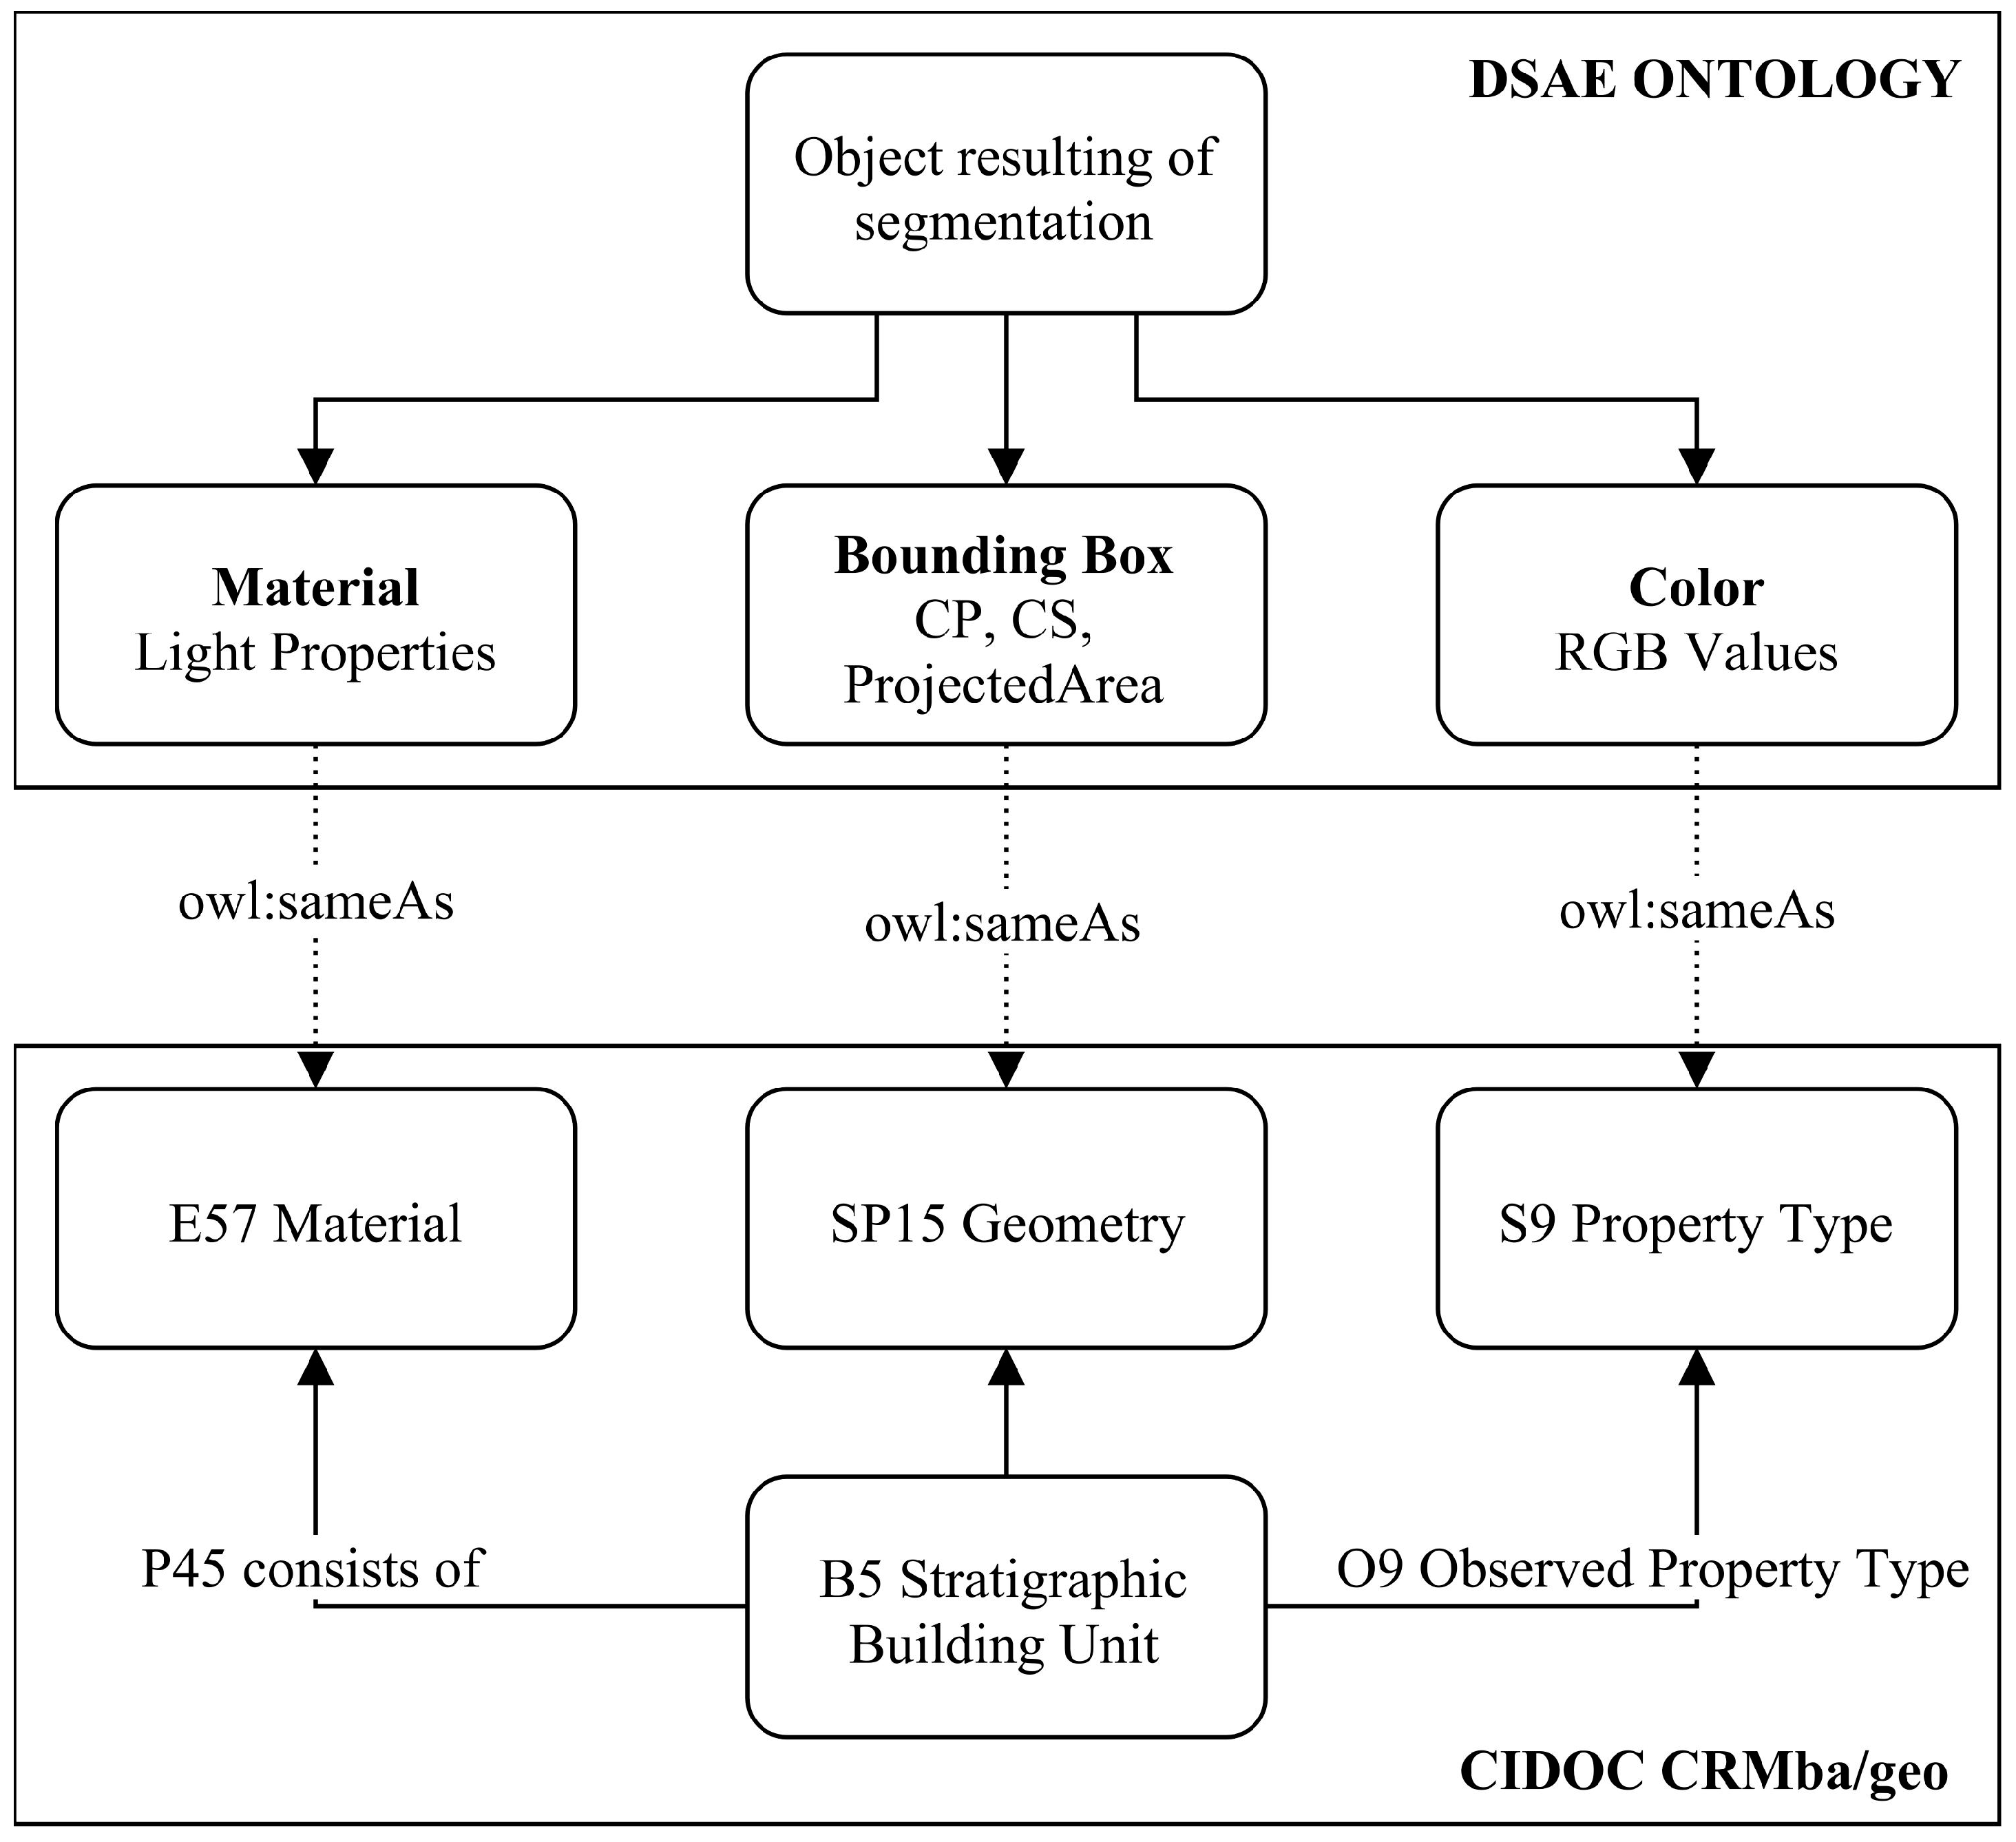
  106. Ronzino, P.; Niccolucci, F.; Felicetti, A.; Doerr, M. CRMba a CRM extension for the documentation of standing buildings. Int. J. Digit. Libr. 2016, 17, 71–78. [Google Scholar] [CrossRef]
  107. Garstka, J.; Peters, G. Learning Strategies to Select Point Cloud Descriptors for 3D Object Classification: A Proposal. In Eurographics 2014; Paulin, M., Dachsbacher, C., Eds.; The Eurographics Association: Strasbourg, France, 2014. [Google Scholar]
  108. Franken, M.; van Gemert, J.C. Automatic Egyptian hieroglyph recognition by retrieving images as texts. In Proceedings of the 21st ACM International Conference on Multimedia—MM ’13, Barcelona, Spain, 21–25 October 2013; ACM Press: New York, NY, USA, 2013; pp. 765–768. [Google Scholar]
  109. Hmida, H.B.; Cruz, C.; Boochs, F.; Nicolle, C. From 9-IM topological operators to qualitative spatial relations using 3D selective Nef complexes and logic rules for bodies. In Proceedings of the International Conference on Knowledge Engineering and Ontology Development (KEOD 2012), Barcelona, Spain, 4–7 October 2012; SciTePress: Setubal, Portugal, 2012; pp. 208–213. [Google Scholar]
  110. Forte, M. Cyber-archaeology: An eco-approach to the virtual reconstruction of the past. In International Symposium on “Information and Communication Technologies in Cultural Heritage”; Earthlab: Ioannina, Greece, 2008; pp. 91–106. [Google Scholar]
  111. Remondino, F. From point cloud to surface. In Proceedings of the International Workshop on Visualization and Animation of Reality-based 3D Models, Tarasp-Vulpera, Switzerland, 24–28 February 2003; Volume XXXIV. [Google Scholar]
  112. Hussain, M. Efficient simplification methods for generating high quality LODs of 3D meshes. J. Comput. Sci. Technol. 2009, 24, 604–608. [Google Scholar] [CrossRef]
  113. Scheiblauer, C.; Wimmer, M. Out-of-core selection and editing of huge point clouds. Comput. Graph. 2011, 35, 342–351. [Google Scholar] [CrossRef]
Figure 1. Overview of the methodology developed in this paper. (1) Data pre-processing; (2) Feature computation and segmentation; (3) Object features to ontology; (4) Object classification in regard to ontology.
Geosciences 07 00096 g001
Figure 2. The vault of Germigny-des-prés being captured for dense-image matching processing.
Geosciences 07 00096 g002
Figure 3. Point cloud of the church of Germigny-des-Prés. Top View (left) and zone of interest (right).
Geosciences 07 00096 g003
Figure 4. Point cloud from a set of 2D poses reconstructed via dense-image matching using the software ContextCapture v 4.4.6, Bentley Systems, Exton, United States [37].
Geosciences 07 00096 g004
Figure 5. UML meta-model of the ontology. Tesserae have one or multiple geometries, which are characterized by their regularity (determined by the ontological reasoning framework), and an area. Tesserae also have a temporality (characterized as a time interval, being placed at early Middle Ages or during a restoration at the 19th century) and different materials. These materials retain various properties including light sensitivity.
Geosciences 07 00096 g005
Figure 6. Sub-ontology for the classification of point cloud tessera objects. Blue arrows represent links regarding the tree structure (these are “subClassOf”). The oranges links represent the “hasProperty” relationship that we created to describe the relationship between a Tessera and its properties. It is a simple relationship from domain (Tessera) to Range (Properties).
Geosciences 07 00096 g006
Figure 7. Detailed ontology for the classification of the mosaic's point cloud. The yellow lines are the links of sub-assumptions, of reasoning. They are in fact links of equivalence between a class and its definition.
Geosciences 07 00096 g007
Figure 8. Connectivity relationship between the CIDOC-CRM and the DSAE ontology to extend interoperability and allow descriptive knowledge for archaeologist to be included.
Geosciences 07 00096 g008
Figure 9. Unique colourisation of a group of golden tesserae (bottom-up view).
Geosciences 07 00096 g009
Figure 10. Zone 1: Classification workflow of tesserae in Zone 1. From left to right: Colour point cloud; abstraction-based segmented point cloud; classified point cloud; 2D geometry over point cloud.
Geosciences 07 00096 g010
Figure 11. DSAE ontology and plugged CIDOC-CRM + CIDOC-CRMba for the detection of objects of interest: calcareous stones, openings and limestone bay frames.
Geosciences 07 00096 g011
Figure 12. Ontology-based classification of the South-South-West façade of the castle of Jehay. From left to right: the façade studied; the result of the segmentation (stones only); the result of the full segmentation; the result of the classification for quasi-planar objects of interest.
Geosciences 07 00096 g012
Figure 13. Server-side data management system. Point clouds go through different processing steps regarding Section 3, and point groups based on the definition of objects regarding domain knowledge are constituted and populate the SPC database.
Geosciences 07 00096 g013
Figure 14. Query result in the WebGL prototype of the optimal viewpoint for faience pieces and gold tesserae in an extracted zone through SQL query.
Geosciences 07 00096 g014
Figure 15. Classification results over the different zones of the mosaics.
Geosciences 07 00096 g015
Figure 16. Classification and semantization of dark coloured glass.
Geosciences 07 00096 g016
Figure 17. 3D point cloud of the statue of the Egyptian priest Ahmose and his mother, Baket-re. Diorite. C.1490–1400 BC. 18th Dynasty. New Empire. Ny Carlsberg Glyptotek Museum. Copenhagen. Denmark. From left to right: 3D point cloud; feature extraction and segmentation; 3D visualization.
Geosciences 07 00096 g017
Figure 18. CIDOC-CRM ontology for the detection of objects of interest: calcareous stones and openings. Considering the castle of Jehay (B1), it has a building section (BP1) being the studied façade (B2), composed of different elements such as calcareous stones (B3), embrasures (B3) and openings (B4).
Geosciences 07 00096 g018
Table 1. Point features computed from the point cloud data after data fusion, before segmentation.
TypePoint FeaturesRangeExplanation
Sensor desc.X, Y, ZBounding-boxLimits the study of points to the zone of interest
R, G, B 1Material ColourLimited to the colour range that domain knowledge specifies
I Clear noise and weight low intensity values for signal representativity
Shape desc.RANSAC 2-Used to provide estimator of planarity
Local desc.Nx, Ny, Nz 3[−1, 1]Normalized normal to provide insight on point and object orientation
Density 4-Used to provide insights on noise level and point grouping into one object
Curvature[0, 1]Used to provide insight for edge extraction and break lines
KB 5 Distance map Amplitude of the spatial error between the raw measurements and the final dataset
Structure desc. 6Voxels-Used to infer initial spatial connectivity
1 [96]; 2 [97]; 3 [98]; 4 [98]; 5 Knowledge-based; 6 [11].
Table 2. Segment features computed from the extracted segments.
TypePoint FeaturesRangeExplanation
Sensor generalizationXb, Yb, ZbbarycentreCoordinates of the barycentre
Rg, Gg, Bg 1-Material unique colour from statistical generalization
I-Intensity unique value from statistical generalization
Shape desc.CV 2-Convex Hull, used to provide a 2D shape generalization of the underlying points
Area-Area of the 2D shape, used as a reference for knowledge-based comparison
CS, CP[0, 1]Used to provide insight on the regularity of the shape envelope
Local generalizationNx, Ny, Nz 3[−1, 1]Normalized normal of the 2D shape to provide insight on the object orientation
1 [96]; 2 Convex-hull; 3 [98].
Table 3. Example of tessera classification using RDF constraints.
RDF Triple StoreEffect
((CS some xsd:double[> “1.1”^^xsd:double]) or (CS some xsd:double[< “1.05”^^xsd:double]))
and (CP some xsd:double[> “4.0E-4”^^xsd:double])*
Tessera is irregular (1)
(CP some xsd:double[<= “4.0E-4”^^xsd:double])
and (CS some xsd:double[>= “1.05”^^xsd:double, <= “1.1”^^xsd:double])
Tessera is square
(1) and (hasProperty some ColorGold)
and (hasProperty some NonReflective)
and (Area some xsd:double[<= “1.2”^^xsd:double])
Tessera is alto-medieval
(hasProperty some ColorWhite)
and (Area some xsd:double[>= “16.0”^^xsd:double, <= “24.0”^^xsd:double])
Material is Faience
Table 4. Segmentation accuracy of tesserae samples.
TesseraeSegmentation
Number of Points
Accuracy
Ground truthTesserae C.
Gold
Sample NO. 110,8911080199%
Sample NO. 210,12311,04891%
Sample NO. 310,27210,64896%
Sample NO. 411,77812,44094%
Faience
Sample NO. 127,20428,57095%
Sample NO. 223,26422,97899%
Sample NO. 323,85124,44098%
Sample NO. 422,23822,98597%
Silver
Sample NO. 11364137399%
Sample NO. 287693194%
Sample NO. 33783331288%
Sample NO. 41137109897%
C. Glass
Sample NO. 11139128387%
Sample NO. 2936102990%
Sample NO. 382173690%
Sample NO. 459862595%
Table 5. Recapitulation of tesserae detection results.
IDTesseraeSegmentationClassificationRes.
TypeNbNb%Nb%Nb
1Geosciences 07 00096 i001NG13833188%13198%7
Geosciences 07 00096 i002AG23919699%43
Geosciences 07 00096 i003FT1111100%11100%0
2Geosciences 07 00096 i004NG15528491%12893%27
Geosciences 07 00096 i005AG15813995%19
Geosciences 07 00096 i006ST26924993%21687%53
3Geosciences 07 00096 i007NG39683989%29786%99
Geosciences 07 00096 i008AG54947195%78
Geosciences 07 00096 i009CG69549471%48698%209
Total2610220885%207594%535
Table 6. Segmentation accuracy of the façade of the castle of Jehay over calcareous stones.
ElementsSegmentation
In Number of Points
Accuracy
Ground truthMethod
Calcareous Stones
Sample NO. 137,05735,66896%
Sample NO. 230,61027,10088%
Sample NO. 334,08732,20099%
Sample NO. 435,19730,45986%
Table 7. Example of queries over the point cloud.
LanguageRDF Triple StoreEffect
SPARQL  PREFIX rdf:<http://www.w3.org/1999/02/22-rdf-syntax-ns#>
  PREFIX npt: <http://www.geo.ulg.ac.be/nyspoux/>
      SELECT ?ind
    WHERE {
    ?ind rdf:type npt:AltoMedievalTessera
} ORDER BY ?ind
Return all alto-medieval tesserae (regarding initial data input)
SQLSELECT name, area FROM worldObject WHERE ST_3DIntersects(geomWo::geometry, polygonZ::geometry);Return all tesserae which are comprised in the region defined by a selection polygon and gives their area
SPARQL & SQL  SELECT geomWo FROM worldObject WHERE ST_3DIntersects(geomWo::geometry, polygon2Z::geometry) AND area > 0,0001;
  PREFIX rdf: <http://www.w3.org/1999/02/22-rdf-syntax-ns#>
  PREFIX npt: <http://www.geo.ulg.ac.be/nyspoux/>
  SELECT ?ind
   WHERE {
   ?ind rdf:type npt: XIXCentTessera
        } ORDER BY ?ind
Return all renovated tesserae in the region 2 where the area is superior to 1 cm²
Table 8. Classification of elements based on numerical attributes and topological relations.
LanguageEquivalent To DefinitionEffect
OWL (Protégé)(hasProperty some ColorLimestone)
   and (hasProperty some NonReflective)
   and (CP some xsd:double[<= “4.0E-4“^^xsd:double])
   and (CS some xsd:double[>= “1.05”^^xsd:double, <= “9.0”^^xsd:double])
   and (ProjectedArea some xsd:double[>= “0.05”^^xsd:double, <= “0.4”^^xsd:double])
Defines an element as a BayFrame
OWL (Protégé)(not (hasProperty some ColorLimestone))
 and (sfWithin some BayFrame)
and (BoundingBox some xsd:double[>= “2.9”^^xsd:double, <= “3.5”^^xsd:double])
Defines an element as a DoorSection

