Article

Prospectivity Mapping for Epithermal Deposits of Western Milos Using a Fuzzy Multi Criteria Evaluation Approach Parameterized by Airborne Hyperspectral Remote Sensing Data

1
Department of Geographical, Environment and Earth Sciences, University of Hull, Hull HU6 7RX, UK
2
Institute of Geodynamics, National Observatory of Athens, Lofos Nymfon, Thission, P.O. Box 20048, 11810 Athens, Greece
3
Geography and Earth Systems Science, University of Derby, Kedleston Road, Derby DE22 1GB, UK
4
School of Earth Sciences, University of Bristol, Bristol BS8 1TH, UK
*
Author to whom correspondence should be addressed.
Geosciences 2019, 9(3), 116; https://doi.org/10.3390/geosciences9030116
Submission received: 12 January 2019 / Revised: 28 February 2019 / Accepted: 28 February 2019 / Published: 7 March 2019
(This article belongs to the Special Issue Magmatic-Hydrothermal Ore Deposits)

Abstract

:
A Mineral prospectivity mapping (MPM) approach using a GIS-based weighted linear combination implementation of a Multi-Criteria Evaluation approach utilising a fuzzy Analytical Hierarchy Process to elucidate expert knowledge has been implemented to analyse the spatial distribution of epithermal deposits on the Island of Milos, Greece and model their association with exploration evidence data with the aim of providing insights into the controls on ore deposition. An integrated field and Digital Airborne Imaging Spectrometer (DAIS) hyperspectral and thermal multispectral airborne remote sensing dataset supported by field mapping and laboratory analyses, has been utilised to resolve hydrothermal alteration and parameterise the MPM. This study has highlighted the intimate spatial relationship between topographic highs and locations with high grade silicified alteration at a number of locations. The ability of high spatial resolution multispectral Thermal InfraRed (TIR) remote sensing imagery, integrated with topographic data, to resolve these silicified topographic highs provides an additional tool in the exploration of epithermal deposits. The spatial relationships between silicified lithocaps, high-grade altered rocks, faulting and topographic highs were utilised in the development of the MPM model. A close association between the modelled results and the hydrothermal alteration mapped in the field supports the accuracy of this MPM approach.

1. Introduction

Analysis of the spatial associations of known occurrences of mineral deposits with specific geological features provides insight into the controls on mineral deposit occurrence [1]. Geomorphological features within volcanic terrains provides evidence on both the volcanological and structural evolution and also constrain the potential locations of epithermal mineral deposits [2,3,4,5]. The identification of these geomorphological features in the field is hampered by the large spatial scale, inaccessible terrain and most significantly because of erosion and tectonism which significantly reduces the amount and clarity of surface expressions of these features [6,7]. Remote sensing methodologies offer the potential of accurately mapping the diagnostic mineralogical assemblages of the alteration minerals associated with epithermal deposits at landscape scales [8,9,10,11,12,13,14,15,16,17,18].
While most of the available spatial datasets are limited to surface expressions of the mineral systems, surface topography, and geological features the combination of these datasets with expert knowledge and spatial analysis methods can provide insights into the ore-forming processes. Mineral Prospectivity Mapping (MPM) provides a structured quantitative methodology to integrate these multiple spatial datasets to analyse the distribution of mineral deposits and model their spatial association providing insights into the controls on ore deposition e.g., [1,19,20,21,22,23,24]. MPM can utilise either a data- and knowledge-driven approach or some combination of both [25]. There are a number of methods available for the integration of evidence in data-driven approaches including logisitic regression [26], weights of evidence [27] and neural networks [28], while knowledge-based approaches utilise methods such as analytical hierarchy process [29] and fuzzy logic [30]. A number of GIS-based Multi-Criteria Evaluation (MCE) methods are available that can be used in MPM including Boolean overlay and weighted linear combination (WLC) [31]. Fuzzy set theory [32], when combined with WLC methods [23,31] provides an approach for overcoming the limitation of using threshold values in standard Analytical Hierarchy Process (AHP) approaches [33]. This study has two main objectives: (a) to develop a mineral prospectivity mapping approach for epithermal deposits using an integrated field and airborne-based remote sensing dataset and (b) apply these methods in the study of epithermal deposits to the western part of the island of Milos, Greece.

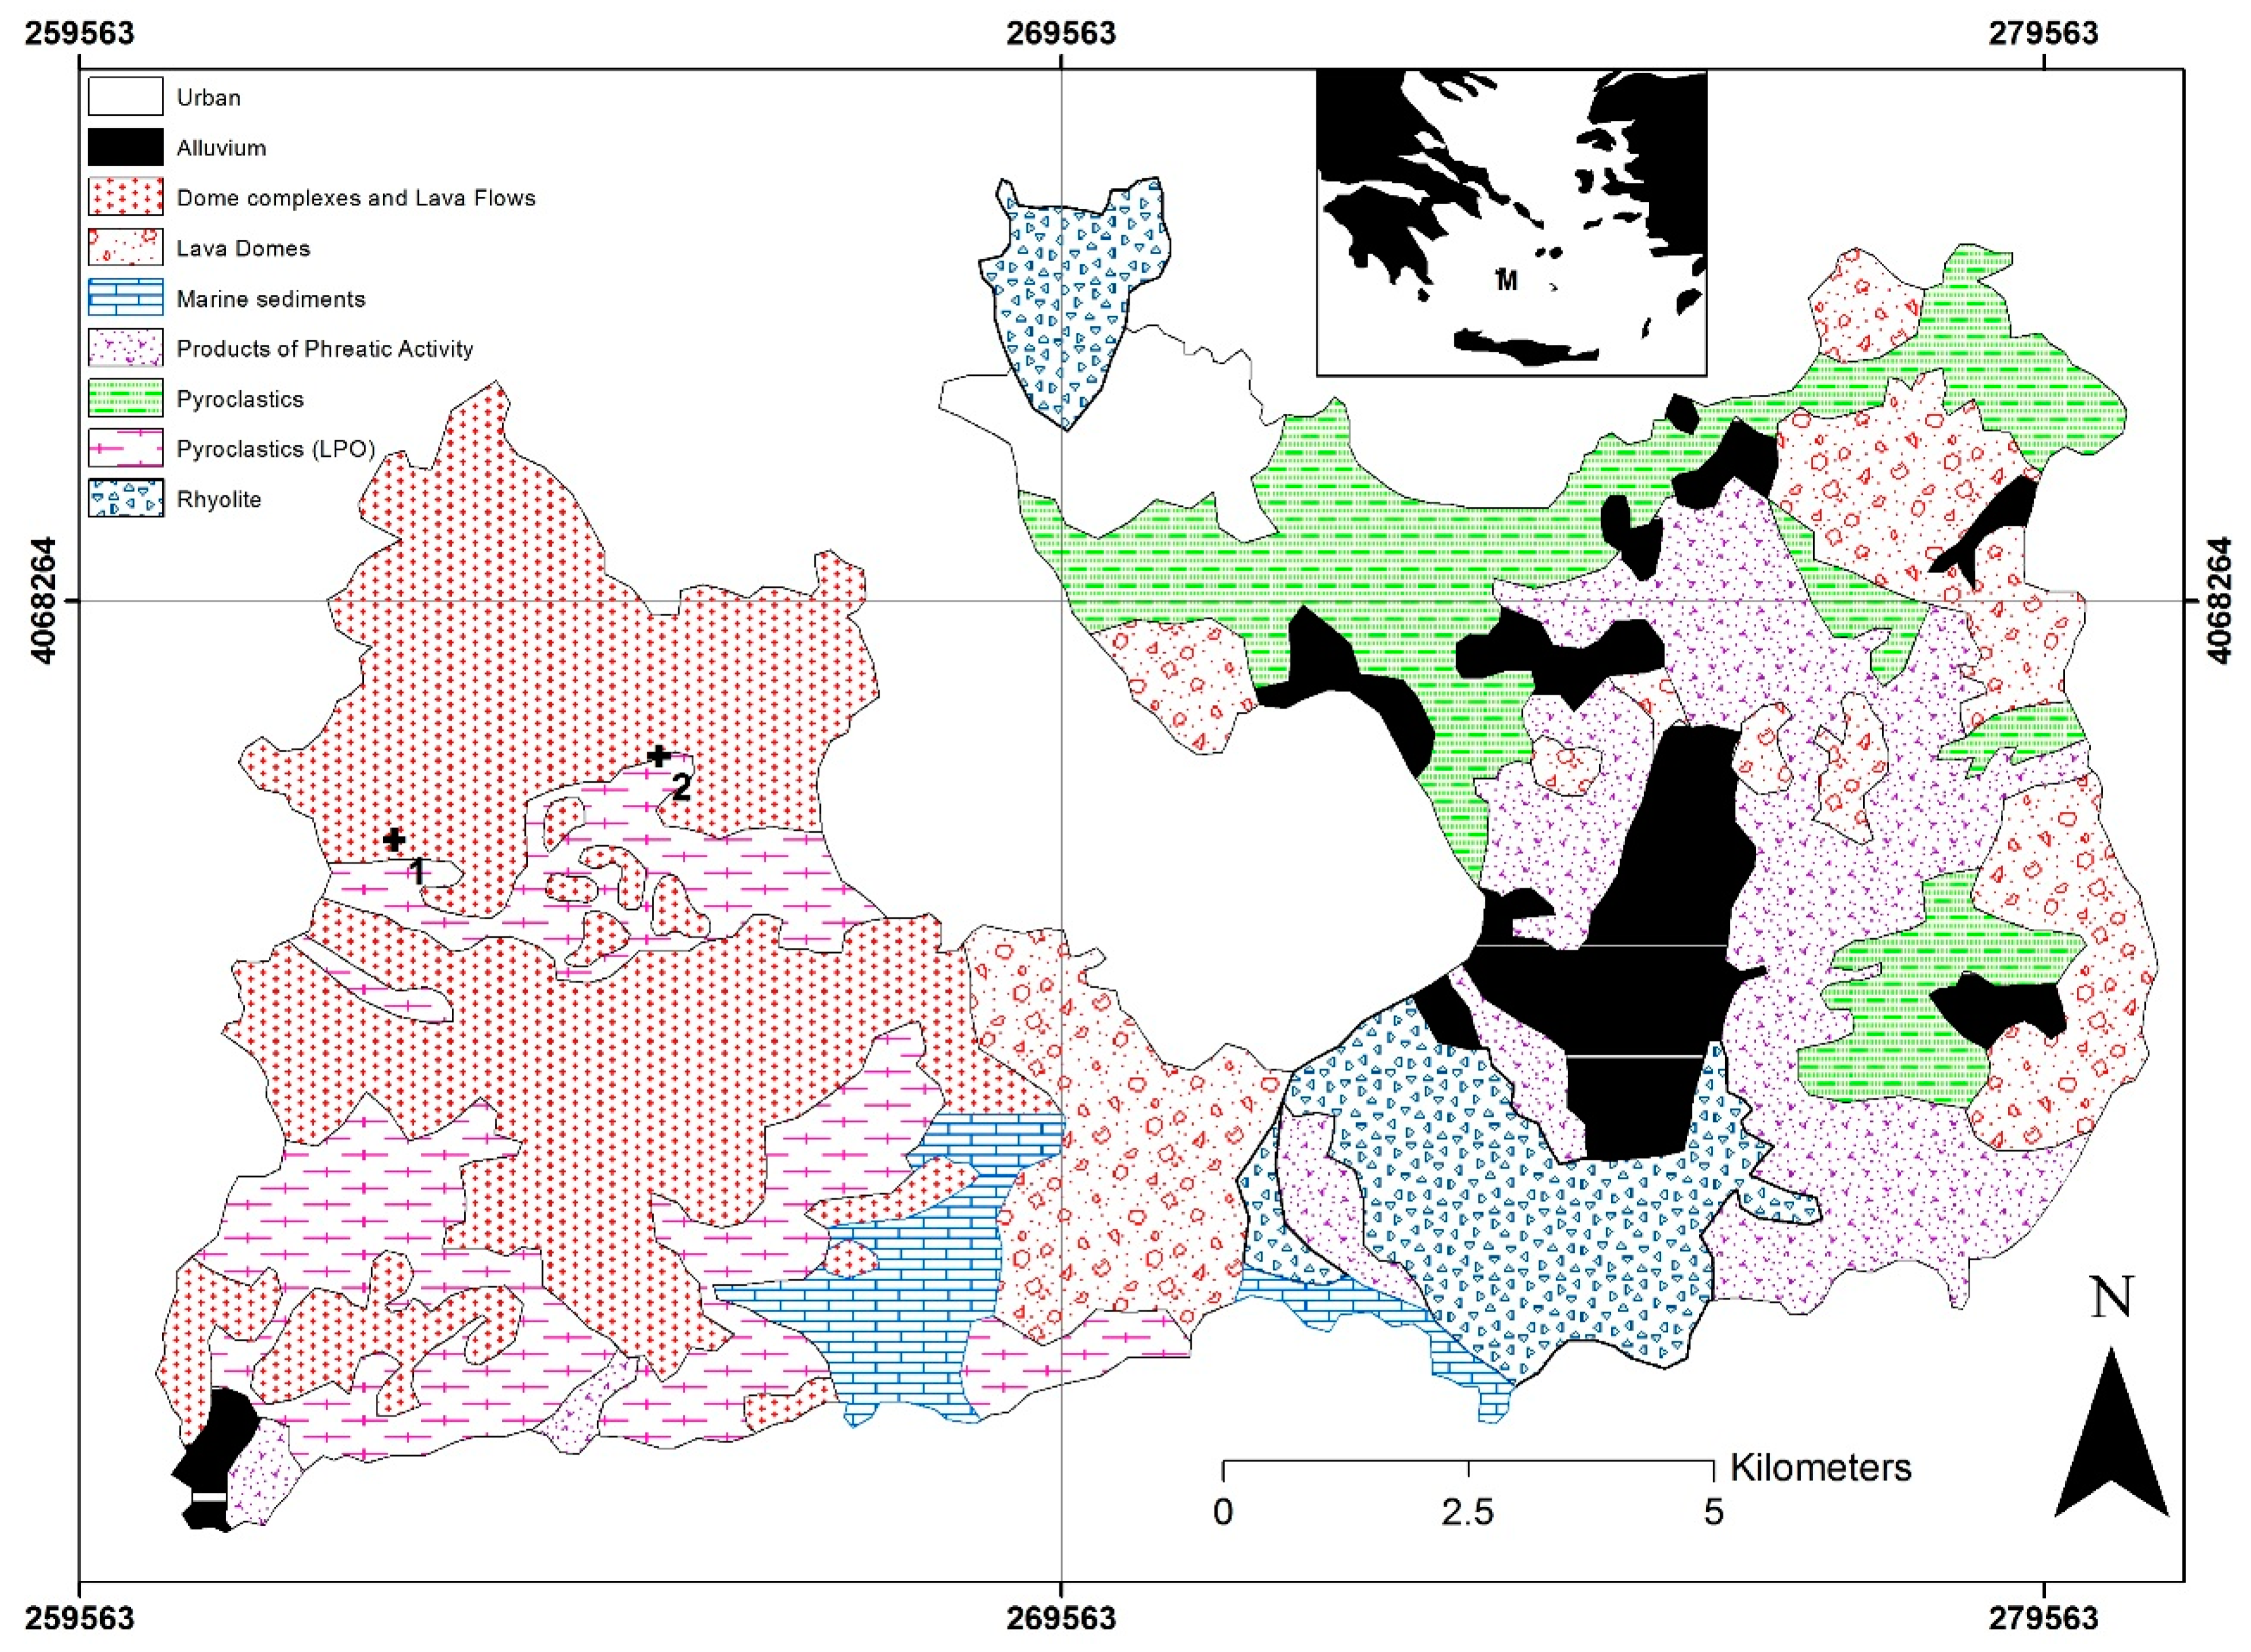
2. Geological Setting of the Study Area

The island of Milos is located in the southern Aegean Sea and is a recently emergent submarine volcano that exhibits a variety of mineralisation styles [34,35,36,37,38,39,40]. Late Pliocene submarine and late Pleistocene to Holocene subaerial volcanic rocks overlie Mesozoic metamorphic basement and upper Miocene—lower Pliocene marine sedimentary rocks and localized alluvial cover [34,35,36,37,38,39,40]. The volcanic rocks are calc-alkaline with localized high-K variants. They range from basalt to rhyolite in composition but are predominantly andesites and dacites [35]. A major normal, arcuate E-trending fault separates western Milos into two subareas with distinct alteration and mineralisation characteristics with the northern section comprising the Triades-Galana and Kondaros deposits [38,40], (Figure 1). Extensional tectonics have generated a series of horsts and grabens which have produced the dominant structural features of western Milos. They are characterised by a series of steep, NE-trending structures [38]. These structures have localised magmatic-hydrothermal fluid flow producing zones of intense silicification, brecciation and veining [38]. The silicic alteration is made up of fine-grained quartz, TiO2 polymorphs, and alunite, pyrite and occurs as vuggy- and massive-silica types. The hydrothermal alteration and associated mineralisation are spatially related to N30 °E- and E-trending faults and occurs as multi-stage breccia zones and quartz–barite–galana veins or stockworks. They crosscut earlier formed quartz–sericite–kaolinite and quartz–kaolinite altered breccia fragments with barite, kaolinite, sericite, adularia and quartz as associated gangue minerals [38,40]. The nature of the alteration is characterised by laterally and vertically gradation from NE-trending silicic outcrops into advanced argillic, argillic, propylitic alteration and fresh rock. The mineralogy of the advanced argillic zones is characterised by alunite, quartz, chalcedony, opal-CT, kaolinite, halite, diaspore, pyrite, chalcendony and jarosite [38,39,40]. The main occurrence of argillic alteration, characterised by illite, kaolinite, smectite and sericite, is marginal to the main centres of advanced argillic alteration with some outcrops located in fault zones [38,40]. The study area has high relief, ranging from 0 to 748 m, is devoid of settlements, excellent rock exposure, and a very dry and stable climate with very little vegetation cover making it ideal for remote sensing based geological mapping.
The mineralisation at Triades-Galana is a Pb–Zn–Ag deposit located along NE trending faults, the authors of [38,39,40] hosted in pyroclastic rocks and is genetically associated to andesitic/dacitic lava domes ([38,39,40] Figures 1 and 2). The mineralisation is associated with these flow domes which display alteration ranging from argillic (kaolinite–sericite) to in advanced argillic or silicic alteration. In the Galana area, alteration grades from phyllic (quartz–sericite–pyrite) upwards towards Mersinia–Kondaros into advanced argillic alteration which includes minor massive to vuggy zones of silica. Kaolinite is generally more common in the advanced argillic alteration mineralisation in the Triades-Galana and Kondaros areas whereas phyllic alteration, characterised by sericite, quartz and pyrite is restricted to the area around Triades-Galana. The Zn–Pb–(Ag) deposits at Triades and neighbouring Galana were mined initially for lead and zinc, and later for silver [41]. The minerals at Triades includes galena and sphalerite and were deposited in multiple stages [34]. The Kondaros-Mersinia area is characterized by leached silica caps (including spongy porous rock with chalcedony after opal, massive silica and subordinate vuggy quartz), which constituted the flank of an important volcanic edifice [38]. A Zn–Pb–Ag±Cu±Mn vein type mineralisation containing base metal sulphides is present at Kondaros [38]. The metallic mineralogical assemblage at Kondaros-Katsimouti includes mainly galena and sphalerite and minor pyrite and silver is present in the form of Ag–(Cd)-rich tetrahedrite and polybasite [42].

3. Materials and Method

3.1. Hydrothermal Alteration

The location and nature of hydrothermal alteration was resolved using field mapping and remote sensing methods, with supporting geochemical and petrological analyses, and secondary data from previous studies.

3.1.1. Field Mapping with Supporting XRD and Petrological Analyses

A mapping study was completed in May 2010. The distribution of alteration zones and silicified lithocaps was produced by field-based mapping supported by XRD analyses [38], Figure 2. A representative set of field spectra and hand specimens were collected (Figure 3) and studied using XRD and petrological analyses (Table 1). XRD analyses were undertaken in the laboratories of the British Geological Survey using a PANalytical X’Pert Pro diffractometer. Software for interpretation was the PANalytical X’Pert Highscore Plus coupled with the International Centre for Diffraction Data (ICDD) database.

3.1.2. Field VNIR-SWIR Reflectance and Laboratory Emission Spectroscopy

An Analytical Spectral Devices (ASD) FieldSpec Pro FR spectroradiometer was used to acquire field spectra of outcrops representative of the alteration zones. The ASD covers the 0.35–2.5 µm wave range with a sampling resolution of 1.4 nm at 0.35–1.0 µm and 2 nm at 1.0–2.5 µm with full width half maximum (FWHM) spectral resolutions: 6 nm on average at VNIR and 11 nm at SWIR wavelengths. Reflectance values were calculated using a Spectralon white reference panel. The effect of compositional heterogeneity on sample spectra was assessed by taking spectra evenly spaced, using a grid sampling approach, across sample surfaces. Emission spectra of a representative set of field samples were acquired in the laboratory using a TELOPSTM Fourier Transform InfraRed spectrometer (FTIR). The samples were heated to 70 °C and the effect of background longwave radiation was measured using a gold plate.

3.1.3. Digital Airborne Imaging Spectrometer (DAIS) Airborne Remote Sensing Dataset

DAIS is a 79-channel sensor [43] which covers the range from 0.4 to 14 µm with six channels covering the thermal infrared region (Table 2). The DAIS imagery was acquired at an altitude of 3050 m above ground level giving a spatial resolution of 5 m at nadir [43].

3.1.4. DAIS Data Processing

The VNIR and SWIR DAIS data was atmospherically corrected using the empirical line technique utilising ground spectra acquired coincident with the airborne data acquisition [44]. The DAIS data has a moderate signal-to-noise performance [43] which means that a purely modelling based approach to atmospheric correction can often produce relatively noisy spectra which can adversely affect subsequent spectral analysis and matching algorithms [44]. The Empirical Line Technique (ELT), if implemented correctly, has the capability of removing both atmospheric and systematic instrument noise from the hyperspectral imagery which can often produce imagery with significantly better signal-to-noise ratios than modelling, particularly in areas with relatively low topographic variability [44]. In this study an excellent set of large, homogenous field targets with different albedos were available within the study providing an ideal dataset for successful implementation of the ELT. Spatial mapping and abundance estimates for specific alteration zones were carried out using the Mixture Tuned Matched Filtering (MTMF) technique, implemented in ENVI 5.1TM, on the SWIR [45,46,47] data. MTMF performs a matched filtering (MF) of multispectral images which minimises the response of background materials by projecting each pixel vector onto a subspace, which is orthogonal to the background spectra, and then maximises the response of the endmembers of interest by comparing the residual pixels to each of the reference spectra. The MTMF spectral matching approach can utilise a range of input spectral profile sources either field, library or spectral endmembers derived from the imagery [45,46,47]. In this study there were abundant locations throughout the study area where large areas of altered rocks were exposed providing an excellent set of ground spectra representative of the different alteration zones. This field spectral library was used in the MTMF-based spectral mapping.
The processing of the DAIS TIR data involved two stages. The first stage was atmospheric correction using the ATCOR-4 atmospheric correction software [48]. ATCOR-4 provides a highly accurate correction of thermal wave range data incorporating variations in elevation in the calculation on a per-pixel basis [48]. ATCOR-4 requires the specification of column water vapour concentration and visibility in order to parameterise the atmospheric model. A standard continental summer MODTRAN atmospheric model [48] was selected as being very similar to the atmospheric conditions on Milos at the time of the data acquisition. The second stage of processing was the separation of the temperature-emissivity components from the TIR data. The emissivity alpha residuals technique implemented in ENVI 5.1TM [49] was utilised to carry out the temperature-emissivity separation because of its accuracy and scene-independent nature of the processed data [50]. To resolve the locations with the highest degree of silicified alteration the very strong quartz emission minima was utilised (Figure 4a). A ratio of DAIS TIR bands (74 + 75)/(78 + 79) was calculated. Bands 74 and 75 extend across the emission minimum of quartz which gives locations with a higher level of silicification a lower ratio value (Figure 4b).

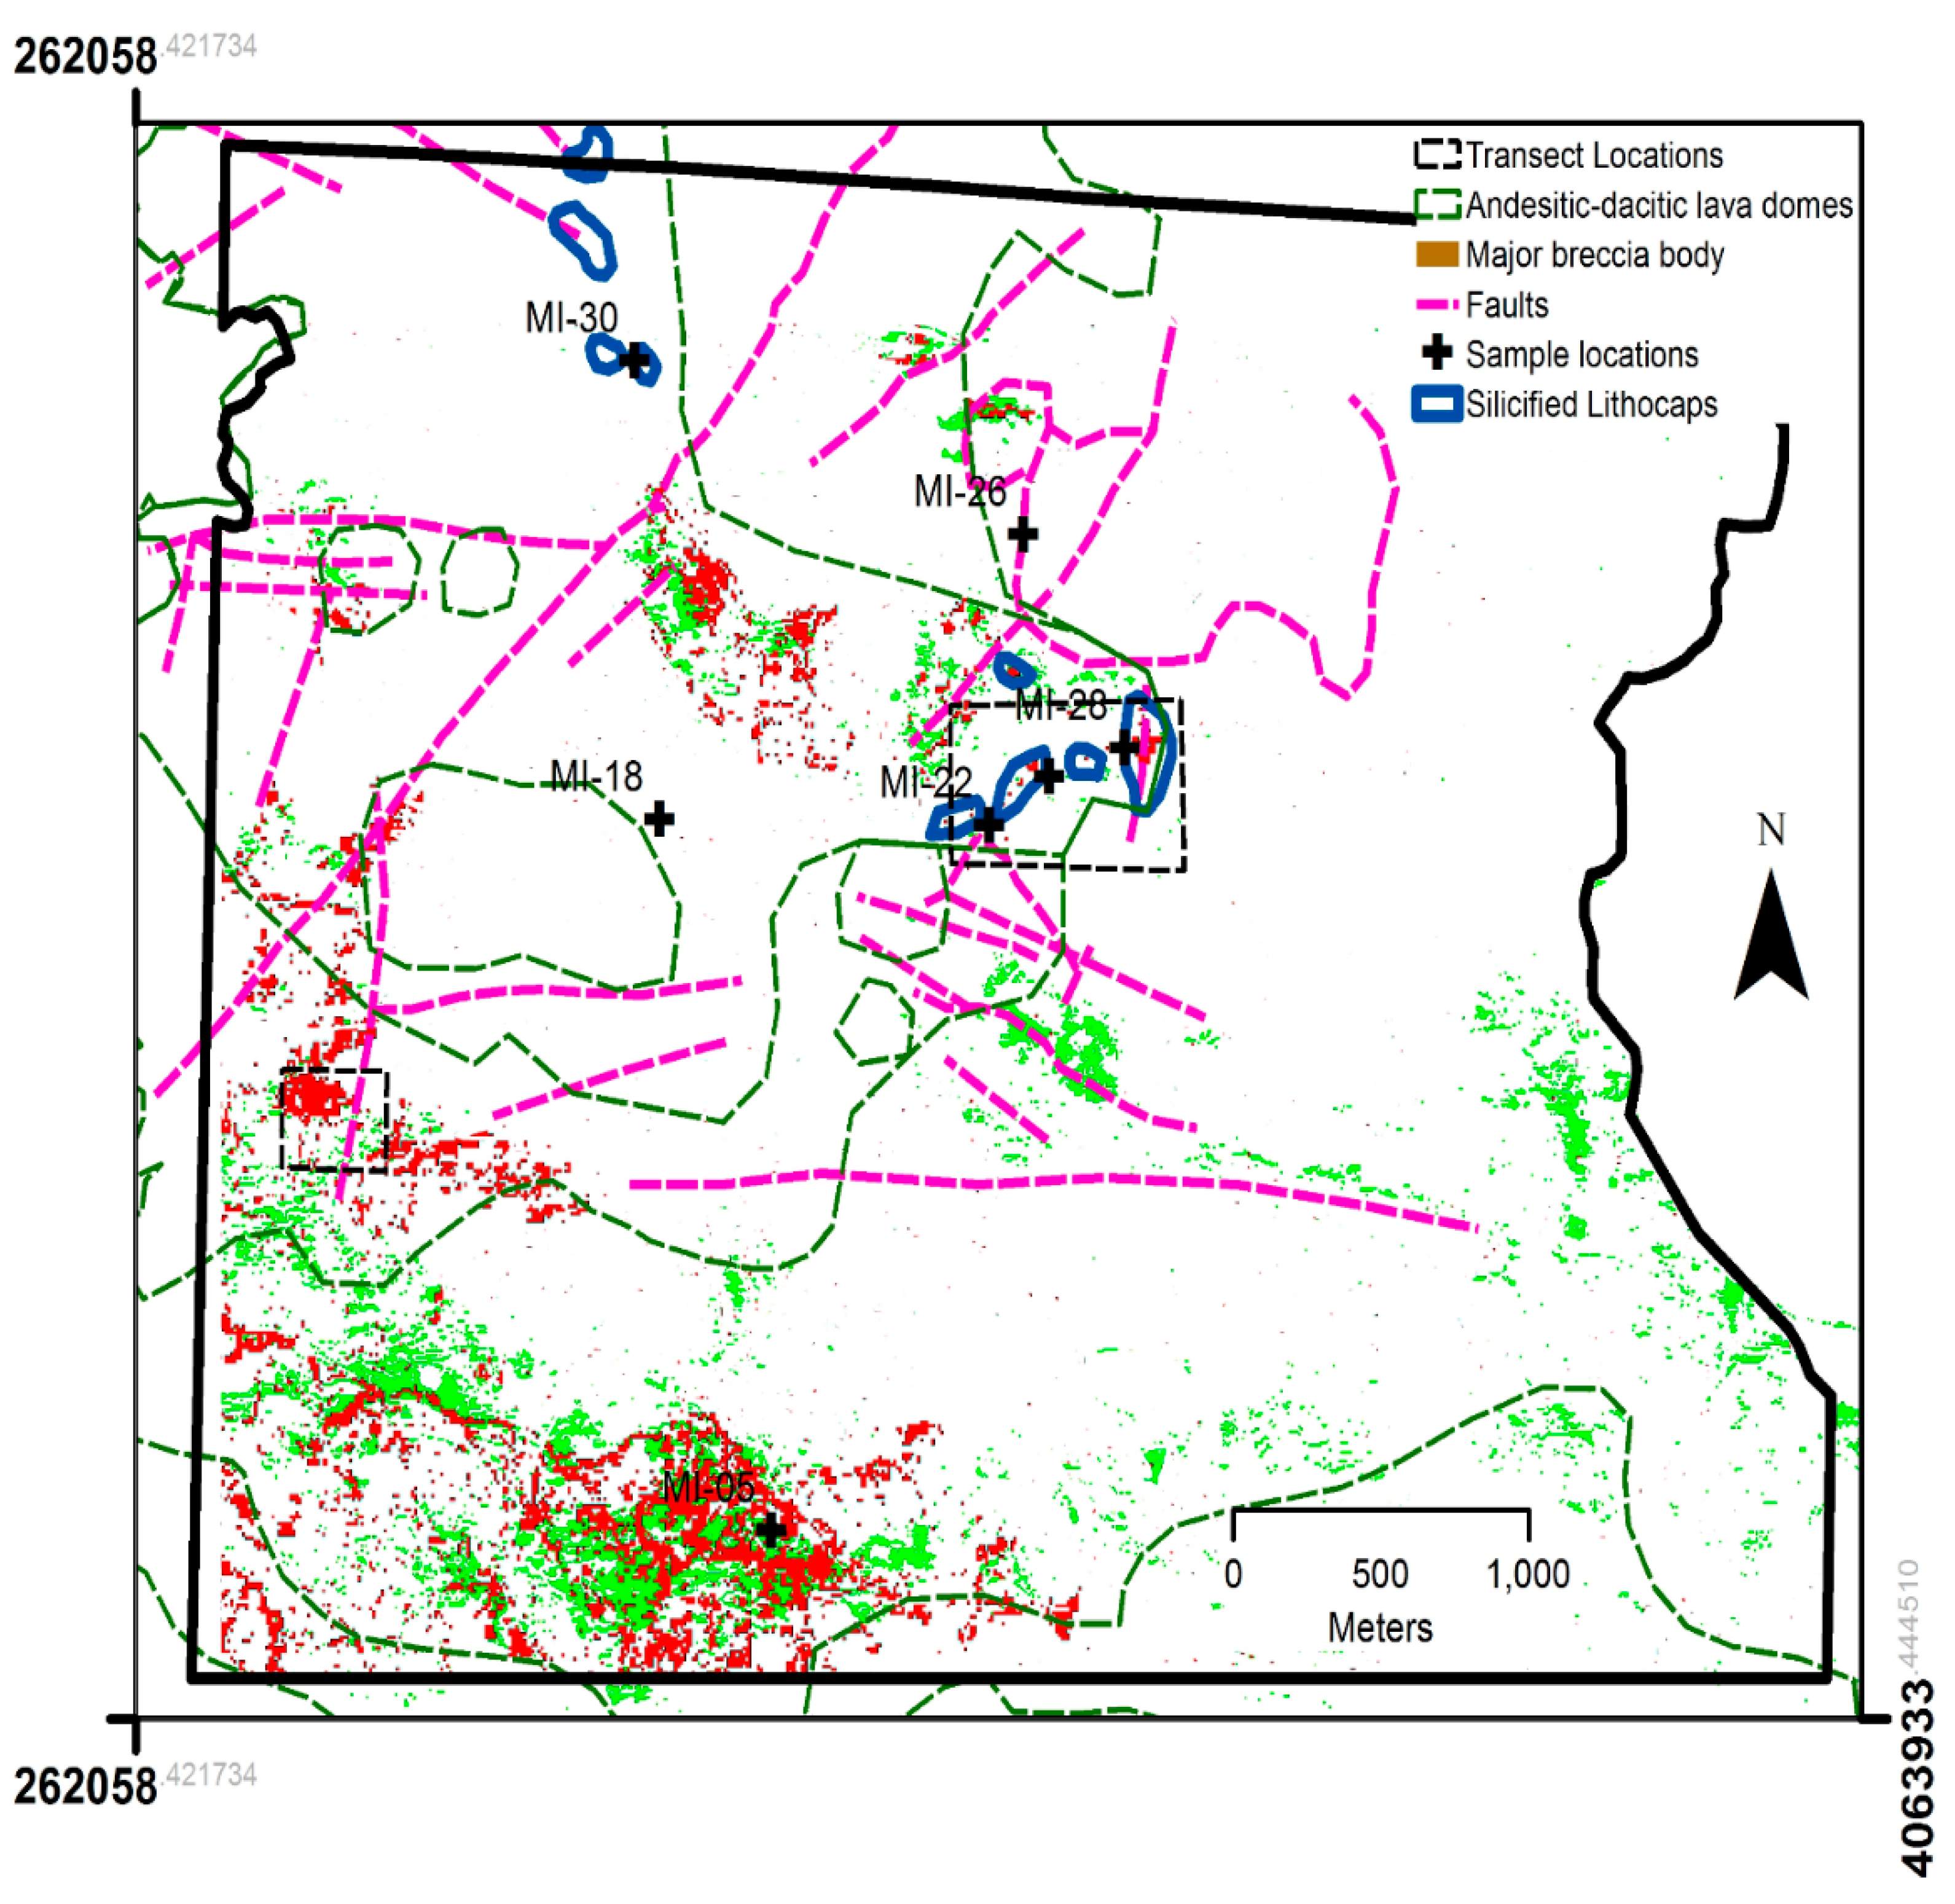
3.2. Lithology and Structures

For prospectivity mapping, epiclastic aprons associated with andesitic-dacitic lava domes were considered favourable for epithermal mineralisation [34,38,39,40,41,42]. A Digital Elevation Model (DEM) and a slope layer were generated from a 1:50,000 contour map. The slope and contour layers were used with cross-sectional analysis to resolve the location and dimension of topographic highs. The mineralisation and associated hydrothermal alteration are spatially related to N30° E- and E-trending faults [38]. In epithermal systems, areas of structural weakness can act as pathways of hydrothermal fluids. The nature and extent of this relationship varies markedly between deposits however there are a number of distinct structural, geomorphological and morphological settings which are highly conducive to the formation of epithermal deposits [51,52,53,54,55,56].

3.3. MPM Implementation

A fuzzy AHP approach was used to elicit knowledge on the distances and the relative importance (weighting) of the spatial associations of epithermal mineralization with topography, faulting, advanced argillic hydrothermal alteration, silicified lithocaps and volcanic centres (VC). A WLC MCE approach was used to map prospectivity for epithermal deposits on the island of Milos, Greece. Table 3 shows the relative importance and weights, spatial influences and distances and type of fuzzy function associated with the geological criteria for epithermal deposits in west-central Milos. The highest weight was assigned to the hydrothermal alteration associated with the lithocaps, the advanced argillic alteration and the faults were assigned less weighting and the topographic highs and the Volcanic Centres were assigned the lowest weightings. The consistency ration (CR) is < 0.1 which indicates a good consistency of the judgements used for the comparison. The analysis of the spatial influences for the five criteria produced new spatial layers which were multiplied according to their assigned weighting (Table 3). The hydrothermal alteration layers, comprising only the higher grade advanced argillic and silicified (lithocaps) layers was also multiplied by the assigned weighting and added to the other weighted layers producing the final MPM model result.

4. Results

4.1. Analysis of Field Spectral and Laboratory Spectral Emissivity Datasets

Field spectra representative of the alteration zones and unaltered rocks convolved to the DAIS SWIR band waveranges are shown in Figure 3. The spectral resolution of the DAIS imagery is sufficient to resolve the diagnostic absorption features of the minerals characteristic of the silic (quartz), advanced argillic (kaolinite, alunite) and argillic (kaolinite, smectite) alteration zones. Emission spectra of quartz-rich samples from Milos show emission minima near 8.40 and 8.95 µm separated by a sharp emission maximum at 8.63 µm (Figure 4a).
These laboratory spectra, and also emission spectra from the Jet Propulsion Laboratory (JPL) spectral library [57], when convolved to the DAIS sensor wavelengths demonstrate their capability to differentiate quartz-rich rocks (Figure 4b). The JPL library was selected because of its extensive range of emission spectra with compositions related to the samples under study. Alunite and Kaolinite have second-order emission features. Alunite exhibits a minimum around 9.9 µm while Kaolinite has multiple absorption features at 9.0, 9.68, 9.92 and 10.95 µm [57,58,59].

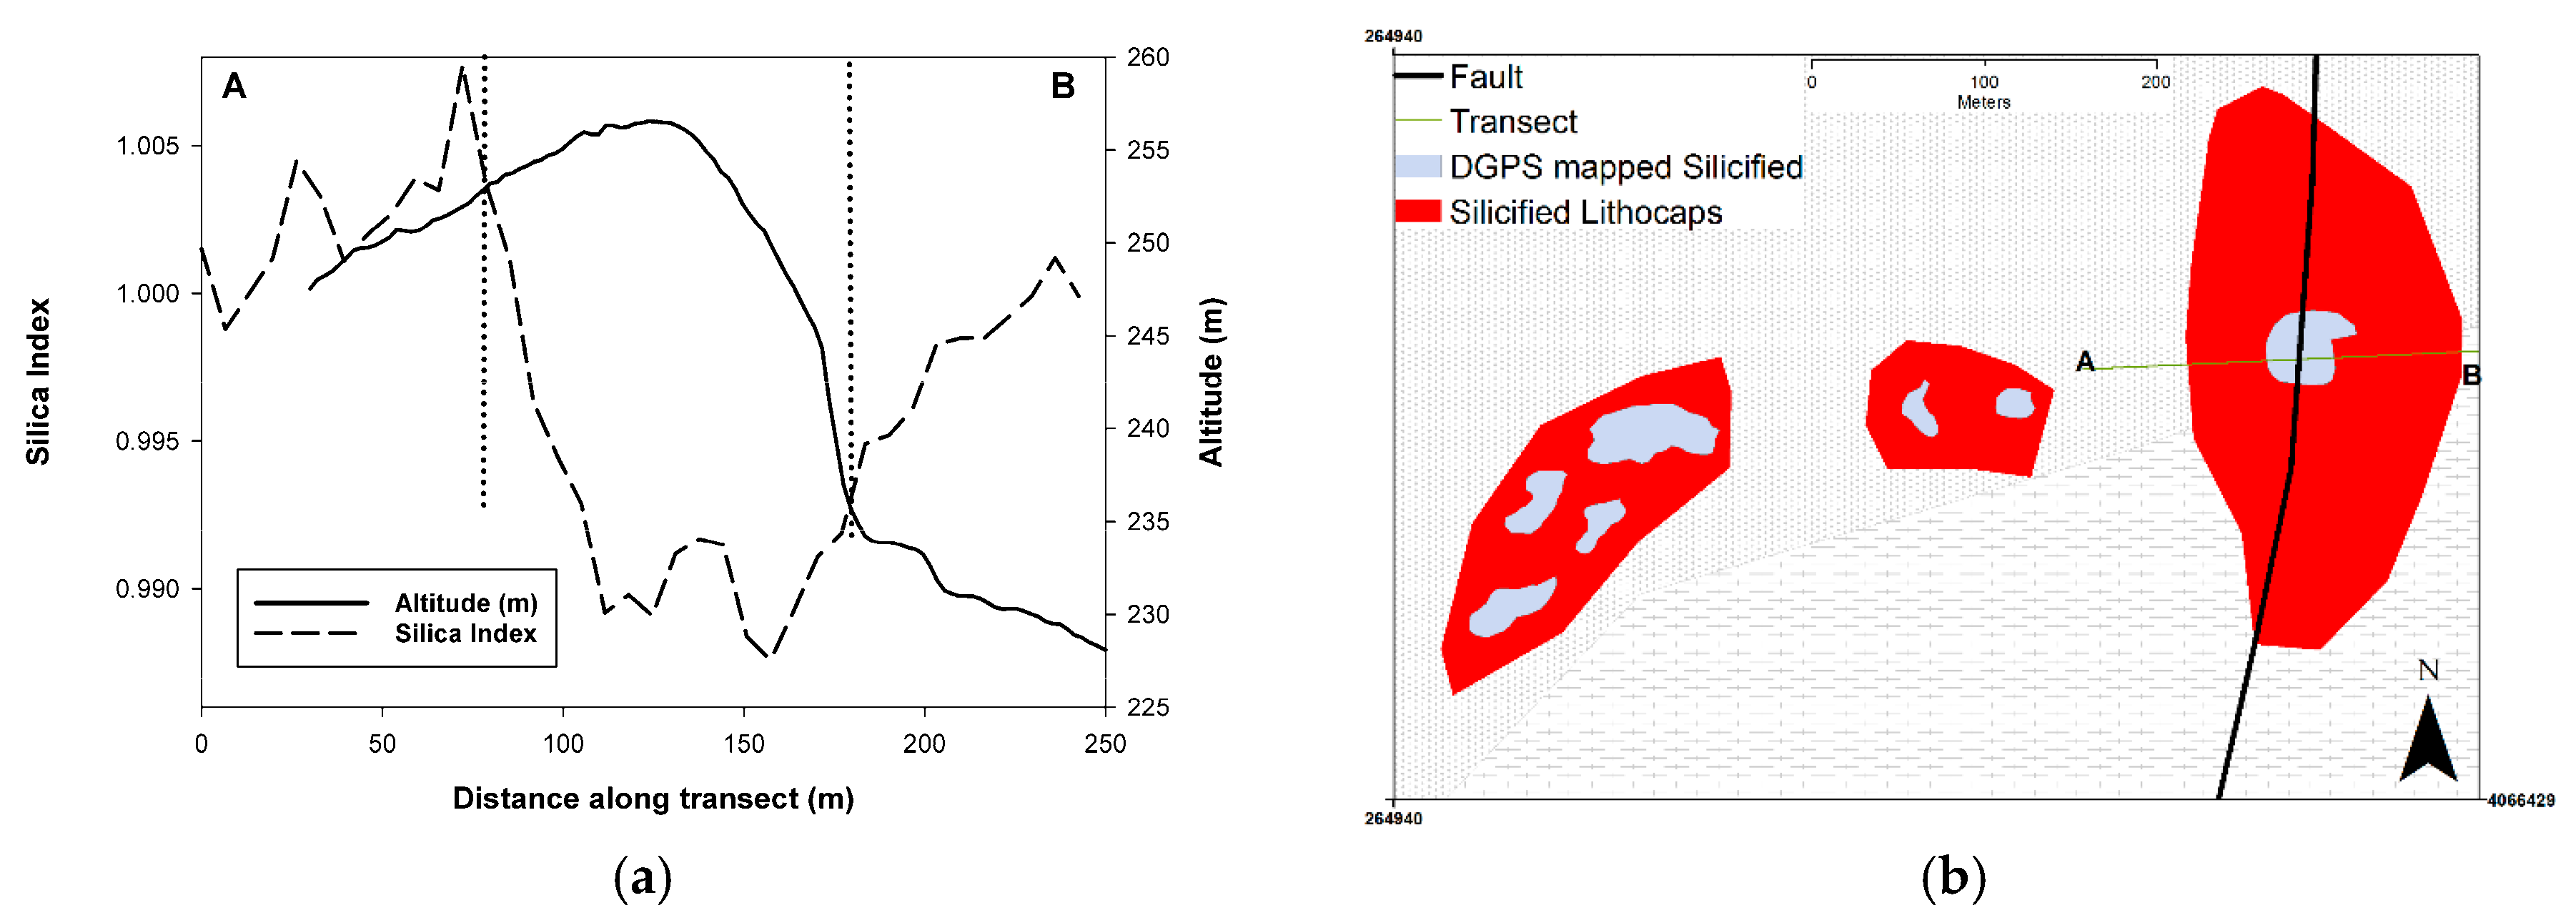
4.2. Analysis of DAIS Datasets

The results of the MTMF analysis of the SWIR imagery and the silica index derived from the TIR data are shown in Figure 2 with higher values representing good matches [32,33,34]. Pixels corresponding to the highest degree of match for each class were transferred digitally to the aerial photography mosaic with red and green pixels representing silicified and advanced argillic alteration, respectively. Pixels that are not colour-coded are unclassified. To investigate the spatial and topographic relationship of the alteration zones mapped from the DAIS SWIR and TIR datasets cross-sections across the Triades-Galana and Kondaros hydrothermal alteration zones with the MTMF analysis were plotted with topography (Figure 5 and Figure 6). At Kondaros a transect southwest to northeast across the silicified sinter again shows a clear topographic high associated with the outcrop of the silicified lithocaps (Figure 5).
The results of the DAIS TIR based mapping of the silicified lithocaps were highly correlated to the results of the field mapping carried out by [30]. To validate the accuracy of the lithocap mapping by [38] the authors mapped the outcrops at Kondaros assisted by a Differential Global Positioning System (Figure 5b). While the outcrop of the silica lithocaps resolved by the authors was generally similar to that mapped by [38] the outcrops were generally composed of a number of smaller, more discrete outcrops, with a mean size of 20 × 40 m2 compared to larger areas (120 × 200 m2) mapped by [38].
At Triades-Galana (Figure 6) a transect southwest to northeast across the silicified breccia outcrops shows a number of distinct topopgraphic highs where the silificied rock outcrops and with the close lateral association with advanced argillic and argillic alteration zones.

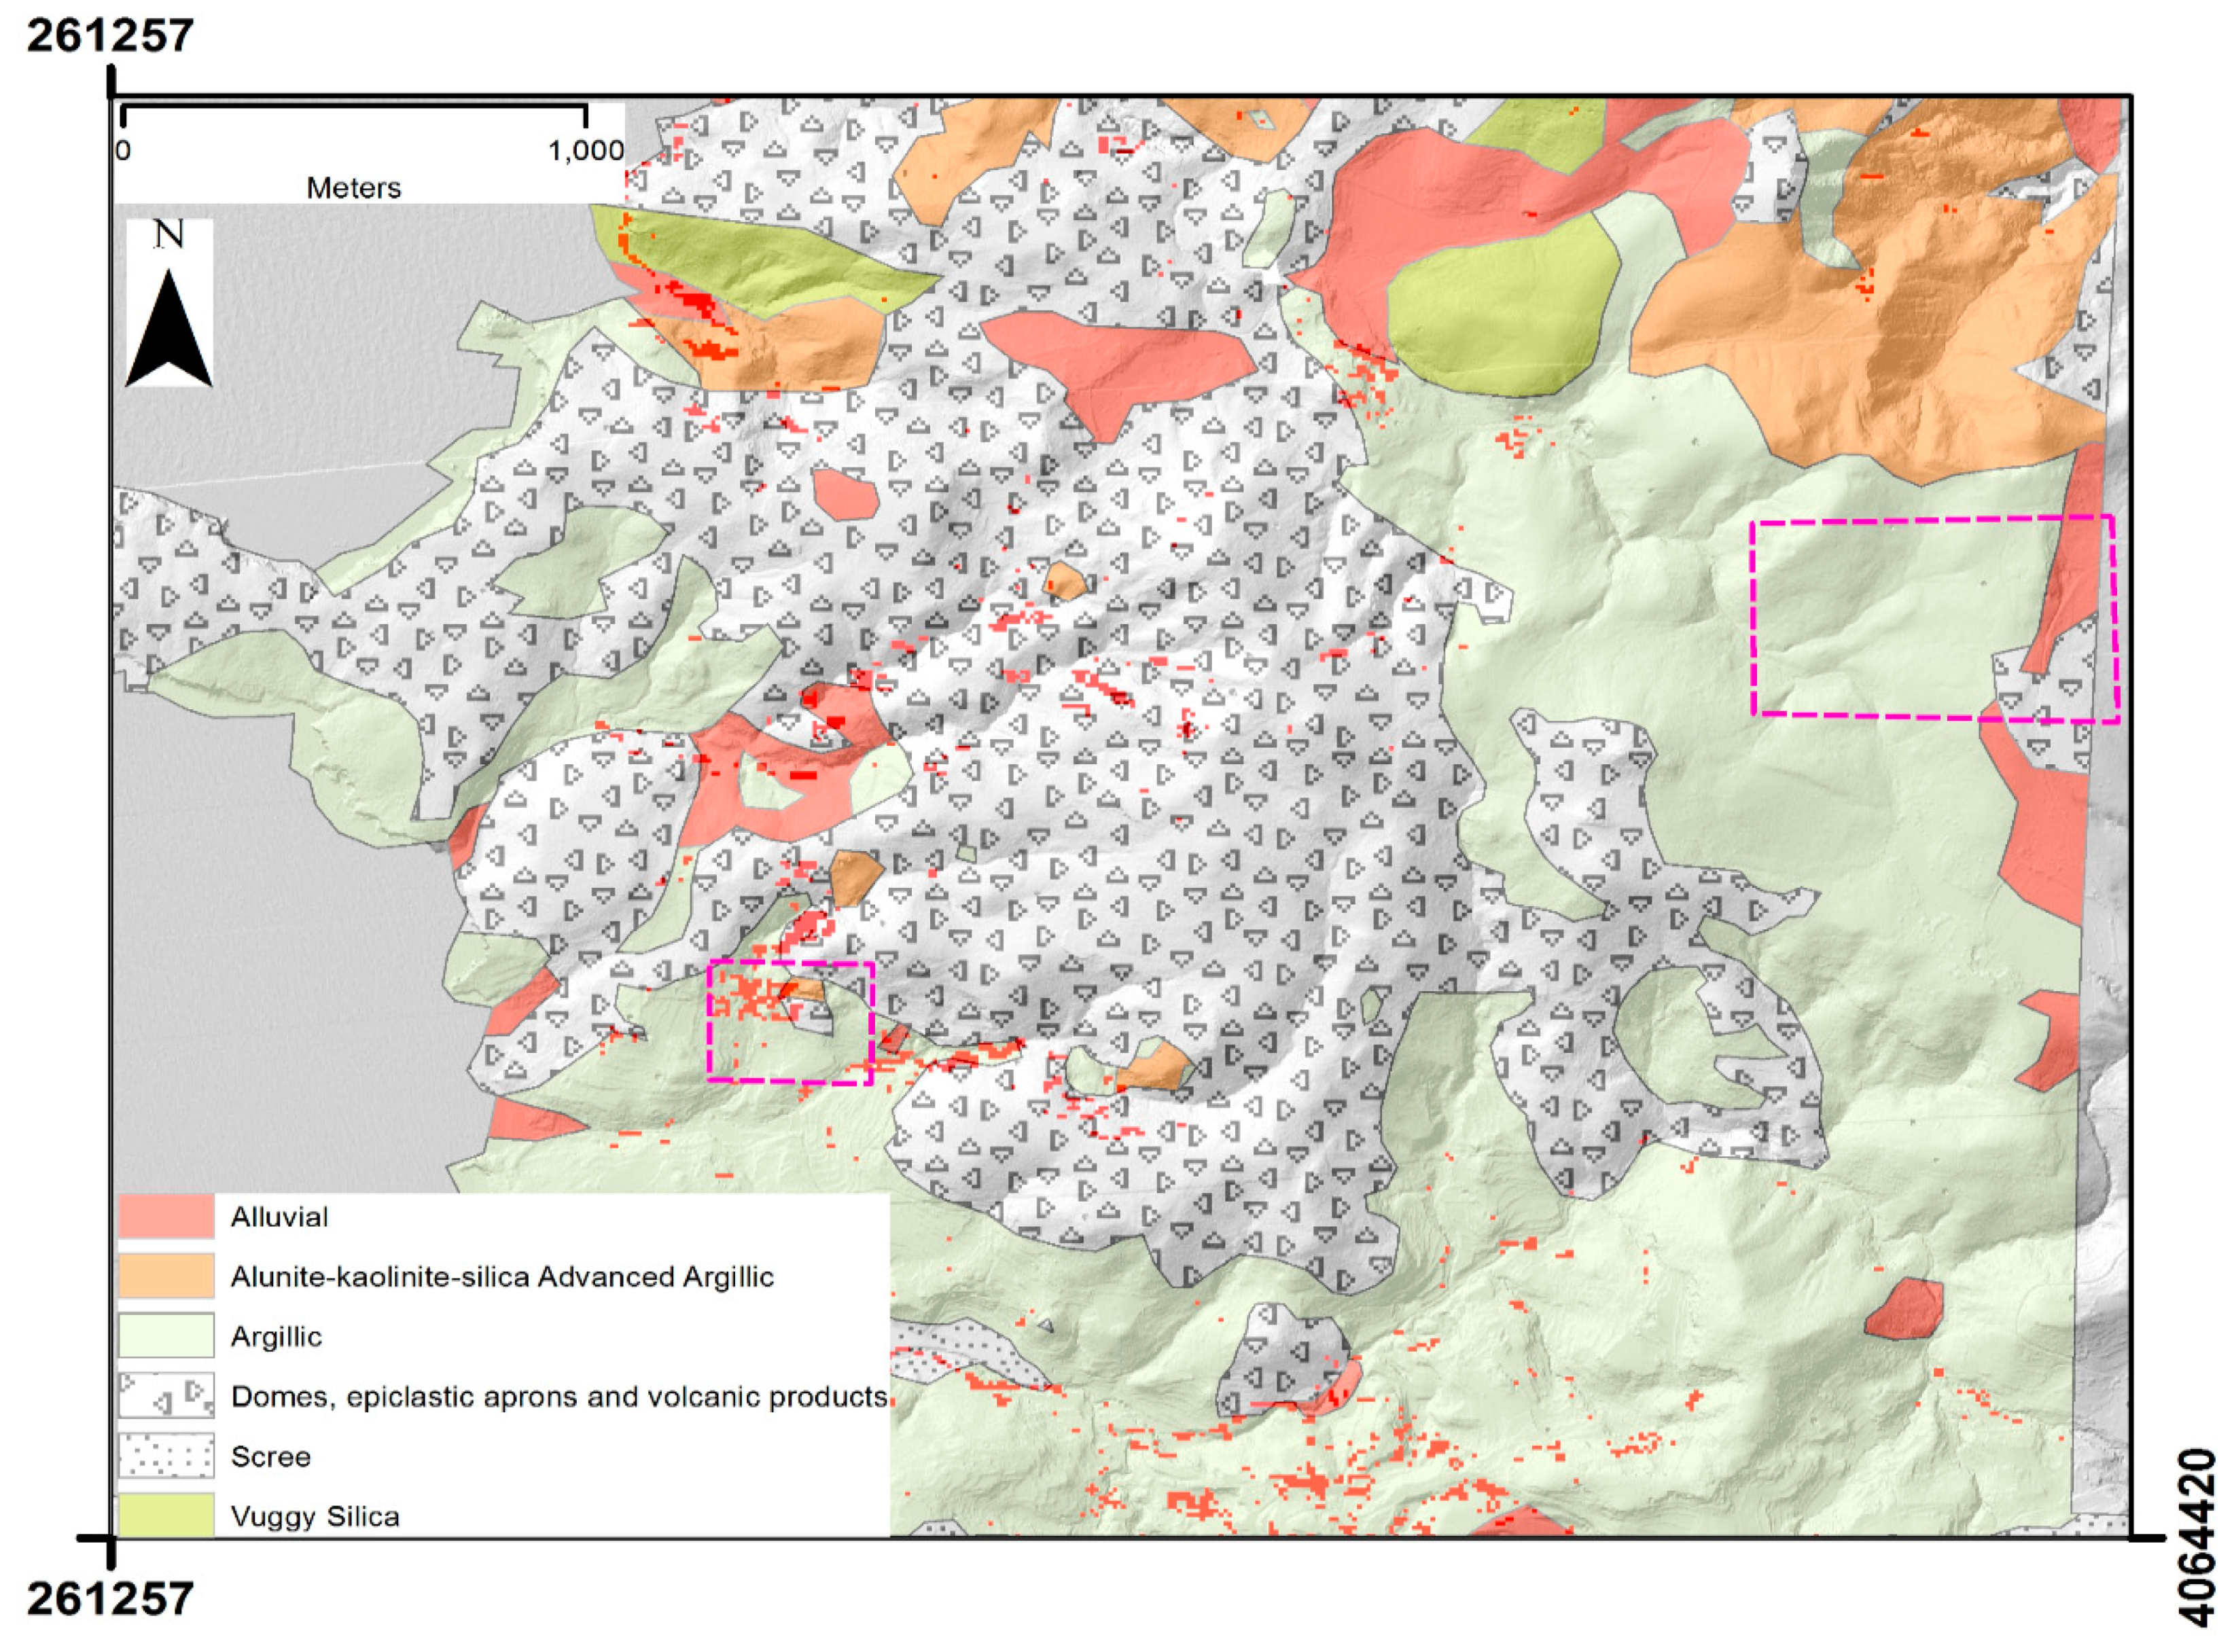
4.3. Results of the MPM Modelling

The results of the MPM modelling displayed on the DEM (Figure 7) demonstrate the intimate relationship between alteration, mineralisation, topography and faulting. The locations identified as having the highest potential for mineralisation are found within the andesitic-dacitic lava domes, closely associated with the east/northeast trending faulting and generally forming clearly identifiable topographic highs. The results of the MPM modelling overlain by the field mapped alteration zones (Figure 8) show that the highest potential mineralisation zones are located with the mapped advanced argillic and silicified zones supporting the accuracy of the prospectivity modelling.

5. Discussion

5.1. Utility of High Spatial and Spectral Remote Sensing based Hydrothermal Mapping

There have been a large number of studies that have demonstrated the potential of SWIR and thermal remote sensing data to map the highest grade alteration associated and thus mineral prospectivity associated with epithermal deposits [1,8,9,10,11,12,13,14,15,16,17,59,60,61]. A significant limitation has been the spatial resolution of the only widely available multi-spectral thermal wave range sensor, ASTER, which with a 90 × 90 m2 pixel covers an area of 8100 m2. On Milos, the size of the silicified lithocaps range from 20 × 20 to 100 × 150 m2. Additionally the outcrop of these lithocaps is generally made of smaller, discrete patches rather than one large outcrop. The high spatial and spectral resolution of the DAIS TIR data, 5 × 5 m2, enabled even the smallest outcrop of silicified rock to be differentiated from the country rocks. The hyperspectral characteristics of the DAIS SWIR imagery was also a significant advantage in mapping the hydrothermal alteration zones as the higher grade advanced argillic outcrops could be clearly identified by the direct identification of alunite and kaolinite concentrations from the DAIS imagery on a pixel-by-pixel basis. The intimate spatial association with silicified lithocaps and localised topographic highs has been recognised by many researchers e.g., [1,5]. The high spatial resolution DAIS imagery enables direct integration with topography as demonstrated at Triades-Galana and Kondaros providing enhanced identification of mineral prospectivity.

5.2. Potential of Fuzzy Multi Criteria Evaluation MPM of Epithermal Deposits

The MPM modelling has identified a number of discrete spatial locations of high potential for mineral prospectivity around Triades-Galana and Kondaros and a number of areas on the northern and southern margins of the study area (Figure 7). Triades-Galana and the area on the southern margin have already been mined for a variety of metallic and high-grade clay minerals which supports the validity of the modelling results.
Overlaying the map of hydrothermal alteration produced by field-based mapping [38] onto the MPM results (Figure 8) shows that the highest locations for mineral prospectivity are all located in the argillic, advanced argillic and silicified alteration zones. The fuzzy multi criteria evaluation method implemented in this study provides a straightforward approach to integrating a wide range of spatial datasets and producing a quantitative output, however, there are a number of issues that can affect the quality of the output modelling. The results are critically dependent on a range of factors including the determination of spatial threshold distances, the criterion weights in the weighted linear combination, the use of a linear transformation and decision risk [62].

6. Conclusions

Prospectivity for epithermal deposits was mapped successfully in the western part of the Island of Milos using airborne remote sensing data and applying a GIS-based weighted linear combination implementation of a MCE approach.
The use of DAIS airborne data, calibrated and validated using ground spectra, demonstrated the potential of high spatial and spectral resolution remote sensing datasets to identify the diagnostic mineral assemblages representative of the different alteration zones. The utility of high spatial resolution TIR wave range remote sensing data in mapping epithermal deposits was clearly shown. The ability to map out lithocaps at a spatial resolution sufficient to allow integration with high spatial resolution topographic data enabled a clear spatial association between localized topographic highs, characteristic of lava domes and the silicified lithocaps. The high spatial and spectral resolution DAIS SWIR data allowed accurate detection of the mineralogy diagnostic of the alteration zones and also identification of the intimate spatial and vertical relationships between volcanological-related geomorphological features and the altered rocks.
The results of the MPM could be improved by: (a) inclusion of other data layers, such as geochemistry and geophysics that were not used in this study; (b) implementation of a multi-scenario modelling approach which would allow the sensitivity of the model results to variation in the key criteria to be quantitatively assessed and (c) more detailed understanding of the influence of the faulting on the spatial distribution of hydrothermal alteration.

Author Contributions

G.F., A.G. and A.J.M. carried out the fieldwork on Milos. G.F. processed and analysed the airborne and field remote sensing datasets. G.F. implemented the spatial modelling approach. G.F. Produced the original draft, A.G., R.P. and A.J.M. assisted in the production of the figures and assisted in the review and editing of the manuscript.

Funding

This research was funded by Natural Environment Research Council: GA/09F/139—RMS E3557.

Acknowledgments

This research was supported by an award from the DAIS Large Scale Facility based at the German Aerospace Research Establishment (DLR) and by loans of field spectrometers from the NERC Field Spectroscopy Facility. Simon Kemp, British Geological Survey, UKRI is thanked for provided the XRD analyses. The authors would like to thank the three anonymous reviewers for their very helpful comments and corrections and Jon Naden, British Geological Survey, UKRI for constructive comments on the manuscript.

Conflicts of Interest

The authors declare no conflict of interest.

References

  1. Andrada de Palomera, P.; van Ruitenbeek, F.J.; Carranza, E.J.M. Prospectivity for epithermal gold-silver deposits in the Deseado Massif, Argentina. Ore Geol. Rev. 2015, 71, 484–501. [Google Scholar] [CrossRef]
  2. Lipman, P.W. Ash-flow calderas as structural controls of ore deposits—Recent work and future problems. U.S. Geol. Soc. Bull. 1992, 2012, L1–L11. [Google Scholar]
  3. Milesi, J.-P.; Marcoux, E.; Sitorous, T.; Simandjuntak, M.; Leroy, J.; Bailly, L. Pongkor (West Java, Indonesia): A Pliocene supergene-enriched epithermal Au–Ag–(Mn) deposit. Miner. Depos. 1999, 34, 131–149. [Google Scholar] [CrossRef]
  4. Rytuba, J.J. Evolution of volcanic and tectonic features in caldera settings and their importance in the localization of ore deposits. Econ. Geol. 1994, 89, 1687–1696. [Google Scholar] [CrossRef]
  5. White, N.C.; Hedenquist, J.W. Epithermal environments and styles of mineralisation: Variations and their causes, and guidelines for exploration. J. Geochem. Explor. 1990, 36, 445–474. [Google Scholar] [CrossRef]
  6. Kouli, M.; St Seymour, K. Contribution of remote sensing techniques to the identification and characterisation of Miocene caldera, Lesvos Island, Aegean Sea, Hellas. Geomorphology 2006, 44, 1–16. [Google Scholar] [CrossRef]
  7. Vamvoukakis, C.; St Kouli, M.; Lamera, S.; Denes, G. Investigation of non pristine volcanic structures acting as probable hosts to epithermal gold mineralization in the back arc region of the active Aegean arc, using combined satellite imagery and field data: Examples from Lesvos volcanic terrain. Dev. Volcanol. 2005, 7, 329–343. [Google Scholar]
  8. Pour, A.M.; Hashim, M. The application of ASTER remote sensing data to porphyry copper and epithermal gold deposits. Ore Geol. Rev. 2012, 44, 1–9. [Google Scholar] [CrossRef] [Green Version]
  9. Rockwell, B.W.; Hofstra, A.H. Identification of quartz and carbonate minerals across northern Nevada using ASTER thermal emissivity data—Implications for geologic mapping and mineral resource investigations in well-studied and frontier areas. Geosphere 2008, 4, 218–246. [Google Scholar] [CrossRef]
  10. Pour, A.B.; Park, Y.; Park, T.S.; Hong, J.K.; Hashim, M.; Woo, J.; Ayoobi, I. Evaluation of ICA and CEM algorithms with Landsat-8/ASTER data for geological mapping in inaccessible regions. Geocarto Int. 2018. [Google Scholar] [CrossRef]
  11. Pour, A.B.; Park, Y.; Park, T.S.; Hong, J.K.; Hashim, M.; Woo, J.; Ayoobi, I. Regional geology mapping using satellite-based remote sensing approach in Northern Victoria Land, Antarctica. Pol. Sci. 2018, 16, 23–46. [Google Scholar] [CrossRef]
  12. Pour, A.B.; Park, T.S.; Park, Y.; Hong, J.K.; Zoheir, B.; Pradhan, B.; Ayoobi, I.; Hashim, M. Application of multi-sensor satellite data for exploration of Zn-Pb sulfide mineralization in the Franklinian Basin, North Greenland. Remote Sens. 2018, 10, 1186. [Google Scholar] [CrossRef]
  13. Pour, A.B.; Hashim, M.; Park, Y.; Hong, J.K. Mapping alteration mineral zones and lithological units in Antarctic regions using spectral bands of ASTER remote sensing data. Geocarto Int. 2018, 33, 1281–1306. [Google Scholar] [CrossRef]
  14. Pour, A.B.; Hashim, M.; Hong, J.K.; Park, Y. Lithological and alteration mineral mapping in poorly exposed lithologies using Landsat-8 and ASTER satellite data: North-eastern Graham Land, Antarctic Peninsula. Ore Geol. Rev. 2017. [Google Scholar] [CrossRef]
  15. Safari, M.; Maghsodi, A.; Pour, B.A. Application of Landsat-8 and ASTER satellite remote sensing data for porphyry copper exploration: A case study from Shahr-e-Babak, Kerman, south of Iran. Geocarto Int. 2017. [Google Scholar] [CrossRef]
  16. Ahmadirouhani, R.; Rahimi, B.; Karimpour, M.H.; Malekzadeh Shafaroudi, A.; Najafi, S.A.; Pour, B.A. Fracture mapping of lineaments and recognizing their tectonic significance using SPOT-5 satellite data: A case study from the Bajestan area, Lut Block, east of Iran. J. Afr. Earth Sci. 2017, 134, 600–612. [Google Scholar] [CrossRef]
  17. Aubakar, A.J.; Hasim, M.; Pour, B.A. Identification of hydrothermal alteration minerals associated with geothermal system using ASTER and Hyperion satellite data: A case study from Yankari Park, NE Nigeria. Geocarto Int. 2018. [Google Scholar] [CrossRef]
  18. Van der Meer, F.; van der Werff, H.M.A.; van Ruitenbeek, F.J.A.; Hecker, C.A.; Bakker, W.H.; Noomen, M.F.; van der Meijde, M.; Carranza, E.J.M.; Boudewijn de Smeth, J.; Woldai, T. Multi- and hyperspectral geologic remote sensing: A review. Int. J. Appl. Earth Obs. Geoinf. 2012, 14, 112–128. [Google Scholar] [CrossRef]
  19. Bonham-Carter, G.F.; Agterberg, F.P.; Wright, D.F. Integration of geological datasets for gold exploration in Nova Scotia. Photogramm. Eng. Remote Sens. 1988, 54, 1585–1592. [Google Scholar]
  20. Carranza, E.J.M. Controls on mineral deposit occurrence inferred from analysis of their spatial pattern and spatial association with geological features. Ore Geol. Rev. 2009, 35, 383–400. [Google Scholar] [CrossRef]
  21. Carranza, E.J.M.; Sadeghi, M. Predictive mapping of prospectivity and quantitative estimation of undiscovered VMS deposits in Skelleft district, (Sweden). Ore Geol. Rev. 2010, 38, 219–241. [Google Scholar] [CrossRef]
  22. Lisitin, V. Spatial data analysis of mineral deposit point patterns: Applications to exploration targeting. Ore Geol. Rev. 2015, 71, 861–881. [Google Scholar] [CrossRef]
  23. Zhang, N.; Zhou, K.; Du, X. Application of fuzzy logic and fuzzy AHP to mineral prospectivity mapping of porphyry and hydrothermal vein copper deposits in the Dananhu-Tousuquan island arc, Xinjiang, NW China. J. Afr. Earth Sci. 2017, 128, 84–96. [Google Scholar] [CrossRef]
  24. Zuo, R.; Zhang, Z.J.; Zhang, D.J.; Carranza, E.J.M.; Wang, H.C. Evaluation of uncertainity in mineral prospectivity mapping due to missing evidence: A case study with skarn-type Fe deposits in Southwestern Fujian Province, China. Ore Geol. Rev. 2015, 71, 502–515. [Google Scholar] [CrossRef]
  25. Brown, W.M.; Groves, D.; Gedeon, T. Use of fuzzy membership input layers to combine subjective geological knowledge and empirical data in a neural network layer method for mineral-potential mapping. Nat. Resour. Res. 2003, 12, 183–200. [Google Scholar] [CrossRef]
  26. Chung, C.F.; Agterberg, F.P. Regression models for estimating mineral resources from geological map data. Math. Geol. 1980, 12, 473–488. [Google Scholar] [CrossRef]
  27. Bonham-Carter, G.F.; Agterberg, F.P.; Wright, D.F. Weights of evidence modeling: A new approach to mapping mineral potential. In Statistical Applications in the Earth Sciences; Agterberg, F.P., Bonham-Carter, G.F., Eds.; Geological Survey of Canada: Ottawa, ON, Canada, 1989; pp. 171–183. [Google Scholar]
  28. Porwal, A.; Carranza, E.J.M.; Hale, M. Artifical neural networks for mineral prospectivity mapping: A case study from Aravalli Province, Western India. Nat. Resour. Res. 2003, 12, 156–171. [Google Scholar]
  29. Harris, J.R.; Wilkinson, L.; Heather, K.; Fumerton, S.; Bernier, M.A.; Ayer, J.; Dahn, R. Application of GIS processing techniques for producing mineral prospectivity maps—A case study: Mesothermal Au in the Swayze greenstone belt, Ontario. Can. J. Earth Sci. 2001, 43, 865–893. [Google Scholar] [CrossRef]
  30. An, P.; Moon, W.; Rencz, A.N. Application of fuzzy theory for integration of geological, geophysical and remotely sensed data. Can. J. Explor. Geophys. 1991, 27, 1–11. [Google Scholar]
  31. Gorsevski, P.V.; Donevska, K.R.; Mitrovski, C.D.; Frizado, J.P. Integrating multi-criteria evaluation techniques with geographic information systems for landfill site selection: A case study using ordered weighted average. Waste Manag. 2012, 32, 287–296. [Google Scholar] [CrossRef] [PubMed]
  32. Zadeh, L.A. Fuzzy Sets. Inf. Control. 1965, 8, 338–353. [Google Scholar] [CrossRef]
  33. Saaty, R.W. The analytic hierarchy process—What is it and how it is used. Math. Model. 1987, 9, 161–176. [Google Scholar] [CrossRef]
  34. Smith, D.J.; Naden, J.; Miles, A.J.; Bennett, H.; Bicknell, S.H. Mass wasting events and their impact on the formation and preservation of submarine ore deposits. Ore Geol. Rev. 2018, 97, 143–151. [Google Scholar] [CrossRef]
  35. Stewart, A.L.; McPhie, J. An upper Pliocene coarse pumice breccia generated by a shallow submarine explosive eruption, Milos, Greece. Bull. Volcanol. 2004, 66, 15–28. [Google Scholar] [CrossRef]
  36. Naden, J.; Kilias, S.P.; Darbyshire, D.B.F. Active geothermal systems with entrained seawater as analogies for transitional continental magmato-hydrothermal and volcanic-hosted massive sulfide mineralisation—The example of Milos Island, Greece. Geology 2005, 33, 541–544. [Google Scholar] [CrossRef]
  37. Kilias, S.P.; Naden, J.; Cheliotis, I.; Shepherd, T.J.; Constandinidou, H.; Crossing, J.; Simos, I. Epithermal gold mineralisation in the active Aegean volcanic arc: The Profitis Ilias deposit, Milos Island, Greece. Miner. Deposita 2001, 36, 32–44. [Google Scholar] [CrossRef]
  38. Alfieris, D. Geological, Geochemical and Mineralogical Studies of Shallow Submarine Epithermal Mineralisation in an Emergent Volcanic Edifice at MILOS Island (Western Side), Greece. Unpublished Ph.D. Thesis, University of Hamburg, Hamburg, Germany, 2006. [Google Scholar]
  39. Alfieris, D.; Voudouris, P. Ore mineralogy of transitional submarine to subaerial magmatic-hydrothermal deposits in W. Milos, Greece. In: Cook, N.G. and Bonev, I., eds., Au-Ag-Te-Se deposits. Geochem. Mineral. Petrol. 2005, 43, 1–6. [Google Scholar]
  40. Alfieris, D.; Voudouris, P.; Spry, P.G. Shallow submarine epithermal Pb–Zn–Cu–Au–Ag–Te mineralization on western Milos Island, Aegean Volcanic Arc, Greece: Mineralogical, geological and geochemical constraints. Ore Geol. Rev. 2013, 53, 159–180. [Google Scholar] [CrossRef]
  41. Marschik, R.; Bauer, T.; Hensler, A.S.; Skarpelis, N.; Holzl, S. Isotope Geochemistry of the Pb-Zn-Ba(-Ag-Au) mineralisation at Triades-Galana, Milos Island, Greece. Resour. Geol. 2010, 60, 335–347. [Google Scholar] [CrossRef]
  42. Papavasiliou, K.; Voudouris, P.; Kanellopoulos, C.; Alfieris, D.; Xydous, S. The Kondaros-Katsimouti intermediate suplfidation Epithermal Pb-Zn-Ag-Mn mineralisation, Western Milos, Greece: New Mineralogical and Geochemical data. Bull. Geol. Soc. Greece 2016, 50, 1959–1968. [Google Scholar] [CrossRef]
  43. Strobl, P.; Muller, A.; Schlapfer, D.; Schaepman, M. Laboratory Calibration and Inflight Validation of the Digital Airborne Imaging Spectrometer DAIS 7915 for the 1996 Flight Season, Algorithms for Multispectral and Hyperspectral Imagery III. SPIE Proc. 1997, 307, 225–235. [Google Scholar]
  44. Ferrier, G.; Wadge, G. The application of imaging spectrometry data to mapping alteration zones associated with gold mineralization in southern Spain. Int. J. Remote Sens. 1996, 17, 331–350. [Google Scholar] [CrossRef]
  45. Green, A.A.; Berman, M.; Switzer, P.; Craig, M.D. A transformation for ordering multispectral data in terms of image quality with implications for noise removal. IEEE Trans. Geosci. Remote Sens. 1988, 26, 65–74. [Google Scholar] [CrossRef] [Green Version]
  46. Boardman, J. Automating spectral unmixing of AVIRIS data using convex geometry concepts. In Proceedings of the Summaries 4th Annual JPL Airborne Geoscience Workshop, Pasadena, CA, USA, 25–29 October 1993; pp. 11–14. [Google Scholar]
  47. Boardman, J.W. Leveraging the high dimensionality of AVIRIS data for improved subpixel target unmixing and rejection of false positives: Mixture tunded matched filtering. In Proceedings of the Summaries of the Seventh JPL Airborne Geoscience Workshop, Pasadena, CA, USA, 12–16 January 1998; NASA Jet Propulsion Laboratory: Pasadena, CA, USA; pp. 55–56. [Google Scholar]
  48. Richter, R.; Schläpfer, D. Atmospheric/Topographic Correction for Airborne Imagery. ATCOR-4 User Guide, Version 6.2.1; DLR-IB 565-02/08; Deutsches Zentrum für Luft- und Raumfahrt (DLR): Weßling, Germany, 2014. [Google Scholar]
  49. Kealy, P.S.; Hook, S.J. Separating temperature and emissivity in thermal infrared multispectral scanner data: Implications for recovering land surface temperatures. IEEE Trans. Geosci. Remote Sens. 1993, 31, 1155–1164. [Google Scholar] [CrossRef]
  50. Hook, S.; Gabell, A.R.; Green, A.A.; Kealy, P.S. A Comparison of Techniques for Extracting Emissivity Information from Thermal Infrared data for geologic studies. Rem. Sen. Environ. 1992, 42, 123–135. [Google Scholar] [CrossRef]
  51. Anguita, F.; Verma, S.P.; Marquez, A.; Vasconcelos, F.M.; Lopez, I.; Laurrieta, A. Circular features in the Trans-Mexican Volcanic Belt. J. Volcanol. Geotherm. Res. 2001, 107, 265–274. [Google Scholar] [CrossRef] [Green Version]
  52. Aydar, E.; Gourgaud, A.; Ulusoy, I.; Digonnet, F.; Labazuy, P.; Sen, E.; Bayhan, H.; Kurttas, T.; Tolluoglu, A.U. Morphological analysis of active Mount Nemrut stratovolcano, eastern Turkey: Evidences and possible impact areas of future eruption. J. Volcanol. Geotherm. Res. 2003, 123, 301–312. [Google Scholar] [CrossRef]
  53. Froger, J.-L.; Lenat, J.-F.; Chorowicz, J.; Le Pennec, J.-L.; Bourdier, J.-L.; Kose, O.; Zimitoğlu, O.; Gundogdu, N.M.; Gourgaud, A. Hidden calderas evidenced by multisource geophysical data; example of Cappadocian Calderas, Central Anatolia. J. Volcanol. Geotherm. Res. 1998, 185, 99–128. [Google Scholar] [CrossRef]
  54. Saintot, A.; Angelier, J.; Chorowicz, J. Mechanical significance of structural patterns identified by remote sensing studies: A multiscale analysis of tectonic structures in Crimea. Tectonophysics 1999, 313, 187–218. [Google Scholar] [CrossRef]
  55. Szekely, B.; Karatson, D. DEM-based morphometry as a tool for reconstructing primary volcanic landforms: Examples from the Borzsony Mountains, Hungary. Geomorphology 2004, 63, 25–37. [Google Scholar] [CrossRef]
  56. Ulusoy, I.; Cubukcu, E.; Aydar, E.; Labazuyb, P.; Gourgaud, A.; Vincent, P.M. Volcanic and deformation history of the Bodrum resurgent caldera system (southwestern Turkey). J. Volcanol. Geotherm. Res. 2004, 136, 71–96. [Google Scholar] [CrossRef]
  57. Clark, R.N.; Swayze, G.A.; Wise, R.; Livo, K.E.; Hoefen, T.M.; Kokaly, R.F.; Sutley, S.J. USGS Digital Spectral Library; Open File Report 03-395; U.S. Geological Survey: Reston, VA, USA, 2003.
  58. Salisbury, J.W. Infrared (2.1–25 µm) spectra of minerals. In Johns Hopkins Studies in Earth and Space Sciences; Johns Hopkins University Press: Baltimore, MD, USA, 1991. [Google Scholar]
  59. Christensen, P.R.; Bandfield, J.L.; Hamilton, V.E.; Howard, D.A.; Lane, M.D.; Piatek, J.L.; Stefanov, W.L. A thermal emission spectral library of rock-forming minerals. J. Geophys. Res. 2000, 105, 9735. [Google Scholar] [CrossRef]
  60. Azizi, H.; Tarverdi, M.A.; Akbarpour, A. Extraction of hydrothermal alterations from ASTER SWIR data from east Zanjan, northern Iran. Adv. Space Res. 2010, 46, 99–109. [Google Scholar] [CrossRef]
  61. Rowan, L.C.; Schmidt, R.G.; Mars, J.C. Distribution of hydrothermally altered rocks in the Reko Diq, Pakistan mineralized area based on spectral analysis of ASTER data. Remote Sens. Environ. 2006, 104, 74–87. [Google Scholar] [CrossRef]
  62. Eastman, J.R.; Kyem, P.A.K.; Toledano, J. Raster procedures for multi-criteria/multi-objective decisions. Photogramm. Eng. Remote Sens. 1995, 61, 539–547. [Google Scholar]
Figure 1. Geological map of Milos: 1—Triades-Galana; 2—Kondaros and inset map showing geographical location M (Modified from [35]).
Geosciences 09 00116 g001
Figure 2. Location map of study area in western Milos showing sample locations and transect locations. Red and green pixels represent silicified and advanced argillic hydrothermal alteration respectively as identified from the Digital Airborne Imaging Spectrometer (DAIS) TIR and Short Wave InfraRed (SWIR) data respectively. Location of faulting, silicified lithocaps were identified by [38] and major breccia bodies by [34].
Geosciences 09 00116 g002
Figure 3. (a) Field Spectra. (b) Field spectra resampled to the DAIS SWIR bandwidths.
Geosciences 09 00116 g003
Figure 4. (a) Laboratory emission spectra of unaltered volcanic and silicified alteration zone. Numbers in labels indicate field site (Table 1). (b) Emission spectra from Milos (shown in Figure 4a) and related emission spectra from the JPL library [57] resampled to the DAIS TIR bandwidths.
Geosciences 09 00116 g004
Figure 5. (a) Transect (A-B) showing topography and silica index. (b) Transect (A-B) west-to-east across silicified Lithocap at Kondaros. Dotted lines show limits of mineralized zone.
Geosciences 09 00116 g005
Figure 6. (a) Transect (C-D) showing topography and silica index. (b) Transect (C-D) from southwest-to-northeast across Silicified Breccia bodies at Triades (B). Dotted lines show limits of mineralized zone.
Geosciences 09 00116 g006
Figure 7. Results of mineral prospectivity mapping (MPM) modelling superimposed on a Digital Elevation Model. The level of modelled mineral prospectivity is scaled from low (green) to high (red) values.
Geosciences 09 00116 g007
Figure 8. Results of MPM modelling overlain by field mapped hydrothermal alteration zones adapted from [38] underlain by a DEM. Red pixels indicate pixels with high values of modelled mineral prospectivity.
Geosciences 09 00116 g008
Table 1. Mineralogy and description of the field locations of samples.
SampleXRD Analyses: Minerals Present in %Location Description
MI-05Alunite (21.8%), Natro-alunite (14.8%), quartz (34.5%), cristobalite (8.5%), tridymite (3.2%), kaolinite (17%),Kaolinite Mine, Advanced Argillic
MI-18Amorphous (47.5%), Andesine (47.5%), Augite (0.9%), Enstatite (4.1%),Dacite
MI-21Quartz (99.7%)Silicified Sinter
MI-22Alunite (29.2%), Natro-alunite (9.3%), quartz (61.2%)Altered volcanics
MI-26Andesine (52.7%), Sanidene (14.7%), Quartz (5%), Cristobalite (22.1%), Hematite (1.8%), Smectite present.Propylitic, Volcanics
MI-28Alunite (22.4%), Natro-alunite (18.2%), Cristobalite (23.7%), Tridymite (28.6%), Quartz (6.7%)Silica Cap rock
MI-30Quartz (61.9%), Barite (38.1%)Fine grained sinter
Table 2. DAIS sensor spectral range specifications.
Wavelength RangeNumber of BandsBandwidths
450–1050 nm3225 nm
1500–1800 nm845 nm
1900–2450 nm3225 nm
3000–5000 nm12.0 µm
8700–12,700 nm60.9 µm
Table 3. Recognition criteria for intermediate-high sulphur epithermal deposits on the Island of Milos, with relative weightings and extent and nature of spatial influence.
FactorWeightSpatial InfluenceFuzzy Function
Volcanic Centres (VC)s: Andesitic-dacitic lava domes1Within andesitic-dacitic lava domesNone-Binary
Topographic Highs:1Within 100 mLinear
Faults: N30 °E- and E-trending faults2Within 200 mLinear
Hydrothermal Alteration: pixels classified as being in the Advanced Argillic Zone2Within pixelNone
Hydrothermal Alteration: pixels classified as silicified lithocaps4Within pixelNone

