
Indoor Air Quality Assessment and Study of Different VOC Contributions within a School in Taranto City, South of Italy


Abstract
:1. Introduction
2. Materials and Methods
3. Results and Discussion
4. Conclusions
Acknowledgments
Author Contributions
Conflicts of Interest
References
- Ezzati, M. Indoor Air Pollution: Developing Countries. Int. Encycl. Public Health 2017. [Google Scholar] [CrossRef]
- Faustman, E.M.; Silbernagel, S.M.; Fenske, R.A.; Burbacher, T.M.; Ponce, R.A. Mechanisms underlying children’s susceptibility to environmental toxicants. Environ. Health. Perspect. 2000, 108, 13–21. [Google Scholar] [CrossRef] [PubMed]
- Dambruoso, P.R.; de Gennaro, G.; Demarinis Loiotile, A.; Di Gilio, A.; Giuncato, P.; Marzocca, A.; Mazzone, A.; Palmisani, J.; Porcelli, F.; Tutino, M. School Air Quality: Pollutants, Monitoring and Toxicity; Pollutant Diseases, Remediation and Recycling—Volume 4 of the Series Environmental Chemistry for a Sustainable World; Springer: Berlin, Germany, 2013; pp. 1–44. [Google Scholar]
- Rivas, I.; Viana, M.; Moreno, T.; Pandolfi, M.; Amato, F.; Reche, C.; Bouso, L.; Àlvarez-Pedrerol, M.; Alastuey, A.; Sunyer, J.; et al. Child exposure to indoor and outdoor air pollutants in schools in Barcelona, Spain. Environ. Int. 2014, 69, 200–212. [Google Scholar] [CrossRef] [PubMed]
- Wargocki, P.; Wyon, D.P. Ten questions concerning thermal and indoor air quality effects on the performance of office work and schoolwork. Build. Environ. 2017, 112, 359e366. [Google Scholar] [CrossRef]
- Stafford, T.M. Indoor air quality and academic performance. J. Environ. Econ. Manag. 2015, 70, 34–50. [Google Scholar] [CrossRef]
- Rosbach, J.T.M.; Vonk, M.; Duijm, F.; van Ginkel, J.T.; Gehring, U.; Brunekreef, B. A ventilation intervention study in classrooms to improve indoor air quality: The FRESH study. Environ. Health 2013, 12, 110. [Google Scholar] [CrossRef] [PubMed]
- De Gennaro, G.; Farella, G.; Marzocca, A.; Mazzone, A.; Tutino, M. Indoor and Outdoor Monitoring of Volatile Organic Compounds in School Buildings: Indicators Based on Health Risk Assessment to Single out Critical Issues. Int. J. Environ. Res. Public Health 2013, 10, 6273–6291. [Google Scholar] [CrossRef] [PubMed]
- Chithra, V.S.; Shiva Nagendra, S.M. Indoor air quality investigations in a naturally ventilated school building located close to an urban roadway in Chennai, India. Build. Environ. 2012, 54, 159–167. [Google Scholar] [CrossRef]
- De Gennaro, G.; Dambruoso, P.R.; Demarinis Loiotile, A.; Di Gilio, A.; Giungato, P.; Marzocca, A.; Mazzone, A.; Palmisani, J.; Porcelli, F.; Tutino, M. Indoor air quality in schools. Environ. Chem. Lett. 2007, 12, 467–482. [Google Scholar] [CrossRef]
- Pegas, P.N.; Nunes, T.; Alves, C.A.; Silva, J.R.; Vieira, S.L.A.; Caseiro, A.; Pio, C.A. Indoor and outdoor characterization of organic and inorganic compounds in city centre and suburban elementary schools of Aveiro, Portugal. Atmos. Environ. 2012, 55, 80e89. [Google Scholar] [CrossRef]
- Pegas, P.N.; Evtyugina, M.G.; Alves, C.A.; Nunes, T.; Cerqueira, M.; Franchi, M.; Pio, C. Outdoor/indoor air quality in primary schools in Lisbon: A preliminary study. Quim. Nova 2010, 33, 1145–1149. [Google Scholar] [CrossRef]
- Godwin, C.; Batterman, S. Indoor air quality in Michigan schools. Indoor Air 2007, 17, 109–121. [Google Scholar] [CrossRef] [PubMed]
- Pegas, P.N.; Alves, C.A.; Evtyugina, M.G.; Nunes, T.; Cerqueira, M.; Franchi, M.; Pio, C.A.; Almeida, S.M.; Freitas, M.C. Indoor air quality in elementary schools of Lisbon in spring. Environ. Geochem. Health 2011, 33, 455e468. [Google Scholar] [CrossRef] [PubMed]
- Santos, J.M.; Mavroidis, I.; Reis, N.C.; Pagel, E.C. Experimental investigation of outdoor and indoor mean concentrations and concentration fluctuations of pollutants. Atmos. Environ. 2011, 45, 6534–6545. [Google Scholar] [CrossRef]
- ISO. ISO 16000-1: Indoor Air—Part 1: General Aspects of Sampling Strategy; ISO: Geneva, Switzerland, 2004. [Google Scholar]
- ISO. ISO 16000-5: Indoor Air—Part 5: Sampling Strategy for Volatile Organic Compounds (VOCs); ISO: Geneva, Switzerland, 2007. [Google Scholar]
- Bruno, P.; Caputi, M.; Caselli, M.; de Gennaro, G.; de Rienzo, M. Reliability of a BTEX radial diffusive sampler for thermal desorption. Atmos. Environ. 2005, 39, 1347–1355. [Google Scholar] [CrossRef]
- Bruno, P.; Caselli, M.; de Gennaro, G.; Iacobellis, S.; Tutino, M. Monitoring of volatile organic compounds in non-residential indoor environments. Indoor Air 2008, 18, 250–256. [Google Scholar] [CrossRef] [PubMed]
- ISO. ISO 16017-2: Indoor, Ambient and Workplace Air—Sampling and Analysis of Volatile Organic Compounds by Sorbent Tube/Thermal Desorption/Capillary Gas Chromatography—Part 2: Diffusive Sampling; ISO: Geneva, Switzerland, 2003. [Google Scholar]
- Radiello. Available online: http://www.radiello.com/english/index_en.htmlS (accessed on 10 December 2016).
- Cetin, E.; Odabasi, M.; Seyfioglu, R. Ambient volatile organic compound (VOC) concentrations around a petrochemical complex and a petroleum refinery. Sci. Total Environ. 2003, 312, 103–112. [Google Scholar] [CrossRef]
- Kalabokas, P.D.; Hatzaianestis, J.; Bartzis, J.G.; Papagiannakopoulos, P. Atmospheric concentrations of saturated and aromatic hydrocarbons around a Greek oil refinery. Atmos. Environ. 2001, 35, 2545–2555. [Google Scholar] [CrossRef]
- Lin, T.Y.; Sree, U.; Tseng, S.H.; Hwa Chiu, K.; Wu, C.H.; Lo, J.G. Volatile organic compound concentrations in ambient air of Kaohsiung petroleum refinery in Taiwan. Atmos. Environ. 2004, 38, 4111–4122. [Google Scholar] [CrossRef]
- Bruno, P.; Caselli, M.; de Gennaro, G.; de Gennaro, L.; Tutino, M. High spatial resolution monitoring of benzene and toluene in the Urban Area of Taranto (Italy). J. Atmos. Chem. 2006, 54, 177–187. [Google Scholar] [CrossRef]
- Tiwari, V.; Hanai, Y.; and Masunaga, S. Ambient levels of volatile organic compounds in the vicinity of petrochemical industrial area of Yokohama, Japan. Air Qual. Atmos. Health 2010, 3, 65–75. [Google Scholar] [CrossRef] [PubMed]
- Caselli, M.; de Gennaro, G.; Marzocca, A.; Trizio, L.; Tutino, M. Assessment of the impact of the vehicular traffic on BTEX concentration in ring roads in urban areas of Bari (Italy). Chemosphere 2010, 81, 306–311. [Google Scholar] [CrossRef] [PubMed]
- Scorecard’s Data Sources—Good Guide. Available online: http://scorecard.goodguide.com/about/txt/data.html (accessed on 9 December 2016).
- Nazaroff, W.W.; Weschler, C.J. Cleaning products and air fresheners: Exposure to primary and secondary air pollutants. Atmos. Environ. 2004, 38, 2841–2865. [Google Scholar] [CrossRef]
- De Gennaro, G.; Amodio, M.; Dambruoso, P.R.; de Gennaro, L.; Demarinis Loiotile, A.; Marzocca, A.; Stasi, F.; Trizio, L.; tutino, M. Indoor air quality (IAQ) assessment in a multistorey shopping mall by high-spatial-resolution monitoring of volatile organic compounds (VOC). Environ. Sci. Pollut. Res. Int. 2014, 21, 13186–13195. [Google Scholar]
- Zhu, J.; Cao, X.L.; Beauchamp, R. Determination of 2-butoxyethanol emissions from selected consumer products and its application in assessment of inhalation exposure associated with cleaning tasks. Environ. Int. 2001, 26, 589–597. [Google Scholar] [CrossRef]
- National Institute of Building Sciences. Reviewing and Refocusing on IAQ in Schools; National Institute of Building Sciences: Washington, DC, USA, 2006. [Google Scholar]


| Compound | Concentration (µg/m3) | ||||||||||||||
|---|---|---|---|---|---|---|---|---|---|---|---|---|---|---|---|
| Classroom 5C | Classroom 5D | Classroom 4C | Corridor | Outdoor | |||||||||||
| Min | Max | Mean | Min | Max | Mean | Min | Max | Mean | Min | Max | Mean | Min | Max | Mean | |
| Methyl-tert-butil- etere | 0.33 | 0.82 | 0.53 | 0.28 | 0.86 | 0.61 | 0.14 | 0.80 | 0.47 | 0.32 | 0.68 | 0.50 | 0.65 | 0.96 | 0.85 |
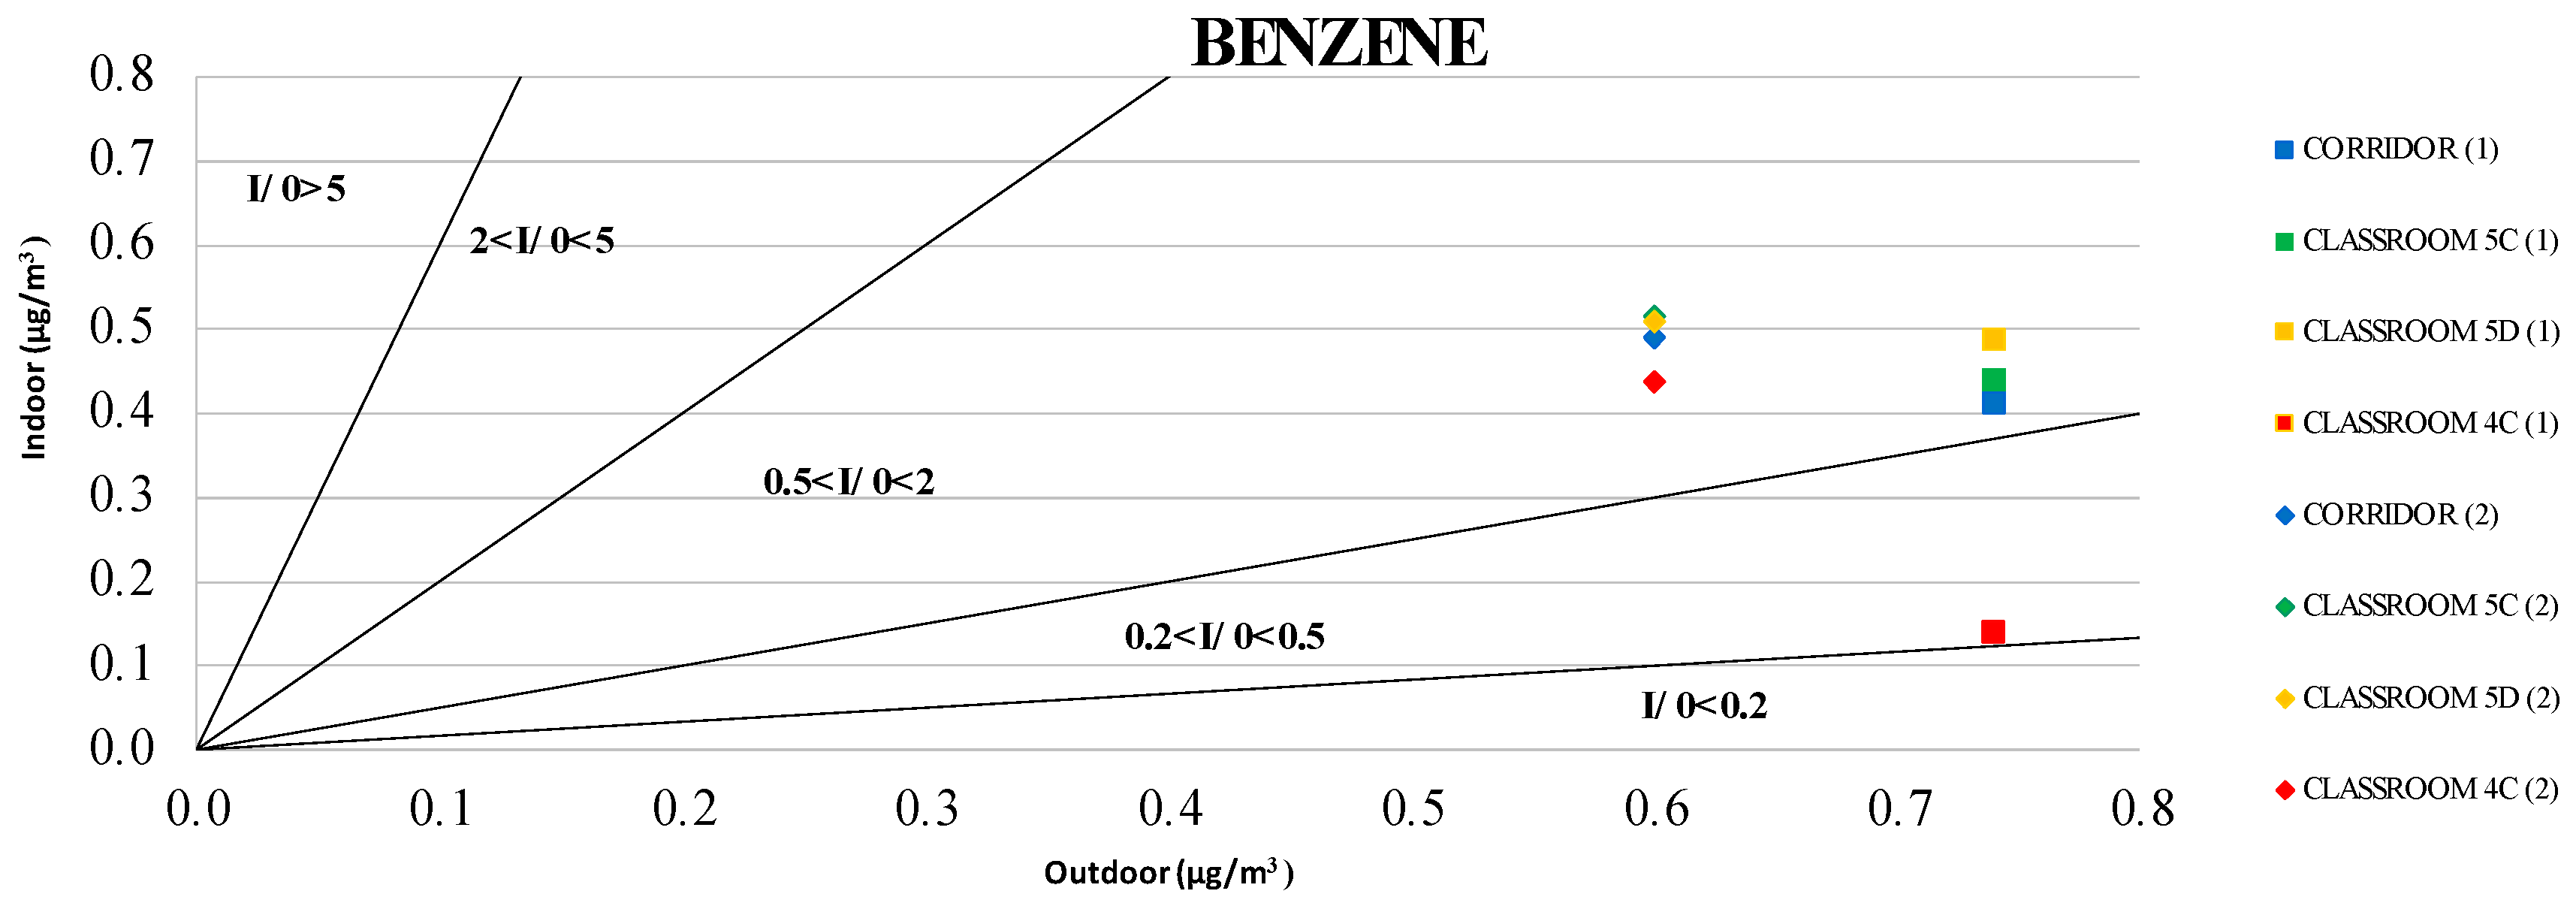
| Benzene | 0.41 | 0.53 | 0.48 | 0.38 | 0.61 | 0.50 | 0.12 | 0.44 | 0.29 | 0.38 | 0.50 | 0.45 | 0.59 | 0.84 | 0.67 |
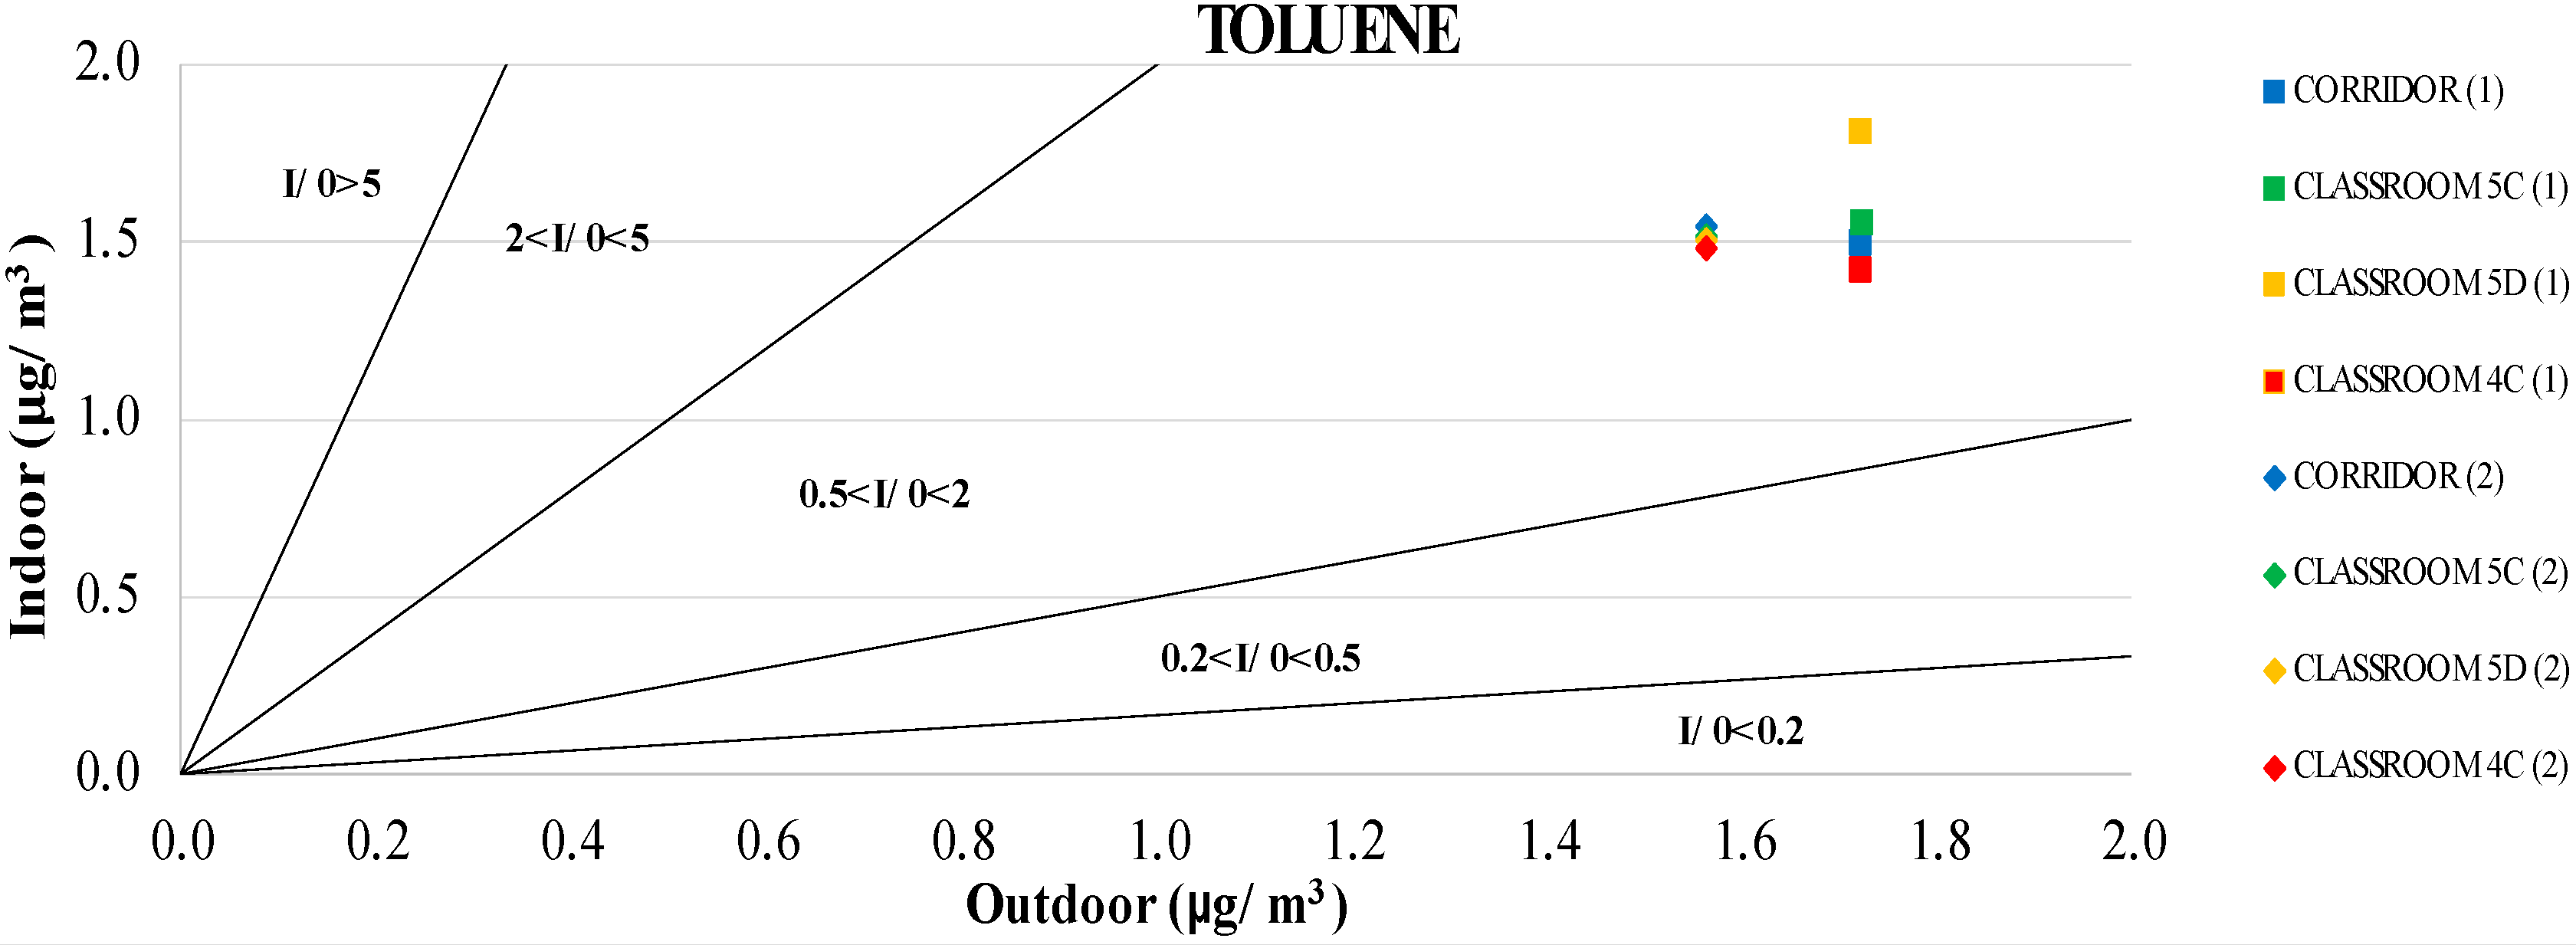
| Toluene | 1.34 | 1.78 | 1.54 | 1.51 | 1.88 | 1.66 | 1.37 | 1.49 | 1.45 | 1.31 | 1.69 | 1.52 | 1.54 | 1.90 | 1.64 |
| N-Octane | 0.21 | 0.56 | 0.40 | 0.11 | 1.25 | 0.61 | 0.23 | 0.36 | 0.26 | 0.21 | 0.35 | 0.28 | 0.20 | 0.35 | 0.26 |
| Tetrachloroethylene | 0.07 | 0.11 | 0.09 | 0.07 | 0.12 | 0.09 | 0.07 | 0.09 | 0.08 | 0.07 | 0.11 | 0.09 | 0.08 | 0.14 | 0.10 |
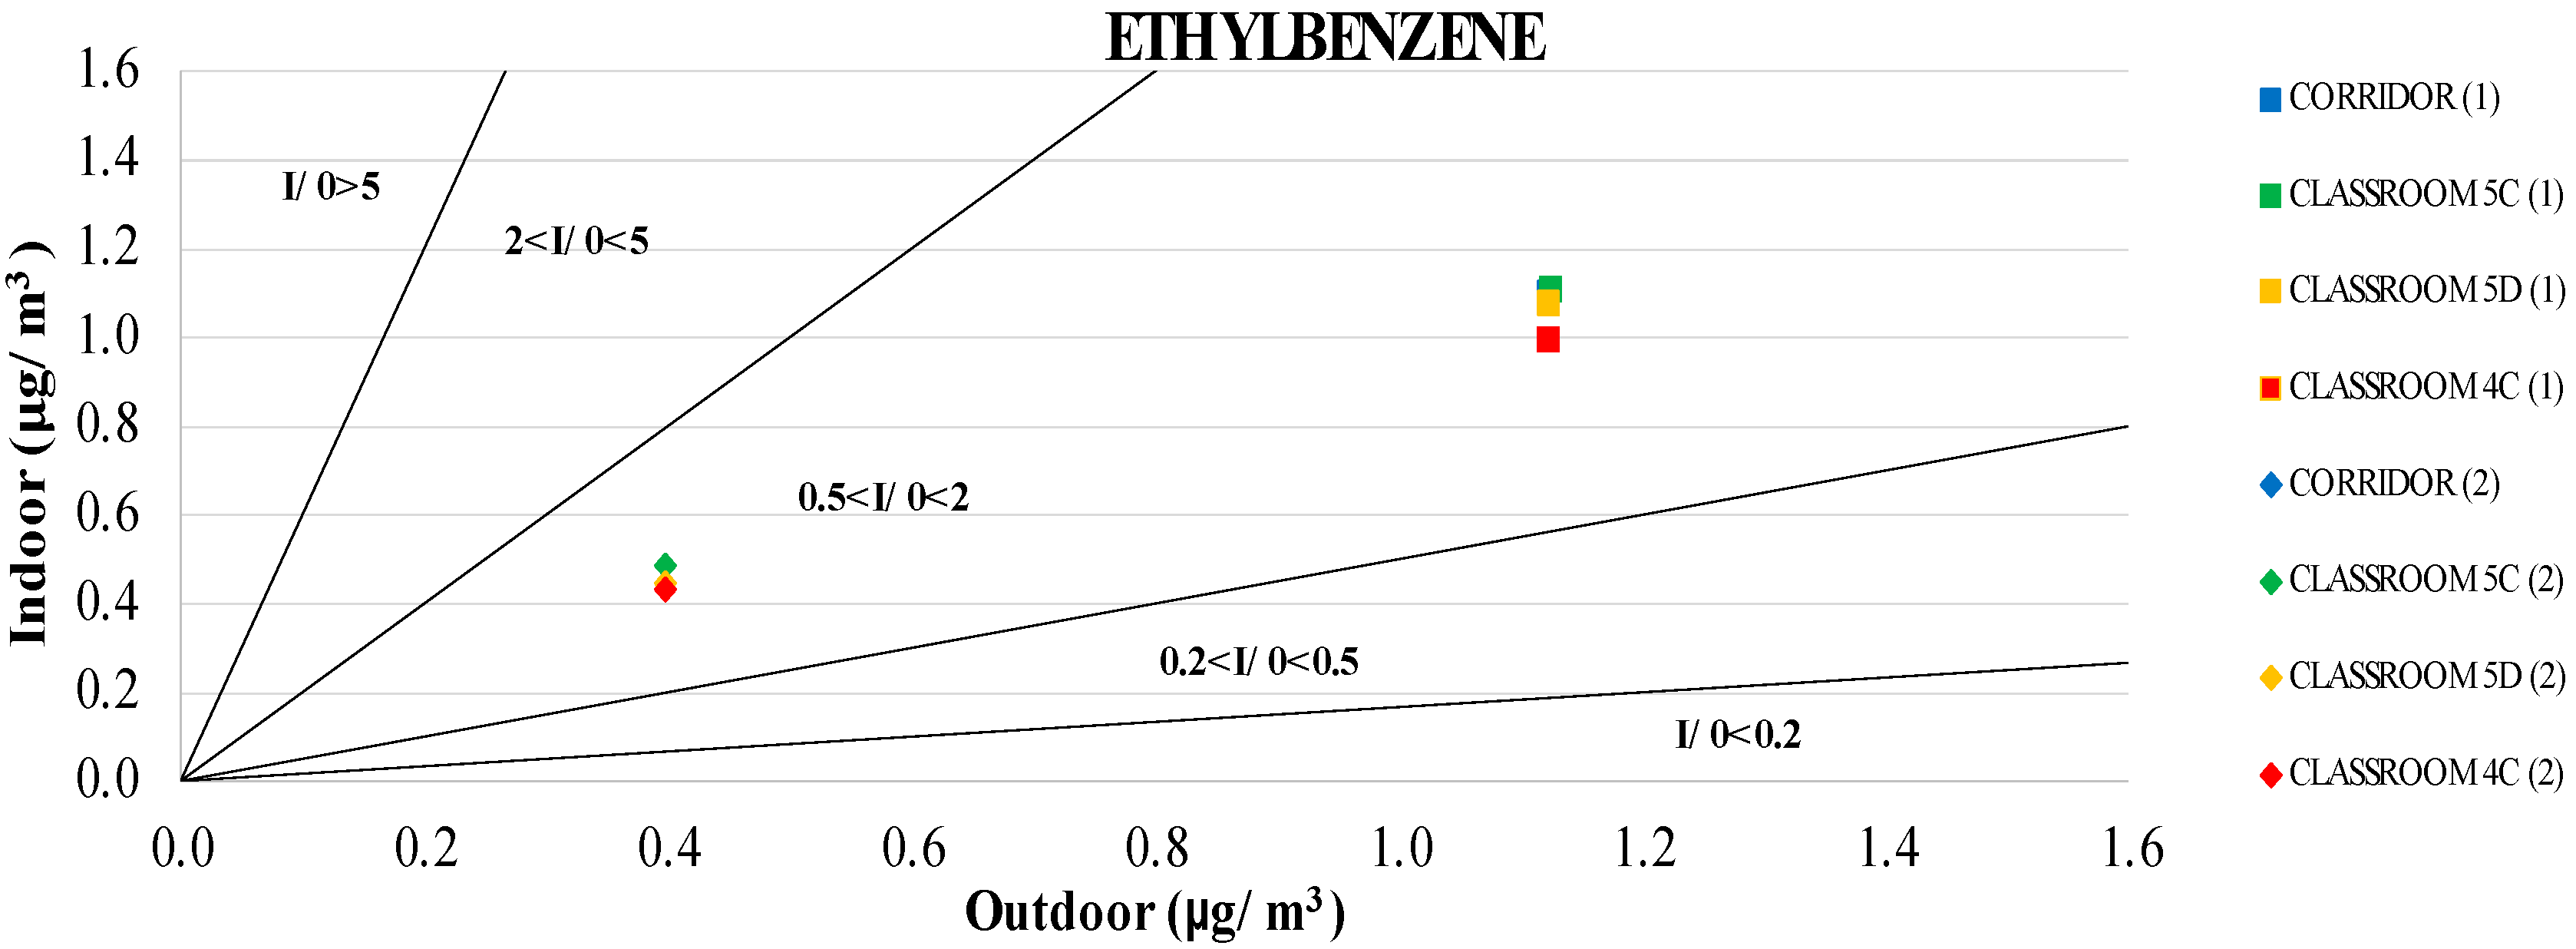
| Ethylbenzene | 0.48 | 1.18 | 0.80 | 0.41 | 1.40 | 0.76 | 0.43 | 1.18 | 0.71 | 0.42 | 1.13 | 0.77 | 0.37 | 1.23 | 0.76 |
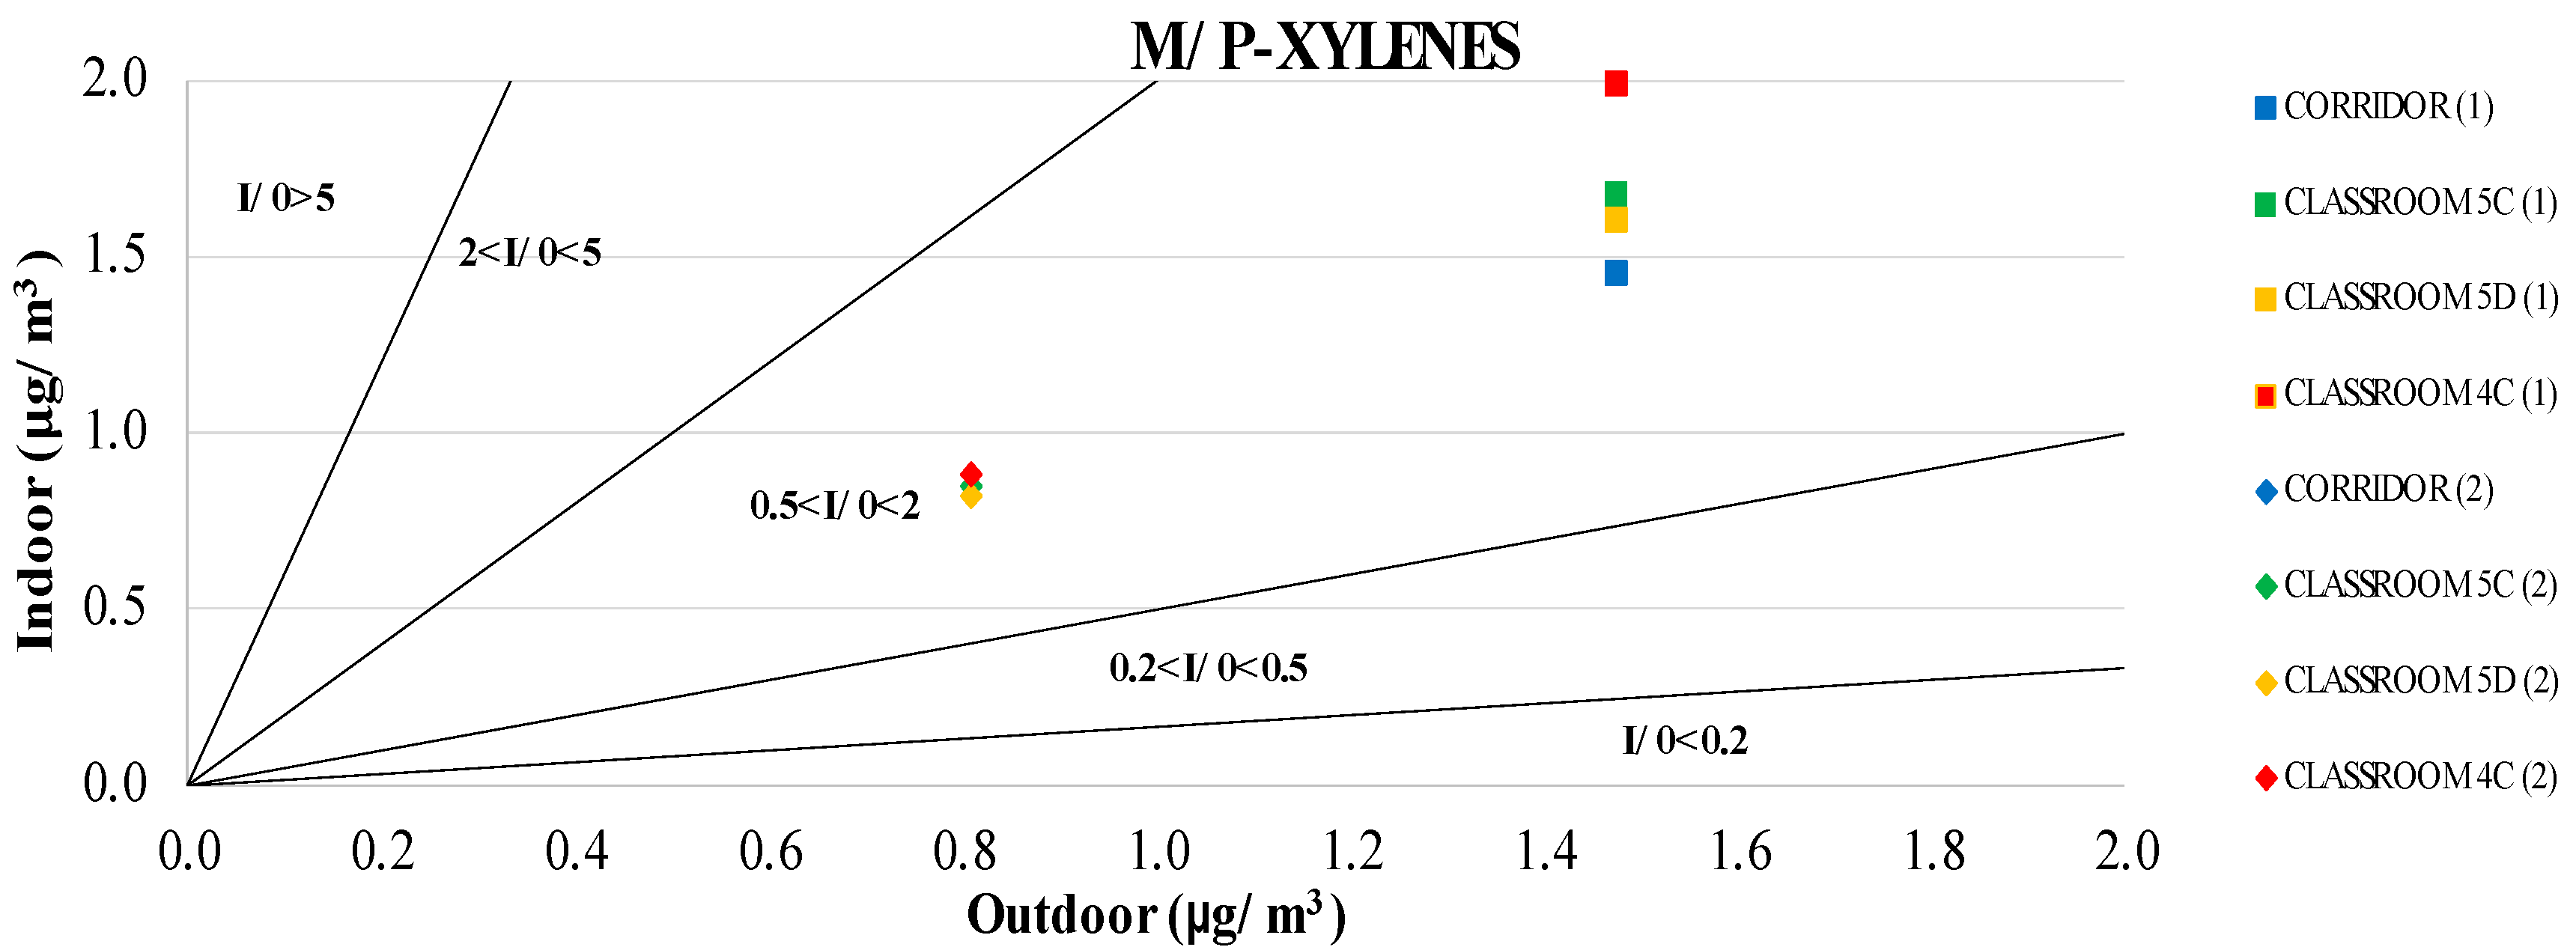
| M/p-Xylenes | 0.85 | 1.74 | 1.27 | 0.79 | 1.64 | 1.21 | 0.89 | 2.20 | 1.44 | 0.81 | 1.45 | 1.14 | 0.78 | 1.54 | 1.14 |
| Styrene | 0.04 | 0.36 | 0.18 | 0.06 | 0.25 | 0.17 | <0.03 * | 0.43 | 0.17 | 0.04 | 0.23 | 0.13 | 0.13 | 0.17 | 0.15 |
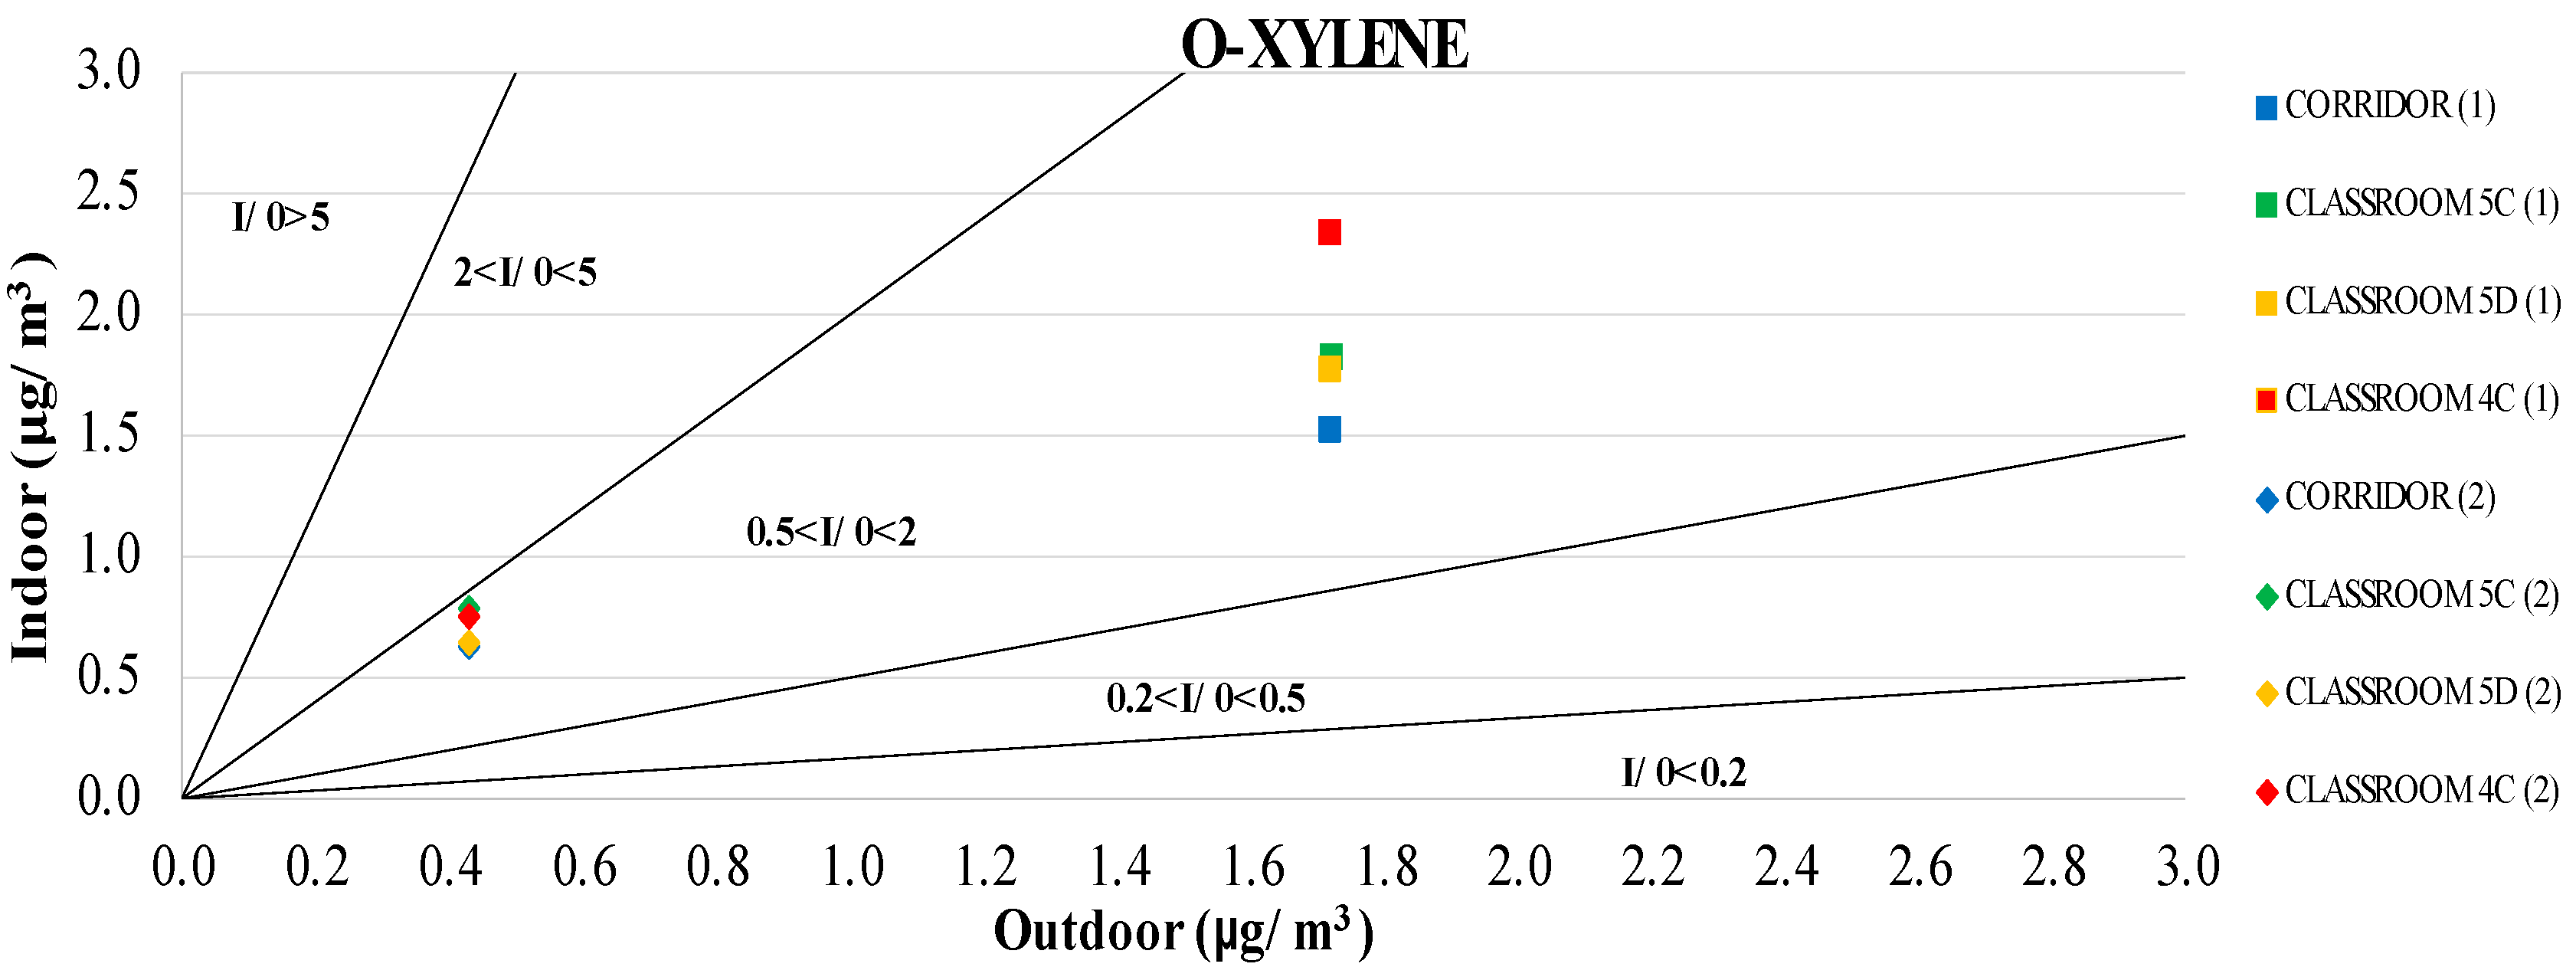
| O-Xylene | 0.76 | 1.90 | 1.30 | 0.60 | 2.00 | 1.21 | 0.75 | 2.63 | 1.54 | 0.59 | 1.72 | 1.07 | 0.43 | 2.03 | 1.08 |
| N-nonane | 0.17 | 1.13 | 0.61 | 0.27 | 2.89 | 1.57 | 0.88 | 1.06 | 0.58 | 0.20 | 1.17 | 0.67 | 0.14 | 0.60 | 0.34 |
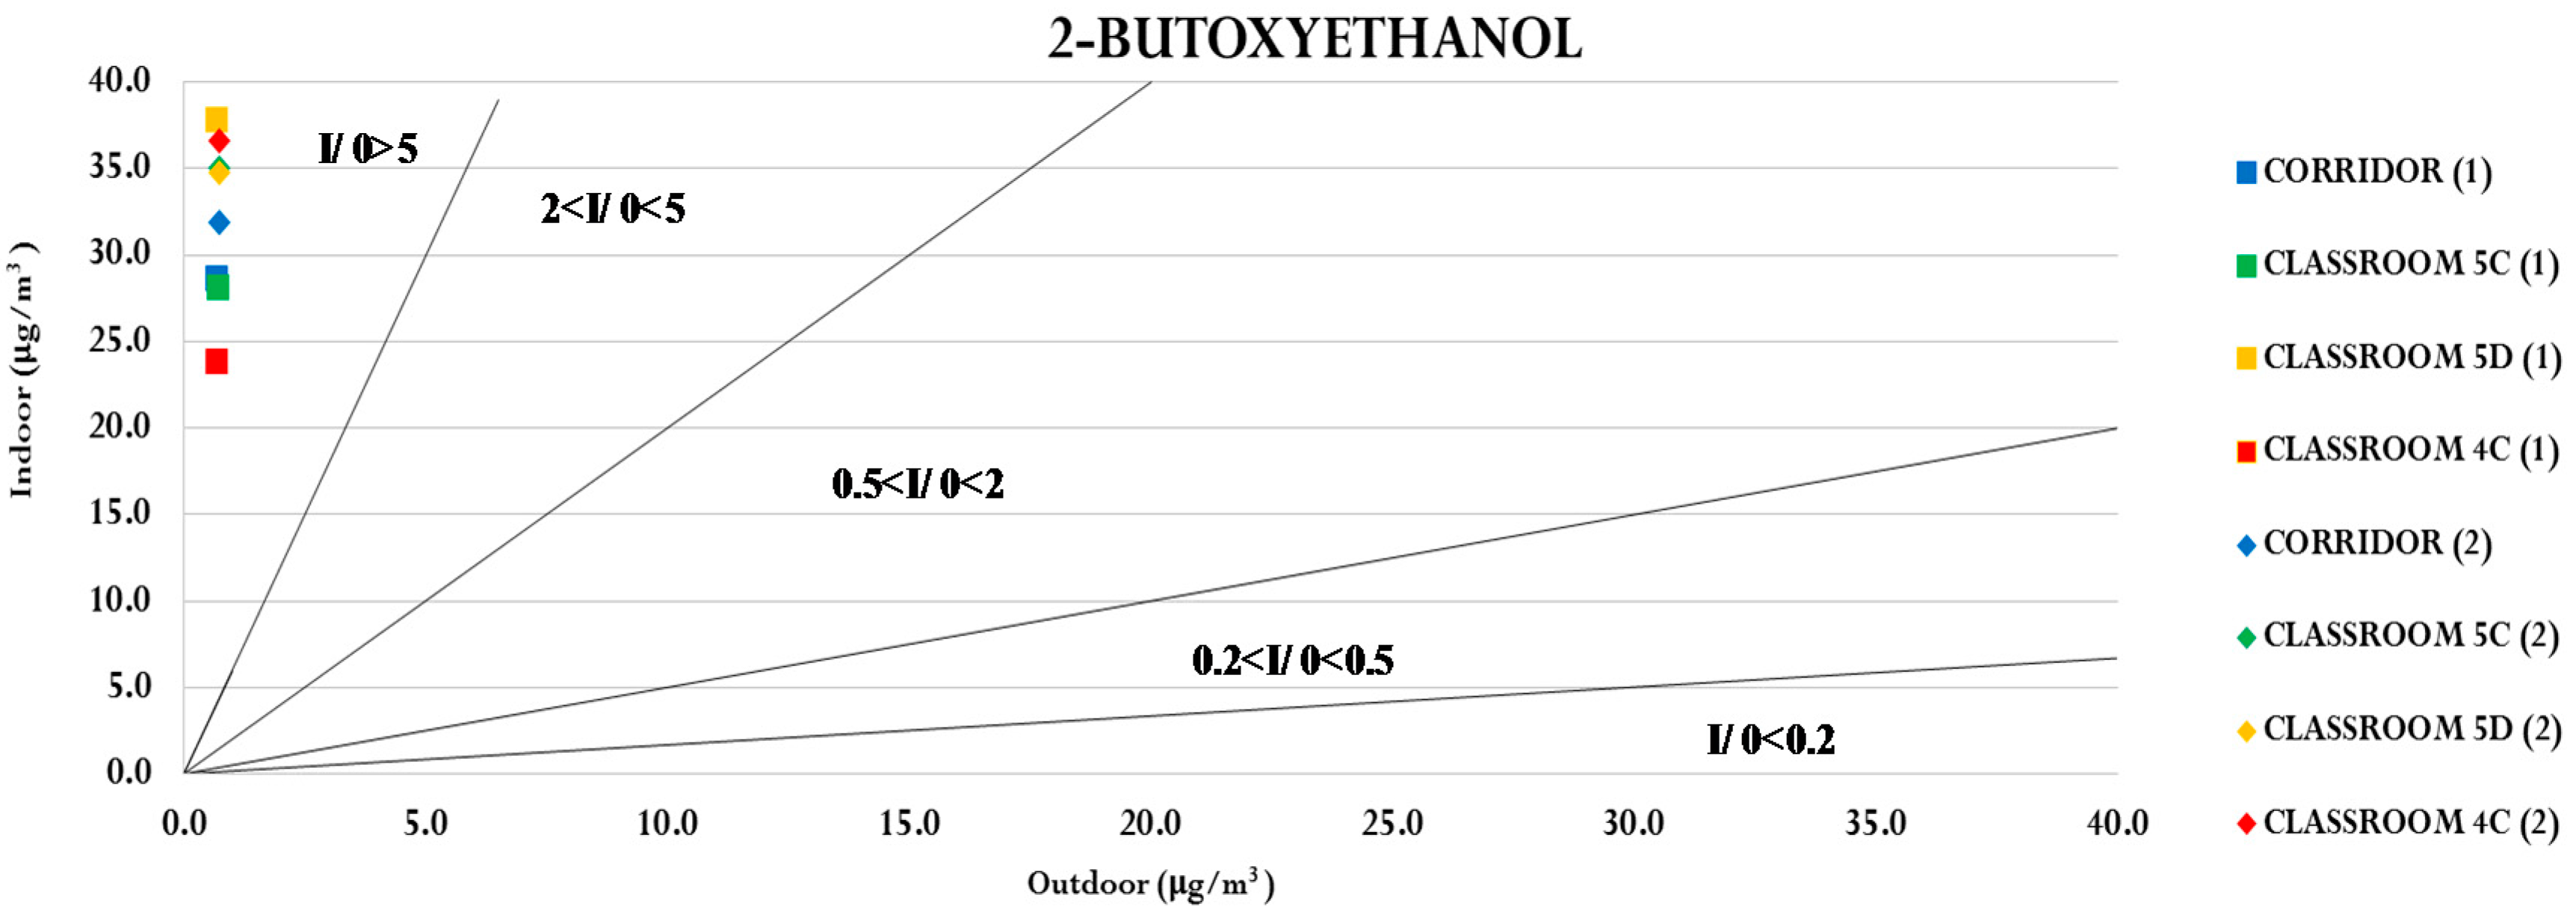
| 2-Butoxyethanol | 27.92 | 35.55 | 31.60 | 33.32 | 46.43 | 36.31 | 23.10 | 36.59 | 30.21 | 28.61 | 33.36 | 30.30 | <0.03 * | 1.37 | 0.71 |
| Alpha pinene | 0.33 | 0.99 | 0.72 | 0.73 | 1.51 | 1.07 | 0.88 | 1.27 | 1.02 | 0.30 | 0.98 | 0.60 | <0.03 * | 0.15 | 0.06 |
| Camphene | 1.67 | 3.35 | 2.54 | 1.57 | 3.04 | 2.43 | 0.90 | 2.14 | 1.38 | 4.82 | 6.02 | 5.30 | 0.06 | 0.15 | 0.10 |
| 1,2,4-Trimethylbenzene | 0.56 | 4.55 | 2.12 | 0.51 | 2.98 | 1.69 | 0.59 | 5.80 | 2.71 | 0.63 | 2.70 | 1.67 | 0.48 | 4.09 | 2.29 |
| N-Decane | 0.13 | 1.65 | 0.85 | 0.23 | 2.81 | 1.51 | 0.15 | 1.61 | 0.86 | 0.19 | 2.04 | 1.08 | 0.12 | 0.62 | 0.37 |
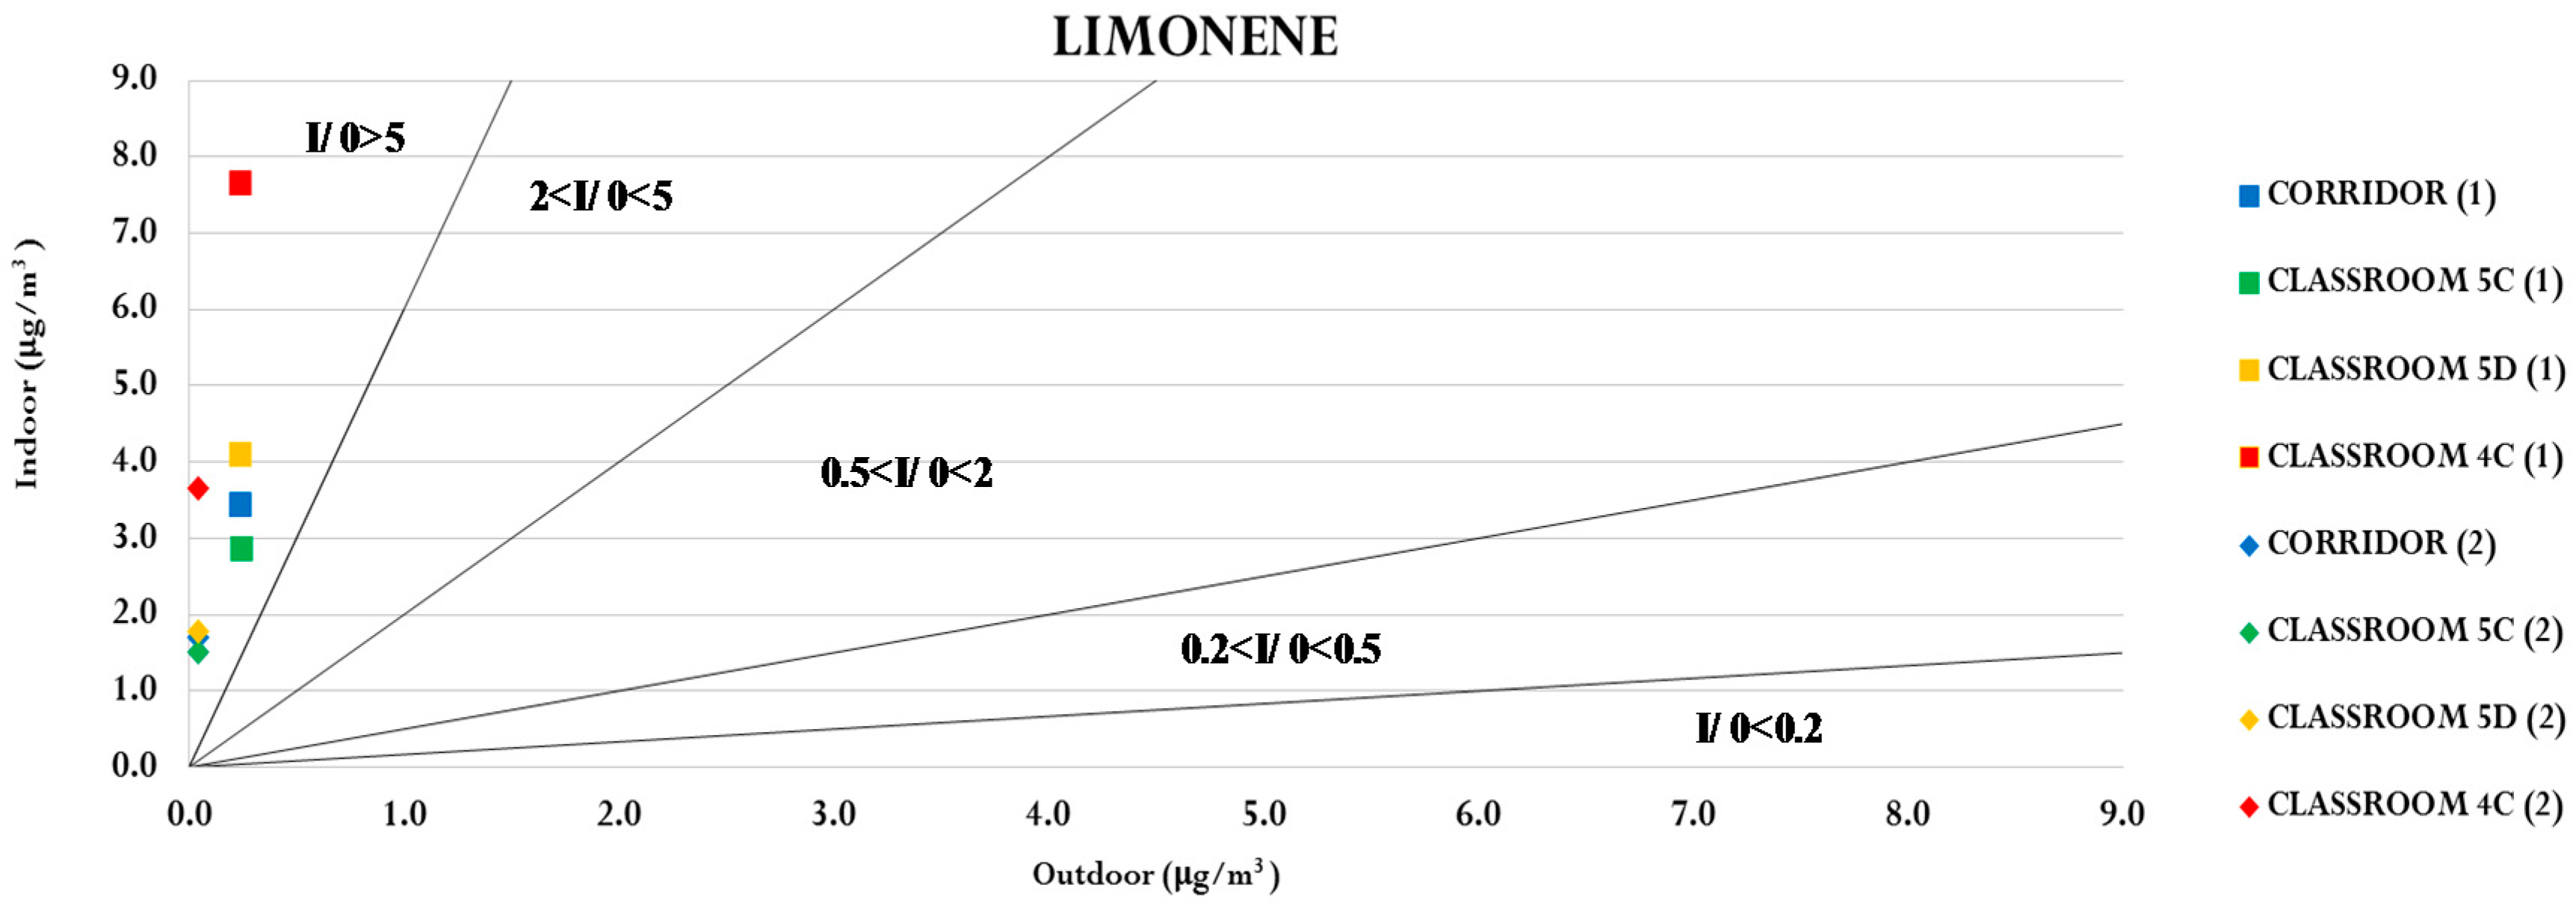
| Limonene | 1.14 | 3.75 | 2.19 | 1.33 | 4.53 | 2.94 | 3.65 | 7.98 | 5.66 | 1.65 | 3.56 | 2.57 | <0.05 * | 0.24 | 0.08 |
| Concentration µg/m3 | ||||||||||||||||||||||||||||
|---|---|---|---|---|---|---|---|---|---|---|---|---|---|---|---|---|---|---|---|---|---|---|---|---|---|---|---|---|
| Compuond | This Study | a | b (School 1) | b (School 2) | b (School 3) | c | d (School 1) | d (School 2) | d (School 3) | d (School 4) | d (School 5) | d (School 6) | d (School 7) | d (School 8) | ||||||||||||||
| In | Out | In | Out | In | Out | In | Out | In | Out | In | Out | In | Out | In | Out | In | Out | In | Out | In | Out | In | Out | In | Out | In | Out | |
| Methyl-tert-butil-etere | 0.52 | 0.85 | ||||||||||||||||||||||||||
| Benzene | 0.44 | 0.67 | 0.31 | 0.36 | 2.88 | <LOD | 3.01 | 3.13 | 2.54 | 2.46 | 0.09 | 0.06 | 0.59 | 0.55 | 1.27 | 0.62 | 3.11 | 0.44 | 0.32 | 1.00 | 0.60 | 0.81 | 0.77 | 0.60 | 0.18 | 0.37 | 0.08 | 0.14 |
| Toluene | 1.54 | 1.64 | 3.44 | 0.71 | 10.3 | 2 | 2.51 | 2.58 | 4.59 | 2.93 | 2.81 | 0.52 | 2.07 | 2.06 | 2.43 | 1.29 | 1.40 | 0.73 | 1.44 | 5.62 | 3.70 | 2.47 | 5.47 | 1.63 | 0.85 | 0.73 | 0.85 | 0.83 |
| N-Octane | 0.35 | 0.26 | ||||||||||||||||||||||||||
| Tetrachloroethylene | 0.09 | 0.10 | 0.02 | <0.01 | 0.51 | 0.41 | 1.21 | 0.23 | 0.85 | 0.10 | 0.1 | 0.69 | 0.19 | 0.14 | 0.29 | 0.31 | 0.11 | 0.07 | 0.15 | 0.17 | ||||||||
| Ethylbenzene | 0.76 | 0.76 | 0.24 | <0.01 | 0.49 | 0.43 | 1.31 | 0.28 | 0.42 | 0.15 | 0.36 | 1.70 | 0.56 | 0.47 | 1.03 | 0.38 | 0.22 | 0.20 | 0.21 | 0.19 | ||||||||
| M/p-xylenes | 1.22 | 1.14 | 0.32 | 8.8 | 1.22 | 1.42 | 1.26 | 2.82 | 1.78 | 2.3 | 1.47 | 1.46 | 1.83 | 0.89 | 10.81 | 0.41 | 0.65 | 2.38 | 1.80 | 1.65 | 3.75 | 1.13 | 0.65 | 0.57 | 0.58 | 0.60 | ||
| Styrene | 0.15 | 0.15 | 0.04 | <0.01 | 0.73 | 0.45 | 1.24 | 0.21 | 0.17 | 0.14 | 0.29 | 1.26 | 0.31 | 0.18 | 0.46 | 0.26 | 0.18 | 0.16 | 0.13 | 0.12 | ||||||||
| O-Xylene | 1.21 | 1.08 | 3.09 | 0.39 | 1.05 | 0.46 | 5.45 | 0.57 | 0.24 | <0.01 | ||||||||||||||||||
| N-Nonane | 0.80 | 0.34 | 0.8 | |||||||||||||||||||||||||
| 2-Butoxyethanol | 31.5 | 0.71 | ||||||||||||||||||||||||||
| Alpha pinene | 0.77 | 0.06 | 3.66 | 0.5 | 0.15 | 4.27 | 0.16 | 1.35 | 0.11 | 20.37 | <0.03 | 4.97 | 2.89 | 1.36 | 0.27 | 4.99 | 3.08 | 1.07 | 0.23 | 2.85 | <0.03 * | 2.59 | 0.34 | 1.33 | 0.72 | |||
| Camphene | 3.71 | 0.10 | 2.66 | 15.22 | 5.24 | 0.51 | 0.70 | 0.29 | 3.16 | 3.62 | 1.97 | 0.12 | 1.87 | 0.04 | 10.01 | 0.68 | 1.32 | 1.32 | ||||||||||
| 1,2,4-Trimethylbenzene | 1.92 | 2.29 | 0.07 | |||||||||||||||||||||||||
| N-Decane | 1.08 | 0.37 | 1 | 0.4 | 0.46 | 0.3 | 1.71 | 0.65 | 2.97 | 0.34 | 1.23 | 1.61 | 2.41 | 0.52 | 3.59 | 4.74 | 3.65 | 0.38 | 1.6 | 0.38 | 1.66 | 0.43 | 1.18 | 0.50 | ||||
| Limonene | 3.08 | 0.08 | 3.17 | 0.39 | 86 | 4.41 | 1.2 | 18.27 | 32.15 | 10.10 | 10.25 | 4.15 | 1.03 | 7.34 | 10.51 | 3.26 | 0.36 | 3.52 | 0.08 | 5.16 | 1.22 | 1.96 | 1.01 | |||||
© 2017 by the authors. Licensee MDPI, Basel, Switzerland. This article is an open access article distributed under the terms and conditions of the Creative Commons Attribution (CC BY) license ( http://creativecommons.org/licenses/by/4.0/).
Share and Cite
Marzocca, A.; Di Gilio, A.; Farella, G.; Giua, R.; De Gennaro, G. Indoor Air Quality Assessment and Study of Different VOC Contributions within a School in Taranto City, South of Italy. Environments 2017, 4, 23. https://doi.org/10.3390/environments4010023
Marzocca A, Di Gilio A, Farella G, Giua R, De Gennaro G. Indoor Air Quality Assessment and Study of Different VOC Contributions within a School in Taranto City, South of Italy. Environments. 2017; 4(1):23. https://doi.org/10.3390/environments4010023
Chicago/Turabian StyleMarzocca, Annalisa, Alessia Di Gilio, Genoveffa Farella, Roberto Giua, and Gianluigi De Gennaro. 2017. "Indoor Air Quality Assessment and Study of Different VOC Contributions within a School in Taranto City, South of Italy" Environments 4, no. 1: 23. https://doi.org/10.3390/environments4010023