1. Introduction
Time and frequency distribution is a key enabling technology for remote clock synchronization, which finds applications in telecommunication, navigation, grid deployment, remote sensing, precision measurement, and fundamental research. With the advent of optical atomic clocks [
1,
2,
3,
4] and their much higher stability over traditional atomic clocks operating at microwave frequencies, it has become increasingly clear that future remote clock synchronization, especially on the backbone level, must be accomplished in the optical domain.
Recently, remote distribution of optical-frequency references has attracted considerable interest [
5,
6,
7,
8,
9,
10,
11,
12,
13,
14,
15,
16,
17,
18,
19]. There are in general two possible transfer media:
optical fiber and
free space. An optical fiber provides a light transfer path isolated from the surrounding environment, minimizing excess noises added to the clock signals during beam propagation and hence maximizing the fidelity of the delivered frequency references. Coherent optical links spanning well over 100 km have been experimentally demonstrated by a number of groups [
5,
6,
7,
8,
9]. On the other hand, free-space clock distribution benefits from its flexibility and low overhead cost, and has proved to be a feasible option for short-distance,
ad hoc networks or networks among mobile hubs, despite its much poorer link fidelity due primarily to air turbulence [
15,
16,
17,
18,
19]. It is also the only option for space-terrestrial network synchronization [
17].
So far, most of the effort in both fiber-optic and free-space clock distribution has been devoted to the realization of faithful delivery of a
single-frequency optical carrier [
5,
6,
7,
8,
9,
10,
15,
17]. An alternative approach, meanwhile, transfers
multiple frequency references simultaneously in the form of an optical frequency comb (OFC) [
13,
14,
16,
18,
19]. The advantage of the latter scheme rests on its ability to directly synchronize clocks operating at different wavelengths, for example between an Hg
+ clock and a Ca clock [
20], or even in different domains, for example between an optical atomic clock and a traditional atomic clock, such as a Cs clock [
1]. As a result, direct distribution of an OFC can potentially suit a broader range of network synchronization scenarios.
One of the most important issues in remote clock distribution is the
excess phase noise, which refers to the extra phase noise added to the original highly-coherent frequency references by the transfer media due to fluctuations inherent to them or external perturbations. For a multifrequency clock transfer scheme, characterizing the excess phase noise is more challenging because multiple waves are simultaneously involved and the phase noise added by the transfer medium to each wave may not necessarily be the same. On top of that, dispersion could further complicate the problem. Therefore, in general, the instability of a multi-frequency clock transfer link is characterized by the long-term error of the clock (e.g., the Allan deviation) rather than the phase noise spectrum [
13]. However, under certain conditions, phase noise can be directly measured in a multifrequency scheme with a well-defined meaning.
We have recently proposed a multiheterodyne technique for direct phase noise characterization of a multifrequency clock distribution system [
19]. In essence, multiheterodyne is a generalization of the optical heterodyne technique used for characterizing single-carrier clock distribution systems [
14]. It measures the coherent superposition of the optical heterodyne signals generated by multiple frequency components. When the refractive index fluctuation of the transfer medium is small enough so that its impact to all of the involved frequency components can be treated as approximately equal, the multiheterodyne signal becomes a close representation of the optical heterodyne signal produced by individual frequency components [
19].
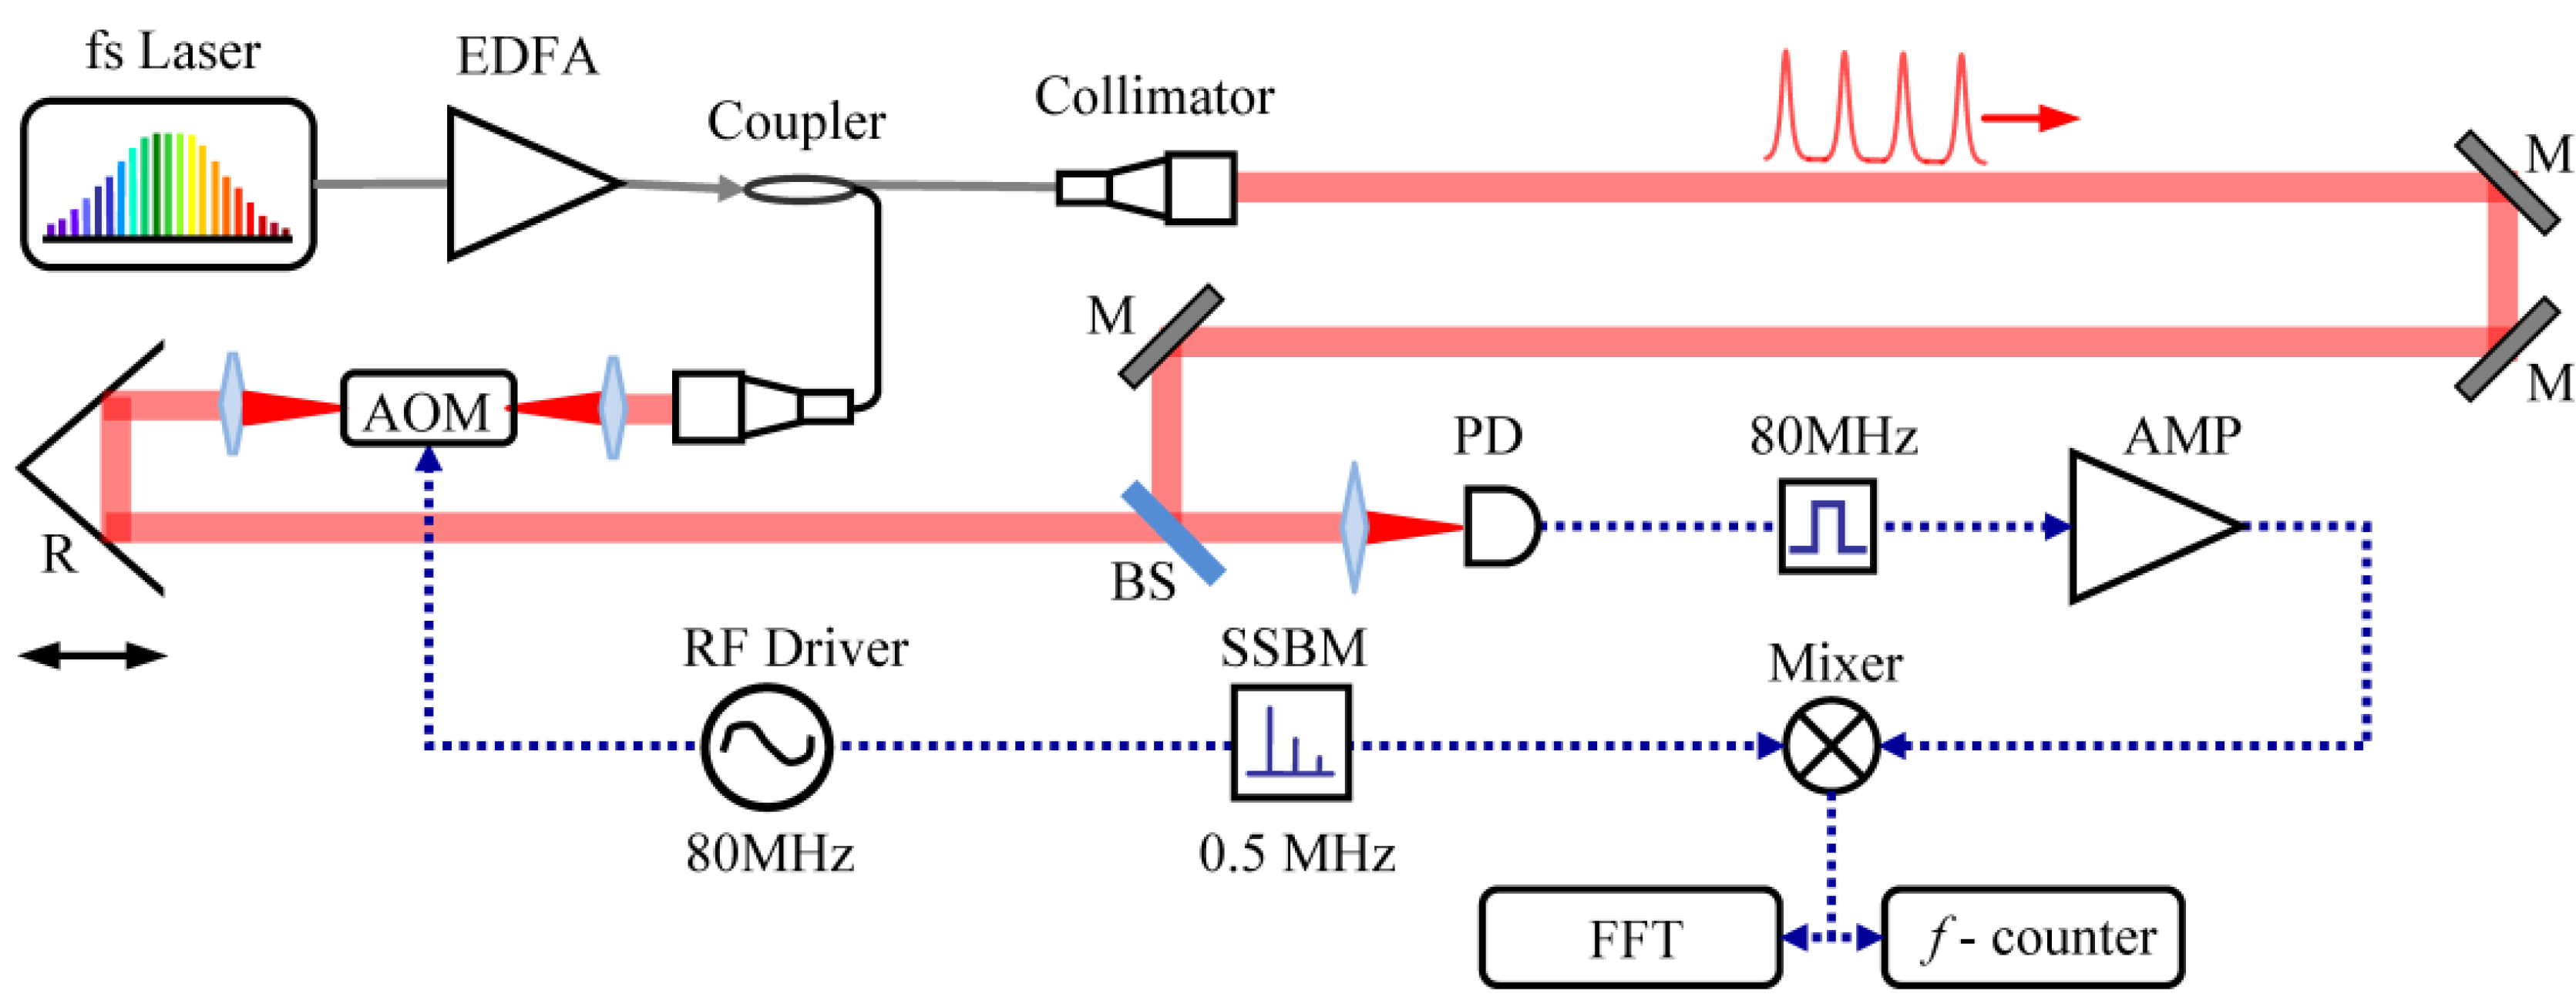
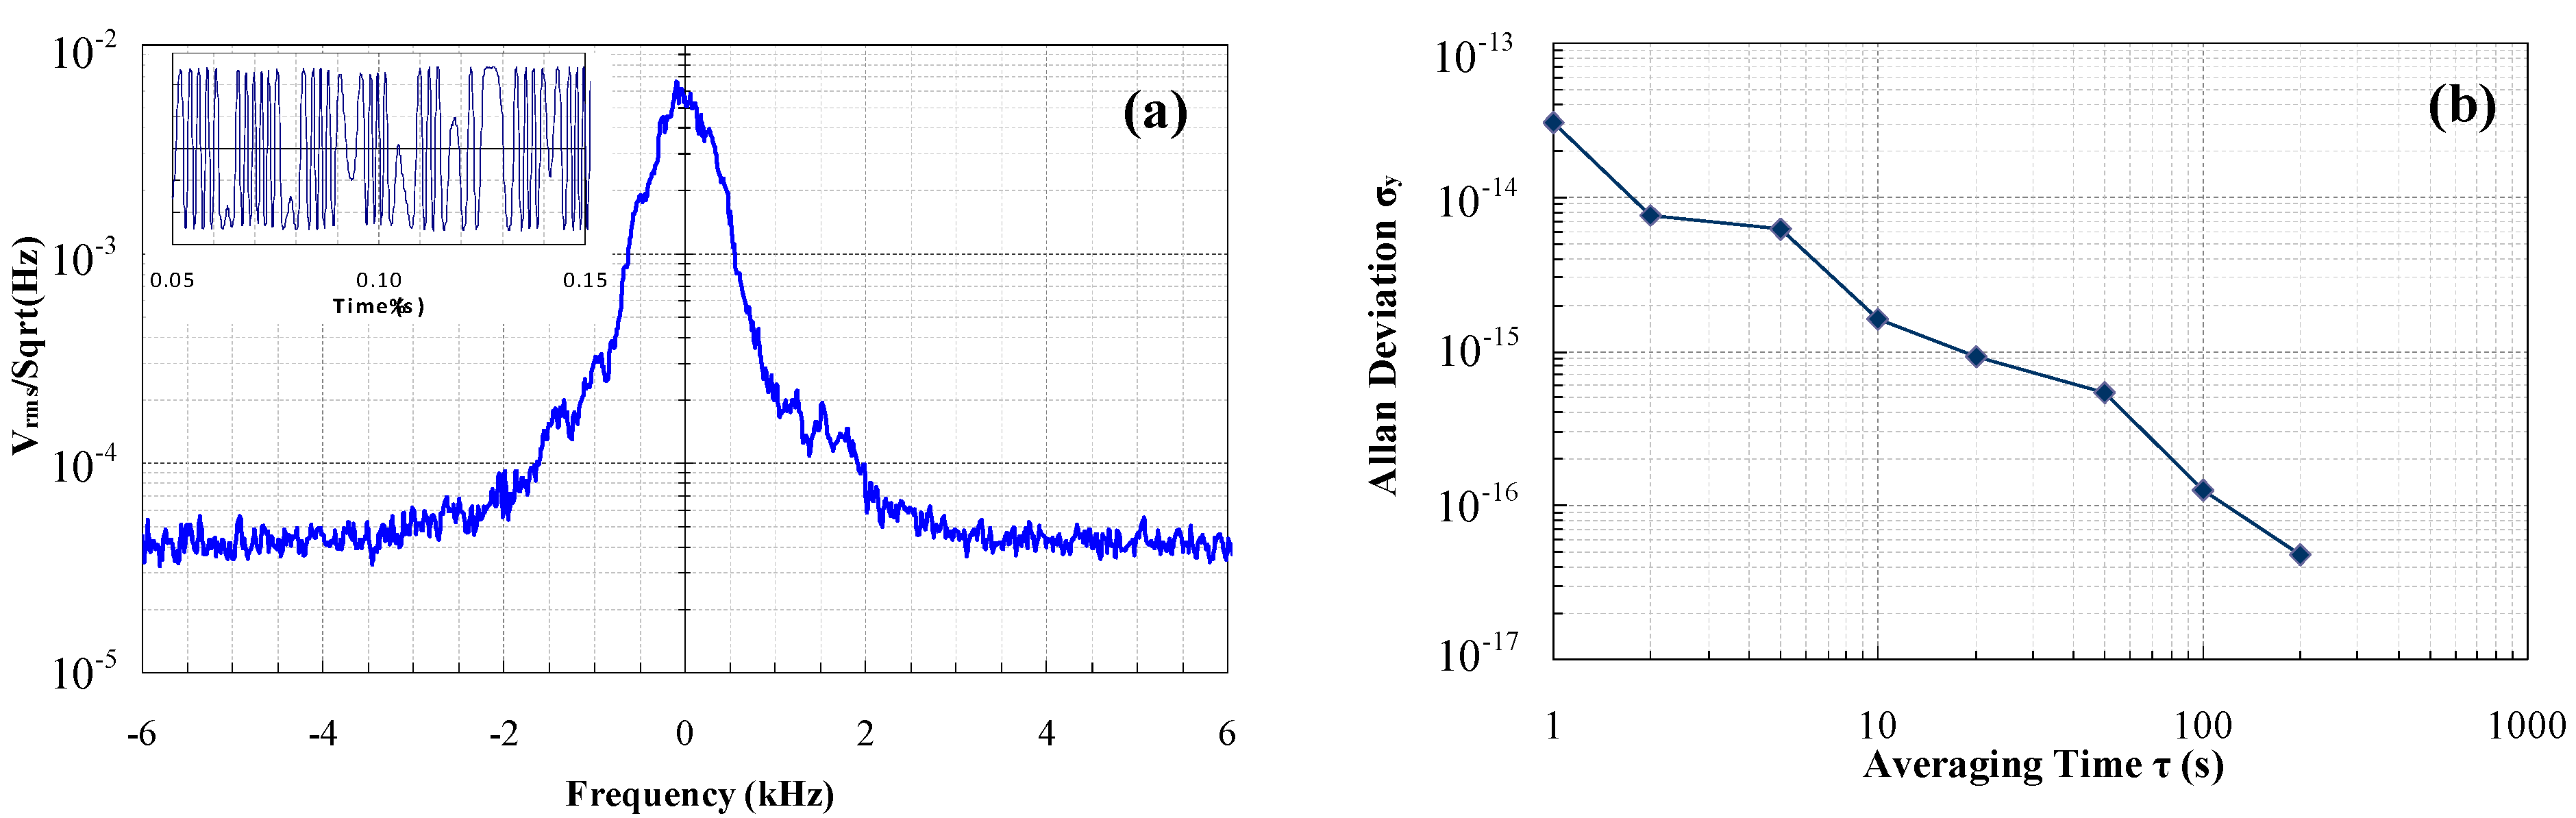
Here we report our experiments on multiheterodyne characterization of the excess phase noise in both fiber-optic and free-space distributions of an OFC. In fiber-optic distribution, we introduced an external, monotone acoustic perturbation and studied its impact on the phase noise spectrum and the total rms noise amplitude. In free-space distribution, we delivered a femtosecond pulse train from an OFC laser across a 60 m rooftop atmospheric link and measured the spectral broadening and phase noise spectra caused by turbulence. Our results demonstrate the effectiveness of multiheterodyne in characterizing the excess phase noise in various settings of multifrequency remote clock transfer.
2. Fiber-Optic Distribution
In the case of fiber-optic clock distribution, the focus of our work is on quantifying the effects of external acoustic perturbations on the phase noise of optical clock signals propagating in a fiber link. The work shares some similarities with the 1992 experiment by Pang
et al. [
21] but focuses on the contemporary topic of fiber-optic remote transfer of an OFC.
2.1. Experimental Setup
In our experiment, we let a frequency comb propagate through a section of fiber and use a loudspeaker to introduce various types of acoustic perturbations to the fiber. We then compare the output from the fiber with the original comb to find out the amount of excess noise.
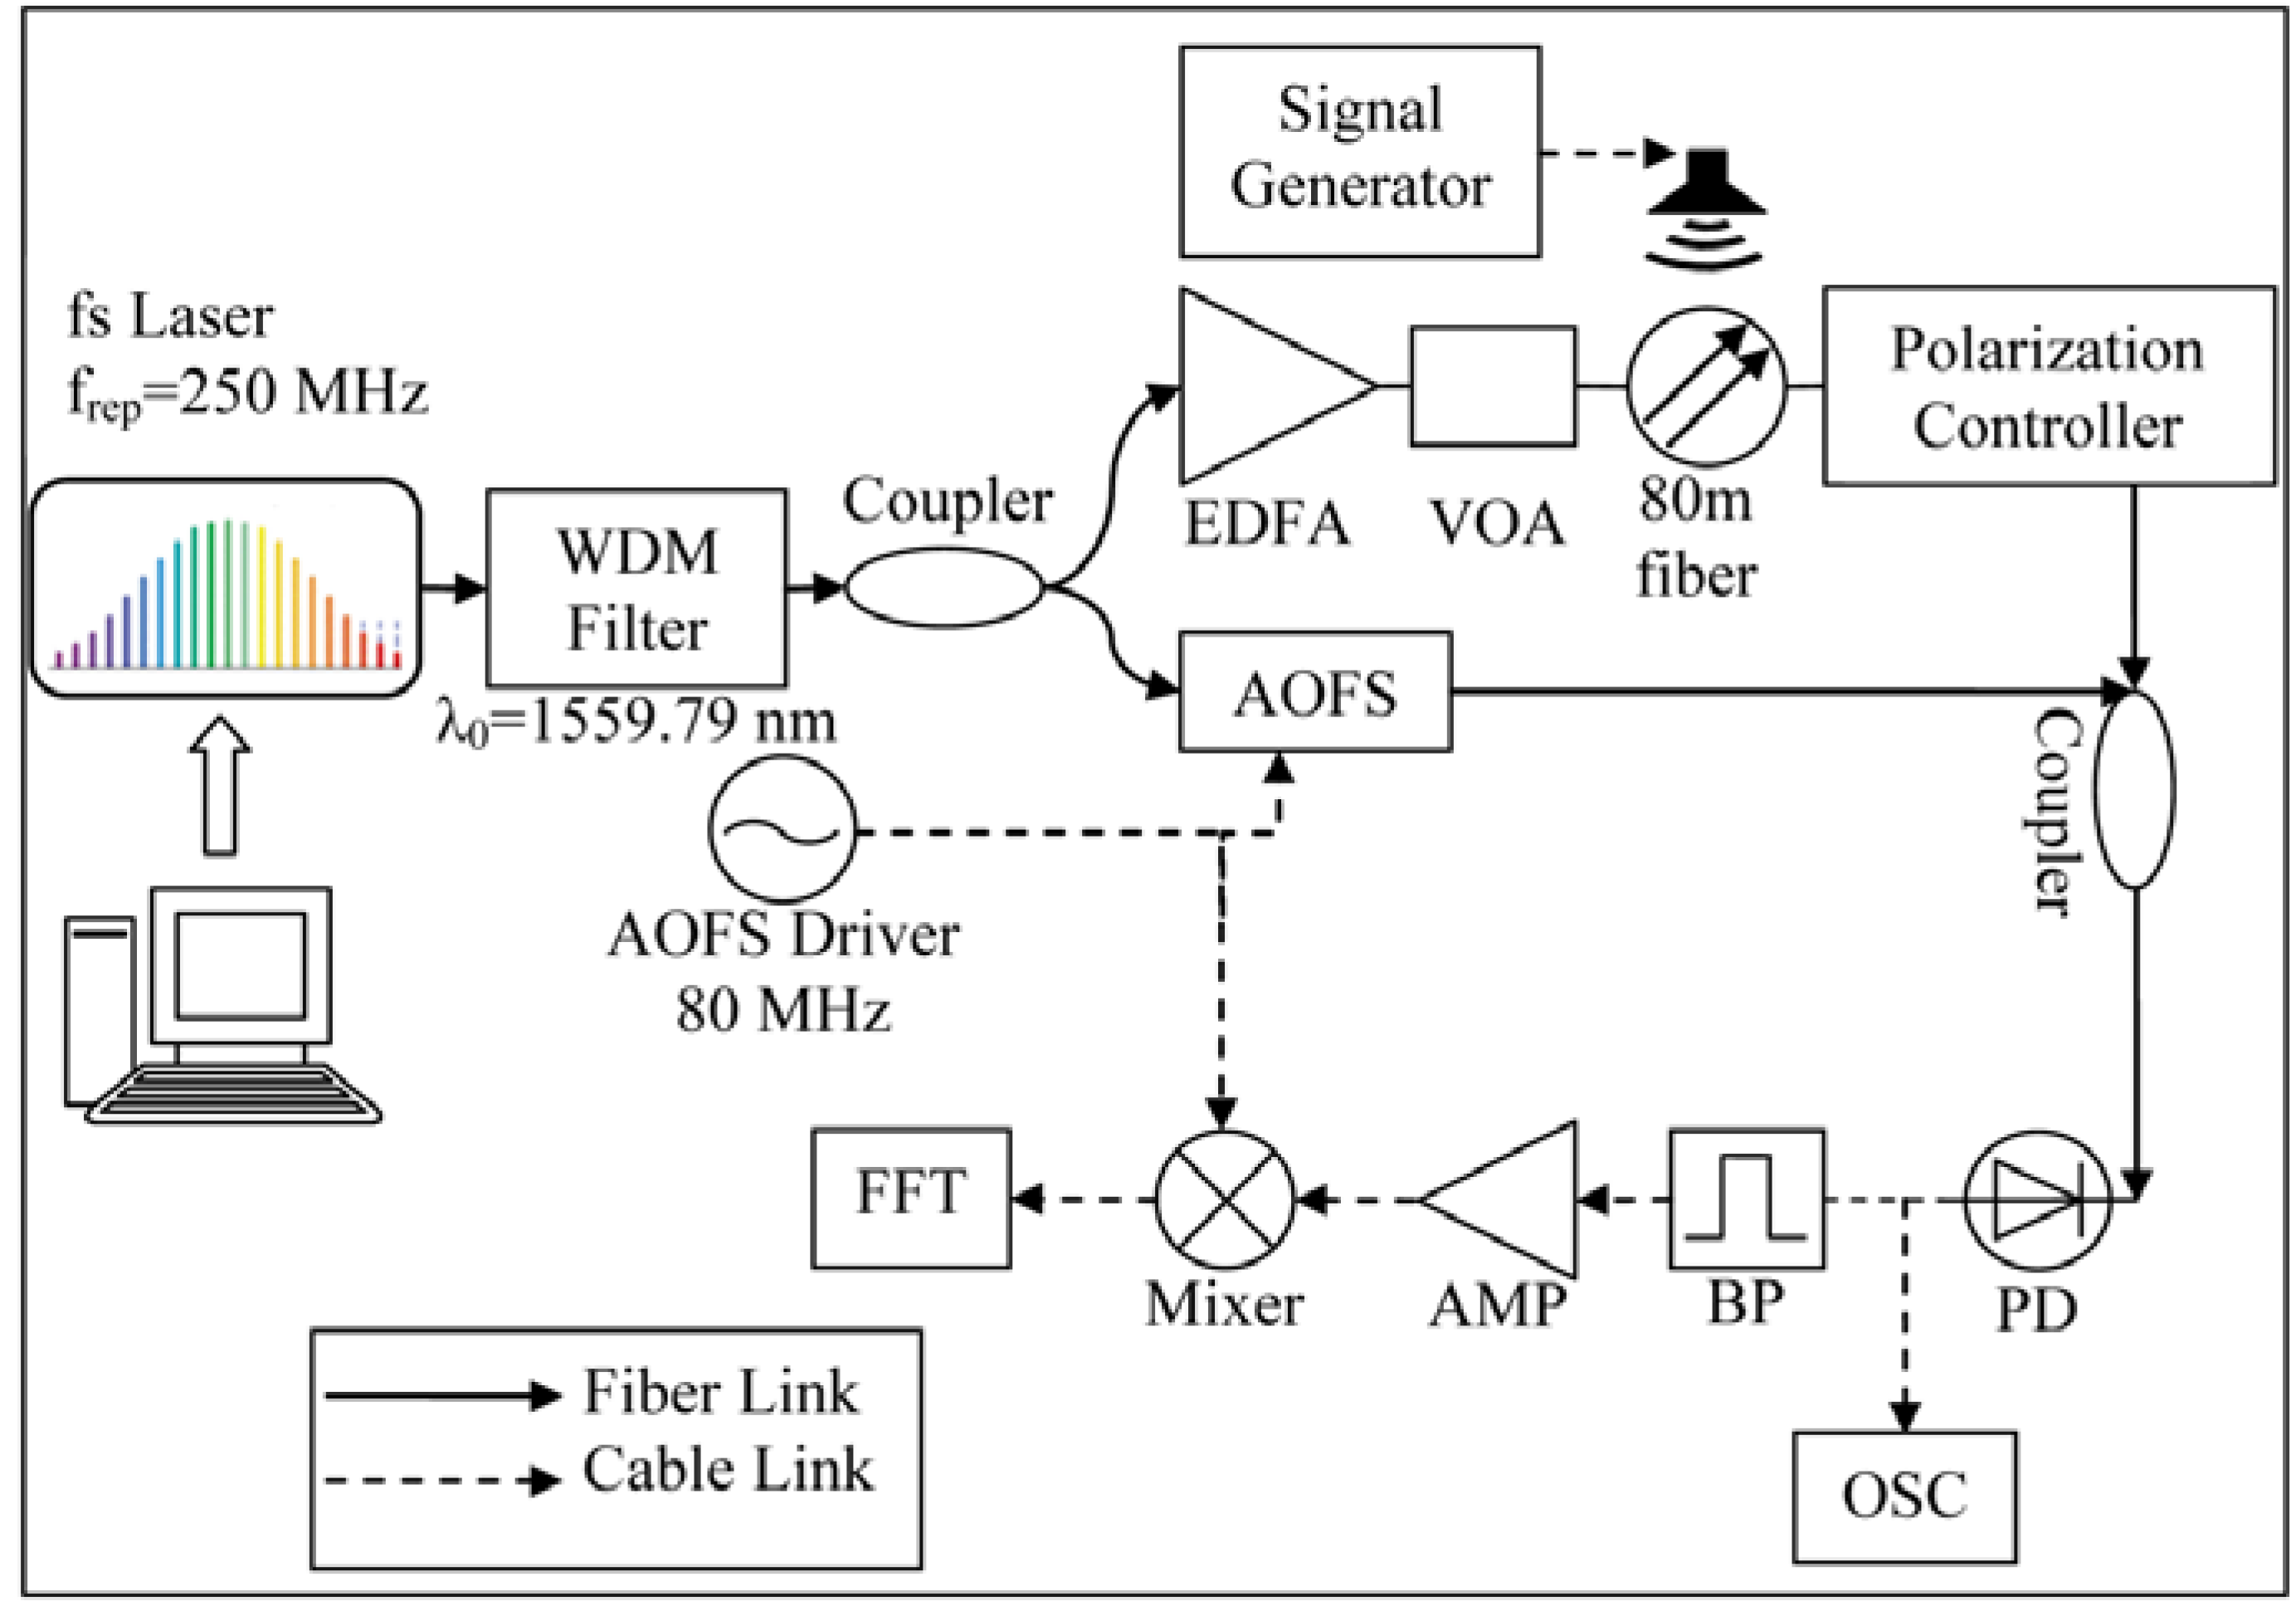
Figure 1 shows a schematic of the experimental setup. The light source is a commercial femtosecond-laser frequency comb (FC1500, Menlo Systems, Martinsried, Germany) operating at 1.56 μm, with comb line spacing (
i.e., pulse repetition rate) of 250 MHz. The optical system is essentially a Mach-Zehnder interferometer sandwiched between two fiber couplers. In the signal arm, an erbium-doped fiber amplifier (EDFA-16-LC, Optilab, Phoenix, AZ, USA; EDFA) and a variable optical attenuator (VOA50, Thorlabs, Newton, NJ, USA; VOA) control the signal power to achieve the optimum signal-to-noise ratio while preventing detector saturation. The fiber link consists of a section of either single-mode fiber (SMF-28; SMF) or polarization maintaining fiber (HB1500T; PMF) wound loosely on a plastic spool. For the SMF, two different fiber lengths, 80 m and 800 m, are tested. A loudspeaker is placed a few centimeters away on the side of the spool and is driven by a signal generator. A polarization controller (PC) is inserted after the fiber link to optimize the output signal. In the reference arm, an acousto-optic frequency shifter (AMM-80, Brimrose, Sparks, MD, USA; AOFS) is used to add an 80 MHz offset to the frequencies of the reference signal. The two arms then combine at a fiber coupler, which directs the interferometer output to a photodetector (DET01CFC, Thorlabs, Newton, NJ, USA; PD). The reference arm is only several meters long, significantly shorter than the signal arm. Its length is chosen so that pulses from both arms can temporally overlap on the detector. In addition, the pulse repetition rate of the laser is frequently adjusted around its 250 MHz nominal value through a computerized control system to maintain the optimum pulse overlapping condition. This is because a repetition rate change can cause a change of the relative pulse delay in an imbalanced interferometer [
22].
Figure 1.
Schematic of the experimental setup for characterizing the excess phase noise spectra of optical frequency transfer in a fiber link under external acoustic perturbations. AMP, microwave amplifier; BP, band pass filter; OSC, oscilloscope; WDM, wavelength division multiplexer.
Figure 1.
Schematic of the experimental setup for characterizing the excess phase noise spectra of optical frequency transfer in a fiber link under external acoustic perturbations. AMP, microwave amplifier; BP, band pass filter; OSC, oscilloscope; WDM, wavelength division multiplexer.
The beating between the two overlapped pulses generates an 80 MHz beat note on the photodetector. This heterodyne process, however, is complicated by the fact that a frequency comb is composed of a series of discrete spectral lines and the beat note is hence due to multi-heterodyne. A detailed theoretical analysis of multi-heterodyne phase noise detection has been given elsewhere [
19]. Here, we just point out that, in order to minimize the impact of fiber dispersion to the heterodyne signal, a narrow band optical filter centered at 1559.79 nm with a pass band of 0.4 nm (
i.e., about 100 GHz) is inserted at the output of the laser. The beat note is passed through a bandpass filter and an amplifier before it is mixed in quadrature with the 80 MHz driving signal from the AOFS driver. The resulting dc signal is then frequency analyzed by a fast Fourier transform (FFT) analyzer (SR785, Stanford Research Systems, Sunnyvale, CA, USA) to reveal the noise spectrum. Meanwhile, an oscilloscope (GDS-2204, Instek, Montclair, CA, USA) is used to monitor the 80 MHz beat note in the time domain.
It should be noted that the OFC was in free-run (without stabilization of the pulse repetition rate and the carrier-envelope offset frequency) during the measurements. This is valid in our case because, for excess noise measurements, where both the signal and the reference are derived from the same femtosecond laser, the laser phase noise enters the multiheterodyne beat note as a result of arm-length imbalance in the interferometer. In most of our measurements (for both
fiber-optic and
free-space transfer tests), this imbalance is in the order of 100 m, much less than the coherence length of the OFC (a free-run fiber-based OFC typically has a comb-line linewidth of about 20 kHz near its center wavelength [
23]). As a result, the impact of the laser noise is negligible compared to the added noise. Moreover, our experience with operating the OFC indicates that stabilizing the OFC with an rf atomic clock, such as a Cs or Rb clock, can dramatically reduce the slow frequency drift of the comb lines, but does little to improve the short-term linewidth. Therefore, for short-distance demonstrations, a free-run OFC works sufficiently well.
2.2. Experimental Results
In the experiment, we first verify that our detection system can allow us to see the excess phase noise due to pulse propagation in the fiber. This is done by measuring the phase noise at the output of the interferometer with the speaker turned off and with different lengths of SMF inserted in the signal arm. The phase noise is found to be proportional to the fiber length, indicating a direct correlation between the excess phase noise and the fiber. We then focus our attention on the noise behavior under external perturbations.
The simplest way of acoustic perturbation is harmonic perturbation (single-tone). In principle, a more realistic broadband perturbation can be treated as the superposition of many single-tone perturbations. Thus, we focus only on single-tone perturbations in the current study. We have tested two different speaker locations, including putting the speaker on the side of the fiber spool without physical contact and putting it directly on the fiber spool with physical contact. Other than some minor differences in the amplitude, the overall noise spectra follow a similar trend in both cases. Therefore, we only present here the results obtained with the speaker sitting on the side of the fiber spool.
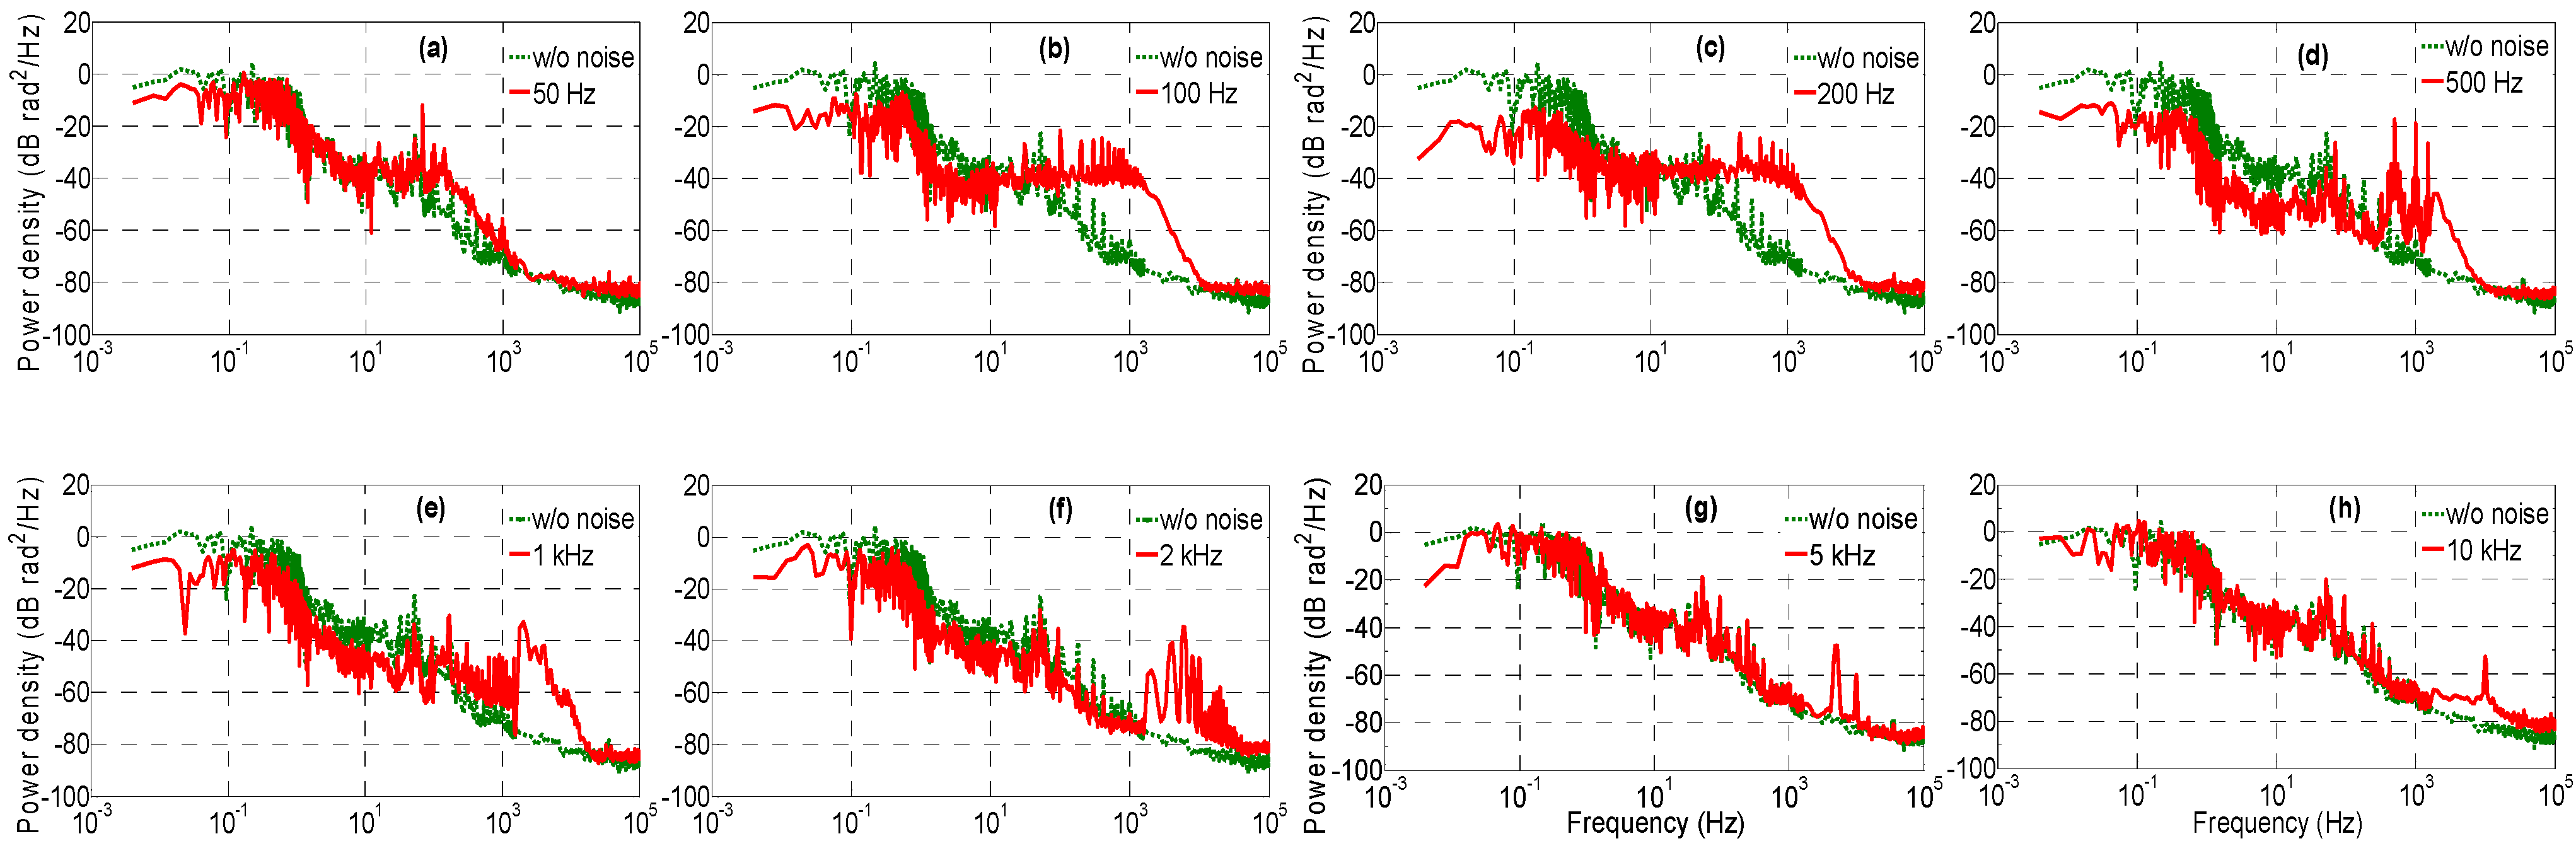
Figure 2 shows the excess phase noise spectra with eight different perturbation frequencies. All the data are obtained with an 80 m transmission distance in SMF, and are measured within the span of about 1 hour in normal lab conditions. The driving power to the speaker remains the same for all eight figures. The acoustic power is estimated to be about 80 dB in decibel scale.
Figure 2.
Excess phase noise spectra with (solid) and without (dashed) external acoustic perturbations. Measurement is done with 80 m single-mode fiber (SMF) at eight single-tone perturbation frequencies: (a) 50 Hz; (b) 100 Hz; (c) 200 Hz; (d) 500 Hz; (e) 1 kHz; (f) 2 kHz; (g) 5 kHz; and (h) 10 kHz. The driving power is the same for all the frequencies.
It is evident from
Figure 2 that the single-tone perturbations cause an increase of phase noise power density within the spectral range of the perturbation frequency and its first few harmonics. Such a behavior agrees with the commonly accepted notion that external acoustic perturbations to optical fibers induce phase fluctuations in the light propagating through the fiber. What is interesting, according to our measured data, is the simultaneous reduction of the noise spectral density at frequencies below the perturbation frequency. Such an effect exists within the entire tested frequency span, but is especially pronounced between 100 Hz and 1 kHz. The same test is also done with an 800 m transmission distance, and a similar change of the phase noise spectral shape is observed. The decrease of phase noise at frequencies below the excitation frequency indicates that single-tone acoustic perturbation can effectively suppress low-frequency phase noise. The stronger effect within 100–1000 Hz is likely due to the greater acoustic efficiency of the speaker in this frequency range.
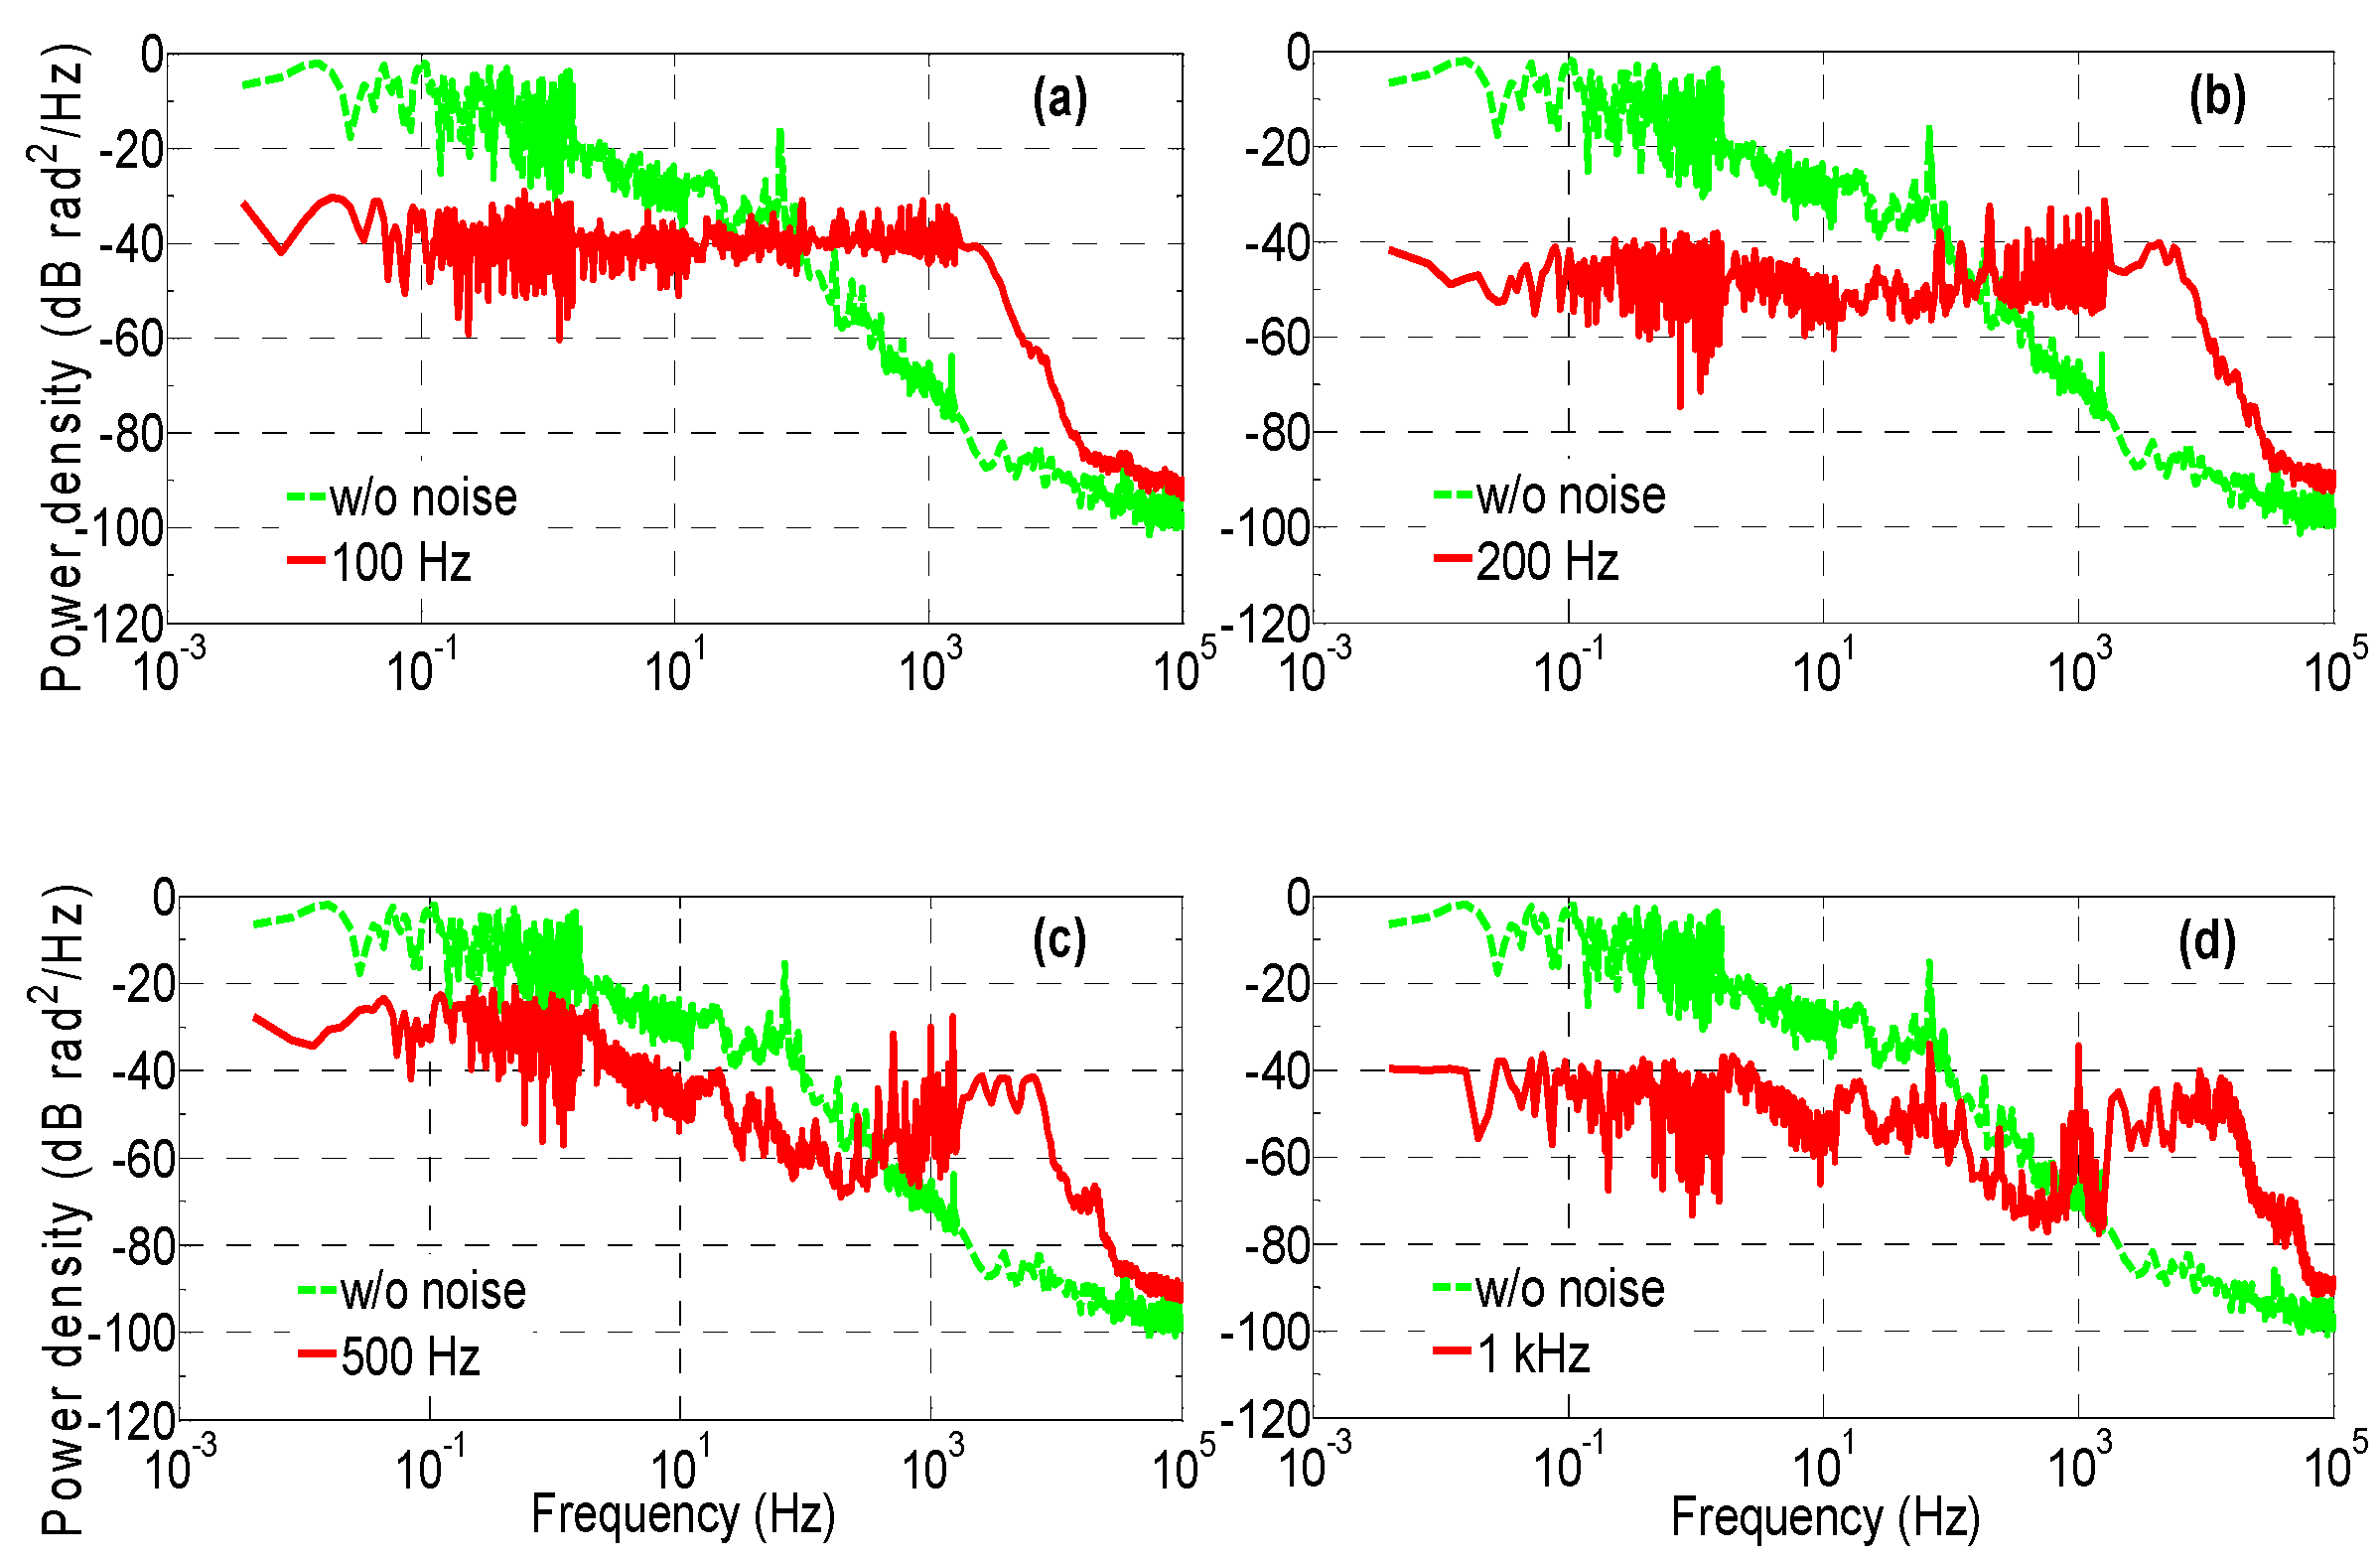
One possible mechanism that can lead to the coupling between acoustic excitation and excess transmission phase noise is polarization fluctuation. Physical vibration of the fiber in an external acoustic field can alter the polarization state of the laser beam, resulting in phase fluctuations due to the fiber birefringence. To find out if the noise suppression is related to polarization, we change the 80 m SMF to 80 m PMF in the signal arm and perform the same test at the same perturbation frequencies.
Figure 3 shows the excess phase noise spectra under perturbation frequencies of 100 Hz, 200 Hz, 500 Hz and 1 kHz, respectively, along with the spectrum without the perturbation. Compared to the SMF results at the same frequencies, similar noise suppression is observed at low frequencies even with the PMF. This indicates that it is unlikely the noise suppression effect is due to acoustically excited polarization fluctuation.
Figure 3.
Excess phase noise spectra with (solid) and without (dashed) external acoustic perturbations with 80 m polarization maintaining fiber (PMF) being used. Measurement is done at four single-tone perturbation frequencies: (a) 100 Hz; (b) 200 Hz; (c) 500 Hz; and (d) 1 kHz.
Figure 3.
Excess phase noise spectra with (solid) and without (dashed) external acoustic perturbations with 80 m polarization maintaining fiber (PMF) being used. Measurement is done at four single-tone perturbation frequencies: (a) 100 Hz; (b) 200 Hz; (c) 500 Hz; and (d) 1 kHz.
Meanwhile, a key question regarding the impact of external excitation is whether single-tone perturbations can cause increase of total phase noise power, which can be calculated by integrating the power spectral density traces in
Figure 2 and
Figure 3 over the entire frequency span. We compare the total noise powers with and without acoustic perturbations for both SMF and PMF at the four perturbation frequencies between 100 Hz and 1 kHz, where the suppression to low-frequency noise is most significant. The result is summarized in
Table 1. Given the noisy nature of the traces, we see some fluctuations in the amount of change of total noise power. But for most cases, the percentage power change with acoustic perturbation range from about 5% to about 10%. Evidently, single-frequency perturbation leads to the increase of phase noise power.
Table 1.
Total excess phase noise powers at different perturbation frequencies.
Table 1.
Total excess phase noise powers at different perturbation frequencies.
| Acoustic Noise Frequency | SMF | PMF |
|---|
| Total Noise Power | Absolute Power Change | Percentage Power Change | Total Noise Power | Absolute Power Change | Percentage Power Change |
|---|
| No Perturbation | 3.89 × 10⁻² | - | - | 3.63 × 10⁻² | - | - |
| 100 Hz | 4.33 × 10⁻² | 4.37 × 10⁻³ | 11.21% | 4.00 × 10⁻² | 3.76 × 10⁻³ | 10.38% |
| 200 Hz | 4.28 × 10⁻² | 3.84 × 10⁻³ | 9.87% | 3.83 × 10⁻² | 2.06 × 10⁻³ | 5.69% |
| 500 Hz | 3.92 × 10⁻² | 2.07 × 10⁻⁴ | 0.53% | 3.93 × 10⁻² | 3.02 × 10⁻³ | 8.34% |
| 1 kHz | 4.38 × 10⁻² | 4.84 × 10⁻³ | 12.42% | 3.84 × 10⁻² | 2.11 × 10⁻³ | 5.80% |
2.3. Discussion
While the increase of the total noise power under external acoustic excitation is as expected, the suppression of the low-frequency phase noise by a single-tone perturbation is somewhat a surprise. The exact mechanism causing this interesting effect is subject to further investigation. One possible scenario is, when an acoustic wave strikes a fiber, the pressure oscillation in the air prompts periodic changes of strain and stress inside the fiber and hence periodic fluctuations of the refractive index. With sufficient amplitude, the resulting periodic phase variation of light can average out the phase noise caused by spontaneous fluctuations of strain and stress at lower frequencies, leading to a suppression of the noise spectral density below the perturbation frequency. This effect can be stronger in anisotropic fiber structures such as PMFs compared to isotropic structures such as SMFs because the fluctuations of strain and stress are more appreciable in anisotropic structures. Nevertheless, the present work demonstrates experimentally the impact of acoustic perturbations to fiber-optic remote clock distribution and characterizes the excess phase noise spectrum for the frequency comb-based scheme. The noise-suppression effect by single-tone acoustic perturbations potentially offers a way to manipulate the phase noise spectrum of transferred clocks at low frequencies without active noise cancellation.
4. Conclusions
In conclusion, we have experimentally demonstrated remote distribution of multifrequency optical frequency references via both a fiber-optic and a free-space transfer links. Using a multiheterodyne technique, we have characterized the excess phase noise introduced to the clock signals by the transfer links. In the case of fiber-optic distribution, a single-tone, external acoustic perturbation is introduced and its impact on the phase noise spectrum is studied. Enhancement of noise power is found at the perturbation frequencies and their harmonics, whereas, for a wide span of perturbation frequencies (100–1000 Hz), noise suppression is observed at frequencies below the perturbation frequencies. In the case of free-space distribution, spectral broadening is observed after a 60 m atmospheric transmission and the resulted clock instability is characterized by an Allan deviation measurement. Overall, this research shows the effectiveness of multiheterodyne in the characterization of multifrequency remote clock distribution based on frequency combs.


