Article

Experimental Evaluation of Lubrication Characteristics of a New Type Oil-Film Bearing Oil Using Multi-Sensor System

1
School of Mechanical Engineering, Taiyuan University of Science and Technology, Taiyuan 030024, China
2
Department of Electrical, Electronic & Computer Engineering, University of Pretoria, Pretoria 0002, South Africa
3
School of Mechatronic Engineering, China University of Mining Technology, Xuzhou 221116, China
4
School of Manufacturing & Mechanical Engineering, University of New South Wales (UNSW), Sydney 2200, Australia
*
Authors to whom correspondence should be addressed.
Appl. Sci. 2017, 7(1), 28; https://doi.org/10.3390/app7010028
Submission received: 4 November 2016 / Revised: 12 December 2016 / Accepted: 13 December 2016 / Published: 26 December 2016

Abstract

:
In order to evaluate the operating performance of a new type oil-film bearing oil S220, a new test bearing was designed based on oil-film bearing test rig. The operating temperature of S220 was tested through the thermocouples installed on a test bearing; the operating oil-film pressure was tested through pressure transducers; and the operating oil-film thickness was tested through displacement transducers. Meanwhile, M220 was also tested as a comparison, and both oils are based on mineral oil. The results showed that all property indexes of the test rig can meet the specified requirements and can guarantee the performance test of oil-film bearing oil; the operating temperature of S220 is generally equal to that of M220, and both have the same operating stability. The temperature property conforms to Formula (1) and the operating temperature under different load cases can be predicted. Although oil-film pressure of M220 is a little more stable, the oil-film pressure of S220 is similar to that of M220. Moreover, both have the similar oil-film thickness, and the oil-film thickness of S220 is slightly smaller than that of M220, especially at the beginning of operation. Ultimately, oil S220 is evaluated to be suitable for actual engineering application.

1. Introduction

Oil-film bearing oil is mainly used for the lubrication of oil-film bearing in a strip and wire mill [1]. The property of oil mainly depends on the quality of base oil and additives, as well as the optimization of compound formula. If the oil is not qualified, it will not only affect the quality of steel plate and lead to economic loss, but might also result in a severe accident. Research shows that 75% accidents in steel mills result from the failure of lubricating oil [2]. Generally, there are four evaluation methods to evaluate the performances of oil-film bearing oil, which include physical and chemical monitoring, simulation test, bench test, and running test [3].
Physical and chemical monitoring is the most basic evaluation method to check whether the physical and chemical indexes of oil-film bearing oil can meet the standard or not, the commonly used analytical methods are spectral analysis [4,5], differential scanning calorimetry [6], and the chemical approach [7]. However, these methods can hardly reflect the lubrication status of bearing friction pairs. Simulation test is used to simulate the working status and condition of devices in the laboratory. It can only be applied to some simple operation conditions, but it cannot reflect the effects of complicated conditions on the operating performances of oil-film bearing. Test methods mainly include four-ball test [8,9] and FZG (Forschungsstelle fur Zahnrader und Getriebebau) gear test [10], etc. The bench test is the most economical and effective. Under all comprehensive rigorous experimental conditions, bench testing can realize the operation under different conditions of devices and can intuitively reflect the operating performances of oil. Testing oil-film bearing oil is mainly done on the oil-film bearing test rig [11,12,13]. The final procedure of oil development is the running test, and the test for oil-film bearing oil is required to be conducted on an on-site rolling mill [14,15], but too many influential factors need to be considered, and even the normal production of enterprise will be influenced or interrupted, so it is difficult to implement this method.
Bench testing is regarded as the most economical and ideal evaluation method. Some experts made contributions to bench testing. Tadashi Katafuchi evaluated the low-viscosity base oil [3], F.P. Brito studied the effect of heavy loads on lubrication performance [16]. P.G. Morton studied the stability of bearings [17]. J. Bouyer measured the start-up torque of bearings under different pressure [18]. Sergei B. Glavatskih evaluated sensor performances under various operating conditions [19]. Furthermore, Gregory F. Simmons and Sergei B. Glavatskih did some work on synthetic lubricants [20], but their test rig did not cover the medium and heavy load range. Although these contributions referred to bench testing of lubricating oil, they did not provide a method to evaluate oil-film bearing oil comprehensively. In this study, bench testing was done on a large-scale oil-film bearing test rig, and the test rig can simulate the actual rolling process covering a load range from light loads to heavy loads, i.e., the external hydraulic pressure is from 0 MPa to 25 MPa, and the maximum load in this study is 12 MPa. Furthermore, the distribution of transducers in the test rig was based on theoretical calculation results of oil-film pressure, oil-film thickness, and oil-film temperature, and the positioning of transducers was determined to be in accordance with mesh subdivision of actual oil-film performances [2,
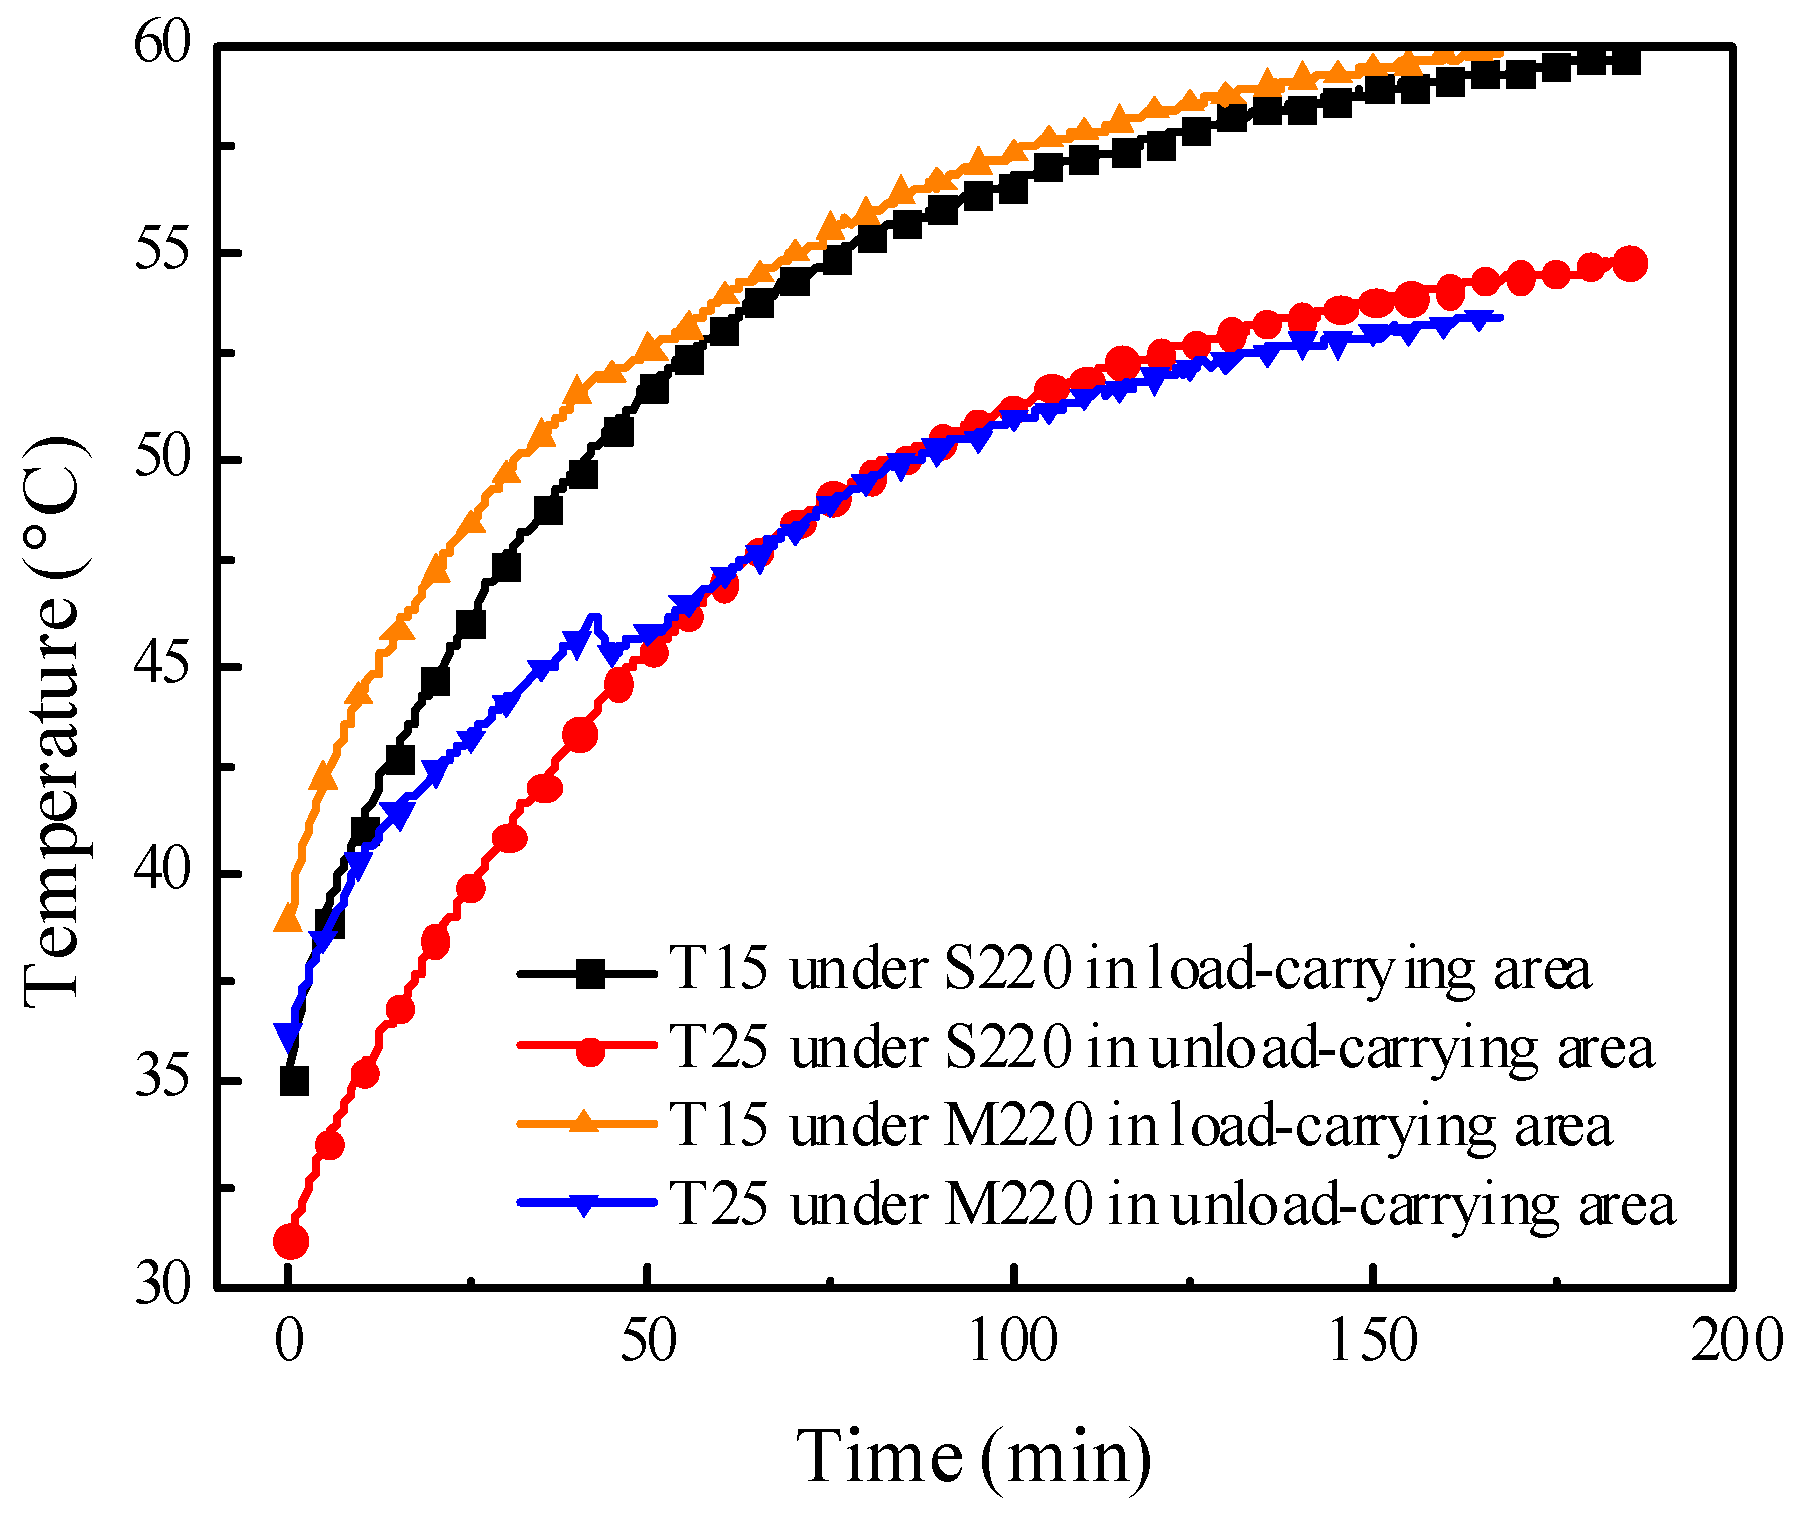
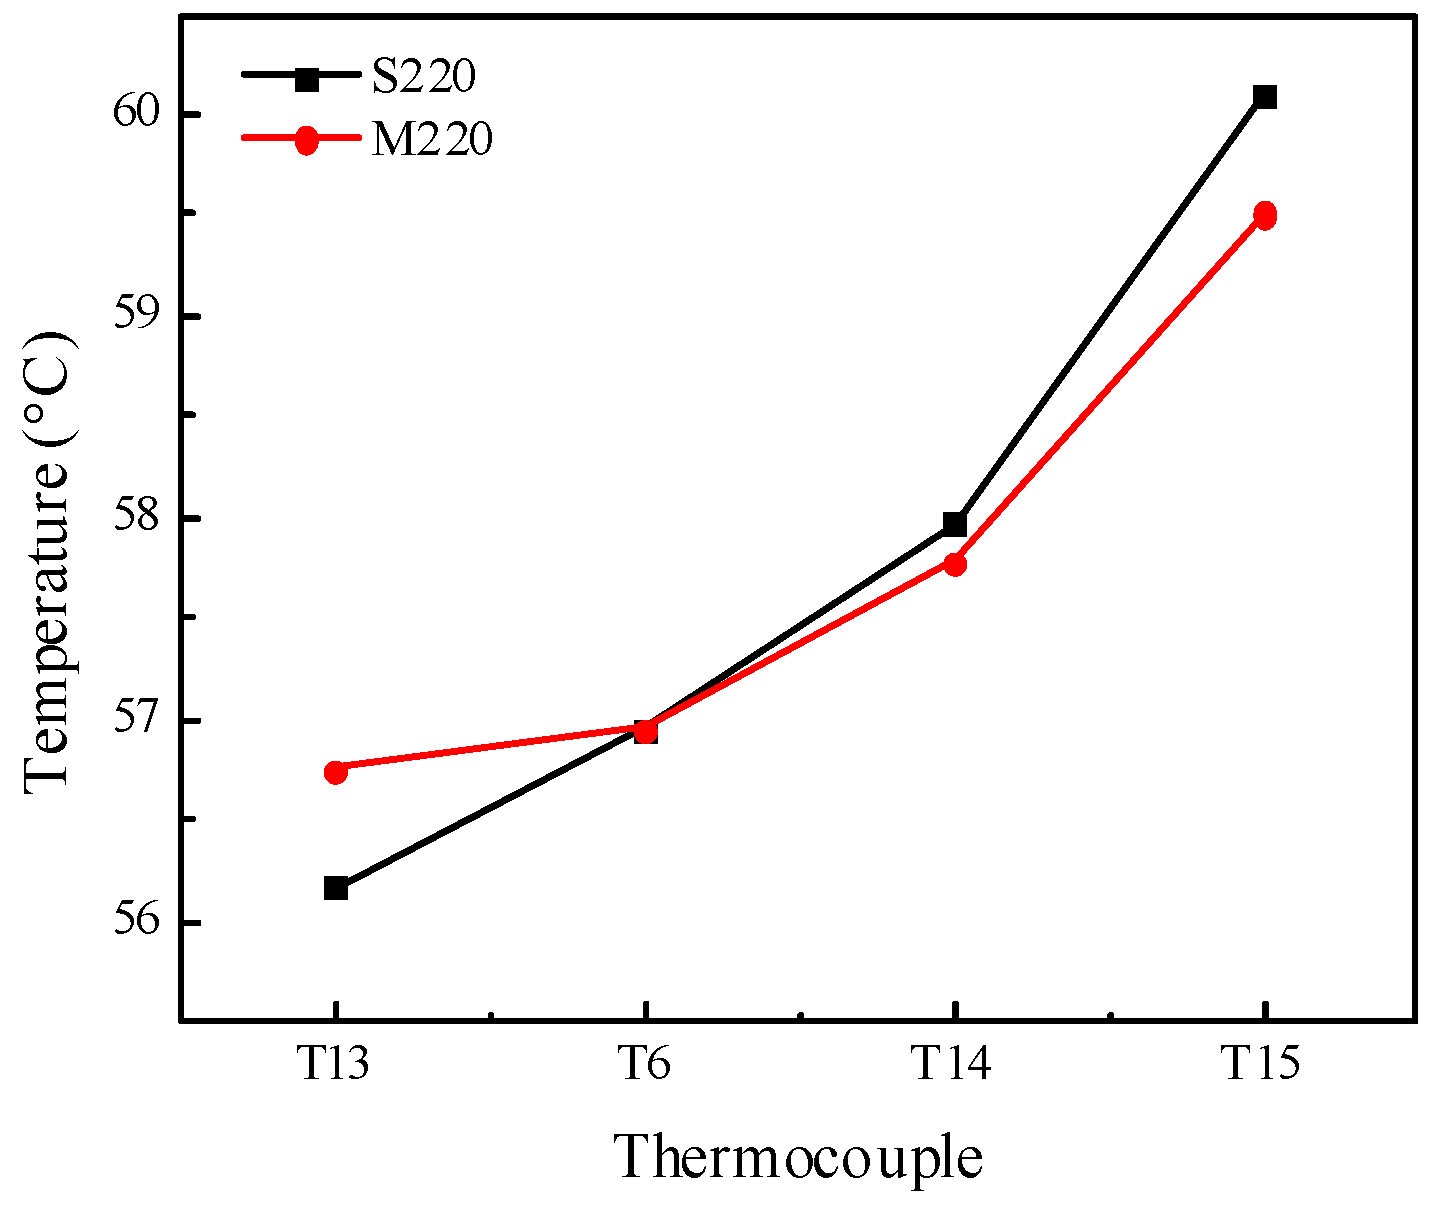
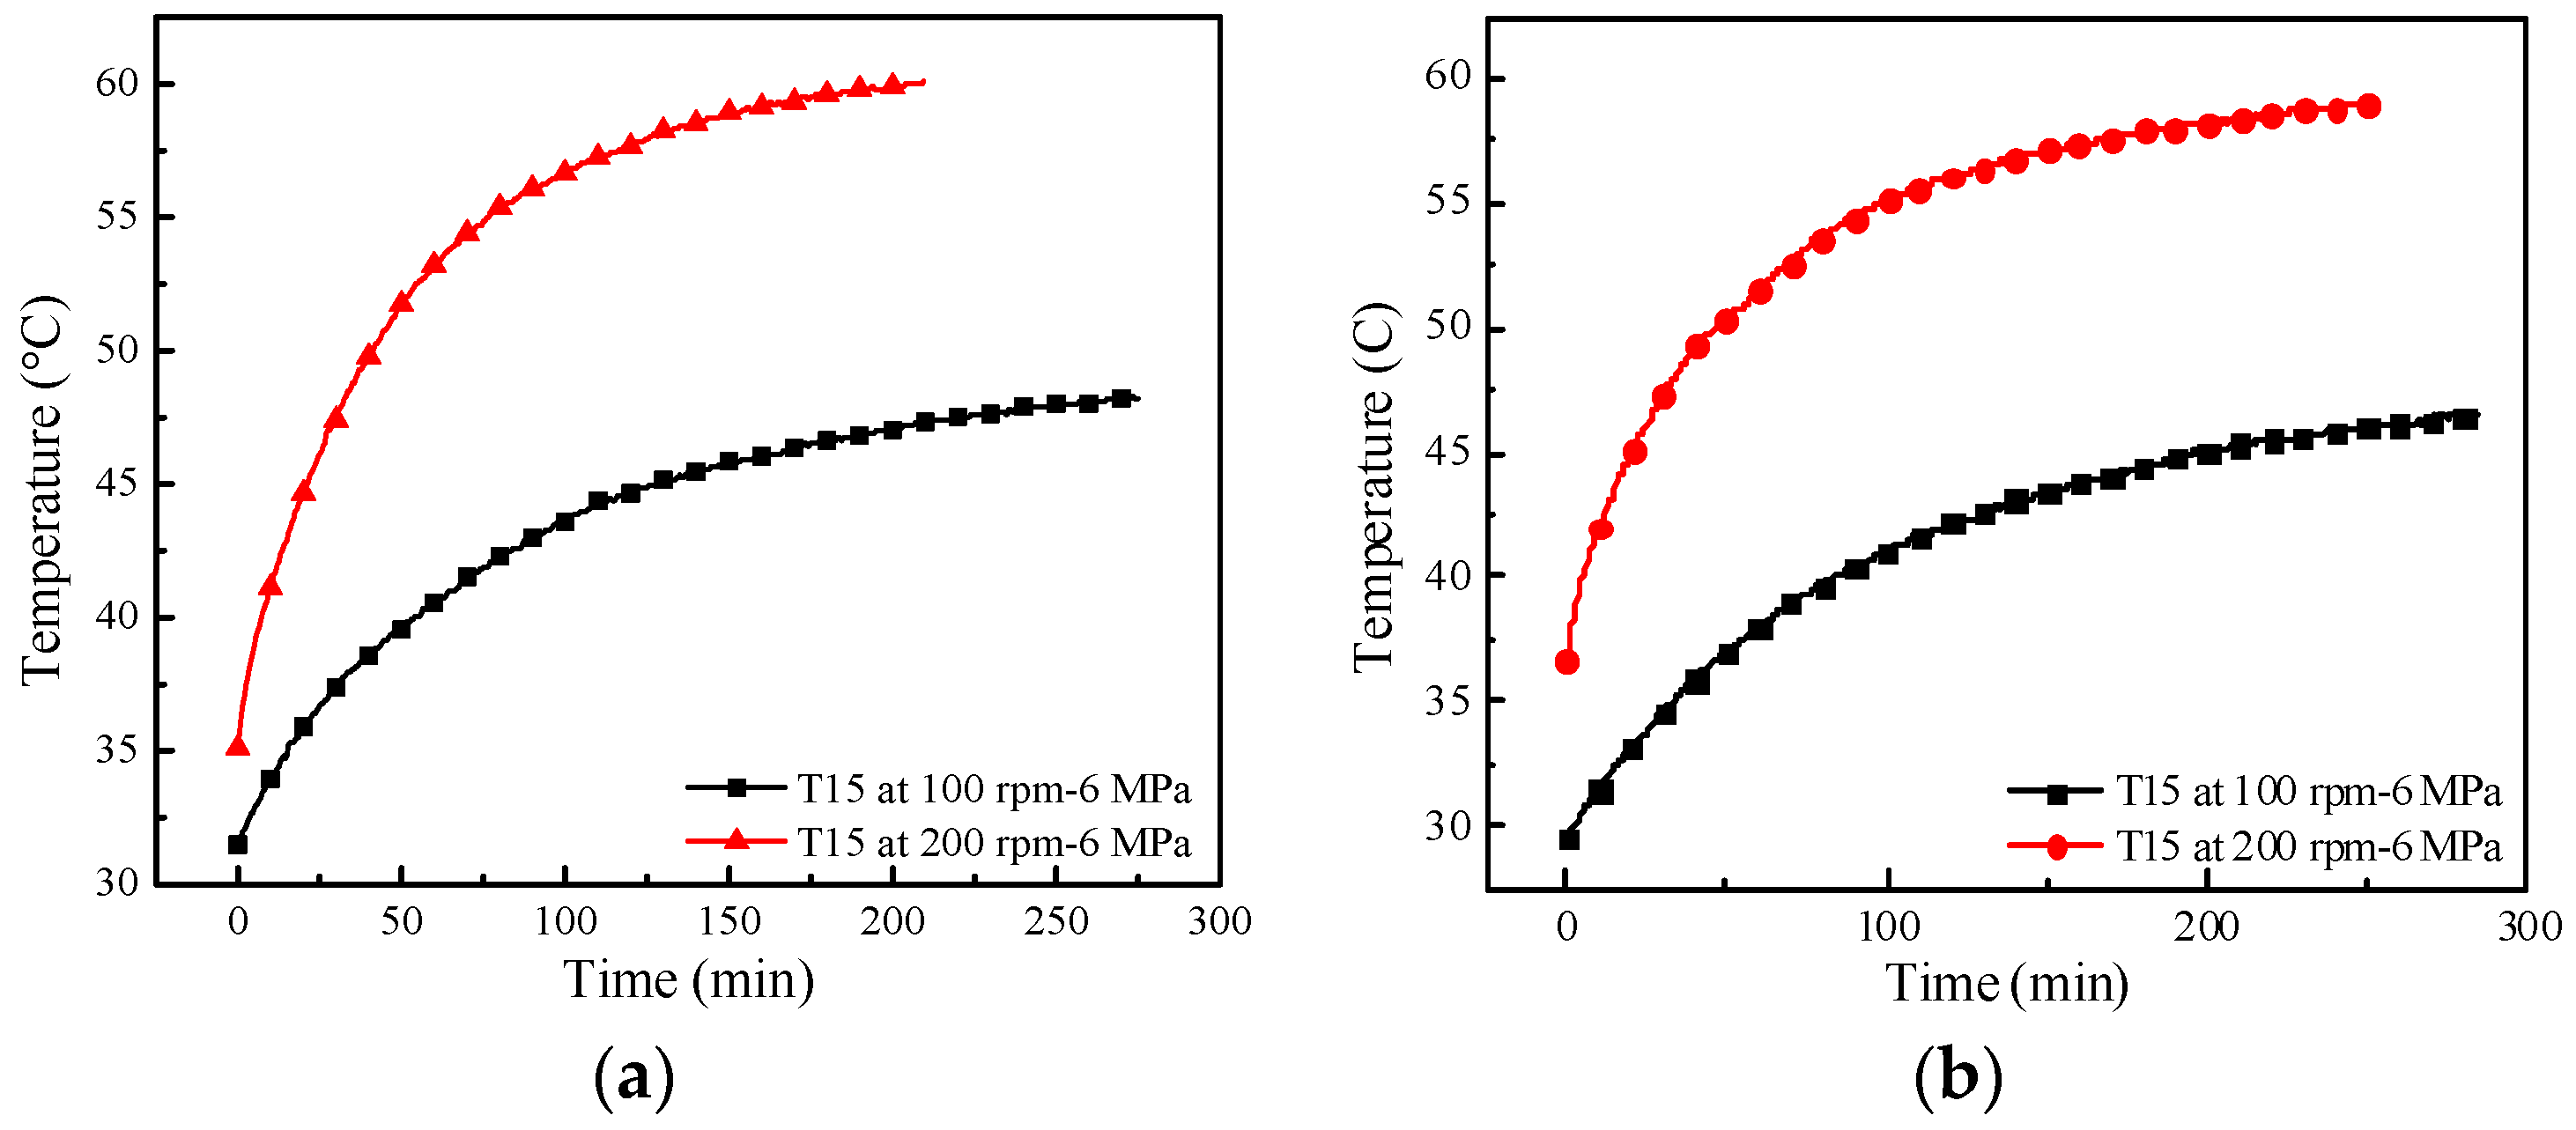
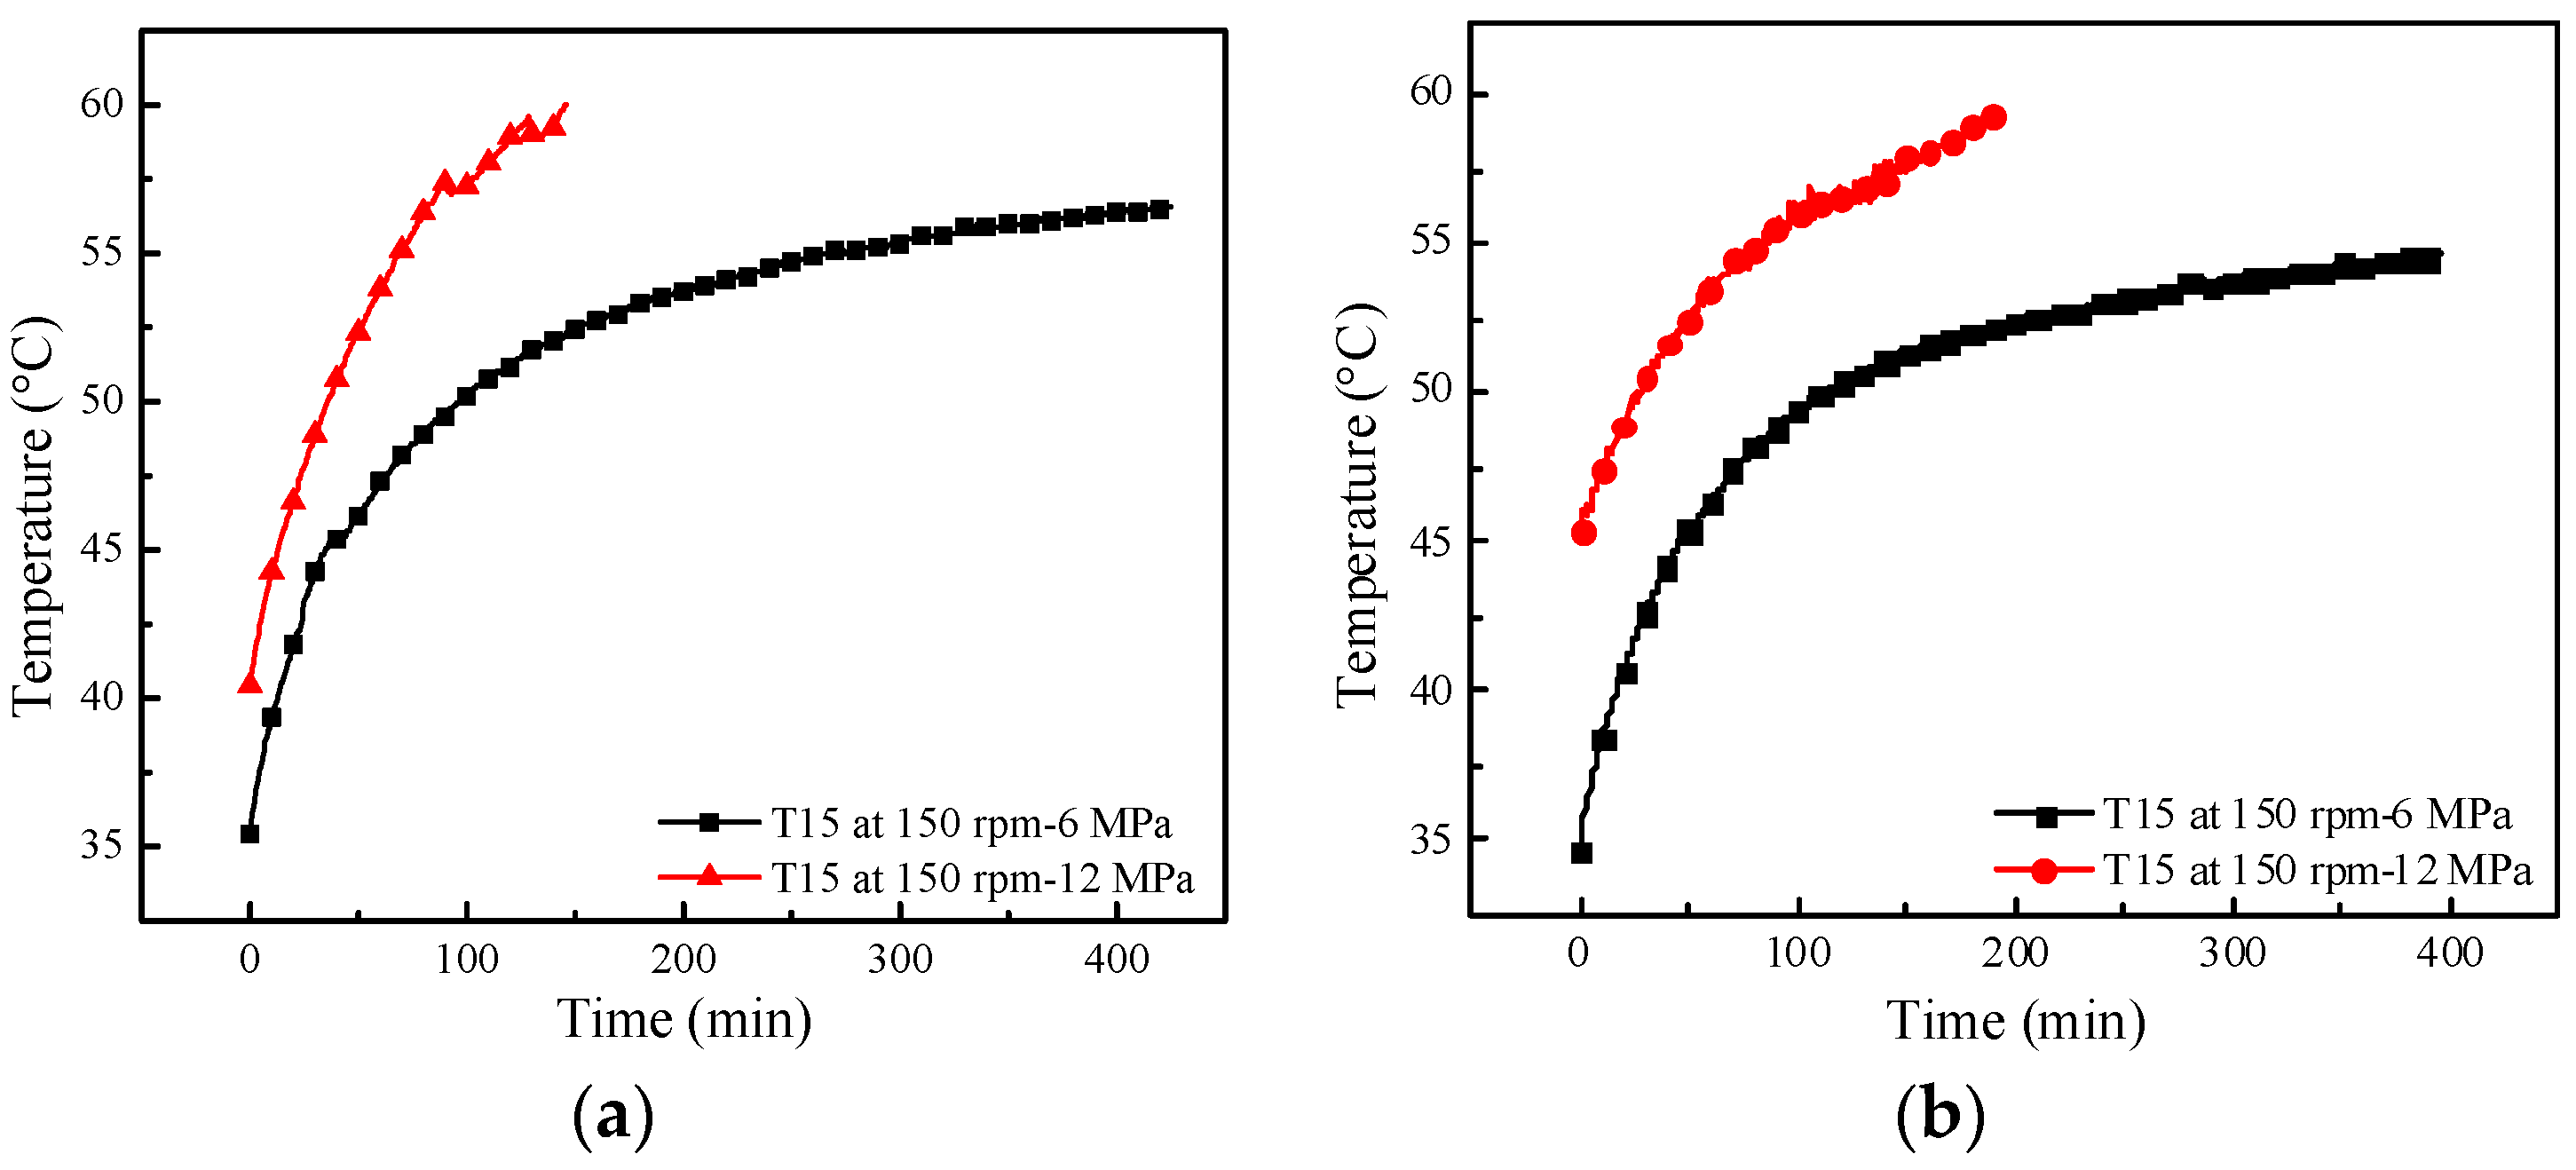
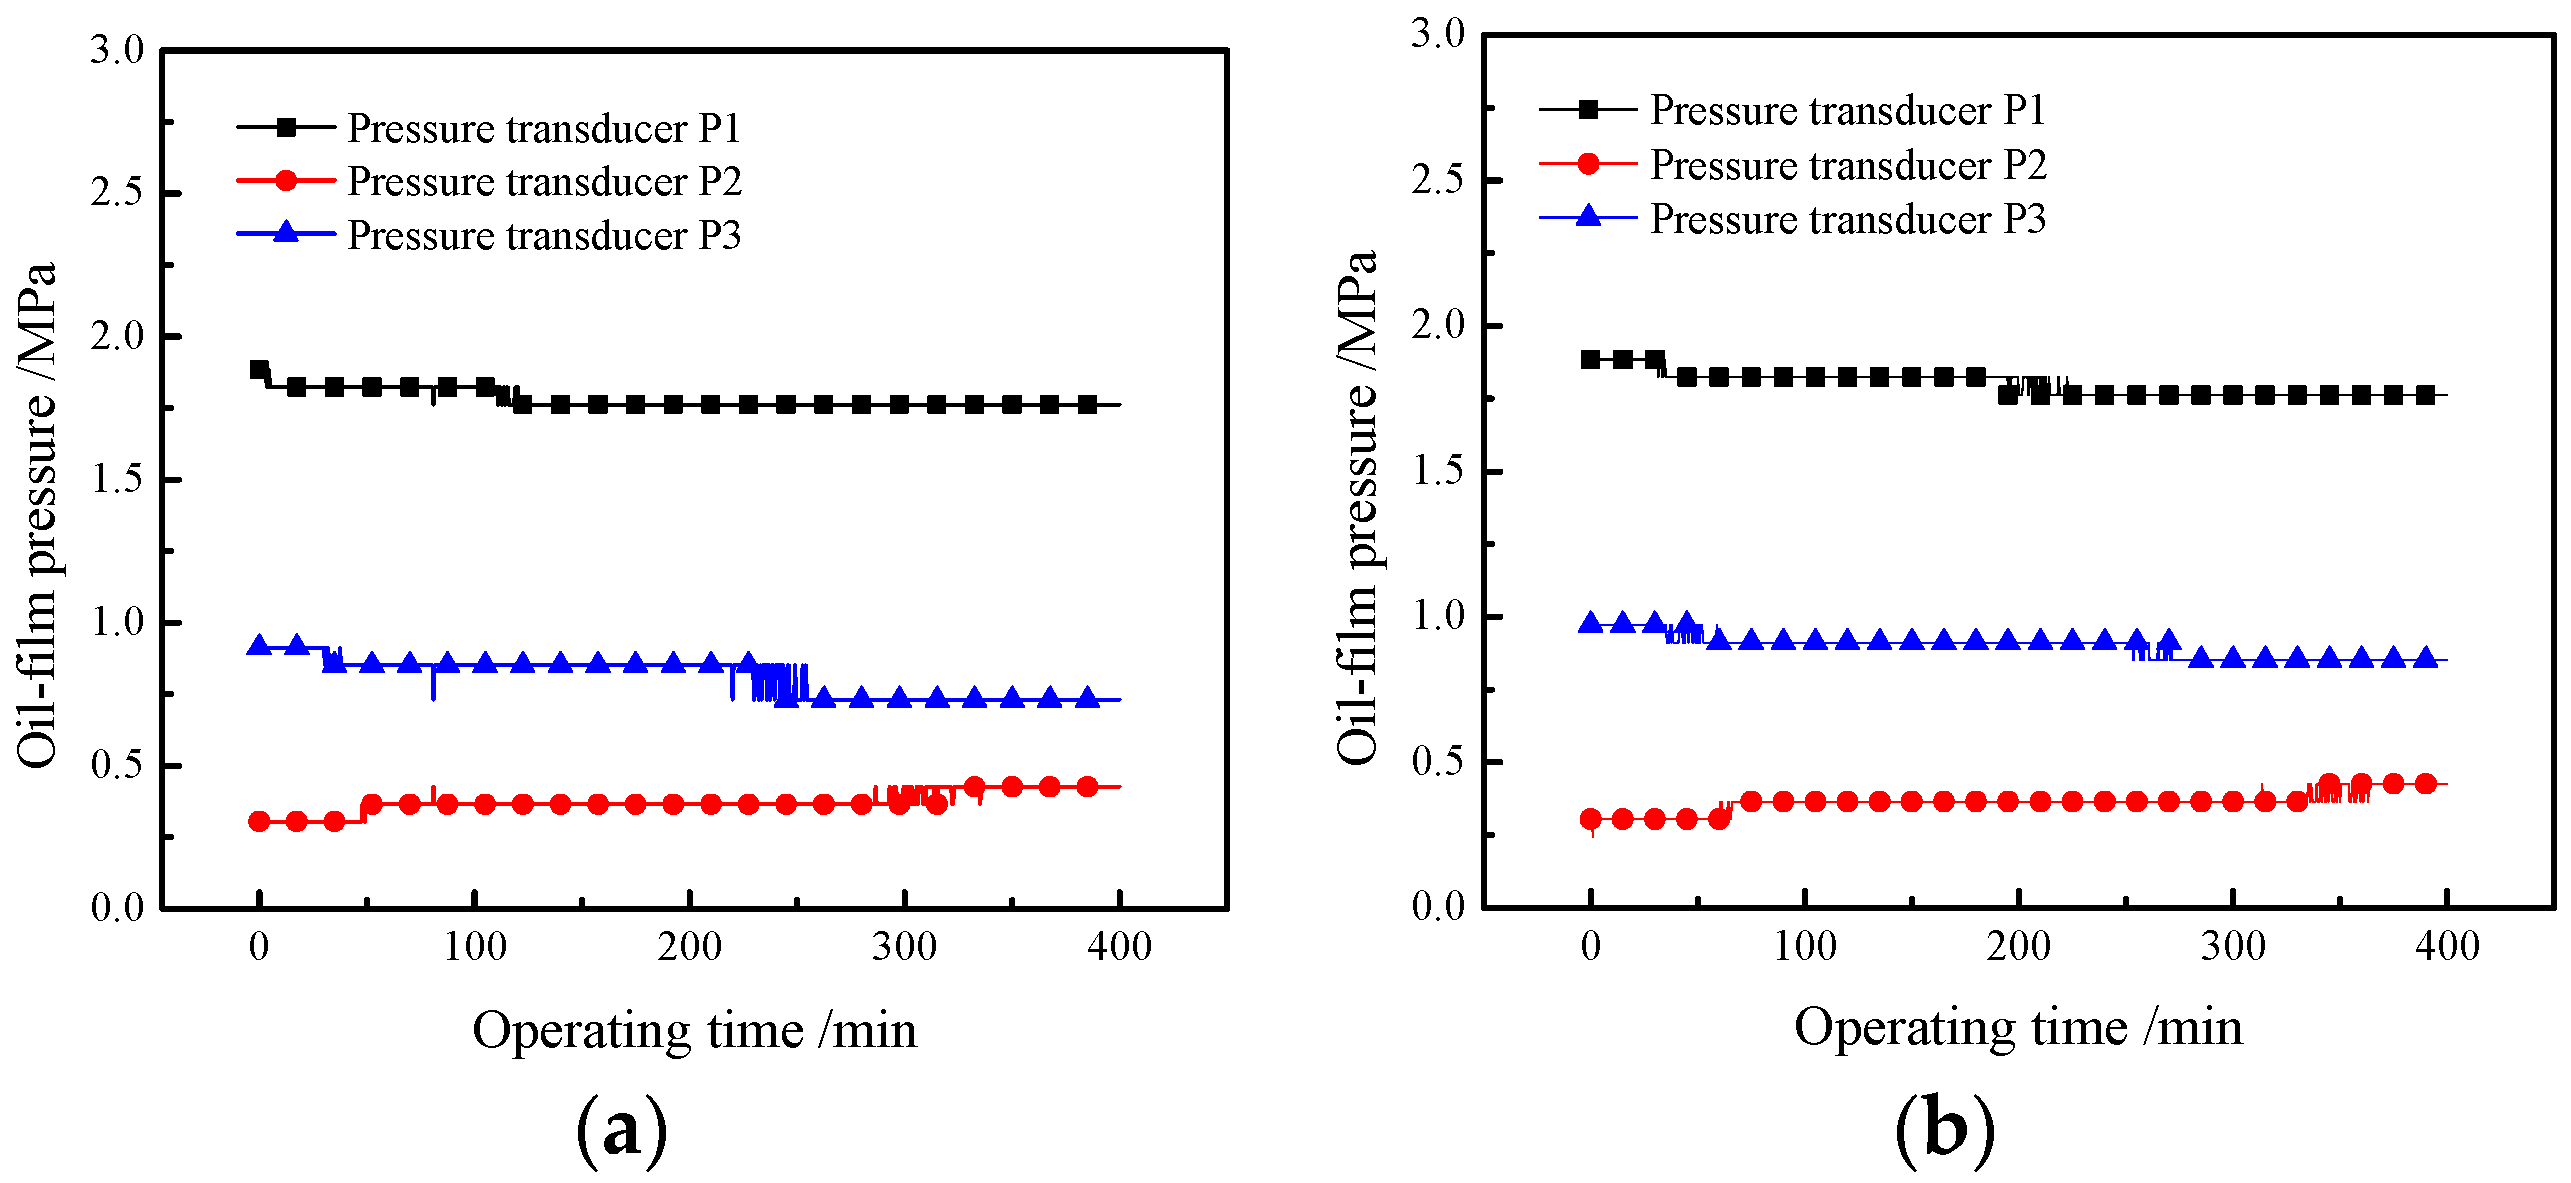
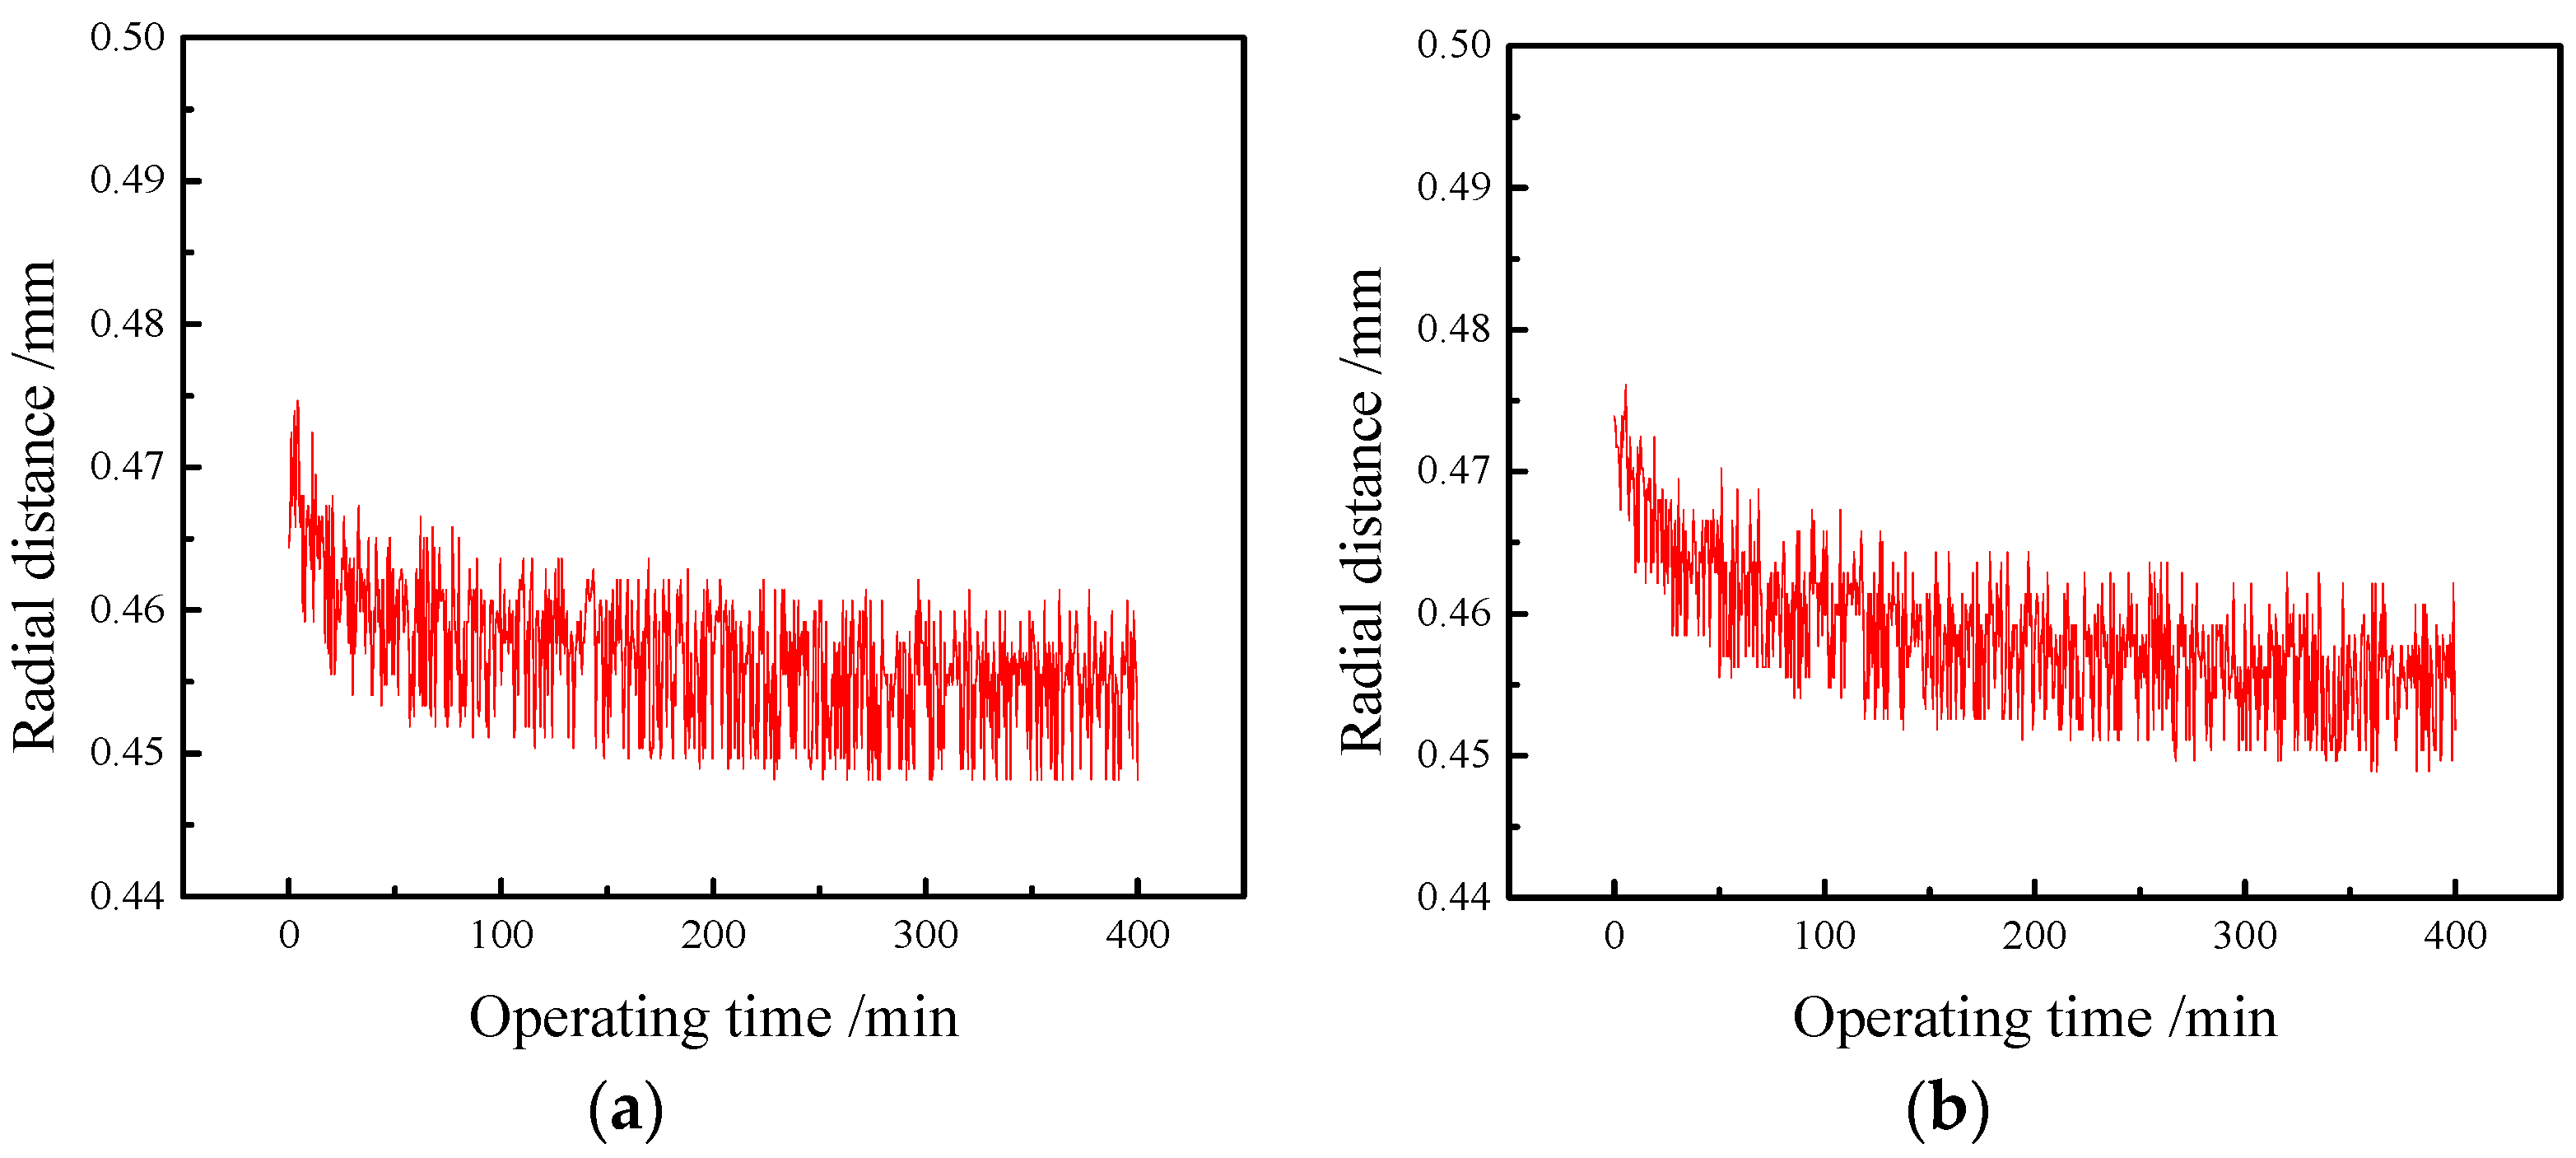
21]. The test on oil-film bearing oil of different brands was compared, and the oil-film temperature, oil-film pressure, and oil-film thickness were analyzed respectively. Finally, a comprehensive evaluation on operating performances of oil S220 was made after on-line testing for three months.

2. Experimental Apparatus and Method

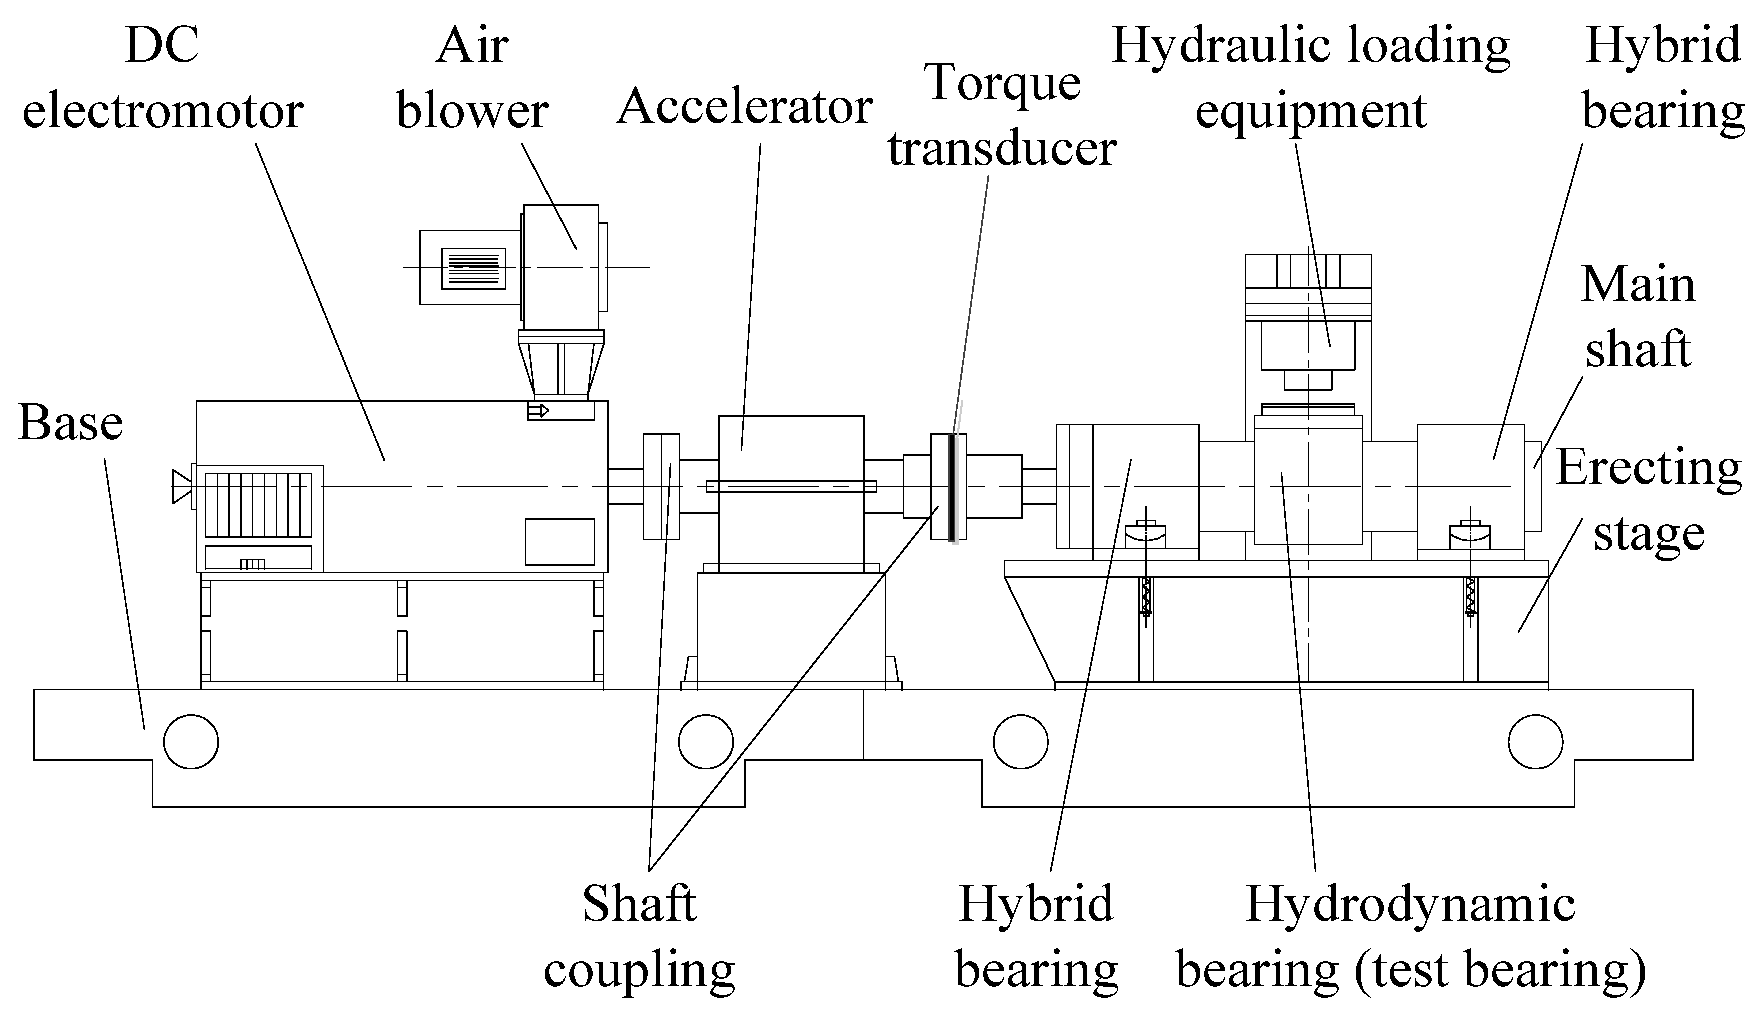
Bench test of oil-film bearing oil was conducted on large-scale mill oil-film bearing test rig. This test rig consists of a mechanical system, hydrodynamic lubrication system, hydrostatic lubrication system, thin-oil lubrication system used for the accelerator, hydraulic loading system, electrical control system, pneumatic control system, and data acquisition system. Its mechanical system is composed of a hydrostatic-dynamic oil-film bearing subsystem and experimental hydrodynamic oil-film bearing subsystem. The operating performances of oil-film bearing oil can be monitored on-line. The schematic diagram of oil-film bearing test rig is shown in Figure 1 [22].
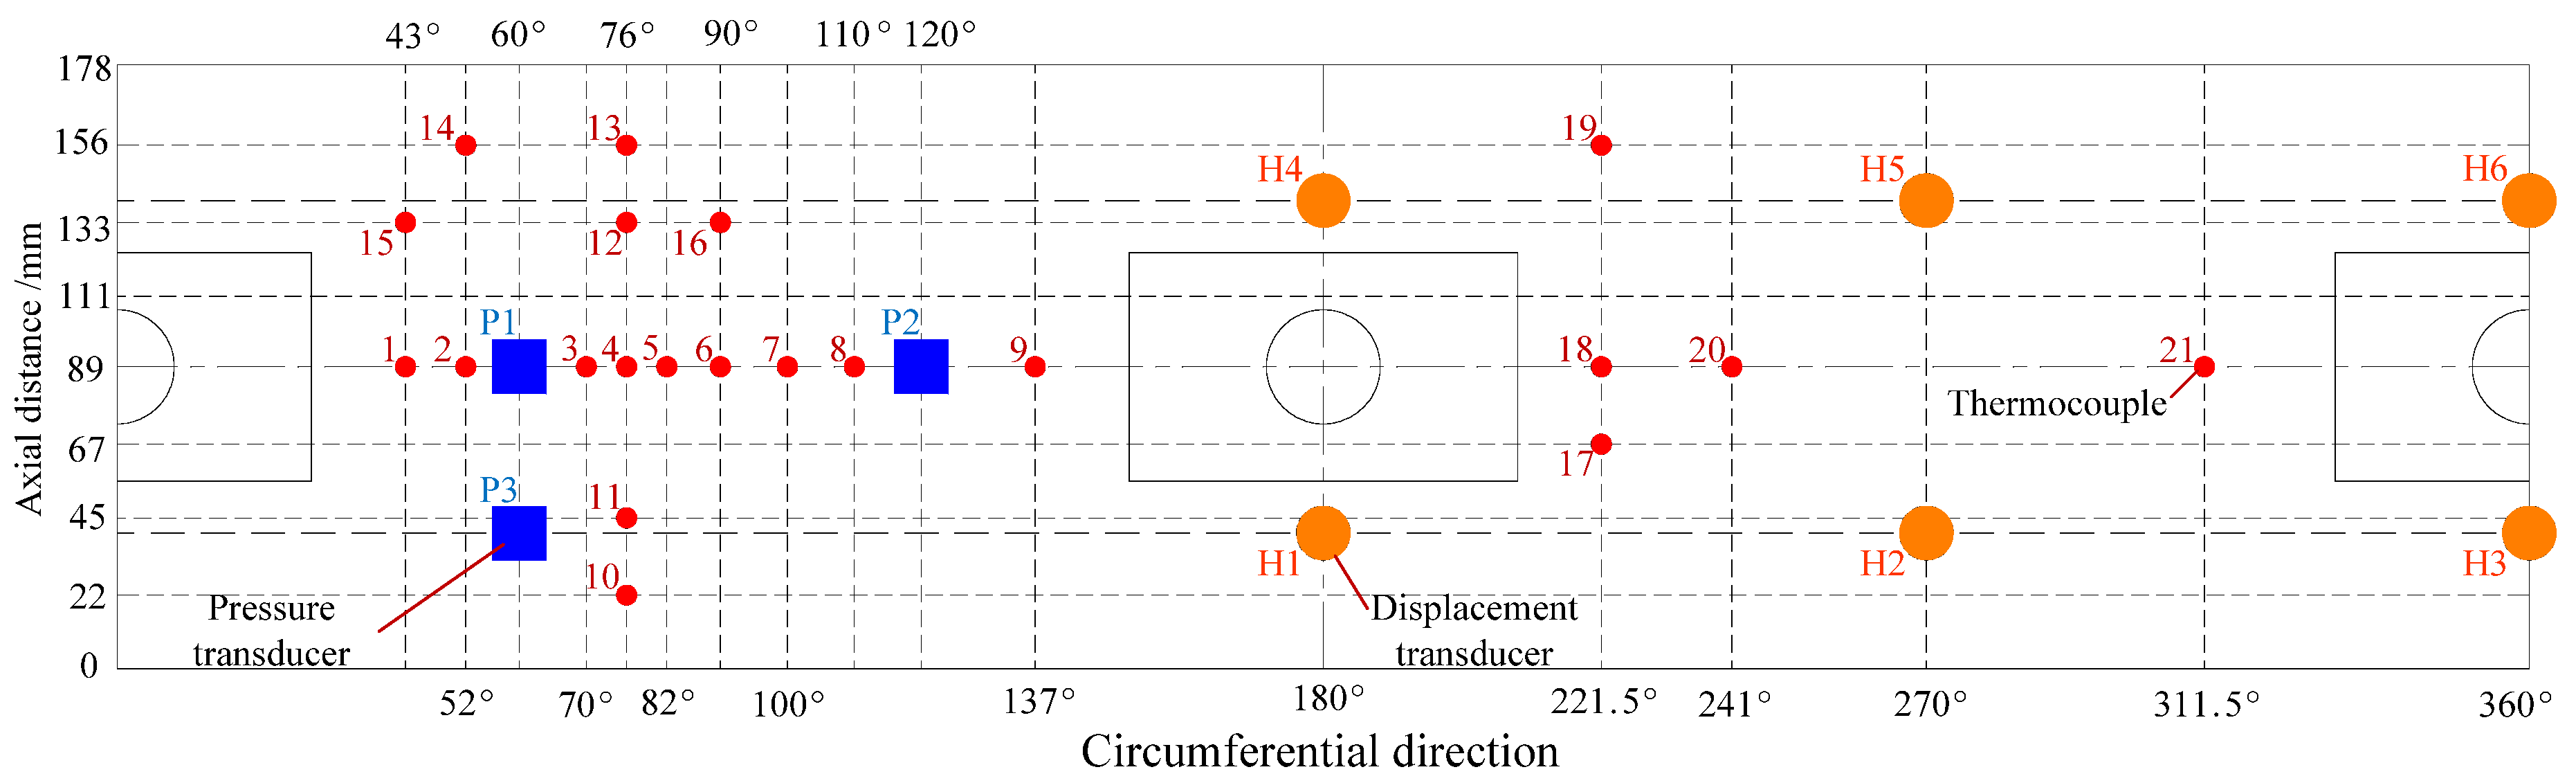
Several kinds of transducers have been installed in oil-film bearing test rig. Figure 2 is the distribution of different transducers on the test bearing. There are 3 pressure transducers (HYDAC-ETS300, HYDAC, Bremen, Germany) used for measuring oil-film pressure, 6 displacement transducers (BENTLY3300X, BENTLY, Exton, PA, USA) for oil-film thickness, 21 thermocouples (HYDAC-ETS300, HYDAC, Bremen, Germany) for oil-film temperature, and 1 torque transducer (ZRN503) (ZRN503, Beijing Ruineng Instrument Technology Co., Ltd., Beijing, China) for power or torque measurement in Figure 1. The transducers are distributed based on theoretical calculation results of oil-film pressure, oil-film thickness, and oil-film temperature, and the positions of transducers are determined in accordance with mesh subdivision of actual oil-film performance.
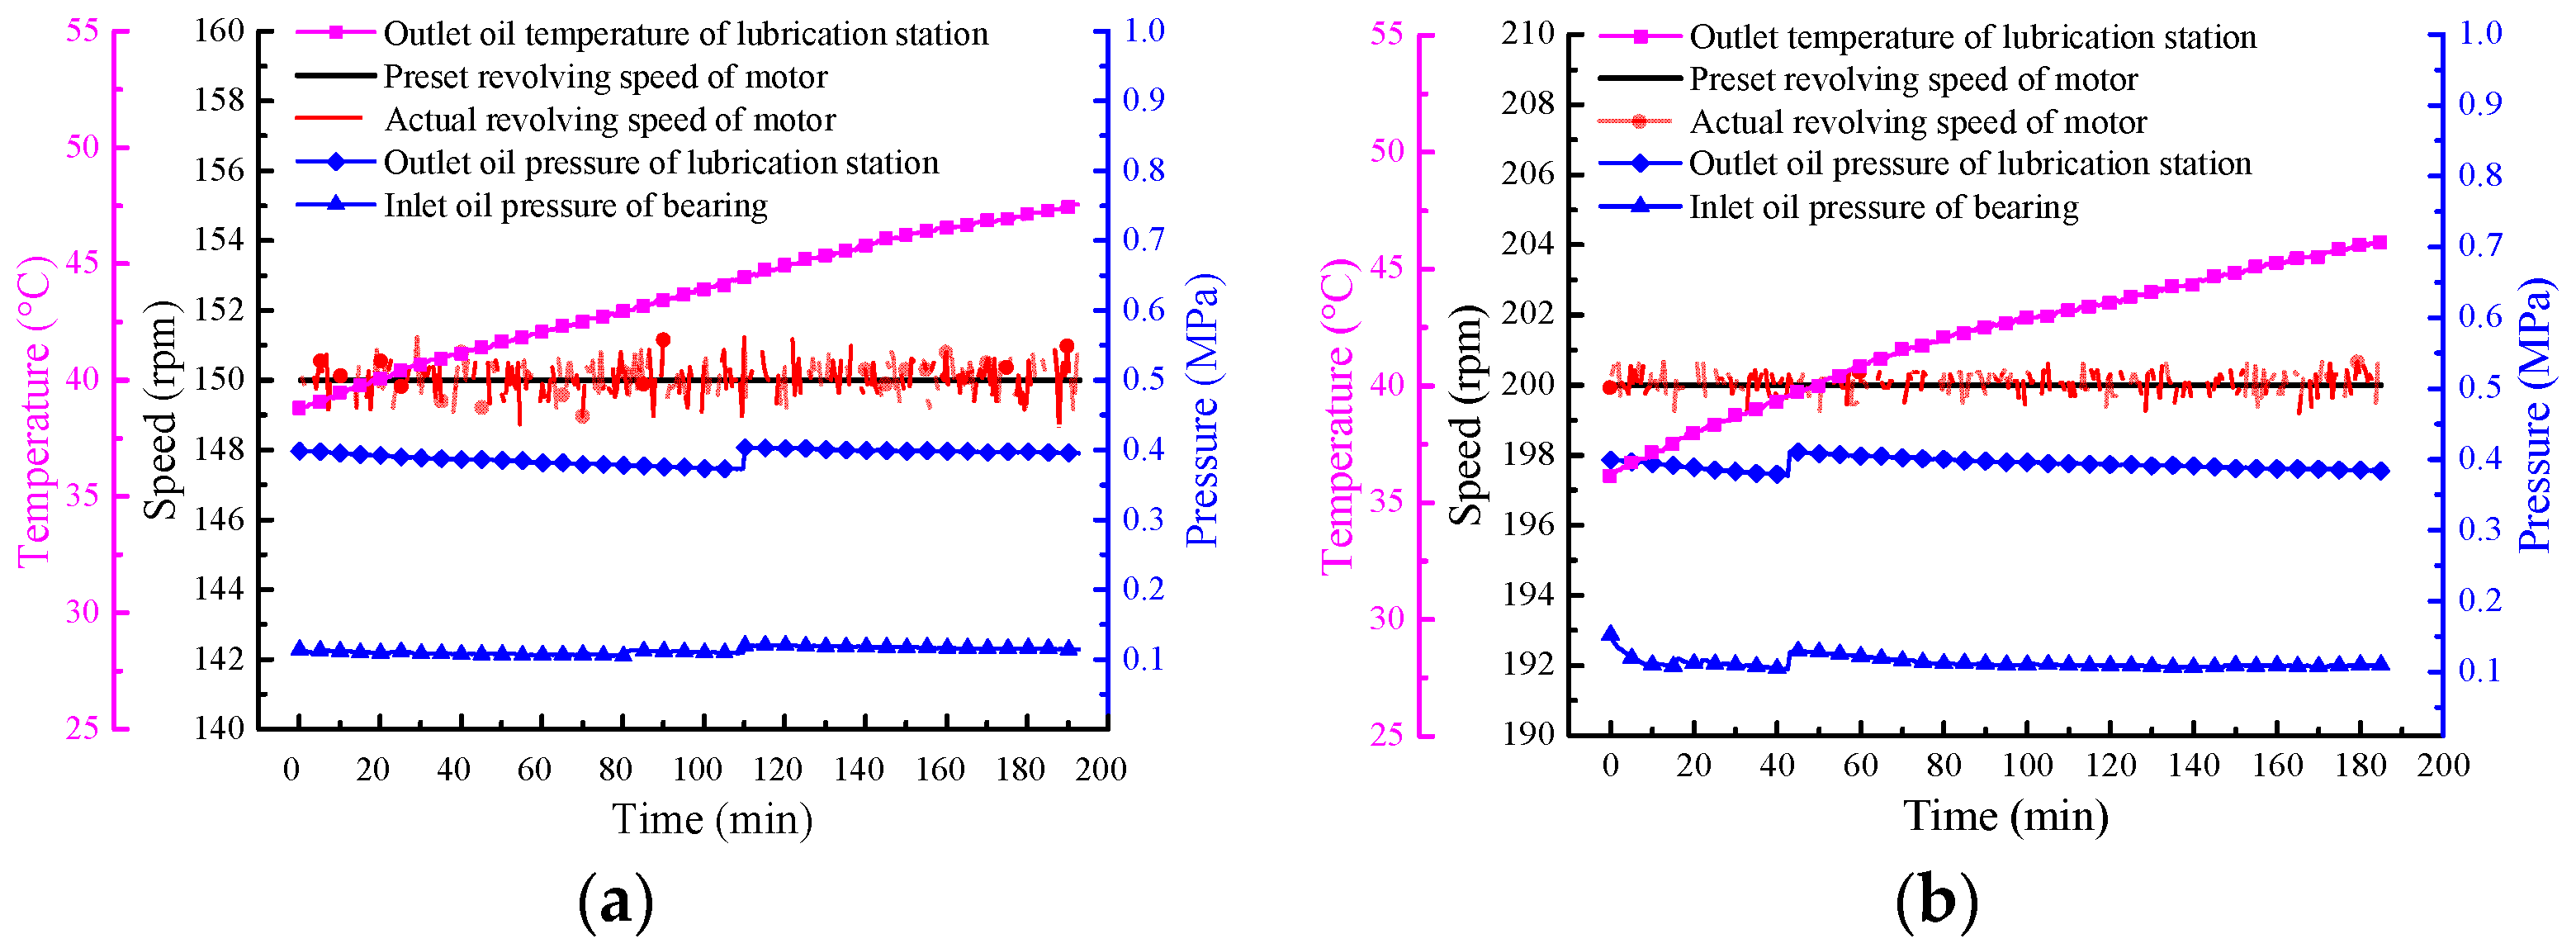
Physical signals from these transducers will be translated into digital signal via PLC (Programmable Logic Controller), and the digital signal will be displayed on IPC (Industrial Personal Computer) (610L, Advantech Co., Ltd., Shanghai, China). So the operating performances of oil-film bearing (Taiyuan Heavy Industries Co., Ltd., Taiyuan, China) can be monitored on-line. The main structural parameters of test bearing are shown in Table 1. When the oil supply is sufficient and the system is preheated, the instruction from upper computer will be transmitted to PLC, thereafter, the DC (Direct Current) electromotor (24-250-42, Xi'an Motor Co., Ltd., Xi'an, China) and hydraulic loading system will be started. When the test rig operates at the preset speed and load, the transducers begin to collect data of the oil film. In order to analyze the operating performances of oil-film bearing oil, six typical load cases were set, as shown in Table 2.

3. Results and Discussion

3.1. Systematic Performances

The monitoring system of the test rig can directly reflect the accuracy and reliability of oil [23]. Table 3 shows the fundamental parameters of both oils. Actual rotational speed of motor, outlet oil pressure of lubrication station, oil temperature of lubrication station, and inlet oil pressure of bearing effectively reflect the systematic properties of test rig. Table 4 gives the main parameters of systematic performances. As shown in Table 4, the systematic performances of the test rig under the lubrication of S220 under different load cases are approximately equivalent to that under the lubrication of M220, and each index generally meets the requirement of systematic operation.
Figure 3 illustrates the detailed systematic performances of the test rig at 150 rpm-12 MPa and 200 rpm-6 MPa respectively on basis of test on S220. The stability of the rotational speed of the motor will affect the distribution of oil-film pressure and the attitude angle when the force on the roller is under balance, and thereby affect the stability of oil film. During the test process, the absolute error between motor speed preset through the upper computer and actual speed fed back from the DC speed regulator basically keeps within ±1 rpm, and the relative error is less than 1%. Therefore, the accuracy of the rotational speed of the motor can meet the test requirements of the system.
In order to guarantee oil to flow into bearings, initial oil pressure must be set within a proper range. Pressure transducers and a self-operated pressure regulator installed on the oil pipeline near the entrance to bearings are used to monitor and regulate inlet oil pressure of bearings. As shown in Figure 3, the pressure of lubrication station is kept within 0.38~0.40 MPa. Actual inlet oil pressure of bearings is kept within 0.1~0.12 MPa, which is within the required range of the preset pressure.
High temperature will lead to low viscosity and decrease load-carrying capacity of bearings. In order to guarantee the operation safety of bearings, the limit on the outlet oil temperature of lubrication station must be set. Figure 3 shows that outlet oil temperature of the lubrication station during the test process is kept within 39~50 °C, which conforms to the requirement of the preset temperature.
As known from the above analysis, various systematic performances of the oil-film bearing test rig meet the test requirements: the relative error of motor speed is less than 1%, the rolling force keeps constant, and the temperature of the lubrication station and inlet oil temperature of bearing are within the specified range. The systematic properties of the oil-film bearing test rig are relatively stable, and the test rig can guarantee the normal test for oil-film bearing oil.

3.2. Oil-Film Temperature

3.2.1. Oil-Film Temperature of S220 and M220

Table 5 gives the operation time and the maximum temperature of both oils at stable operation states. The maximum temperature of oil increases with speed and load, but the operation time to the maximum temperature decreases. The rotational speed and load have great influence on lubricating properties of oil [24], and the test results under different load cases are obtained. Although there are different lubricating performances between S220 and M220, the difference gradually shrinks with the increase of speed and load. Ultimately, the lubricating performances of both kinds of oils with respect to temperature tend to be the same and ultimately reach equilibrium, and the maximum temperature is within the permitted range.
Figure 4 illustrates the oil-film temperature variation with time at 200 rpm-6 MPa. The temperature of T15 is the maximum temperature in the load-carrying area and the temperature of T25 is the maximum in the unload-carrying area. As shown in Figure 4, oil temperature rises gradually with time, but the gradient of temperature rise decreases constantly. Ultimately, the temperature tends to be constant and stable. This indicates that oil-film temperature will not rise infinitely but tends to be steady. Owing to higher oil-film pressure and larger internal friction in load-carrying area, more heat will be generated. So the temperature in the load-carrying area is higher than that in the unload-carrying area. Meanwhile, the equilibrium temperature of both oils is the same. As for the operating time to reach the equilibrium temperature, S220 is a little longer than M220.
The distribution of the circumferential temperature from the equilibrium stage in the mid-plane of bearing at 200 rpm-6 MPa is illustrated in Figure 5. The temperature was tested by thermocouples from T1 to T12 in the load-carrying area and by T21 and T25 in the unload-carrying area. As shown in Figure 5, the temperature distribution of both oils is the same. Because oil-film temperature in the load-carrying area generally represents the load-carrying capacity and the stability of oil film, the load-carrying capacity and stability of both are equivalent.
The distribution of axial temperature from equilibrium stage in load-carrying area at 200 rpm-6 MPa is depicted in Figure 6. The temperature in the load-carrying area increases along the axial direction, but temperature difference exists in both oils. The difference is somewhat larger on both ends of the bearing and smaller in the middle region. The difference is within 1 °C. Therefore, the temperature distribution of both oils is similar along the axial direction.
As known from above, both oils are extremely similiar in the operating temperature and the temperature distribution. Oil-film temperature reflects load-carrying performance and service life of oil-film bearing oil, so the load-carrying capacity of S220 is equivalent to that of M220.

3.2.2. Prediction of Operating Temperature

In order to study the influence of load cases on oil-film temperature and further analyze the operating performances of both oils with the same viscosity, the temperatures of S220 and M220 are compared under the same load and at different speeds, as shown in Figure 7, and the temperatures of S220 and M220 at the same speed and under different loads are shown in Figure 8.
Figure 7 shows the comparison of temperature under the same load and at different speeds. The operating temperature increases with time, but the gradients of temperature rise at 200 rpm-6 MPa is larger than that at 100 rpm-6 MPa. The equilibrium temperature of both oils at 100 rpm-6 MPa and at 200 rpm-6 MPa are respectively about 50 °C and 60 °C which indicates that the increase of rotational speed leads to the increase of the gradient of temperature rise. This is because the increase of rotational speed results in the generation of more friction heat.
Figure 8 shows the comparison of temperature at the same speed and under different loads. The operating temperature increases with time, but the gradients of temperature rise at 150 rpm-12 MPa is larger than that at 150 rpm-6 MPa. The ultimate temperature of both oils at 150 rpm-6 MPa and 150 rpm-12 MPa is respectively about 55 °C and 60 °C, which indicates that the increase of load leads to the increase of the gradient of temperature increase. This is because the increase of load also results in the generation of more friction heat.
In order to predict oil-film temperature at a given time, the temperature of both oils was compared and analyzed. A large amount of test data indicates that the relationship between temperature and time conforms to Formula (1) as below through the data fitting method [25,26].
T = A 2 + ( A 1 A 2 ) 1 + ( t t a ) p
where T is Oil-film temperature, °C; t is operating time, min; A1, A2, ta, and p are constants of which the value can be fitted based on the test data, °C, °C, min, 1.
Oil-film temperature under some load cases and at given times can be predicted through Formula (1). Similarly, if the permitted temperature is given, the operation time of the system can be predicted. For instance, the temperature of S220 and M220 at 100 rpm-6 MPa is fitted respectively as shown in Formulas (2) and (3), in which each related parameter is shown in Table 6. If the operation time t tends to be infinite, the extreme temperature T of oil-film will be A2. The extreme temperature of S220 and M220 is 52.64 °C and 51.29 °C respectively through Formulas (2) and (3). From the calculated results, it can be concluded that there exists a difference in operating temperature of both oils, but the difference is not very large.
For S220:
T S 220 = 52.64 20.8 1 + ( t 78.46 ) 1.08
For M220:
T M 220 = 51.29 21.47 1 + ( t 91.93 ) 1.12
Figure 9 shows the relative error [27] of temperature of both oils between test data and fitted data, and the calculation equation is as Formula (4). As shown in Figure 9, the relative error is less than 0.5% at almost all times except at a few moments such as at the beginning of operation. Therefore, it is relatively accurate to describe the operating performance of oil with Formula (1).
δ = | T test T fitted | T test × 100 %

3.3. Oil-Film Pressure

In Section 3.2, oil-film temperature under different load cases has been analyzed and oil-film temperature determines the safety of operation [28,29]. In order to avoid repeatedly analyzing the influence of load cases on the operating performance of oil-film bearing oil, the emphasis in Section 3.3 and Section 3.4 will be on the comparison between two kinds of oil-film bearing oil, and 150 rpm-6 MPa is selected as the analyzing load case [30,31].
Figure 10 is the comparison of oil-film pressure between S220 and M220 at 150 rpm-6 MPa. P1 and P2 (P means pressure transducer) are in the same circumferential direction, and P1 and P3 are in the same axial direction, e.g., the theoretical oil-film pressures at 150 rpm-6 MPa were P1 = 1.528069, P2 = 0.475358, and P3 = 0.701255 by numerical calculation, which is obvious that P1 > P3 > P2. As shown in Figure 10, the experimental results of oil-film pressure of both oils conform to the theoretical distribution. P1 is the nearest to the loading point, so it is the maximum. P3 is near to the axial end of oil-film bearing, so it is smaller. P2 locates in the unload-carrying area, so it is the smallest. During the whole operation stage, the oil-film pressure always keeps constant, and both oils have the equal oil-film pressure at the corresponding points. Therefore, both oils have the approximate same oil-film pressure.

3.4. Oil-Film Thickness

The variations of oil-film thickness with time at 150 rpm-6 MPa are shown from Figure 11, Figure 12 and Figure 13. Figure 14 is the comparison of minimum oil-film thickness between S220 and M220 at 150 rpm-6 MPa. Oil-film thickness is obtained from displacement transducers H1, H2, and H3, and their positions are shown in Figure 2. As is known from these figures, the oil-film thickness is large at the initial phase and then tends to decrease, and the minimum oil-film thickness of both oils is almost the same. Therefore, the oil-film thickness of S220 and M220 has the same variation laws.

4. Conclusions

The oil-film bearing test rig can realize the monitoring of operating performances of oil-film bearings with thermocouples, pressure transducers, and displacement transducers installed on the test bearings. From the above analysis, several conclusions can be obtained as follows:
(1)
All property indexes of an oil-film bearing test rig can meet the specified requirements, and the test rig can guarantee the performance test of oil-film bearing oil.
(2)
The temperature performance of S220 is generally equal to that of M220 and both have the equivalent operation stability. The oil-film temperature performance conforms to Formula (1), and can be predicted at given load case through Formula (1).
(3)
Although the oil-film pressure of M220 is a little more stable, the oil-film pressure performance of S220 is similar to that of M220.
(4)
S220 and M220 have the same performance of oil-film thickness, and the oil-film thickness of S220 is slightly smaller than that of M220, especially at the beginning of operation.
(5)
From the comprehensive three months of comprehensive testing, S220 is evaluated to be suitable for further engineering application.

Acknowledgments

This work is supported by the Natural Science Foundation of Shanxi Province (No. 201601D011049), Shanxi Patent Generalization and Implementation of Special Funding (No. 2016005), and Shanxi Provincial Key Research and Development Project (201603D111017).

Author Contributions

Jianmei Wang and Reza Malekian conceived and designed the experiments; Min Cai performed the experiments; Yanan Zhang and Zhixiong Li analyzed the data; Min Cai contributed reagents/materials/analysis tools; Jianmei Wang wrote the paper.

Conflicts of Interest

The authors declare no conflict of interest.

Nomenclature

The following symbols are used in this manuscript:
TOil-film temperature, °C
A1, A2, ta, pconstants of which the value can be fitted based on the test data, °C, °C, min, 1
toperating time, min
TS220temperature of oil S220, °C
TM220temperature of oil M220, °C
Ttesttest temperature, °C
Tfittedfitted temperature, °C
δrelative error, 100%
S220New type oil-film bearing oil of brand type S with viscosity 220
M220existent oil-film bearing oil of brand type M with the same viscosity, which has been widely applied in engineering

References

  1. Tang, C. The developing of high speed wire and rod mill oil. Drive Syst. Tech. 2006, 20, 44–48. [Google Scholar]
  2. Huang, G.X.; Wang, J.M.; Jing, D.H. Pressure distribution and damages of oil-film bearing sleeve during the process of interference fit. Chin. J. Mech. Eng. 2006, 42, 102–108. [Google Scholar] [CrossRef]
  3. Moritsugu, K.; Fillon, M.; Bouyer, J.; Jarny, S. Influence of lubricants on plain bearing performance: Evaluation of bearing performance with polymer-containing oils. Tribol. Int. 2012, 46, 190–199. [Google Scholar]
  4. Santos, J.C.O.; Lima, L.N.; Santos Iêda, M.G.; Souza, A.G. Thermal, spectroscopic and rheological study of mineral base lubricating oils. J. Ther. Anal. Calorim. 2007, 87, 639–643. [Google Scholar] [CrossRef]
  5. Li, X.W.; Su, J. The automobile engine lubricating oil monitor engineering research based on the near-infrared light method. In Proceedings of the International Conference on Consumer Electronics, Communications and Networks (CECNet 2011), Xianning, China, 16–18 April 2011; pp. 3678–3681.
  6. Drabik, J.; Trzos, M. Modelling relation between oxidation resistance and tribological properties of non-toxic lubricants with the use of artificial neural networks. J. Ther. Anal. Calorim. 2012, 109, 521–527. [Google Scholar] [CrossRef]
  7. Sasaki, A. Contaminants in used Oils and their problems. Proc. Inst. Mech. Eng. Part J J. Eng. Tribol. 2006, 220, 471–478. [Google Scholar] [CrossRef]
  8. Liu, G.; Li, X.; Lu, N.; Fan, R.H. Enhancing AW/EP property of lubricant oil by adding nano Al/Sn particles. Tribol. Lett. 2005, 18, 85–90. [Google Scholar] [CrossRef]
  9. Perez, J.M.; Weller, J.; David, E.; Duda, J.L. Sequential four-ball study of some lubricating oils. Lubr. Eng. 1999, 55, 28–32. [Google Scholar]
  10. Martins, R.; Cardoso, N.; Seabra, J. Gear power loss performance of biodegradable low-toxicity ester-based oils. Proc. Inst. Mech. Eng. Part J J. Eng. Tribol. 2008, 222, 431–440. [Google Scholar] [CrossRef]
  11. Wang, J.M.; Huang, Q.X.; Sun, J.Z.; Xue, T. Design and development of hydrodynamic lubricating system of large-scale mill oil-film bearing test rig. Adv. Mater. Res. 2011, 145, 274–277. [Google Scholar] [CrossRef]
  12. Masuda, T.; Ushijima, K.; Hamai, K. Measurement of oil film pressure distribution in connecting rod bearing with test rig. Tribol. Trans. 1992, 35, 71–76. [Google Scholar] [CrossRef]
  13. Dimond, T.; Rockwell, R.D.; Sheth, P.N.; Allaire, P.E. A new fluid film bearing test rig for oil and water bearings. Proc. ASME Turbo Expo Part B Power Land Sea Air 2008, 5, 1101–1110. [Google Scholar]
  14. Grigor’eva, N.I.; Tarabaev, G.I.; Kudryavtsev, S.N.; Gavrilova, I.A. Russian Lubricating Oils for Rolling Mills with Fluid-Friction Bearings. Metallurg 2005, 49, 64. [Google Scholar] [CrossRef]
  15. Mao, D.H.; Wang, W.J.; Cheng, J.; Tan, J.P. Performance of lubricating oil film in aluminium foil rolling. Trans. Nonferr. Met. Soc. China 1999, 9, 30–35. [Google Scholar]
  16. Brito, F.P.; Miranda, A.S.; Claro, J.C.P.; Fillon, M. Experimental comparison of the performance of a journal bearing with a single and a twin axial groove configuration. Tribol. Int. 2012, 54, 1–8. [Google Scholar] [CrossRef] [Green Version]
  17. Morton, P.G.; Johnson, J.H.; Walton, M.H. Paper XI(ii) The influence of grooves in bearings on the stability and response of rotating systems. Tribol. Ser. 1987, 11, 347–354. [Google Scholar]
  18. Bouyer, J.; Fillon, M. Experimental measurement of the friction torque on hydrodynamic plain journal bearings during start-up. Tribol. Int. 2011, 44, 772–781. [Google Scholar] [CrossRef]
  19. Glavatskih, S.B.; Uusitalo, Ö.; Spohn, D.J. Simultaneous monitoring of oil film thickness and temperature in fluid film bearings. Tribol. Int. 2001, 34, 853–857. [Google Scholar] [CrossRef]
  20. Simmons, G.F.; Glavatskih, S.B. Synthetic Lubricants in Hydrodynamic Journal Bearings: Experimental Results. Tribol. Lett. 2011, 42, 109–115. [Google Scholar] [CrossRef]
  21. Ma, L. Optimization of the System Performance of Oil Film Bearing Test Bed. Master’s Thesis, Taiyuan University Science Technology, Taiyuan, China, Apirl 2014. [Google Scholar]
  22. Wang, J.M.; Kang, J.F.; Zhang, Y.J.; Huang, X.J. Viscosity monitoring and control on oil-film bearing lubrication with ferrofluids. Tribol. Int. 2014, 75, 61–68. [Google Scholar]
  23. Yan, K.; Wang, N.; Zhai, Q.; Zhu, Y.S.; Zhang, J.H.; Niu, Q.B. Theoretical and experimental investigation on the thermal characteristics of double-row tapered roller bearings of high speed locomotive. Int. J. Heat Mass Transf. 2015, 84, 1119–1130. [Google Scholar] [CrossRef]
  24. Takabi, J.; Khonsari, M.M. Experimental testing and thermal analysis of ball bearings. Tribol. Int. 2013, 60, 93–103. [Google Scholar] [CrossRef]
  25. Yang, G.W.; Xu, J. A new fitting scattered data method based on the criterion of geometric distance. AASRI Procedia 2014, 6, 41–48. [Google Scholar] [CrossRef]
  26. Sari, M. An improved method of fitting experimental data to the Hoek–Brown failure criterion. Eng. Geol. 2012, 127, 27–35. [Google Scholar] [CrossRef]
  27. Jones, M.C.; Park, H.S.; Shin, K.-I.; Vines, S.K.; Jeong, S.O. Relative error prediction via kernel regression smoothers. J. Stat. Plan. Inference 2008, 138, 2887–2898. [Google Scholar] [CrossRef]
  28. Zhang, X.; Shao, J.; An, W.; Yang, T.; Reza, M. An Improved Time-Frequency Representation based on Nonlinear Mode Decomposition and Adaptive Optimal Kernel. Elektron. Elektrotech. 2016, 22, 52–57. [Google Scholar]
  29. Jin, X.; Shao, J.; Zhang, X.; An, W.; Malekian, R. Modeling of nonlinear system based on deep learning framework. Nonlinear Dyn. 2016, 84, 1327–1340. [Google Scholar] [CrossRef]
  30. Su, B.; Malekian, R.; Yu, J.; Feng, X.; Liu, Z. Electrical Anisotropic Response of Water Conducted Fractured Zone in the Mining Goaf. IEEE Access 2016, 4, 6216–6224. [Google Scholar] [CrossRef]
  31. Gong, T.; Huang, H.; Chen, P.; Malekian, R.; Chen, T. Secure Two-party Distance Computation Protocol Based on Privacy Homomorphism and Scalar Product in Wireless Sensor Networks. Tsinghua Sci. Technol. 2016, 21, 385–396. [Google Scholar]
Figure 1. Schematic diagram of oil-film bearing test rig.
Applsci 07 00028 g001
Figure 2. Distribution of different transducers on the test bearing.
Applsci 07 00028 g002
Figure 3. Systematic properties of an oil-film bearing test rig. (a) 150 rpm-12 MPa; (b) 200 rpm-6 MPa.
Applsci 07 00028 g003
Figure 4. The oil-film temperature variation with time at 200 rpm-6 MPa.
Applsci 07 00028 g004
Figure 5. Circumferential temperature distribution in the mid-plane of bearing at 200 rpm-6 MPa.
Applsci 07 00028 g005
Figure 6. The axial temperature distribution in the load-carrying area at 200 rpm-6 MPa.
Applsci 07 00028 g006
Figure 7. Comparison of temperature under the same load and at different speeds. (a) S220; (b) M220.
Applsci 07 00028 g007
Figure 8. Comparison of temperature at the same rotational speed and different loads. (a) S220; (b) M220.
Applsci 07 00028 g008
Figure 9. The relative error in temperature between test value and fitted value. (a) S220; (b) M220.
Applsci 07 00028 g009
Figure 10. Comparison of oil-film pressure between S220 and M220 at 150 rpm-6 MPa. (a) S220; (b) M220.
Applsci 07 00028 g010
Figure 11. The variation of oil-film thickness from displacement transducer H1 with time at 150 rpm-6 MPa. (a) S220; (b) M220.
Applsci 07 00028 g011
Figure 12. The variation of oil-film thickness from displacement transducer H2 with time at 150 rpm-6 MPa. (a) S220; (b) M220.
Applsci 07 00028 g012
Figure 13. The variation of oil-film thickness from displacement transducer H3 with time at 150 rpm-6 MPa. (a) S220; (b) M220.
Applsci 07 00028 g013
Figure 14. The comparison of minimum oil-film thickness between S220 and M220 at 150 rpm-6 MPa. (a) S220; (b) M220.
Applsci 07 00028 g014
Table 1. Main structure parameters of the test bearing.
Structure ParametersValue (mm)
Bearing diameter D220
Bearing length L178
Radial clearance c0.10
Table 2. Six typical load case combinations for testing.
Load Case123456
Revolving speed (rpm)100150150200300300
Hydraulic load (MPa)6.06.012.06.06.012.0
Table 3. Fundamental parameters of both oils.
Viscosity Grade220
40 °C Viscosity (mm2/s)219.3
100 °C Viscosity (mm2/s)25.38
Viscosity index147
Flash point (°C)248
Pour point (°C)−48
Table 4. Systematic performances under different load cases.
OilLoad Case (rpm-MPa)Actual Rotational Speed of Motor (rpm)Inlet Oil Pressure of Bearing (MPa)Outlet Oil Pressure of Lubrication Station (MPa)Outlet Oil Temperature of Lubrication Station (°C)Maximum Rise of Oil Temperature (°C)Highest Temperature in Bearing Block (°C)
M220100-698.63~100.950.10~0.120.376~0.40634.64~47.6018.9143.80
150-6148.93~151.000.10~0.130.383~0.40737.71~49.6920.0449.40
150-12148.62~151.180.10~0.120.373~0.40538.80~47.5514.6948.70
200-6198.97~200.810.11~0.120.377~0.41236.15~51.4623.5553.00
300-6299.26~300.660.10~0.130.384~0.40140.43~42.7616.6949.00
300-12298.83~301.210.10~0.110.392~0.40339.53~40.7810.9245.20
S220100-698.75~101.140.10~0.130.394~0.39837.14~45.5216.8544.60
150-698.39~100.950.10~0.120.375~0.40837.23~49.4821.9450.30
150-12148.86~151.180.10~0.130.380~0.40840.31~46.6119.8750.30
200-6199.10~200.810.10~0.130.380~0.40636.77~47.9224.9951.80
300-6299.07~300.600.10~0.120.375~0.41236.67~40.5722.3548.50
300-12299.01~300.720.10~0.120.381~0.39938.18~39.9013.0444.00
Table 5. Operation time and maximum temperature under different load cases.
Load Case (rpm-MPa)S220M220
Maximum Temperature of Oil (°C)Location with the Maximum TemperatureOperation Time to Maximum Temperature (h)Maximum Temperature of Oil (°C)Location with the Maximum TemperatureOperation Time to Maximum Temperature (h)
100-0647.21T158.0248.69T158.17
150-0656.56T157.1054.59T157.20
150-1260.01T155.3359.42T156.10
200-0659.71T153.6059.81T154.30
300-0660.00T150.8360.01T151.10
300-1260.20T150.4060.01T150.50
Table 6. Fitted values of related parameters of different kinds of oil.
Oil TypeA1 (°C)A2 (°C)t0 (min)p
S22031.8452.6478.461.08
M22029.8251.2991.931.12

