
A Modified Bio-Ecological Process for Rural Wastewater Treatment

1
School of Energy and Environment, Southeast University, Nanjing 210096, China
2
Department of Environmental Science, FUUAST, Karachi 75300, Pakistan
*
Author to whom correspondence should be addressed.
Appl. Sci. 2017, 7(1), 66; https://doi.org/10.3390/app7010066
Submission received: 20 October 2016
/
Revised: 5 January 2017
/
Accepted: 5 January 2017
/
Published: 10 January 2017
Abstract
:Limited water resources and ensuring access to clean water are critical environmental challenges, especially for the developing world. In particular, rural domestic wastewater has become a significant source for the pollution of freshwater bodies. A modified bio-ecological A2O-wetland system for rural wastewater treatment consisting of a biological unit (anaerobic baffled reactor, anoxic tank and oxic unit, A2O) and an ecological unit (horizontal flow constructed wetland) was developed, and key performance indicators were identified. The bio-ecological treatment system showed high removal efficiency for pollutants, successfully achieving 91%, 85%, 78%, and 92% removal efficiencies for chemical oxygen demand (COD), ammonium (NH4–N), total nitrogen (TN), and total phosphorus (TP), respectively. The concentrations of pollutants in the effluent from the system were lower than the Class 1 A regulated values of the Chinese National Standard GB18918-2002. The system offered high removal efficiency, simple operation, and low energy consumption. The A2O-wetland is a good alternative for rural wastewater treatment systems.

1. Introduction
Over the past few decades, the deterioration of freshwater has become a global phenomenon that will further intensify the demand for water reuse [1,2]. The inadequate supply of water also poses health risks to consumers because of its poor quality. The discharge of domestic sewage is a principal source of pollution for freshwater bodies [3]. Effective wastewater management and treatment is critical for maintaining public health and safe environments [4]. Domestic wastewater typically contains suspended solids, pathogen microorganisms, nutrients, and other pollutants [5]. For environmental safety and health hazards, these pollutants must be brought down to permissible levels for safe wastewater disposal [6]. Therefore, wastewater treatment is of paramount importance before discharging to the environment [7].
Lack of adequate sanitation system can be a source of pollution and a risk to the health of human beings and the environment as well. Hence, a significant worldwide effort has been made to implement and improve sanitation systems in the last few decades [8]. However, according to WHO (World Health Organization) [9] 2500 million people were still without access to appropriate sanitation systems. Therefore, it is critical to improve and implement basic wastewater treatment facilities in the affected populations, mainly in developing countries, where people live with extreme poverty conditions, particularly rural inhabitants or peri-urban dwellers [10]. Moreover, wastewater treatment is not only a problem concerning developing countries, different associated problems still have to be solved in industrialized and developed countries as well [11]. Recently, the primary focus of sanitation has changed to the reduction of environmental impacts [12]. Primarily centralized systems have been built to treat wastewater in urban or densely populated areas [13], and have required large investment costs for sewer networks [14]. For rural areas there is a need to adopt decentralized wastewater treatment methods, because wastewater collection in the villages is difficult due to the dispersed layout, small-scale, and complex geographic conditions [15].
One of the main concerns regarding municipal wastewater discharge is the concentration of nutrient compounds [16]. These nutrients can stimulate the growth of aquatic vegetation in receiving water bodies, thereby decreasing the oxygen concentration [17]. Eutrophication of freshwaters bodies has gained increased attention, and a number of wastewater treatment methods have been developed to address this issue. Over the past few years some new technologies have been developed for rural or decentralized sewage treatments, such as the multistep A2O-H system [18], A2O-BAF system [19], five-step continuous flow activated sludge process (FSCFASP) [20], septic tanks [20], algal ponds [21], and soil trenches [22]. Most of these processes are selective or have operational issues. Molinos-Senante et al. [23] described an ANP (analytical network processes) approach to rank wastewater treatment technology set-ups for small communities by assessing multiple interdependences elements. Their results illustrated that constructed wetland is the most preferred alternative technology.
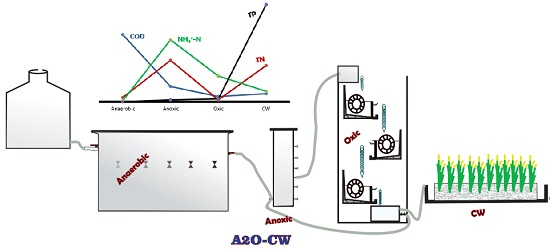
Decentralized sanitation systems can have great success in rural and peri-urban areas that lack sanitation coverage [24]. Conventional wastewater technologies are expensive to build, maintain, and operate [24], especially for scattered populations. Therefore, it is important to develop economical, environmentally sustainable, and socially acceptable wastewater treatment technologies for rural areas [25]. A modified simple bio-ecological (A2O-CW) wastewater treatment system was developed in this study. The biological system consists of an anaerobic baffled reactor (ABR), anoxic tank, and an oxic unit with an ecological unit consisting of a constructed wetland. The system offered simple operation, low energy consumption, and high treatment efficiency.
2. Materials and Methods
2.1. Reactor Setup
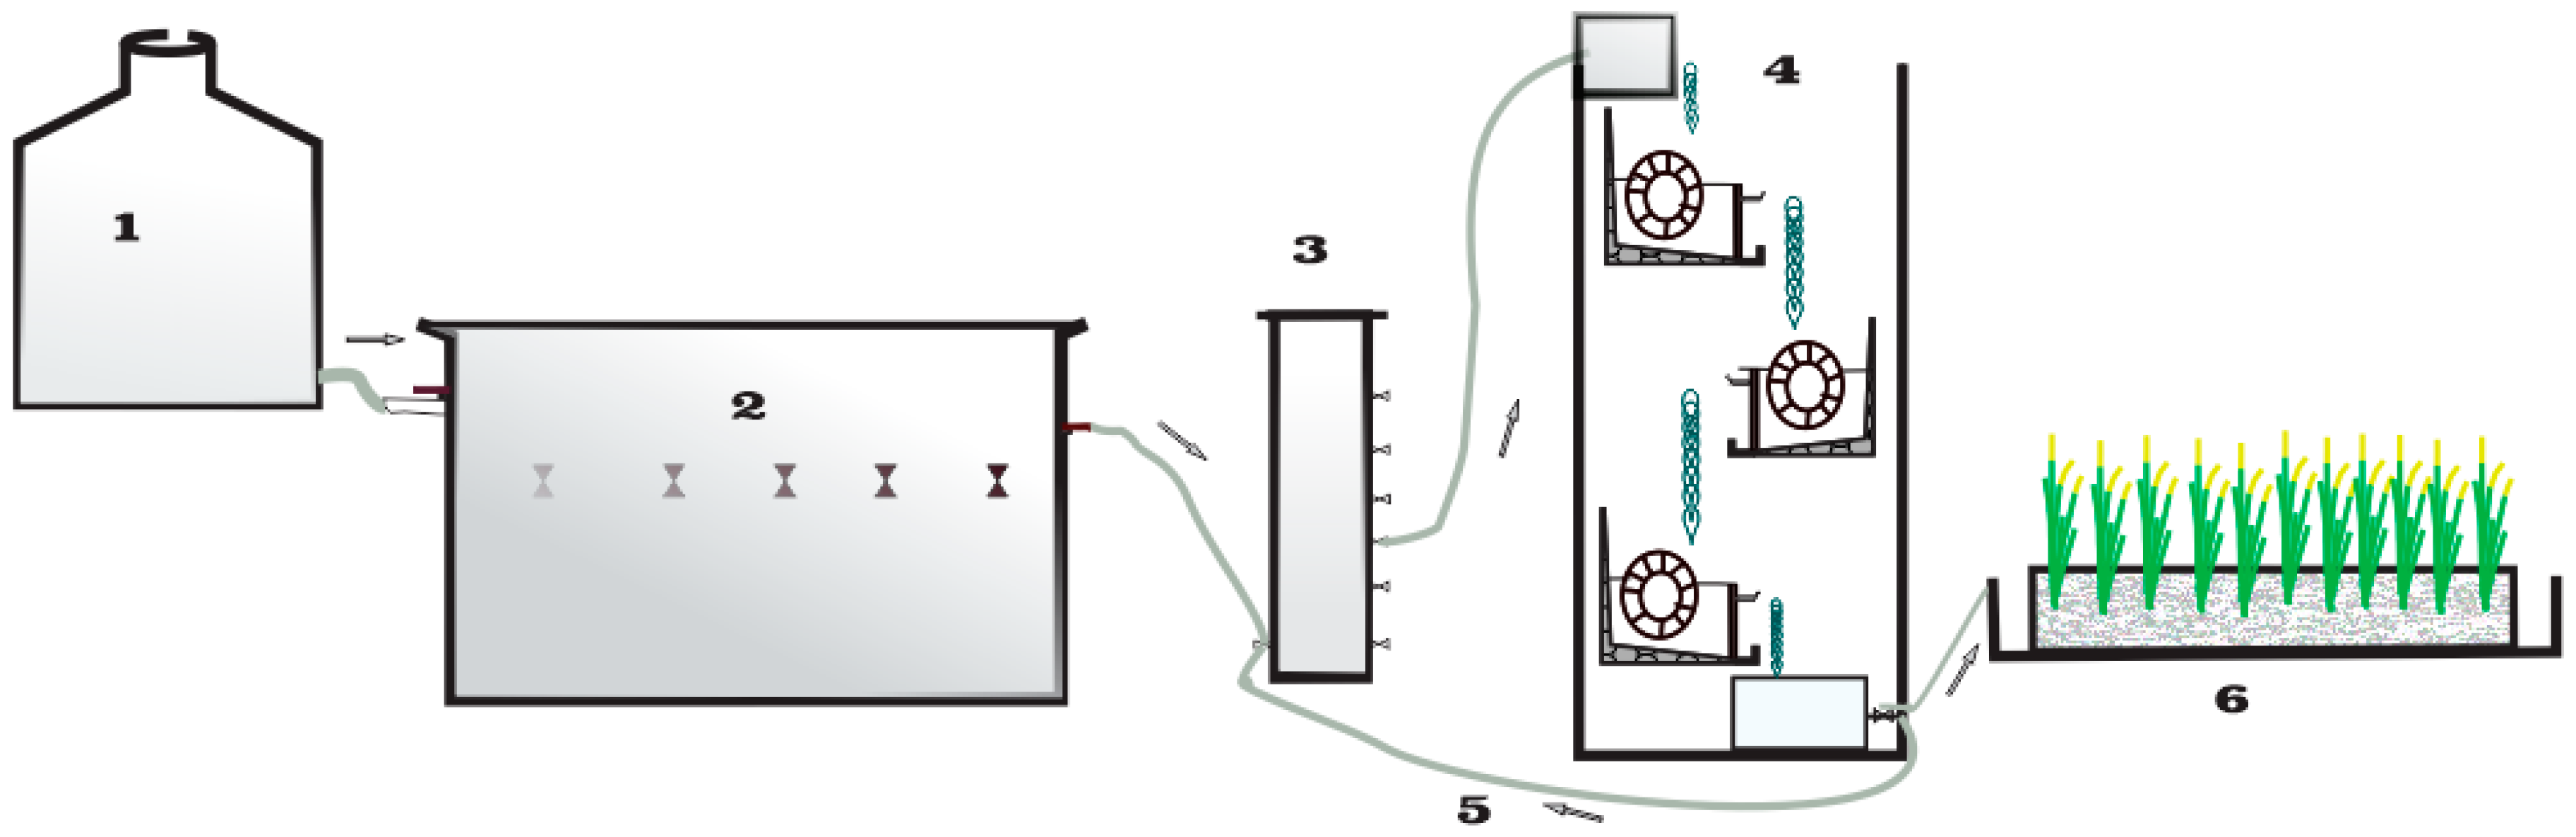
A lab-scale novel bio-ecological setup consisting of an anaerobic baffled reactor (ABR), anoxic tank, oxic unit and constructed wetlands is shown in Figure 1.
2.1.1. Anaerobic Baffled Reactor
The anaerobic baffled reactor (ABR) was 1 m × 0.2 m × 0.75 m (length × width × height) with an effective volume of 100 L. The reactor had vertical baffles dividing the reactor into five compartments and each compartment was filled with non-woven cloth. The outlet of each compartment had a DN10 sampling port.
2.1.2. Anoxic Tank
The anoxic tank was 1 m × 0.2 m × 0.2 m (height × length × width) with an effective volume of 32 L. The device was equipped with outlets at different heights.
2.1.3. Oxic Unit
The oxic part of the A2O-wetland system consisted of three cells, and each cell contained a rectangular tank (0.2 m × 0.2 m × 0.1 m in diameter), a bio-wheel, and a rotating disc working on the watermill principle. The wastewater dropped and pushed the blades of the wheel to rotate an axle that drove the bio-wheel in the reaction tank.
2.1.4. Constructed Wetland
The HFCW (horizontal flow constructed wetland) was a rectangular PVC (polyvinyl chloride) container 1 m long, 0.2 m wide, and 0.6 m deep. The constructed wetland was packed with 15 cm supporting layer of gravel (20–40 mm), 30 cm of cobblestone (0.5–2 mm diameter), and 5 cm of sand and soil mixture, planted with Ipomoea aquatica (water spinach). The hydraulic loading rate was set according to the biological unit effluent.
2.2. Experimental Procedure
The experimental reactor had been running for over four months after system start-up. The temperature during the experiment was 24–32 °C. First, the ABR received wastewater directly from the storage tank, where anaerobic degradation of the organic pollutants took place. The ABR effluent then flowed into the anoxic tank for denitrification and deodorization. Next, the sewage was pumped into the oxic unit. In the oxic unit, part of the wastewater dropped into the wheel, which was attached to a biological disc in the oxic unit through a shaft, rotating the biological disc. This unit was used primarily for nitrification and further degradation of organic pollutants. After the oxic treatment, a part of the effluent was pumped to the anoxic unit to maintain the reflex ratio, whereas the remaining effluent water was pumped to the constructed wetland for post treatment.
2.3. Sewage Characteristics
The wastewater for this research was obtained from the campus of the Southeast University at Wuxi. The wastewater originates from dormitories, restaurants, and laboratories of the university campus. The sewage quality is presented in Table 1.
2.4. Analytical Methods
The water quality of the influent to and effluent from each stage was monitored regularly (three times per week). Chemical oxygen demand (COD), ammonium (NH4–N), total nitrogen (TN), total phosphorus (TP), and total suspended solids (TSS) were analyzed according to standard methods (Table 2). pH and dissolved oxygen (DO) were tested by PH100 and DO200 probes (YSI), respectively.
2.5. Data Analysis
Initially data and graphical presentation were performed in MS-excel (Office package-16) and then SPSS version-18.0 (SPSS Incorporation, Chicago, IL, USA) program was used to perform statistical analysis.
2.6. Start-Up Conditions
ABR start-up is a complicated process, during which the reactor needs to maintain full treatment capacity [27]. Many factors can affect the start-up of an ABR such as the concentration and composition of wastewater, pH, temperature, hydraulic retention time (HRT), reactor size, and structure [28]. Potential problems can arise during start-up because of plug flow, low pH, and accumulation of volatile fatty acids (VFAs) [29]. Some approaches such as feed dilution, organic loading rate (OLR), periodic feeding, and effluent recycling can help to overcome these difficulties [30]. Low loading start-up and reducing the concentration of organic matter promotes granular sludge growth [31]. For the start-up, the reactor operated for 50 days with HRT for 72 h, which was gradually reduced to 48 h and then 24 h until the COD removal efficiency stabilized at 60%, and the pH stabilized between 7.03 and 7.23 (Table 3).
3. Results and Discussion
3.1. Performance Evaluation of ABR
Figure 2 shows HRT and COD removal relationship in the ABR. COD in the influent was between 180 and 330 mg/L−1, and the variation of the COD concentration in the influent was impacted by the summer rain. In general, the COD removal efficiency increased with increasing HRT. The average COD removal efficiencies were 60%, 65%, 72%, and 74% for HRTs of 24 h, 48 h, 72 h, and 96 h, respectively.
HRT is one of the key factors affecting the operating results of the anaerobic reactor [32]. According to [33], higher HRT increases the wastewater contact time in the reactor and improves the removal efficiency of organic matter by promoting the growth of anaerobic microorganisms. However, longer HRT means a small flow rate and insufficiently stirred anaerobic sludge, resulting in an inability to maintain removal efficiency. Longer HRTs also require large areas and volumes of the reactor, which is not economically suitable. Selecting an accurate HRT for an anaerobic reactor is very important. The increase of the HRT from 24 h to 72 h increased the COD removal efficiency from 60% to 72%, however, when HRT increased from 72 h to 96 h no significant changes in the COD removal efficiency occurred. Excessively long HRTs reduce the up-flow velocity in each reactor compartment and the nutrition distribution for microbes; therefore, no significant changes occurred in the COD removal rate [34]. Extending HRT increased the reactor volume and construction costs [35]. An HRT of 72 h was optimal for the COD removal.
Figure 3 shows the COD removal rate in different compartments of the ABR at different HRTs. The first compartment showed a higher removal efficiency compared to all of the other compartments, followed by the second, third, fourth, and fifth compartments. As the HRT increases, the removal rate also increases. This result was possibly caused by the elevated substrate concentration, which also increased substrate flux into the bioaggregates, thereby increasing microbial growth [36]. The removal rates in compartments I, II, III, IV, and V at HRTs of 24 h to 96 h were 28%–42%, 12%–15%, 8%–11%, 5%–7%, and 2%–4%, respectively. Compartments IV and V showed low removal rates because most of the COD had been removed in the first three compartments and anaerobic microbes have low nutrients to consume [35].
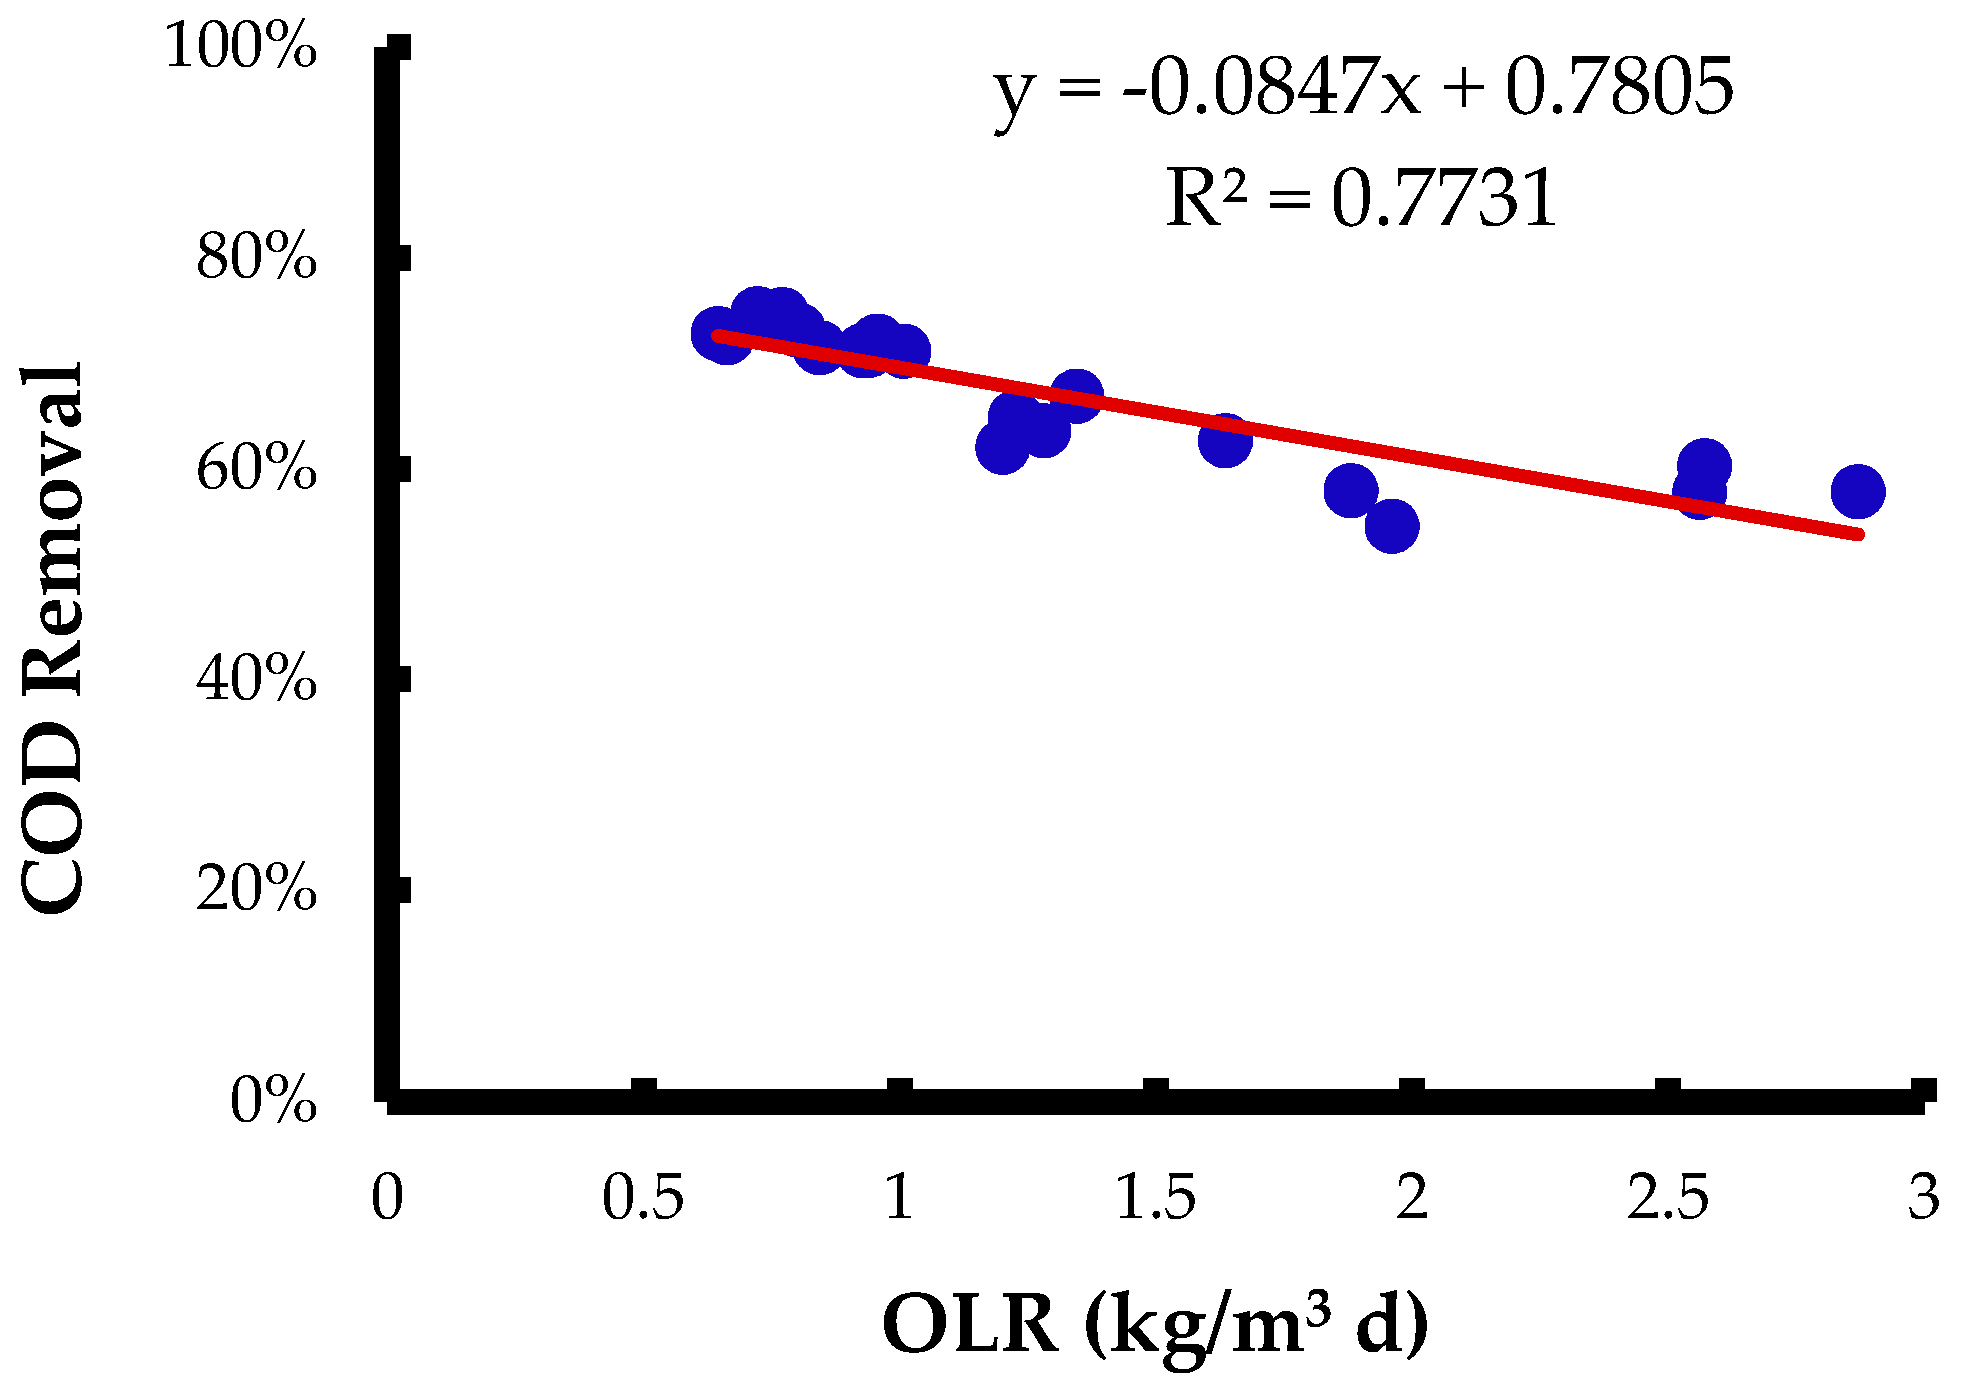
Organic loading rate (OLR) is a chief factor that indicates the amount of volatile solids to be fed into the reactor every day [37]. Figure 4 shows the relationship of OLR and COD removal efficiency. OLR fluctuates between 0.58 and 2.87 kg COD/m3·day. At lower OLR, the removal efficiency was high. When the OLR was between 0.5 and 1.0 kg COD/m3·day, the COD removal rate was above 70%. At the middle point between 1.5 and 2.0 kg COD/m3·day, the removal efficiency dropped. Increasing OLR increased the substrate concentration and elevated microbial growth, resulting in a high COD removal rate [38]. However, further increases in the OLR dropped the removal efficiency. This result might be because high organic loadings decreased VSS (volatile suspended solids) and accumulation of inorganics, leading to subsequent destabilization of the reactor and processes, which affects the reactor performance [39].
3.2. Optimization of the Anoxic Tank Configuration
The flow ratio from the oxic unit to that from the anaerobic reactor in the anoxic unit is called the reflux ratio. This ratio determines the carbon source and nitrate quantity in the anoxic tank, and both these parameters can affect the denitrification process [40]. Therefore, the reflux ratio is one of the most significant parameters affecting the treatment efficiency. The reflux ratio was adjusted to 25%, 50%, 100%, and 150%, which resulted in HRTs in the aerobic unit of 8 h, 6.5 h, 5 h, and 3.5 h, respectively. The removal efficiencies of COD, NH4–N, and TN were also investigated (Figure 5).
The average ABR influent concentrations of COD and NO3-N were 85.2–92.3 mg/L−1 and 39.2–40.5 mg/L−1, respectively, while the influents to the oxic unit were 25.5–54.7 mg/L−1 and 2.1–3.25 mg/L−1, respectively. Increasing the reflux ratio increased the removal efficiency. When the reflux ratio was greater than 100%, the influence on TN removal was more significant than that for the removal of COD and NH4–N. TN removal in the anoxic tank was largely dependent on the concentration of NO3-N, which was mainly drained from the oxic unit [41].
At the reflux ratios of 25%, 50%, 100%, and 150%, TN removal rates were 22.5%, 27.5%, 40.1%, and 42.5%, respectively. For 25% to 100% reflux ratios, the TN removal rate increased significantly, but when the reflux ratio increased to 150%, the increase in TN removal efficiency was not remarkable. This result may be caused by nitrogen limitation in the anoxic zone [35]. Therefore, a reflux ratio of 100% was optimal.
3.3. Overall Reactor Performance
The complete A2O-wetland unit consisted of an anaerobic baffled reactor, anoxic tank, oxic unit, and constructed wetland as a combination of biological and ecological processes, was operated as a consecutive flow model. The HRTs in the ABR, anoxic tank, and oxic unit were 3 days, 5 h, and 4.4 h, respectively. The reflux ratio in the anoxic tank was 100%, and the hydraulic loading of the wetland was 0.2–0.4 m3/day. Water spinach was selected for the constructed wetland due to its easy survival and well developed root system.
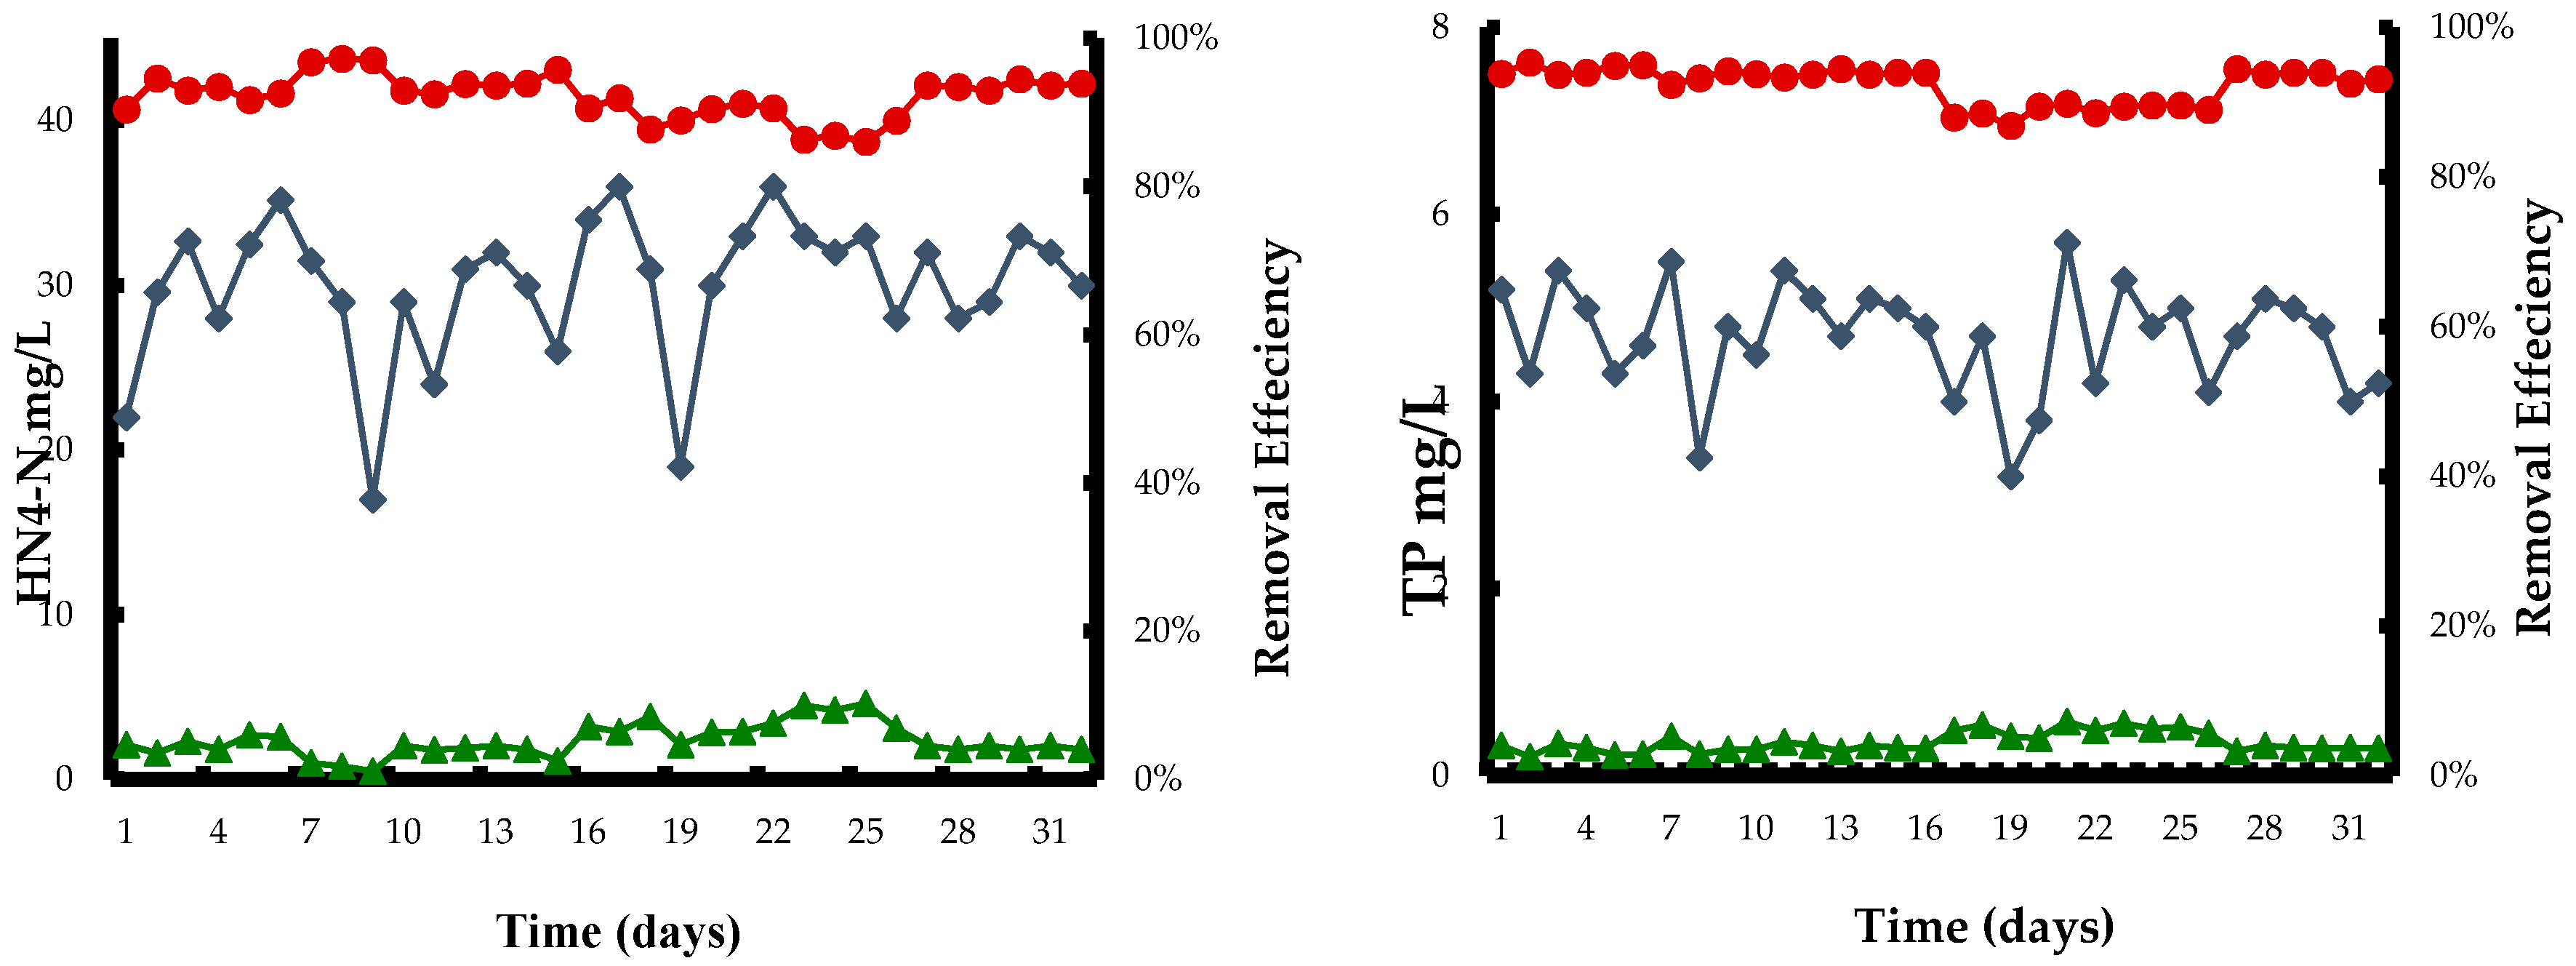
Figure 6 shows the concentration and removal efficiencies of COD, TN, NH4–N, and TP in a bio-ecological system. The combined overall removal efficiency of the A2O-wetland system during the monitored period was 91% for COD, 78% for TN, 85% for NH4–N, and 92% for TP. The mean, minimum, and maximum for the concentration and removal efficiencies of COD, ammonia, TN, and TP are shown in Table 4. The influent COD concentration was between 185.3 and 321.2 mg/L−1 and after treatment, the effluent COD concentration was 10.4–28.7 mg/L−1. The removal efficiency for COD reached up to 90%. TN concentrations in the influent and effluent were 22.4–42.1 mg/L−1 and 3.6–11.5 mg/L−1, respectively, and the total nitrogen removal efficiency was 75%–85%. Whereas, the average effluent concentration of NH4–N and TP were 2.35 ± 0.99 and 0.36 ± 0.10 mg/L−1 with removal efficiency of 85% and 92%, respectively.
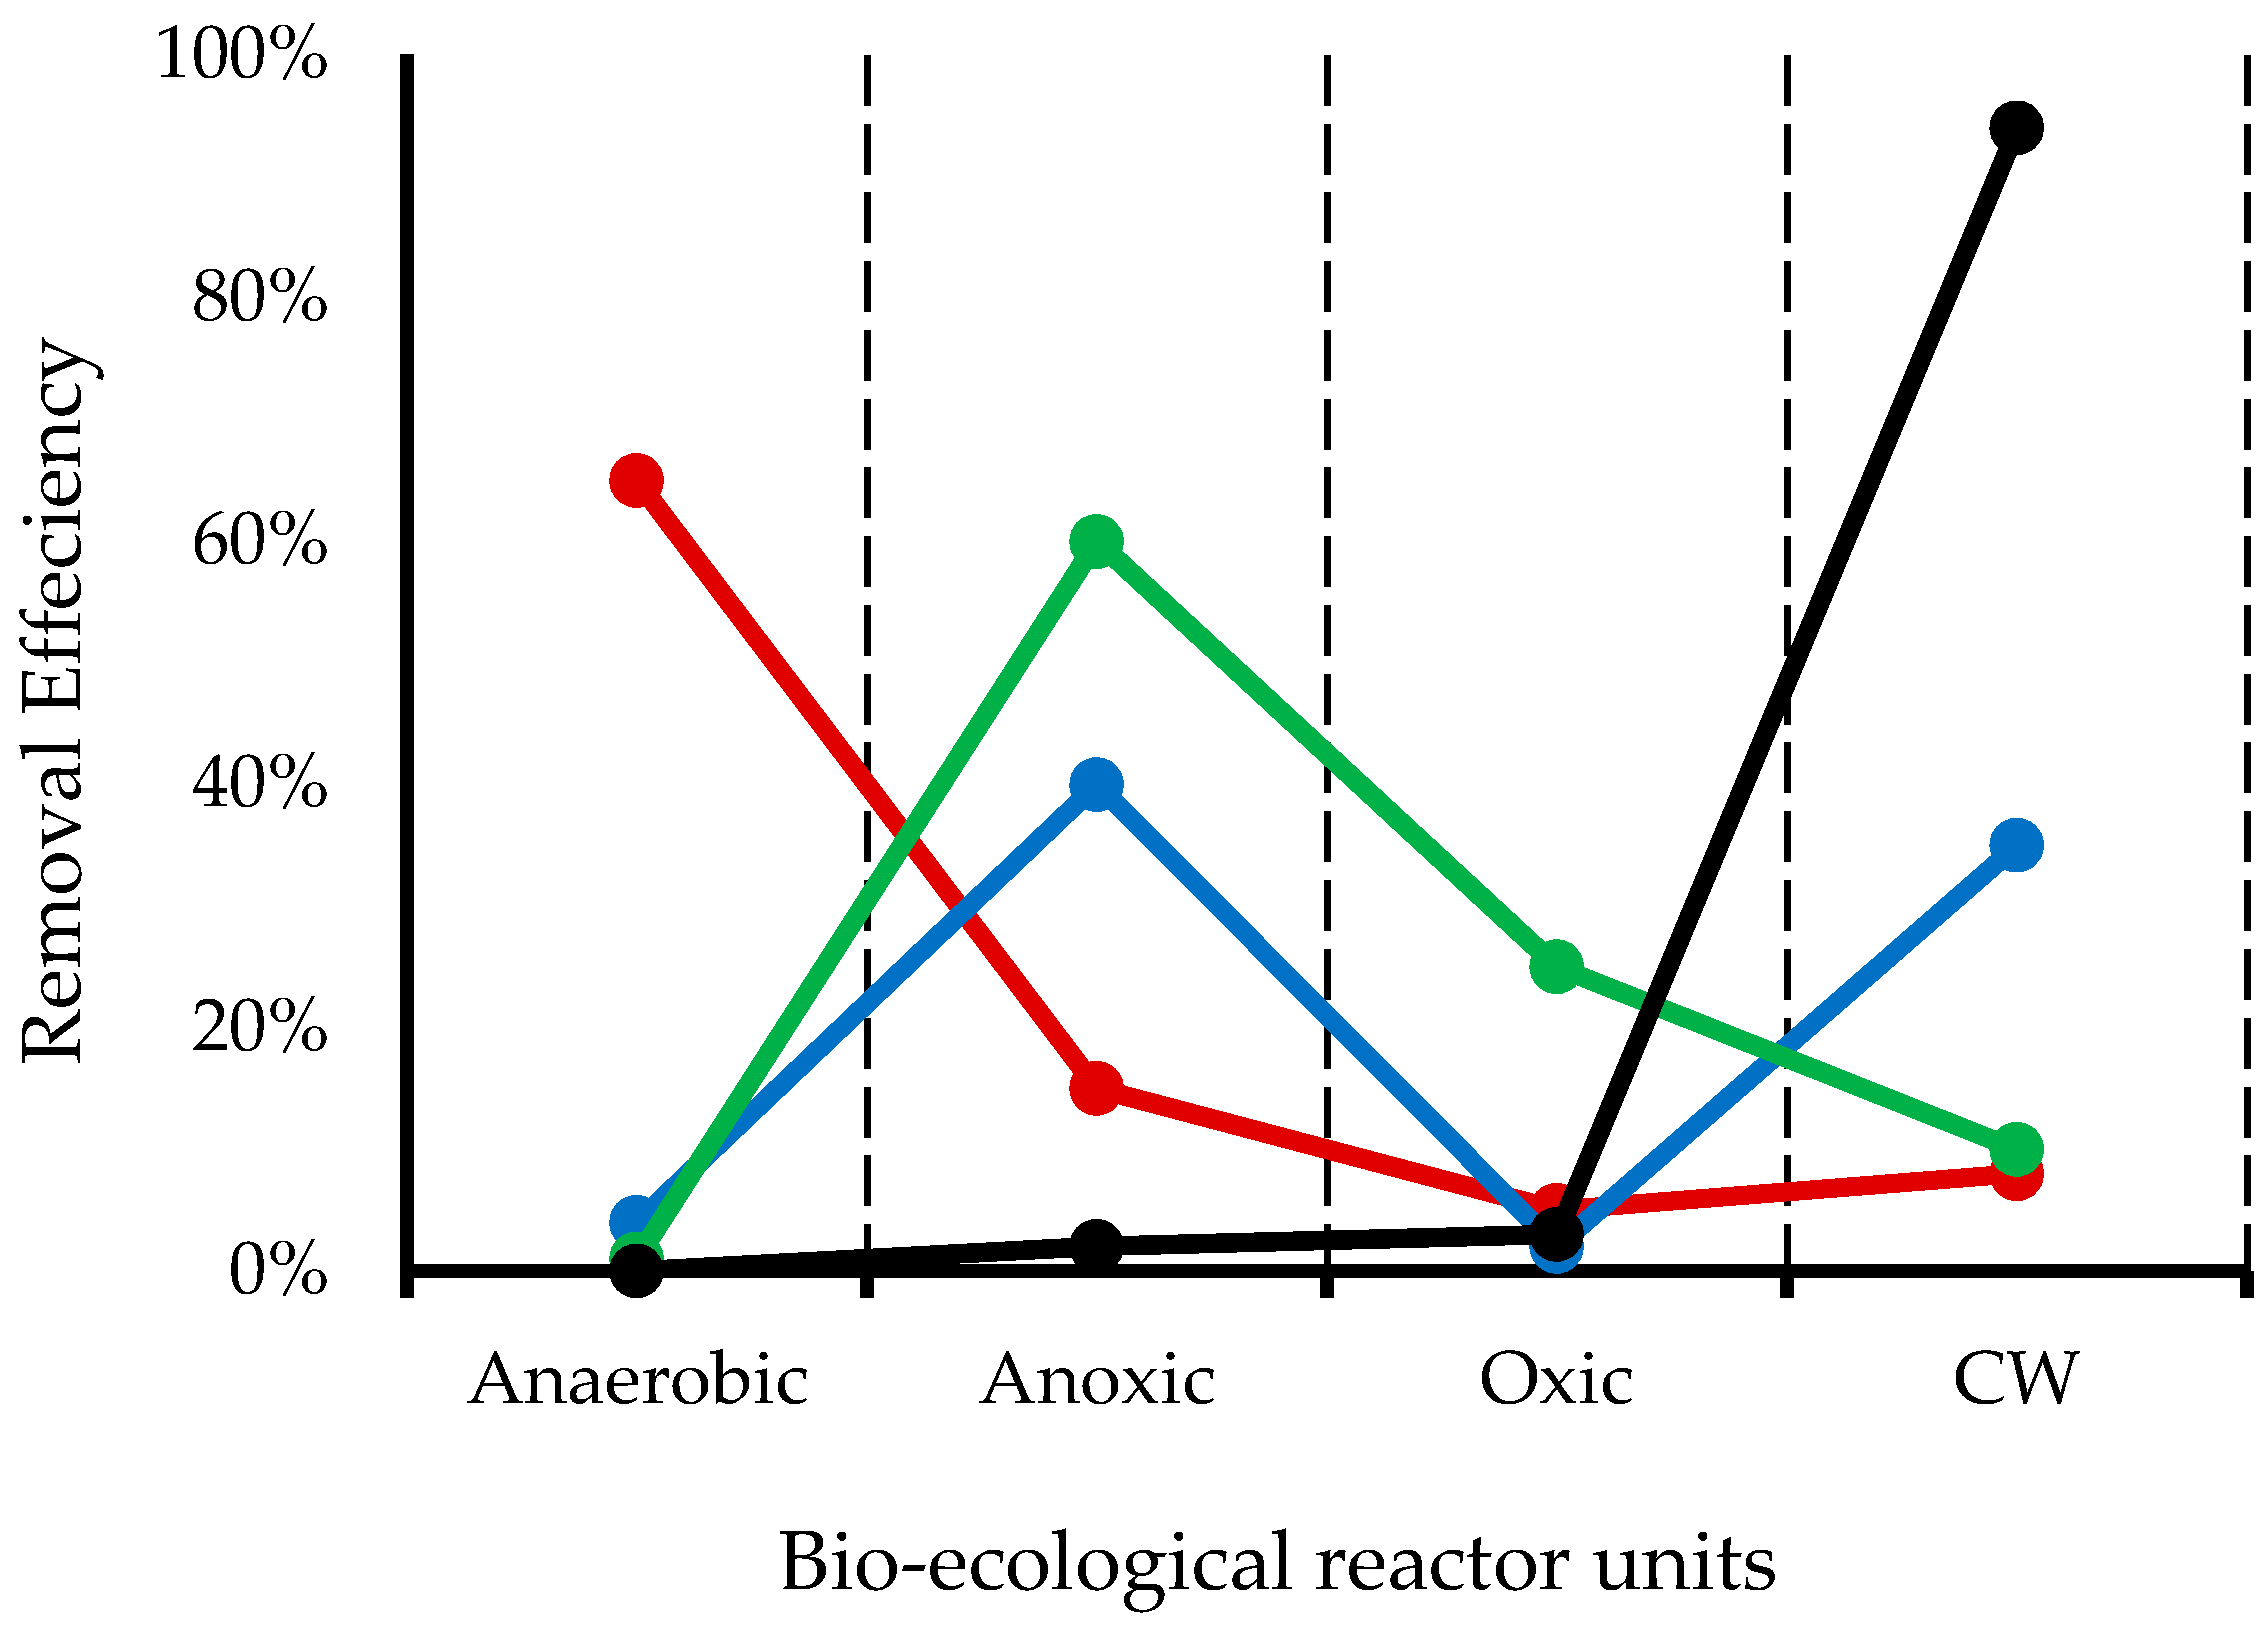
Figure 7 illustrates the removal efficiencies of the bio-ecological system for tested parameters in different stages of the A2O-wetland system. The most effective COD removal took place in the ABR under an HRT of 3 h, and it was supposed that the chief quantity of the organic matter was removed by heterotrophic bacteria [42]. The average TN removal efficiency in the anoxic tank was 40.1%, and the other major part was constructed wetland for TN removal. Nitrogen removal can occur through nitrification, denitrification, and volatilization, and nitrogen can also be taken up by plants and become part of plant biomass [43]. Nitrogen uptake by plants is an important function of CW (constructed wetland) [44]. TP removal efficiency was between 87% and 95%. The main part of TP was removed by the CW. The processes that can remove nitrogen in constructed wetlands are nitrification, denitrification, nitrogen fixation, NH3 volatilization, plant and microbial uptake, nitrate reduction to ammonium (nitrate-ammonification), mineralization (ammonification), anaerobic ammonia oxidation (ANAMMOX), sorption, fragmentation, desorption, burial, and leaching, whereas phosphorus removal processes in constructed wetland are adsorption, desorption, dissolution, precipitation, plant and microbial uptake, leaching, fragmentation, sedimentation, and mineralization [45,46].
The bio-ecological reactor was proposed for rural domestic wastewater treatment. In comparison with other decentralized or on-site technologies, such as intermittently aerated MBBR (TN = 47%–55%; COD = 42%–67%) [47], filter packed with recycled glass (TN = 10%–26%; COD = 72%–83%) [48]; step feed biofilm process (TN = 25%–75%; COD = 80%) [49]; hybrid bioreactor (TN = 59.1%; COD = 93%) [50]; reed bed (TN = 33%–66%) [51]; and integrated A/O biofilm reactor (TN = 66%–84%; COD = 62%–85%) [52], the organic pollutant removal efficiency of A2O-CW was higher. The bio-ecological system showed a highly significant effect (p < 0.001) for COD, TN, ammonium, and TP.
According to [53], aeration, pumping, and material flow are the most important units in WWTPs (wastewater treatment plants) regarding energy consumption, and aeration consumes more than a half of the total energy consumption in WWTPs. In the bio-ecological system, there was no other energy consumption equipment other than a water pump. Thus, the average cost of wastewater could be kept to a minimum. An important approach for bio-ecological processes is the treatment and reuse of domestic wastewater in a decentralized manner, especially in rural areas [54]. Ecological wastewater treatment often leads to decentralized treatment, and considers the wastewater as a resource for irrigation and fertilizer [24].
4. Conclusions
The main findings are the following:
The bio-ecological treatment system of A2O (anaerobic baffled reactor, anoxic tank, and oxic unit) and wetland showed a high removal efficiency for nutrients. The system successfully achieved 92%, 96.7%, 83.6%, and 95.3% removal efficiencies for COD, ammonium, TN, and TP, respectively. The concentrations of organic matter and nutrients in the effluent from the system were lower than the Class 1 A regulated values of the Chinese National Standard GB18918-2002. The most effective COD removal took place in the first three compartments of ABR under a HRT of 3 h by heterotrophic bacteria. For anoxic nitrification the optimum reflex ratio was 100%. The major part of TN removal occurred in the anoxic tank and CW, whereas TP removal took place in the constructed wetland. Aeration is an important part of biological units; more than half of the total energy consumed in wastewater treatment plants is used in aeration and pumping. The A2O-wetland is an energy saving alternative for wastewater treatment and an appropriate technology, especially for the rural regions of the developing world.
Acknowledgments
The authors are thankful to Ministry of Environment, People Republic of China for providing funding for this project. This work was financially supported by the “Major Science and Technology Project of Water Pollution Control and Management in China” grant number 2012ZX07101-005.
Author Contributions
Haq Nawaz Abbasi, Fang Xu, and Xiwu Lu conceived and designed the project, materials, and analysis tools. Haq Nawaz Abbasi and Fang Xu performed the experiment works and data analysis, however, Xiwu Lu supervised them during all stages. All authors wrote the paper.
Conflicts of Interest
The authors declare no conflict of interest.
References
- Ali, R.; McFarlane, D.; Varma, S.; Dawes, W.; Emelyanova, I.; Hodgson, G.; Charles, S. Potential climate change impacts on groundwater resources of south-western australia. J. Hydrol. 2012, 475, 456–472. [Google Scholar] [CrossRef]
- Flörke, M.; Kynast, E.; Bärlund, I.; Eisner, S.; Wimmer, F.; Alcamo, J. Domestic and industrial water uses of the past 60 years as a mirror of socio-economic development: A global simulation study. Glob. Environ. Chang. 2013, 23, 144–156. [Google Scholar] [CrossRef]
- Powley, H.R.; Dürr, H.H.; Lima, A.T.; Krom, M.D.; Van Cappellen, P. Direct discharges of domestic wastewater are a major source of phosphorus and nitrogen to the mediterranean sea. Environ. Sci. Technol. 2016, 50, 8722–8730. [Google Scholar] [CrossRef] [PubMed]
- Affam, A.C.; Chaudhuri, M.; Kutty, S.R.M.; Muda, K. Combination of FeGAC/H2O2 advanced oxidation process and sequencing batch reactor for treatment pesticide wastewater. Environ. Earth Sci. 2016, 75, 1–9. [Google Scholar] [CrossRef]
- Naidoo, S.; Olaniran, A.O. Treated wastewater effluent as a source of microbial pollution of surface water resources. Int. J. Environ. Res. Public Health 2013, 11, 249–270. [Google Scholar] [CrossRef] [PubMed]
- Gunady, M.; Shishkina, N.; Tan, H.; Rodriguez, C. A review of on-site wastewater treatment systems in western australia from 1997 to 2011. J. Environ. Public Health 2015, 2015, 716957. [Google Scholar] [CrossRef] [PubMed]
- Odjadjare, E.C.; Olaniran, A.O. Prevalence of antimicrobial resistant and virulent Salmonella spp. In treated effluent and receiving aquatic milieu of wastewater treatment plants in durban, south africa. Int. J. Environ. Res. Public Health 2015, 12, 9692–9713. [Google Scholar] [CrossRef] [PubMed]
- Molinos-Senante, M.; Gómez, T.; Garrido-Baserba, M.; Caballero, R.; Sala-Garrido, R. Assessing the sustainability of small wastewater treatment systems: A composite indicator approach. Sci. Total Environ. 2014, 497, 607–617. [Google Scholar] [CrossRef] [PubMed]
- Supply, W.U.J.W.; Programme, S.M.; Organization, W.H. Progress on Drinking Water and Sanitation: 2014 Update; World Health Organization: Geneva, Switzerland, 2014. [Google Scholar]
- Gordon, B.A.; Mackay, R.; Rehfuess, E. Inheriting the World: The Atlas of Children's Health and the Environment; World Health Organization: Geneva, Switzerland, 2004. [Google Scholar]
- Gleick, P.H. Global freshwater resources: Soft-path solutions for the 21st century. Science 2003, 302, 1524–1528. [Google Scholar] [CrossRef] [PubMed]
- Lens, P.; Lens, P.N.; Zeeman, G.; Lettinga, G. Decentralised Sanitation and Reuse: Concepts, Systems and Implementation; IWA Publishing: London, UK, 2001. [Google Scholar]
- Massoud, M.A.; Tarhini, A.; Nasr, J.A. Decentralized approaches to wastewater treatment and management: Applicability in developing countries. J. Environ. Manag. 2009, 90, 652–659. [Google Scholar] [CrossRef] [PubMed]
- Maurer, M.; Rothenberger, D.; Larsen, T. Decentralised wastewater treatment technologies from a national perspective: At what cost are they competitive? Water Science Technol. Water Supply 2005, 5, 145–154. [Google Scholar]
- Li, W.-S.; Wang, H.-Y.; Pan, S.-J. Present status on decentralized domestic sewage in rural areas of china and its treatment technology. Tianjin Agric. Sci. 2008, 6, 025. [Google Scholar]
- Li, H.; Zhou, B.; Tian, Z.; Song, Y.; Xiang, L.; Wang, S.; Sun, C. Efficient biological nitrogen removal by johannesburg-sulfur autotrophic denitrification from low COD/TN ratio municipal wastewater at low temperature. Environ. Earth Sci. 2015, 73, 5027–5035. [Google Scholar] [CrossRef]
- Rabalais, N.N. Nitrogen in aquatic ecosystems. AMBIO: J. Hum. Environ. 2002, 31, 102–112. [Google Scholar] [CrossRef]
- Wu, Y.; Zhu, W.; Lu, X. Identifying key parameters in a novel multistep bio-ecological wastewater treatment process for rural areas. Ecol. Eng. 2013, 61, 166–173. [Google Scholar] [CrossRef]
- Chen, Y.; Peng, C.; Wang, J.; Ye, L.; Zhang, L.; Peng, Y. Effect of nitrate recycling ratio on simultaneous biological nutrient removal in a novel anaerobic/anoxic/oxic (A2/O)-biological aerated filter (BAF) system. Bioresour. Technol. 2011, 102, 5722–5727. [Google Scholar] [CrossRef] [PubMed]
- Abualhai, S.; Naseer, R.; Xiwu, L. Biological nutrient removal using a novel five-step continuous flow activated sludge process technology. Environ. Prot. Eng. 2013, 39, 165–184. [Google Scholar]
- Zhou, Q.; He, S.; He, X.; Huang, X.; Picot, B.; Li, X.; Chen, G. Nutrients removal mechanisms in high rate algal pond treating rural domestic sewage in east china. Water Sci. Technol. Water Supply 2006, 6, 43–50. [Google Scholar] [CrossRef]
- Haruta, S.; Sakurai, Y. Reclaimed wastewater quality in combined household wastewater treatment facilities for individual houses in rural area. J. Rural Plan. 2007, 12, 215–220. [Google Scholar] [CrossRef]
- Molinos-Senante, M.; Gómez, T.; Caballero, R.; Hernández-Sancho, F.; Sala-Garrido, R. Assessment of wastewater treatment alternatives for small communities: An analytic network process approach. Sci. Total Environ. 2015, 532, 676–687. [Google Scholar] [CrossRef] [PubMed]
- Otterpohl, R.; Braun, U.; Oldenburg, M. Innovative technologies for decentralised water-, wastewater and biowaste management in urban and peri-urban areas. Water Sci. Technol. 2004, 48, 23–32. [Google Scholar]
- Cameron, K.; Madramootoo, C.; Crolla, A.; Kinsley, C. Pollutant removal from municipal sewage lagoon effluents with a free-surface wetland. Water Res. 2003, 37, 2803–2812. [Google Scholar] [CrossRef]
- Federation WE. Standard Methods for the Examination of Water and Wastewater; American Public Health Association: Washington, DC, USA, 2005. [Google Scholar]
- Barber, W.P.; Stuckey, D.C. The use of the anaerobic baffled reactor (ABR) for wastewater treatment: A review. Water Res. 1999, 33, 1559–1578. [Google Scholar] [CrossRef]
- Hassan, S.R.; Zaman, N.Q.; Dahlan, I. Effect of organic loading rate on anaerobic digestion: Case study on recycled paper mill effluent using modified anaerobic hybrid baffled (MAHB) reactor. KSCE J. Civ. Eng. 2015, 19, 1271–1276. [Google Scholar] [CrossRef]
- Liu, R.; Tian, Q.; Yang, B.; Chen, J. Hybrid anaerobic baffled reactor for treatment of desizing wastewater. Int. J. Environ. Sci. Technol. 2010, 7, 111–118. [Google Scholar] [CrossRef]
- Skiadas, I.; Lyberatos, G. The periodic anaerobic baffled reactor. Water Sci. Technol. 1998, 38, 401–408. [Google Scholar] [CrossRef]
- Jiao, T.; Wang, H.-Z.; Zhang, W.-B.; Huang, J. Study on rural scattered sewage treatment in contact oxidation reactor. Environ. Sci. Technol. 2011, S2, 25–30. [Google Scholar]
- El-Mashad, H.M.; Zeeman, G.; Van Loon, W.K.; Bot, G.P.; Lettinga, G. Effect of temperature and temperature fluctuation on thermophilic anaerobic digestion of cattle manure. Bioresour. Technol. 2004, 95, 191–201. [Google Scholar] [CrossRef] [PubMed]
- Xing, J.; Tilche, A. The effect of hydraulic retention time on the hybrid anaerobic baffled reactor performance at constant loading. Biomass Bioenergy 1992, 3, 25–29. [Google Scholar] [CrossRef]
- Abdelgadir, A.; Chen, X.; Liu, J.; Xie, X.; Zhang, J.; Zhang, K.; Wang, H.; Liu, N. Characteristics, process parameters, and inner components of anaerobic bioreactors. BioMed Res. Int. 2014, 2014, 841573. [Google Scholar] [CrossRef] [PubMed]
- Zhu, G.-F.; Li, J.-Z.; Wu, P.; Jin, H.-Z.; Wang, Z. The performance and phase separated characteristics of an anaerobic baffled reactor treating soybean protein processing wastewater. Bioresour. Technol. 2008, 99, 8027–8033. [Google Scholar] [CrossRef] [PubMed]
- Movahedyan, H.; Assadi, A.; Parvaresh, A. Performance evaluation of an anaerobic baffled reactor treating wheat flour starch industry wastewater. Iran. J. Environ. Health. Sci. Eng. 2007, 4, 77–84. [Google Scholar]
- Babaee, A.; Shayegan, J. Effects of Organic Loading Rates (OLR) on Production of Methane from Anaerobic Digestion of Vegetable Waste. In Proceedings of the World Renewable Energy Congress, Linköping, Sweden, 8–13 May 2011.
- Kanimozhi, R.; Vasudevan, N. Effect of organic loading rate on the performance of aerobic sbr treating anaerobically digested distillery wastewater. Clean Technol. Environ. Policy 2014, 16, 467–476. [Google Scholar] [CrossRef]
- Chelliapan, S.; Wilby, T.; Yuzir, A.; Sallis, P.J. Influence of organic loading on the performance and microbial community structure of an anaerobic stage reactor treating pharmaceutical wastewater. Desalination 2011, 271, 257–264. [Google Scholar] [CrossRef]
- Wang, S.-Y. Effect of carbon source and nitrate concentration on denitrifying phosphorus removal by dpb sludge. J. Environ. Sci. 2004, 16, 548–552. [Google Scholar]
- Rajagopal, R.; Rousseau, P.; Bernet, N.; Béline, F. Combined anaerobic and activated sludge anoxic/oxic treatment for piggery wastewater. Bioresour. Technol. 2011, 102, 2185–2192. [Google Scholar] [CrossRef] [PubMed]
- Yao, Y.-C.; Zhang, Q.-L.; Liu, Y.; Liu, Z.-P. Simultaneous removal of organic matter and nitrogen by a heterotrophic nitrifying–aerobic denitrifying bacterial strain in a membrane bioreactor. Bioresour. Technol. 2013, 143, 83–87. [Google Scholar] [CrossRef] [PubMed]
- Brix, H. Wastewater treatment in constructed wetlands: System design, removal processes, and treatment performance. In Constructed Wetland and Water Quality Improvement; Moshiri, G.A., Ed.; Lewis Publisher: Lewis, NY, USA, 1993; pp. 9–22. [Google Scholar]
- Shelef, O.; Gross, A.; Rachmilevitch, S. Role of plants in a constructed wetland: Current and new perspectives. Water 2013, 5, 405–419. [Google Scholar] [CrossRef]
- Sharma, S.B.; Sayyed, R.Z.; Trivedi, M.H.; Gobi, T.A. Phosphate solubilizing microbes: Sustainable approach for managing phosphorus deficiency in agricultural soils. Springer Plus 2013, 2, 587. [Google Scholar] [CrossRef] [PubMed]
- Ouyang, X.; Guo, F. Paradigms of mangroves in treatment of anthropogenic wastewater pollution. Sci. Total Environ. 2016, 544, 971–979. [Google Scholar] [CrossRef] [PubMed]
- Luostarinen, S.A.; Rintala, J.A. Anaerobic on-site treatment of black water and dairy parlour wastewater in uasb-septic tanks at low temperatures. Water Res. 2005, 39, 436–448. [Google Scholar] [CrossRef] [PubMed]
- Gill, L.; Doran, C.; Misstear, D.; Sheahan, B. The use of recycled glass as a filter media for on-site wastewater treatment. Desalin. Water Treat. 2009, 4, 198–205. [Google Scholar] [CrossRef]
- Liang, H.; Gao, M.; Liu, J.; Wei, Y.; Guo, X. A novel integrated step-feed biofilm process for the treatment of decentralized domestic wastewater in rural areas of china. J. Environ. Sci. 2010, 22, 321–327. [Google Scholar] [CrossRef]
- Hong, S.-W.; Choi, Y.-S.; Kim, S.-J.; Kwon, G. Pilot-testing an alternative on-site wastewater treatment system for small communities and its automatic control. Water Sci. Technol. 2005, 51, 101–108. [Google Scholar] [PubMed]
- Davison, L.; Headley, T.; Edmonds, M. On-site domestic wastewater treatment by reed bed in the moist subtropics. Water Sci. Technol. 2001, 44, 353–360. [Google Scholar] [PubMed]
- Gong, L.; Jun, L.; Yang, Q.; Wang, S.; Ma, B.; Peng, Y. Biomass characteristics and simultaneous nitrification–denitrification under long sludge retention time in an integrated reactor treating rural domestic sewage. Bioresour. Technol. 2012, 119, 277–284. [Google Scholar] [CrossRef] [PubMed]
- Wakeel, M.; Chen, B.; Hayat, T.; Alsaedi, A.; Ahmad, B. Energy consumption for water use cycles in different countries: A review. Appl. Energy 2016, 178, 868–885. [Google Scholar] [CrossRef]
- Jusufranić, I.; Milešević, T.; Biočanin, R. Water facilities in the system of urban sustainable development. In Proceedings of the 3rd International Conference on New Functional Materials and High Technology, NFMaHT-2015, Tivat, Montenegro, 29–30 June 2015.
Figure 1.
Schematic diagram of bio-ecological system; → wastewater flow directions; 1. Storage Tank for wastewater; 2. ABR (Anaerobic Baffled Reactor, equipped with DN10 sampling port); 3. Anoxic Tank (equipped with outlets for flow from different heights); 4. Oxic Unit (consisted of three sub-parts, each part consisted of a rectangular tank, a bio-wheel, and a rotating disc); 5. Return flow to anoxic tank from oxic unit; 6. Horizontal Flow Constructed Wetland

Figure 2.
COD concentration and removal efficiency of ABR under different HRTs. ![Applsci 07 00066 i001]() Influent water;
Influent water; ![Applsci 07 00066 i002]() Effluent water;
Effluent water; ![Applsci 07 00066 i003]() COD removal efficiency.
COD removal efficiency.
 Influent water;
  Effluent water;
  COD removal efficiency.
Figure 2.
COD concentration and removal efficiency of ABR under different HRTs. ![Applsci 07 00066 i001]() Influent water;
Influent water; ![Applsci 07 00066 i002]() Effluent water;
Effluent water; ![Applsci 07 00066 i003]() COD removal efficiency.
COD removal efficiency.
Influent water; Effluent water; COD removal efficiency.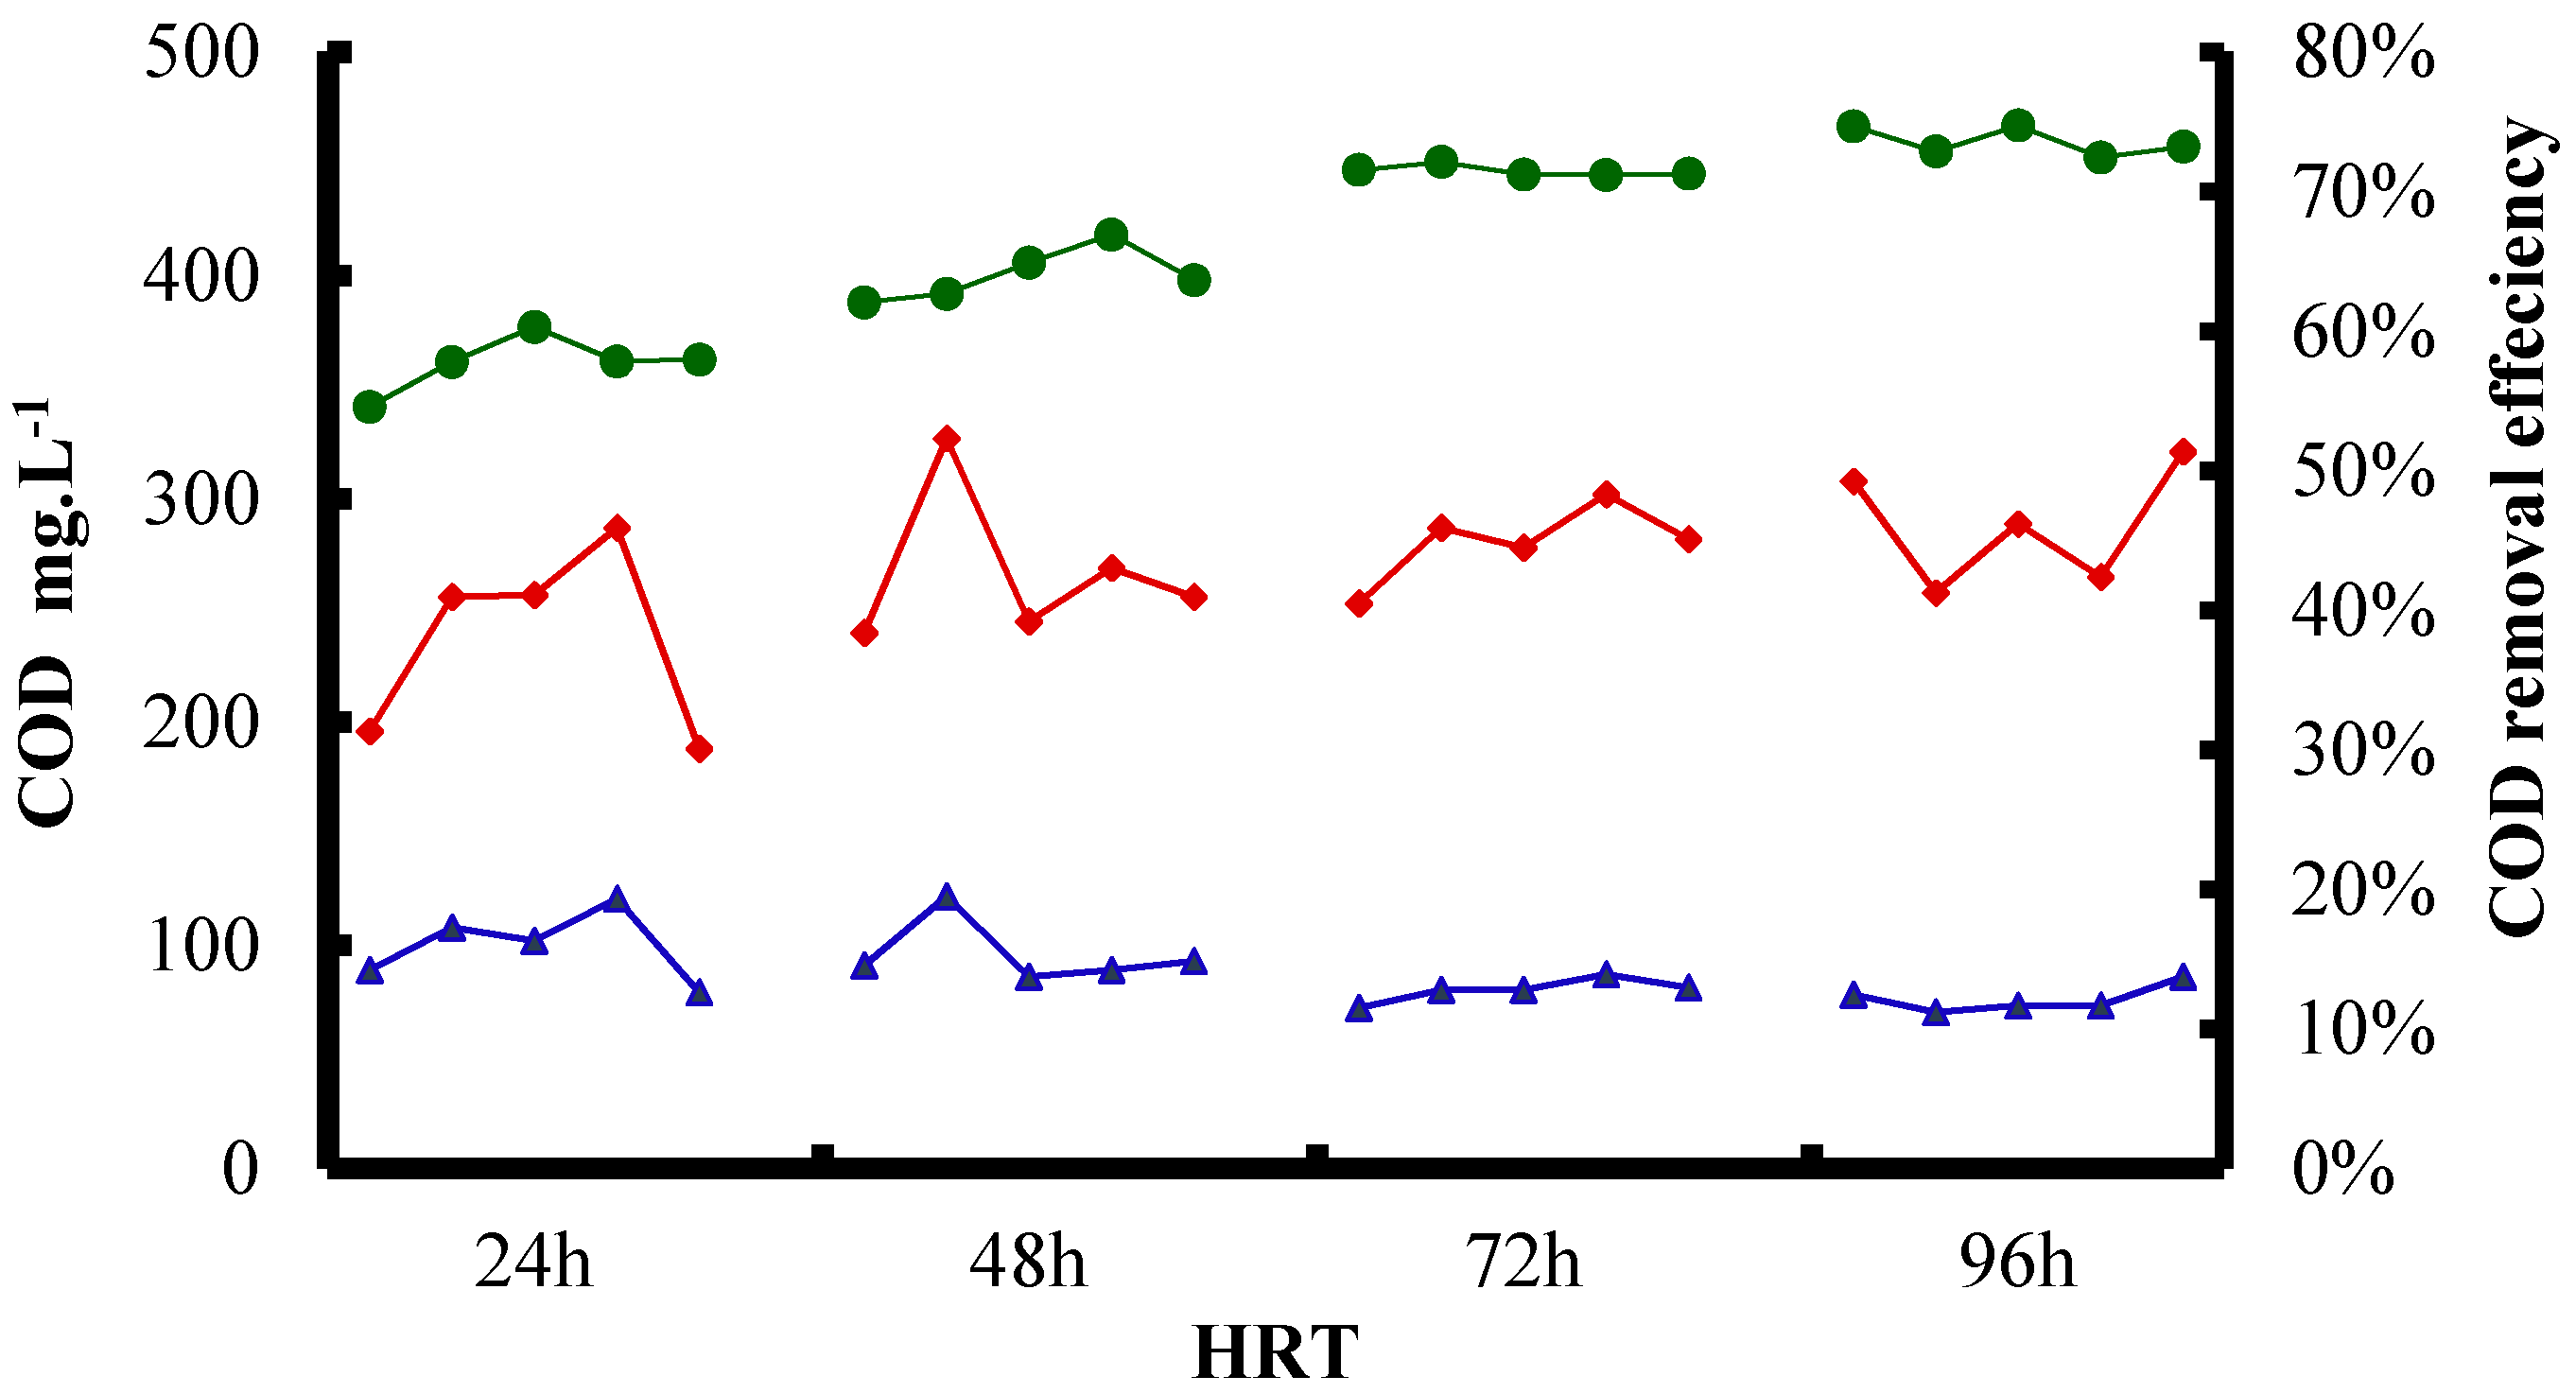
Figure 3.
COD removal efficiencies in different compartments of ABR under different HRTs. ![Applsci 07 00066 i004]() Compartment I;
Compartment I; ![Applsci 07 00066 i005]() Compartment II;
Compartment II; ![Applsci 07 00066 i006]() Compartment III;
Compartment III; ![Applsci 07 00066 i007]() Compartment IV;
Compartment IV; ![Applsci 07 00066 i008]() Compartment V.
Compartment V.
 Compartment I;
  Compartment II;
  Compartment III;
  Compartment IV;
  Compartment V.
Figure 3.
COD removal efficiencies in different compartments of ABR under different HRTs. ![Applsci 07 00066 i004]() Compartment I;
Compartment I; ![Applsci 07 00066 i005]() Compartment II;
Compartment II; ![Applsci 07 00066 i006]() Compartment III;
Compartment III; ![Applsci 07 00066 i007]() Compartment IV;
Compartment IV; ![Applsci 07 00066 i008]() Compartment V.
Compartment V.
Compartment I; Compartment II; Compartment III; Compartment IV; Compartment V.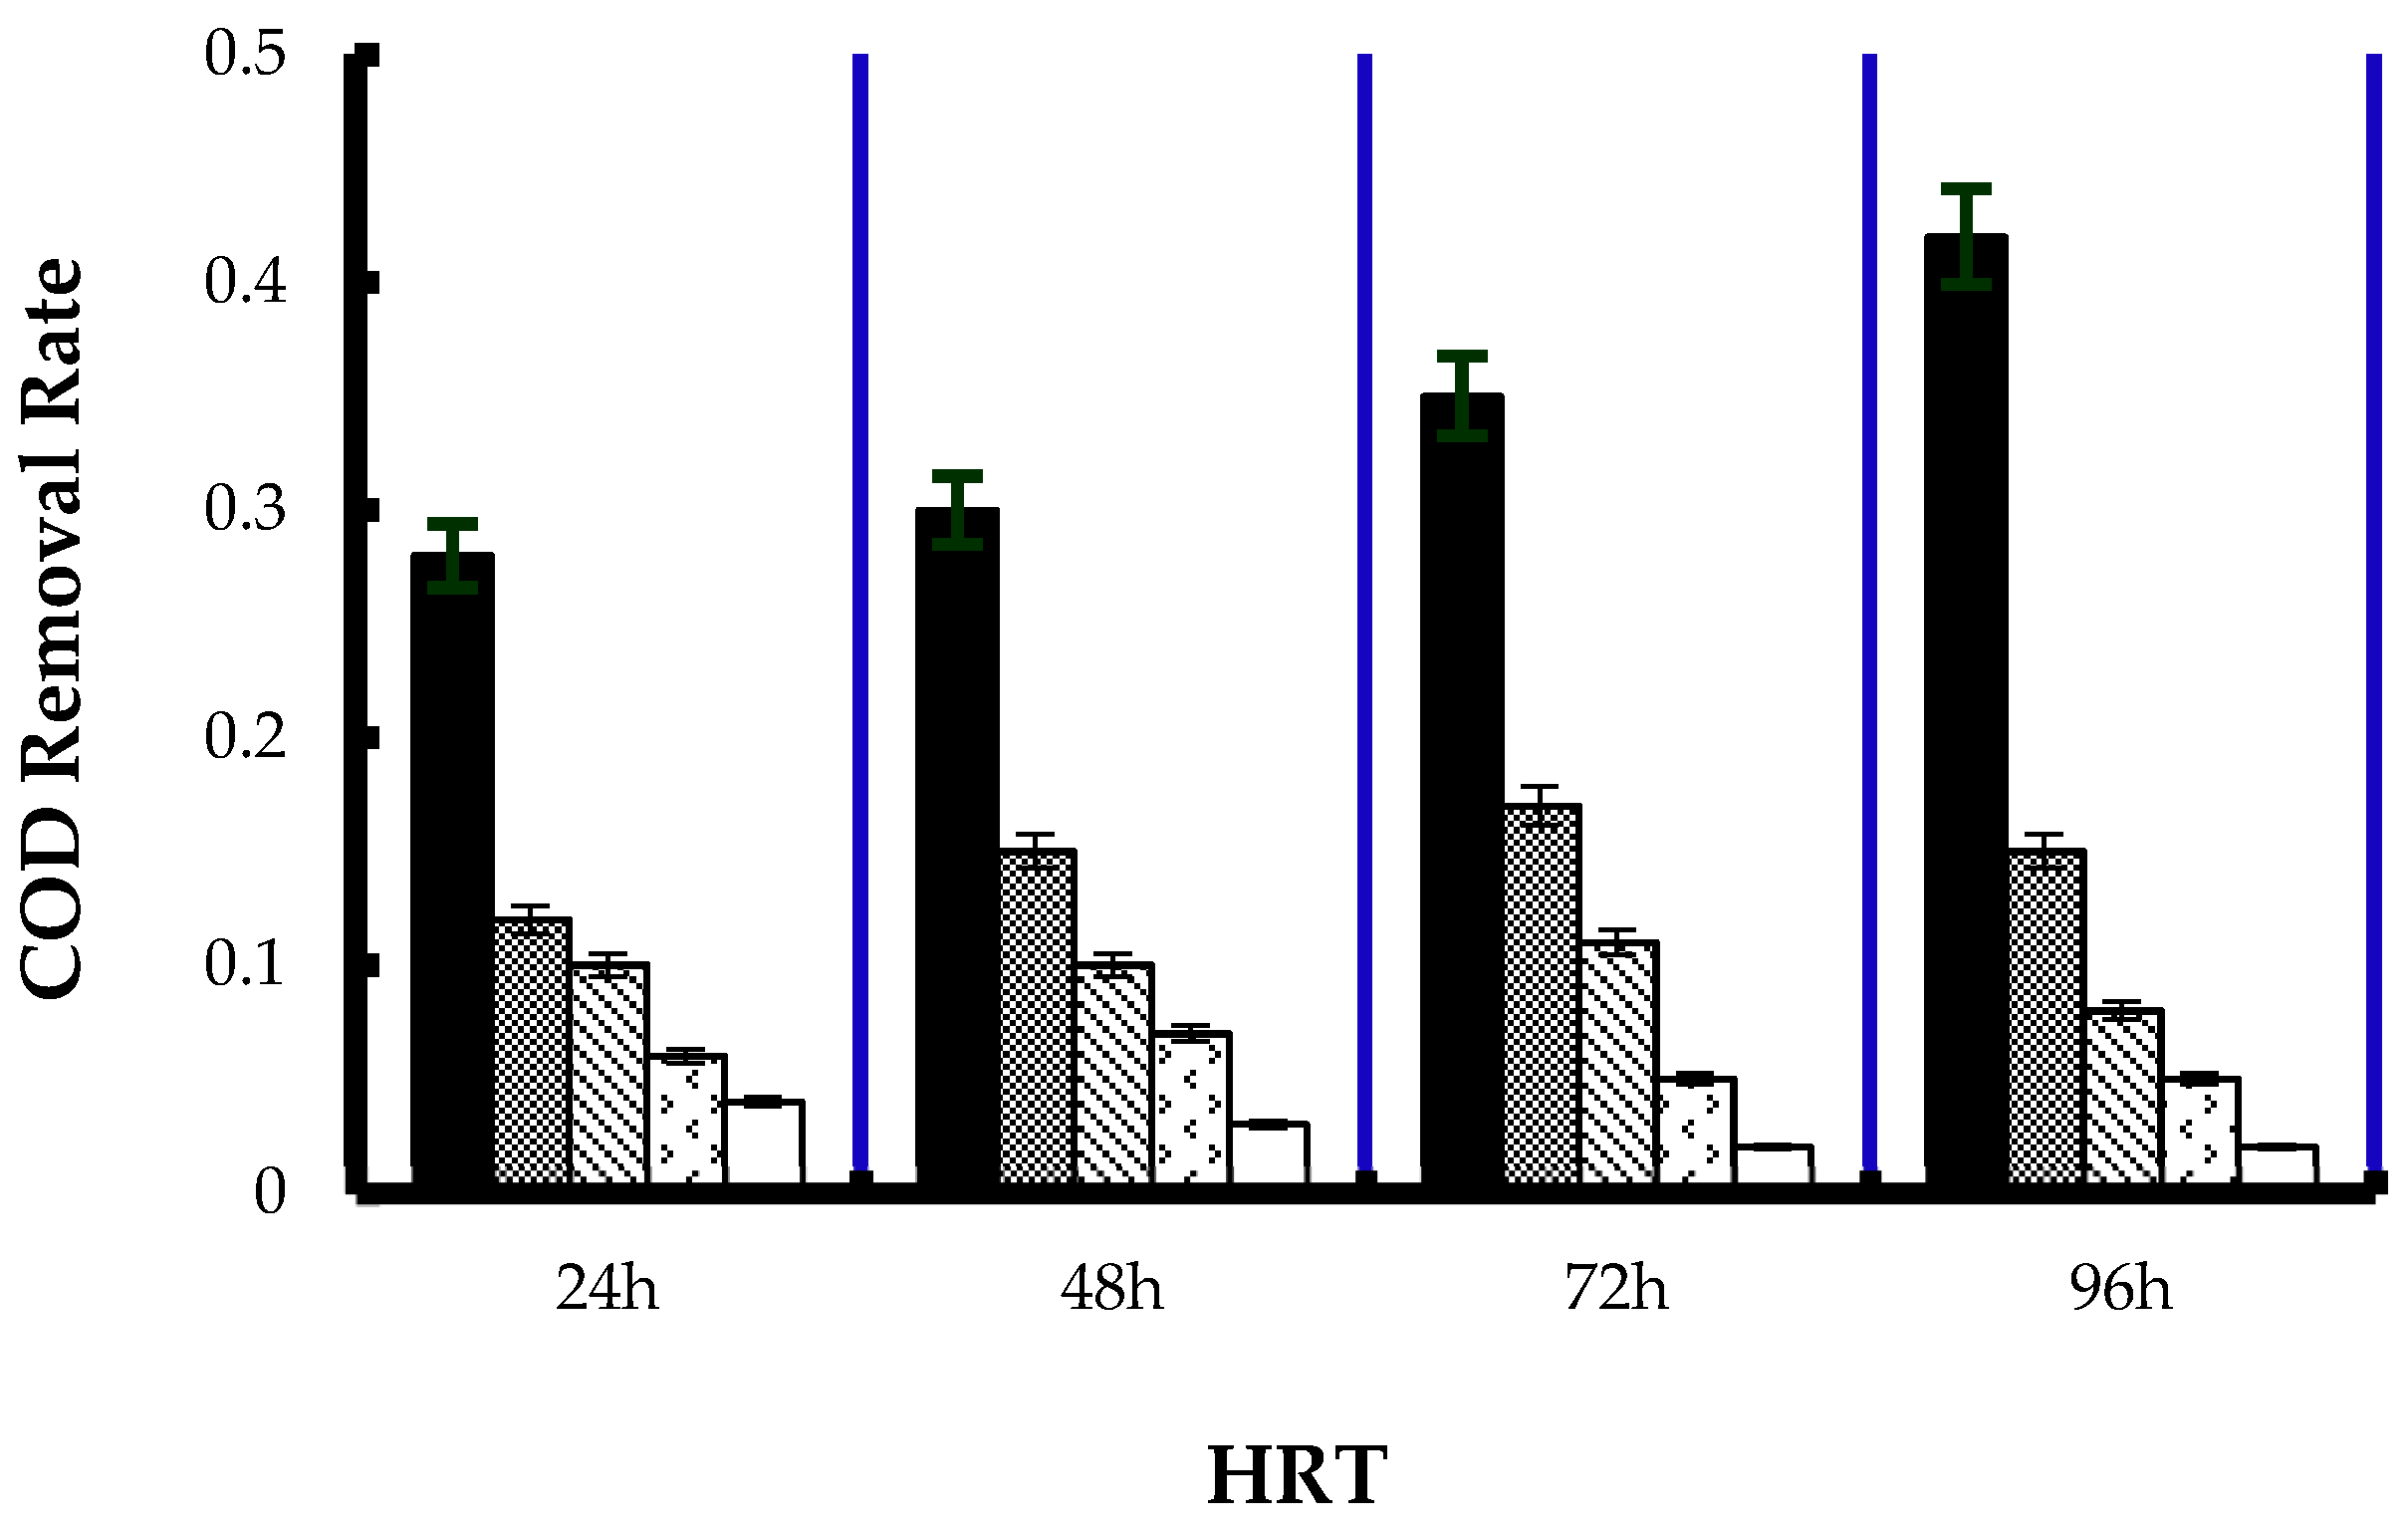
Figure 4.
Effects of organic loading rate (OLR) on the removal rates of COD under HRT on 3 h in ABR.
Figure 4.
Effects of organic loading rate (OLR) on the removal rates of COD under HRT on 3 h in ABR.

Figure 5.
(a) Reflux ratio effect on COD removal in anoxic tank. ![Applsci 07 00066 i009]() anaerobic inflow;
anaerobic inflow; ![Applsci 07 00066 i010]() anoxic effluent water;
anoxic effluent water; ![Applsci 07 00066 i011]() oxic inflow; (b) Reflux ratio effect on NH4–N removal in anoxic tank.
oxic inflow; (b) Reflux ratio effect on NH4–N removal in anoxic tank. ![Applsci 07 00066 i012]() anaerobic ammonia;
anaerobic ammonia; ![Applsci 07 00066 i013]() anoxic ammonia;
anoxic ammonia; ![Applsci 07 00066 i014]() anaerobic nitrate;
anaerobic nitrate; ![Applsci 07 00066 i015]() anoxic nitrate;
anoxic nitrate; ![Applsci 07 00066 i016]() oxic nitrate; (c) Reflux ratio effect on TN removal in anoxic tank.
oxic nitrate; (c) Reflux ratio effect on TN removal in anoxic tank. ![Applsci 07 00066 i017]() anaerobic flow;
anaerobic flow; ![Applsci 07 00066 i018]() anoxic effluent;
anoxic effluent; ![Applsci 07 00066 i019]() oxic flow;
oxic flow; ![Applsci 07 00066 i020]() TN removal.
TN removal.
 anaerobic inflow;
  anoxic effluent water;
  oxic inflow; (b) Reflux ratio effect on NH4–N removal in anoxic tank.
  anaerobic ammonia;
  anoxic ammonia;
  anaerobic nitrate;
  anoxic nitrate;
  oxic nitrate; (c) Reflux ratio effect on TN removal in anoxic tank.
  anaerobic flow;
  anoxic effluent;
  oxic flow;
  TN removal.
Figure 5.
(a) Reflux ratio effect on COD removal in anoxic tank. ![Applsci 07 00066 i009]() anaerobic inflow;
anaerobic inflow; ![Applsci 07 00066 i010]() anoxic effluent water;
anoxic effluent water; ![Applsci 07 00066 i011]() oxic inflow; (b) Reflux ratio effect on NH4–N removal in anoxic tank.
oxic inflow; (b) Reflux ratio effect on NH4–N removal in anoxic tank. ![Applsci 07 00066 i012]() anaerobic ammonia;
anaerobic ammonia; ![Applsci 07 00066 i013]() anoxic ammonia;
anoxic ammonia; ![Applsci 07 00066 i014]() anaerobic nitrate;
anaerobic nitrate; ![Applsci 07 00066 i015]() anoxic nitrate;
anoxic nitrate; ![Applsci 07 00066 i016]() oxic nitrate; (c) Reflux ratio effect on TN removal in anoxic tank.
oxic nitrate; (c) Reflux ratio effect on TN removal in anoxic tank. ![Applsci 07 00066 i017]() anaerobic flow;
anaerobic flow; ![Applsci 07 00066 i018]() anoxic effluent;
anoxic effluent; ![Applsci 07 00066 i019]() oxic flow;
oxic flow; ![Applsci 07 00066 i020]() TN removal.
TN removal.
anaerobic inflow; anoxic effluent water; oxic inflow; (b) Reflux ratio effect on NH4–N removal in anoxic tank. anaerobic ammonia; anoxic ammonia; anaerobic nitrate; anoxic nitrate; oxic nitrate; (c) Reflux ratio effect on TN removal in anoxic tank. anaerobic flow; anoxic effluent; oxic flow; TN removal.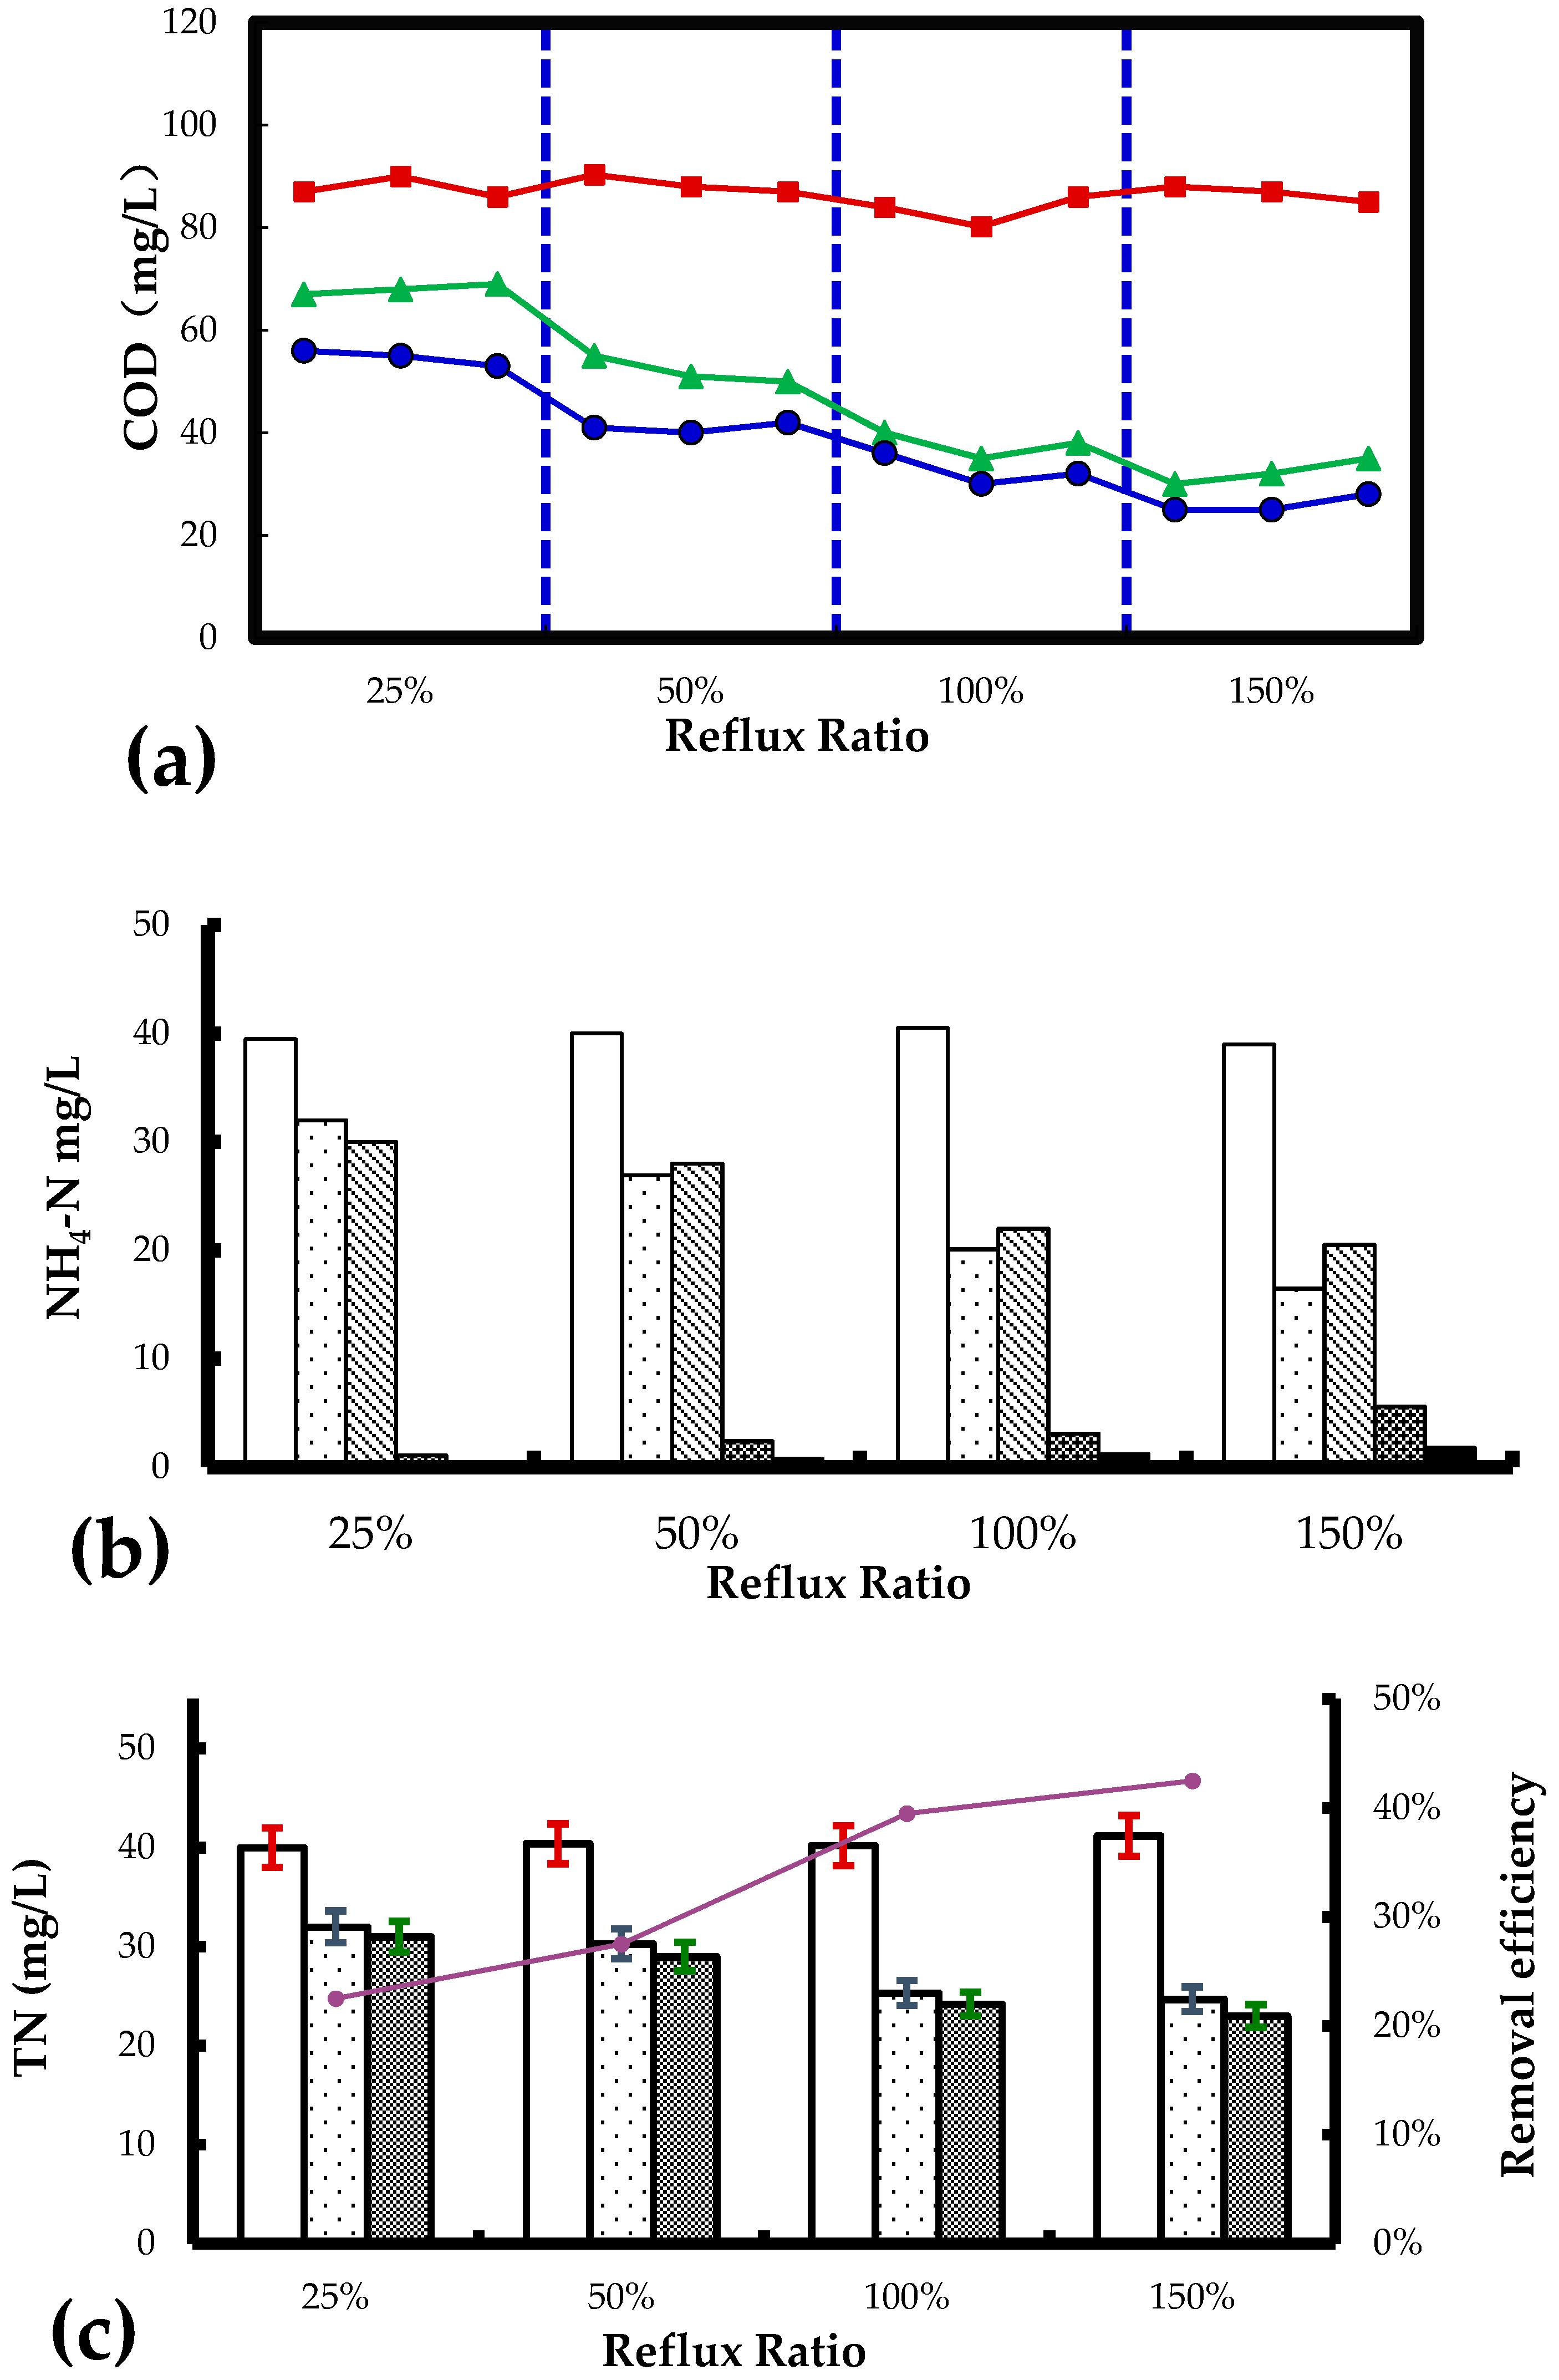
Figure 6.
Removal efficiency of COD, TN, NH4+–N, and TP in A2O–wetland system. ![Applsci 07 00066 i021]() Influent water;
Influent water; ![Applsci 07 00066 i022]() Effluent water;
Effluent water; ![Applsci 07 00066 i023]() COD removal efficiency.
COD removal efficiency.
 Influent water;
  Effluent water;
  COD removal efficiency.
Figure 6.
Removal efficiency of COD, TN, NH4+–N, and TP in A2O–wetland system. ![Applsci 07 00066 i021]() Influent water;
Influent water; ![Applsci 07 00066 i022]() Effluent water;
Effluent water; ![Applsci 07 00066 i023]() COD removal efficiency.
COD removal efficiency.
Influent water; Effluent water; COD removal efficiency.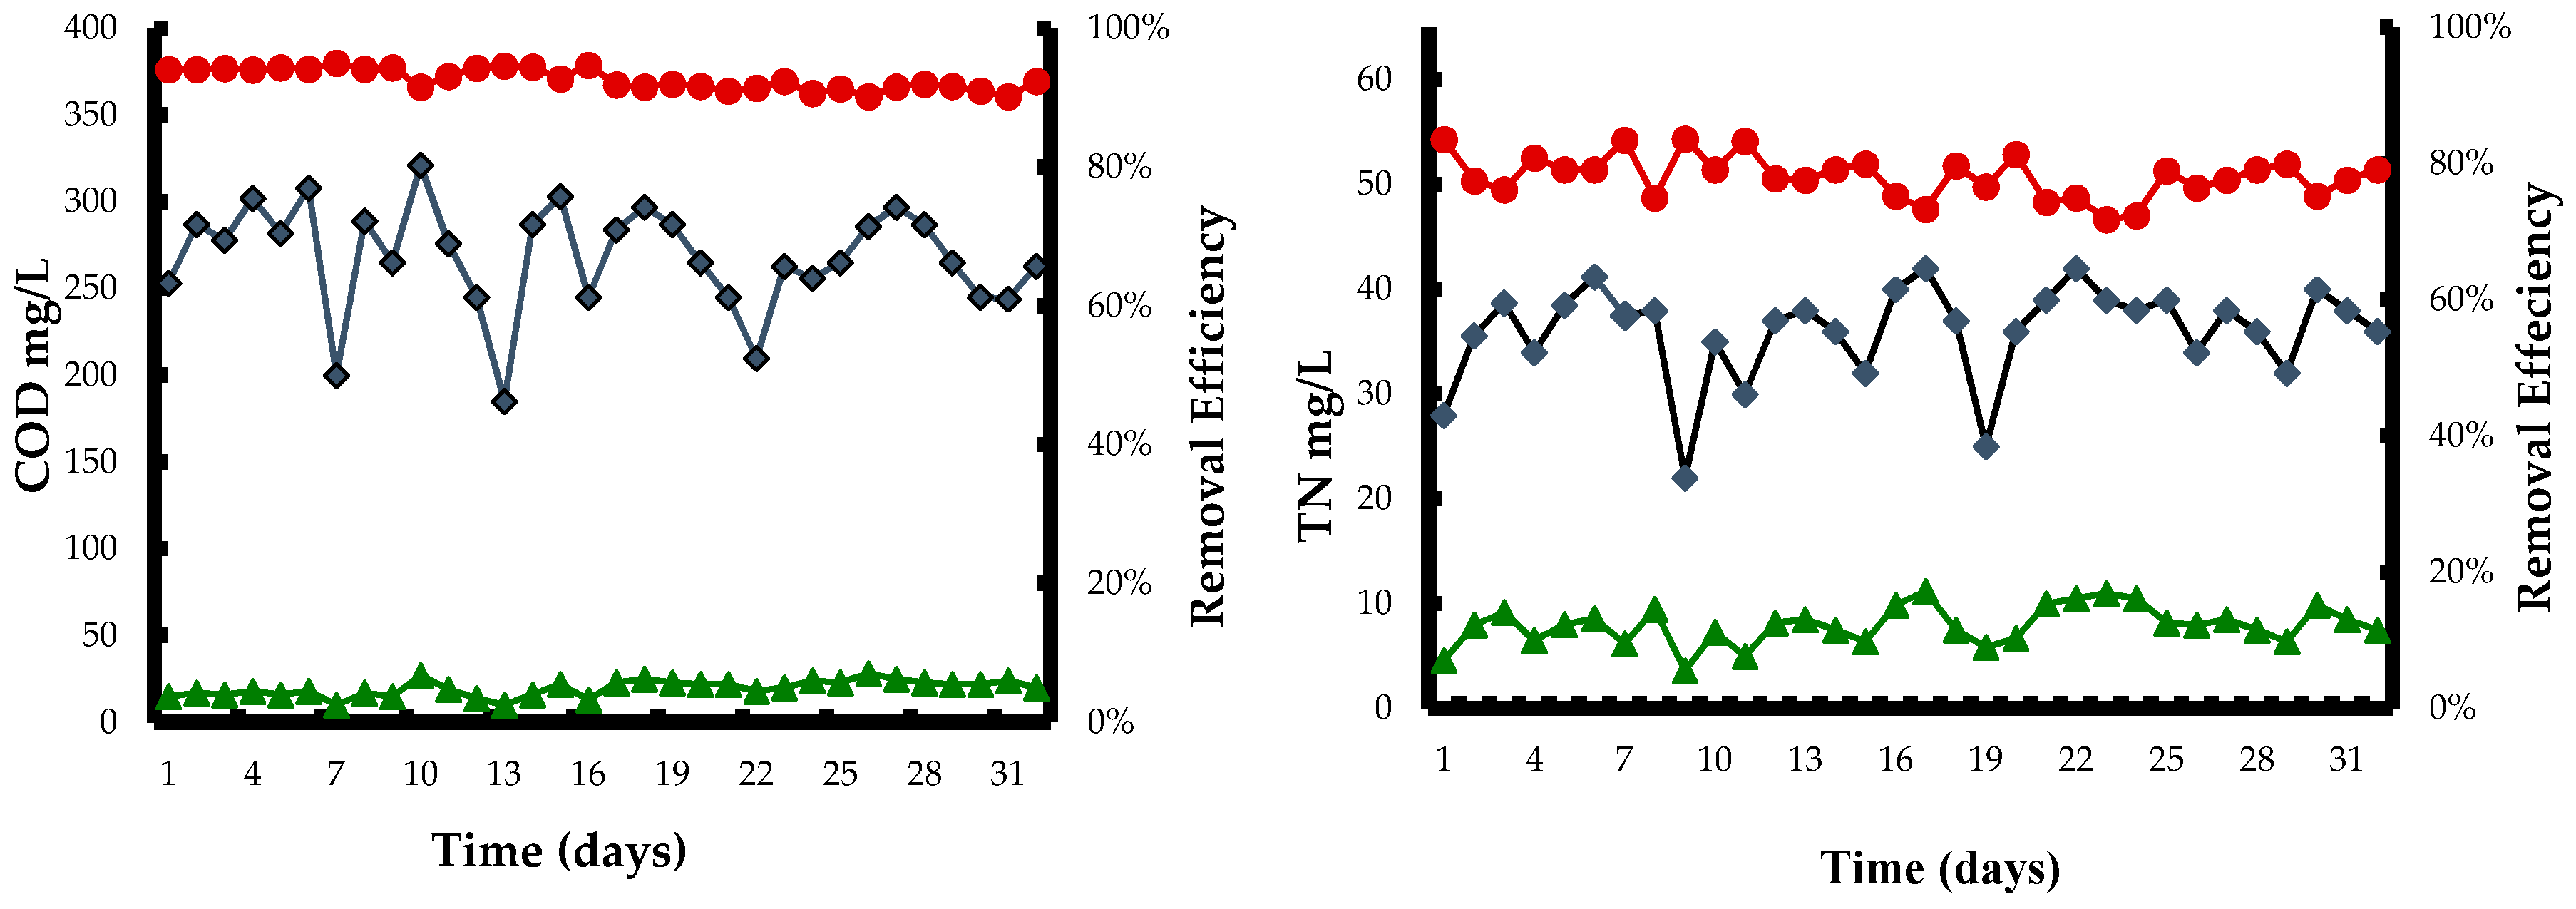

Figure 7.
Removal efficiencies of COD, TN, NH4+–N, and TP in different units of A2O–wetland system. ![Applsci 07 00066 i024]() COD;
COD; ![Applsci 07 00066 i025]() TN;
TN; ![Applsci 07 00066 i026]() NH4–N;
NH4–N; ![Applsci 07 00066 i027]() TP.
TP.
 COD;
COD;  TN;
TN;  NH4–N;
  TP.
TP.
Figure 7.
Removal efficiencies of COD, TN, NH4+–N, and TP in different units of A2O–wetland system. ![Applsci 07 00066 i024]() COD;
COD; ![Applsci 07 00066 i025]() TN;
TN; ![Applsci 07 00066 i026]() NH4–N;
NH4–N; ![Applsci 07 00066 i027]() TP.
TP.
COD; TN; NH4–N; TP.

| Parameters | pH | COD | TN | NH4–N | TP | TSS |
|---|---|---|---|---|---|---|
| mg/L−1 | ||||||
| Range | 6.89–7.23 | 183.0–324.5 | 22.4–43.5 | 15.4–35.7 | 3.4–5.1 | 172–364 |
| Mean | 7.06 | 258.4 | 33.8 | 25.6 | 4.3 | 276 |
Here, COD = chemical oxygen demand; TN = total nitrogen; NH4–N = ammonium; TP = total phosphorus; TSS = total suspended solids.
Table 2.
Test methods used for analysis [26].
| No. | Parameters | Test Methods |
|---|---|---|
| 1 | COD | Closed reflux |
| 2 | TN | Potassium persulfate spectrophotometry |
| 3 | Ammonium | Salicylic acid spectrophotometry |
| 4 | TP | Molybdenum antimony anti points spectrophotometry |
| 5 | TSS | Gravimetric analysis |
| Phase | Time (Days) | Temperature (°C) | HRT (Hours) | Volume Load (kg COD/m3·day) | COD Removal Rate % |
|---|---|---|---|---|---|
| I | 20 | 16–23 | 72 | 0.67–1.06 | 51 |
| II | 15 | 18–28 | 48 | 0.92–1.61 | 60 |
| III | 15 | 20–31 | 24 | 1.76–3.24 | 61 |
Here, COD = chemical oxygen demand; HRT = hydraulic retention time.
| Parameters | Influent | Effluent | Efficiency | ||||||
|---|---|---|---|---|---|---|---|---|---|
| Min | Max | Mean ± SD ** | Min | Max | Mean ± SD ** | Min | Max | Mean | |
| mg/L−1 | % | ||||||||
| COD | 185.3 | 321.2 | 268.2 ± 30.75 | 10.4 | 28.7 | 19.6 ± 4.6 | 0.87 | 0.95 | 0.91 |
| TN | 22.4 | 42.1 | 36.01 ± 4.59 | 3.6 | 11.5 | 7.96 ± 1.84 | 0.75 | 0.85 | 0.78 |
| NH4–N | 17 | 36 | 29.9 ± 4.42 | 0.5 | 4.6 | 2.35 ± 0.99 | 0.81 | 0.94 | 0.85 |
| TP | 3.2 | 5.7 | 4.7 ± 0.59 | 0.2 | 0.58 | 0.36 ± 0.10 | 0.87 | 0.95 | 0.92 |
Here, COD = chemical oxygen demand; TN = total nitrogen; NH4–N = ammonium; TP = total phosphorus. ** is the probability value >0.001.
© 2017 by the authors; licensee MDPI, Basel, Switzerland. This article is an open access article distributed under the terms and conditions of the Creative Commons Attribution (CC-BY) license (http://creativecommons.org/licenses/by/4.0/).
Share and Cite
MDPI and ACS Style
Abbasi, H.N.; Xu, F.; Lu, X. A Modified Bio-Ecological Process for Rural Wastewater Treatment. Appl. Sci. 2017, 7, 66. https://doi.org/10.3390/app7010066
AMA Style
Abbasi HN, Xu F, Lu X. A Modified Bio-Ecological Process for Rural Wastewater Treatment. Applied Sciences. 2017; 7(1):66. https://doi.org/10.3390/app7010066
Chicago/Turabian StyleAbbasi, Haq Nawaz, Feng Xu, and Xiwu Lu. 2017. "A Modified Bio-Ecological Process for Rural Wastewater Treatment" Applied Sciences 7, no. 1: 66. https://doi.org/10.3390/app7010066
Note that from the first issue of 2016, this journal uses article numbers instead of page numbers. See further details here.