1. Introduction
Light alloys, especially aluminum alloys, have been traditionally used in the aircraft industry, mainly in the manufacturing of aircraft structural components [
1,
2]. However, in the last few decades, new materials, such as Carbon Fiber Reinforced Polymers (CFRP), are being used in the manufacturing of these parts [
3]. Frequently, these new materials are utilized in combination with light alloys, to form Fiber Metal Laminates (FML) structures (CFRP/Al) [
4].
Notwithstanding, most of the aeronautical projects for commercial aircraft usually have a lifetime of about 15–20 years [
5]. So, these alloys are still used in the manufacturing of parts such as wing tension members, shear webs, and ribs, where critical requirements include high compressive strength, tension loading, or fatigue [
6]. Consequently, their probability of failure must be reduced. As a result, their manufacturing must be carried out with narrow margins of deviation from design specifications [
7].
Among the different forming processes used in the manufacture of these parts, machining is one of the most common (mostly turning, drilling, and milling operations) [
8,
9]. Although aluminum alloys have, in general, good machinability [
10], when they are hybridized with CFRP, several problems arise, which remain mostly unresolved [
11,
12]. One of the critical factors influencing these processes is the need to complete machining in dry conditions. There are various reasons that lead to such machining under these conditions. On the one hand, CFRP do not exhibit good behaviour under cutting fluids [
13]. On the other hand, the mixture of aluminum chips, CFRP, and cutting fluid presents difficulties when it comes to recycling [
14]. In addition, the new environmental laws call for the use of sustainable manufacturing technologies [
15,
16]. This requires minimizing or eliminating toxic and/or environmentally harmful substances, such as cutting fluids [
17,
18].
Under these dry conditions, the chip evacuation becomes an especially relevant factor, either when machining aluminum alloys as an isotropic material, or during hybridization with composites. High temperatures in the cutting area result in material adhesion phenomena of the cutting tool, which hampers the chip evacuation. In addition, the chip morphology can be related to the tool wear and the surface integrity of the machined part [
19,
20,
21]. Therefore, it influences the dimensional accuracy of the part, and the continuity and stability of the process [
22]. Because of this, the control and monitoring of the chip formation are important to consider during the performance improvement of machining processes [
23].
The chip morphology depends on cutting parameters (cutting speed, feed, and cutting depth), tool geometry, the relative position of the tool-workpiece, and work material properties [
24]. In the literature, many research works on the impact of cutting conditions on the chip formation process and the mechanism of chip formation, can be found [
25,
26,
27,
28,
29,
30]. So, in the case of dry machining aeronautical aluminum alloys, most of the studies are devoted to characterizing the chip arrangement and morphology under different values of cutting parameters, in order to obtain information about the machinability of a particular alloy [
31]. However, there are a lack of studies dedicated to obtaining the relationship between cutting parameters, and geometric and dimensional chip parameters, especially in dry machining. In this regard, there are few studies devoted to obtaining parametric relationships, which allow one to predict the chip morphology and its geometric parameter values, as a function of the cutting parameters [
7,
32].
In this work, a study of the feed influence on chip morphology in dry machining of UNS A97075 (Al-Zn) and UNS A92024 (Al-Cu) alloys has been performed. Different geometric parameters of the chip morphology have been obtained and their evolution with feed has been analysed. Finally, different relationships have been developed, allowing one to predict the evolution of some of the geometric parameters of the chip, as a function of feed.
2. Materials and Methods
Several machining tests were carried out with test bars of two aeronautical aluminum alloys, UNS A92024-T3 (Al-Cu) alloy and UNS A97075-T6 (Al-Zn) alloy, both of which are widely used in the manufacturing of aircraft structural components. The composition of tested alloys, presented as a percentage of weight, is shown in
Table 1.
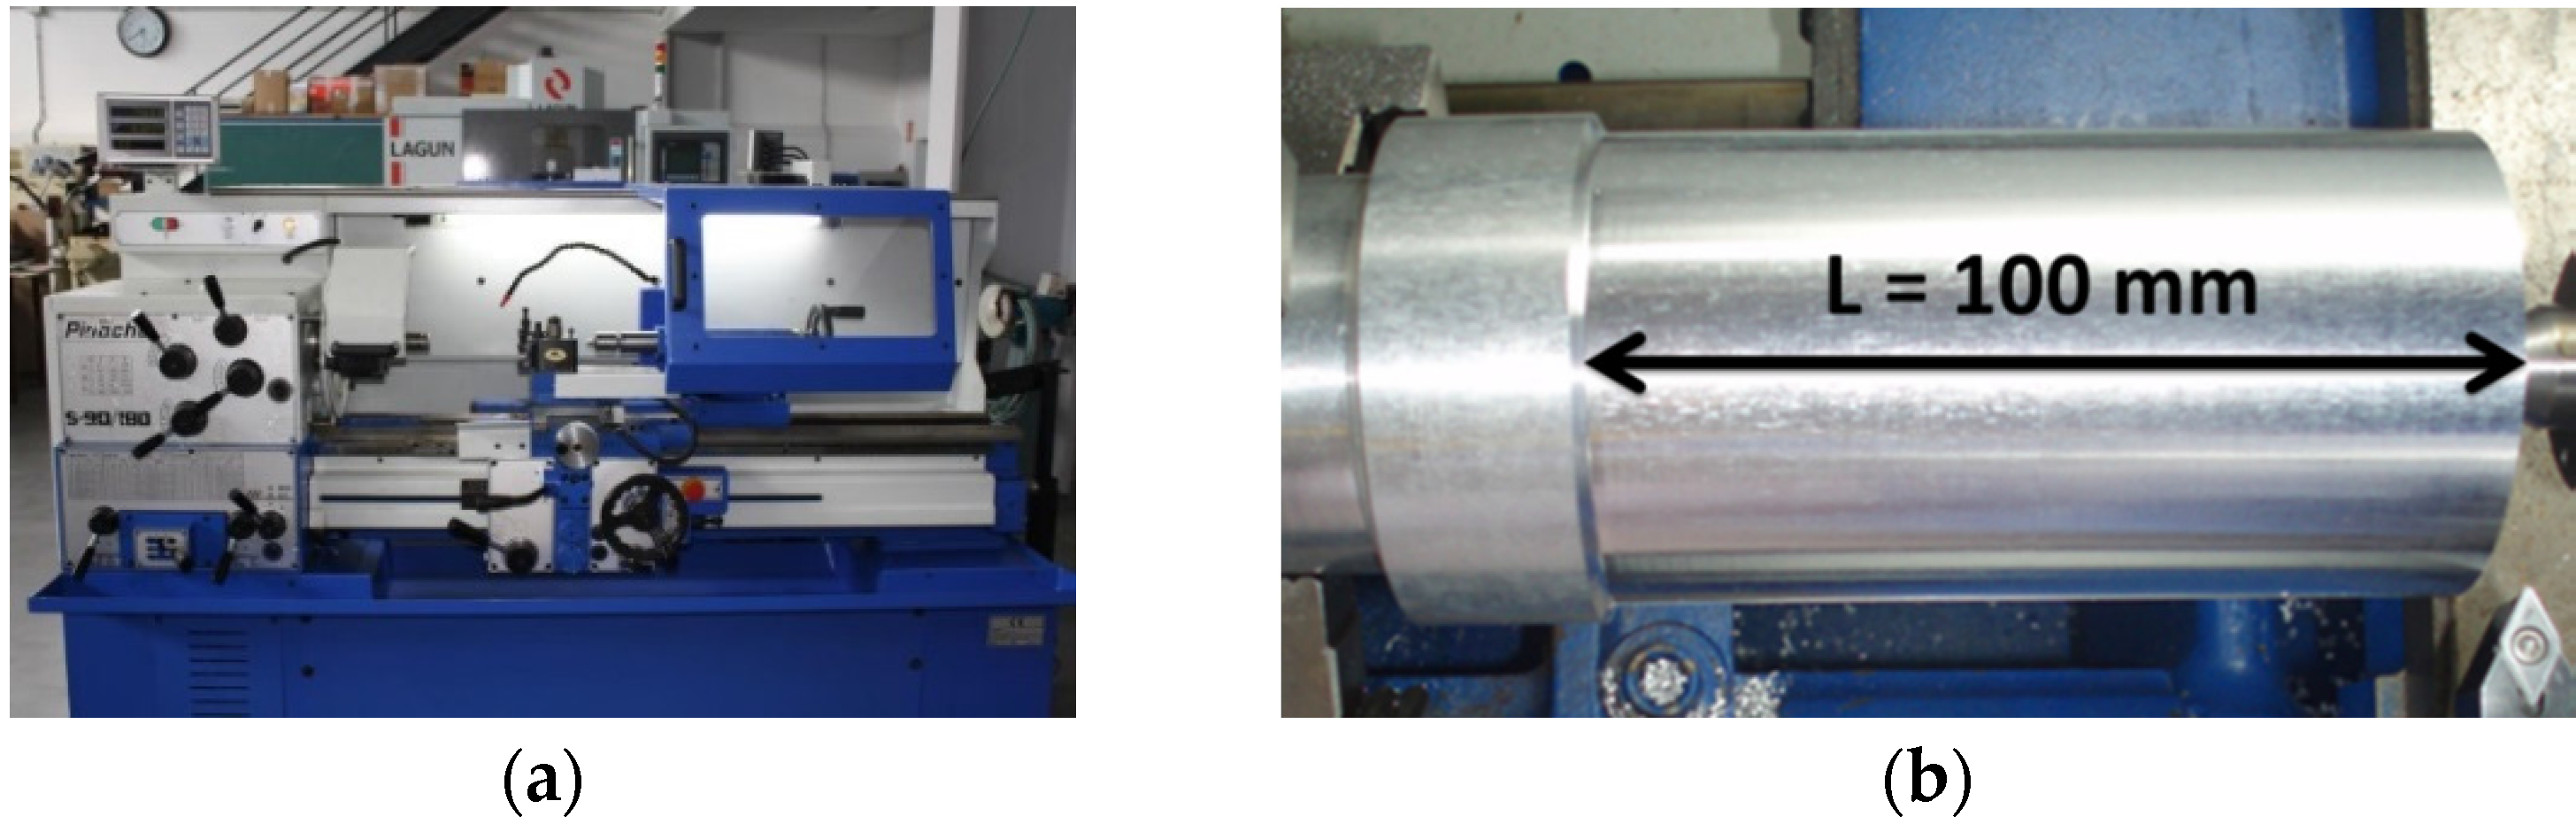
The machining operation selected to perform the tests was parallel horizontal turning, because it minimizes the geometric variables of the process and allows the cutting speed to remain constant. Cylindrical test bars (150 mm long and diameters between 40 mm and 60 mm) were used. Turning tests were carried out in a horizontal lathe, using the model Pinacho SP285R (seen in
Figure 1a). All of the tests were conducted with a constant axial machining length,
L = 100 mm, seen in
Figure 1b.
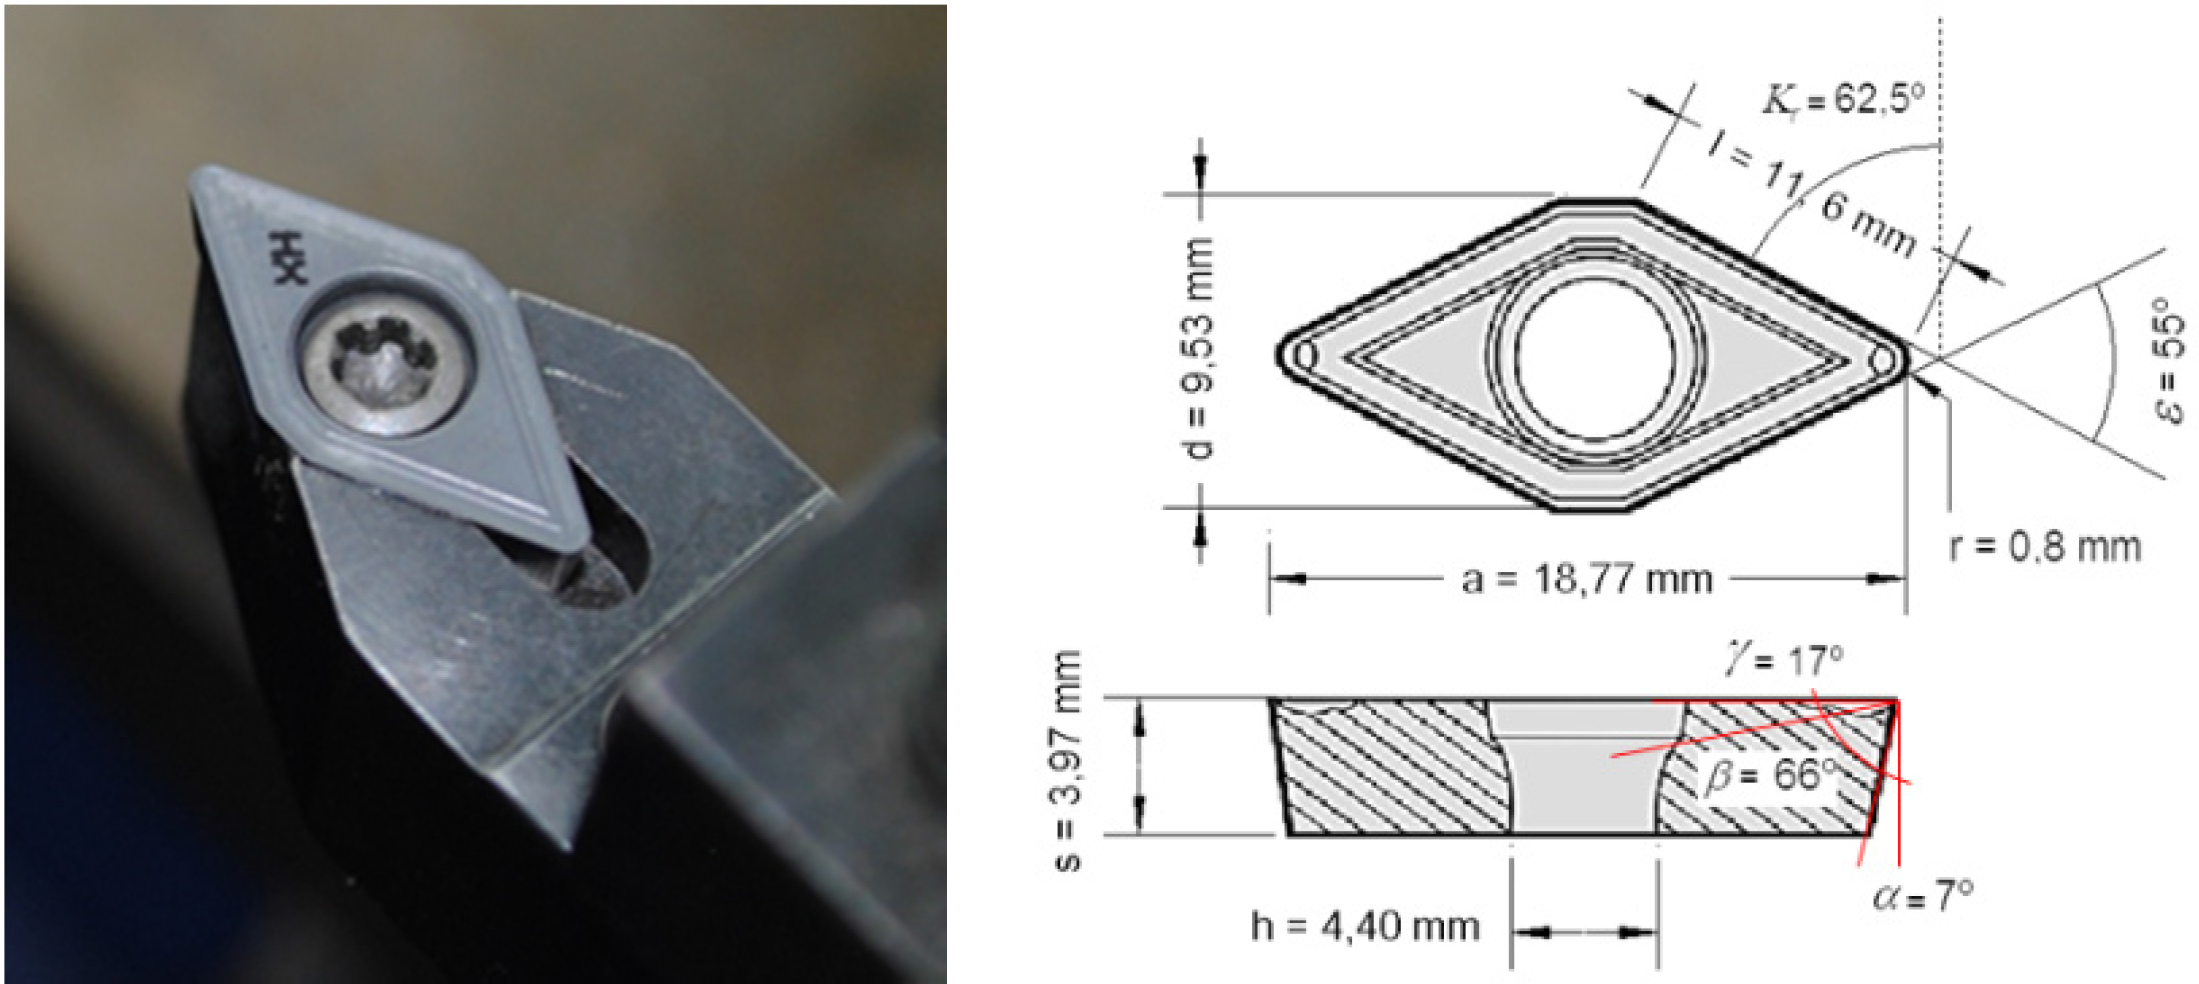
The tools used were neutral WC–Co uncoated turning inserts, with ISO DCMT 11T308F2 identification. Tool geometry is indicated in
Figure 2. In order to ensure the same initial conditions, a new insert was used in each test. A configuration of cutting angles was used, shown in
Table 2. Machining tests were carried out using techniques with low environmental impacts, so all of them were performed in dry conditions.
In order to evaluate the influence of the cutting parameters on the chip geometry, different combinations of cutting speed (
vc), feed (
f), and depth of cut (
ap) values were applied, as presented in
Table 3. In this regard, previous researches have shown a higher influence of feed on the chip morphology of these alloys, whereas the influence of cutting speed and depth of cut were lower [
32]. Accordingly, machining tests were carried out with a fixed
vc and
ap. It should be pointed out that, although a low cutting speed is not recommended for machining aluminum alloys, these alloys are often hybridized with other materials, in which low cutting speed are required.
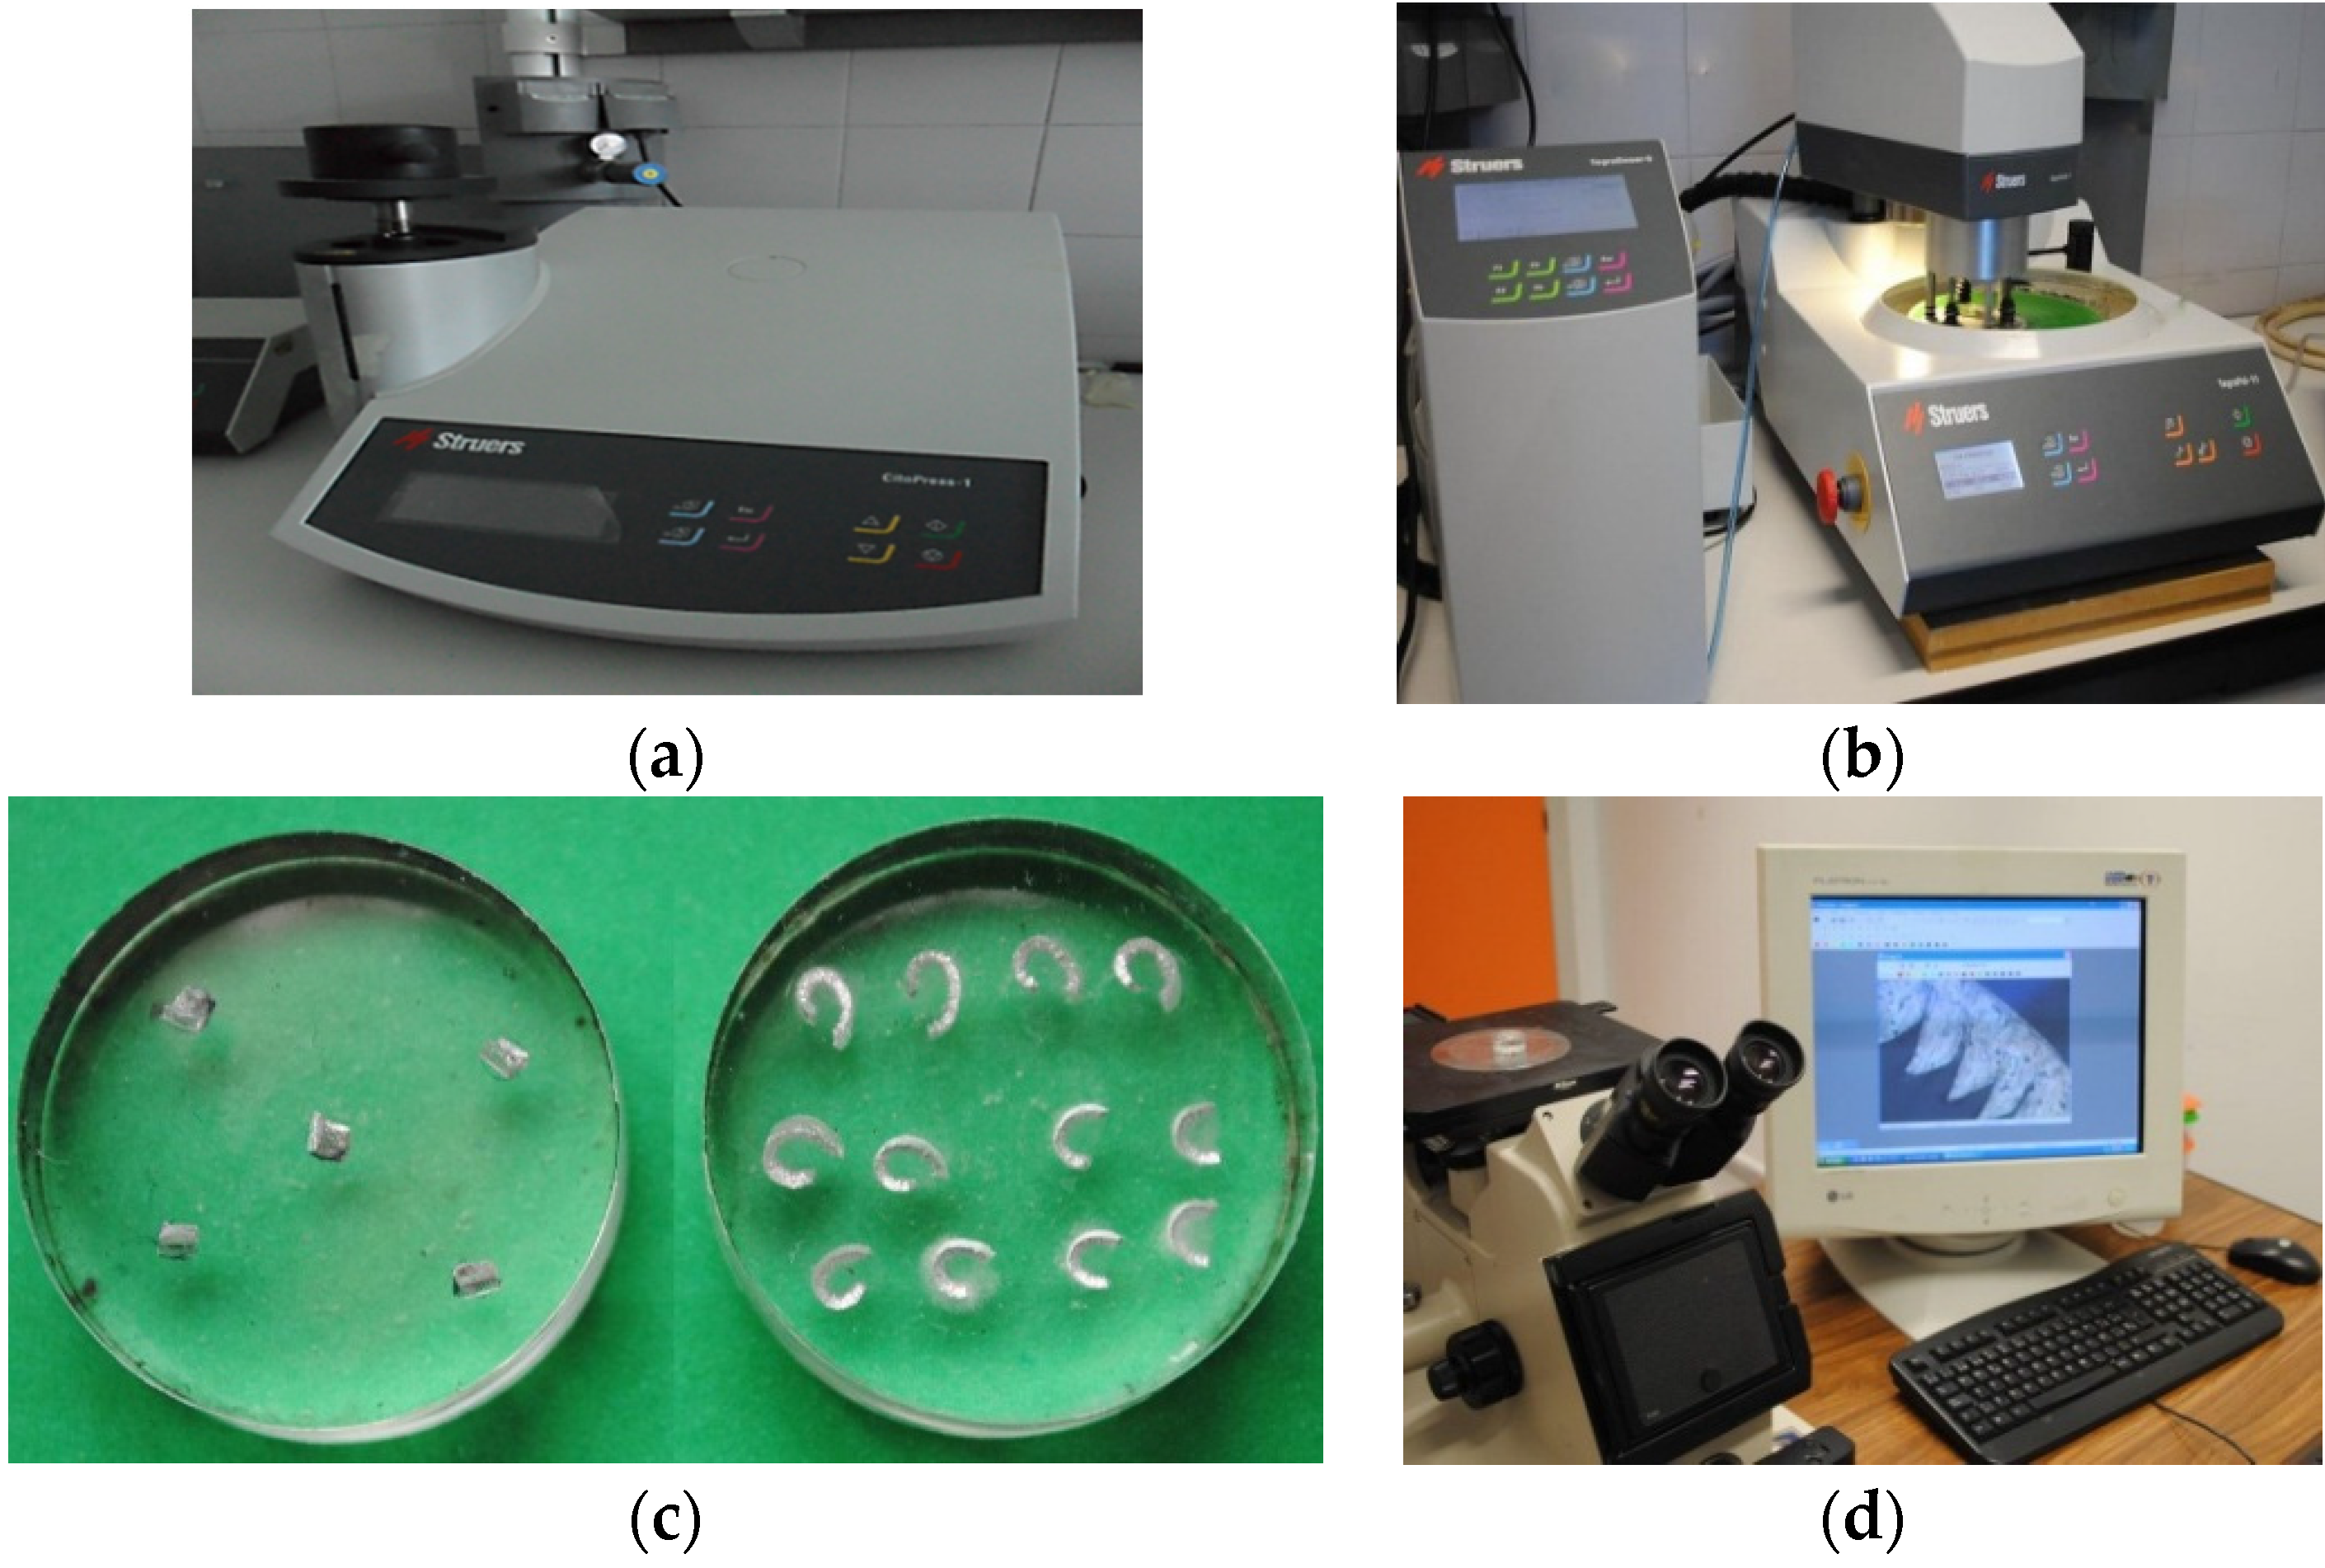
The cutting process was monitored by using a SONY DCR-DVD92E Digital Camera, in order to record the chip generation process, as well as detect any machining issues. In addition, the generated chip was collected, photographed, and stored for further observations. With the aim of evaluating the evolution of the chip geometry along the axial machining length, the chip collection was conducted in three phases: at the beginning, the middle, and the end of machining. Subsequently, chip samples were prepared for observation by Stereoscopic Optical Microscopy (SOM). To complete this, metallographic techniques were used. Firstly, the samples were embedded in resin (STRUERS CLAROFAST) by using CITOPRESS-1 STRUERS equipment,
Figure 3a. Later, they were polished using TEGRAPOL-11 STRUERS equipment,
Figure 3b. Finally, a chemical etching was performed on the samples, in order to facilitate the observation of the chip geometry parameters. For this purpose, a KELLER reagent was used (95% H
2O, 2.5% HNO
3, 1.5% HCl, 1% HF).
Chip specimens (
Figure 3c) were observed using an inverted metallurgical microscope, EPIPHOT 280 NIKON (
Figure 3d). SOM images from the chip’s longitudinal and transverse section were acquired through the use of a CF Infinity Optical System (1.5× to 400×) and a Digital Eclipse Camera. The chip geometric parameter measurements were performed using OmniMet BUEHLER software.
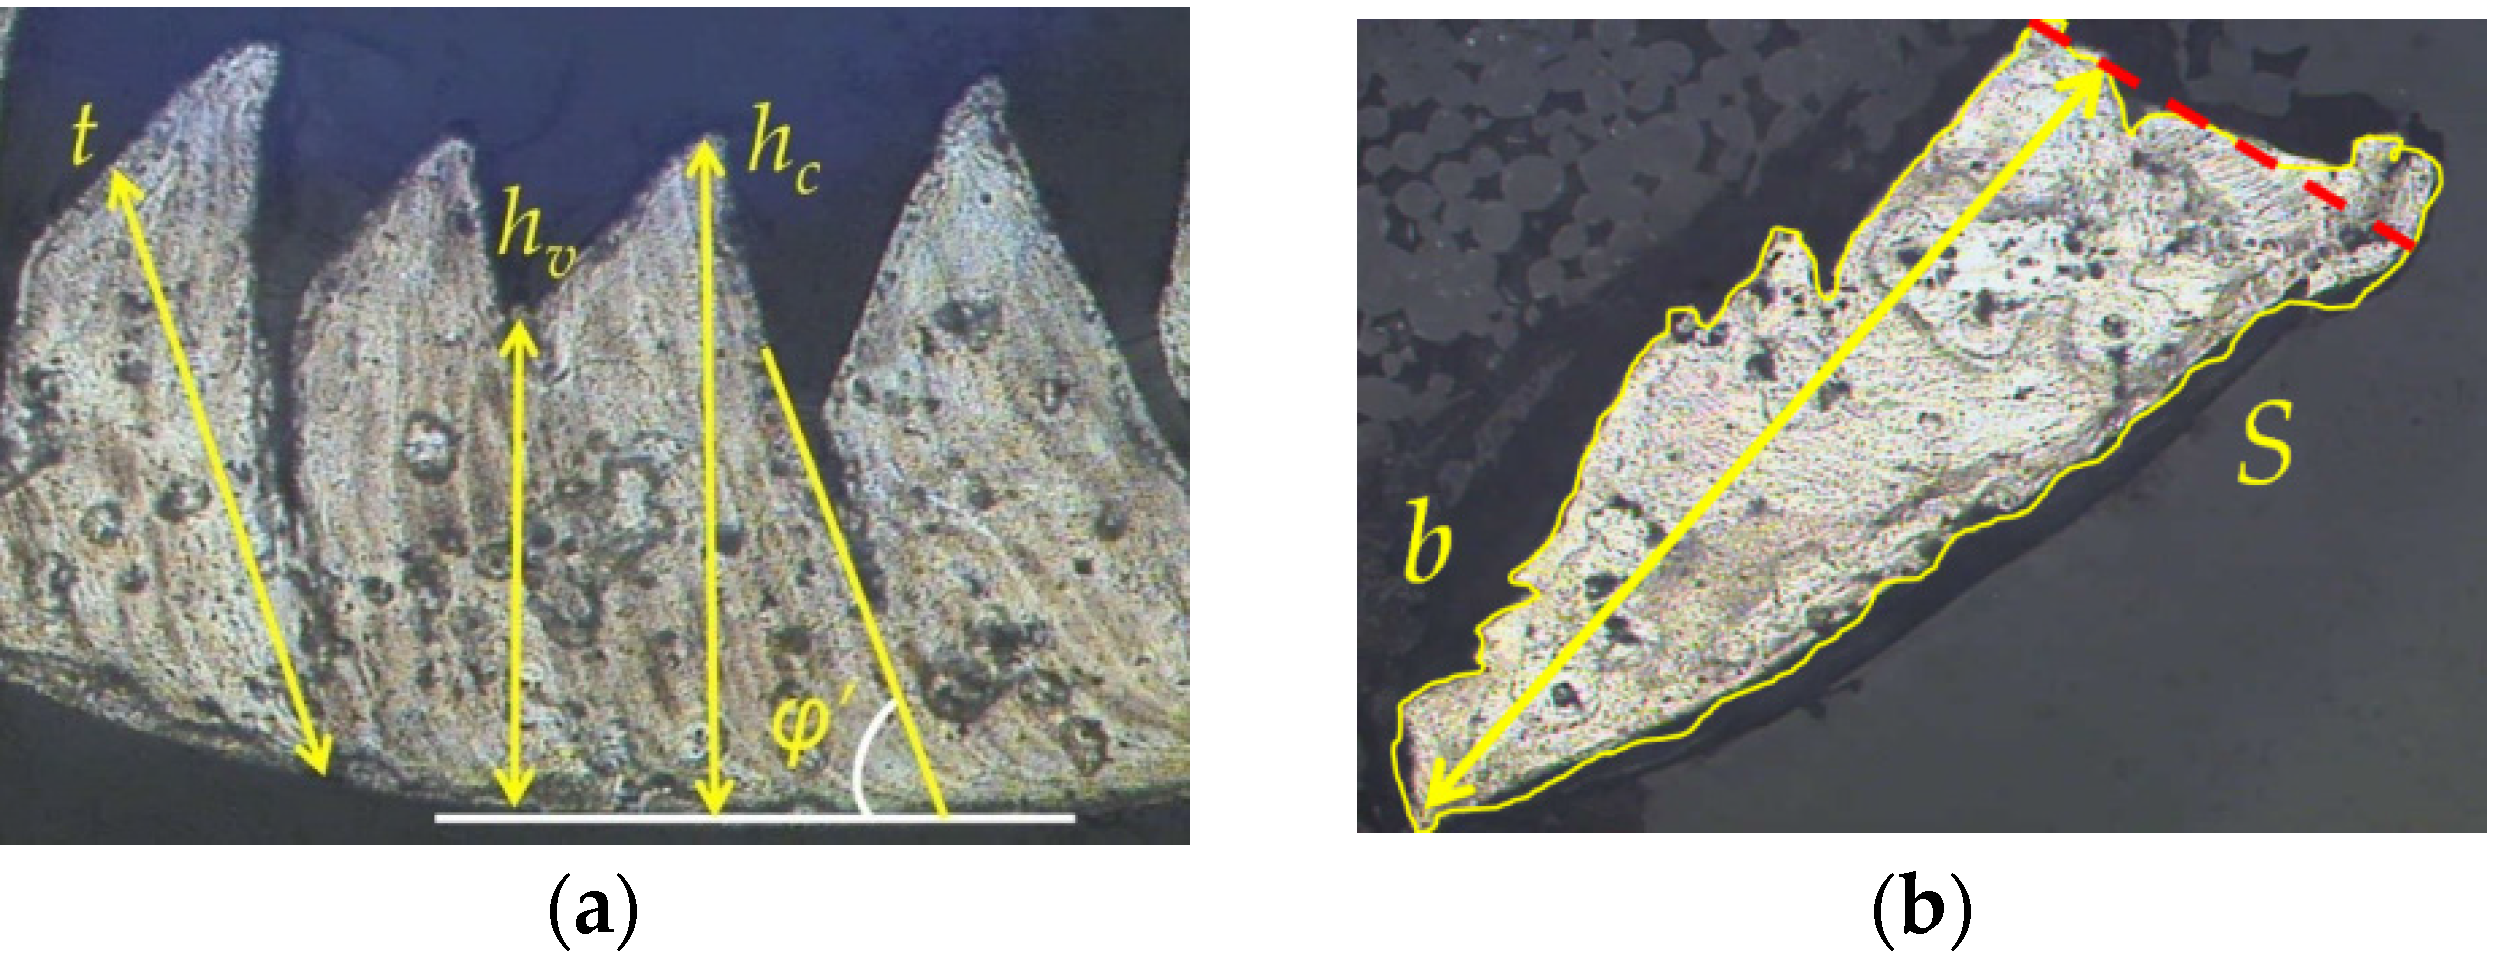
Figure 4 shows the geometric parameters measured on the longitudinal and transverse section. So, the following can be observed: height of peaks (
hc), height of valleys (
hv), chip thickness (
t), complementary shear angle (ϕ’), chip width (
b), and the chip’s cross-section area (
S). The shear angle (ϕ) has been indirectly obtained through its complementary angle (ϕ’), Equation (1):
In addition, the shrinkage factor (ζ) has been calculated by Equation (2), where γ is the rake angle. This parameter provides information on the total chip strain in the cutting process [
24,
30]. It should be pointed out that the hypothesis of a constant volume of the chip during machining, has been assumed in Equation (2), as well as the hypothesis of the plane strain. In addition, an orthogonal cutting process has been assumed. The set-up tool selected allows a close examination of this last hypothesis.
For each test performed, a total of 12 samples of the longitudinal section were prepared for observation, four samples for each zone analyzed (the beginning, the middle, and the end of machining),
Figure 3c. In addition, each geometric parameter of the longitudinal section was measured three times in each sample, resulting in a total of 36 measurements for each feed value.
On the other hand, the chip cross-section area (
S) may change, depending on the position along the chip length. To ensure uniformity in the comparisons, all
S measurements were made along the shear band. To measure
b, a line was drawn approximately parallel to the wider side (red dashed line,
Figure 4b). Then,
b was obtained by drawing a perpendicular line to the farthest point. A total of five samples of the transverse section were analyzed (
Figure 3c), and each geometric parameter was measured three times, resulting in a total of 15 measurements for each feed value.
3. Results and Discussion
3.1. Chip Morphology
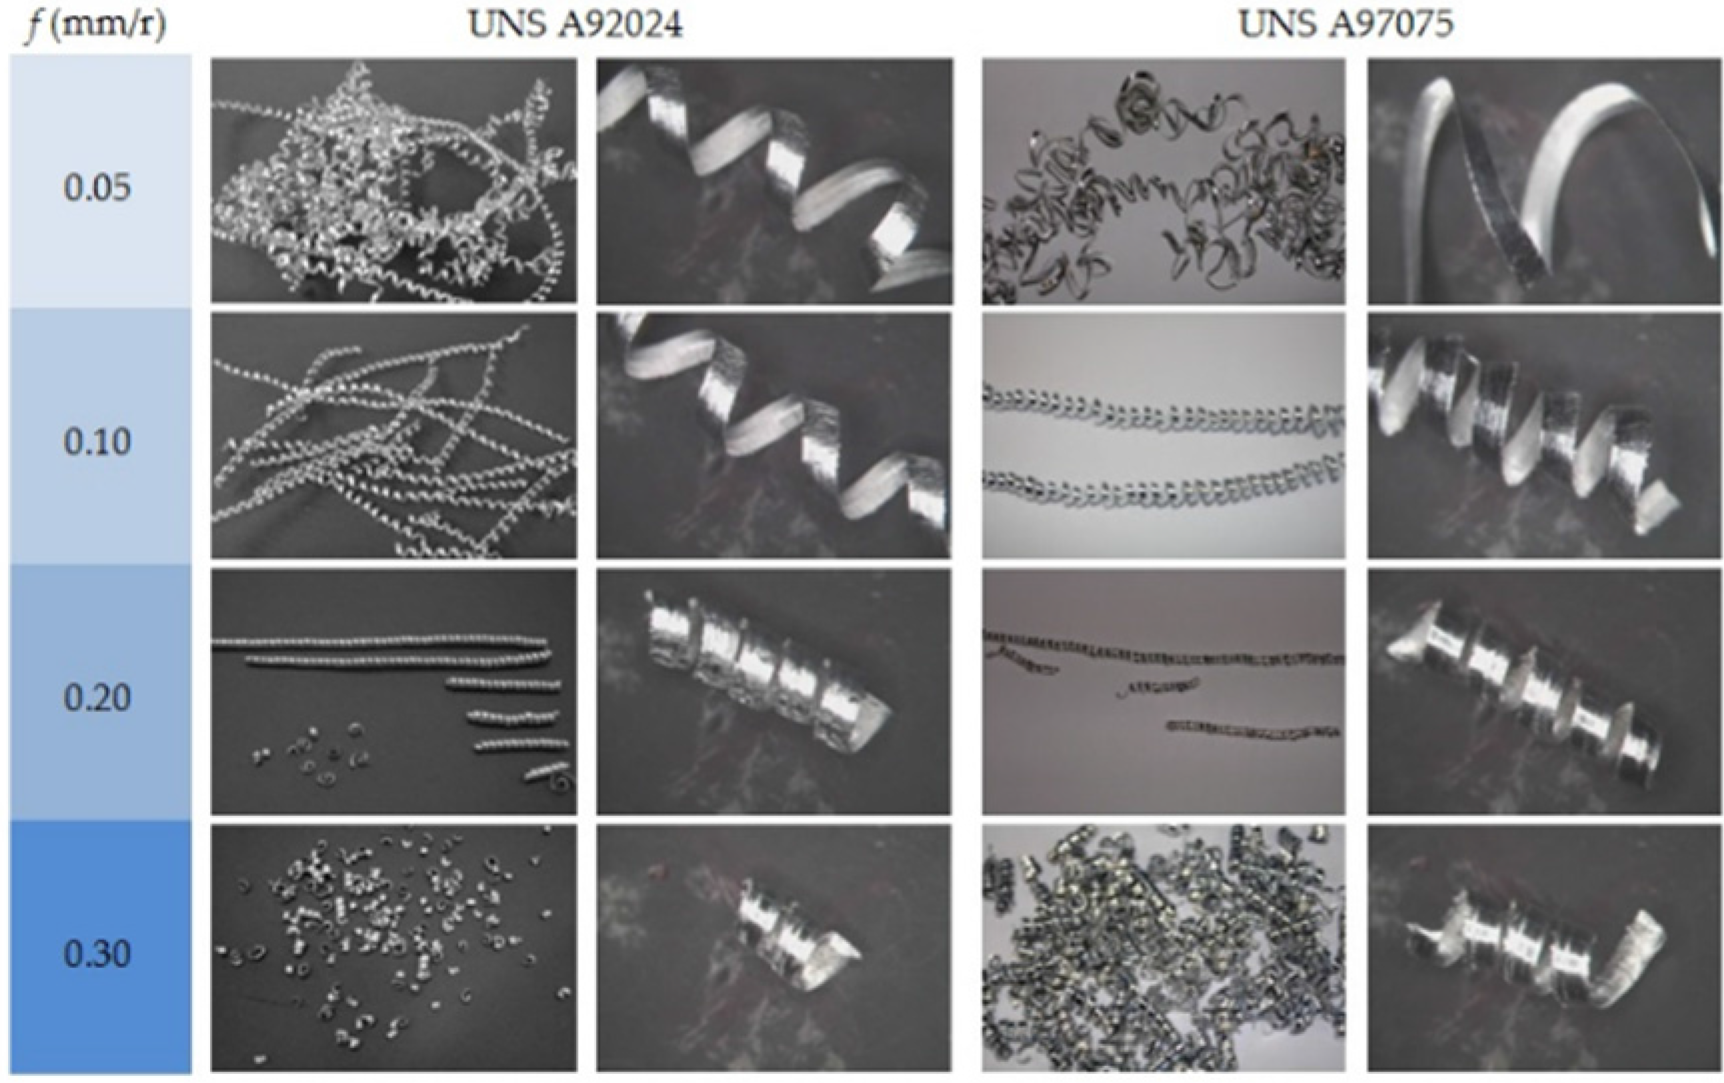
Figure 5 shows the chip macro-geometrical evolution for each feed, for both tested alloys. It can be observed that a continuous chip was obtained in the lowest feed range (0.05 mm/r and 0.1 mm/r), whereas a segmented and shorter chip was obtained in the highest feed range (0.2 mm/r and 0.3 mm/r). Besides, a tendency to form chip nests was observed for
f = 0.05 mm/r. It can be noticed that this evolution was similar in both UNS A92024 and UNS A97075 alloys. All of these observations can be explained by taking into account the increase in cutting force and compression stress, due to the increase of feed. The shear limit is easily reached when the highest feed values are applied and, as a result, a segmented chip is obtained. In addition, a lower value of chip thickness is obtained when a lower value of feed is applied. This makes a chip less rigid and chip nest formation is more likely. It should be pointed out that the observed behavior in both alloys is in good agreement with the results obtained in previous studies [
23,
31].
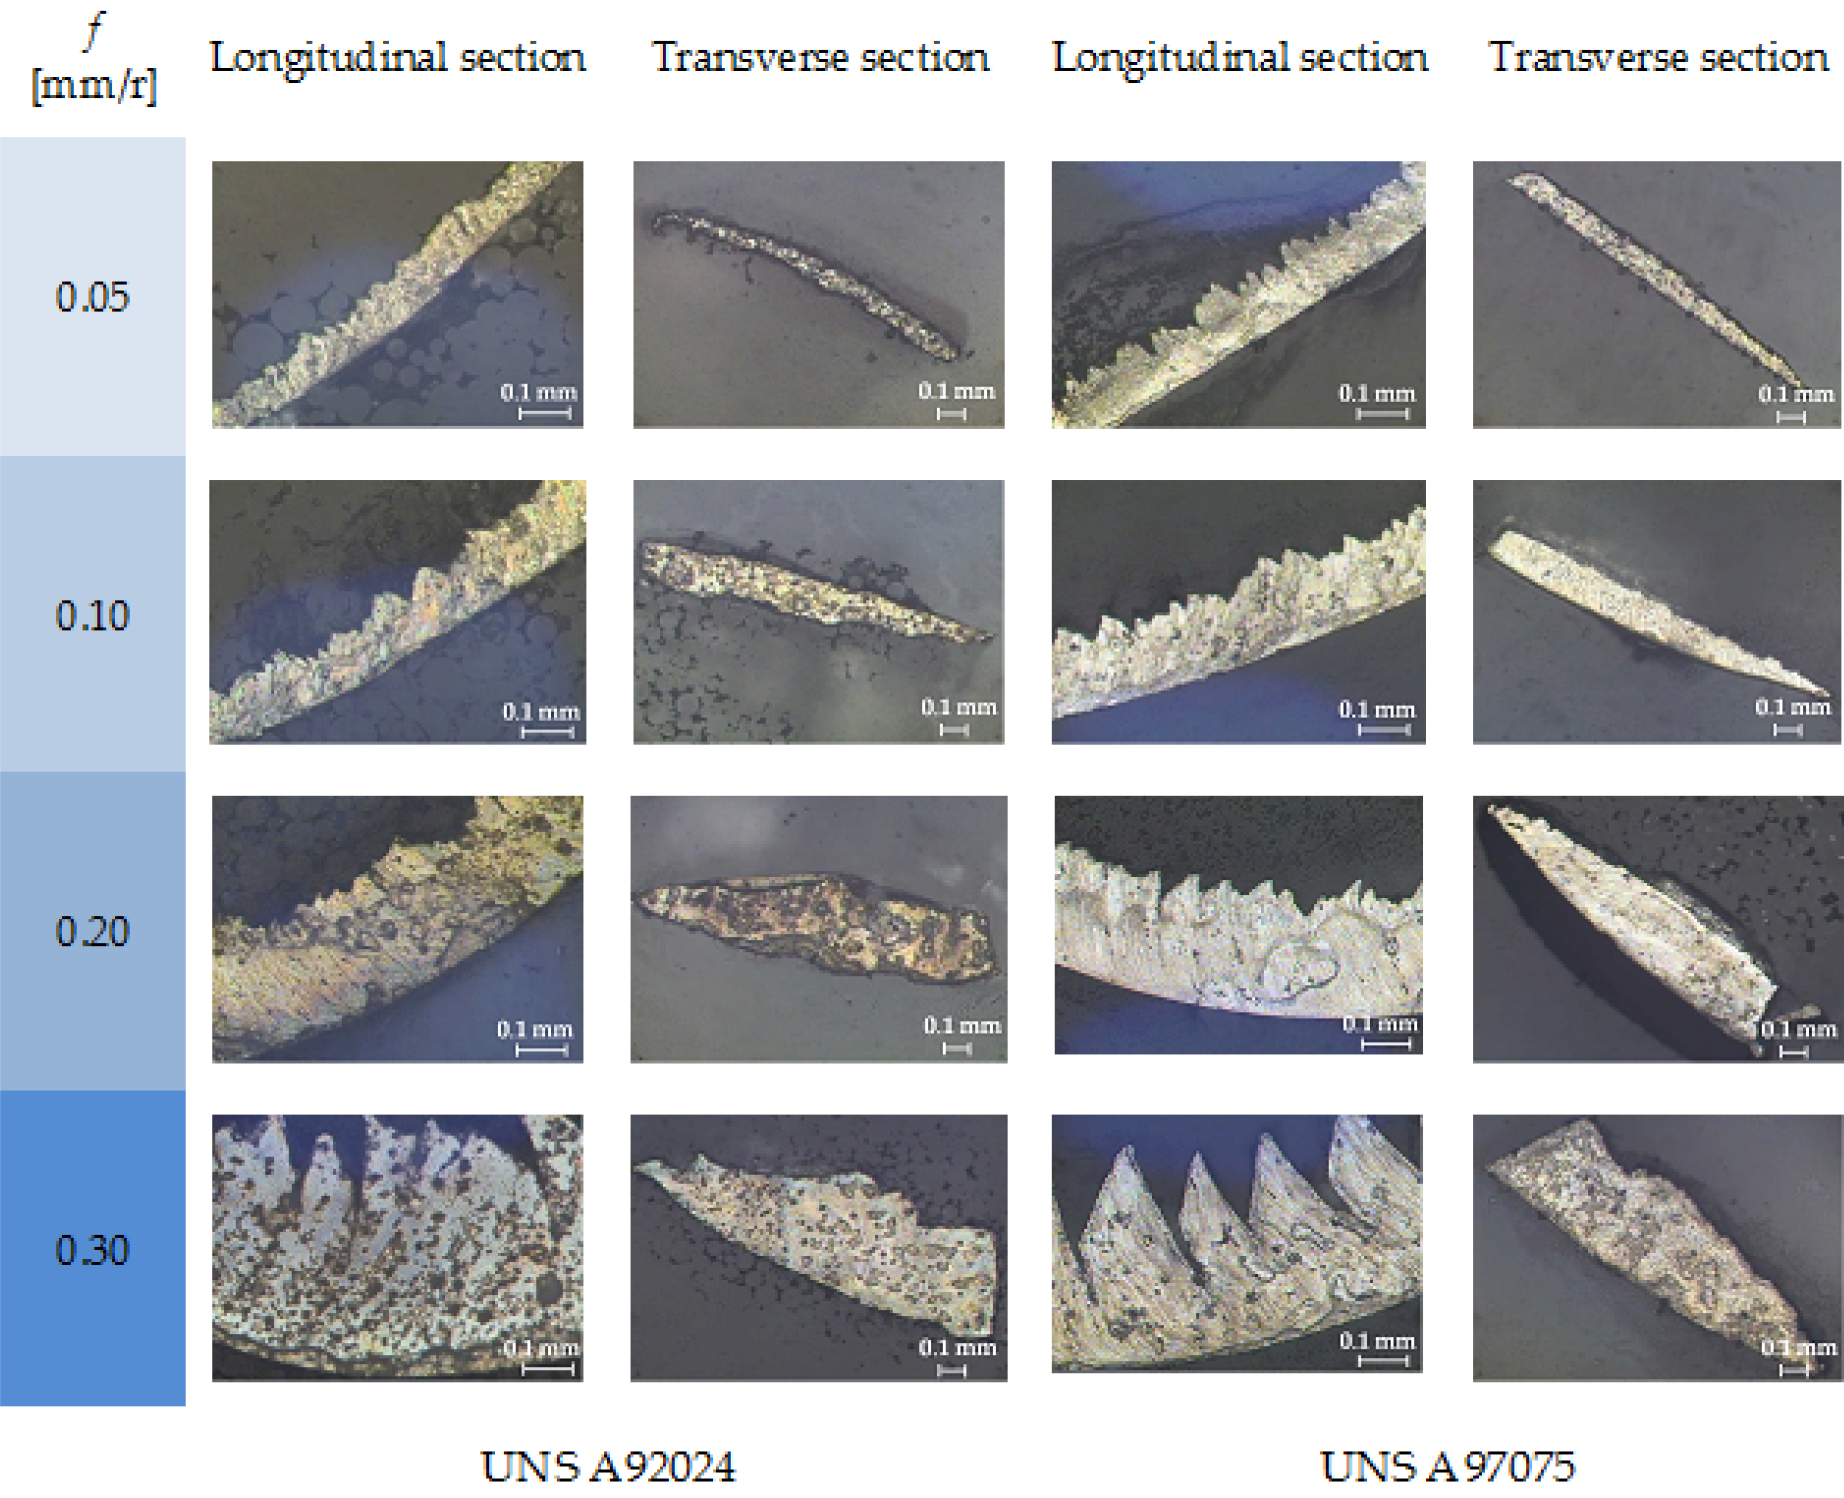
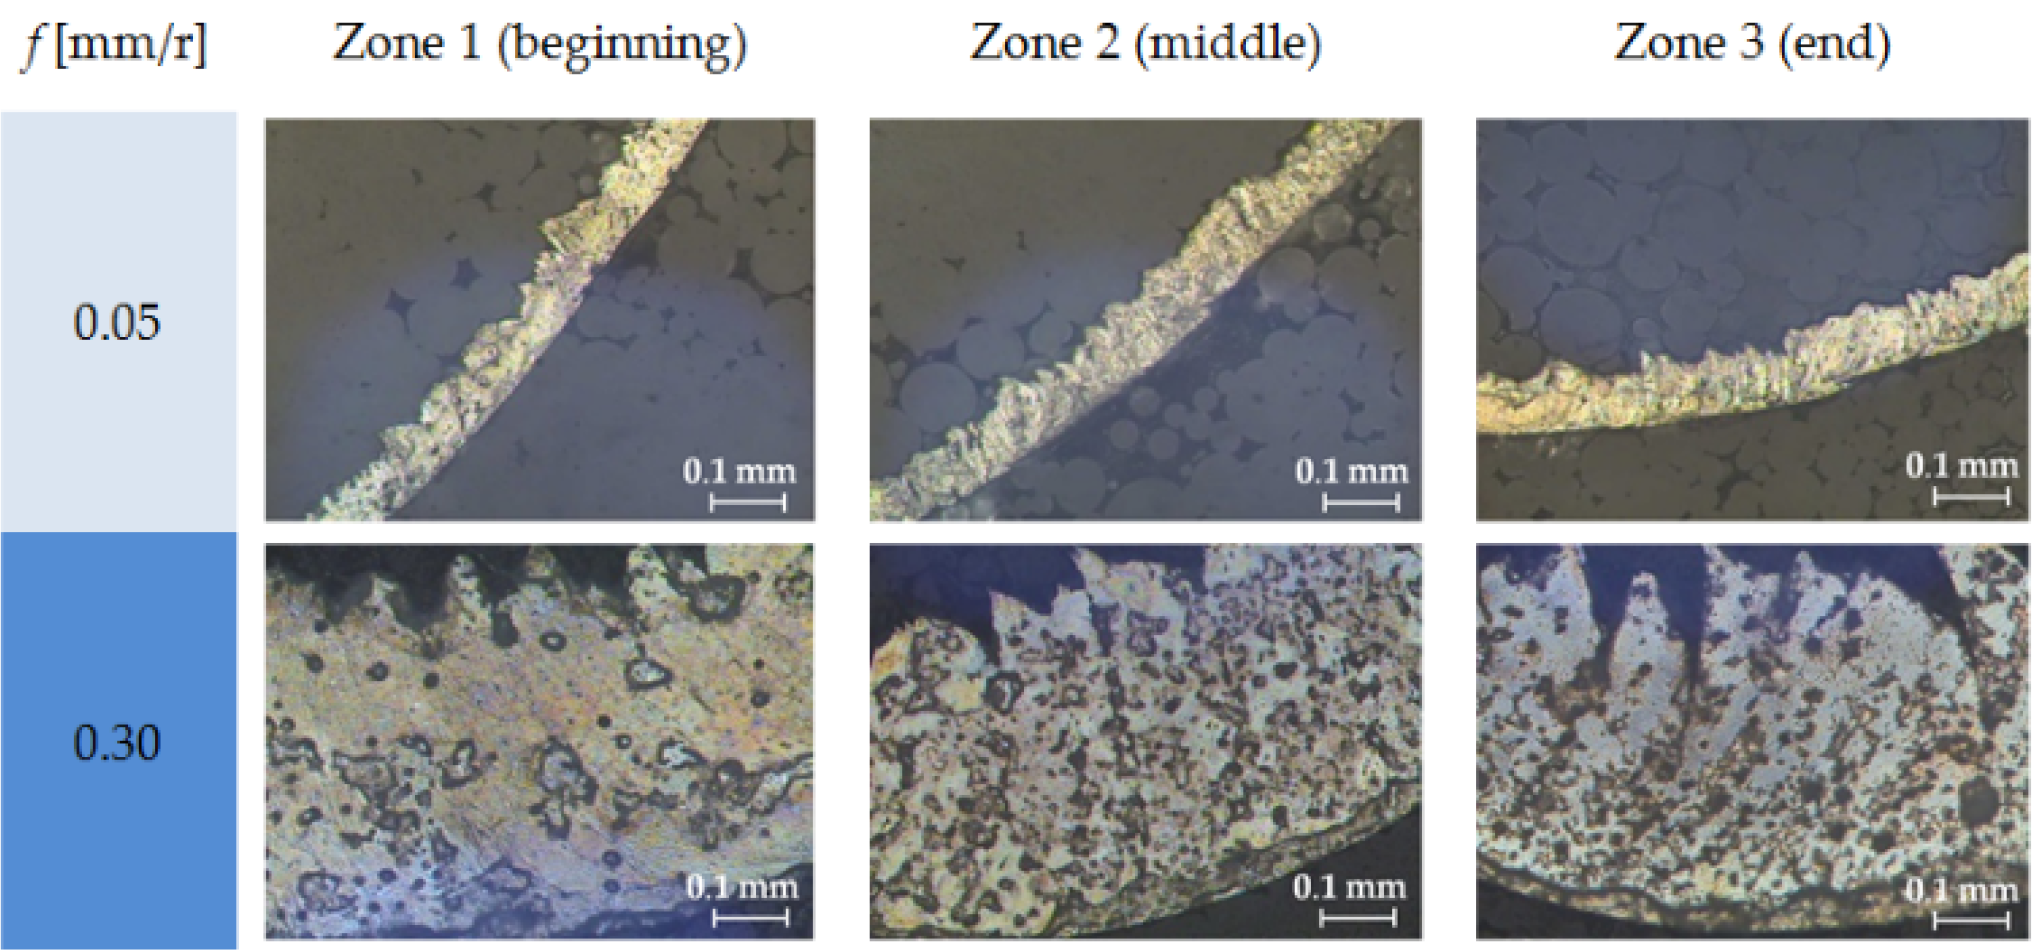
Figure 6 shows SOM images of the chip’s longitudinal and transverse section, as a function of feed.
Apparently, higher segmentation in a chip’s longitudinal section is observed for higher f values. The chip longitudinal section images show a saw-teeth form of chip for f = 0.2 mm/r and f = 0.3 mm/r. The shear sliding effect is stronger for higher feed-rates, due to the fact that the shear limit is more easily reached.
Furthermore, this effect is more noticeable when the feed increases from 0.1 up to 0.2 mm/r. These changes are less apparent once the shear strength limit is reached (from f = 0.2 mm/r up to f = 0.3 mm/r).
In addition, this is more intense in the UNS A97075 alloy, than in the UNS A92024 alloy. This behavior can be explained by taking into consideration the high Zn content of the UNS A97075 alloy, which provides it with a higher plasticity. Thus, a chip of the UNS A97075 alloy is able to support a larger deformation before breaking. This is in good agreement with the data observed in
Figure 5, where a slightly shorter chip is obtained in the UNS A92024 alloy for 0.2 mm/r and 0.3 mm/r.
Finally, no substantial changes were observed in chip morphology as a function of axial machining length (
L), as can be observed in
Figure 7. In this figure, SOM images of the chip’s longitudinal section of the UNS A92024 alloy as a function of
L are shown, for some of the
f values tested.
In this regard, both alloys exhibited the same behavior. These observations are in good agreement with the evolution along L, shown by each of the geometric parameters analyzed (which will be shown later).
3.2. Height of Peaks (hc) and Valleys (hv)
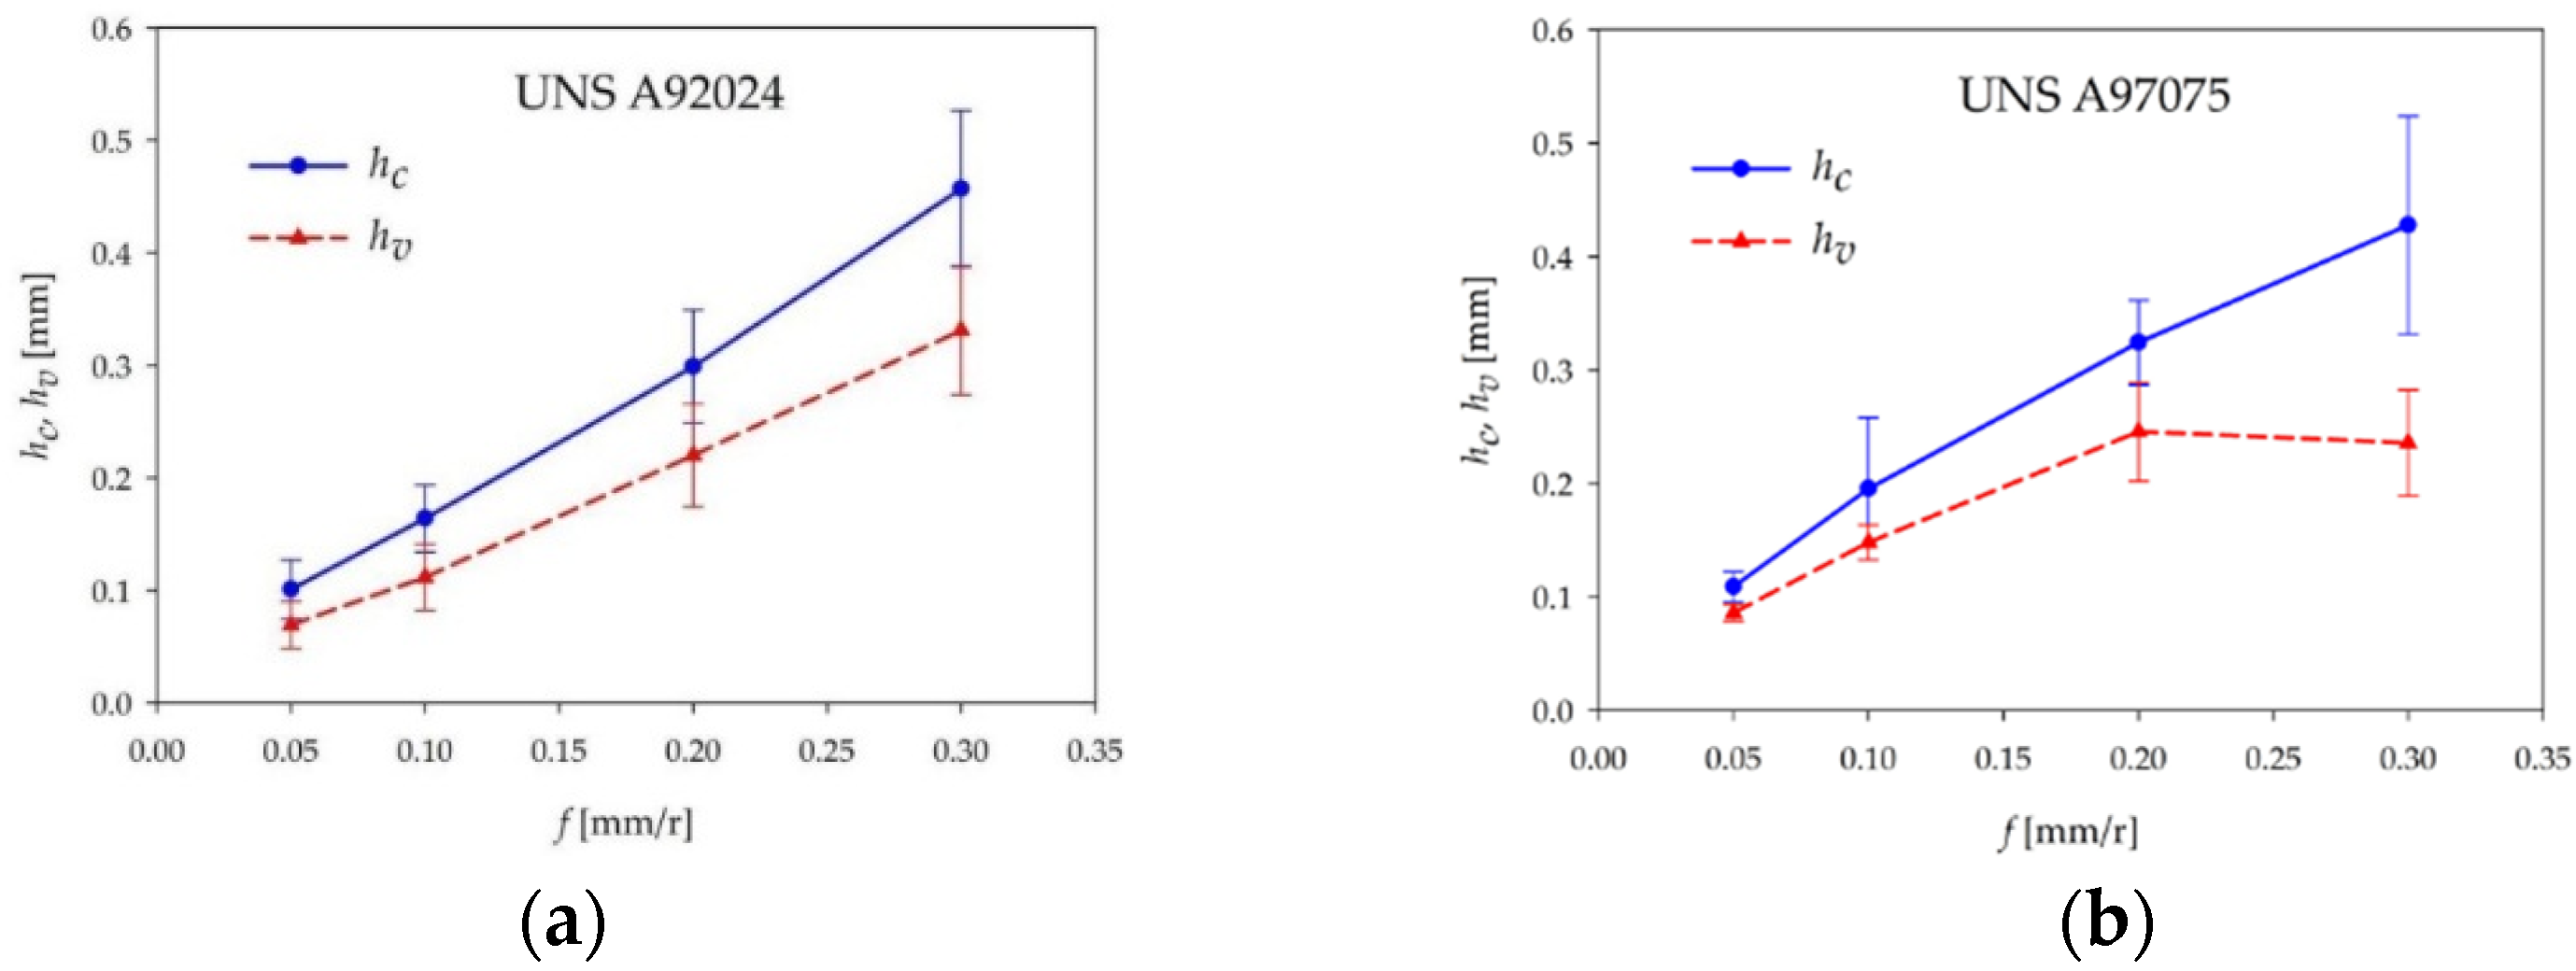
Figure 8 shows the evolution of the
hc and
hv mean values of the chip specimens analyzed, as a function of
f. As can be observed,
hc and
hv values increase with
f, in agreement with the arguments exposed above. This trend is common for both alloys. Furthermore, the largest percentage increase takes place for low feed values (from 0.05 mm/r to 0.1 mm/r). For higher feed values (from 0.1 mm/r to 0.3 mm/r), the percentage increase is lower. As previously commented on, once the shear limit is reached, the changes are less noticeable.
In general, the mean values are very similar for each alloy. Only for f = 0.3 mm/r can a slightly lower value of hv for the UNS A97075 alloy be observed. Due to this, the height difference between hc and hv is higher for the UNS A97075 alloy, than for the UNS A92024 alloy, for this feed value. In addition, the mean value of hv shows a trend to remain constant when f increases from 0.2 mm/r to 0.3 mm/r, for the UNS A97075 alloy. All of these observations can be explained by taking into account that the UNS A97075 alloy withstands larger deformations before breaking, due to its higher plasticity. This effect is more noticeable for high feed values, when the cutting forces are higher. Finally, no significant changes were observed for these parameters as a function of L, in a similar way to that observed for the chip morphology. The mean value variation of hc and hv along L is around 10%, which is within the standard deviation of the measurement process.
From these experimental results for
hc and
hv, a segmentation ratio (
SR) can be calculated, Equation (3). The obtained results for
SR are shown in
Table 4.
In general, a higher segmentation ratio has been obtained for the UNS A92024 alloy in the range of lower f values (0.05–0.01 mm/r), in accordance with the results for hc and hv, due to the higher fragility that Cu provides to this alloy. These values slightly decrease when f increases but, practically, a constant trend can be considered. The reasons are similar to those discussed above, for hc and hv. For the UNS A97075 alloy, the segmentation ratio is lower when f changes from 0.05 mm/r to 0.02 mm/r, with a general trend remaining constant. However, the segmentation ratio increases for f = 0.03 mm/r, until it has almost doubled its value. This is due to the lower value of hv at this point, due to the reasons previously exposed.
Therefore, the segmentation ratio shows a trend to remain constant in a wide range of f, for both alloys, so it does not provide excessively relevant information, due to the high ductility of these alloys.
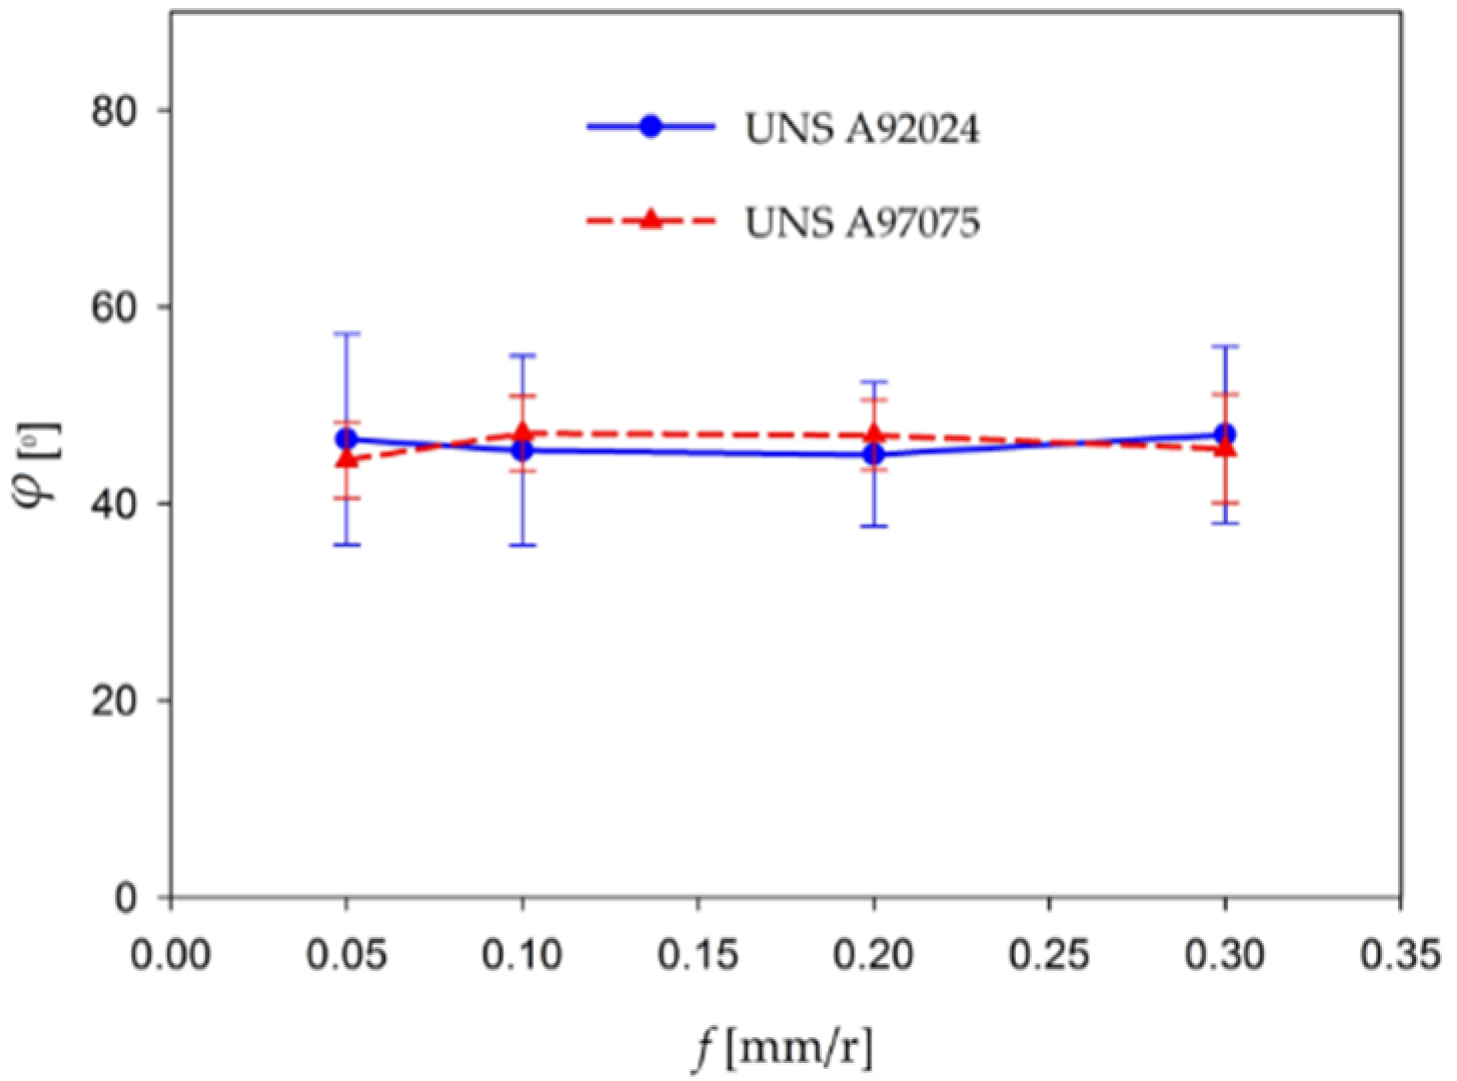
3.3. Shear Angle (ϕ)
Figure 9 shows the evolution of the shear angle’s mean value as a function of feed, for both alloys tested.
The shear angle’s mean value shows a trend to remain almost constant with feed, displaying a value close to 45°. This trend is similar for both alloys. This is a logical trend because the shear angle is mainly influenced by the material’s mechanical properties and tool geometrical configuration, which remain constant in this study. In addition, a higher standard deviation is observed in the experimental results for the UNS A92024 alloy. This fact may be explained by taking into account the fact that the UNS A92024 alloy has shown higher fragmentation than the UNS A97075 alloy, especially in the range of low feed values, so more irregular chips have been obtained. This fact makes the measurement process of the shear angle more difficult, so the dispersion is higher.
As with the others parameters analyzed, no significant changes of ϕ were observed as a function of the axial machining length (L). The mean value variation of hc and hv along L is around 8%, which is within the standard deviation of the measurement process.
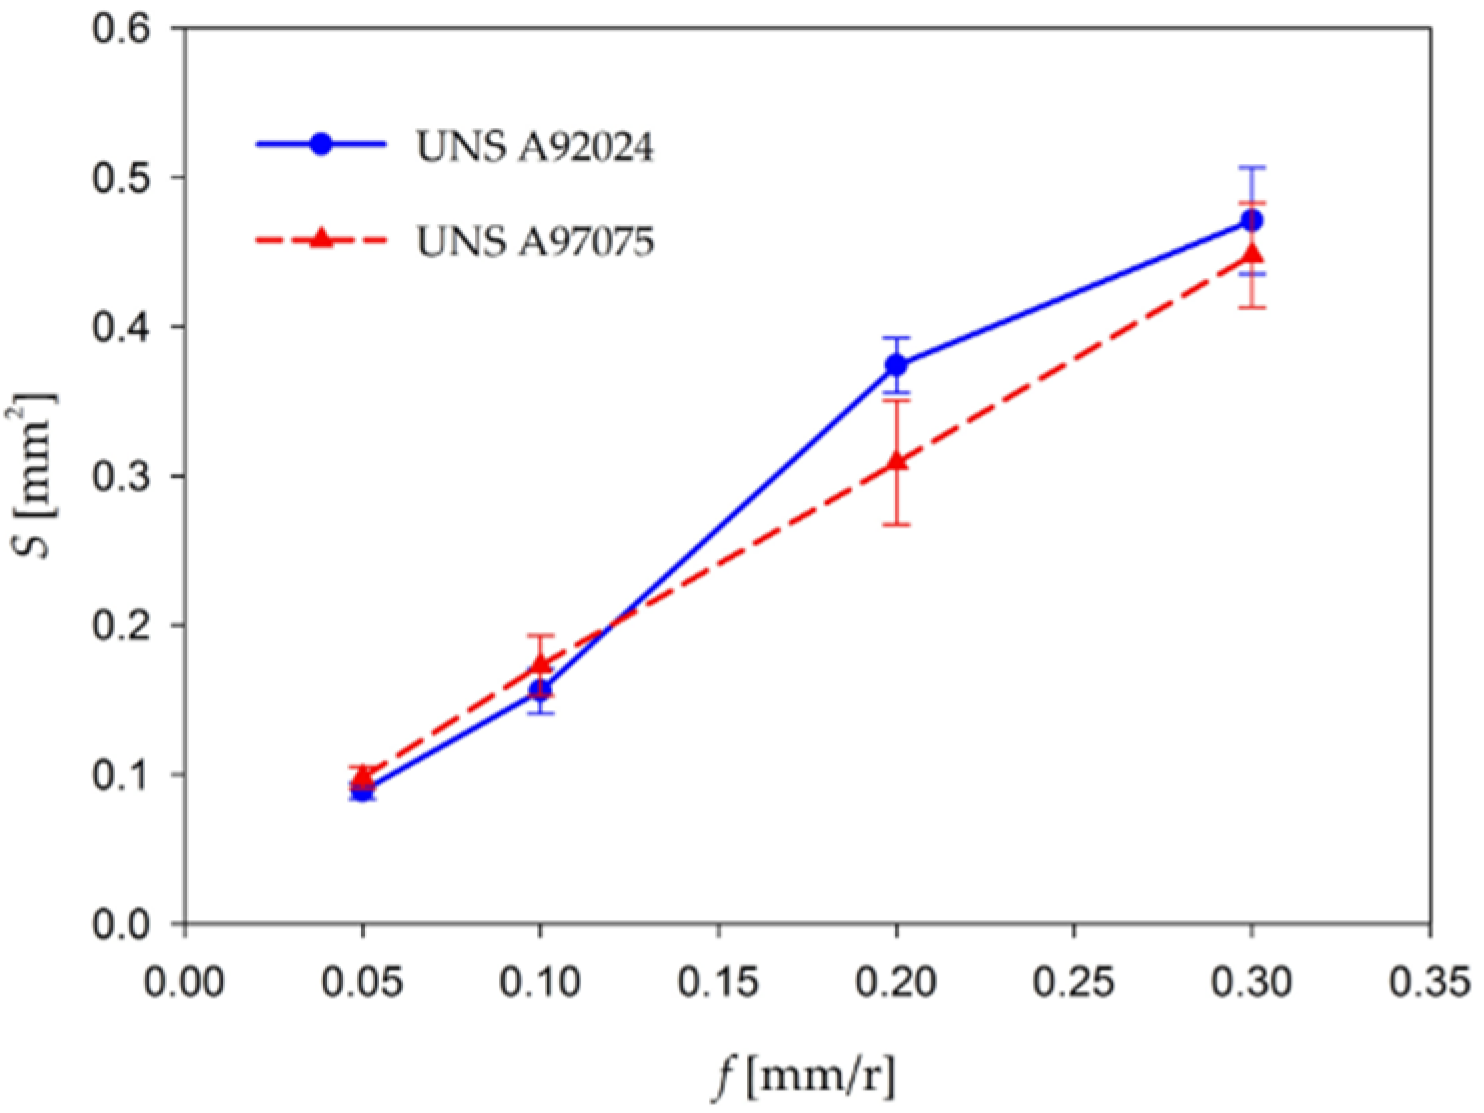
3.4. Chip Cross-Section Area (S) and Chip Width (b)
Figure 10 shows the mean values of
S as a function of
f, for both alloys tested. As it can be observed,
S increases with
f, as expected. The evolution is almost linear with
f, for both alloys. This is logical, taking into account the assumed plane strain hypothesis where
b is considered constant. Assuming this hypothesis,
b can be calculated by Equation (4). So, the obtained theoretical value is
b = 1.13 mm.
This hypothesis is in good agreement with the experimental results for
b, as can be seen in
Figure 11.
The mean value of
b remains almost constant when
f increases, and it is very close to the theoretical value. Only slight changes can be observed for the highest feed values, especially for the UNS A97075 alloy, due to the larger deformation of the chip’s cross-section with higher feed values, as can be seen in
Figure 6. Moreover, the more irregular section makes it more difficult to complete the experimental measurement of
b, which may result in inaccuracies in its values. Finally, no significant changes in
S and
b values were observed along the axial machining length (
L). The mean value variation of
S and
b along
L, is around 11% and 13%, respectively, which is within the standard deviation of the measurement process.
3.5. Shrinkage Factor (ζ)
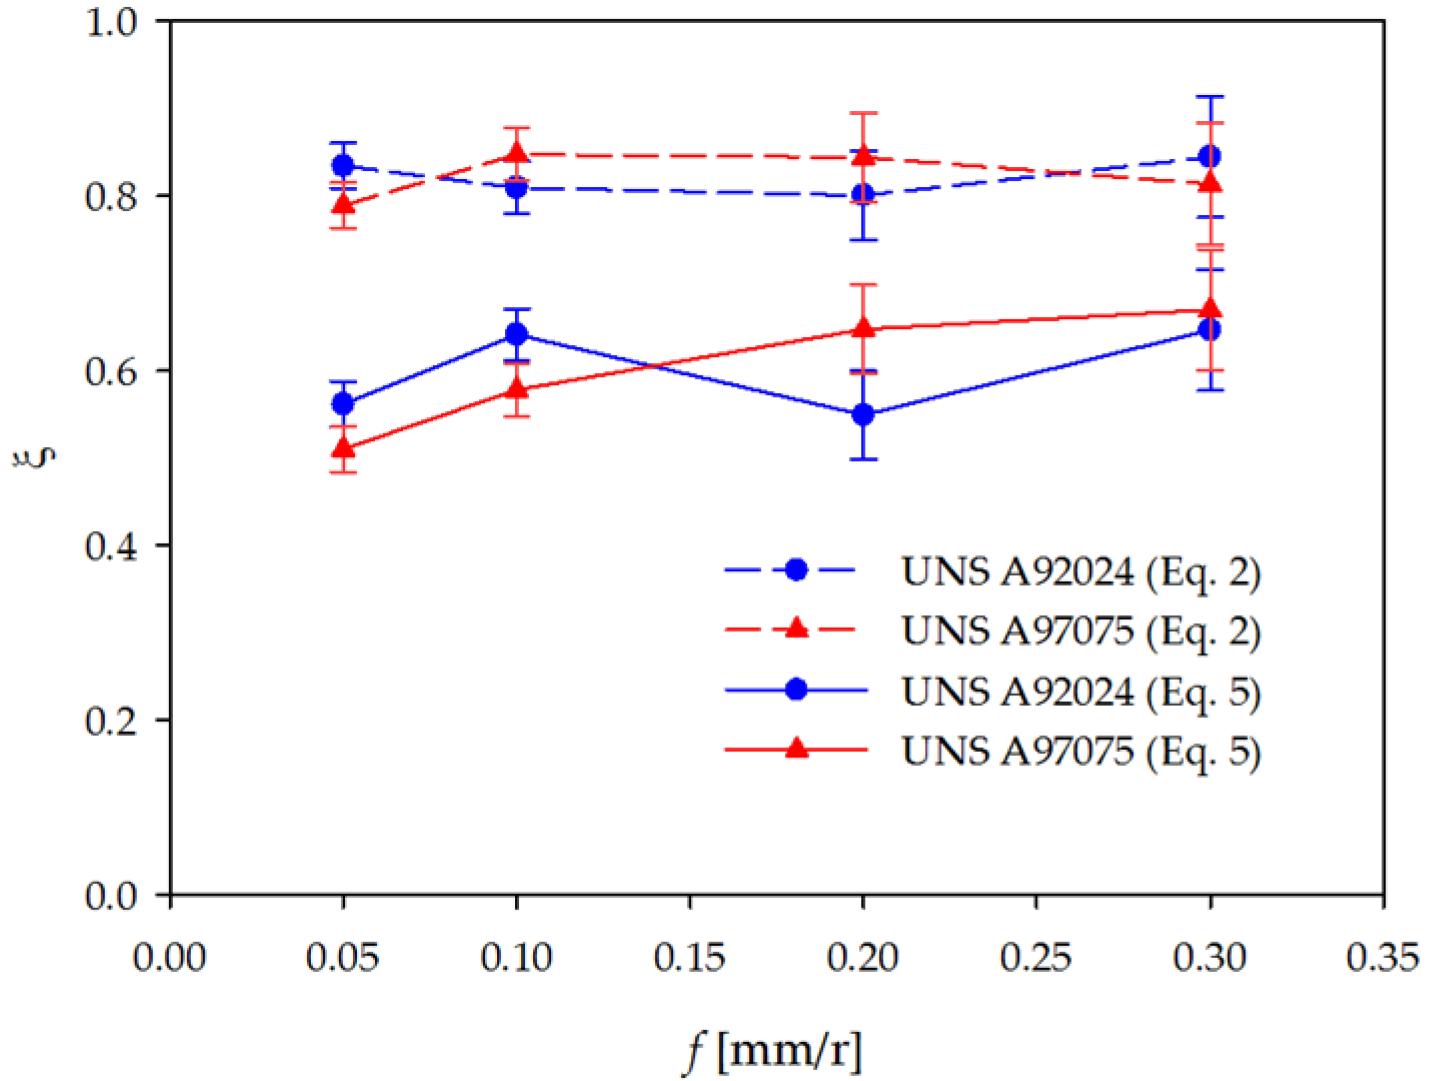
Figure 12 shows the evolution of the mean values of ζ as a function of
f, for each alloy tested. First of all, these values have been calculated by Equation (2), through the experimental measurement of the shear angle (ϕ). As can be observed from this figure, ζ values (calculated via Equation (2)) have the same trend observed for ϕ, as expected. Its value tends to remain constant in terms of
f, at around a value of ζ = 0.8. This behavior is similar in both alloys. Nevertheless, previous studies of these alloys have revealed tool geometry alterations during machining, due to secondary adhesion wear phenomena (Built-Up-Edge, BUE and Built-Up-Layer, BUL), which result in variations of γ [
22,
32,
33]. Because of this, Equation (2) (where γ has been considered constant) is not suitable for calculating ζ in this case.
Because of all of the information mentioned above, the shrinkage factor has been also calculated through the experimental values of the chip’s cross-section area (
S) and the theoretical value of the chip’s cross-section area before machining (
S0, calculated via
f and
ap), Equation (5). The values of
ζ obtained in this way are plotted in
Figure 12.
As it can be observed, ζ values calculated via Equation (5) are lower than those calculated by Equation (2), which means a higher chip strain grade. For both alloys, ζ values fluctuate between 0.55 and 0.65, with a general increasing trend with f. In addition, for the UNS A97075 alloy, the lowest values of ζ are obtained for the lowest f values (0.05 mm/r and 0.1 mm/r), which indicates a higher grade of chip deformation. This grade of deformation becomes lower once the shear limit has been reached (0.2 mm/r and 0.3 mm/r). This fact is less noticeable in the UNS A92024 alloy, due to its lower plasticity.
3.6. Chip Thickness (t)
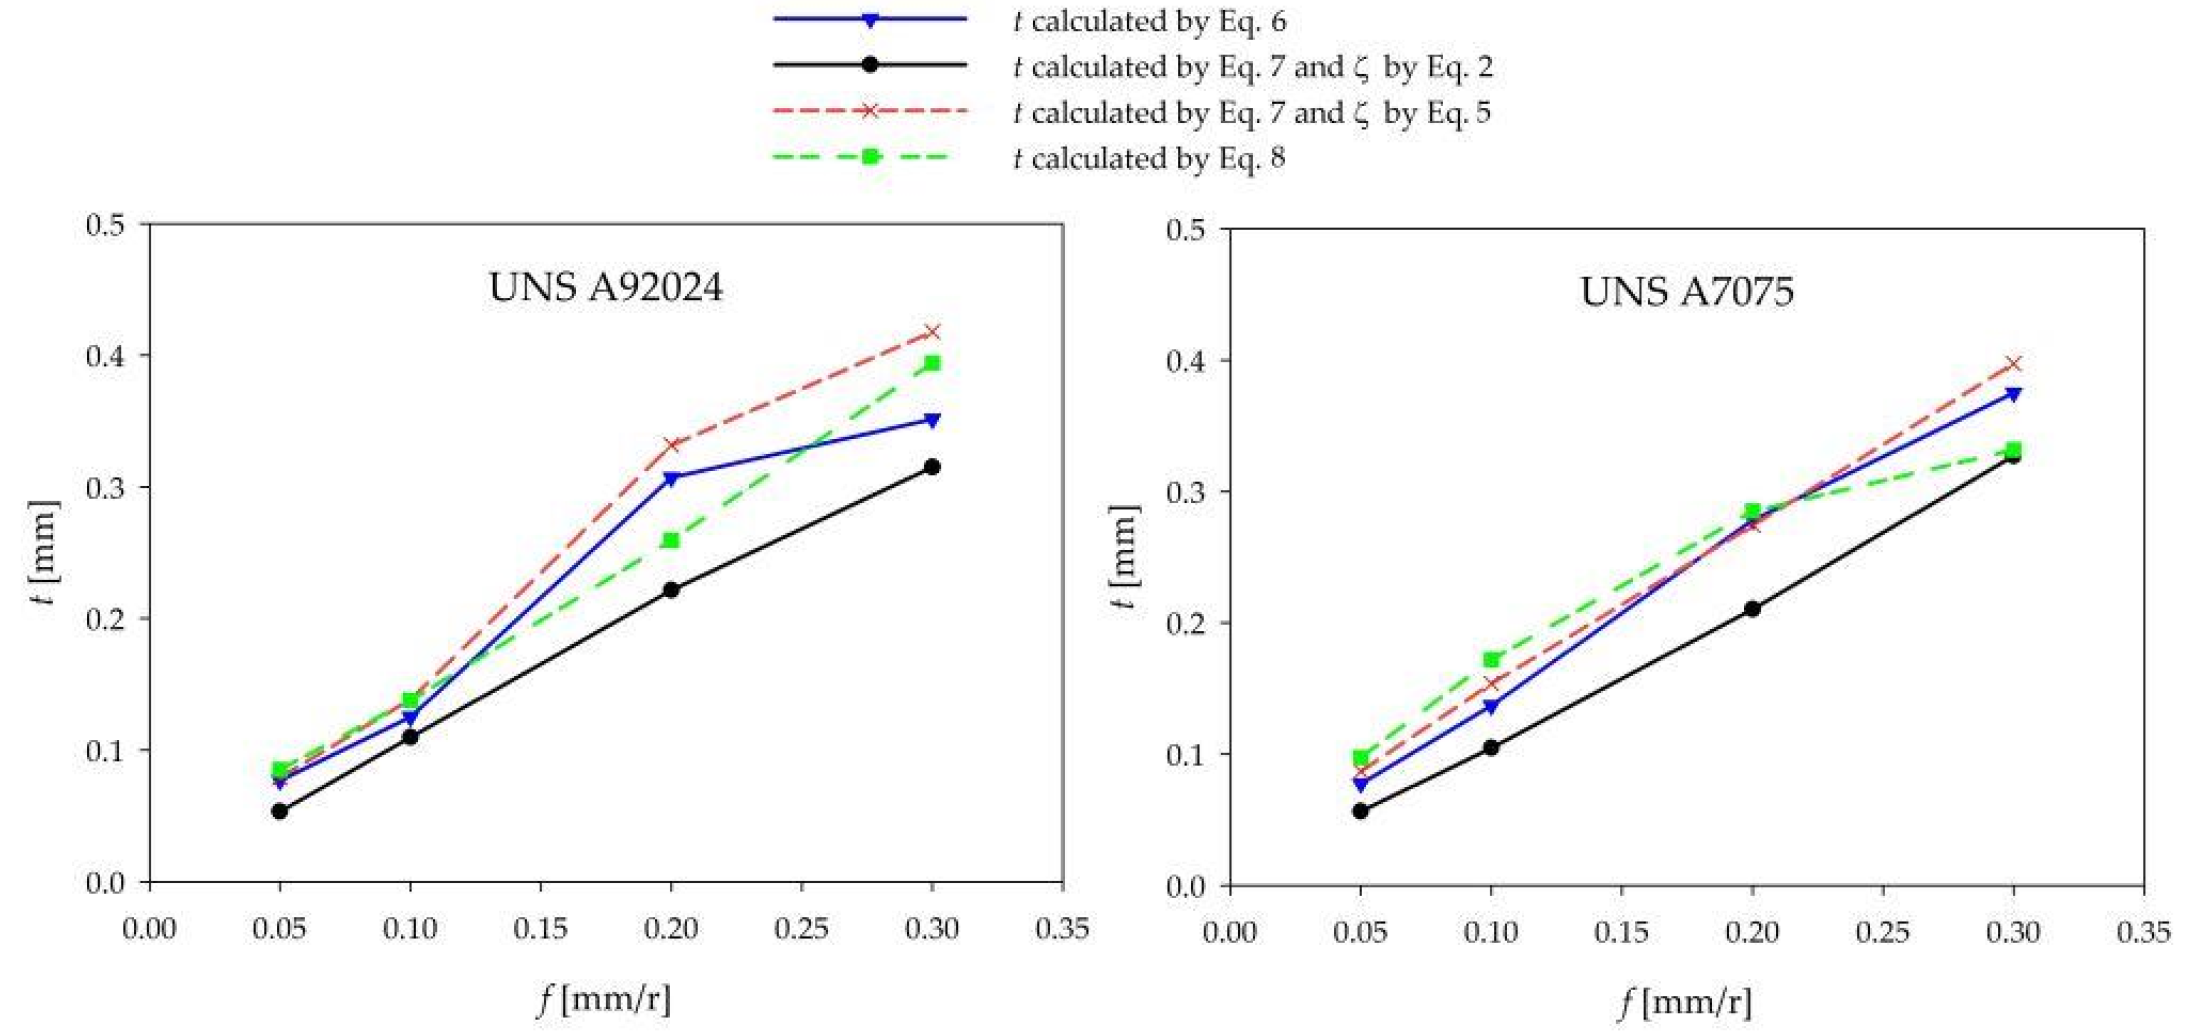
Several methods have been used to evaluate
t as a function of
f. The results are plotted in
Figure 13. First of all,
t values have been calculated through the obtained experimental values of
S and
b, Equation (6). In addition,
t values can be obtained through the theoretical values of chip thickness before machining (
t0) and the experimental values for ζ, Equation (7). Finally, a first approximation of the chip thickness values can be obtained through the experimental measurements of
hc and
hv, Equation (8) [
24].
Obviously, t values show a trend to increase with f, for all of the methods used and for both alloys. The obtained results, when t is evaluated by cross-section experimental parameters (S and b), are very close to those obtained by longitudinal section experimental parameters (hc and hv). However, the results obtained through Equation (7) are further away from this value, when ζ is calculated by Equation (2) (considering constant tool geometry parameters). Thus, this experimental methodology allows the production of more accurate values than analytical methods, due to the necessary simplifications used in these last methods.
For the UNS A97075 alloy, all of the experimental methods used have shown very close results, except for the UNS A92024 alloy, these results are slightly different when the method changes, mainly in the range of higher f. So, in this case, Equation (8) is recommended for calculating t, because the measurement process of hc and hv is less difficult than the measurement of S and b.
3.7. Parametric Relationships
The experimental results above suggest that it is possible to search for relationships which relate the different chip geometric parameters with f. These relationships have been obtained for those variables which have shown a marked dependence on f (hc, hv, S, and t). For this purpose, different models have been tested. Among them, a potential relationship illustrated the best fitting, Equation (9).
In Equation (9),
CGP is the mean value of the chip geometric parameter analyzed (
hc,
hv,
S, or
t), and K and x are constants.
Table 5 provides the results obtained from the fit of this potential relationship, to the experimental data. It should be noted that the experimental values of
t have been obtained by Equation (6).
It can be seen from the data in
Table 5, that the value of the exponent (x) is close to linearity for the UNS A92024 alloy, particularly for
S and
t, whereas its value is lower for UNS A97075, for all parameters analyzed. Therefore, it can be deduced that the chip geometric parameters analyzed have shown a slightly lower dependence on feed for the UNS A97075 alloy than the UNS A92024 alloy. These results are consistent with all of the observations previously mentioned.
The potential proposed relationships have shown a good fit for all of the parameters analyzed (R2 ≥ 0.9). Notwithstanding, it should be pointed out that these potential relationships have been obtained from the mean values of each geometric parameter, so only show their general trend. Standard deviations reach values around 25%–30% in some cases (e.g., for hc and hv), so R2 is far lower, and its value is not representative of the process dispersion.
4. Conclusions
In this work, an analysis influence of the cutting parameters on chip morphology and geometry, during the dry machining of UNS A97075 (Al-Zn) and UNS A92024 (Al-Cu) alloys, has been carried out. Different geometric parameters of the chip have been measured, and their evolution with the feed and the axial machining length has been analysed.
For both alloys, a continuous chip was obtained in the range of lower feed, with a tendency to form chip nests, whereas a segmented and shorter chip was obtained in the range of higher feed.
Among the different chip geometric parameters analysed, the height of peaks (hc), height of valleys (hv), cross-section area (S), and thickness (t) have shown a trend to increase with feed. This fact was less noticeable for the UNS A97075 alloy due to its higher plasticity and greater capacity to withstand deformations before breaking. On the other hand, the shear angle (ϕ) and chip width (b) have shown a trend to remain almost constant with feed, for both alloys tested.
Regarding the shrinkage factor (ζ), its values were calculated by several methods. On the one hand, its values were calculated by using the shear angle (ϕ) experimental values and the tool geometry parameters (considering constant the parameters of the tool setup). On the other hand, they were calculated through the cross-section area (S) experimental values.
The experimental results have revealed that the evaluation of ζ by the first method is not suitable, due to alterations of the tool geometry during machining, which are caused by secondary adhesion wear. The results obtained by the second method have shown that ζ increases with feed. In addition, the lowest values of feed resulted in a lower value of ζ, so higher deformation grade was obtained. Once the shear limit has been reached (higher feed), this grade of deformation becomes lower. This fact was less apparent for the UNS A92024 alloy, due to reasons which are similar to those exposed above.
No significant changes were observed in the parameters analysed as a function of axial machining length (L). Finally, different relationships have been obtained, which allow the prediction of the evolution of some of the geometric parameters of the chip, as a function of feed values. It should be pointed out that the results are valid within the range of tested cutting parameters.


 ,
, 


