Composition Distribution, Damping and Thermal Properties of the Thickness-Continuous Gradient Epoxy/Polyurethane Interpenetrating Polymer Networks

Abstract
:
1. Introduction
2. Materials and Methods
2.1. Materials
2.2. Preparation of Samples
2.3. Measurement
3. Results and Discussion
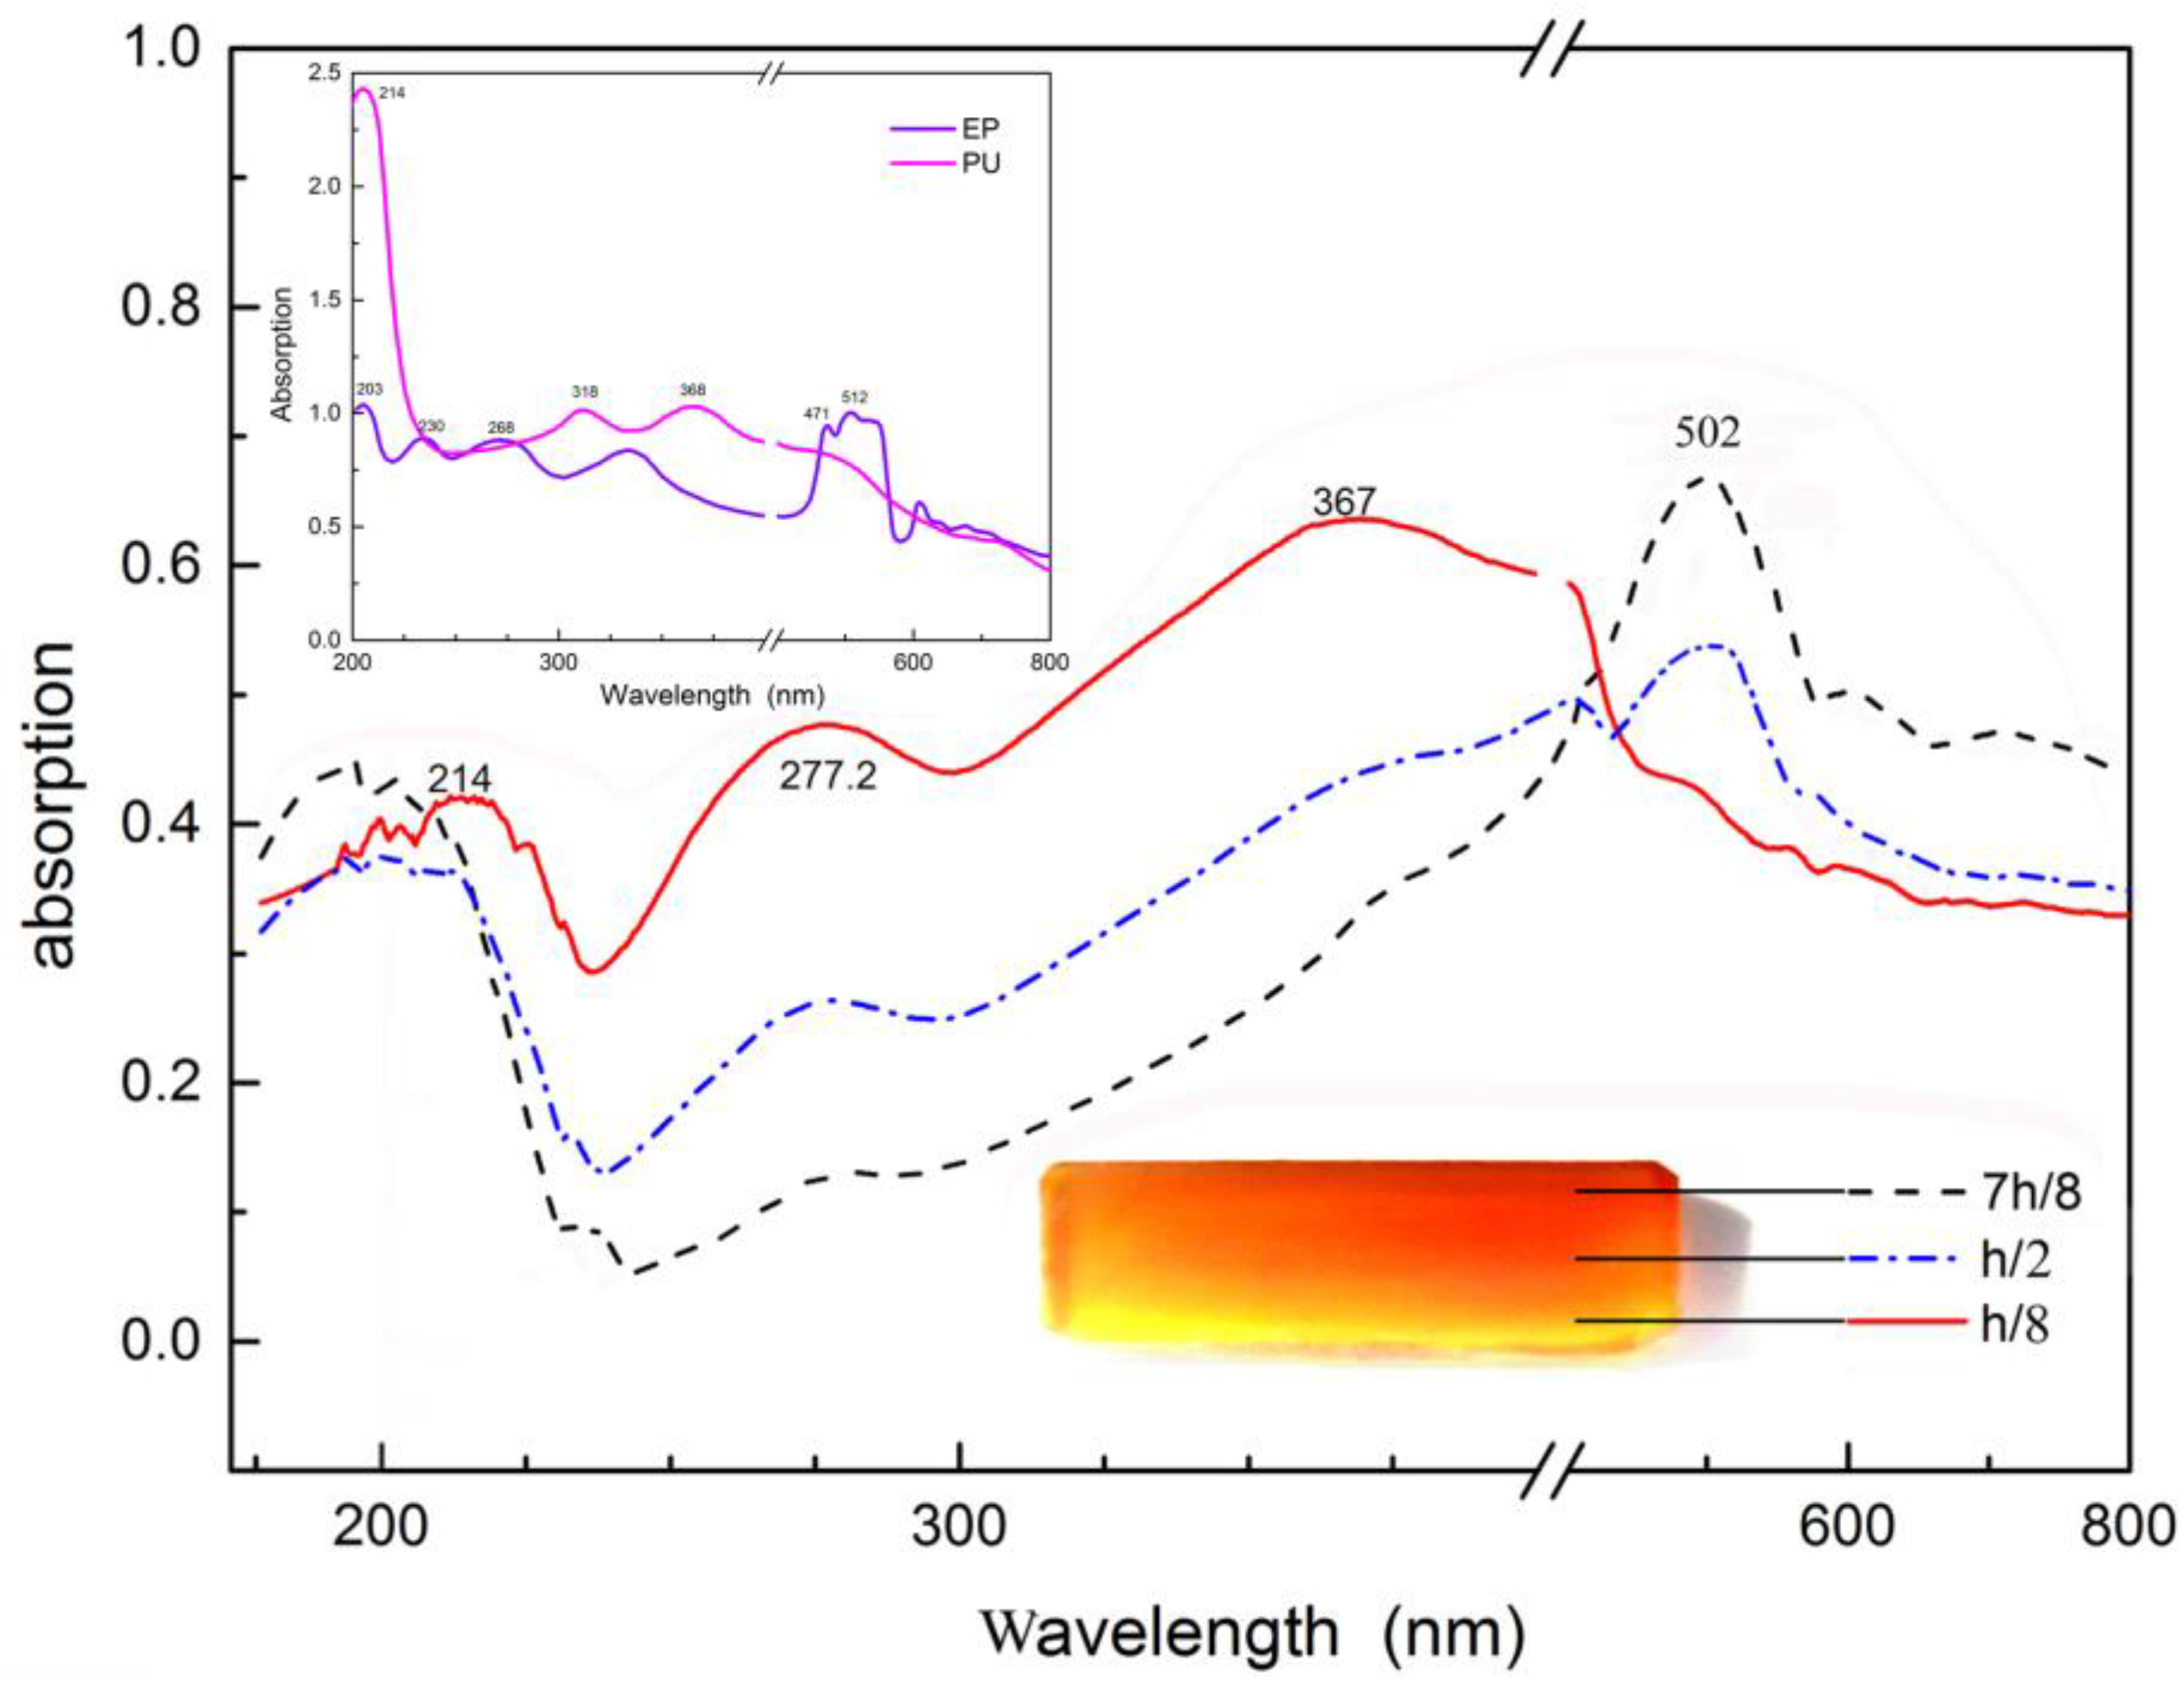
3.1. UV-Vis Absorption
3.2. Contact Angles
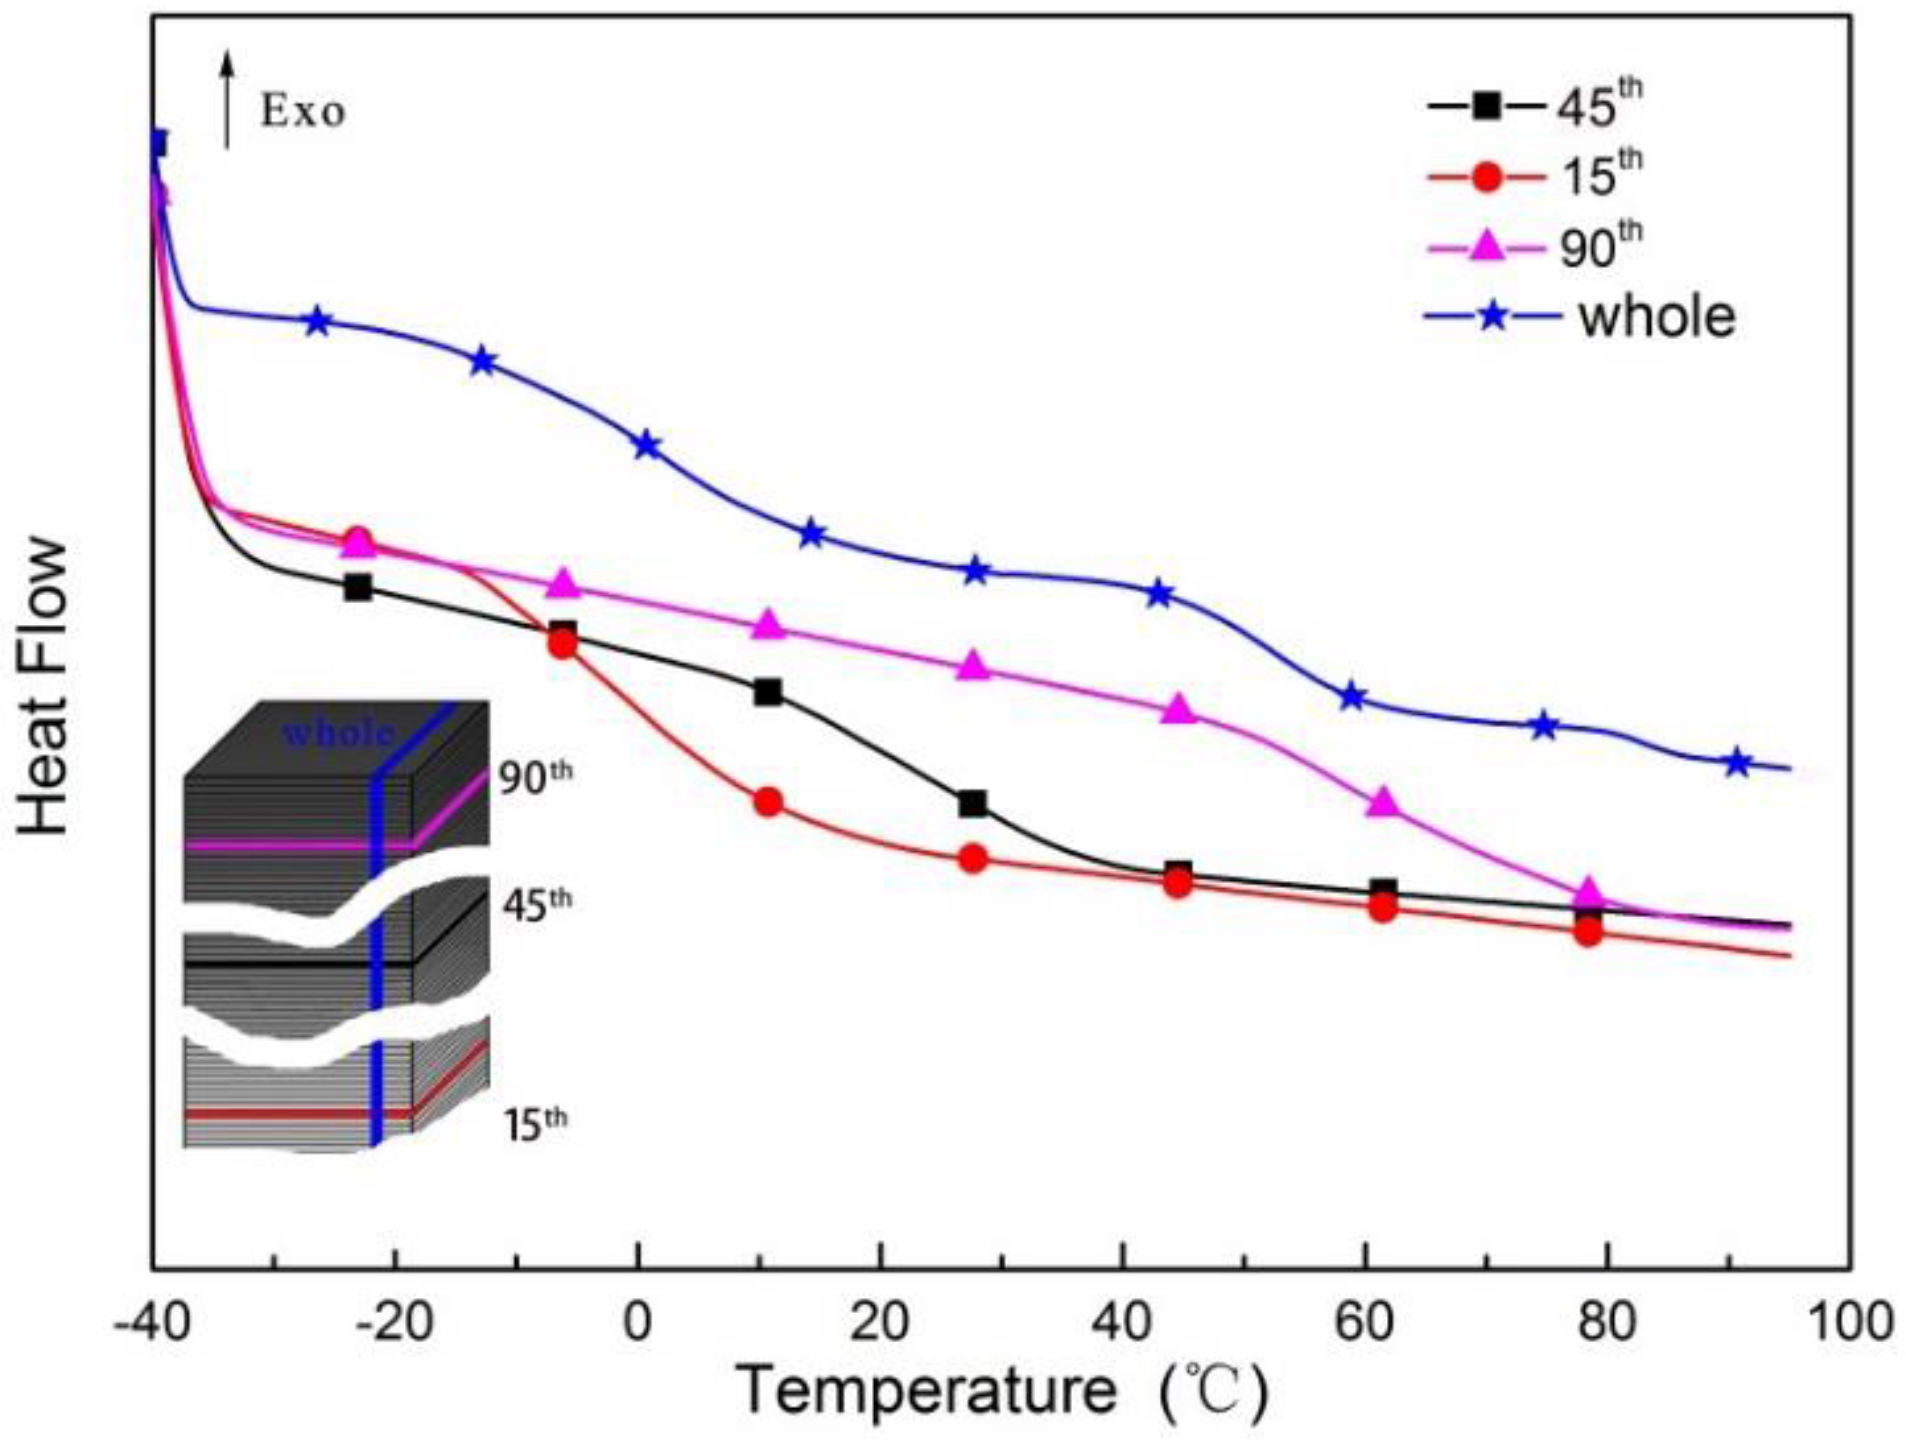
3.3. DSC Analysis
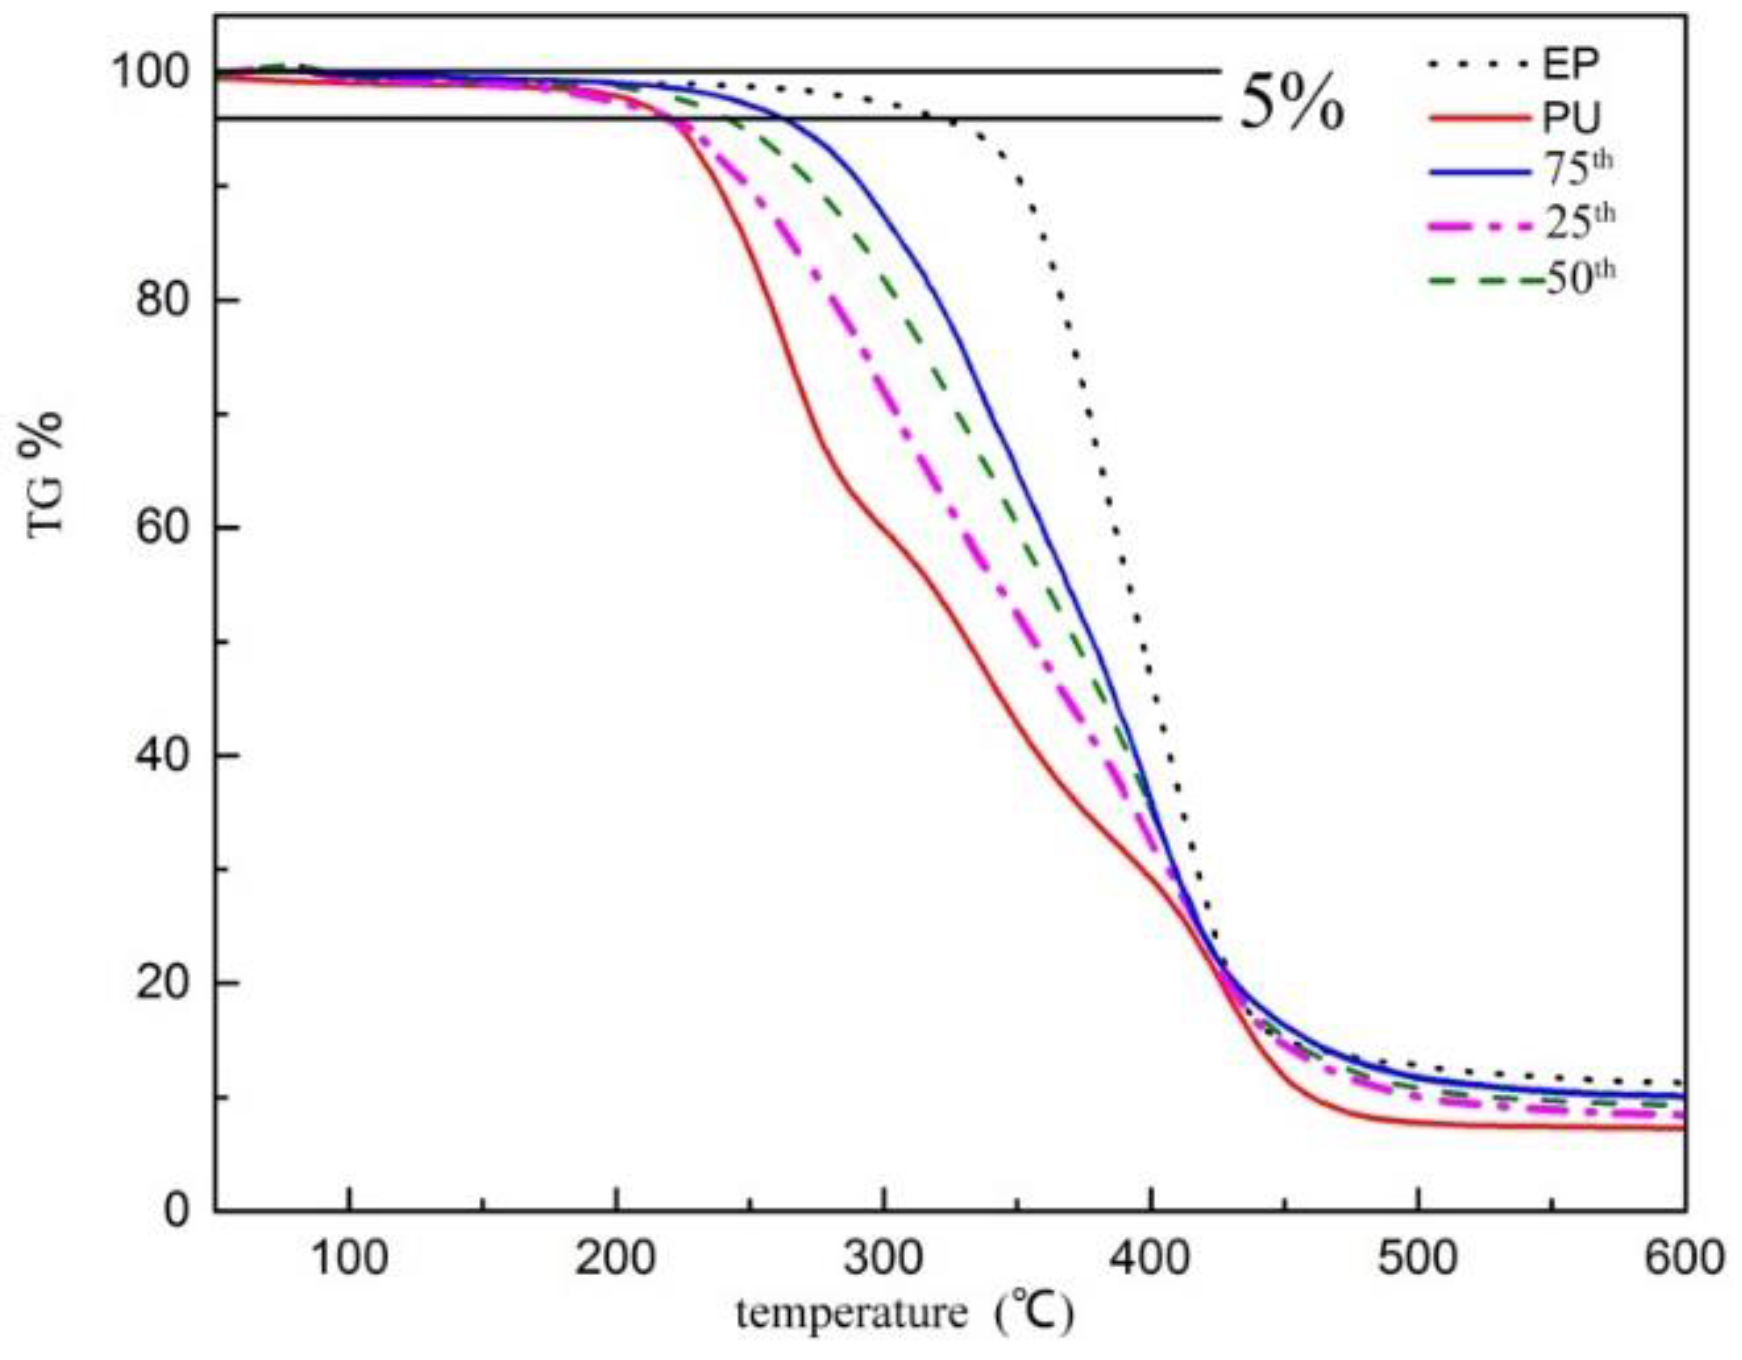
3.4. TG Analysis
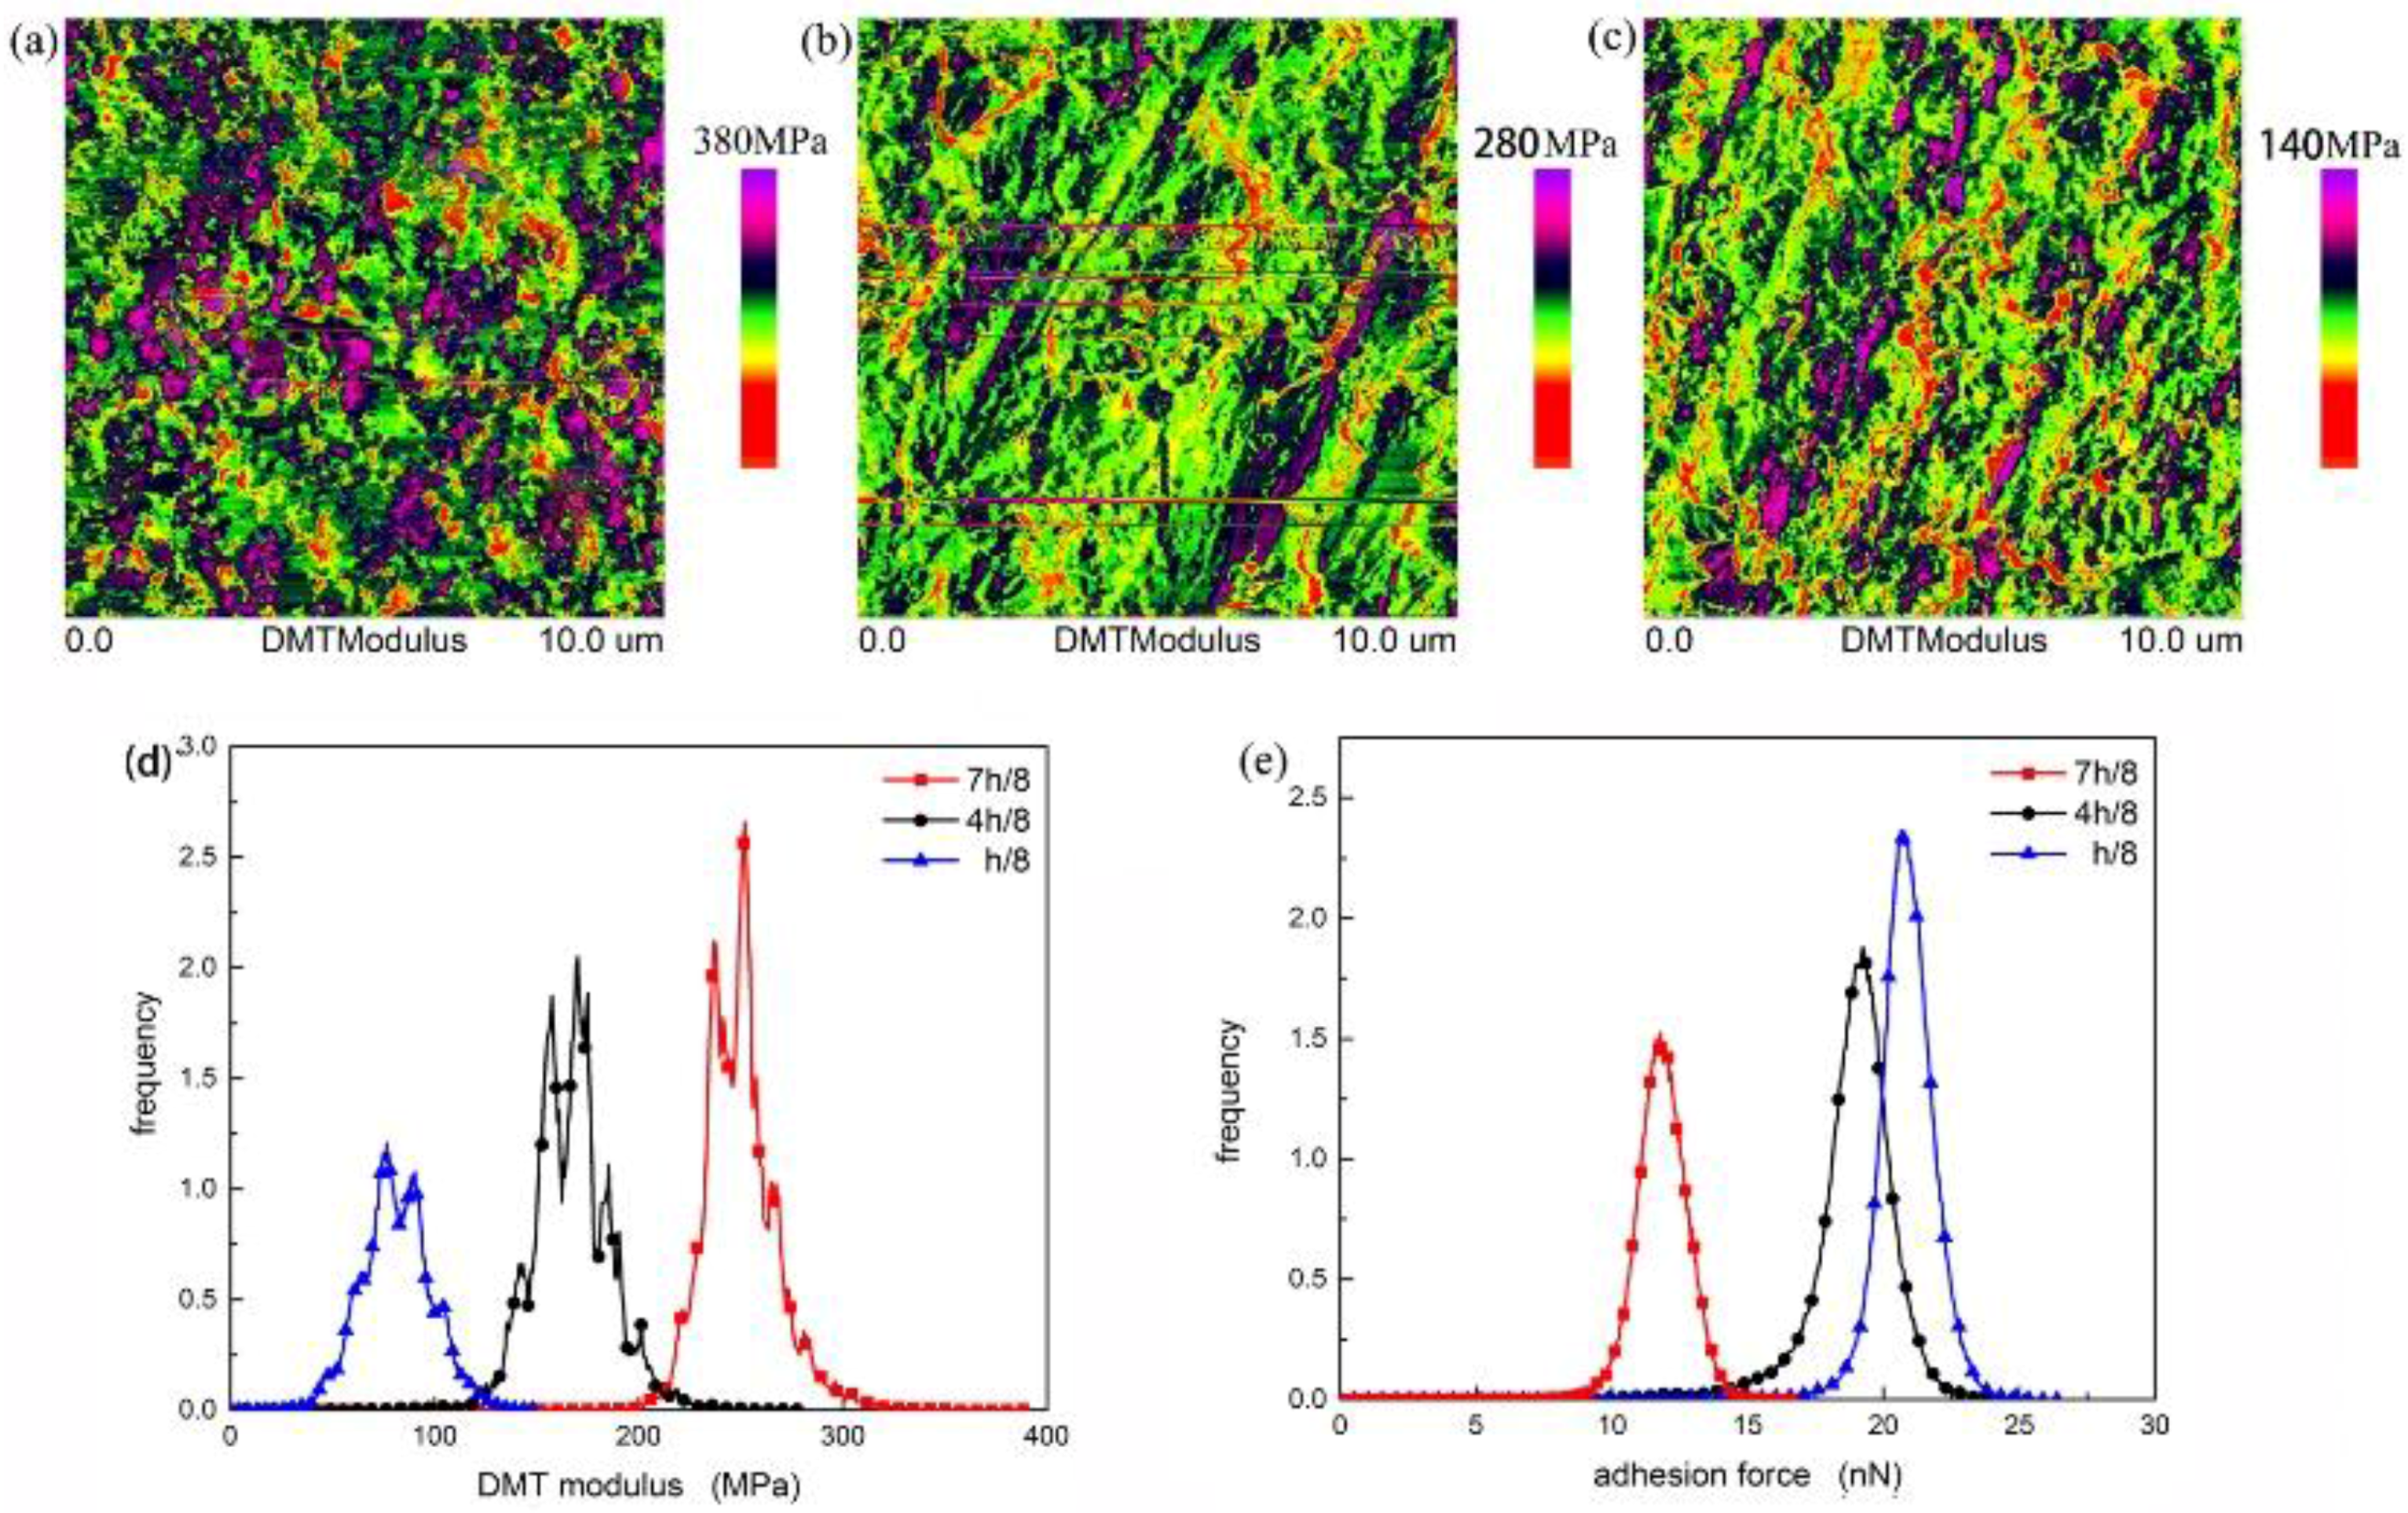
3.5. AFM Analysis
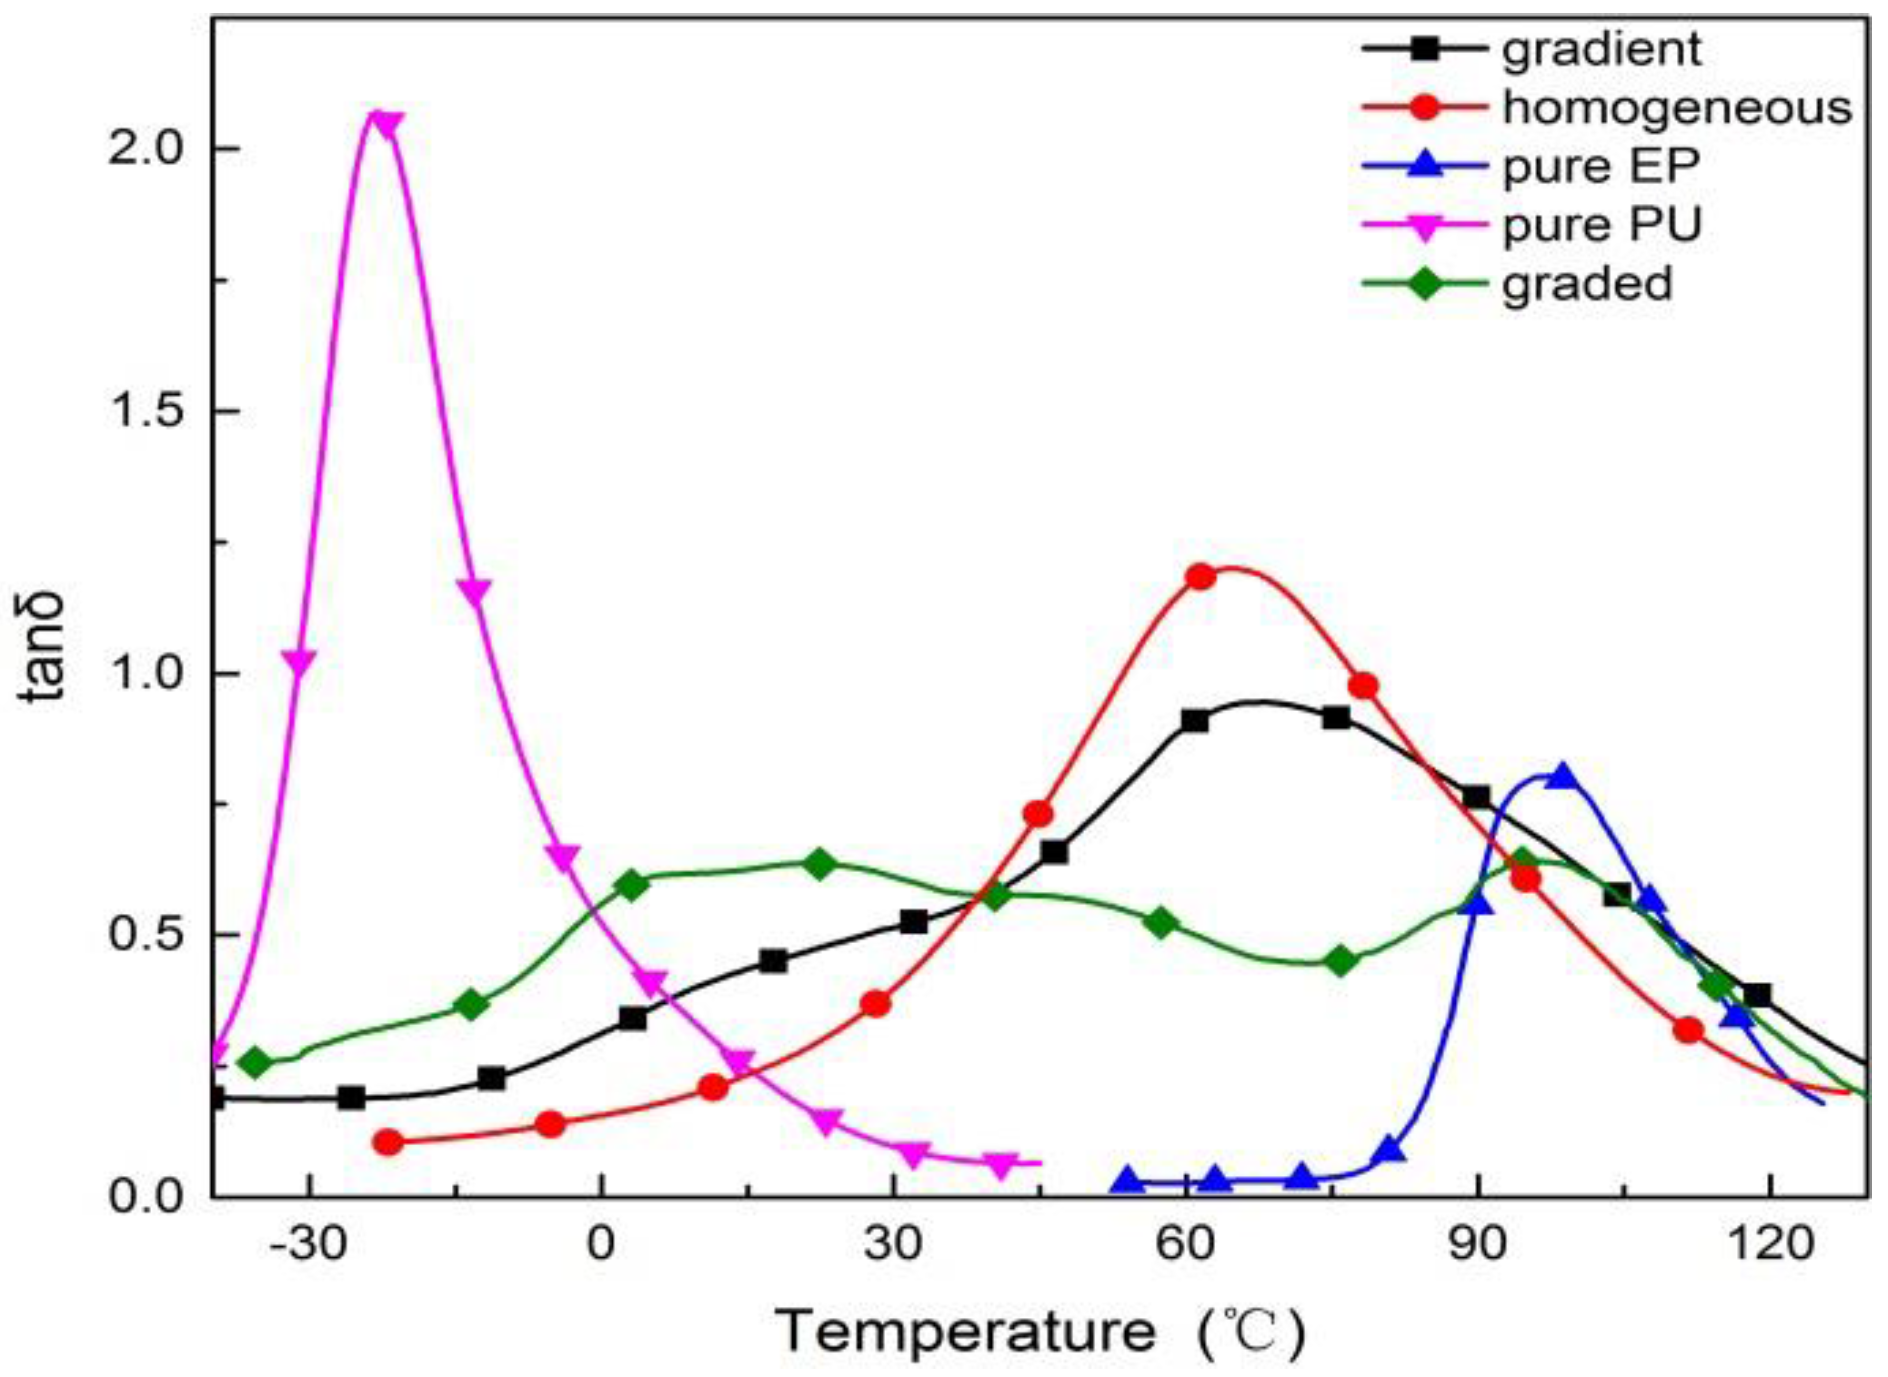
3.6. DMA Analysis
4. Conclusions
Supplementary Materials
Acknowledgments
Author Contributions
Conflicts of Interest
References
- Tian, S.; Cui, F.; Wang, X. New type of piezo-damping epoxy-matrix composites with multi-walled carbon nanotubes and lead zirconate titanate. Mater. Lett. 2008, 62, 3859–3861. [Google Scholar] [CrossRef]
- Gusev, A.A.; Feldman, K.; Guseva, O. Using Elastomers and Rubbers for Heat-Conduction Damping of Sound and Vibrations. Macromolecules 2010, 43, 2638–2641. [Google Scholar] [CrossRef]
- Li, G.; Ma, Y.; He, X.; Li, W.; Li, P. Damping capacity of high strength-damping aluminum alloys prepared by rapid solidification and powder metallurgy process. Tans. Nonferr. Metals Soc. China 2012, 22, 1112–1117. [Google Scholar] [CrossRef]
- Zahedi, F.; Amraei, I.A.; Fathizade, M.A. Investigation of dynamic-mechanical properties of multilayer latex IPNs (MLIPNs) with core/shell morphology: Synthesis and characterization. Polymer 2016, 83, 162–171. [Google Scholar] [CrossRef]
- Recho, P.; Ranft, J.; Marcq, P. One-dimensional collective migration of a proliferating cell monolayer. Soft Matter 2016, 12, 2381–2391. [Google Scholar] [CrossRef] [PubMed]
- Qin, C.L.; Zhao, D.Y.; Bai, X.D.; Zhang, X.G.; Zhang, B.; Jin, Z.; Niu, H.J. Vibration damping properties of gradient polyurethane/vinyl ester resin interpenetrating polymer network. Mater. Chem. Phys. 2006, 97, 517–524. [Google Scholar] [CrossRef]
- Song, M.; Zhao, X.; Li, Y.; Hu, S.; Zhang, L.; Wu, S. Molecular dynamics simulations and microscopic analysis of the damping performance of hindered phenol AO-60_nitrile-butadiene rubber composites. RSC Adv. 2014, 4, 6719–6729. [Google Scholar] [CrossRef]
- Senake Perera, M.C.; Ishiaku, U.S.; Mohd Ishak, Z.A. Characterisation of PVC/NBR and PVC/ENR50 binary blends and PVC/ENR50/NBR ternary blends by DMA and solid state NMR. Eur. Polym. J. 2001, 37, 167–178. [Google Scholar] [CrossRef]
- Lin, C.; Kuo, S.; Huang, C.; Chang, F. Glass transition temperature enhancement of PMMA through copolymerization with PMAAM and PTCM mediated by hydrogen bonding. Polymer 2010, 51, 883–889. [Google Scholar] [CrossRef]
- Ungar, E.E. Loss Factors of Viscoelastically Damped Beam Structures. J. Acoust. Soc. Am. 1962, 34, 1082–1089. [Google Scholar] [CrossRef]
- Knapp, G.; Oreski, G.; Pinter, G. Method to characterize the damping behavior of thin passively constrained layer laminates using dynamic mechanical analysis (DMA) in shear mode. Polym. Test. 2015, 42, 215–224. [Google Scholar] [CrossRef]
- Rao, M.D. Recent applications of viscoelastic damping for noise control in automobiles and commercial airplanes. J. Sound Vib. 2003, 262, 457–474. [Google Scholar] [CrossRef]
- Lee, W.; Han, S.; Park, W. A refined higher order shear and normal deformation theory for E-, P-, and S-FGM plates on Pasternak elastic foundation. Compos. Struct. 2015, 122, 330–342. [Google Scholar] [CrossRef]
- Pradhan, K.K.; Chakraverty, S. Static analysis of functionally graded thin rectangular plates with various boundary supports. Arch. Civ. Mech. Eng. 2015, 15, 721–734. [Google Scholar] [CrossRef]
- Koizumi, M. FGM activities in Japan. Compos. Part B Eng. 1997, 28, 1–4. [Google Scholar] [CrossRef]
- Dubey, A.K.; Kakimoto, K.; Obata, A.; Kasuga, T. Enhanced polarization of hydroxyapatite using the design concept of functionally graded materials with sodium potassium niobate. RSC Adv. 2014, 4, 24601–24611. [Google Scholar] [CrossRef]
- Lambros, J.; Santare, M.H.; Li, H.; Sapna, G.H., III. A Novel Technique for the Fabrication of Laboratory Scale Model Functionally Graded Materials. Exp. Mech. 1999, 3, 184–190. [Google Scholar] [CrossRef]
- Tang, Z.; Wang, Y.; Podsiadlo, P.; Kotov, N.A. Biomedical Applications of Layer-by-Layer Assembly: From Biomimetics to Tissue Engineering. Adv. Mater. 2006, 18, 3203–3224. [Google Scholar] [CrossRef]
- De Villiers, M.M.; Otto, D.P.; Strydom, S.J.; Lvov, Y.M. Introduction to nanocoatings produced by layer-by-layer (LbL) self-assembly. Adv. Drug Deliv. Rev. 2011, 63, 701–715. [Google Scholar] [CrossRef] [PubMed]
- Lin-Gibson, S.; Landis, F.A.; Drzal, P.L. Combinatorial investigation of the structure-properties characterization of photopolymerized dimethacrylate networks. Biomaterials 2006, 27, 1711–1717. [Google Scholar] [CrossRef] [PubMed]
- Crowe-Willoughby, J.A.; Weiger, K.L.; Özçam, A.E.; Genzer, J. Formation of silicone elastomer networks films with gradients in modulus. Polymer 2010, 51, 763–773. [Google Scholar] [CrossRef]
- Kloxin, A.M.; Benton, J.A.; Anseth, K.S. In situ elasticity modulation with dynamic substrates to direct cell phenotype. Biomaterials 2010, 31, 1–8. [Google Scholar] [CrossRef] [PubMed]
- Zaari, N.; Rajagopalan, P.; Kim, S.K.; Engler, A.J.; Wong, J.Y. Photopolymerization in Microfluidic Gradient Generators: Microscale Control of Substrate Compliance to Manipulate Cell Response. Adv. Mater. 2004, 16, 2133–2137. [Google Scholar] [CrossRef]
- Honma, T.; Zhao, L.; Asakawa, N.; Inoue, Y. Poly(ε-Caprolactone)/Chitin and Poly(ε-Caprolactone)/Chitosan Blend Films With Compositional Gradients: Fabrication and Their Biodegradability. Macromol. Biosci. 2006, 6, 241–249. [Google Scholar] [CrossRef] [PubMed]
- Förster, N.; Pöppler, A.; Stalke, D.; Vana, P. Photocrosslinkable Star Polymers via RAFT-Copolymerizations with N-Ethylacrylate-3,4-dimethylmaleimide. Polymers 2013, 5, 706–729. [Google Scholar] [CrossRef]
- Lai, E.; Wang, Y.; Wei, Y.; Li, G. Preparation of Uniform-Sized and Dual Stimuli-Responsive Microspheres of Poly(N-Isopropylacrylamide)/Poly(Acrylic acid) with Semi-IPN Structure by One-Step Method. Polymers 2016, 8, 90. [Google Scholar] [CrossRef]
- Suresh, S. Graded materials for resistance to contact deformation and damage. Science 2001, 292, 2447–2451. [Google Scholar] [CrossRef] [PubMed]
- Lipatov, Y.S.; Karbanova, L.V. Review: Gradient interpenetrating polymer networks. J. Appl. Sci. 1995, 30, 2475–2484. [Google Scholar]
- Liu, B.L.; Wang, J.B.; Zhong, X.L.; Huang, K.; Li, B.; Wang, F.; Xie, J.; Zhou, Y.C. Enhanced electrocaloric effect in a Ba(1−x)SrxTiO3 compositionally graded film. RSC Adv. 2014, 4, 24533–24537. [Google Scholar] [CrossRef]
- Lin, Y.; Minner, D.; Herring, V.; Naumann, C. Physisorbed Polymer-Tethered Lipid Bilayer with Lipopolymer Gradient. Materials 2012, 5, 2243–2257. [Google Scholar] [CrossRef]
- Carr, L.R.; Krause, J.E.; Ella-Menye, J.; Jiang, S. Single nonfouling hydrogels with mechanical and chemical functionality gradients. Biomaterials 2011, 32, 8456–8461. [Google Scholar] [CrossRef] [PubMed]
- Thomopoulos, S.; Williams, G.R.; Gimbel, J.A.; Favata, M.; Soslowsky, L.J. Variation of biomechanical, structural, and compositional properties along the tendon to bone insertion site. J. Orthop. Res. 2003, 21, 413–419. [Google Scholar] [CrossRef]
- Miserez, A.; Schneberk, T.; Sun, C.J.; Zok, F.W.; Waite, J.H. The transition from stiff to compliant materials in squid beaks. Science 2008, 319, 1816–1819. [Google Scholar] [CrossRef] [PubMed]
- Coyne, K.J.; Waite, J.H. In search of molecular dovetails in mussel byssus: From the threads to the stem. J. Exp. Biol. 2000, 203, 1425–1431. [Google Scholar] [PubMed]
- Moeser, G.M. Seasonal variation in mussel byssal thread mechanics. J. Exp. Biol. 2006, 209, 1996–2003. [Google Scholar] [CrossRef] [PubMed]
- Claussen, K.U.; Scheibel, T.; Schmidt, H.; Giesa, R. Polymer Gradient Materials: Can Nature Teach Us New Tricks? Macromol. Mater. Eng. 2012, 297, 938–957. [Google Scholar] [CrossRef]
- Tamarin, A.; Lewis, P.; Askey, J. The structure and formation of the byssus attachment plaque in Mytilus. J. Morphol. 1976, 149, 199–221. [Google Scholar] [CrossRef] [PubMed]
- Lv, X.; Huang, Z.; Huang, C.; Shi, M.; Gao, G.; Gao, Q. Damping properties and the morphology analysis of the polyurethane/epoxy continuous gradient IPN materials. Compos. Part B Eng. 2016, 88, 139–149. [Google Scholar] [CrossRef]
- Workman, J., Jr. The Handbook of Organic Compounds, Three-Volume Set: NIR, IR, R, and UV-Vis Spectra Featuring Polymers and Surfactants; Academic Press: Cambridge, MA, USA, 2000; Volume 2016, p. 1493. [Google Scholar]
- Sojka, Z.; Bozon-Verduraz, F.; Che, M. UV–Vis–NIR and EPR Spectroscopies; Wiley-VCH Verlag GmbH & Co. KGaA: Weinheim, Germany, 2008. [Google Scholar]
- Llewellyn, E.J.; Lloyd, N.D.; Degenstein, D.A.; Gattinger, R.L.; Petelina, S.V.; Bourassa, A.E.; Wiensz, J.T.; Ivanov, E.V.; McDade, I.C.; Solheim, B.H.; et al. The OSIRIS instrument on the Odin spacecraft. Can. J. Phys. 2004, 82, 411–422. [Google Scholar] [CrossRef]
- Owens, D.K.; Wendt, R.C. Estimation of the surface free energy of polymers. Appl. Polym. Sci. 1969, 8, 1741–1747. [Google Scholar] [CrossRef]
- Meiron, T.S.; Marmur, A.; Saguy, I.S. Contact angle measurement on rough surfaces. J. Colloid Interface Sci. 2004, 274, 637–644. [Google Scholar] [CrossRef] [PubMed]
- Packham, D.E. Surface energy, surface topography and adhesion. Int. J. Adhes. Adhes. 2003, 23, 437–448. [Google Scholar] [CrossRef] [Green Version]
- Mattozzi, A.; Hedenqvist, M.S.; Gedde, U.W. Diffusivity of n-hexane in poly(ethylene-stat-octene)s assessed by molecular dynamics simulation. Polymer 2007, 48, 5174–5180. [Google Scholar] [CrossRef]
- Bergman, J.A.; Cochran, E.W.; Heinen, J.M. Role of the segment distribution in the microphase separation of acrylic diblock and triblock terpolymers. Polymer 2014, 55, 4206–4215. [Google Scholar] [CrossRef]
- Wang, Q.; Chen, S.; Wang, T.; Zhang, X. Damping, thermal, and mechanical properties of polyurethane based on poly(tetramethylene glycol)/epoxy interpenetrating polymer networks: Effects of composition and isocyanate index. Appl. Phys. A 2011, 104, 375–382. [Google Scholar] [CrossRef]
- Gao, G.; Zhang, M.; Lu, P.; Guo, G.; Wang, D.; Sun, T. Chirality-assisted ring-like aggregation of Aβ(1–40) at liquid–solid interfaces: A stereoselective two-step assembly process. Angew. Chem. Int. Ed. 2015, 54, 2245–2250. [Google Scholar] [CrossRef] [PubMed]
- Xu, K.; Zhang, F.; Zhang, X.; Guo, J.; Wu, H.; Guo, S. Molecular insights into the damping mechanism of poly(vinyl acetate)/hindered phenol hybrids by a combination of experiment and molecular dynamics simulation. RSC Adv. 2015, 5, 4200–4209. [Google Scholar] [CrossRef]
- Wang, P.Y.; Clements, L.R.; Thissen, H.; Tsai, W.B.; Voelcker, N.H. Screening rat mesenchymal stem cell attachment and differentiation on surface chemistries using plasma polymer gradients. Acta Biomater. 2015, 11, 58–67. [Google Scholar] [CrossRef] [PubMed]
- Sperling, L.H.; Frideman, D.W. Synthesis and mechanical behavior of interpenetrating polymer network. J. Appl. Polym. Sci. 1969, 7, 425–427. [Google Scholar]
- Zhao, X.; Xiang, P.; Tian, M.; Fong, H.; Jin, R.; Zhang, L. Nitrile butadiene rubber/hindered phenol nanocomposites with improved strength and high damping performance. Polymer 2007, 48, 6056–6063. [Google Scholar] [CrossRef]
- Peter, C.; Kremer, K. Multiscale simulation of soft matter systems—From the atomistic to the coarse-grained level and back. Soft Matter 2009, 5, 4357. [Google Scholar] [CrossRef]
- Sorathia, U.; Yeager, W.; Dapp, T. Advanced Damping Materials for Marine Applications. In Sound and Vibration Damping with Polymers; American Chemical Society: Washington, DC, USA, 1990; pp. 382–396. [Google Scholar]
- Wu, C.; Yamagishi, T.; Nakamoto, Y.; Ishida, S.; Nitta, K.; Kubota, S. Organic hybrid of chlorinated polyethylene and hindered phenol. I. Dynamic mechanical properties. J. Polym. Sci. Part B Polym. Phys. 2000, 38, 2285–2295. [Google Scholar] [CrossRef]
- Wu, P.; Yang, Y.; Siesler, H.W. Two-dimensional near-infrared correlation temperature studies of an amorphous polyamide. Polymer 2001, 42, 10181–10186. [Google Scholar] [CrossRef]
- Kim, S.H.; Tan, J.P.K.; Nederberg, F.; Fukushima, K.; Colson, J.; Yang, C.; Nelson, A.; Yang, Y.; Hedrick, J.L. Hydrogen bonding-enhanced micelle assemblies for drug delivery. Biomaterials 2010, 31, 8063–8071. [Google Scholar] [CrossRef] [PubMed]


© 2017 by the authors. Licensee MDPI, Basel, Switzerland. This article is an open access article distributed under the terms and conditions of the Creative Commons Attribution (CC BY) license ( http://creativecommons.org/licenses/by/4.0/).
Share and Cite
Lv, X.; Huang, Z.; Shi, M.; Fan, Y.; Gao, G. Composition Distribution, Damping and Thermal Properties of the Thickness-Continuous Gradient Epoxy/Polyurethane Interpenetrating Polymer Networks. Appl. Sci. 2017, 7, 135. https://doi.org/10.3390/app7020135
Lv X, Huang Z, Shi M, Fan Y, Gao G. Composition Distribution, Damping and Thermal Properties of the Thickness-Continuous Gradient Epoxy/Polyurethane Interpenetrating Polymer Networks. Applied Sciences. 2017; 7(2):135. https://doi.org/10.3390/app7020135
Chicago/Turabian StyleLv, Xuesong, Zhixiong Huang, Minxian Shi, Yun Fan, and Guanbin Gao. 2017. "Composition Distribution, Damping and Thermal Properties of the Thickness-Continuous Gradient Epoxy/Polyurethane Interpenetrating Polymer Networks" Applied Sciences 7, no. 2: 135. https://doi.org/10.3390/app7020135