Article

SAR Interferogram Filtering of Shearlet Domain Based on Interferometric Phase Statistics

1
School of Geosciences and Info-Physics, Central South University, Changsha 410083, China
2
School of Civil and Environmental Engineering, Hunan University of Science and Engineering, Yongzhou 425199, China
*
Author to whom correspondence should be addressed.
Appl. Sci. 2017, 7(2), 141; https://doi.org/10.3390/app7020141
Submission received: 21 November 2016 / Revised: 14 January 2017 / Accepted: 17 January 2017 / Published: 4 February 2017

Abstract

:
This paper presents a new filtering approach for Synthetic Aperture Radar (SAR) interferometric phase noise reduction in the shearlet domain, depending on the coherent statistical characteristics. Shearlets provide a multidirectional and multiscale decomposition that have advantages over wavelet filtering methods when dealing with noisy phase fringes. Phase noise in SAR interferograms is directly related to the interferometric coherence and the look number of the interferogram. Therefore, an optimal interferogram filter should incorporate information from both of them. The proposed method combines the phase noise standard deviation with the shearlet transform. Experimental results show that the proposed method can reduce the interferogram noise while maintaining the spatial resolution, especially in areas with low coherence.

1. Introduction

Interferometric Synthetic Aperture Radar (InSAR) has proven to be an effective technology for creating a digital elevation model (DEM) and detecting ground deformation [1], so it has been widely applied in the study of seismic deformation, volcanic activity, glacial drift, urban subsidence and landslides [2,3]. However, the accuracy and reliability of InSAR measurements are highly dependent on the quality of interferometric phase. The interferogram phase is often contaminated by noises caused by the SAR imaging process and data processing, as well as temporal and baseline decorrelation effects [4] that impact the unwrapping process and decrease DEM accuracy [5].
Several techniques proposed to reduce the interferometric phase noises can be divided into two categories: spatial filtering and the frequency domain filtering. Spatial filtering, such as the multi-looking procedure, reduces noises at the expense of spatial resolution [5]. To maintain the resolution, Lee et al. [6] proposed a self-adaptive filter based on local gradient slope estimation, which can obtain satisfactory results by taking the images’ directional characteristics into consideration. Chao et al. [7] presented an improved method by excluding singular pixels within a selected direction via the minimum mean squared error estimator. Fu et al. [8] presented a directionally adaptive filter (DAF) with a filter window and its direction is able to vary continuously with the fringe direction. Baselice et al. [9] proposed a maximum posterior estimator that makes use of the Gaussian Markov Random Fields (MRF). Danudirdjo and Hirose [10] suggested suppressing noise by incorporating InSAR magnitude information with a fractal surface scattering model. Because the signal and noise could be separated in the frequency domain, the method is performed by suppressing the transformed coefficients. Furthermore, the most widely used frequency domain filtering method is the Goldstein filter, in which the filter factor, varying between zero and one, has a great impact on the filter performance [11]. Baran et al. [12] improved the Goldstein filter by adjusting the filtering factor with coherence. By this method, the quality of the filtered interferogram can be highly improved with less resolution loss. However, the filter factor is only related to coherence, but not directly related to the parameters that can reflect the interferogram noise level. Based on this, Li et al. [13] improved filtering parameters, and the parameters depend on interferometric coherence and number of looks of the interferogram. Wang et al. [14] presented an efficient denoising approach based on the assumption that the true phase is composed of principal phase components and residual phase components, and the filter equals to three common filters by varying the bound parameter to three different values.
Recently, some papers about the adaptive filtering of interferometric stacks have been published. Ferretti et al. [15] proposed the Despec KS algorithm, a space adaptive filtering procedure which identifies statistically homogeneous areas. Parizzi et al. [16] presented different methods to select similar pixels based on their amplitude distribution for the purpose of adaptive multi-looking and practical results. Fornaro et al. [17] proposed a temporal filtering, which uses the Phase Linking (PL) algorithm to estimate a set of N acquisition phases that satisfies the property of phase triangularity. Pepe et al. [18] proposed an effective noise filtering approach to improve the performance of classical extended minimum cost flow-small baseline subset (EMCF-SBAS) inversion technique. The filtering process is a nonlinear minimization process and needs no priori information on the statistics of the complex-valued SAR images.
The wavelet filtering method, a signal analysis tool, can combine the spatial domain and frequency domain, meaning it has time-frequency analysis capability [19]; it can also separate the phase information and noise more easily. The InSAR phase-filtering method in the wavelet domain was first proposed by Martinez et al. [20]. Modeling and reduction of SAR interferometric phase-noise in the wavelet domain and a phase-filtering method using wavelet packet were introduced [21]. Abdallah et al. [22] proposed an improved method of the adaptive switching median filter, which takes into account the corresponding coherence map values. Xu et al. [23] presented a sparse regulation approach, which performs phase noise reduction and despeckling. The wavelet transform allows maintaining of the spatial resolution in the filtered phase interferogram. However, these methods estimate the interference phase noise from wavelet coefficients, and do not take into account the statistical properties of the InSAR interferometric noise phase. In addition, the traditional wavelet transform is isotropic, which cannot properly deal with complex multidimensional image data. It has been proven that the traditional wavelet transform can efficiently approximate signals containing point singularities [24], but cannot accurately represent the multidimensional data that contains a large number of edges and line elements, which restricts the application of image processing.
Because traditional threshold filtering methods for SAR interferograms based on wavelet transform neither express information of edges and stripes, nor incorporate the statistical properties of the SAR interferometrc phase, a novel filtering method is proposed in this paper, which combines the shearlet transform with the phase standard deviation for InSAR interferograms. In the proposed method, the filtering intensity depends on the coherence and look number of the phase noise. In addition, this method does not require any windowing process, so it is not affected by the window size and can preserve more fringe details.

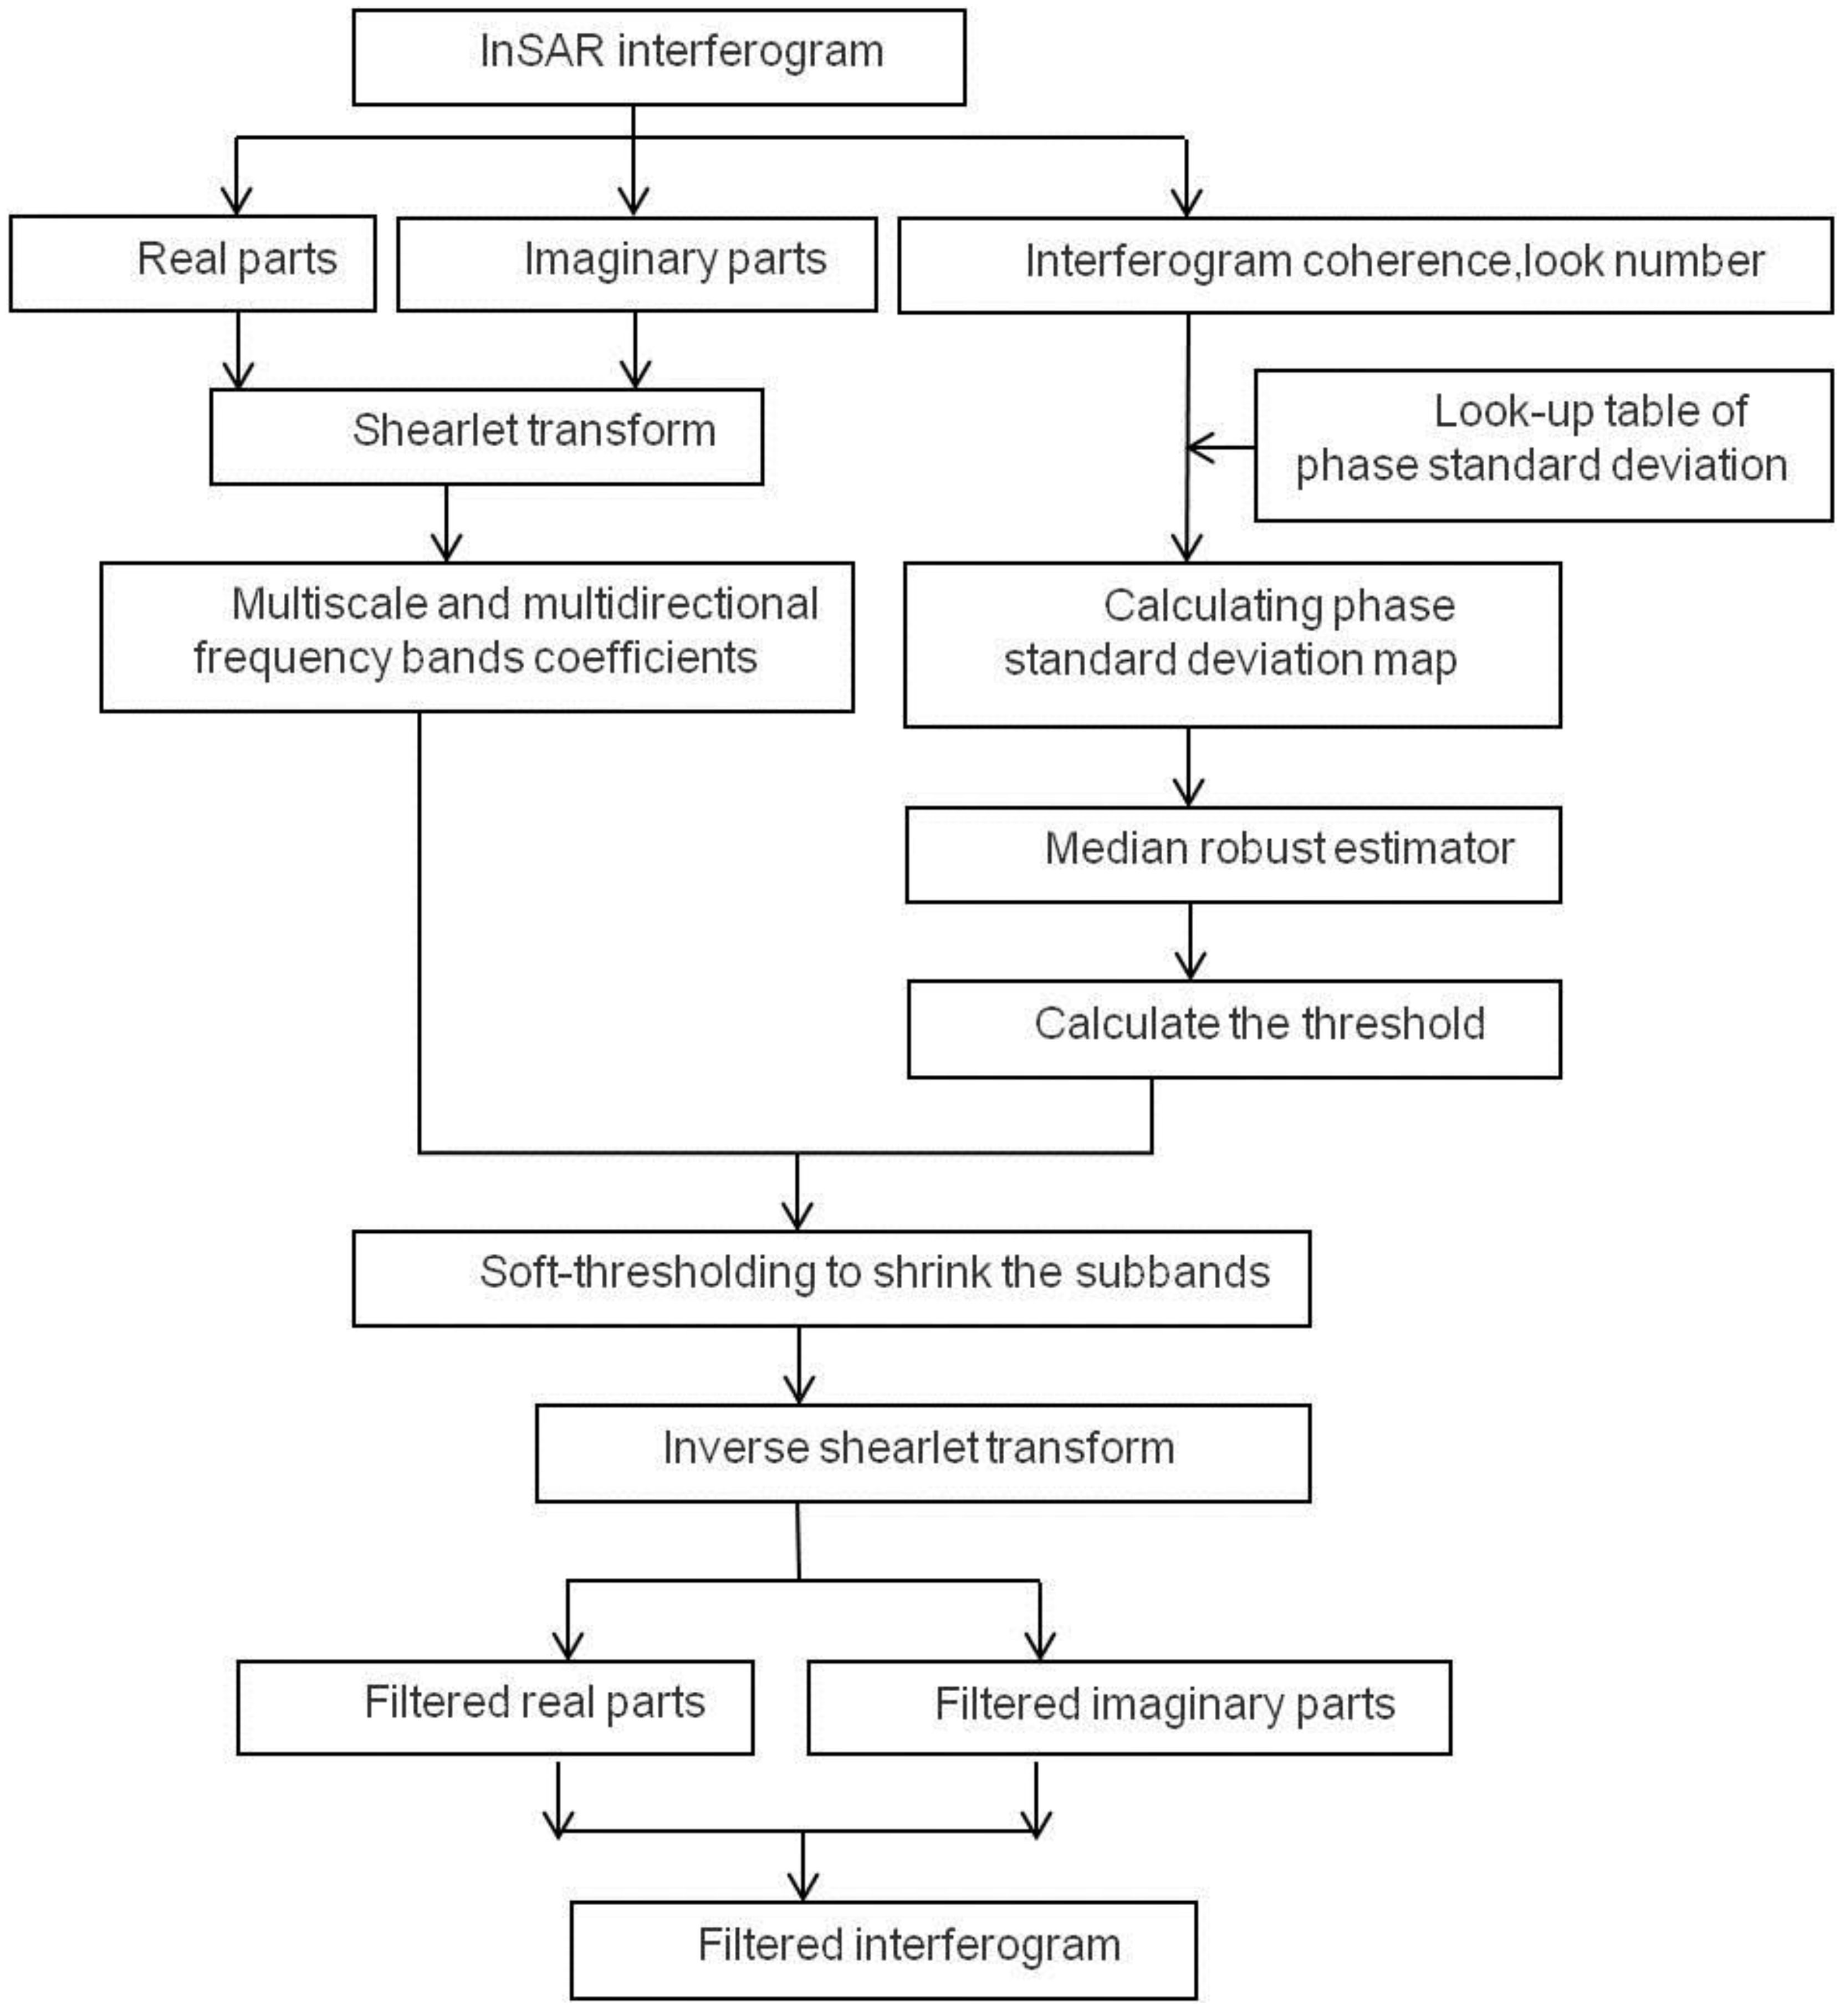
2. Phase Filtering of Shearlet Domain Based on Interferometric Phase Statistics

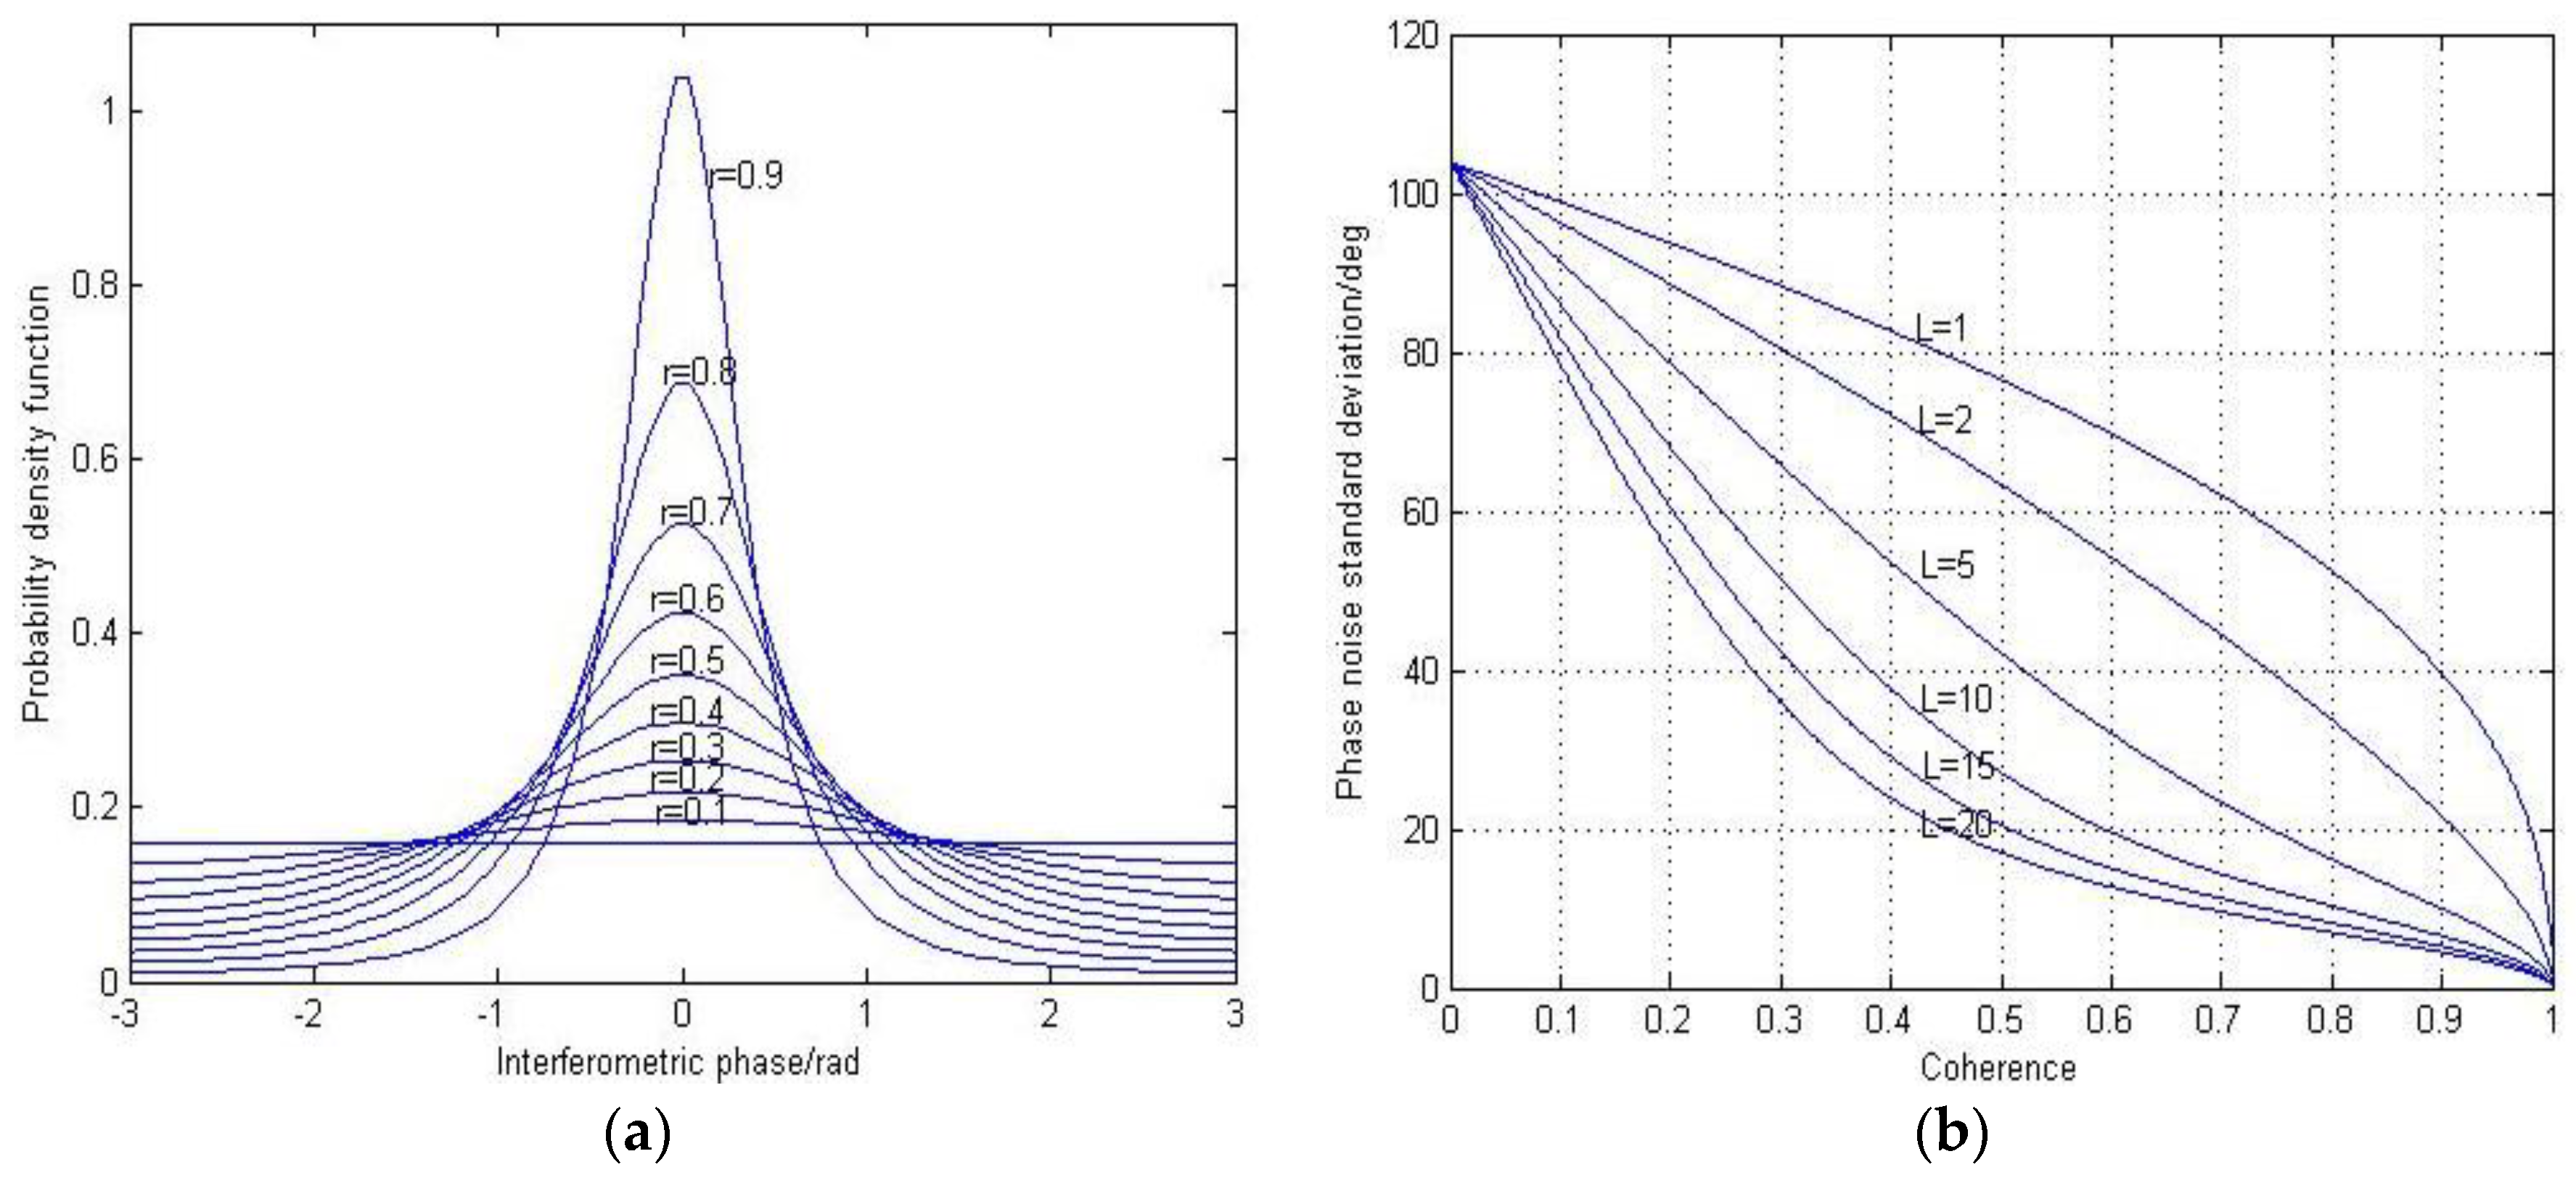
2.1. Interferometric Phase Statistics

For the InSAR Interferometry, the coherence of two SAR images directly affects the accuracy of elevation measurement. Moreover, the coherence itself is affected by factors like system noise, baseline decoherence, time decoherence and image registration errors [25]. The complex correlation coefficient is defined as
r = | r | exp ( j φ x ) = E { S i S j * } E { | S i | 2 } E { | S j | 2 } , i , j = 1 , 2 , ... , m
where | r | denotes the coherence, φ x represents the average phase information, S i and S j are the two interferometric SAR images [26].
The interference phase of a pair of SAR images is described by the pdf [27].
p d f φ ( φ ) = Γ ( L + 1 / 2 ) ( 1 | r | 2 ) n β 2 π Γ ( L ) ( 1 β 2 ) n + 1 / 2 + ( 1 | r | 2 ) n 2 π F 1 2 ( L , 1 ; 1 2 ; β 2 )
where β = | r | cos ( φ φ x ) , representing the Gauss hypergeometric function [28], and Γ is the Gamma function.
The pdf of (2) depends only on the number of looks L and the complex correlation coefficient | r | . The peak of the distribution is located at φ = φ x . Figure 1a shows distributions of correlation coefficient | r | = 0.1 ~ 0.9 , L = 1 and φ x = 0 . Figure 1b shows a standard deviation versus L = 1 , 2 , 5 , 10 , 15 , 20 . As Figure 1b shows, the multi-look processing improves the phase accuracy, i.e., the variance of the phase decreases for a larger number of looks. When the coherence is 0.5, the theoretical phase noise standard deviation for a single-look ( L = 1 ) interferogram is about three times larger than that of a twenty-look ( L = 20 ) interferogram [29]. Additionally, for a given look number, phase standard deviation is inversely proportional to the coherence, i.e., bigger coherence corresponds to smaller phase noise standard deviation and weaker noise, and vice versa. This means the standard deviation of the noise phase is closely correlated with the coherence and the multi-look number. The phase standard deviation can reflect the interference phase noise more comprehensively than coherence or multi-look number.

2.2. Phase Model

An interferometric phase in the complex domain can be expressed as
e j φ = cos ( φ ) + j sin ( φ )
where φ is the interferometric phase.
The interferometric phase can be characterized by an additive noise mode [6] as
φ = φ ω + φ n
where φ is the noisy phase, φ ω is the noise-free phase and φ n is the noise. In addition, φ ω and φ n are assumed to be independent from each other.
According to the analysis presented in Martinez and Fabregas [20], the interferometric phase in the complex domain is continuous. The real and imaginary parts of the phase can be written as [20].
cos ( φ ) = N c cos ( φ ω ) + υ c sin ( φ ) = N c sin ( φ ω ) + υ s
where cos ( φ ) and sin ( φ ) are real and imaginary parts of φ , respectively. υ c and υ s can be considered as zero-mean noise and are independent from φ ω . N c is a factor related to the coherence.
Since the real and imaginary parts of the phase are periodic characteristics, the phase is wrapped from ( π , π ) . Therefore, the filtering should be performed on the real and imaginary parts separately to maintain the phase jumps [30].

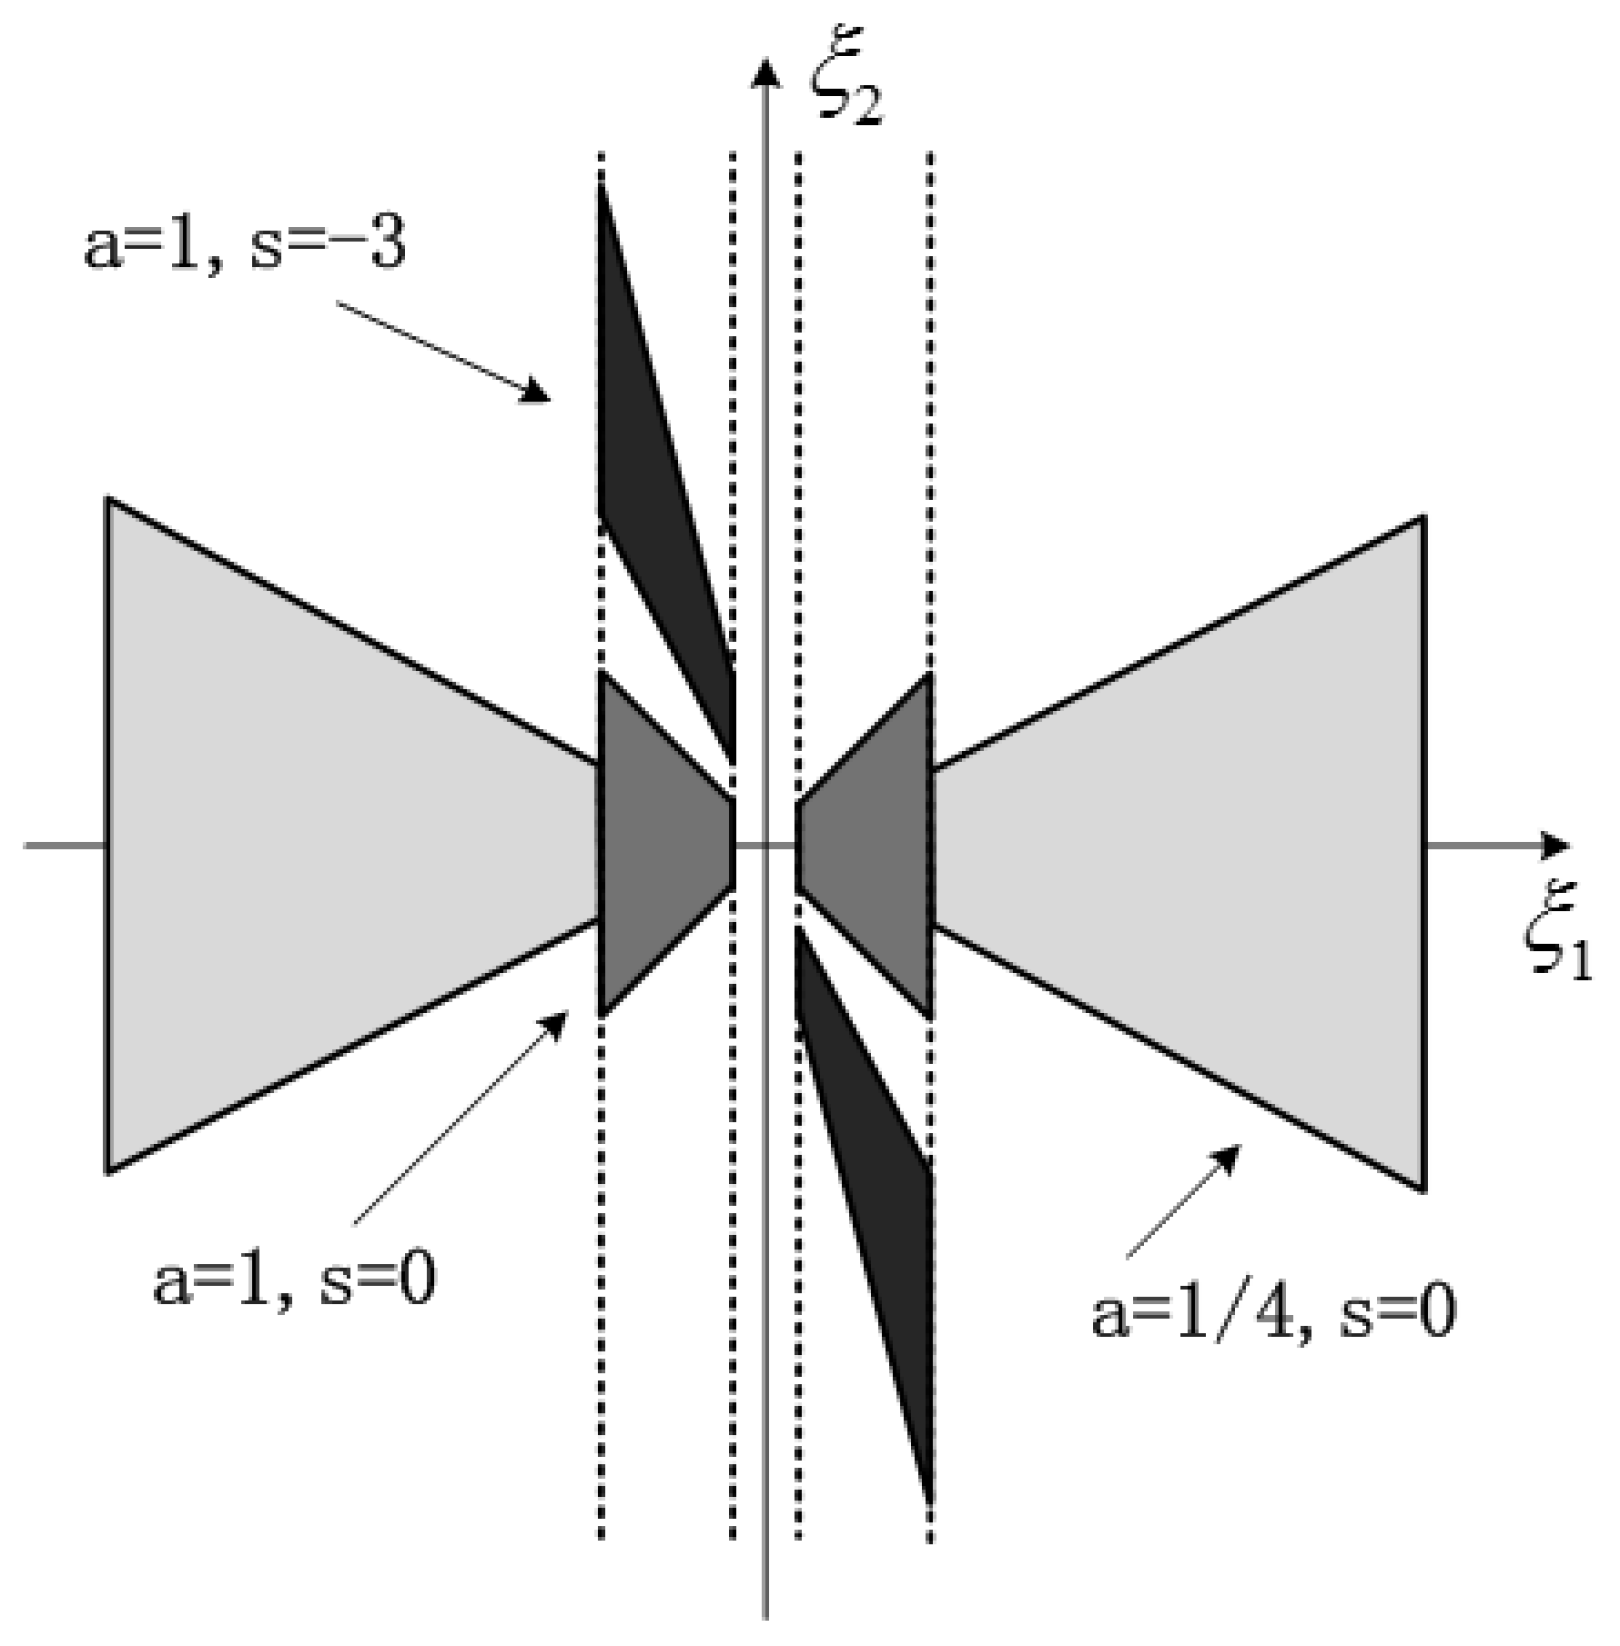
2.3. Interferometric Phase Shearlet Transform

For interferogram with a given size, the InSAR interferometric phase can be regarded as a complex matrix. We first get the real and imaginary parts of the phase, and then process them by the shearlet transform respectively. The continuous shearlet transform is defined as below [30].
S H f ( a , s , t ) = f , ψ a , s , t
where f is the real parts cos ( φ ) and imaginary parts sin ( φ ) . In addition, functions ψ a , s , t ( x ) can be defined as
ψ a , s , t ( x ) = a 3 / 4 ψ ( A 1 B 1 ( x t ) )
where a R + is the scale parameter, s R is the shear parameter, t R 2 is the translation parameter A = ( a , 0 ; 0 , a 1 / 2 ) is an anisotropic dilation matrix associated with scale transformations, through which the shearlet transform can be associated with a multiresolution analysis, like wavelets. B = ( 1 , s ; 0 , 1 ) is the shear matrix, relating to area-preserving geometrical transformations, such as rotations and shear. We can get the frequency supports for ( a = 1 , s = 0 ) , ( a = 1 / 4 , s = 0 ) , ( a = 1 , s = 3 ) , as shown in Figure 2.
Shearlets have the following mathematical properties [24]. They:
  • are well localized;
  • have parabolic scaling;
  • are highly directionally sensitive;
  • are spatially localized;
  • and are optimally sparse.
Shearlets form a tight frame of well-localized waveforms at various scales and directions, and are optimally sparse in representing images with edges [31]. The interferogram contains a large number of edges and details, so the shearlet transform used in interferogram filter is greatly superior.

2.4. The Proposed Filter

The shearlet transform in the time domain and frequency domain has a good localization property, so it can remove the noise while keeping the edge information. The shearlet transform is a linear operator, and the additive noise model is retained within the shearlet domain. Applying the shearlet transform to the real and imaginary parts in (5), we obtain the following
S h ( cos ( θ z ) ) = N c S h ( cos ( θ x ) ) + S h ( υ r ) S h ( sin ( θ z ) ) = N c S h ( sin ( θ x ) ) + S h ( υ i )
where S h represents the shearlet transform operation.
We apply a soft thresholding method to recover the InSAR phase, which is similar to that given in [31]. The shearlet threshold function T ( j , l ) is defined as
T ( j , l ) = k ε j , l σ ^ n
k is a constant and equals to 3, 3, 4 when j = 1, 2, 3, ε j , l denotes the average energy distribution of white noise in shearlet coefficient on scale j and direction l . σ ^ n is the standard deviation of noise [32].
Obviously, the key to determine the threshold is the noise standard deviation σ ^ n [33].
σ ^ n = m e d i a n ( | y i | ) 0.6745 y i  subband  H H 1 ,
where H H 1 is the high frequency sub-band wavelet coefficient in the first level.
However, the estimate of σ ^ n derived from (10), is rough and changes with wavelet functions. More importantly, the threshold defined by (10) generates poor results in low coherence regions. As demonstrated in Section 2.1, the noise standard deviation is a function of coherence and look number. Therefore, we modify the threshold filter to incorporate information contained in these two parameters. We thus propose to replace σ ^ n with the phase standard deviation, which is more reasonable.
The standard deviation of a given coherence and multi-look number can be calculated by numerical integration [30]. Correspondingly, the phase standard deviation map can be calculated pixel by pixel with the coherence map and multi-look factor through numerical integration. However, this process is time-consuming, and will be intolerable if the interferogram is large. As the multi-look number is an integer and the coherence is between 0 and 1, we can create a look-up table for phase standard deviations versus coherences and multi-look numbers, shown in Table 1. The calculation process of the phase standard deviation map in a given interferogram is then simplified to match the coherence and multi-look number in the look-up table at the pixel basis, and finally the interferogram noise standard deviation matrix σ is generated.
For a given interferogram, phase standard deviation σ ^ n varies with coherence. To solve the second problem, we use a robust estimator, the median, in case the fine-scale wavelet coefficients contain a small proportion of strong “signals” mixed with “noise”.
The whole process of the proposed method can be listed as follows. The flow chart is shown in Figure 3.
(1)
The real and imaginary parts of InSAR interferogram are processed by the shearlet transform, which are then decomposed into multiscale and multidirectional frequency bands c ( j , l ) , where j is scale index, l is direction index.
(2)
The threshold is then determined by the following procedure.
  • Create a phase standard deviation look-up table between different coherence and multi-look number, as shown in Table 1.
  • For a given interferogram, the standard deviation map σ can be generated pixel by pixel using the look-up table of the coherence and multi-look.
  • Median robust estimator σ ^ n = m e d i a n ( σ )
  • Calculate the threshold T ( j , l ) = k ε j , l σ ^ n , k = 3 , 3 , 4 for j = 1 , 2 , 3 . ε j , l denotes the average energy distribution of white noise in the shearlet coefficient on scale j in direction l . σ ^ n is the standard deviation defined by the proposed method.
(3)
After the new shrinkage threshold of every shearlet coefficient is obtained, we use the soft-thresholding formulation to shrink the shearlet coefficients.
c ^ ( j , l ) = { sgn ( c ( j , l ) ) * ( | c ( j , l ) | T ( j , l ) , | c ( j , l ) | T ( j , l ) 0 , | c ( j , l ) | < T ( j , l )
(4)
Then the real and imaginary parts of the shearlet coefficients are processed by the inverse shearlet transform and the filtered real and imaginary parts are combined to get the filtered interferogram.

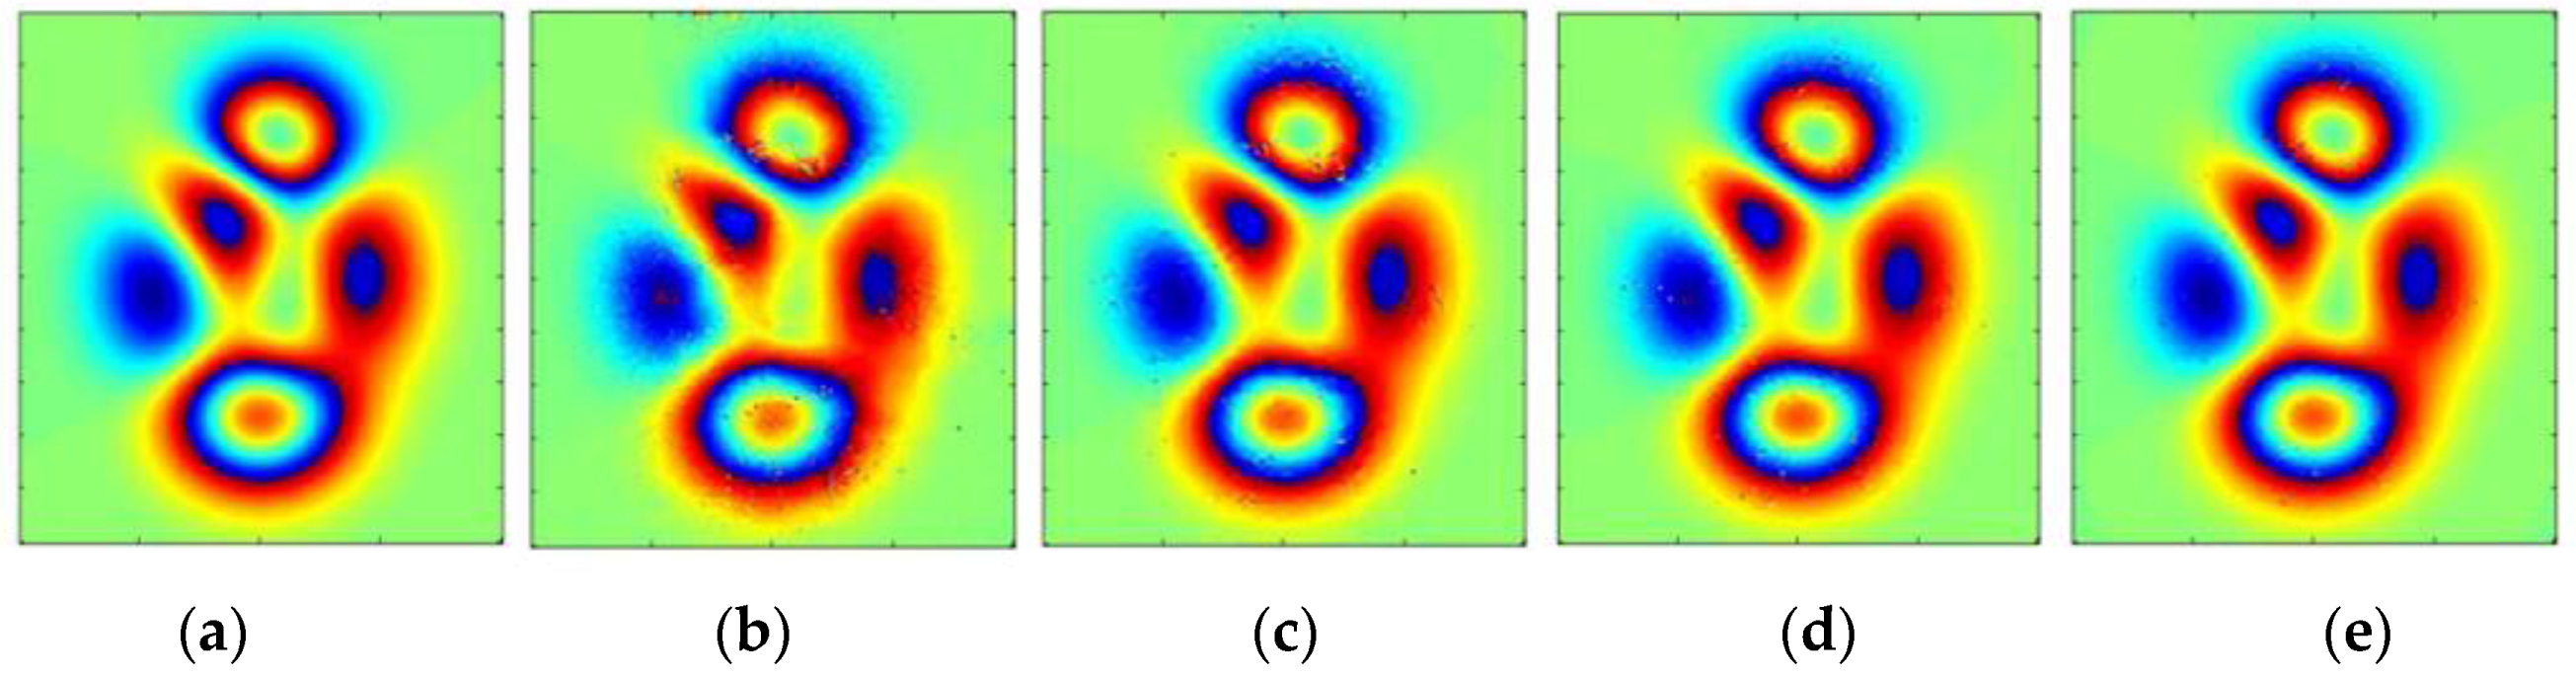
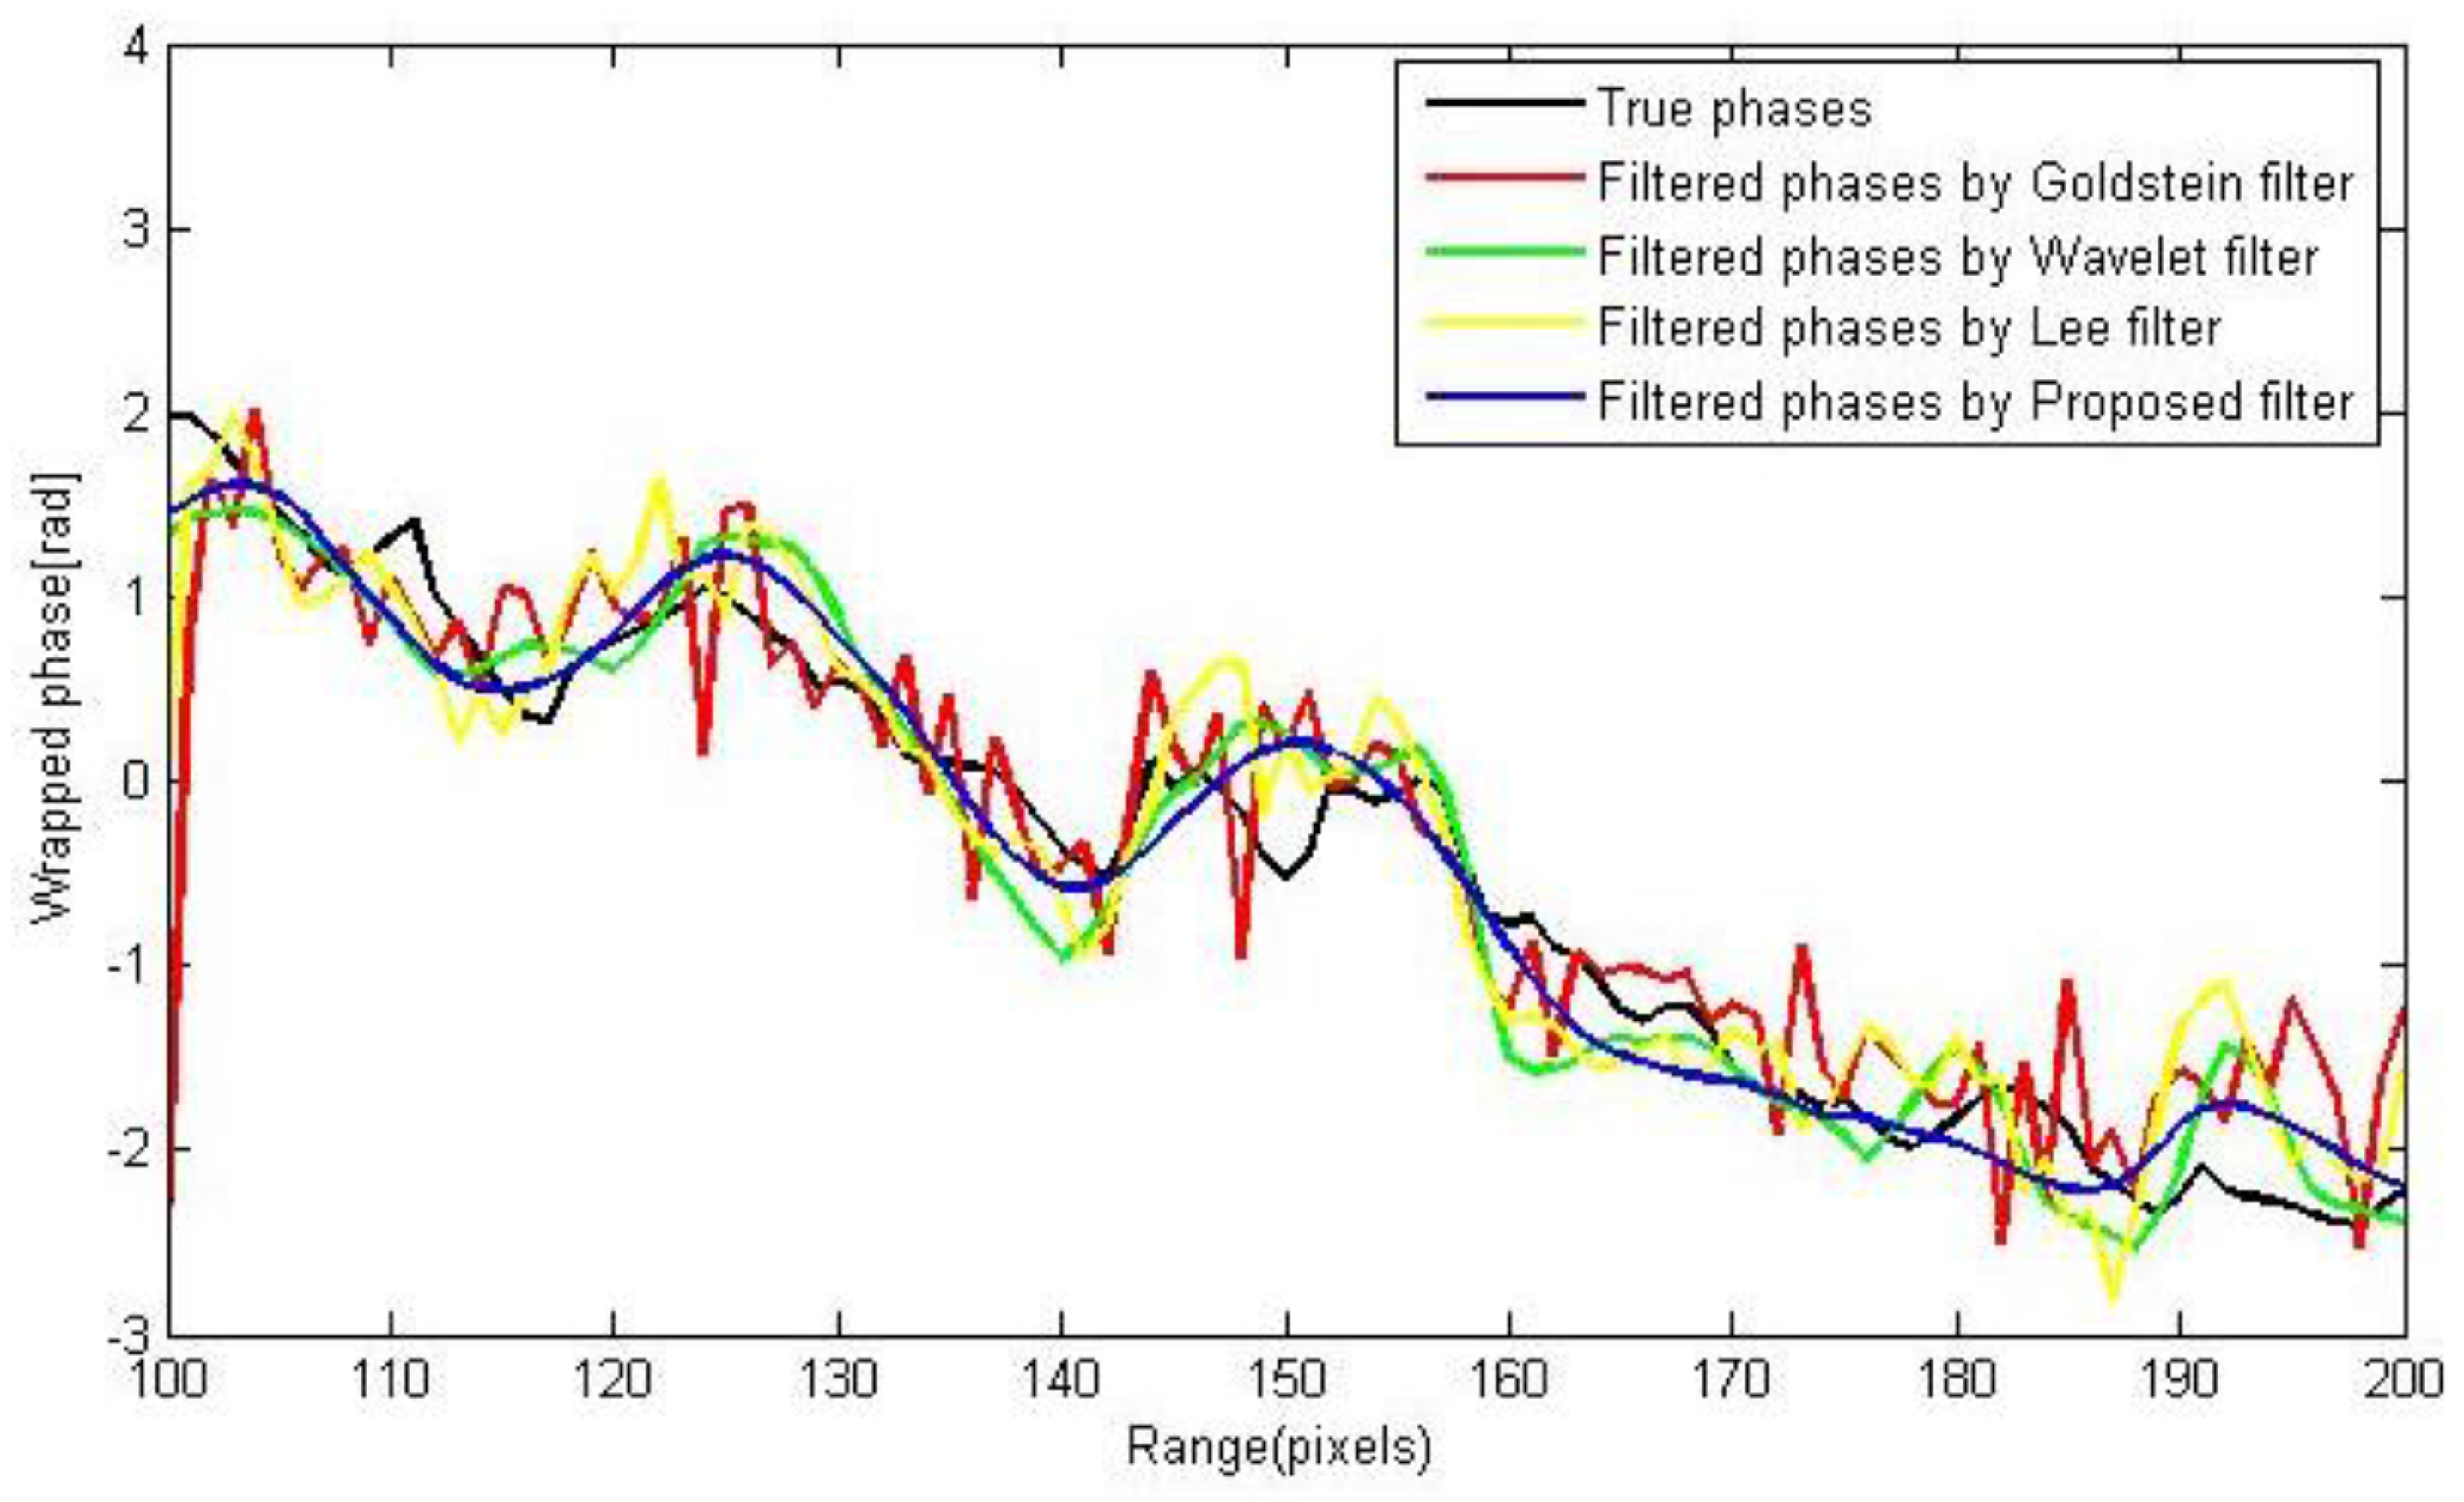
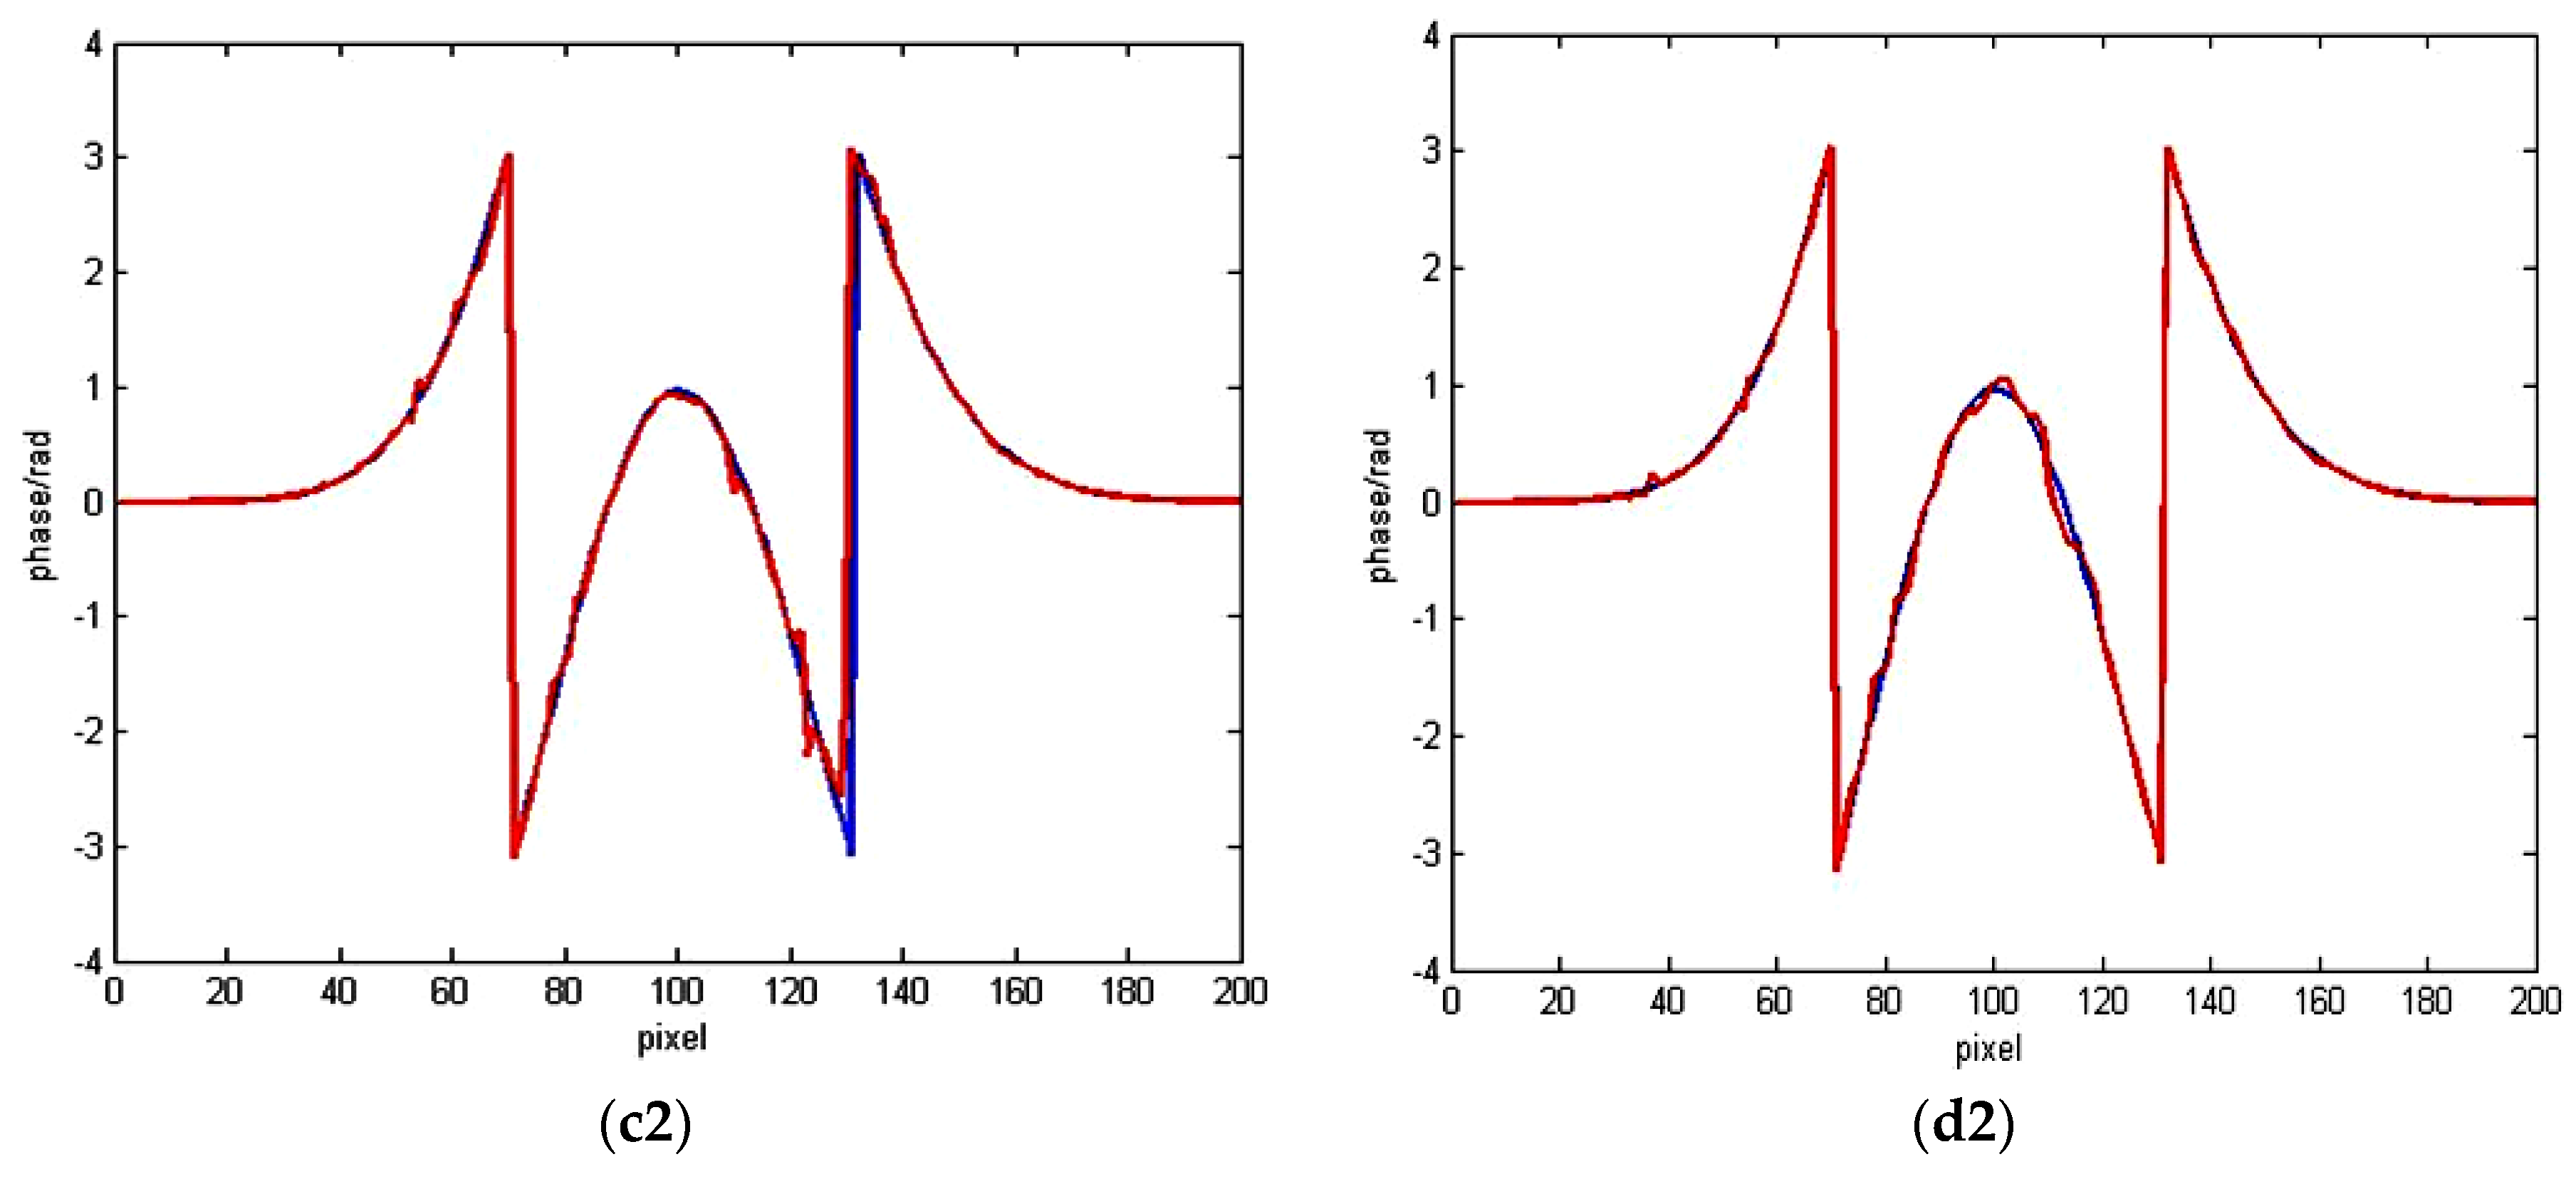
3. Validation with Simulation Data

To examine the filtering performance of the proposed method, the simulation data (592 × 592 pixels) are used in this section. The DEM is first simulated by the multifractal technology. Then based on the European Remote Sensing (ERS) 1/2 imaging geometric parameters and a given vertical baseline length, a noise-free phase is simulated by the DEM [13], see Figure 4a. The coherence map shown in Figure 4b is simulated based on three principle errors: the thermal noise, geometric decorrelation and temporal decorrelation. On the basis of the simulated coherence map and a multi-look number, the phase noise can be simulated. Finally, the noisy phase in Figure 4c is generated by adding the phase noise to the noise-free phase.
The results obtained by the Goldstein filter [11], wavelet filter and Lee filter [6] methods are also compared (Figure 5). The main parameters of the Goldstein filter are as follows: the filter parameters α is 0.5, the patch size is 32 × 32 pixels, the overlaps between patches is 15 pixels to avoid discontinuities. The scale parameter of the wavelet filter is 3. The main parameters of the proposed method are as follows: scale parameter of shearlet is 3, and the shear parameter is (1, 1, 2) for j = 1 , 2 , 3 scale.
From the coarse view of Figure 5(a1–d1), we can observe that noise is suppressed in all filtered phases. For clarity and detailed comparison, two areas, A and B, labeled by white rectangles in Figure 4, are enlarged in Figure 5(a2–d2) and Figure 5(a3–d3), respectively.
The results of the Goldstein filter (Figure 5(a1–a3)) and Lee filter (Figure 5(c1–c3)) show large numbers of phase noise in almost all of the whole phase image, especially in areas of low coherence and high fringe density. The wavelet filter performs better than the Goldstein and Lee methods. As Figure 5(b1–b3) shows, in high coherence areas, most noises have been filtered out. However, in some low coherence areas, there is still some phase noise. The result of the proposed filter is smooth and with all details, as most noise is filtered out in regions of low coherence, improving the spatial resolution, see Figure 5d1–d3. It is clear that the filtered phases of the proposed filter in Figure 5(d1) are the closest to the true phases in Figure 4a.
For further analysis on filtering effect, quantitative assessments are calculated in terms of the root mean squared error (RMSE). RMSE values between true phases and filtered phases of the Goldstein, wavelet, Lee filter and the proposed filters are 1.3715, 1.2196, 1.3439 and 1.0708 rad respectively. Obviously, the proposed filter is more consistent and robust.
A small cross-section marked by the black line in Figure 5(a1–d1) is extracted to compare the filtering effect and the results are shown in Figure 6. Clearly, the filtered phase values of the proposed filter appear less noisy than those of the other three filters. Furthermore, the proposed filter gets smoother curves while effectively maintaining edge details. RMSE values between true phases and filtered phases of the Goldstein, wavelet, Lee and the proposed filters over the cross-section are 0.6457, 0.3607, 0.4528 and 0.2859 rad respectively.

4. Validation with Real Data

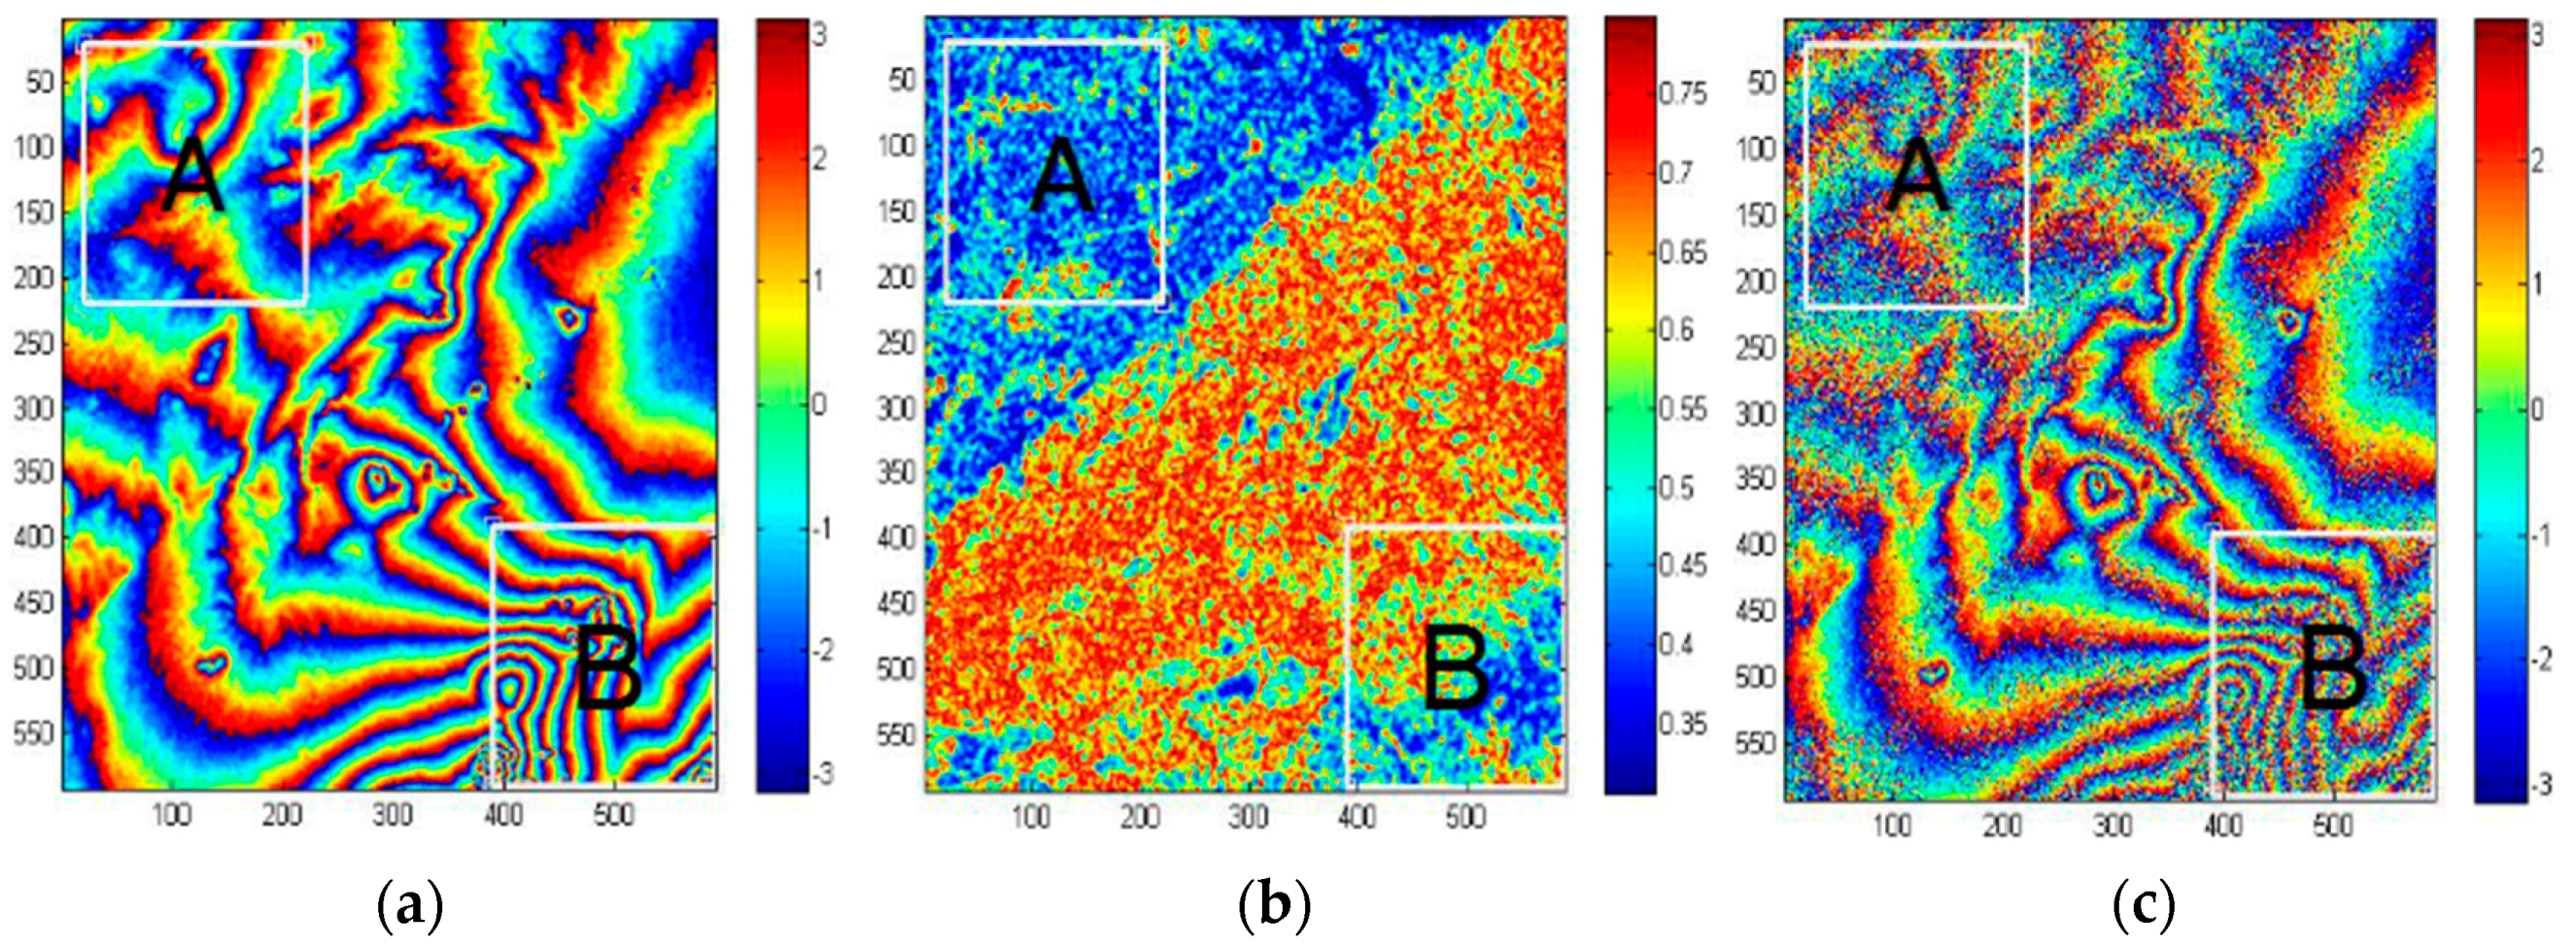
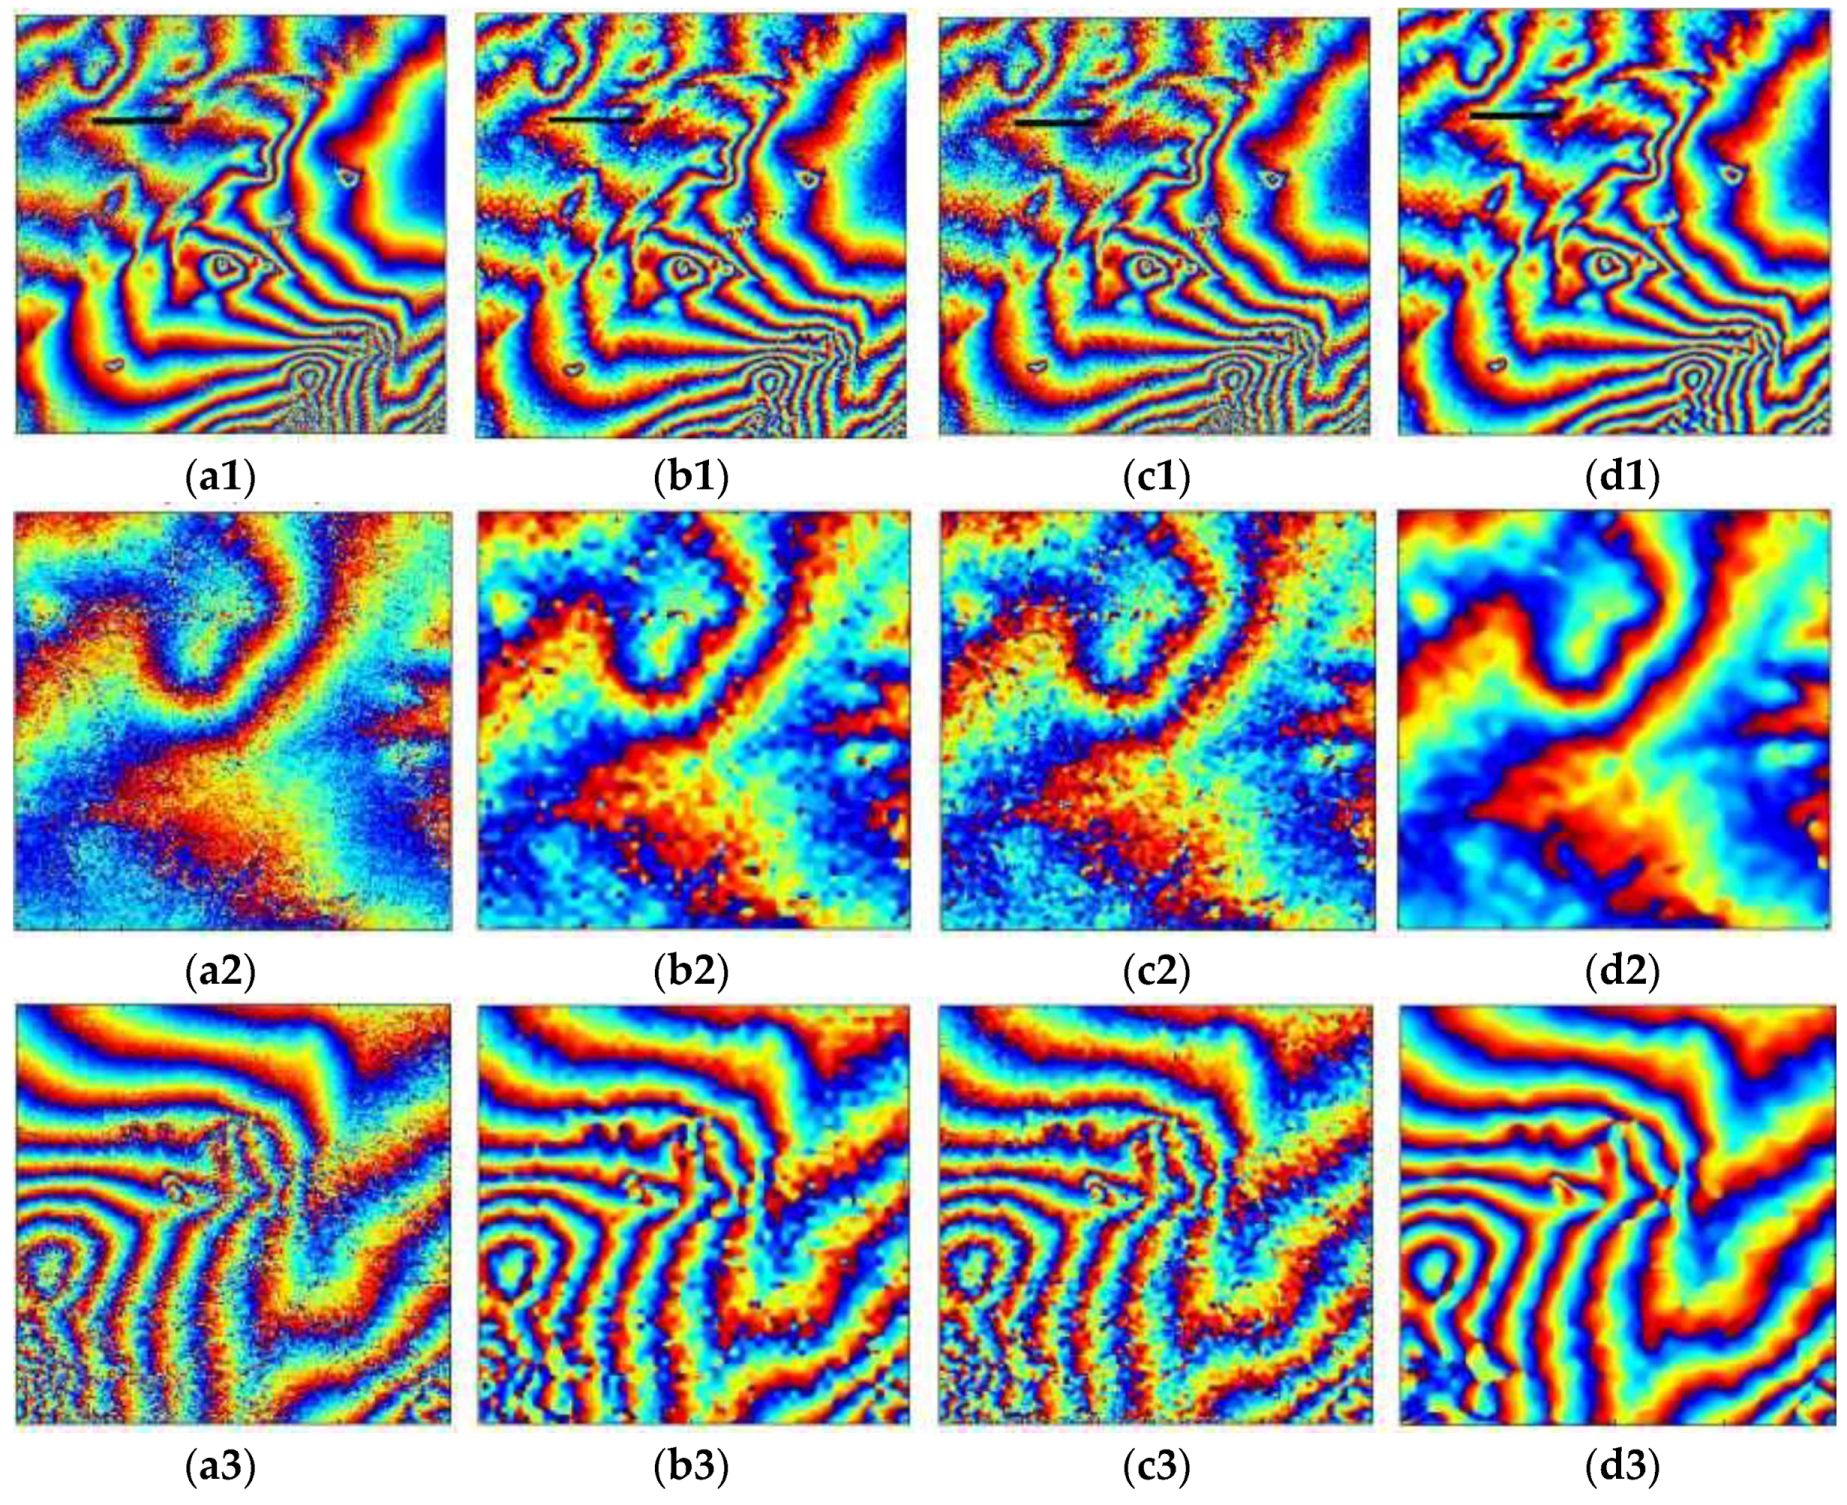
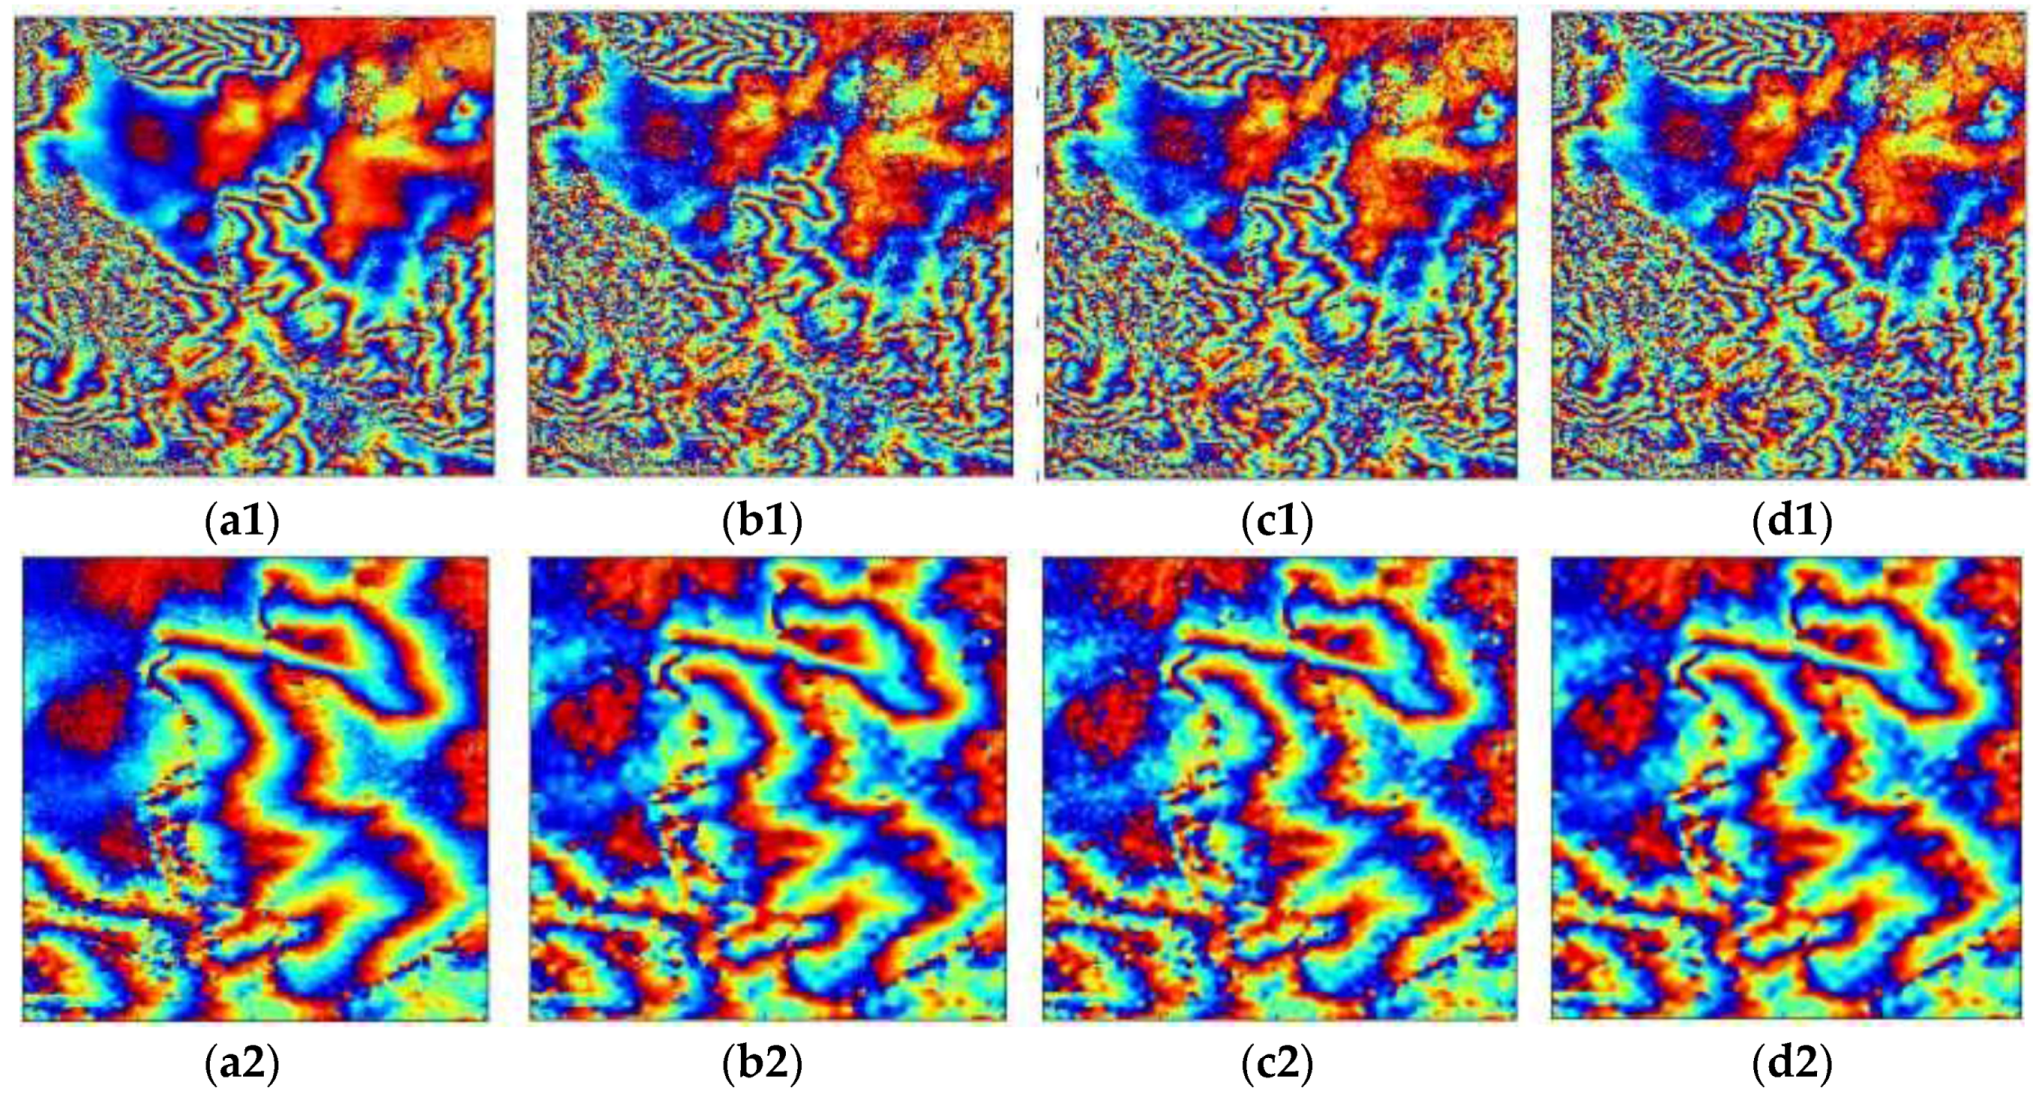
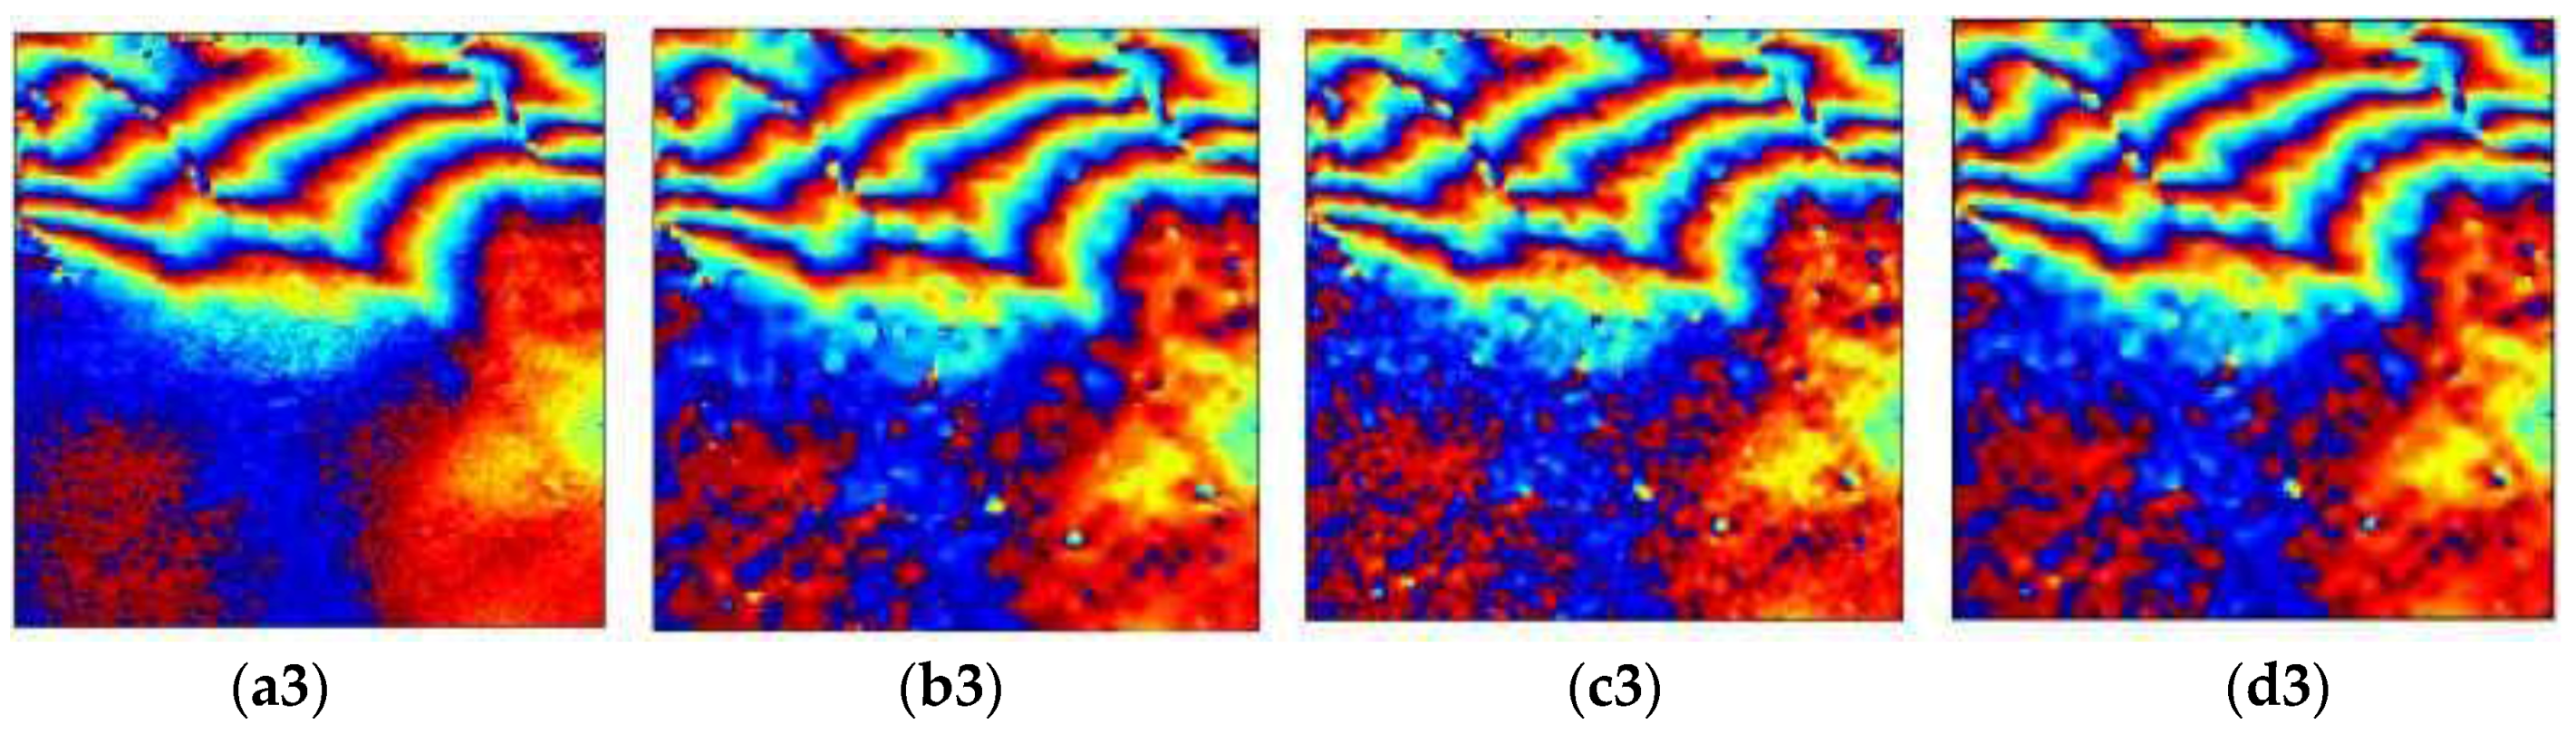
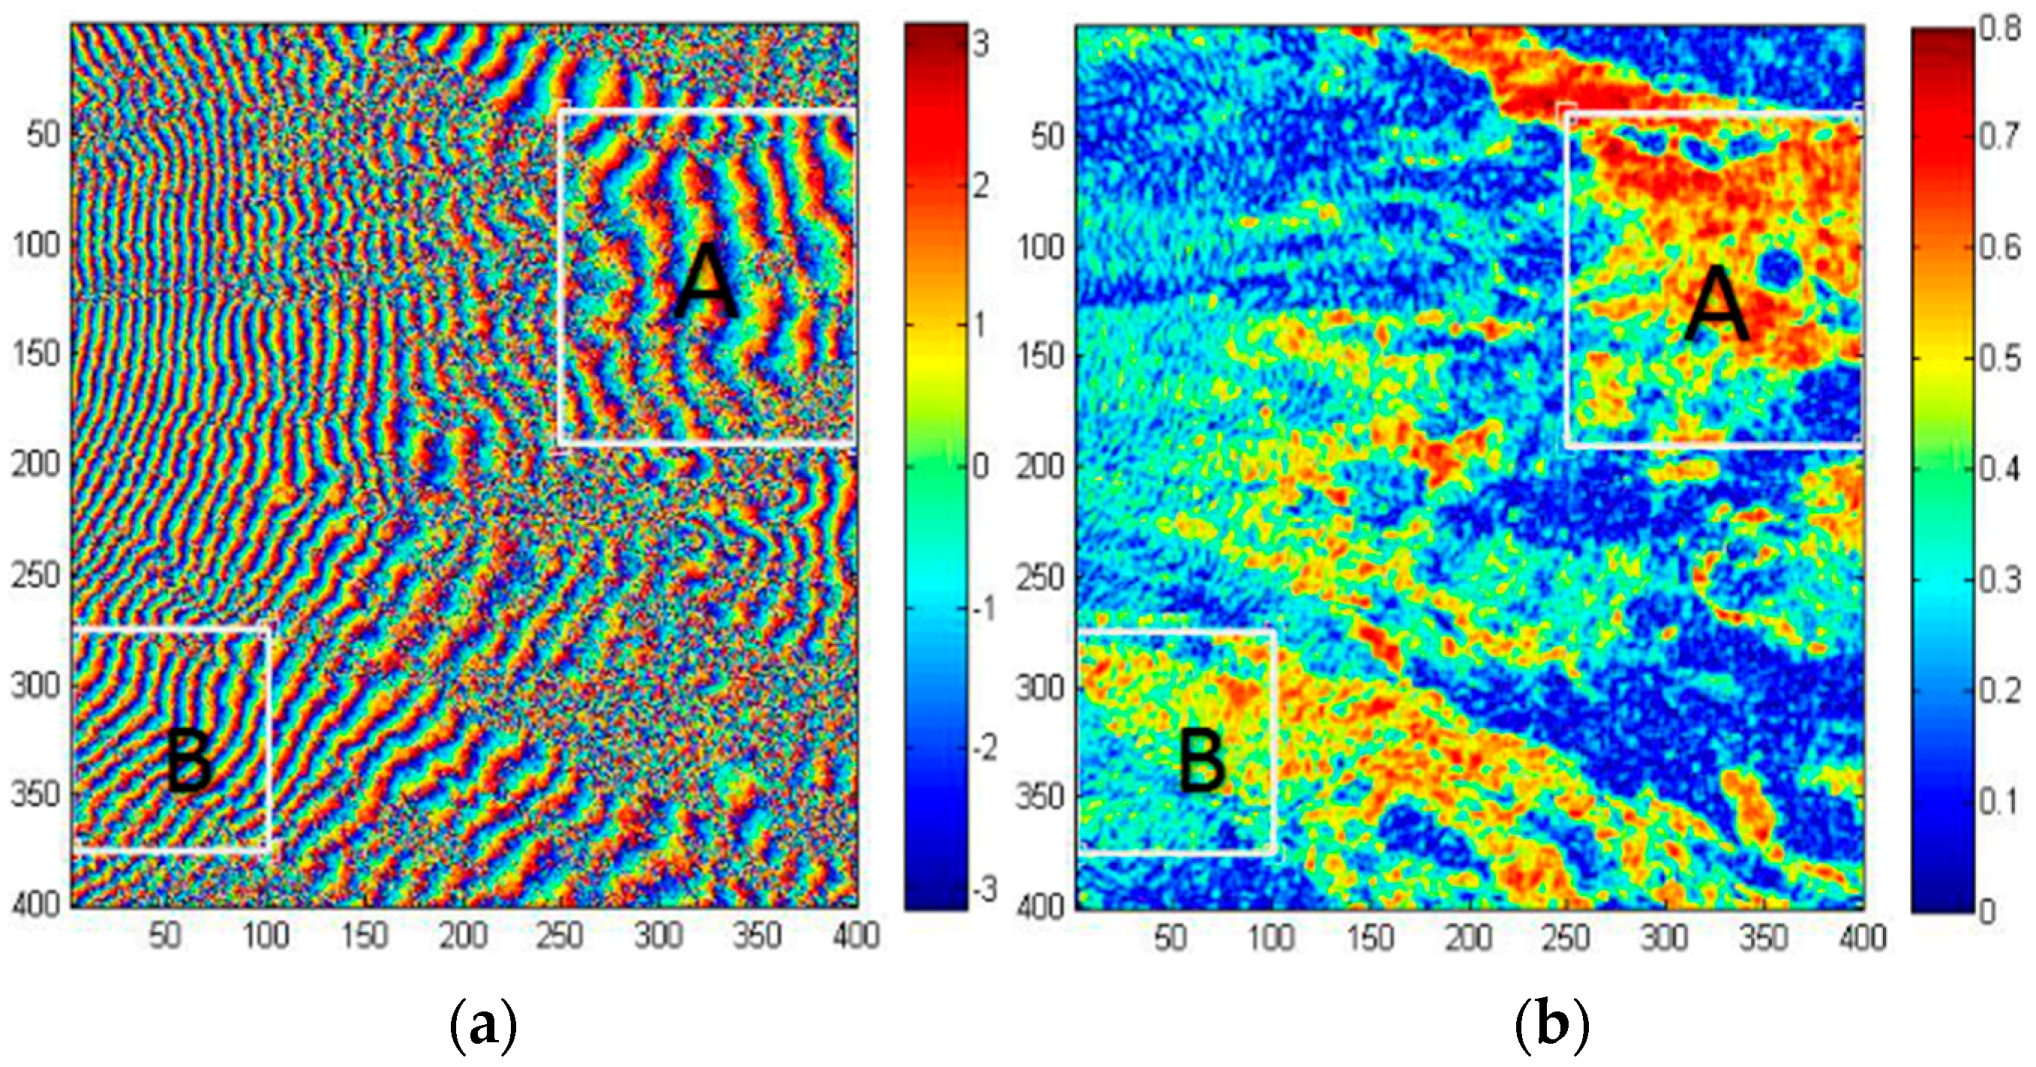
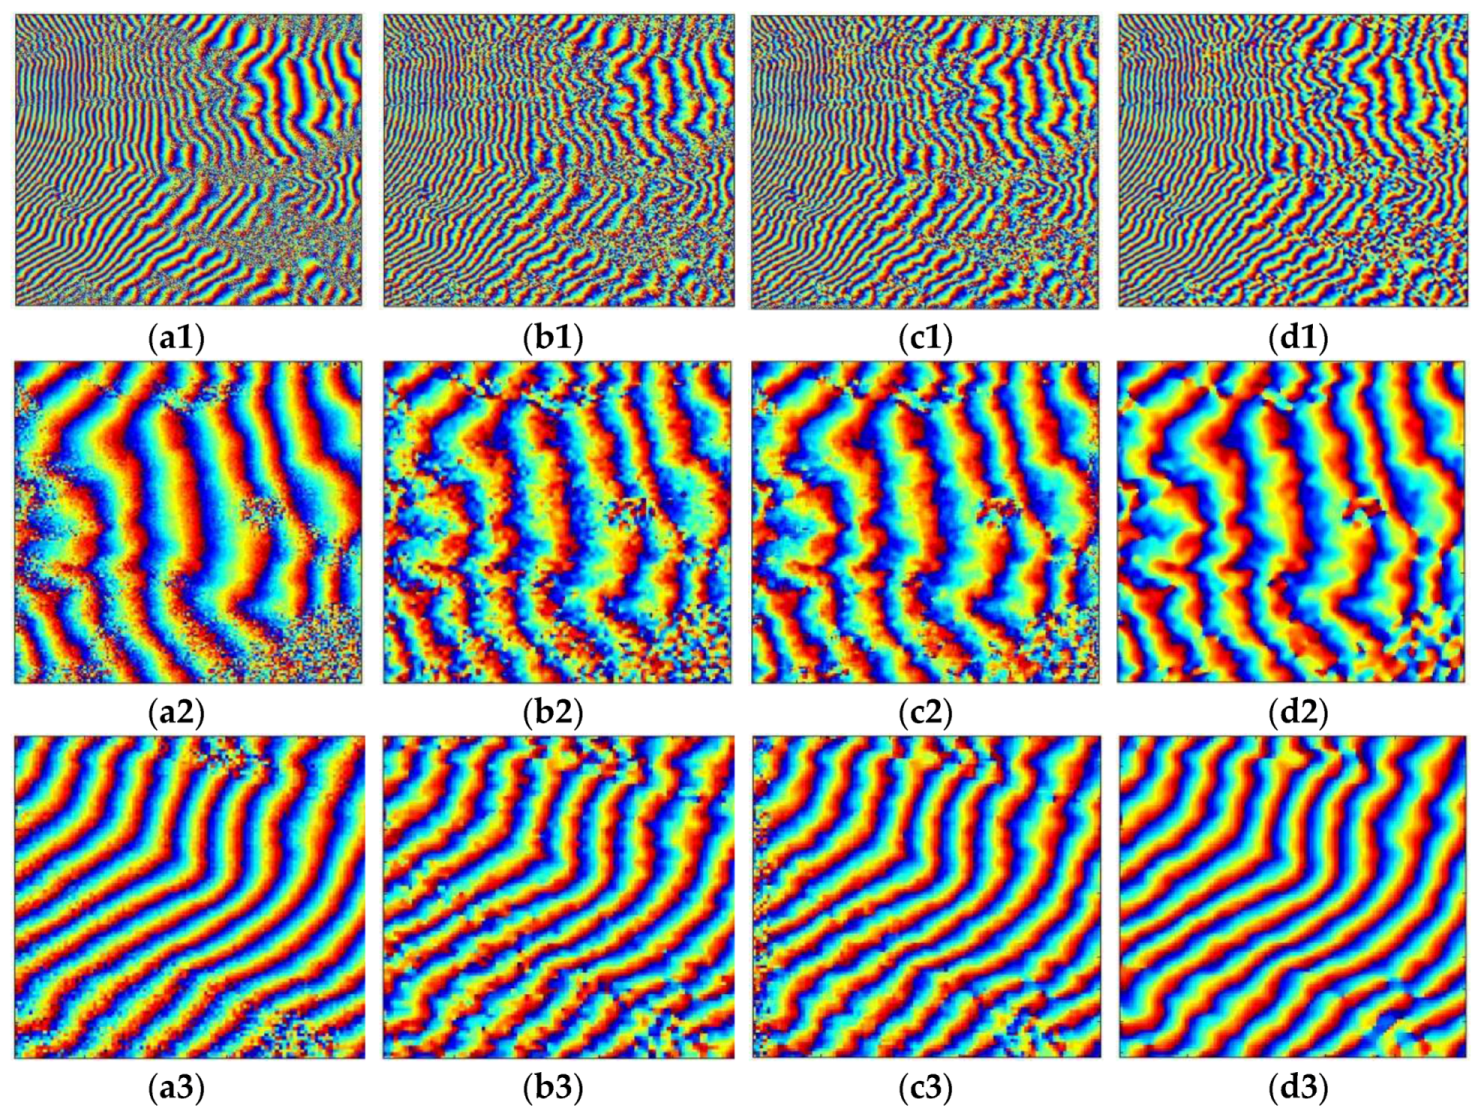
4.1. Validation with the Interferogram over the Etna Volcano

In this section, an interferogram over Mt. Etna Volcano in Italy is selected to verify the proposed filter. The image pairs (Frame: 2853, Track: 222) were acquired on 6 September and 11 October 2000. The vertical baseline is 305 m, the ambiguity height is 31 m, and the intensive fringe area is 400 × 400 pixels. The interferometric phase and corresponding coherence map are shown in Figure 7a,b, respectively.
Figure 8 shows the filtered results of the Goldstein filter, wavelet filter, Lee filter and the proposed filter. Obviously, these methods have removed the noise and enhanced the edge in high coherence areas. However, a lot of noise in low coherence areas remained in the results of the Goldstein filter and wavelet filter as shown in Figure 8(a1,b1). The Lee filter shown in Figure 8(c1) has filtered out most noises, though it partially damages the edge details in the dense fringe area. The results of the proposed filter shown in Figure 8(d1) keep the main features of the image with clearer and more distinguishable interferometric fringes, especially in low coherence areas.
Close-up views of areas A and B in the white rectangles of Figure 7 are shown in Figure 8(a2–d2) and Figure 8(a3–d3), respectively. The average coherence value of area A is high and the coherence of area B is low (Figure 7b). Figure 8(a2) is slightly under-filtered and Figure 8(a3) is slightly over-filtered. The Goldstein filter yields obvious errors and behaves poorly in noise suppression. Compared with the results of the Goldstein method, both the wavelet and Lee methods perform better in noise reduction. In some areas, however, phase noises still exist. The Lee filter is able to retain the details effectively because it adopts the direction filter window. However, as the window has a fixed size, its noise suppression ability is limited in the sparse fringe areas, and it partially damages the edge details in the dense fringe area. The close-up view of the area within areas A and B of Figure 7 from the proposed method is shown in Figure 8(d2,d3). We can see that the proposed methods significantly suppress noise, and interferometric fringes in areas A and B are clearer and more distinguishable.
To further analyze the noise reduction and detail preservation, an experiment was conducted. First, we added the deformation phases to the Etna interferometric phase. Second, we used the aforementioned filtering methods to process the phase containing deformation phases. Finally, we obtained the estimated deformation phases using filtering results.
The deformation phases were simulated by the peaks function shown in Figure 9a. Estimated deformation phases obtained by the Goldstein, wavelet, Lee and the proposed methods are shown in Figure 9b–e, respectively. In contrast to the real deformation phases, Figure 9 suggests that the Goldstein and wavelet methods show phase difference in almost the whole phase image. The performance of the Lee method is superior to the Goldstein and wavelet methods. However, the proposed method has the best performance among the four methods.
Quantitative assessments are listed in Table 2 in terms of the number of residues [34], the phase standard deviation (PSD) [11], the sum of phase difference (SPD) [35] and the root mean square error (RMSE) of the deformation phases. We can see the minimum residues, the minimum PSD value and the minimum SPD can be achieved by the proposed filter. The proposed method can reduce 92.09% residues, indicating that the proposed filter has better performance in phase denoising. It can also be seen that the proposed method has the smallest RMSE. From this point of view, the proposed filter shows better denoising and edge preserving ability.

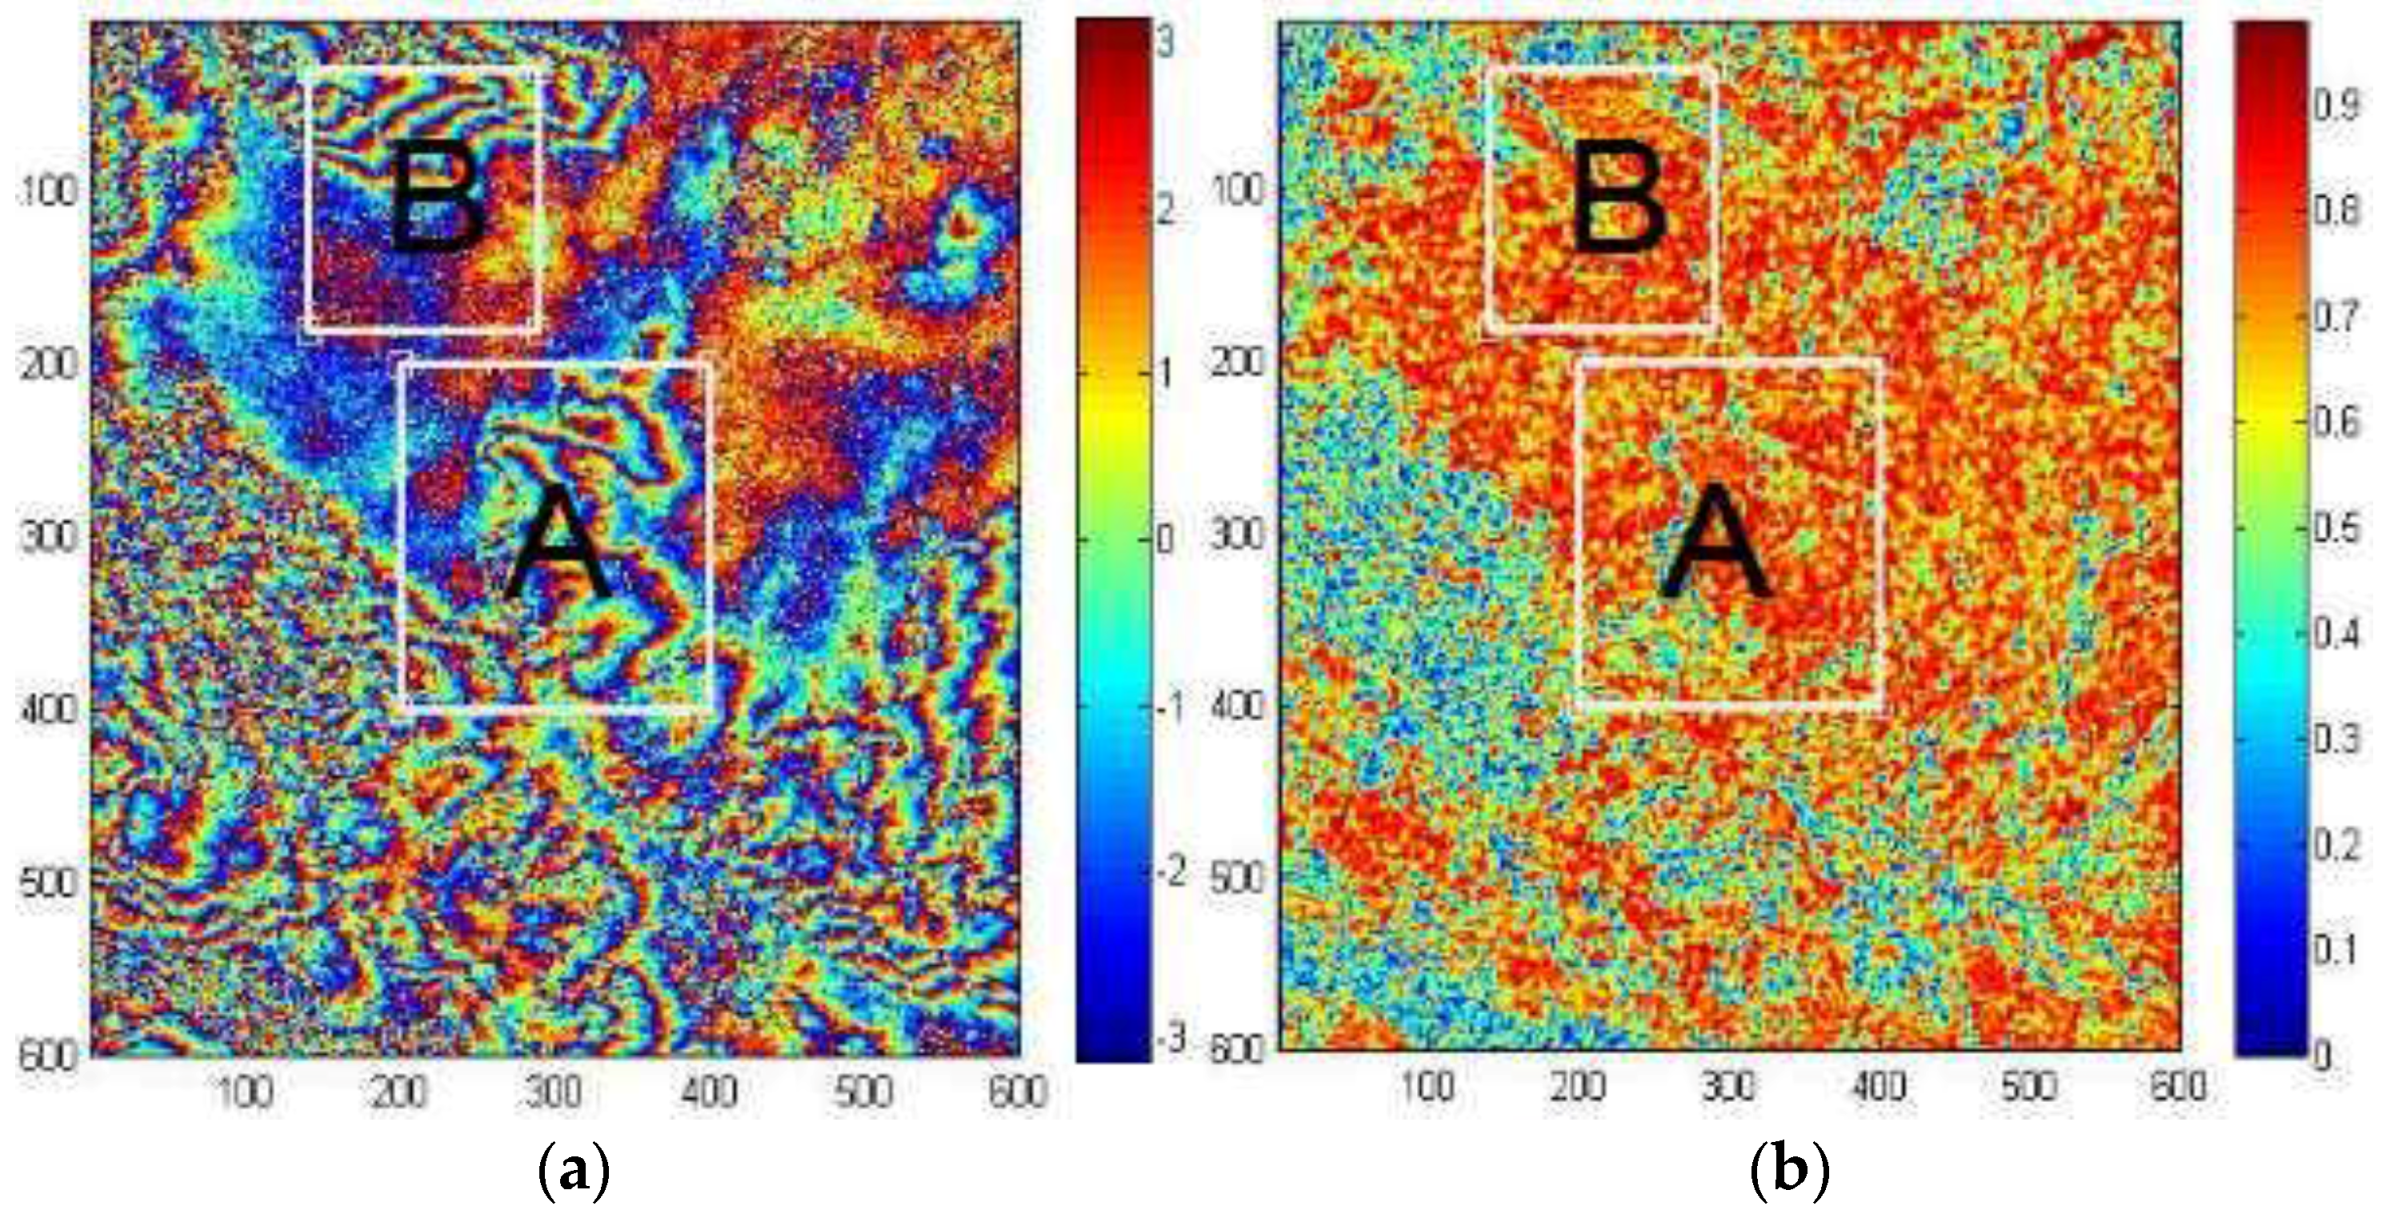
4.2. Validation with the Interferogram over Hong Kong

An interferogram over Hong Kong is used in this section to verify the proposed filter. The ERS pair was acquired on 18 and 19 March 1996. The baseline of the SAR ERS pair (Frame: 3159; Track: 404) is about 100 m. The SAR images are first processed by a multi-look operation (L = 5) in the azimuth direction to generate an interferogram with a resolution of about 20 × 20 m. The size of the area is 600 × 600 pixels. The interferogram and corresponding coherence map are shown in Figure 10.
The interferogram is filtered with the Goldstein filter, the wavelet filters and the proposed filter, separately, and their results are shown in Figure 11. Clearly, these methods have removed most noises. But the Goldstein filter causes damage to the fringe information in the image center (Figure 11(a1–a3)). The magnified filtering results in Figure 11(b2,b3) show the fringe details as poor, and the results in Figure 11(c2,c3) possess speckle noise. Comparison between our filtering result and the other three filtering results shows the proposed method has advantages in noise suppression and fringe preservation.
Estimated deformation phases obtained using the Goldstein, wavelet, Lee and the proposed methods are shown in Figure 12(a1–d1), respectively. The results of the proposed method are more similar to the real deformation phases than those of the other three methods.
Different values along the transect (shown as the black segment in Figure 12(a1–d1)) of the four different images are extracted (Figure 12(a2–d2)). The blue line is the true deformation phase, and the red line is the estimated deformation phase. It is clear the proposed method performs better.
For further analysis on denoising and details preservation, the number of residues, PSD, SPD and RMSE between the true and estimated deformation phases are listed in Table 3. About 81.56% residues have been reduced by the proposed filter. However, the equivalents for the Goldstein filter, wavelet filter and Lee filter are 64.08%, 77.34% and 73.04%, respectively. In addition, the proposed filter obtained the minimum PSD value and minimum SPD. As for the detail preservation, the deformation phase RMSE of the proposed method has the smallest value. The experimental results demonstrate the effectiveness of the proposed method in phase noise reduction and fringe detail preservation.

5. Discussion

This paper presented a shearlet threshold filtering method for SAR interferograms based on the coherence and look number of the interference phase. The phase information and noise can be separated more easily in the shearlet domain. The standard deviation is a function of coherence and look number, so we modified the threshold filter to incorporate information contained in these two parameters.
The proposed method was validated with both simulation data and real data. The simulated test shows that after applying the proposed model, RMSE values between true phases and the results of the Goldstein, the wavelet, the Lee and the proposed filters are 1.3715, 1.2196, 1.3439 and 1.0708 rad, respectively. The proposed filter got the closest results to the true phases in the simulation experiment. The real data results over the Etna volcano show that the residue reductions resulting from the Goldstein filter, wavelet filter and Lee filter are 45.73%, 71.87% and 76.61%, respectively, while the reduction resulting from the proposed filter is 92.09%. The real data results over Hong Kong show that the residue reductions resulting from the Goldstein filter, wavelet filter, and Lee filter are 64.08%, 77.34%, and 73.04%, respectively, while that from the proposed filter is 90.45%. The deformation phase RMSE of the proposed method has the smallest value. Furthermore, we can see that interference fringes of the proposed filter is clearer and with lower noise level, especially in low coherence regions. This indicates that the proposed filter is significantly superior to the other two filters.
The proposed filter is more consistent and robust because the shearlet filtering method has the time-frequency analysis capability and the filtering threshold is defined with the coherence and look number of the interference phase. Traditional wavelet filtering methods apply the wavelet coefficient, a rough estimate, to define the threshold in the interferogram, getting poor results in low coherence regions. Furthermore, shearlets’ mathematical properties can form a tight frame of well-localized waveforms at various scales and directions, and are optimally sparse in representing images with edges. These properties can maintain the edge information. In addition, shearlets have the ability to deal with nonstationary signals. The premise of the Goldstein filter is the unchanged phase frequency or stable statistical properties. Actually, the observed interferometric phase usually contains both stationary and nonstationary components. So a more sophisticated algorithm, such as the shearlet transforms, should be applied.
However, the proposed method also has drawbacks, such as the decomposition levels. The level of shearlet decomposition has great influence on denoising. We will therefore research the determination of decomposition levels in the future.

6. Conclusions

A novel filtering method, the proposed filter, for Synthetic Aperture Radar (SAR) interferograms with the shearlet threshold filtering based on the coherence and look number of the interference phase was proposed in this paper. This method analyzes the statistical characteristics of Interferometric Synthetic Aperture Radar (InSAR) interference phase, and combines the phase noise standard deviation with shearlet filter, which relates the filtering threshold to the coherence and look number of the interference phase. Verification experiments show that the proposed filter offers more accurate results and clearer interference fringes, and can improve the filtering precision. The proposed filter achieves very good filtering effects even in low coherence areas, and it has important application value for InSAR phase unwrapping and InSAR data processing. This will benefit the InSAR applications in seismic deformation, volcanic activity, glacial drift, urban settlement and landslides.

Acknowledgments

The work presented in the paper was supported by the Nature Science Foundation of China (No. 41531068, 41371335, 41274010, and 41671356), Nature Science Foundation of Hunan (No. 14JJ2131), Science research project of Hunan Provincial Department of Education (No. 13C345); Hunan Provincial Department of Education Science Research Key Project (No. 15A074); Yongzhou guiding science and technology projects application of InSAR in Ground Subsidence Observation.

Author Contributions

Yonghong He conceived the idea, designed the experiments, and wrote and revised the paper; Jianjun Zhu performed the shearlet experiments and revised the paper; Haiqiang Fu analyzed the experimental results and discussed the paper; Qinghua Xie analyzed the experimental results and revised the paper; Bing Xu performed the simulated experiments; Bing Zhang discussed the paper and drawn some of the figures.

Conflicts of Interest

The authors declare no conflict of interest.

References

  1. Berardino, P.; Fornaro, G.; Lanari, R. A new algorithm for surface deformation monitoring based on small baseline differential SAR interferograms. IEEE Trans. Geosci. Remote Sens. 2002, 40, 2375–2383. [Google Scholar] [CrossRef]
  2. Song, R.; Guo, H.; Liu, G.; Perski, Z.; Yue, H. Improved Goldstein SAR Interferogram Filter Based on Adaptive Neighborhood Technique. IEEE Geosci. Remote Sens. Lett. 2015, 12, 2114–2118. [Google Scholar]
  3. Wang, Y.; Huang, H.; Dong, Z.; Wu, M. Modified patch-based locally optimal Wiener method for interferometric SAR phase filtering. ISPRS J. Photogramm. Remote Sens. 2016, 114, 10–23. [Google Scholar] [CrossRef]
  4. Lin, X.; Li, F.; Meng, D.; Hu, D.; Ding, C. Nonlocal SAR Interferometric Phase Filtering Through Higher Order Singular Value Decomposition. IEEE Geosci. Remote Sens. Lett. 2015, 12, 806–810. [Google Scholar] [CrossRef]
  5. Suo, Z.; Zhang, J.; Li, M.; Zhang, Q. Improved InSAR Phase Noise Filter in Frequency Domain. IEEE Trans. Geosci. Remote Sens. 2016, 54, 1185–1195. [Google Scholar] [CrossRef]
  6. Lee, J.S.; Papathanassiou, K.P.; Ainsworth, T.L.; Grunes, M.R.; Reigber, A. A new technique for noise filtering of SAR interferometric phase images. IEEE Trans. Geosci. Remote Sens. 1998, 36, 1456–1465. [Google Scholar]
  7. Chao, C.F.; Chen, K.S.; Lee, J.S. Refined filtering of interferometric phase from InSAR data. IEEE Trans. Geosci. Remote Sens. 2013, 51, 5313–5323. [Google Scholar] [CrossRef]
  8. Fu, S.H.; Long, X.J.; Xia, Y. Directionally adaptive filter for synthetic aperture radar interferometric phase images. IEEE Trans. Geosci. Remote Sens. 2013, 51, 552–559. [Google Scholar] [CrossRef]
  9. Baselice, F.; Ferraioli, G.; Pascazio, V.; Schirinzi, G. Joint InSAR DEM and deformation estimation in a Bayesian framework. In Proceedings of the 2014 IEEE Geoscience and Remote Sensing Symposium (IGARSS), Quebec City, QC, Canada, 13–18 July 2014; pp. 398–401.
  10. Danudirdjo, D.; Hirose, A. InSAR image regularization and DEM error correction with fractal surface scattering model. IEEE Trans. Geosci. Remote Sens. 2015, 53, 1427–1439. [Google Scholar] [CrossRef]
  11. Goldstein, R.M.; Werner, C.L. Radar Interferogram Filtering for Geophysical Application. Geophys. Res. Lett. 1998, 25, 4035–4038. [Google Scholar] [CrossRef]
  12. Baran, I.; Stewart, M.P.; Kampes, B.M. A Modification to the Goldstein Radar Interferogram Filter. IEEE Trans. Geosci. Remote Sens. 2003, 41, 2114–2118. [Google Scholar] [CrossRef]
  13. Li, Z.W.; Ding, X.L.; Huang, C. Improved filtering parameter determination for the Goldstein radar interferogram filter. ISPRS J. Photogramm. Remote Sens. 2008, 63, 621–634. [Google Scholar] [CrossRef]
  14. Wang, Q.S.; Huang, H.F.; Yu, A.X.; Dong, Z. An efficient and adaptive approach for noise filtering of SAR interferometric phase images. IEEE Trans. Geosci. Remote Sens. Lett. 2011, 8, 1140–1144. [Google Scholar] [CrossRef]
  15. Ferretti, A.; Fumagalli, A.; Novali, F.; Prati, C. A new algorithm for processing interferometric data-stacks: SqueeSAR. IEEE Trans. Geosci. Remote Sens. 2011, 49, 3460–3470. [Google Scholar] [CrossRef]
  16. Parizzi, A.; Brcic, R. Adaptive InSAR stack multilooking exploiting amplitude statistics: A comparison between different techniques and practical results. IEEE Trans. Geosci. Remote Sens. Lett. 2011, 8, 441–445. [Google Scholar] [CrossRef]
  17. Fornaro, G.; Reale, D.; Verde, S. Adaptive spatial multilooking and temporal multilinking in SBAS interferometry. In Proceedings of the IEEE International Geoscience and Remote Sensing Symposium (IGARSS), Munich, Germany, 22–27 July 2012; pp. 1892–1895.
  18. Pepe, A.; Yang, Y.; Manzo, M.; Lanari, R. Improved EMCF-SBAS processing chain based on advanced techniques for the noise-filtering and selection of small baseline multi-look DInSAR interferograms. IEEE Trans. Geosci. Remote Sens. 2015, 53, 4394–4417. [Google Scholar] [CrossRef]
  19. Martinez, C.L.; Canovas, X.F.; Chandra, M. SAR interferometric phase noise reduction using wavelet transform. Electron. Lett. 2001, 37, 649–651. [Google Scholar] [CrossRef]
  20. Martínez, C.L.; Fàbregas, X. Modeling and reduction of SAR interferometric phase noise in the wavelet domain. IEEE Trans. Geosci. Remote Sens. 2003, 40, 2553–2566. [Google Scholar] [CrossRef]
  21. Zha, X.; Fu, R.; Dai, Z.; Liu, B. Noise reduction in interferograms using the wavelet packet transform and Wiener filtering. IEEE Geosci. Remote Sens. Lett. 2008, 5, 404–408. [Google Scholar]
  22. Abdallah, W.B.; Abdelfattah, R. Two-dimensional wavelet algorithm for interferometric synthetic aperture radar phase filtering enhancement. J. Appl. Remote Sens. 2015, 9, 096061. [Google Scholar] [CrossRef]
  23. Xu, G.; Xing, M.; Xia, X.; Zhang, L.; Liu, Y.; Bao, Z. Sparse regularization of interferometric phase and amplitude for In SAR image formation based on Bayesian representation. IEEE Trans. Geosci. Remote Sens. 2015, 53, 2123–2136. [Google Scholar] [CrossRef]
  24. Easley, G.; Labate, D.; Lim, W.Q. Sparse directional image representations using the discrete shearlet transform. Appl. Comput. Harmon. Anal. 2008, 25, 25–46. [Google Scholar] [CrossRef]
  25. Zebker, H.A.; Villasenor, J. Decorrelation in interferometric radar echoes. IEEE Trans. Geosci. Remote Sens. 1992, 30, 950–959. [Google Scholar] [CrossRef]
  26. Martinez, C.L.; Pottier, E. On the extension of multidimensional speckle noise model from single-look to multilook SAR image. IEEE Trans. Geosci. Remote Sens. 2007, 45, 305–320. [Google Scholar] [CrossRef]
  27. Lee, J.S.; Hopple, K.W.; Mango, S.A.; Miller, R. Intensity and phase statistics of multilook polarimetric interferometric SAR imagery. IEEE Trans. Geosci. Remote Sens. 1994, 32, 1017–1028. [Google Scholar]
  28. Sarabandi, K. Derivation of phase statistics from the Müeller matrix. Radio Sci. 1992, 27, 553–560. [Google Scholar] [CrossRef]
  29. Li, Z.W.; Ding, X.L.; Zheng, D.W. Least squares-based filter for remote sensing image noise reduction. IEEE Trans. Geosci. Remote Sens. 2008, 46, 2044–2049. [Google Scholar] [CrossRef]
  30. Chen, Y.; Xu, H. Comparisons of Speckle Noise Filtering Methods on Interferometric Synthetic Aperture Radar Images. J. Comput. 2014, 9, 908–915. [Google Scholar] [CrossRef]
  31. Cunha, A.L.; Zhou, J.; Do, M.N. The Nonsubsampled Contourlet Transform: Theory, Design, and Applications. IEEE Trans. Image Process. 2006, 15, 3089–3101. [Google Scholar] [CrossRef] [PubMed]
  32. Chen, X.; Deng, C.; Wang, S. Shearlet-Based Adaptive Shrinkage Threshold for Image Denoising. In Proceedings of the International Conference on E-Business and E-Government (ICEE 2010), Guangzhou, China, 7–9 May 2010.
  33. Zhang, B.; Sun, L.X.; Yu, H.B.; Xin, Y.; Cong, Z.B. A method for improving wavelet threshold denoising in laser-induced breakdown spectroscopy. Spectrochim. Acta B 2015, 107, 32–44. [Google Scholar] [CrossRef]
  34. Ghiglia, D.C.; Pritt, M.D. Two-Dimensional Phase Unwrapping: Theory, Algorithms, and Software; Wiley: New York, NY, USA, 1998. [Google Scholar]
  35. Li, Z.L.; Zou, W.B.; Ding, X.L.; Chen, Y.Q. A quantitative measure for the quality of InSAR interferograms based on phase differences. Photogramm. Eng. Remote Sens. 2004, 70, 1131–1137. [Google Scholar] [CrossRef]
Figure 1. (a) Phase distribution for | r | = 0.1 ~ 0.9 and phase φ x = 0 ; (b) Phase standard deviation versus coherence ( L indicates the multi-look number).
Applsci 07 00141 g001
Figure 2. Frequency supports for different values of a and s ( a is the scale parameter, s is the shear parameter).
Applsci 07 00141 g002
Figure 3. Flow chart of the proposed method.
Applsci 07 00141 g003
Figure 4. (a) Simulated noise-free phase; (b) corresponding coherence map; (c) simulated noisy phase. A and B, labeled by white rectangles, indicates the enlarged areas.
Applsci 07 00141 g004
Figure 5. Filtered results of simulated data with (a1) Goldstein; (b1) wavelet; (c1) Lee; (d1) the proposed method; (a2d2) Close-up of results of area A in Figure 4; (a3d3) Close-up of results of area B in Figure 4; the black line in (a1d1) indicates the extracted section. (Unit: rad).
Applsci 07 00141 g005
Figure 6. Cross-section over the phases filtered by the Goldstein filter, wavelet filter, Lee filter and the proposed filter. The location of the cross-section is shown in Figure 5(a1–d1).
Applsci 07 00141 g006
Figure 7. (a) Interferometric phase; and (b) corresponding coherence map over Mt Etna Volcano, Italy. A and B, labeled by white rectangles, indicates the enlarged areas.
Applsci 07 00141 g007
Figure 8. Filtering results of (a1) Goldstein filter; (b1) wavelet filter; (c1) Lee filter; and (d1) the proposed filter; (a2d2) Close-up of results of area A in Figure 7; (a3d3) Close-up of results of area B in Figure 7. (Unit: rad).
Applsci 07 00141 g008
Figure 9. Deformation results of (a) true deformation phase; (b) the Goldstein filter; (c) the wavelet filter; and (d) the Lee filter; (e) the proposed filter. (Unit: rad).
Applsci 07 00141 g009
Figure 10. (a) Original interferogram; and (b) corresponding coherence map over Hong Kong. A and B, labeled by white rectangles, indicates the enlarged areas.
Applsci 07 00141 g010
Figure 11. Interferogram over Hong Kong filtered by (a1) the Goldstein filter; (b1) the wavelet filter; and (c1) Lee filter; (d1) the proposed filter; (a2d2) Close-up of the results of area A in Figure 10; (a3d3) Close-up of results of area B in Figure 10. (Unit: rad).
Applsci 07 00141 g011aApplsci 07 00141 g011b
Figure 12. Deformation results of (a1) the Goldstein filter; (b1) the wavelet filter; (c1) the Lee filter; and (d1) the proposed filter; (a2d2) Cross-section over the estimated deformation phase; the location of the cross-section is shown in (a1d1). (Unit: rad).
Applsci 07 00141 g012aApplsci 07 00141 g012b
Table 1. Look-up table of phase standard deviations versus coherences and multi-look number.
CoherenceMulti-Look Number
12345678910...
0.0011.8131.8131.8131.8121.8121.8121.8121.8111.8111.811...
0.0021.8121.8121.8111.8101.8101.8091.8091.8091.8081.808...
0.0031.8121.8101.8091.8081.8081.8071.8071.8061.8051.805...
0.0041.8111.8091.8081.8071.8061.8051.8041.8031.8031.802...
0.0051.8101.8081.8061.8051.8031.8021.8011.8011.8001.799...
0.0061.8091.8061.8041.8031.8011.8001.7991.7981.7971.796...
0.0071.8081.8051.8031.8011.7991.7981.7961.7951.7941.793...
0.0081.8071.8041.8011.7991.7971.7951.7941.7921.7971.790...
0.0091.8061.8021.8001.7971.7951.7931.7911.7901.7881.787...
0.0101.8051.8011.7981.7951.7931.7911.7891.7871.7851.784...
....................................
Table 2. Quantitative evaluation with the real data over Etna volcano, PSD: the phase standard deviation; SPD: the sum of phase difference, RMSE: the root mean square error.
FilterPositive Residues Negative ResiduesResidue Reduction (%)PSD (×105)SPD (×105)RMSE
Unfiltered10,00510,008-3.42542.5439-
Goldstein5430543145.732.53041.99450.2820
Wavelet2817282471.811.97731.72580.1824
Lee2339234276.611.86471.61190.1705
Proposed79079292.091.39521.32230.1693
Table 3. Quantitative evaluation with real data over Hong Kong.
FilterPositive Residues Negative ResiduesResidue Reduction (%)PSD (×105)SPD (×105)RMSE
Unfiltered99019905-6.17534.5503-
Goldstein3556355964.083.42752.69370.1711
Wavelet2248224177.342.82162.36290.1499
Lee2667267173.043.34032.73150.1117
Proposed1825182681.562.50542.21580.0979

