Article

Numerical Analysis and Optimization on Piezoelectric Properties of 0–3 Type Piezoelectric Cement-Based Materials with Interdigitated Electrodes

1
School of Civil Engineering, Qingdao University of Technology, Qingdao 266033, China
2
Collaborative Innovation Center of Engineering Construction and Safety, Shandong Blue Economic Zone, Qingdao 266033, China
3
Dongying Zhu Cheng Architectural Design Co. Ltd., Dongying257091, China
4
Shandong Engineering Research Center for Concrete Structure Durability, Qingdao University of Technology, Qingdao 266033, China
*
Author to whom correspondence should be addressed.
Appl. Sci. 2017, 7(3), 233; https://doi.org/10.3390/app7030233
Submission received: 19 November 2016 / Revised: 15 February 2017 / Accepted: 23 February 2017 / Published: 1 March 2017
(This article belongs to the Special Issue Structural Health Monitoring (SHM) of Civil Structures)

Abstract

:
The health conditions of complicated concrete structures require intrinsic cement-based sensors with a fast sensing response and high accuracy. In this paper, static, modal, harmonic, and transient dynamic analyses for the 0–3 type piezoelectric cement-based material with interdigitated electrodes (IEPCM) wafer were investigated using the ANSYS finite element numerical approach. Optimal design of the IEPCM was further implemented with electrode distance (P), electrode width (W), and wafer density (H) as the main parameters. Analysis results show that the maximum stress and strain in the x-polarization direction of the IEPCM are 2.6 and 3.19 times higher than that in the y-direction, respectively; there exists no repetition frequency phenomenon for the IEPCM. These indicate 0–3 type IEPCM possesses good orthotropic features, and lateral driving capacity notwithstanding, a hysteresis effect exists. Allowing for the wafer width (Wp) of 1 mm, the optimal design of the IEPCM wafer arrives at the best physical values of H, W and P are 6.2, 0.73 and 1.02 mm respectively, whereas the corresponding optimal volume is 10.9 mm3.

Graphical Abstract

1. Introduction

The health status of modern concrete infrastructures requires considerable intrinsic cement-based sensors for real-time monitoring [1,2,3]. The electrical properties of these sensors are frequently employed as sensing signals reflecting the stress or strain under external static and or dynamic loadings of the cement concrete matrix which is incorporated with some microscale or nano scale additives, such as carbon fibers (CFs), carbon nanotubes (CNTs) [4,5,6,7,8,9,10], or lead zirconate titanate (PZT) powder [11,12,13,14,15,16]. As Li et al. [11,15], Huang et al. [12], Chaipanich et al. [13], Luo et al. [14], Gong et al. [16], Lan et al. [17], Song et al. [18,19,20], and Jaitanong et al. [21] reported, the 0–3 type piezoelectric cement-based composite (PCM) wafer has excellent piezoelectric self-sensing and self-driving responses, and a good compatibility with long-life concrete. Therefore, it is easy to realize the fine regulation of performance indicators through changing the fillers’ contents [14]. These superior features render PCMs, after curing and waterproof encapsulation, as novel candidates of sensors/actuators embedded in concrete-based infrastructures for structural health monitoring (SHM) [15].
Nevertheless, the driving performance in the non-polarized direction of the 0–3 type PCM is not so strong and it cannot produce enough stress or displacement in a specific direction for engineering needs [19,20]. Owing to interdigitated electrode (IE) technology, the polarization direction of the piezoelectric device with IEs is the same as the voltage-driving one, rendering a great improvement of the in-plane strain/stress-driving capacity, and obvious orthotropic features [22,23,24,25,26,27,28]. Zhang et al. [22] documented that the 1–3 type PCM with IEs possessed a high piezoelectric constant and superior orthotropic features with different receiving sensitivities for the stress waves from orthogonal directions. Hagood et al. [23,24] studied the piezoelectric characteristics of a pure PZT wafer with IEs and its application criteria by simulating the method. Roundy et al. [25] found that the harmonic resonant frequency of a PZT sheet with IEs is small and the resonance is more likely to happen, but its electromechanical coupling coefficient is lower than that of the general PZT. Lin et al. [26] reported that the narrow electrode finger spacing, thin interlayer, small fiber thickness, and high volume fraction of a piezoelectric ceramic fiber were all positive with the enhancement of the free strain performance of the piezoelectric fiber composite with IEs. Liu et al. [27] reported that the electrospinning of polyvinylidene fluoride (PVDF) and a CNT piezoelectric nanofiber array on IEs fabricated a flexible sensing device, and found that PVDF/CNT crystallization as spherical composite structures can enhance the piezoelectric properties of PVDF fibers and effectively convert the mechanical energies of low-frequency ambient vibrations and impacts into electrical signals. Chidambaram et al. [28] studied the converse mode piezoelectric coefficient for PZT thin film with IEs, where the film with IEs showed a lower average piezoelectric stress than that with parallel-plate electrode, and effectively prevented cracking. However, to the best knowledge of the authors, there is no research work on the use of the IE technique in 0–3 type PCMs, and no exploration into the orthotropic and driving properties of the corresponding PCM. The 0–3 type PCM with IEs (IEPCM) indeed can be regulated with almost the same durability, Young’s modulus and acoustic impedance as concrete structures, and it effectively makes up for the deficiencies and defects in the engineering application of the common piezoelectric element. Meanwhile, as mentioned above [19,22], the finite element software ANSYS is a powerful tool for simulating and analyzing static and dynamic responses of diversified materials on multi-field coupling problems.
In this work, we utilized ANSYS to simulate the sensing, driving, and orthotropic properties of the 0–3 type IEPCM, including static stress/strain, modal vibration, harmonic response and transient dynamic analysis. The final pitch at the center of the electrode (P), the electrode width (W), and the thickness (H) as the design variables for the optimal design of the IEPCM were also investigated. These studies not only effectively strengthen the piezoelectric sensing and or driving capacity mechanism of the 0–3 type IEPCM, but also provide guidelines for future experimental design. The ultimate goal is to improve the self-sensing and driving performances in a specific direction of the 0–3 type IEPCM. In the meantime, the outcomes of this study should meet the in situ detection requirements of complicated concrete structures and widen the applications of the IEPCM in SHM.

2. Methodology

2.1. Establishment of Characteristic Matrix of IEPCM

Due to the absence of piezoelectric capacity for the cement-based material, the piezoelectric property of IEPCM is up to that of the PZT powders [22]. That is, the higher the doping of PZT powder content acquires the better piezoelectric properties. Allowing for the requirements of the mechanical toughness and compatibility to concrete for the composite materials, we launched the simulation of the 0–3 type PCM mainly consisting of PZT-4 type powder and525-type sulphur aluminate cement by volume mixing ratio as 0.75:0.25. The polarization direction in the x-axis is set as positive, and conductive silver paste is coated on the top surface of PCM rectangular solid wafer as IEs pattern in the x-axis, as illustrated in Figure 1. The elastic stiffness coefficient matrix (c), dielectric constant matrix (ε) and piezoelectric stress constant matrix (e) of the IEPCM obtained by using ANSYS can be correspondingly given as follows [21].
The piezoelectric constant d33 of the IEPCM is calculated by the parallel model formula, as expressed in Equation (1),
d 33 = V 1 d 33 1 s 33 2 + V 2 d 33 2 s 33 1 V 1 s 33 2 + V 2 s 33 1
where V1 and V2 denotes the volume fraction of the component 1 (piezoelectric phase) and component 2 (hydrated cement phase); s 33 1 and s 33 2 is the elastic compliance constant of component 1 (piezoelectric phase) and 2 (hydrated cement phase), respectively. Allowing that the cement base phase has no any piezoelectric properties, the piezoelectric constant d33 of IEPCM means the piezoelectric constant d 33 1 of piezoelectric ceramic.
According to the series model formula of composite materials, we can get the dielectric constant of IEPCM, as shown in Equation (2).
ε = V 1 ε 1 + V 2 ε 2
where ε 1 and ε 2 denotes the dielectric constant of piezoelectric phase and hydrated cement paste, respectively.
The relative dielectric constant of common cement phase is around five, which is sufficiently small when compared with the piezoelectric ceramic. Therefore, the contribution of ε 2 can be neglected and thus the dielectric constant of IEPCM becomes ε = V 1 ε 1 .
Similarly, the elastic stiffness coefficient of IEPCM is proportional to the elastic modulus of the two phases, and can also be acquired by the series model formula of composite materials, as given by
c = c 1 V 1 E 1 + c 2 V 2 E 2 V 1 E 1 + V 2 E 2
where c1, c2 is the elastic stiffness coefficients of the piezoelectric and cement phase, respectively; E1 and E2 represents the corresponding elastic modulus, respectively.
The E1 and E2 of piezoelectric and cement phase is generally equal to 76.5 and 25 GPa, respectively. The E2 value is comparable to E1, which is not to be neglected, but the coefficient of stiffness matrix of cement phase can be omitted when compared with that of the piezoelectric phase. The elastic stiffness coefficients of IEPCM can be represented by
c = c 1 V 1 E 1 V 1 E 1 + V 2 E 2
The density of IEPCM is set as 7600 kg/m3, and three coefficients in the c, ε, and e matrices of PZT-4-type piezoelectric ceramics are selected in accordance to Reference [22].The corresponding c, ε, and e matrix of IEPCM in ANSYS simulation system are calculated by Equations (1)–(4), and the results are shown in Table 1, Table 2 and Table 3, respectively. It is worth to pointing out, the encoding sequence of c, e is consistent to the order of the input parameters in ANSYS.

2.2. Piezoelectric Constitutive Equation of IEPCM

The direction 1, 2, 3 of IEPCM is set as parallel to the z-axis, y-axis, and x-axis, respectively. Since the interdigitated finger electrode alternately appears on the same surface with the positive and negative electrodes (as shown in Figure 1), it makes the polarization centerline of the left half part electrode points to the negative direction of the x-axis, and the polarization centerline of other part points to the positive. Here, first, the polarized direction pointing to the positive part of the x-axis is considered. The piezoelectric equations related with the stress (T) and electric displacement (D) under the unconstrained boundary conditions and short-circuit state are constructed supposed the strain S and the electric field intensity E as independent variables. The constitutive relation between D, T matrix and S, E matrix are shown in Equations (5), (6-1) and (6-2), respectively. Second, if the constant values in Table 2 are taken as opposite ones, the corresponding piezoelectric equations with the polarized direction points to the negative part of the x-axis can also be constructed.
{ T = c E S e E D = e t S + ε s E
[ T 1 T 2 T 3 T 4 T 5 T 6 ] = [ c 33 E c 33 E c 33 E 0 0 0 c 33 E c 33 E c 33 E 0 0 0 c 33 E c 33 E c 33 E 0 0 0 0 0 0 c 66 E 0 0 0 0 0 0 c 44 E 0 0 0 0 0 0 c 44 E ] [ S 1 S 2 S 3 S 4 S 5 S 6 ] [ e 33 0 0 e 31 0 0 e 31 0 0 0 0 0 0 0 e 15 0 e 15 0 ] [ E 1 E 2 E 3 ]
[ D 1 D 2 D 3 ] = [ e 33 e 31 e 31 0 0 0 0 0 0 0 0 e 15 0 0 0 0 e 15 0 ] [ S 1 S 2 S 3 S 4 S 5 S 6 ] + [ ε 33 S 0 0 0 ε 11 S 0 0 ε 11 S ] [ E 1 E 2 E 3 ]

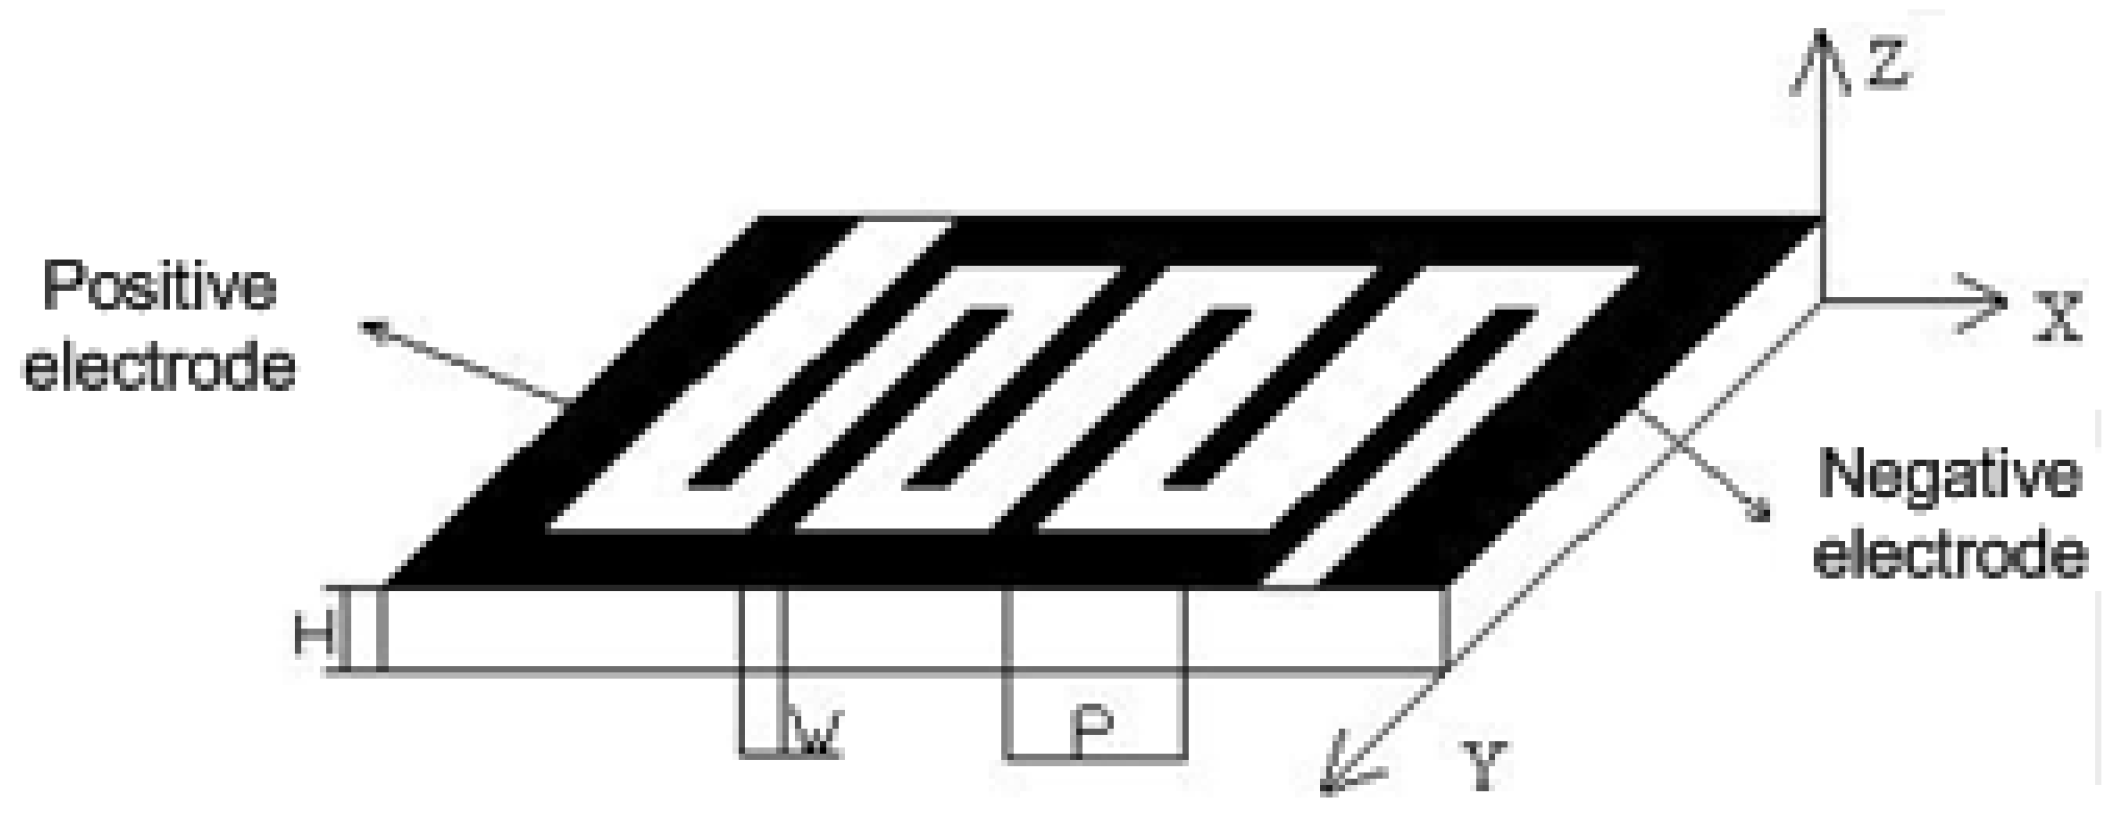
2.3. Modeling of IEPCM

(1)
Establishment of material model—the same solid 226-type element is employed to establish two material models. The matrix coefficients shown in Table 1, Table 2 and Table 3 are fed into ANSYS software in sequence, and to establish the material model 1 with the polarized direction pointing to the positive part of the x-axis. The material model 2 can be constructed by feeding with opposite values in Table 2 and the same values in Table 1 and Table 3.
(2)
Establishment of geometric model—a small rectangle with length (L) of 0.00025 m, width (B) of 0.01 m and H of 0.001 m is established. Two hundred rectangles are copied along the positive direction of x-axis, an integrity rectangle are grown up with L of 0.05 m. Moreover, the W, P of this IEPCM is designed as 0.00025 m, 0.0001 m, respectively.
(3)
Grid meshing—the material model 1 and model 2 is selected and defined, the unit size is divided, and grid meshed, respectively.
(4)
Voltage load applying—voltage load (0 V, 10 V) is applied onto the negative, positive electrodes, in turn. For simplification, the main supporting parts of positive and negative electrodes are neglected in this simulation.

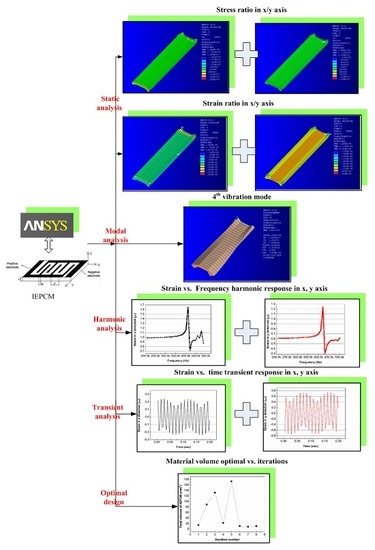
3. Static/Dynamic Response Characteristics of IEPCM

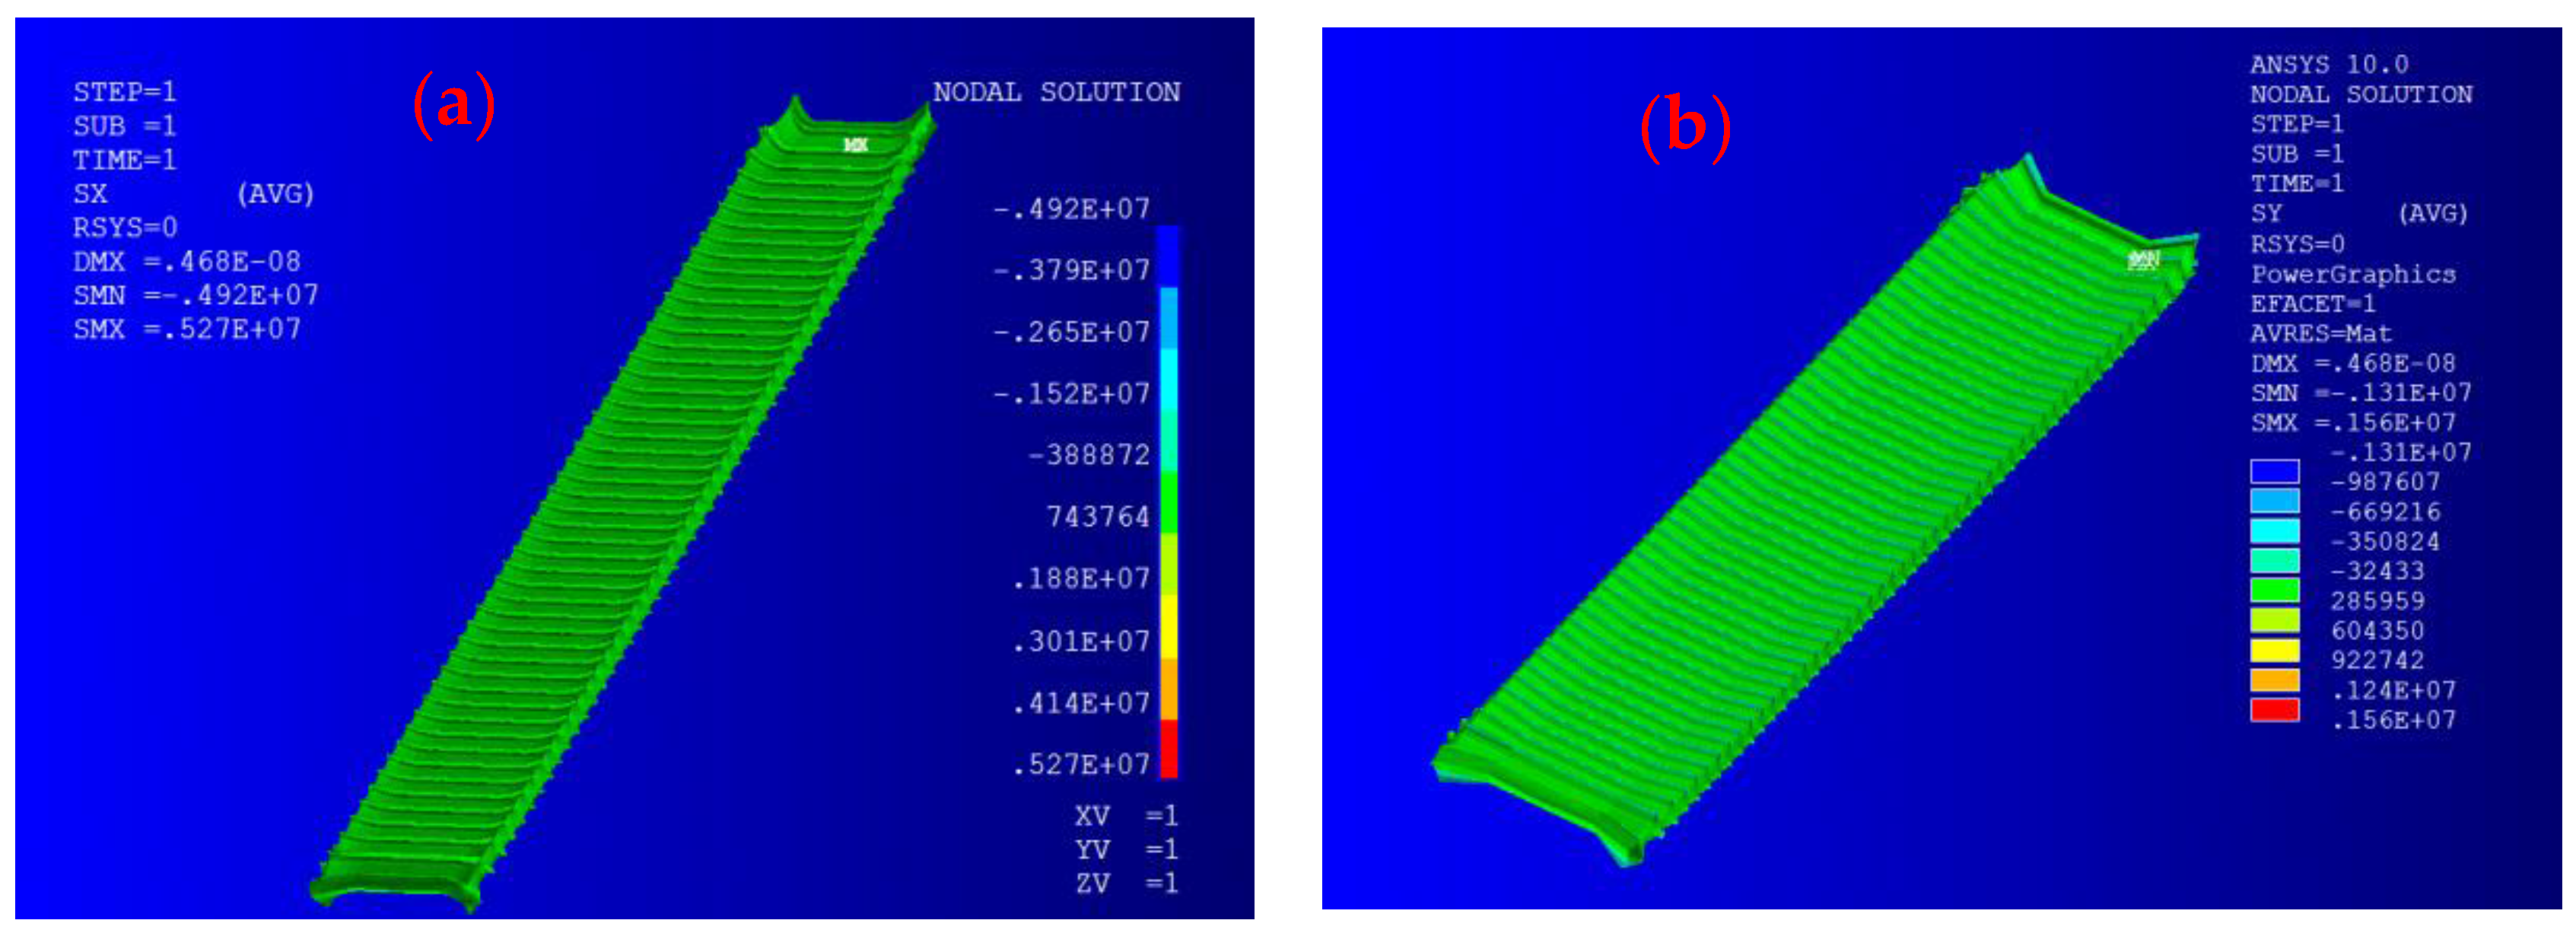
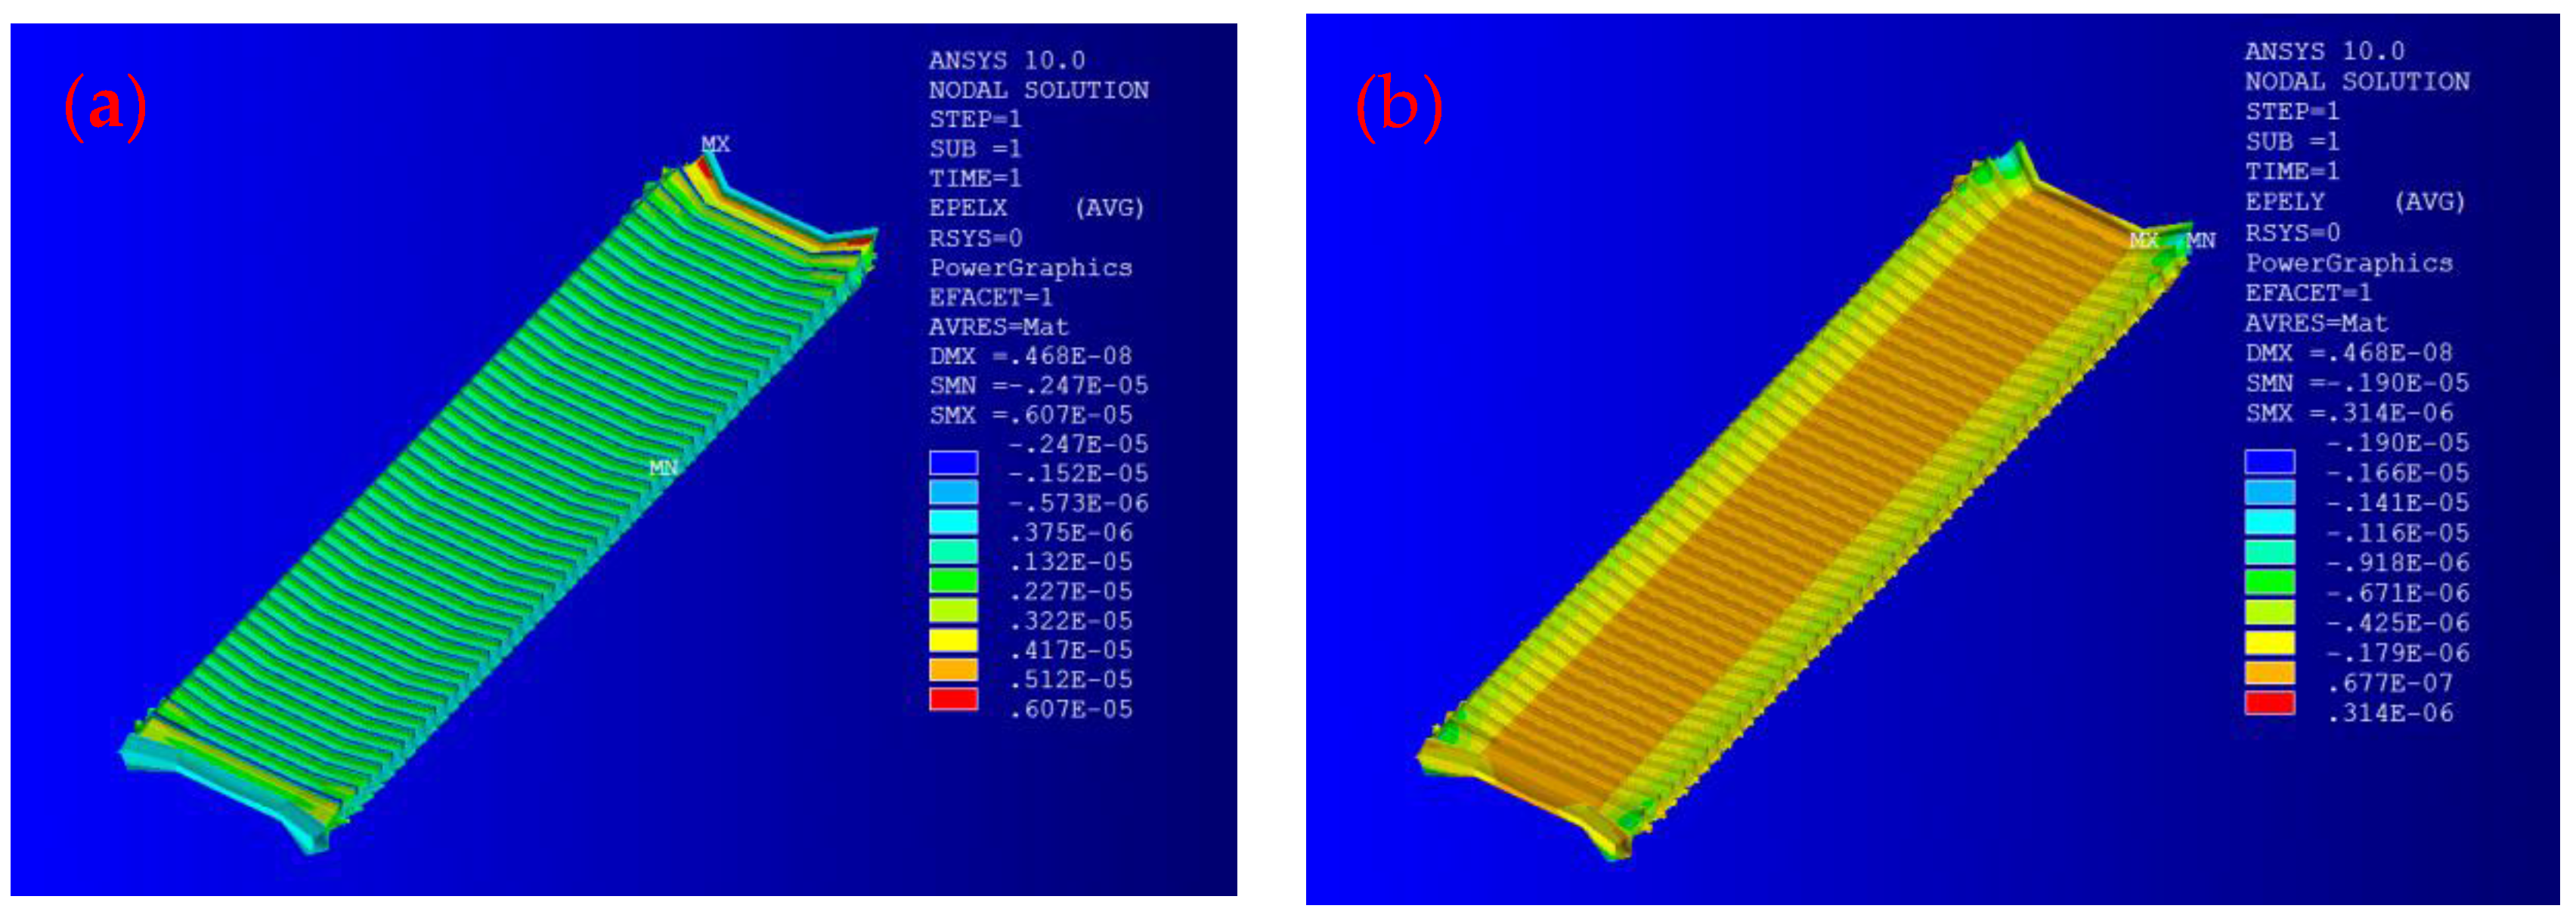
3.1. Static Response Analysis of IEPCM

Here, the ratio of the transverse stress and strain of the IEPCM in the y-axis to the corresponding longitudinal ones in the x-axis are focused on. The static stress and strain distributions in the x- and y-direction of the IEPCM are shown in Figure 2a,b and Figure 3a,b.
The maximum stress in the x-direction was 3.41 MPa, and it appeared on both ends of the IEPCM as shown in Figure 2a,b. Moreover, most of the stresses were about 0.704 MPa. The maximum stress in the y-direction was 1.31 MPa, and it also appeared on both ends of the IEPCM. Obviously, the corresponding IEPCM showed different driving stress responses in the transverse and longitudinal directions. As can be seen from Figure 3a,b, the maximum strain of the IEPCM in the x-direction was 6.07 με, and it appeared on both ends. In the middle region, the strain from the left to right sides between neighboring electrodes was altered from a high to low value, and the maximum value was 2.47 με. The maximum strain in the y-direction was 0.918 με, also appearing on both ends. In the middle region, the strain from the upper and lower sides between neighboring electrodes was also altered from a high to low value, and the maximum strain value was 1.16 με. The maximum strain ratio in the x-, y-direction at both ends, and in the middle region of the IEPCM, was 3.19, 2.69, respectively. It shows that there is a great difference between the transverse and the longitudinal strain, which presents an obvious orthotropic characteristic and can effectively meet the basic requirements of engineering needs as well.
Through numerical analysis of half the local area between a pair of opposite electrodes of an interdigitated piezoelectric element, Hagood et al. found that there are quite different results between the full model and local area because the latter ignored the influence from the other part [24]. Here, a numerical simulation on the static analysis between neighboring electrodes of the IEPCM was also studied in order to compare the difference between the full model and local area.
The static analysis results show that the maximum stress in the x- and y-direction in the full model were both about three times larger than those in local area just between neighboring electrodes, which shows that the size change in the x-direction has a significant influence on the stress distributions in the x- or y-direction. However, the maximum strain in the x- and y-direction in the full model are just 6.59%, 1.04% larger than that between neighboring electrodes, respectively, which indicates that the size change in the x-direction has little influence on the strain distributions in the x- and y-direction.
Therefore, during the next numerical analysis and optimal design of the IEPCM, in order to reduce the simulation time under the prerequisite of ensuring good quality and enhance the calculation efficiency, the full model of the IEPCM is simplified into the local area between neighboring electrodes. Supposing the driving strains in the x-direction are the state variables, the optimal results for the control variables W, P, and the thickness of H can be acquired.

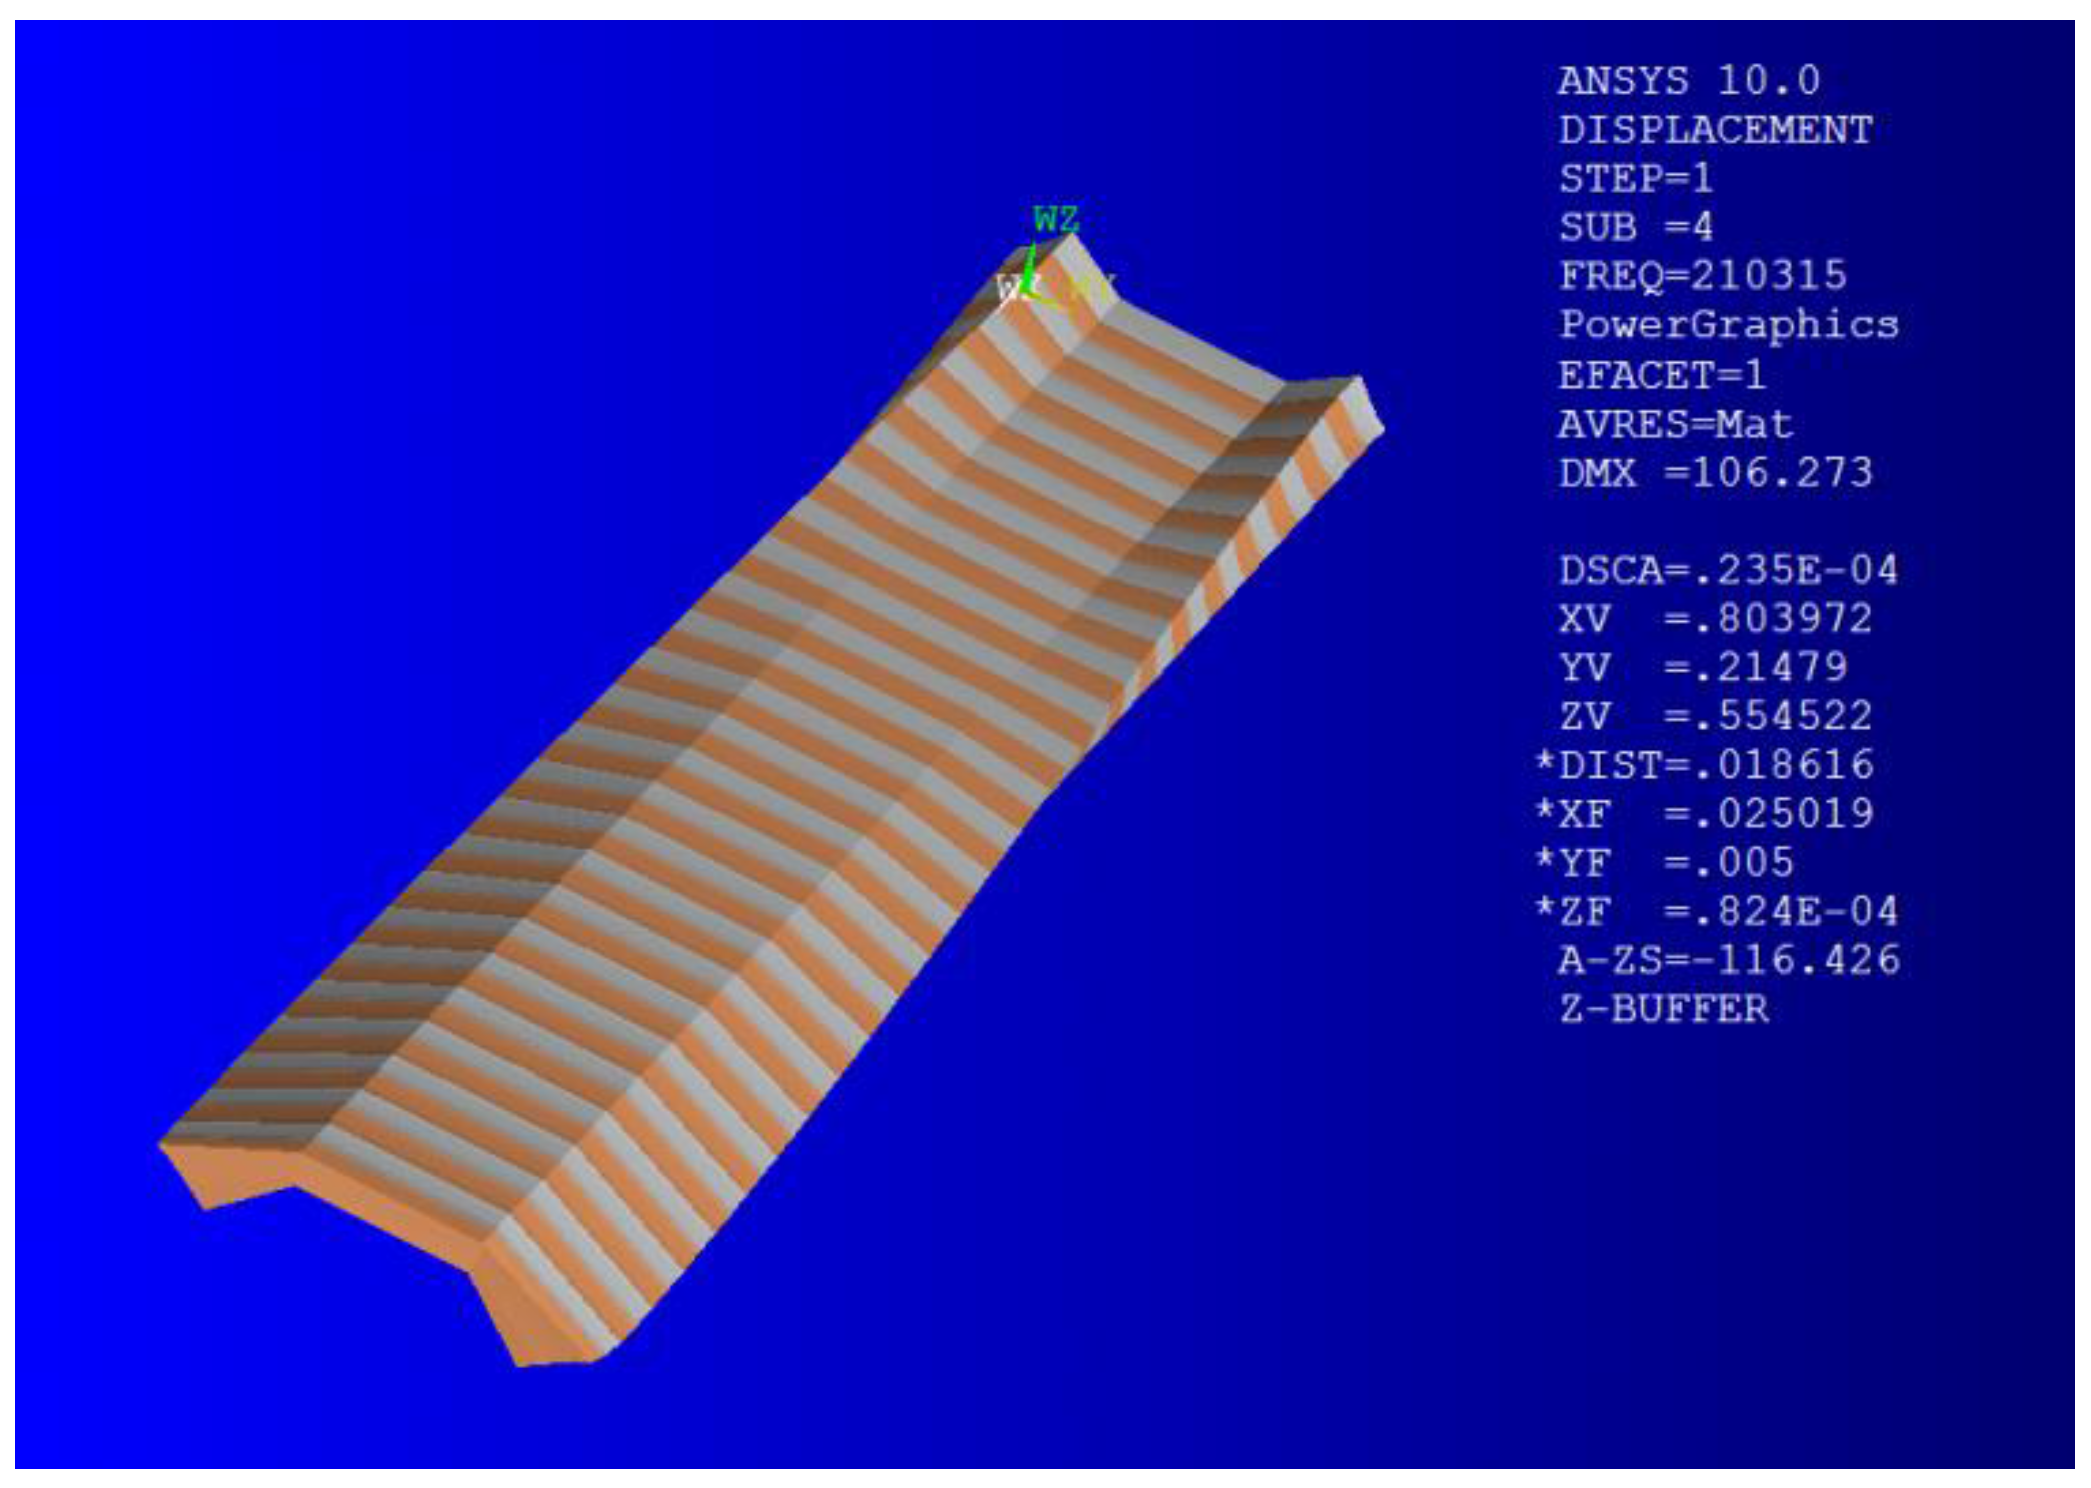
3.2. Modal Analysis of IEPCM

In fact, the vibration characteristics of a structure, such as the vibration shape, and the modal frequency can be extracted through modal analysis, and when its natural frequency has no repeated phenomenon, it indicates that its principal mode is orthogonal. Here, the lower surface of the IEPCM is fixed, the applied voltage between the upper and lower surface is defined to be 0 V, and then its modal analysis with first 40 order frequencies is analyzed by the modal frequency ranging from 10 kHz to 300 kHz. Figure 4 shows the fourth-order vibration mode of the IEPCM.
It is not difficult to observe from Figure 4 that the modal frequency of the IEPCM appears starting from 200 kHz, and the resonance frequency is 210.3 kHz. The frequency distribution is crowded together, but there is no repeated frequency phenomenon, which implies that the principal mode of the IEPCM is orthogonal [19].

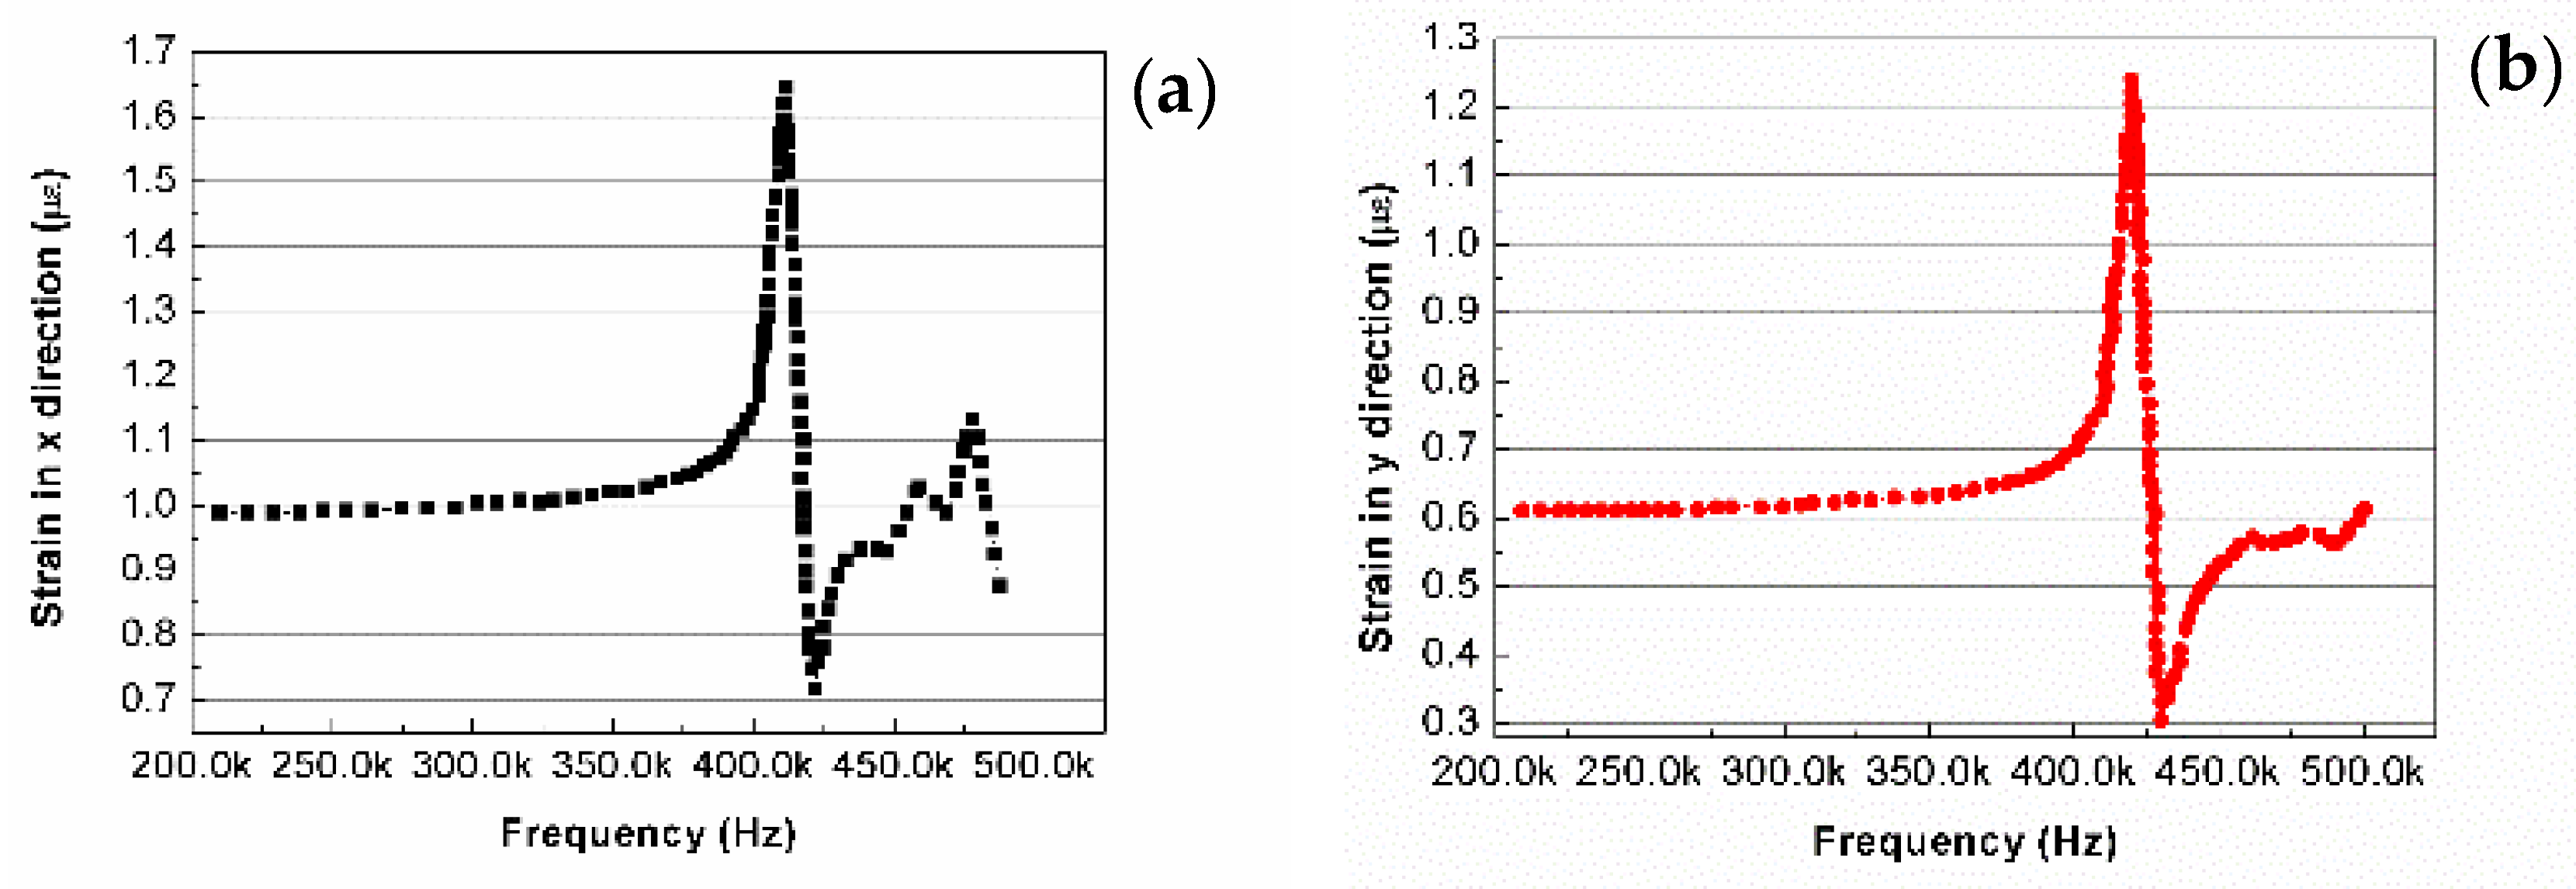
3.3. Harmonic Response Analysis of IEPCM

As is known, the harmonic frequency distributions and resonance response amplitudes of a structure can be achieved from the harmonic response analysis. In accordance with Reference [22], the harmonic response frequency range was set from 200 kHz to 500 kHz, the load sub-step was set as 30, and the harmonic response analysis of the IEPCM was carried out. The strains in the x- and y-direction on one point near the left edge on the top surface of the IEPCM were extracted and focused on, and the corresponding strain features changing with the frequency were obtained, as shown in Figure 5.
As can be seen from Figure 5a,b, there exists a similar change trend in the strain in the x- and y-direction as the frequency increases. Before 400 kHz, the strain in both the x- or y-direction slowly climbs up, and then sharply rises up to the maximal values (1.59 με, 1.25 με) and quickly drops down to the bottom during the 400–440 kHz range, which indicates the harmonic frequencies of the IEPCM in both directions are about 420 kHz [21]. When the frequency increases to 480 kHz, the strain in the x- and y-direction resumes to a balanced value 1.0 με, 0.58 με, respectively. It is worth noting that the resonance responses (strains in the x- or y-direction) near the harmonic frequency of 420 kHz are not to be neglected, which implies the work frequency of the IEPCM should be shifted away from 420 kHz.

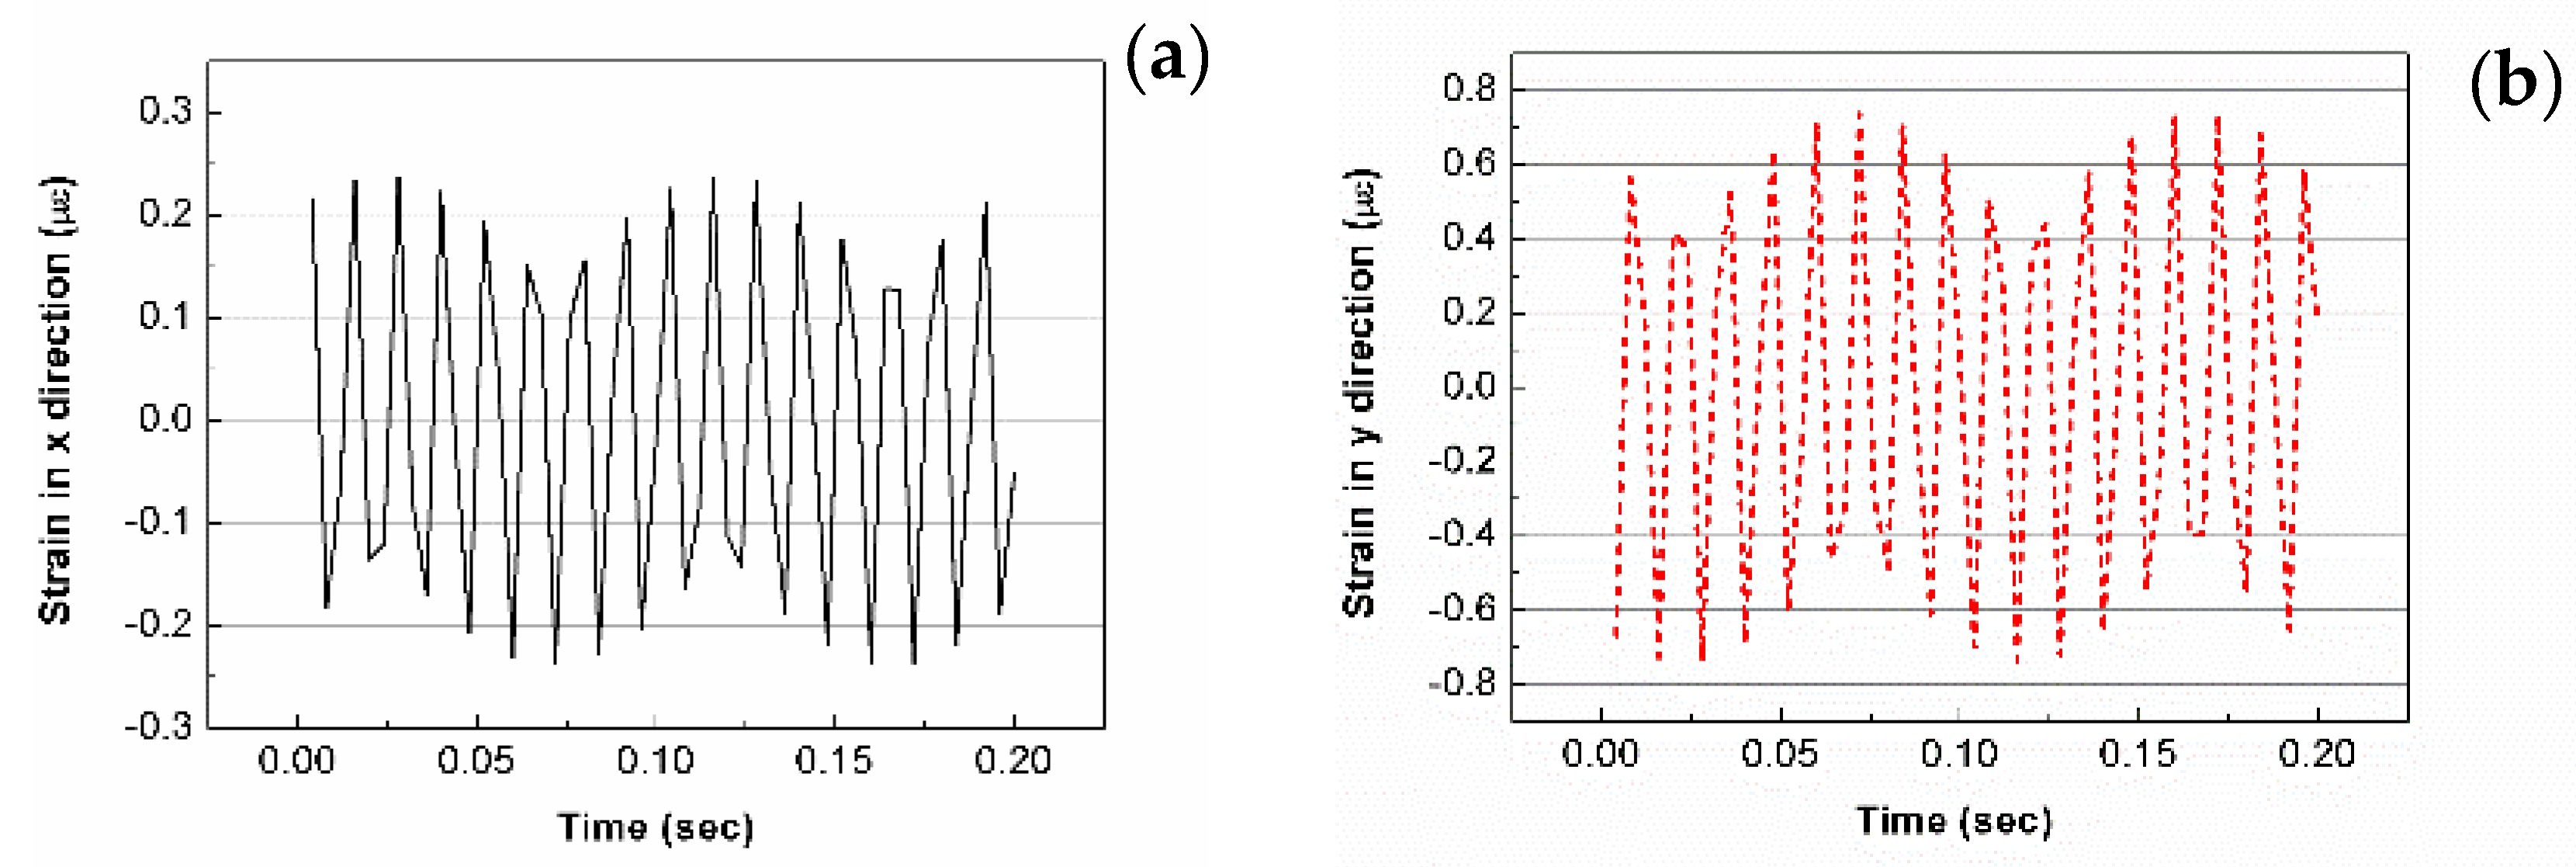
3.4. Transient Response Analysis of IEPCM

Transient response analysis is also called the time-history dynamic response analysis of a structure bearing, at any time, a varying load. The transient response analysis of a structure can effectively alleviate and even avoid the negative impact aroused from structural resonance and fatigue. An AC voltage of 10 Vrms with a period of 0.4 s was applied to the electrodes. The voltage step was set as 0.2 Vrms. The transient dynamic analysis of the IEPCM was implemented. Similarly, the strains in the x- and y-direction on one point near the left edge on the top surface of the IEPCM were extracted, the corresponding features changing with time are shown in Figure 6, and its hysteretic characteristics were also analyzed.
As demonstrated in Figure 6a,b, the strain fluctuates along with time; some hysteresis characteristics exist for the IEPCM, which may bring forth some negative effect on the fatigue. In fact, other than the influence from the IEPCM material itself and the production process, the load region of the driving voltage has a great influence on the curve shape. The amplitude of each strain response is different from the others. Therefore, during the preparation of the IEPCM, it is essential to ensure the positive and negative electrodes of the IEPCM are symmetric as far as possible, including the main branch corresponding to the positive and negative electrode branches [28].

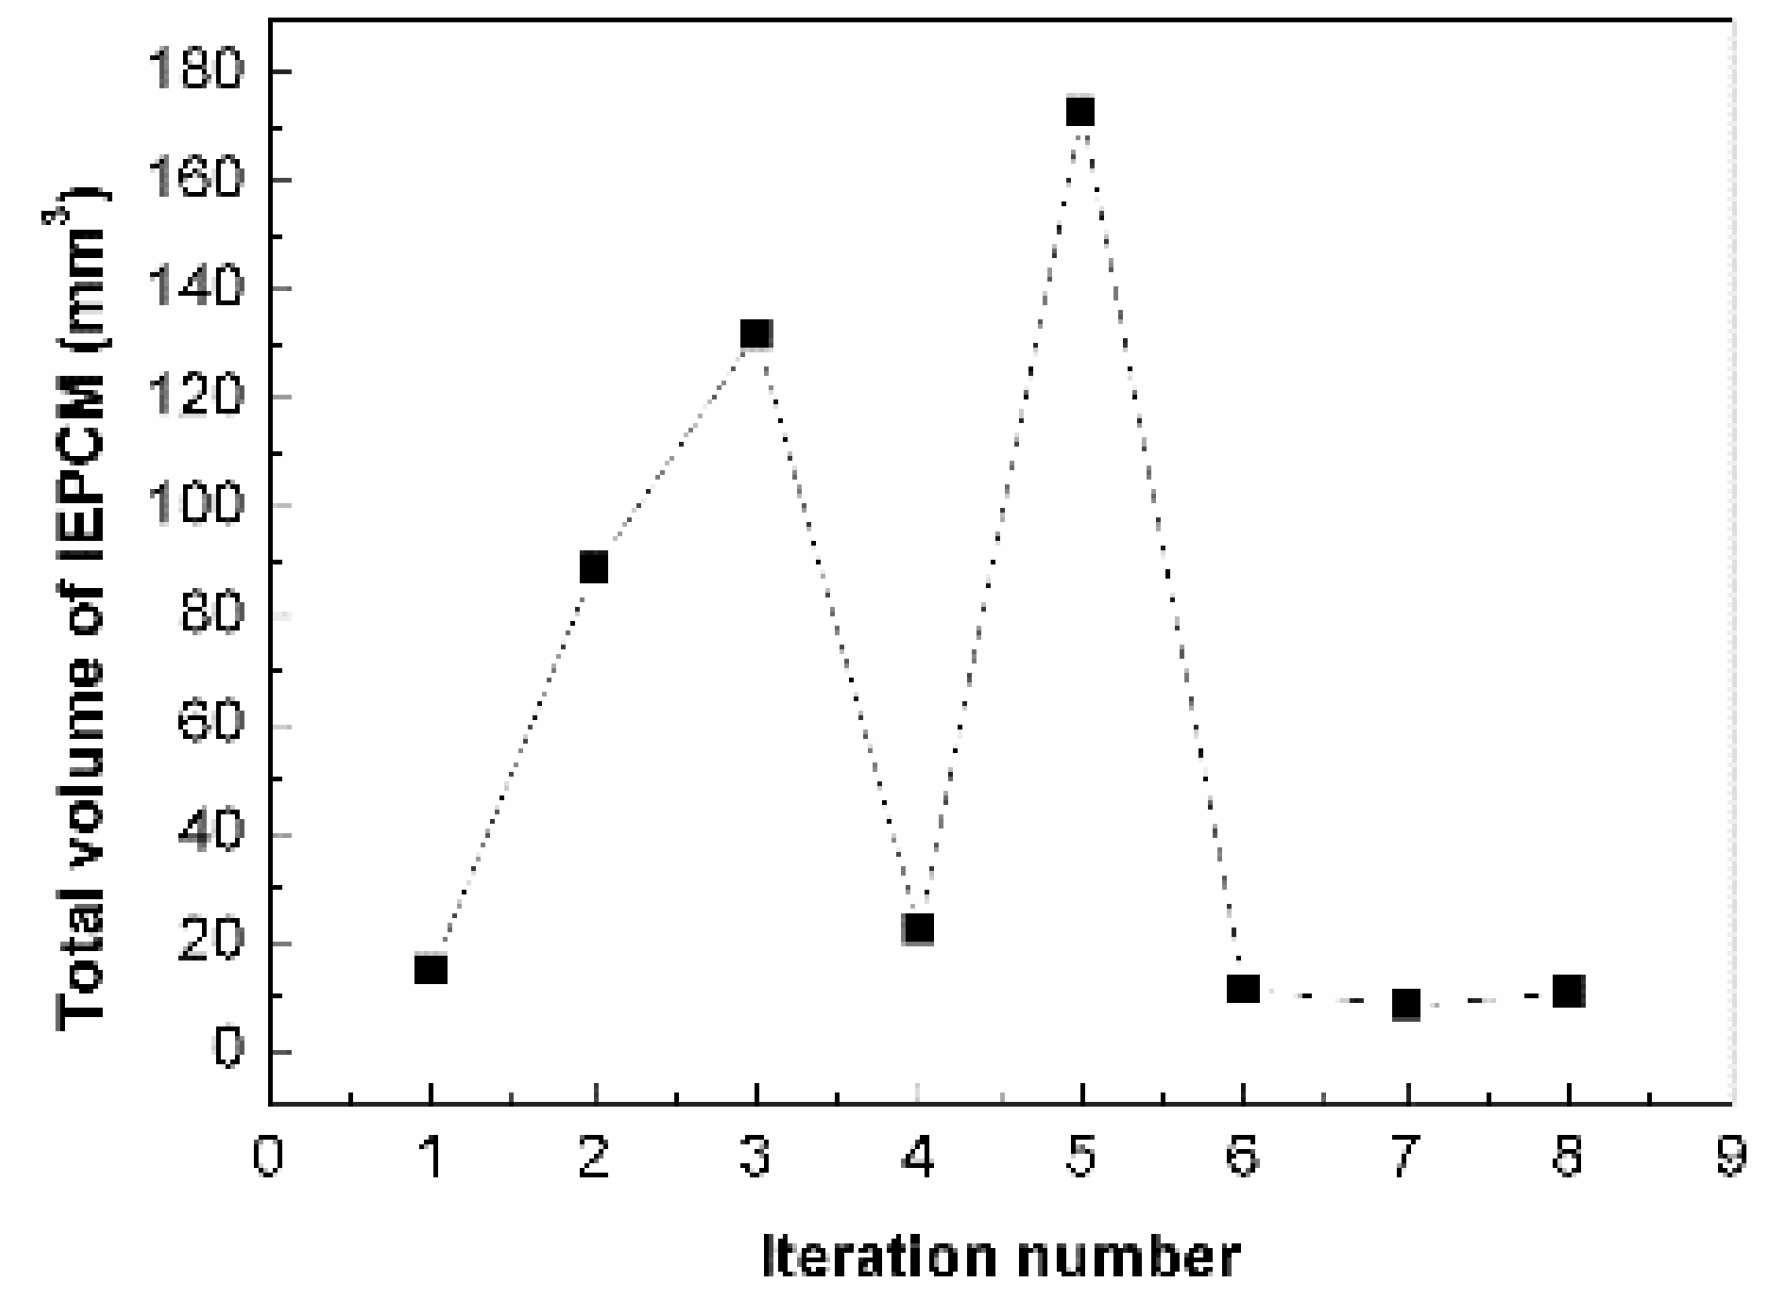
4. Optimal Design of IEPCM

The optimal design of the IEPCM through finite element simulation can save the volume consumption of the material ahead of the experiment. Here, the local area just between neighboring electrodes is focused on; the finite element design model of the IEPCM is optimized with the voltage on the positive electrode, applying up to 100 V. The wafer width (Wp) of the IEPCM is fixed at 0.001 m, the P, W and H of the IEPCM are supposed as the design variables, and their changing scopes are set as 0.001 m ≤ P ≤ 0.015 m, 0.0003 m ≤ W ≤ 0.0009 m, 0.001 m ≤ H ≤ 0.015 m, respectively. Assuming the maximum stress in the x-direction does not reach the ultimate stress of the IEPCM, the effect of the stress of the IEPCM can be accordingly neglected. The maximum strain in the x-direction (TMAX) is selected as a state variable, and the objective function is the total volume of the IEPCM (VTOT). The scope of TMAX is restricted by the condition TMAX ≥ 60 με through preliminary simulation. Figure 7 shows the VTOT changing trend along with the number of iterations.
Based on the results shown in Figure 7, we conclude that the VTOT optimization design for the IEPCM requires eight iteration cycles, and the VTOT values have sharp fluctuations for the first five iterations. After that, the VTOT comes to a low plateau, and the optimal VTOT appears at the eighth iteration. Thus, the optimal values of W, P, and H of the IEPCM are 0.00073 m, 0.00102 m and 0.00062 m, respectively, and the corresponding state variable TMAX is 95.3 με, whereas the optimized VTOT is 10.9 mm3. It is noted that the maximum strain TMAX along Wp appears in the center line between neighboring electrodes.

5. Conclusions

A numerical study on the static and dynamic responses of 0–3 type IEPCM was carried out to investigate its orthotropic properties and lateral electromechanical driving capacities. The objective of this work is to develop an electromechanical driving theory and to provide experimental guidance for 0–3 type IEPCMs. The significant findings are summarized as follows.
(1)
The maximum strain ratio at both ends of IEPCM in the x- and y-direction is 3.19, whereas that in the middle region is 2.69. These values indicate that good orthotropic characteristics and lateral piezoelectric driving capacity can be produced for 0–3 type IEPCMs.
(2)
The modal frequency distribution of the IEPCM is crowded together but with no repeated frequency; the vibration mode of the IEPCM is orthogonal, whereas the resonance frequency is 210.3 kHz. The harmonic responses of the IEPCM either in the x- and y-direction are almost the same at 420 kHz, which indicates some hysteresis characteristics exist. The load region of the driving voltage has a significant influence on the transient dynamic property of the IEPCM.
(3)
When the wafer width Wp of 0–3 type IEPCM is set at 1 mm, the main physical parameters of the optimal design for the IEPCM are achieved as follows: the thickness H is 0.62 mm, the electrode width W is 0.73 mm, the electrode spacing P is 1.02 mm and the corresponding volume VTOT is 10.9 mm3.

Acknowledgments

This work is supported by grants from the National Natural Science Foundation of China (Project No. 51578297, 51378270, 51678322 and 51650110509), the National“111” project, and the Taishan Scholar Priority Discipline Talent Group program funded by the Shan Dong Province.

Author Contributions

Jianlin Luo, Kwok Chung, Qiuyi Li and Chunwei Zhang initiated the work; Shuai Zhang and Chenglin You were involved in the numerical analysis; Jianlin Luo and Chenglin You made the preliminary draft; Jianlin Luo, Kwok Chung, Donghsuai Hou and Chunwei Zhang made the revisions and discussions.

Conflicts of Interest

The authors declare no conflict of interest.

Abbreviations

The following abbreviations are used in this manuscript:
PCMPiezoelectric cement-based material
IEPCMPiezoelectric cement-based material with interdigitated electrodes
SHMStructural health monitoring
PZTLead-zirconate-titanate

References

  1. Han, B.; Wang, Y.; Dong, S.; Zhang, L.; Ding, S.; Yu, X.; Ou, J. Smart concrete and structures: A review. J. Intell. Mater. Syst. Struct. 2015, 26, 1303–1345. [Google Scholar] [CrossRef]
  2. Wen, S.; Chung, D.D.L. Model of piezoresitivity in carbon fiber cement. Cem. Concr. Res. 2006, 36, 1879–1885. [Google Scholar] [CrossRef]
  3. Han, B.; Yu, X.; Ou, J. Self-Sensing Concrete in Smart Structures; Butterworth-Heinemann, Elsevier Science: Amsterdam, The Netherlands, 2014. [Google Scholar]
  4. Li, G.Y.; Wang, P.M.; Zhao, X.H. Pressure-sensitive properties and microstructure of carbon nanotube reinforced cement composites. Cem. Concr. Compos. 2007, 29, 377–382. [Google Scholar] [CrossRef]
  5. Azhari, F.; Banthia, N. Cement-based sensors with carbon fibers and carbon nanotubes for peizoresistive sensing. Cem. Concr. Compos. 2012, 34, 866–873. [Google Scholar] [CrossRef]
  6. Konsta-Gdoutos, M.S.; Aza, C.A. Self-sensing carbon nanotube (CNT) and nanofiber (CNF) cementitious composites for real time damage assessment in smart structures. Cem. Concr. Compos. 2014, 53, 110–128. [Google Scholar] [CrossRef]
  7. Galao, O.; Baeza, F.J.; Zornoza, E.; Garces, P. Strain and damage sensing properties on multifunctional cement composites with CNF admixture. Cem. Concr. Compos. 2014, 46, 90–98. [Google Scholar] [CrossRef] [Green Version]
  8. D’Alessandro, A.; Ubertini, F.; Materazzi, A.L.; Porfiri, M.; Laflamme, S. Electromechanical modelling of new nanocomposite carbon cement-based sensors for structural health monitoring. Struct. Health Monit. 2015, 14, 137–147. [Google Scholar] [CrossRef]
  9. D’Alessandro, A.; Rallini, M.; Ubertini, F.; Materazzi, A.L.; Kenny, J.M. Investigations on scalable fabrication procedures for self-sensing carbon nanotube cement-matrix composites for SHM applications. Cem. Concr. Compos. 2016, 65, 200–213. [Google Scholar]
  10. Luo, J.L.; Chung, K.L.; Li, Q.Y.; Chen, S.J.; Li, L.; Hou, D.S.; Zhang, C.W. Piezoresistive properties of cement composites reinforced by functionalized carbon nanotubes using photo-assisted Fenton. Smart Mater. Struct. 2017, 26, 035025. [Google Scholar] [CrossRef]
  11. Li, Z.J.; Zhang, D.; Wu, K.R. Cement-based 0–3 piezoelectric composites. J. Am. Ceram. Soc. 2002, 85, 305–313. [Google Scholar] [CrossRef]
  12. Huang, S.F.; Chang, J.; Lu, L.C.; Chen, X. Preparation and polarization of 0–3 cement-based piezoelectric composites. Mater. Res. Bull. 2006, 41, 291–297. [Google Scholar] [CrossRef]
  13. Chaipanich, A.; Rianyoi, R.; Potong, R.; Jaitanong, N. Aging of 0–3 piezoelectric PZT ceramic–Portland cement composites. J. Ceram. Int. 2014, 40, 13579–13584. [Google Scholar] [CrossRef]
  14. Luo, J.L.; Zhang, S.; Wei, X.; Li, Q.Y.; Li, L.; Sun, S.W. Preparation and piezoelectric properties of CNT modified cement-based piezoelectric composites. Piezoelectr. Acoustoopt. 2015, 37, 437–440. (In Chinese) [Google Scholar]
  15. Li, Z.J.; Gong, H.Y.; Zhang, Y.J. Fabrication and piezoelectricity of 0–3 cement based composite with nano-PZT powder. Curr. Appl. Phys. 2009, 9, 588–591. [Google Scholar] [CrossRef]
  16. Gong, H.Y.; Zhang, H.Y.; Che, S.W. Influence of carbon black on properties of PZT-cement piezoelectric composites. J. Compos. Mater. 2010, 44, 2547–2557. [Google Scholar]
  17. Lan, K.H.; Chan, H.L.W. Piezoelectric cement-based 1–3 composites. Appl. Phys. A 2005, 81, 1451–1454. [Google Scholar]
  18. Quant, M.; Elizalde, H.; Flores, A.; Ramirez, R.; Orta, P.; Song, G.B. A comprehensive model for piezoceramic actuators: Modeling, validation and application. Smart Mater. Struct. 2009, 18, 125011. [Google Scholar] [CrossRef]
  19. Xu, Y.L.; Qian, Y.; Chen, J.J.; Song, G.B. Modal-based mixed vibration control for uncertain piezoelectric flexible structures. Struct. Eng. Mech. 2015, 55, 229–244. [Google Scholar] [CrossRef]
  20. Hong, X.; Wang, H.; Wang, T.; Liu, G.; Li, Y.; Song, G.B. Dynamic cooperative identification based on synergetic for pipe structural health monitoring with piezoceramic transducers. Smart Mater. Struct. 2013, 22, 045003. [Google Scholar] [CrossRef]
  21. Jaitanong, N.; Yimnirun, R.; Zeng, H.R.; Li, G.R.; Yin, Q.R.; Chaipanich, A. Piezoelectric properties of cement based/PVDF/PZT composites. Mater. Lett. 2014, 130, 146–149. [Google Scholar] [CrossRef]
  22. Zhang, Z.Z.; Peng, Y.P.; Xu, D.Y.; Cheng, X. FEM analysis of 1–3 cement based piezoelectric composites. Adv. Mater. Res. 2010, 123–125, 539–542. [Google Scholar] [CrossRef]
  23. Wickramasinghe, V.K.; Hagood, N.W. Durability characterization of active fiber composite actuators for helicopter rotor blade applications. In Proceedings of the 44th AIAA/ASME/ASCE/AHS Conference, Norfolk, Virginia, 7–10 April 2003; pp. 7–10.
  24. Hagood, N.W.; Kindel, R.; Ghandi, K. Improving transverse actuation of piezoceramics using interdigitated surface electrodes. SPIE 1993, 1917, 341–352. [Google Scholar]
  25. Roundy, S. On the effectiveness of vibration-based energy harvesting. J. Intell. Mater. Syst. Struct. 2005, 16, 809–823. [Google Scholar] [CrossRef]
  26. Lin, X.J.; Huang, S.F.; Zhou, K.C.; Zhang, D. The influence of structural parameters on the actuation performance of piezoelectric fiber composites. Mater. Des. 2016, 107, 123–129. [Google Scholar] [CrossRef]
  27. Liu, Z.H.; Pan, C.T.; Su, C.Y.; Lin, L.W.; Chen, Y.J.; Tsai, J.S. A flexible sensing device based on a PVDF/MWCNT composite nanofiber array with an interdigital electrode. Sens. Actuators A 2014, 211, 78–88. [Google Scholar] [CrossRef]
  28. Chidambaram, N.; Balma, D.; Nigon, R.; Mazzalai, A.; Matloub, R.; Sandu, C.S.; Muralt, P. Converse mode piezoelectric coefficient for lead zirconatetitanate thinfilm with interdigitated electrode. J. Micromech. Microeng. 2015, 25, 045016. [Google Scholar] [CrossRef]
Figure 1. The outline configuration of piezoelectric cement-based material with interdigitated electrodes (IEPCM).
Applsci 07 00233 g001
Figure 2. Static stress distributions of IEPCM under applied 10 V voltage: (a) x-direction; (b) y-direction.
Applsci 07 00233 g002
Figure 3. Static strain distributions of IEPCM under applied 10 V voltage: (a) x-direction; (b) y-direction.
Applsci 07 00233 g003
Figure 4. The fourth-order vibration mode of IEPCM.
Applsci 07 00233 g004
Figure 5. Strain distributions of IEPCM vs. frequency: (a) x-direction; (b) y-direction.
Applsci 07 00233 g005
Figure 6. Strain distributions of IEPCM vs. time: (a) x-direction; (b) y-direction.
Applsci 07 00233 g006
Figure 7. The changes in the material volume of IEPCM vs. iteration numbers.
Applsci 07 00233 g007
Table 1. Elastic stiffness coefficient matrix in short circuit state of IEPCM c (GPa).
ItemValueItemValueItemValueItemValueItemValueItemValue
C11103.7
C1267.0C22119.1 (Symmetry)
C1367.0C2370.2C33119.1
C140C240C340C4423.5
C150C250C350C450C5528.0
C160C260C360C460C560C6623.5
Table 2. Dielectric coefficient matrix in clamping state of IEPCM ε (nF/m).
ε11ε22ε33
4.224.854.85
Table 3. Piezoelectric stress coefficient matrix of IEPCM e (×C/m2).
Stress DirectionX AxisY AxisZ Axis
E-Field Direction
Xe11 (15.1)e12 (0)e13 (0)
Ye21 (−5.2)e22 (0)e23 (0)
Ze31 (−5.2)e32 (0)e33 (0)
XYe41 (0)e42 (12.7)e43 (0)
YZe51 (0)e52 (0)e53 (0)
XZe61 (0)e62 (0)e63 (12.7)

