Article

A Visual Analytics Approach for Detecting and Understanding Anomalous Resident Behaviors in Smart Healthcare

1
School of Software Engineering, Central South University, Changsha 410075, China
2
Data Center Consolidation (Beijing), Industrial and Commercial Bank of China, Beijing 100000, China
3
School of Information Science and Engineering, Central South University, Changsha 410075, China
4
Division of Health & Social Care Research, Faculty of Life Sciences &Medicine, King’s College London, London WC2R 2LS, UK
5
Information Management Department, Hunan University of Finance and Economics, Changsha 410083, China
*
Authors to whom correspondence should be addressed.
Appl. Sci. 2017, 7(3), 254; https://doi.org/10.3390/app7030254
Submission received: 31 December 2016 / Revised: 25 February 2017 / Accepted: 27 February 2017 / Published: 7 March 2017
(This article belongs to the Special Issue Smart Healthcare)

Abstract

:
With the development of science and technology, it is possible to analyze residents’ daily behaviors for the purpose of smart healthcare in the smart home environment. Many researchers have begun to detect residents’ anomalous behaviors and assess their physical condition, but these approaches used by the researchers are often caught in plight caused by a lack of ground truth, one-sided analysis of behavior, and difficulty of understanding behaviors. In this paper, we put forward a smart home visual analysis system (SHVis) to help analysts detect and comprehend unusual behaviors of residents, and predict the health information intelligently. Firstly, the system classifies daily activities recorded by sensor devices in smart home environment into different categories, and discovers unusual behavior patterns of residents living in this environment by using various characteristics extracted from those activities and appropriate unsupervised anomaly detection algorithm. Secondly, on the basis of figuring out the residents’ anomaly degree of every date, we explore the daily behavior patterns and details with the help of several visualization views, and compare and analyze residents’ activities of various dates to find the reasons why residents act unusually. In the case study of this paper, we analyze residents’ behaviors that happened over two months and find unusual indoor behaviors and give health advice to the residents.

1. Introduction

With the development of Internet of things, various powerful sensors are introduced in household devices frequently, which create a safer, more convenient and comfortable smart home environment [1,2]. At the same time, massive data related to residents’ living are continuously captured by the sensors, providing opportunities for researchers to explore residents’ behaviors. Through analyzing these behaviors, we can not only recognize indoor activities but also discover residents’ living habits, and, more importantly we can detect their unusual behaviors so that we can give them suggestions on how to live a more healthy and environment-friendly life. Furthermore, it can even help conduct health assessment and diagnosis of mobility impaired disease and Alzheimer’s disease [3,4].
Recently, detecting anomalous behaviors for smart health in smart home environment has already caught the eyes of some pioneers. Currently, methods of machine learning, frequently used to study these problems [5,6,7], usually include the following steps: (1) activity recognition; (2) classify these activities and select features; and (3) use the methods of machine learning to figure out the value of residents’ health conditions. However, the existing methods have many problems. First, ground truth is generally difficult to obtain, so semi-supervised or supervised machine learning has to rely on a large number of manual annotations. Second, most existing methods are used for a few certain types of activity, which ignores the internal relations between humans and their various activities in smart home. Finally, more human intelligence should be invested, as it is required to comprehend unusual behaviors, analyze causes of anomalous behaviors, recognize, etc.
In this paper, visual analytics technology is introduced to detect and analyze residents’ unusual behaviors for health in smart home, which better combines machine intelligence and artificial intelligence. First, we divide more than 30 activities that happen at home into categories, select different characteristics according to activity property, conduct local outlier factor (LOF) based anomaly detection, blend anomaly detection results of events in different categories, and create an overall anomaly appraisal and anomaly indication of separate items. Then, we design a smart home visual analytics system (SHVis) in which original data and anomaly detection results are blended in an interactive visual analysis interface with multiple views. This tool supports interactive exploration of anomaly tendency, analysis of spatial and temporal distribution of daily activities and multi-periods comparative analysis for smart health. It can effectively help analysts analyze, contrast and interpret users’ daily activities and anomalous events to predict resident health information. In the case studies, we use several analyses of interesting anomalous events to show the effectiveness of this tool.
The major contribution of this paper includes:
(1)
Employing LOF algorithm to anomaly detection of residents’ daily activities, which can detect anomalous activities rapidly and effectively.
(2)
Designing a series of visual views to analyze, compare and interpret users’ various daily activities, which will help researchers locate anomalous events of residents’ life rapidly, compare users’ behaviors of different dates, and observe detailed information of anomalous events.

2. Related Work

In recent years, there have been number studies focusing on human activity recognition for health in smart home. As the basic steps of analysis of human behavior pattern, the goal of activity recognition is to recognize human daily activities from the data collected from sensors deployed into rooms without disturbing the privacy of the inhabitants [8]. Many machine learning based approaches have been well researched in this area. For example, Kim et al. summarized and compared the performance, features and application scenarios of many machine learning algorithms for activity recognition from the sensor data collecting from smart home [9]. Krishnan et al. proposed a sliding window based SVM (Support Vector Machines) method leading to a real-time performance of activity recognition on streaming sensor data [10]. Some work focus on users’ behaviors predication. For example, Liao et al. establishes Markov chain-like models to predict the web resources users need [11].
Based on the study of activity recognition, some researchers have recently carried out many pioneer works on analysis of residents behavior patterns in smart home, especially for the elderly living alone. Some of these works focus on overall evaluation of residents’ cognitive ability and life health status according to analysis of data over a period. For example, Prafulla et al. used approximately two years of sensor data in 18 smart homes to train machine learning algorithms for predicting standard clinical assessment scores of residents [5]. Noury et al. evaluated the health status of elderly people living independently at home based on long-term observations on the usage information of electrical devices during months or years [6]. Moreover, other works focus on anomaly detection from daily or weekly perspective based on the monitoring of a single activity or the combination of behaviors. For example, Das et al. proposed a novel one-class classification-based approach to detect errors in daily activities of older adults [12], Jae et al. summarized sensor-based daily behaviors into three aspects, namely activity level, mobility level, and nonresponse interval, and developed a support vector data description method to detect abnormal behavioral patterns of elderly people living alone [13]. Zhao et al. used a novel computer-vision-based system consisting of inexpensive programmable depth sensors, wearable devices, and smart phones to ensure worker safety in the workplace without violating their privacy [14]. Aran et al. proposed an indicator of predictability based on the cross-entropy measure for the detection of anomalies in elderly daily behavior [15]. Alcalá et al. used a novel approach to identify appliance activities from smart meter data and extract the pattern of usage, which is used to monitor the health of the household’s occupant [16]. As mentioned above, the machine learning method occupies an absolutely dominant position in the work of residents’ behavior assessment and anomaly detection. Our approach aims to solve these problems by combining visual analysis with machine learning.
By now, many studies have introduced visualization and visual analytics into anomaly detection in application domains, such as cyber security and financial crime. There are also some existing works about human abnormal behavior analysis supported by visualization or visual analytics. In terms of human online communication behaviors, Caonan et al. [17,18] designed several novel visualizations to help users understand the analysis results of anomaly recognition algorithm based on machine learning and analyze the behavior patterns of anomalous persons who are potential threats to society. For increased situational awareness and decision making in emergency response, Yuri [19] and Kim [20] visualized people’s laws of daily activities in public areas and their movement in emergencies from the data captured by cameras and motion sensors in buildings. On the perspective of human urban life, Liao et al. [21] combined conditional random field model with visual analytics methods to analyze the anomalies in urban taxi Global Positioning System (GPS) traces. Peng et al. [22] performed a visual analysis on heterogeneous trajectories and credit card records of suspects to help investigators obtain their abnormal behaviors and gain evidence. Rohlig et al. [23] presented a novel visual analytics approach for parameter-dependent activity recognition. In general, the analysis and anomaly detection about human behavioral pattern have received extensive attention from visualization and visual analysis communities.

3. Data Description and Task Profile

3.1. Data Description

The Center for Advanced Studies in Adaptive Systems (CASAS) project is a famous smart home research project presented by Washington State University, which treats many houses as intelligent agents where the activities of residents are perceived using multiple sensors [24]. We select two sets of sensor data captured from two houses with two residents living alone in the CASAS project. One dataset has 326,066 rows of data from 18 July 2012 to 17 September 2012 with 28 kinds of daily activities, such as Enter Home, Leave Home, Evening Meds, Morning Meds, Eat Lunch, Eat Dinner, Cook Dinner, Dress, Bathe, Sleep, Toilet, Watch TV, etc. Another dataset has 1,719,553 rows of data from 4 November 2010 to 11 June 2011 with 11 kinds of daily activities, such as Enter Home, Leave Home, Bed to Toilet, Eating, Housekeeping, Relax, Sleeping, Wash Dishes, etc. A sensor event record generally represents four basic fields, namely timestamp, sensorID, sensorStatus, and activityID; an example is shown in Table 1. In these fields, timestamp is accurate to milliseconds, recording the time that the sensor event occurred. Sensor ID represents a certain sensor deployed inside the house. Ssensor status represents the status of the sensor; most sensors only have “ON” and “OFF” statuses, where “ON” means sensor is triggered, and “OFF” means sensor is closed. For a sensor, the time between the nearest “ON” and “OFF” represents the active time of this sensor. Some sensor types, such as temperature sensors and power sensors, are recorded as numbers, and are beyond the scope of this paper. The value of activity ID indicates a specific type of daily activity, which has been pre-processed by activity recognition methods. The field consists of an activity and a status. The words “begin” and “end” of status represent the start and the end of an activity, respectively.

3.2. Task Profile

The paper aims at monitoring and exploring users’ anomalous behaviors in their smart homes with the help of sensors used to record users’ behaviors in a short time. The biggest difficulty in the process of analysis is how to discover and locate anomaly rapidly, how to analyze residents’ behavior which has been defined as anomalous from multiple perspectives, and how to discover the false alert from calculation results. Overall, targets of analysis can be divided into the following parts.

3.2.1. Interactive Activity Classification and Summary

In this part, the task is to classify the activities recorded by sensors further so that the features of residents’ behaviors can be described more explicitly. For example, “leave home” and “enter home” happen momentarily, while “sleep” and “watch TV” last for a certain period. Thus, we need to classify related activities based on behavior characteristics and offer an interactive manner allowing users to combine these activities freely. Meanwhile, in order to adjust activity categories reasonably, we also need to provide an activity overview to show the information such as the times and the duration of residents’ activities.

3.2.2. Combined Anomaly Detection and Summary of Results

In order to get better anomaly detection results, the paper comprehensively takes characteristic parameter of each activity into consideration. We employ a multi-activity and multi-features calculation method to detect and analyze residents’ behaviors, and obtain anomaly degrees of residents’ activity every day. Researchers carry out characteristics calculation and adjust activities on the basis of analysis results to obtain more precise and accurate value of anomaly degree.

3.2.3. Exploration of Residents’ Anomalous Behaviors and Their Spatial and Temporal Distribution

Using the residents’ unusual behaviors obtained in T2, T3 is to display and analyze spatial and temporal characters of unusual behaviors by visual analyses methods with multiple dimensions of activity durations, times and start times. With the visual tools, researchers can examine detailed activity information of the date, analyzing activities’ information on that very date, such as duration, start time, and times. Furthermore, researchers need to analyze where, when and which resident’s behavior is unusual.

3.2.4. Rapid Anomaly Comparison

Researchers not only need to analyze activities in a single date, but compare and contrast behavior patterns of various dates including anomalous and normal dates. In addition, residents’ behaviors of some period need to be compared with their general behavior rule. This process offers great help in finding false alert from calculation results.

4. Anomaly Detection

In this section, we detect anomalous behaviors of tested residents through residents’ behavior classification, characteristics extraction and anomalous behavior extraction.

4.1. Characteristics Categories

There are many kinds of indoor activities and they are quite different. For example, “sleep” generally happens in bed at nights and lasts for a long time, usually 6 to 9 h. However, although “bath” happens in bathroom regularly, its start time differentiates with each resident’s living habits and the duration is generally short. Some other activities happen irregularly in terms of start time and duration, such as “toilet” and “watch TV”, without relatively fixed time or duration. Therefore, when we take day as unit to analyze anomaly degree of residents’ indoor activities, we need treat different activities in different ways. Table 2 shows part of the data describing activities of an elderly person living alone.
We select three most representative characteristics to calculate anomaly degree of residents’ daily behaviors after the analysis of features of indoor activities.
  • Duration: A healthy resident’s activity often follows a certain rule, meaning that its value of duration fluctuates around a fixed value. According to the activity’s duration, we can calculate anomaly value of residents’ activities in each date with LOF algorithm.
  • Times: Similar to Duration, occurrence times of a resident’s activity maintain around a fixed value. According to the occurrence times of an activity, we can also calculate anomaly value with LOF algorithm.
  • Start time: Similar to Duration and Times, we can calculate anomaly value of residents’ activities in each date with LOF algorithm with the help of standard deviation.

4.2. Characteristics Extraction

Based on the analyses of activity classification, we can select a corresponding activity to calculate residents’ anomaly degree according to properties of various characteristics. There are different methods to select activity for each feature. The following are details:
  • Duration: When using Duration to calculate, activities of long duration have greater influence on the calculation of anomaly degree, while activities of short duration such as “leave home” and “toilet” have few effects on such calculation, which could almost be neglected. Hence, activities of long duration should be chosen when calculating anomaly degree in this category.
  • Times: Activities with short duration are not suitable for calculation of Duration anomaly degree, but they are fit for calculation of Times anomaly degree. For instance, how often a resident goes to bathroom exerts a great influence on reflecting anomaly degree of his behavior on that day, whereas how long a resident takes in toilet totally in a day is insignificant in calculation. Therefore, activities of short duration should be chosen when calculating anomaly degree in the category of Times. In addition, the activity with relatively stable frequency is more valuable when calculating anomaly degree of Times, meaning that it should be given priority in selection.
  • Start time: Start time of some activities can also be regarded as the evidence to judge if anomalous events occurred. For instance, duration of “sleep” may be around a certain number of hours, if they go to bed too early or too late it means they behaved unusually on that day.
On the basis of analyzing various features of activities, we rule out activities without stability on any of the features described above, such as “entertain guests”, as this activity only offers no valuable reference for calculating anomaly degree of duration, times and start time, and would affect accuracy of calculation. Table 3 describes activity characteristics which can be used in calculation.

4.3. Local Outlier Factor

Abnormity of residents’ daily behavior refers to some event deviating from the general rule of events in daily life. For example, a resident with high blood pressure needs to take medicine on time to bring high blood pressure down. If one day he/she does not take medicine on time or take no medicine at all, it will be defined as his unusual behavior. A challenge in detecting residents’ anomalous behavior is that residents’ behaviors are dynamically changing. Hence, we cannot simply use occurrence of some events to judge if a behavior pattern of the resident some day is abnormal. Besides, anomalous behaviors of a resident are often very few, which cannot represent the distribution of abnormity very well. Since LOF (local outlier factor model) is an unsupervised learning approach and needs no training dataset when detecting outliers, it overcomes the difficulty of annotating anomalous behaviors in residents’ behavior dataset and effectively reduces probability of erroneous judgment. Therefore, the paper employs LOF to detect residents’ abnormal behavior pattern. Based on the method used to classify residents’ behaviors in Section 4.1, this paper uses behavior characteristics, including duration, scene, times and start time, to calculate LOF outliers and show the final results.
Define   X = [ x 1 , x 2 , , x t ] , where x t is an eigenvector used to describe residents’ behavior at date t   [ 1 , 2 , , T ] . Based on users’ every day activity, we find user’s anomaly degree on that very day using LOF algorithm. Definition of behavior anomaly degree is shown as Equation (1).
L O F k ( x t ) = y N k ( x t ) l r d k ( y ) l r d k ( x t ) | N k ( x t ) |   =   y N k ( x t ) l r d k ( y ) | N k ( x t ) | l r d k ( x t )
In Equation (1), N k ( x t ) is the set of the k-nearest neighbors of x t in the feature space X. l r d k ( x t ) is local reachability density of the feature vector x which can be calculated by Equation (2).
l r d k ( x t ) = 1 / ( y N k ( x t ) r d k ( x t , y ) | N k ( x t ) | )
In Equation (2), r d k ( x , y ) is the distance used to define what is called reachability distance, which can be calculated by Equation (3). d(x,y) represents the Euclidean distance between feature vector x and y. k distance(x) is the max distance of the feature vector x to its k-nearest neighbors.
r d k ( x , y ) = max { k   d i s t a n c e ( y ) , d ( x , y ) }
Since abnormality of behavior is only in comparison to its several neighbors instead of the entire data set, the result is still valid in the case of residents with multiple potential lifestyles. Therefore, we can find resident abnormal behavior by LOF in the data set based on the regularity of resident’s life.

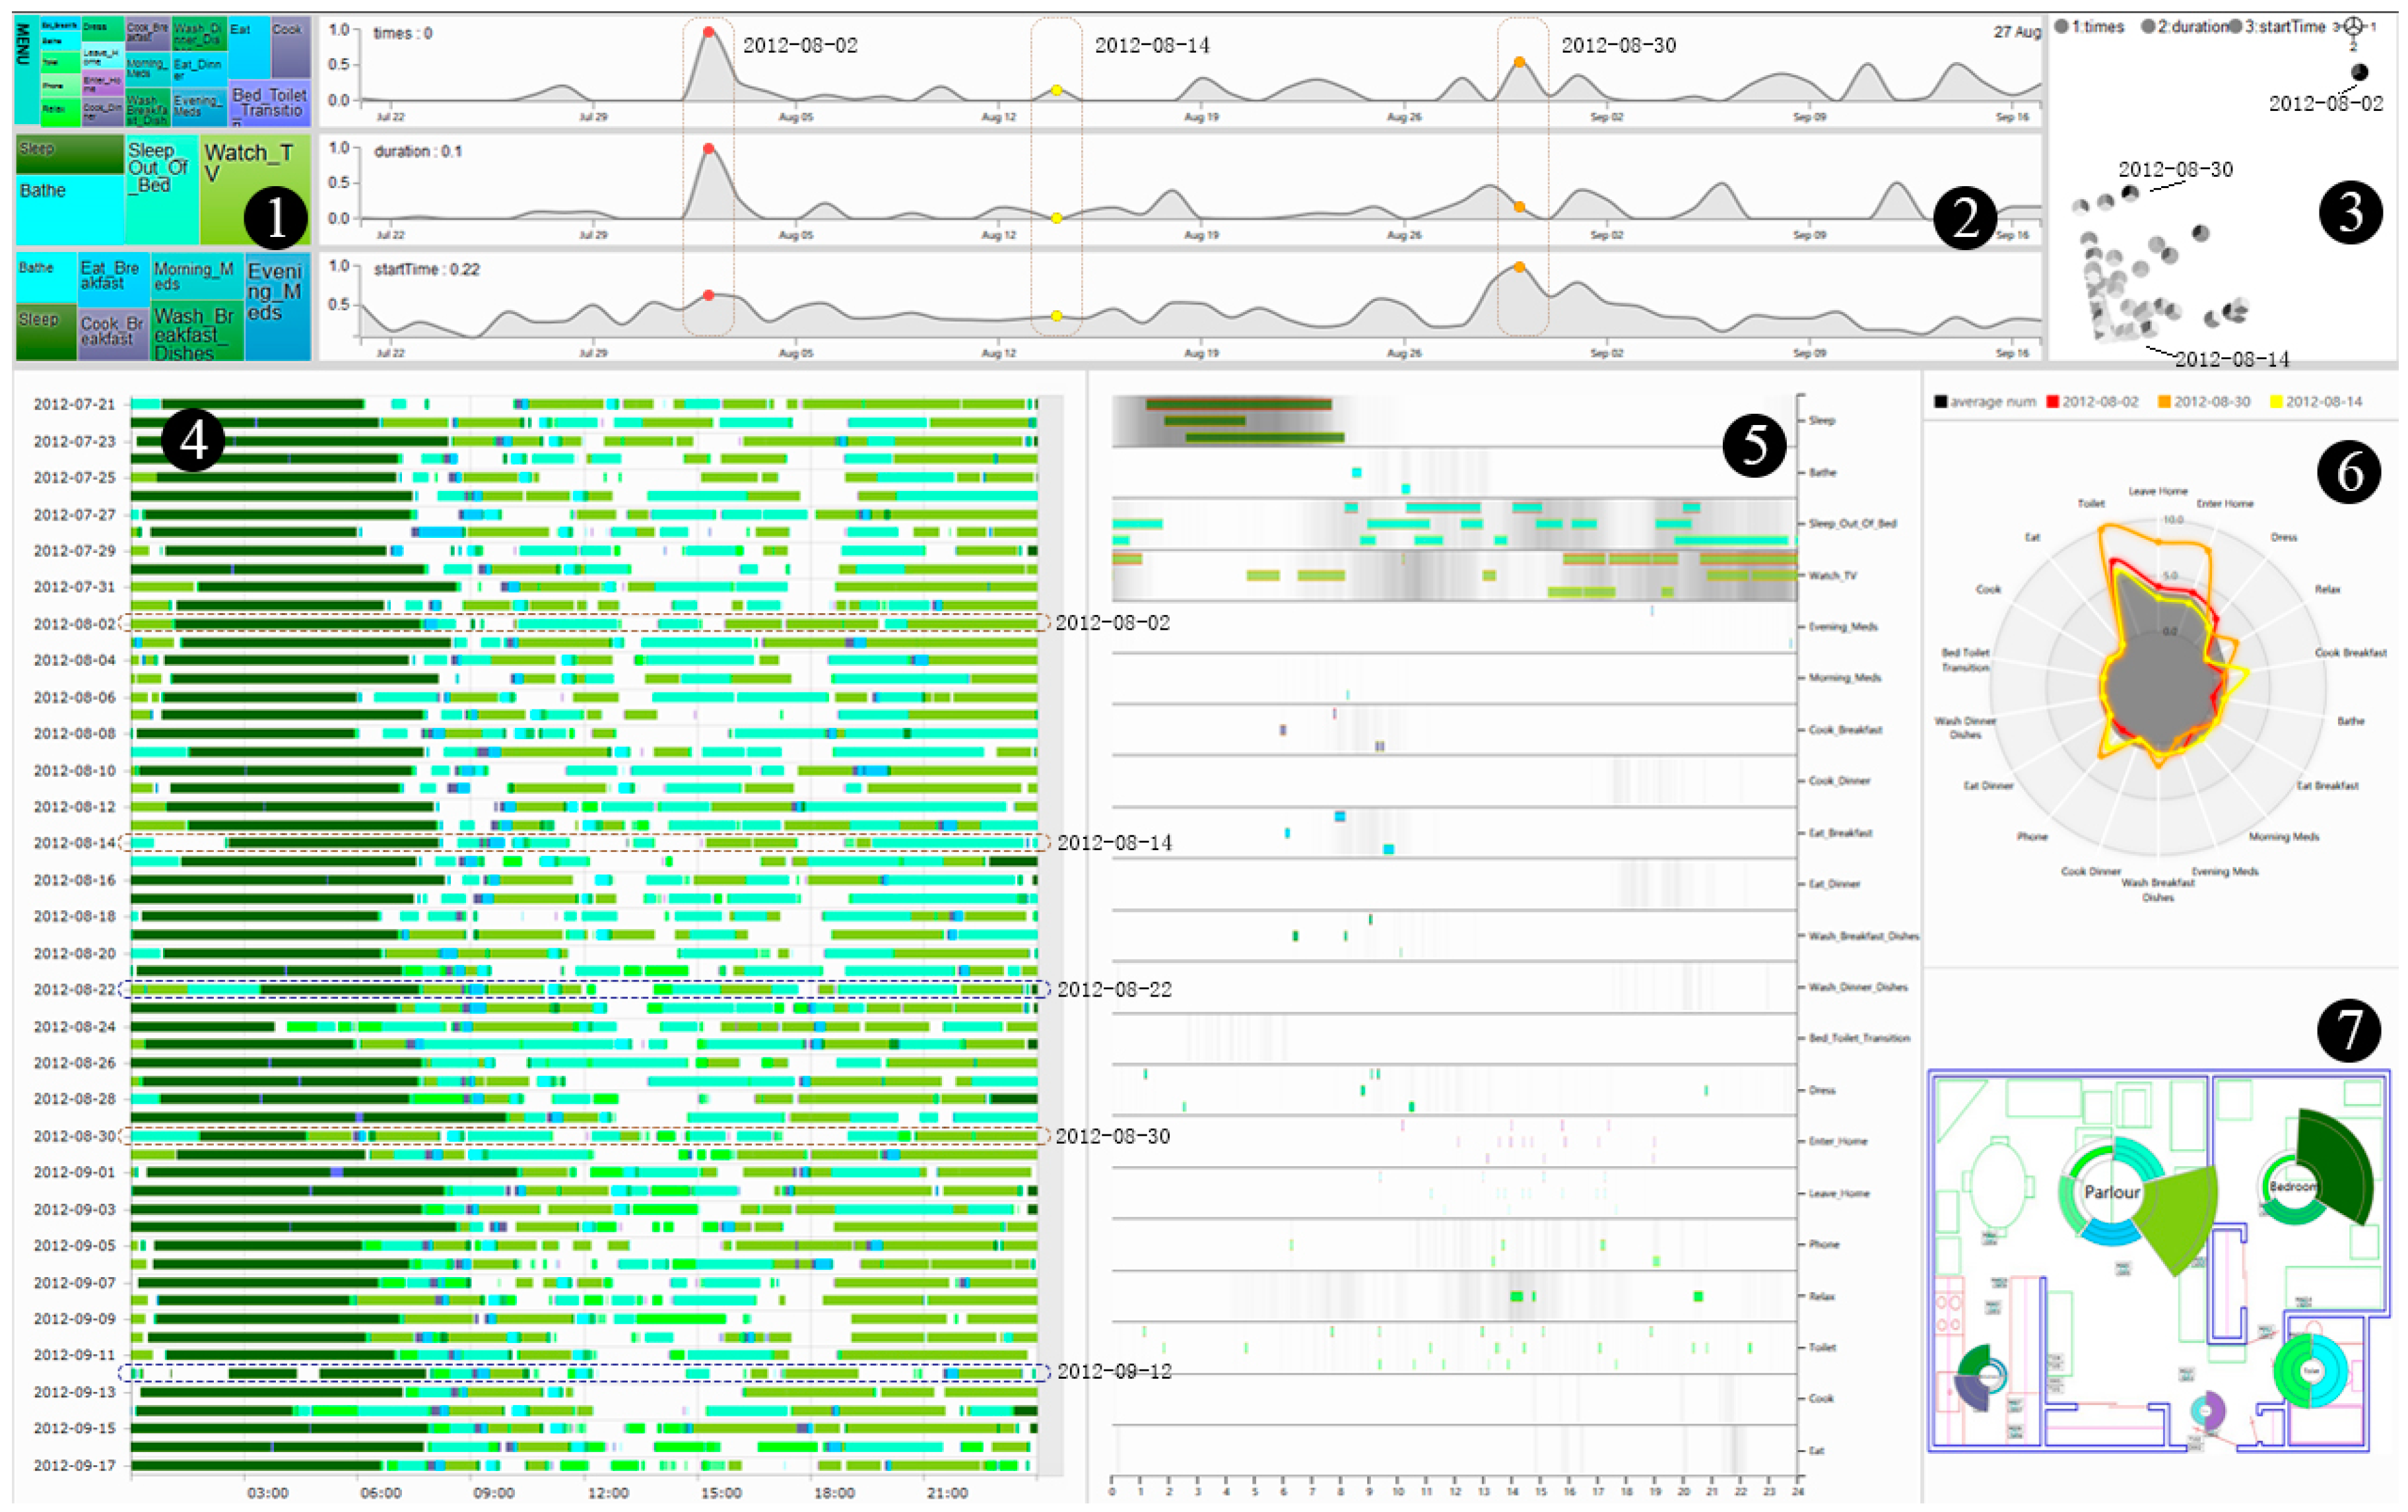
5. Analysis Interface and Visualization

In this section, we give the detailed description of the visualization views of SHVis. SHVis is a tool to explore and analyze the residents’ daily activities for smart health from multiple views. The overview of SHVis shows in Figure 1, which consists of seven visualization views. Figure 1(1–3) explains three sorts of abnormity distribute on each date by three methods: Tree-map, score and projection view. This part can also provide the information of what kind of activities exert greatest influence on three sorts of abnormity, respectively. Figure 1(4–7) can help researchers analyze concrete conditions of residents’ daily activities with Activity Gantt view, Heat Gantt view, Radar view and Space Radar view. These parts help researchers find the specific reasons why unusual behaviors occur. Furthermore, it can help researchers to compare activities of different dates rapidly. SHVis provides an effective way for us to deeper understand the behavioral patterns of residents in smart homes. The detailed description of visual components is as follows.

5.1. Activity Tree Map View

By using three characteristics, the system works out anomaly degree of everyday’s activities. Then, the system uses random forests algorithm to measure weight of the anomaly value of each activity on assessment of abnormal value. Based on activities’ weight, we can create a tree map of categories, in which every rectangle represents an activity, different colors stand for different activities, and the size of rectangle shows the weight of the activity on calculations of this category. For example, as Figure 1(1) shows, the second set is the abnormal value figured out based on duration, among which the biggest rectangle is “Watch TV”, meaning that “Watch TV” has the greatest effects on residents’ activity abnormal value obtained based on duration. The colors here stand for different activities, which are consistent with the codification colors in other views.

5.2. Anomaly Grading View
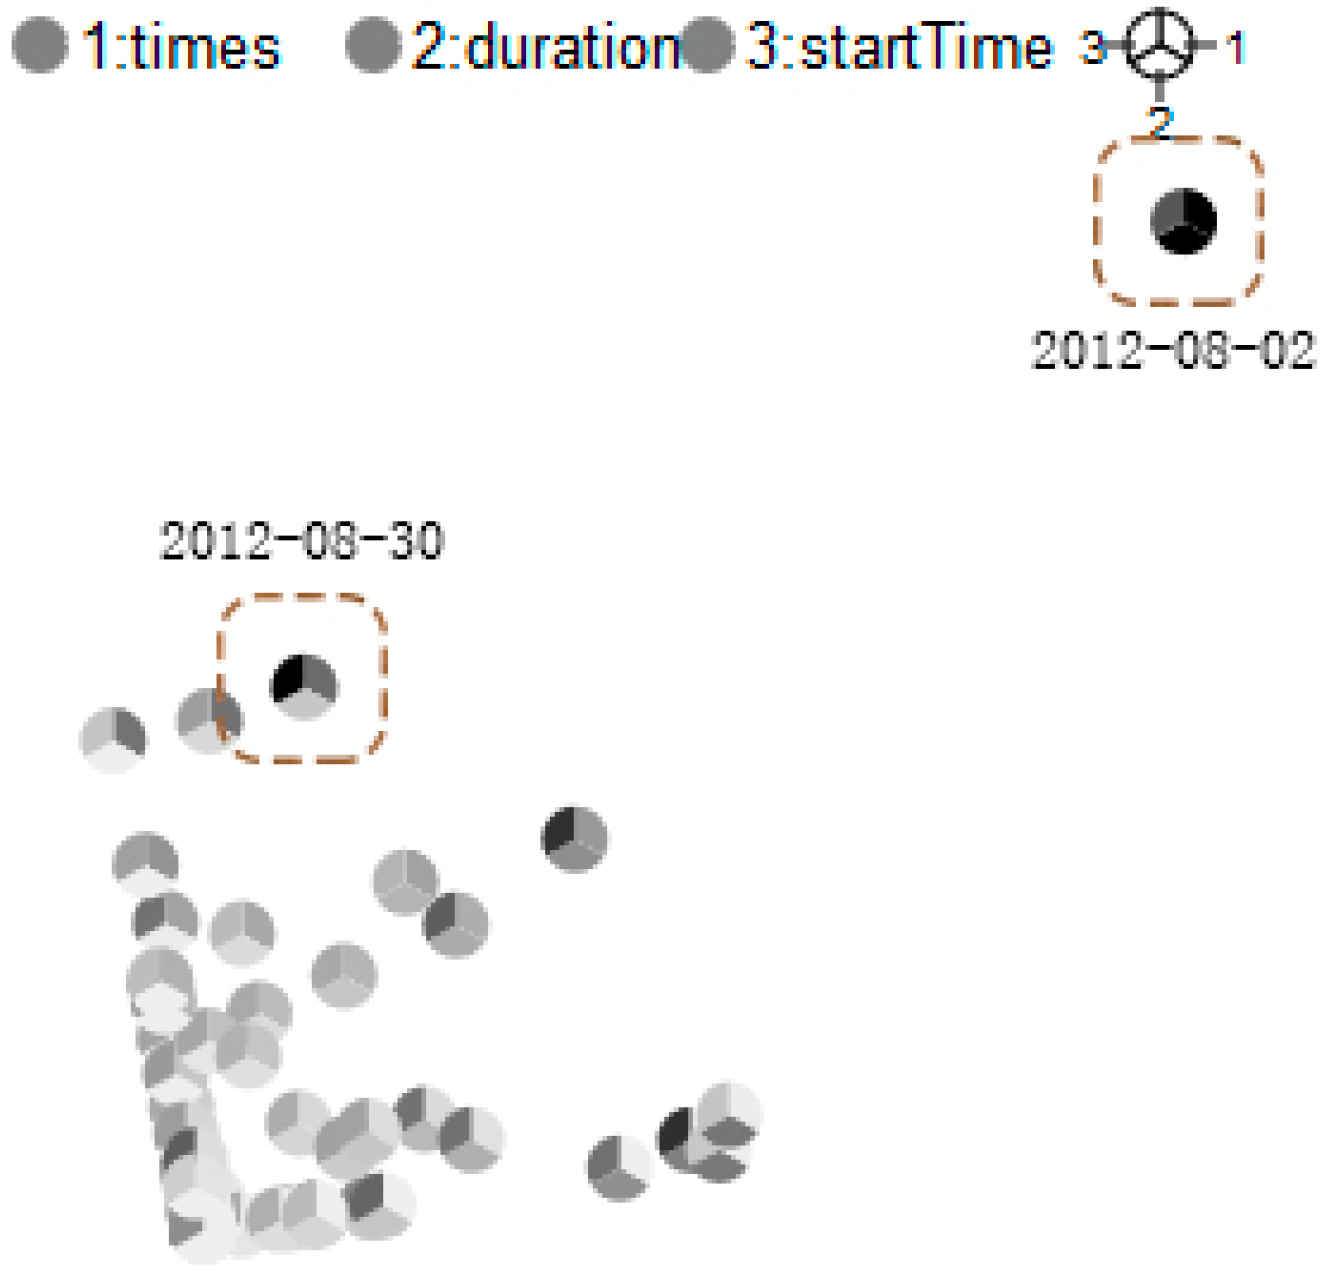
Anomaly Grading View is divided into three parts corresponding to three sections in Activity Tree Map. The view is designed to display activity anomaly grades, which are calculated by anomaly detection algorithm. Three results of calculation are normalized in interval [0, 1]. This part is a filter for data display in other views. In this view, we can choose different date intervals by dragging to locate the date of abnormal pattern. Besides, we can choose different dates by clicking to look over and compare details of residents’ activities. In Figure 1(2), we can see that, according to Times and Duration, the resident behaved abnormally on 2 August; according to Times and Start time, the resident behaved unusually on 30 August; and the 14 August activity abnormal value is relatively small.

5.3. Date Map View

In this map, based on anomaly degree obtained through three features, we project each date on plane using Multidimensional scaling (MDS). Every spot stands for a date, relative position of which shows residents’ activity status. Spots further from the cluster of spots, have higher comprehensive anomaly degrees, and vice versa. We divide each spot into three equal sectors and each sector stands for a kind of abnormity. Darker sector colors correspond to higher abnormity values. Clicking the circle options on topside, we can filter abnormal value of three sorts while when the mouse holds on one spot, the date represented by the spot will be shown just beside it. As shown in Figure 2, we can see that, on 2 August, the date with biggest anomaly degree, the resident’s abnormal values calculated in terms of Duration and Times are high, and anomaly degree of Start time is in the medium level. Meanwhile, we can see the date 30 August with a relatively high abnormal value is also far from the cluster of spots. The abnormal behavior dates can be looked at in more detail in the following analysis views.

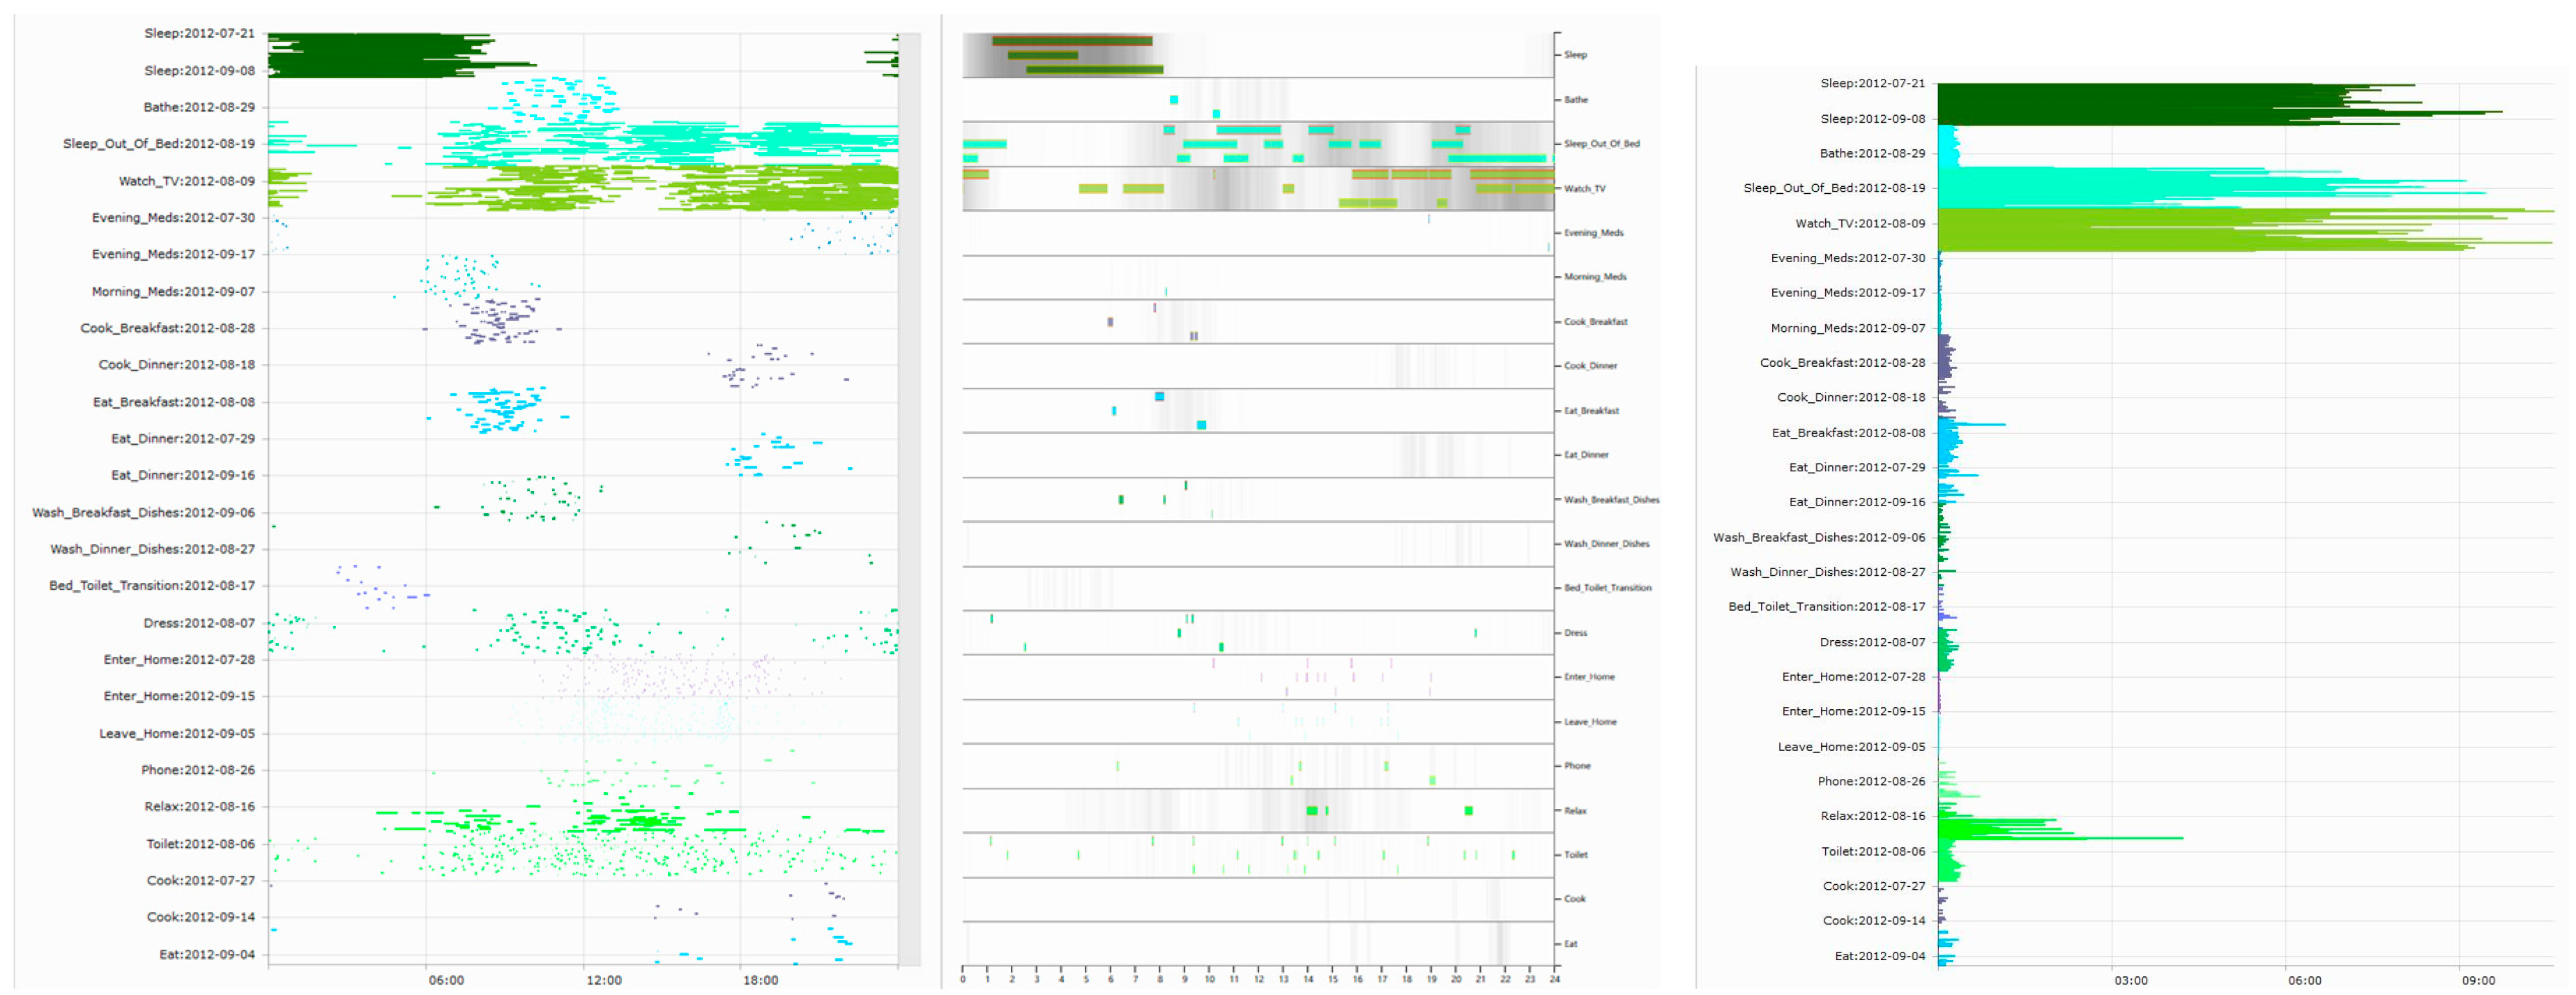
5.4. Gantt Chart View

Based on views or maps described above, to look into residents’ activity models in a period, researchers need to interactively look through various activity data in a certain period within smart home. First, Gantt chart is used to show the interactive information due to the residents’ activities can be ranked and filtered according to dates in the chart which could reduce screen space.
In Gantt Chart, we can choose to display information of specific dates and specific activities. The codification colors are the same as that used in Activity Tree Map View. X-axis in Gantt view is 24 h of a day, and Y-axis is the date, so it is very convenient to compare activities in different dates. For example, as shown in Figure 1(4), we can know that the resident go to bed very late on 22 August and there is a long interruption of sleep on 12 September. Furthermore, the Gantt chart allows users to display activities in layers in an interactive manner and to display accumulative duration of activities. By doing this, we can analyze time regularities and Duration characteristics more clearly and accurately. The details are shown in Figure 3.
Although Gantt Chart is convenient to get the comparison information from different dates, it sacrifices the spatial information of activities, and makes it difficult to discover the general rules of residents’ activities and the activity information of short duration. These shortcomings are solved by other views.

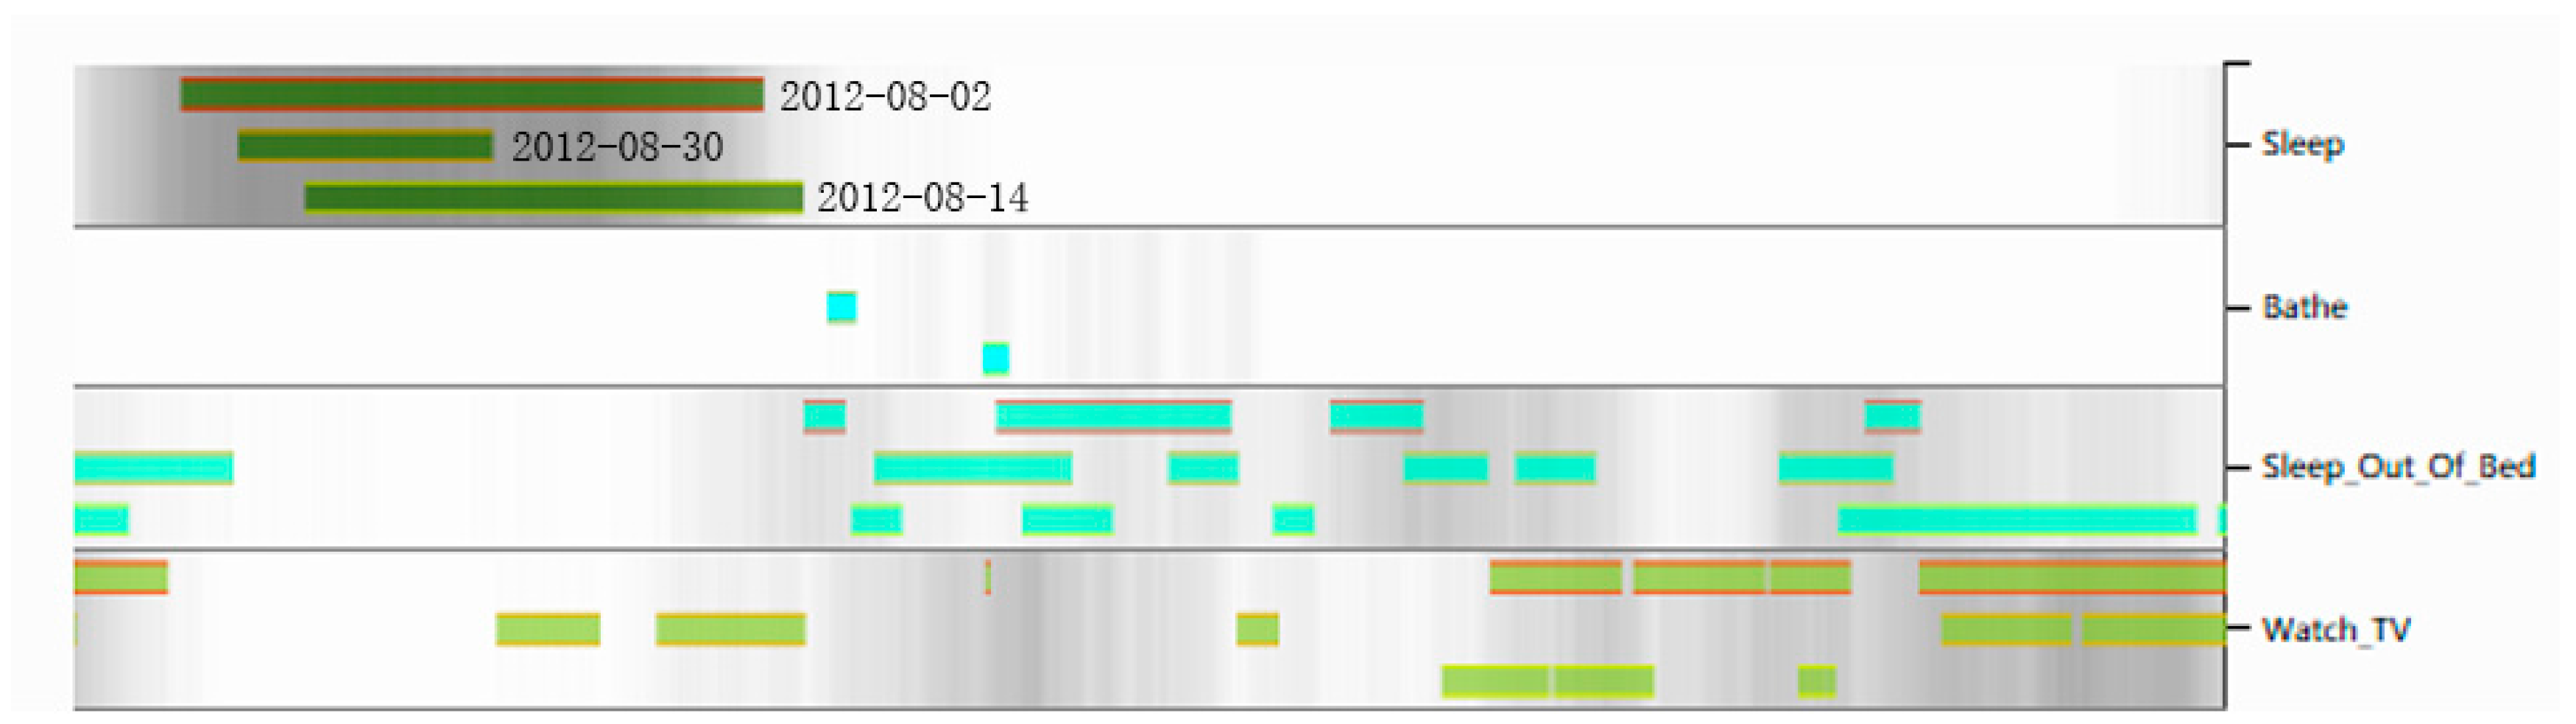
5.5. Heat Gantt Chart View
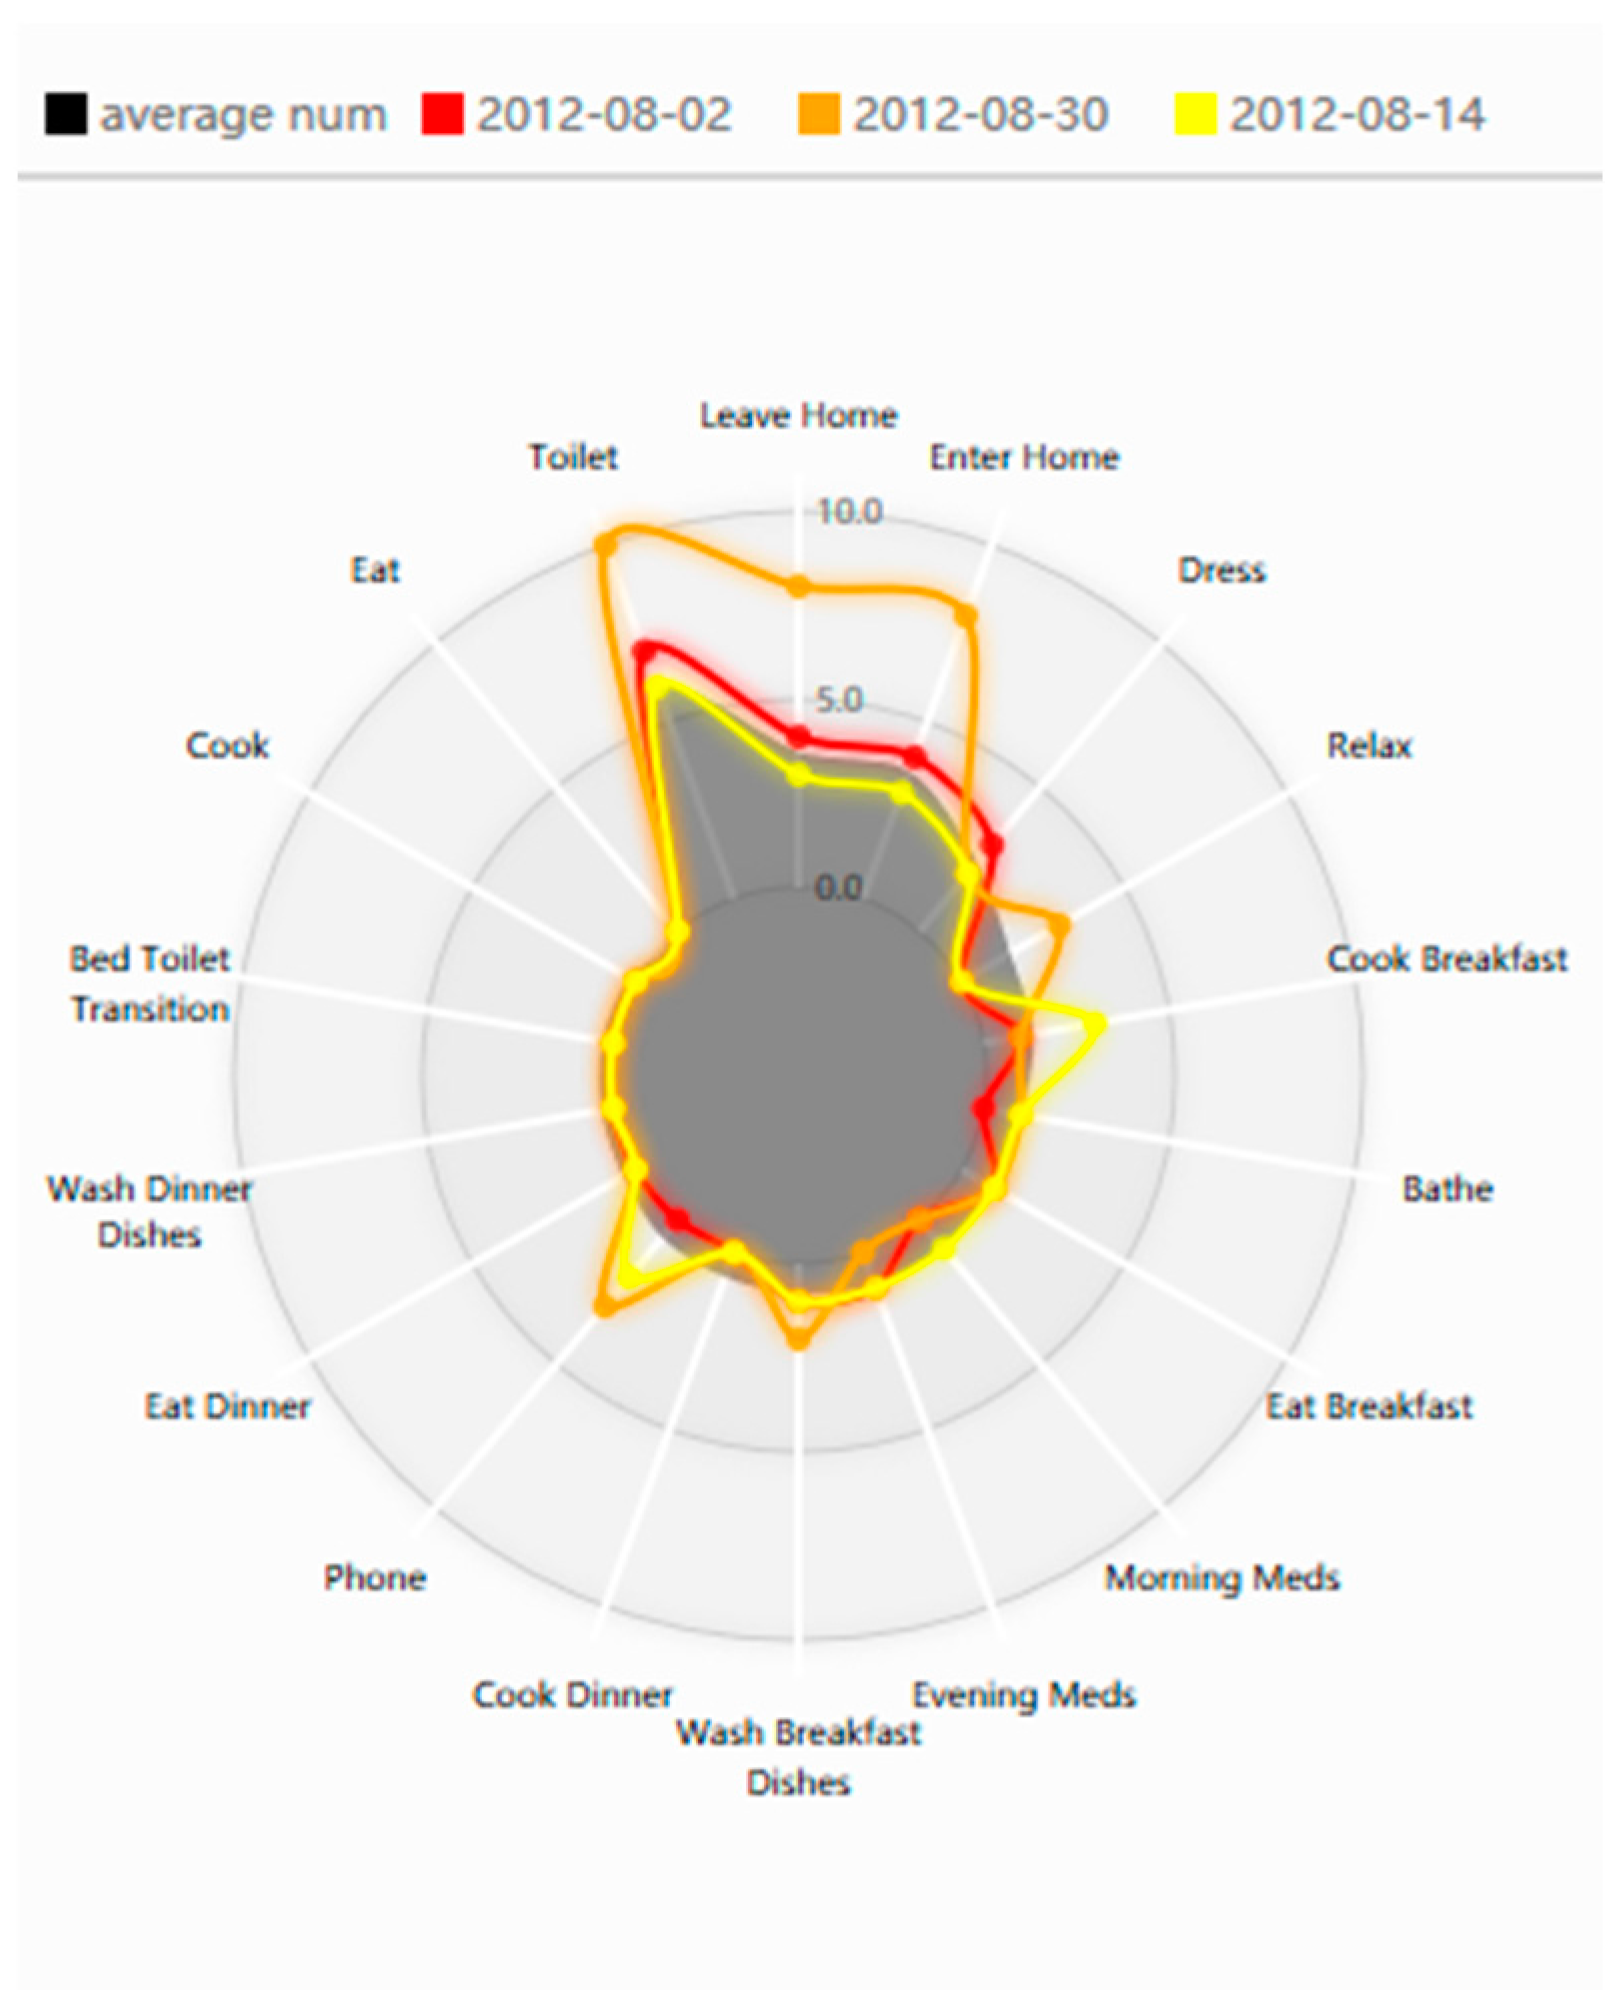
To solve the problem in Gantt Chart for discovering the general rules of residents’ activities, we use Heat Gantt Chart to explore these rules. First, we cluster the activities on each date, then we draw out probability of each activity occurred at each time point in 24 h using a grayscale heat Gantt Chart, where white means the activity occurs at that time on no day and deeper colors indicate greater probabilities the event occurred.
When a user selects a date in the view of activity anomaly degree, the system draws activities of the date in Heat Gantt Chart, thus it is convenient to compare the activity of the date to the general rules of the activity. If several dates are selected, the system will compare activities on these days. Generally we can select three dates each time at most and draw different segments representing different dates in the outlines of the activity rectangle. From the information shown in Figure 4, we can guess the resident perhaps has some troubles on 30 August 2012.

5.6. Radar Map View

To solve the problem in Gantt chart that it is difficult to explain the short duration activity information, we use Radar Map to explore these kinds of activities. The Radar Map uses frequency characteristics of activity to detect short-term behavior anomalies. The initial gray area of Radar Map refers to the average times of each selected activity. As shown in Figure 5, the Radar Map can compare the relationship of different dates, and the relationship between the values of a certain day with the average value, which helps recognize the date when the activity frequency presents anomaly. For example, we can see from Figure 5 that the activity frequency of the resident’s “toilet”, “leave home” and “enter home” are much higher than the average value on 30 August. The codification colors are in agreement with the counterparts in Heat Gantt Chart.

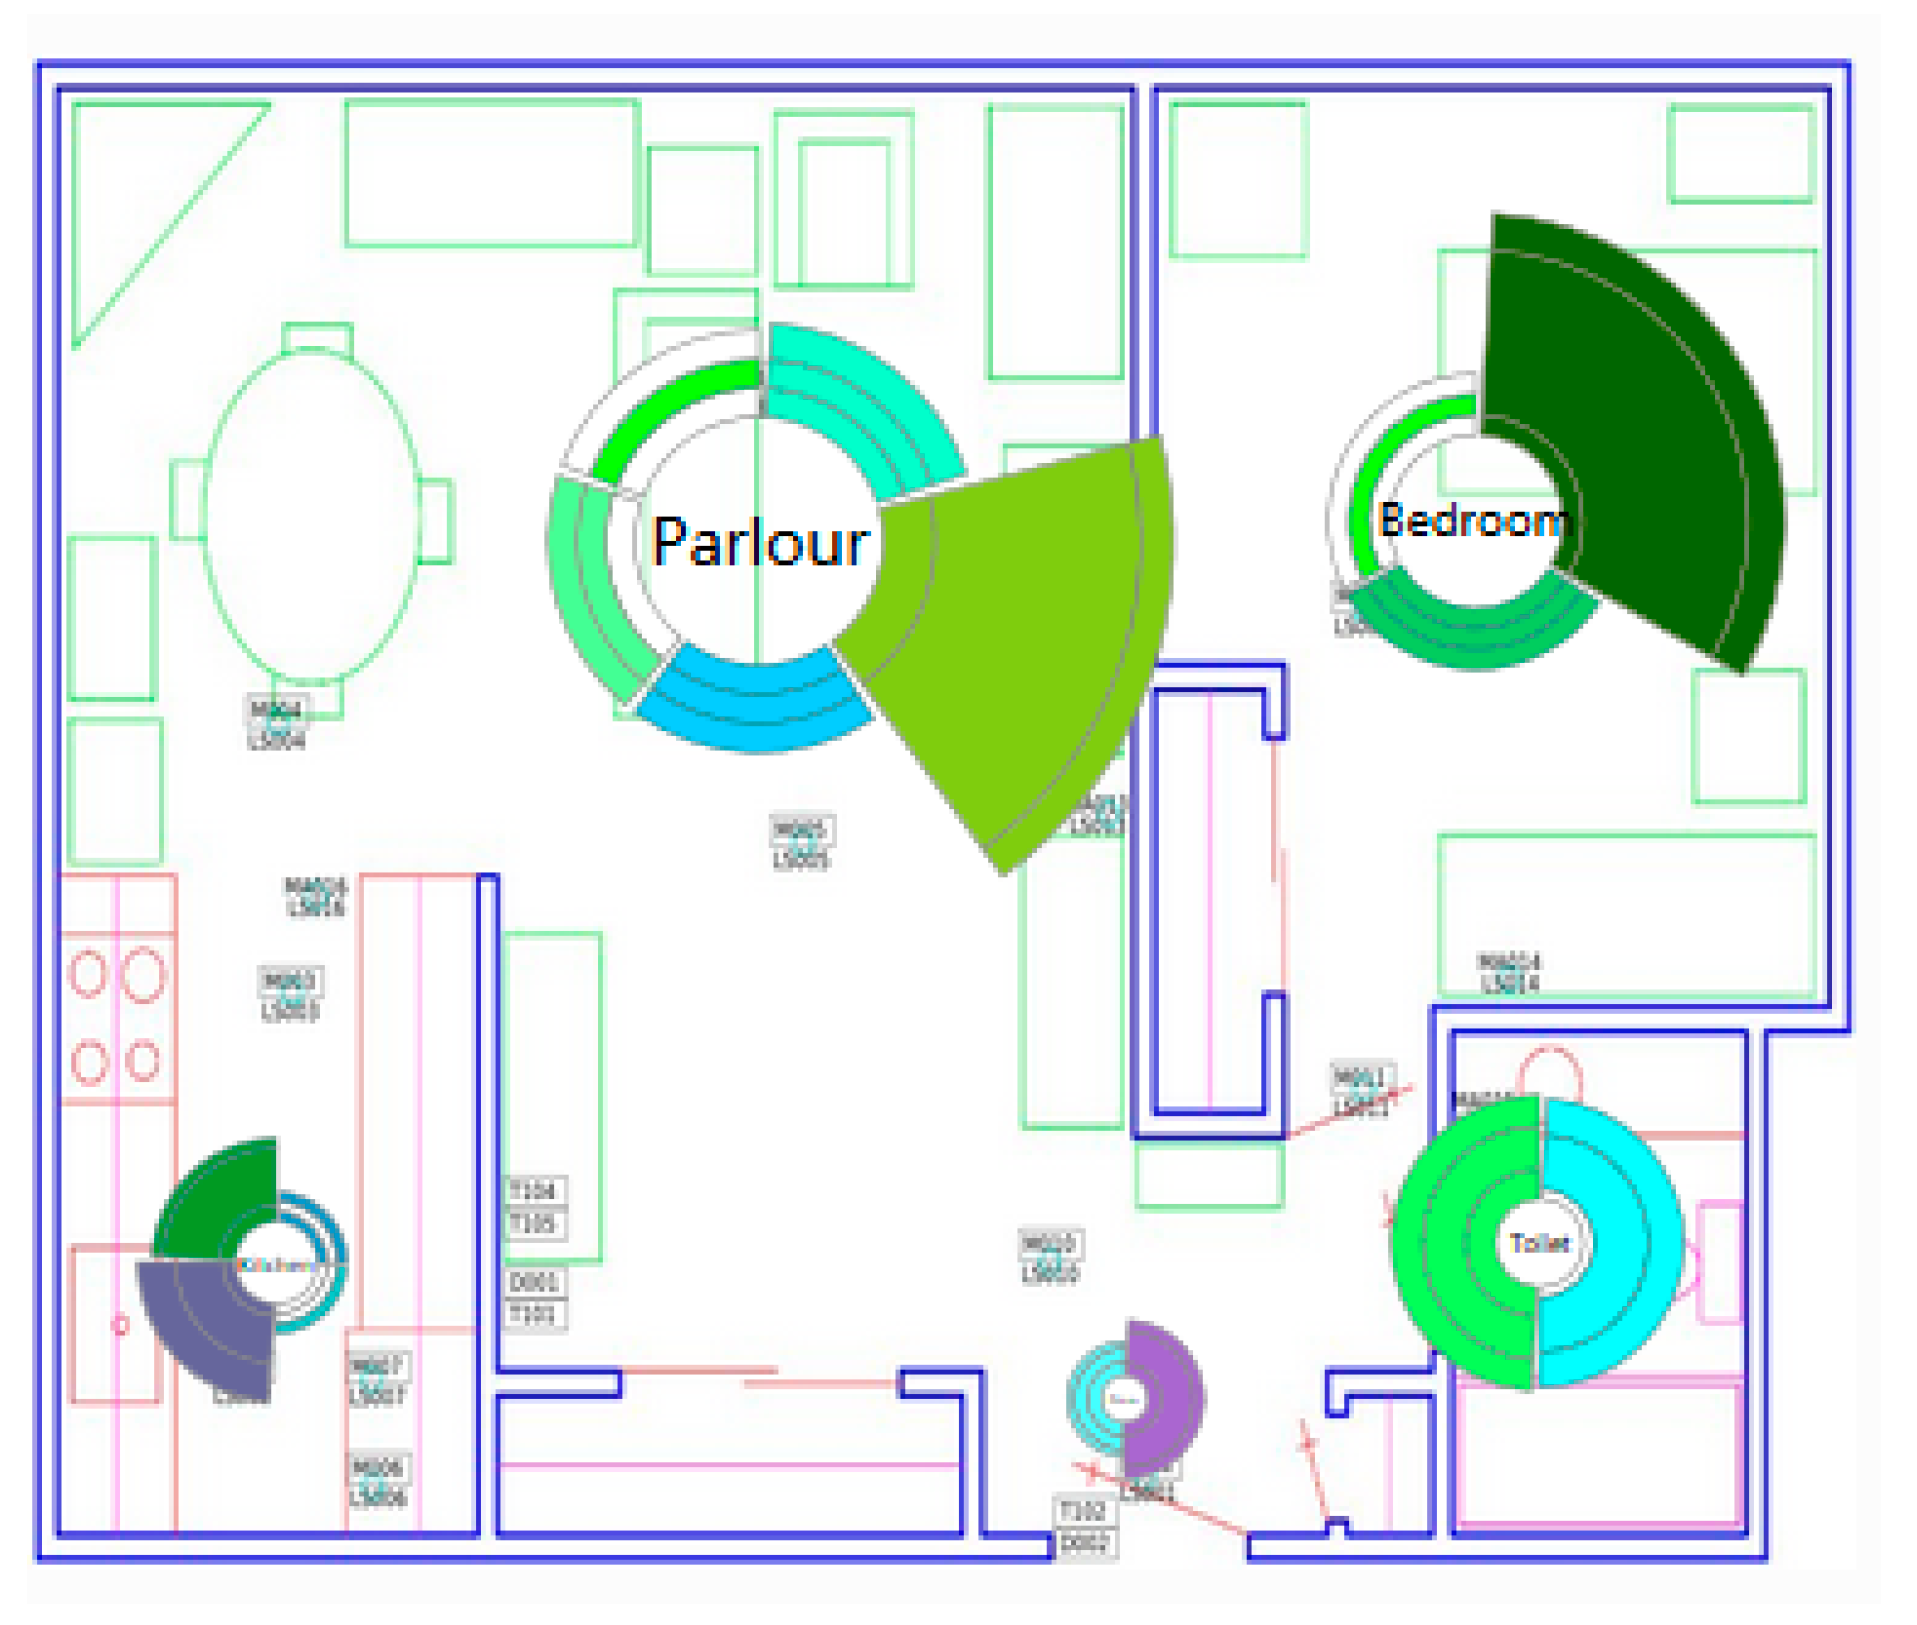
5.7. Space Radar Map View

We use Space Radar Map to solve the problem of missing activity space information in Gantt Chart. This view is used to show the spatial distribution of activities, and compare the duration of activities on different days. Figure 6 shows the duration of activities in different places for three days. The different colors represent different activities. The area is white when no activity occurs on that day. The date corresponds to the selected date of the Radar Map, the fill color is the same as that of the Gantt Chart. It is convenient to examine the spatial distribution of the activity. We should note that the image size of the corresponding date only represents the duration recorded by the sensor at this place triggered by the activity, which is not exactly equal to the duration of the activity on that day. As in Figure 6, the sensor-recorded duration triggered by the resident’s sleeping activity is quite long on 30 August, so it could be inferred that the sleeping quality of the inhabitant is rather poor. The fill color of the bathing area in the bathroom is white on 2 August, from which we can tell that the inhabitant did not take a bath that day.

6. Case Study

The data set consists of the information of an adult living in a smart domestic environment collected by various sensors. Based on the original data, we hope to use this system to analyze the daily behavior of the resident, and find out the date of anomaly behavior pattern and the reason for the anomaly.
The system first analyzes 30 kinds of residents’ activities and classifies activities according to the activity classification methods mentioned above, and then determines the strategy of calculating the anomaly for each activity. Furthermore, we can filter activities based on activity features to decide which activities can be used for the calculation of anomaly. Figure 1(1,2) shows the anomaly degree worked out using three methods of activity anomaly measurement and the weight of each activity used for calculations. Consequently, we can see that some daily activities with long duration and activities with strong regularity exert great influence on the measurement of anomaly. This regularity is in accord with the general knowledge of inhabitant’s activity. It can be seen in Figure 1(3) that most dates are gathered together, indicating that inhabitant’s activities of most dates correspond to their living habits, and only a few dates projected to the edge are judged as anomaly. The anomaly degree on 30 August, 2 August and 1 September arrives at the highest with the projective point at the remotest place from the cluster.
The start time and duration of inhabitants’ daily activities can be seen from the Gantt Chart of Figure 1(4). We choose 2 August, 30 August and 14 August for comparison and analysis. In Figure 1(5), we can see that the resident’s sleeping activity was quite normal on 2 August. However, the resident lacked the activity of bathing; the time of watching TV was longer than the average value; he/she did not take medicine as usually, and did not take a rest. On 30 August, the resident slept too short, while he/she slept a long time on the sofa, and did not take medicine both in the morning and in the evening. Regarding 14 August, it was a relatively normal day, on which the behavior pattern of the resident had no obvious anomaly. It can be seen in Figure 5 that the resident’s activity frequency showed great discrepancy with the average frequency on the radar map at the two days judged as anomaly. Especially, the resident had evident fluctuation in the times of going to toilet, leaving home, taking rest and medicine, and using phone on 30 August. The patient also presented such behavior phenomenon on 2 August, while the normal date of 14 August was nearer to the general activity routines, which accorded with the resident’s daily behavioral habits.
Figure 6 shows the duration of sensor at different places triggered by different activities, and the value does not refer to the activity duration of the resident at this place, as the resident would not trigger the sensor at that place after he/she slept in the bedroom. Triggering the sensor for many times will make the duration of triggering sensor longer, indicating the resident may have a poor sleep and get up many times. It can be concluded from the sleeping activity that the resident had a long sleep on 2 and 14 August, but the duration of triggering sensor was quite short, which proved a high quality of sleeping for the resident. The sleeping time on 30 August was quite short, but duration of triggering sensor is relatively long, which explained that the resident slept short and poor.

7. Conclusions

In this paper, we propose a new visual analytics system to analyze the abnormity of resident’s behavior pattern in the intelligent environment. Researchers can make analysis through anomaly recognition model without supervision and multi-view visual analysis system to find out the anomaly date of resident’s behavior pattern and examine the reason. It will be easy for the rapid check of resident’s activities using this system and for the comparison of inhabitant’s behavior at different dates, which is significant to find out resident’s bad habits and behavior that may influence their health. In the future, we hope that we can further classify the activities and determine the weight of each activity in calculating residents’ behavior anomaly to calculate more accurately and discover the anomaly of resident’s daily behavior more precisely.

Acknowledgments

This project is supported by the Fundamental Research Funds for the Central Universities of Central South University with No. 2016zzts371, Hunan Provincial 2011 Collaborative Innovation Center for Development and Utilization of the Financial and Economic Big Data Property and the National Natural Science Foundation of China under Grant Nos. 61402540 and 61672538. We would like to thank the Center for Advanced Studies in Adaptive Systems (CASAS) at Washington State University for making available the data set. Ying Zhao and Xiaoping Fan are co-corresponding authors of this work.

Author Contributions

Zhifang Liao and Ying Zhao, Fanngfang Zhou conceived and designed the system; Lingyuan Kong and Xiao Wang performed the experiments and realized the system; Zhining Liao collected the data; Xiaoping Fan offered useful suggestions for the preparation and writing the paper; Zhifang Liao and Lingyuan Kong wrote the paper.

Conflicts of Interest

The authors declare no conflict of interest.

References

  1. Acampora, G.; Cook, D.J.; Rashidi, P.; Athanasios, V.V. A Survey on Ambient Intelligence in Healthcare. Proc. IEEE Inst. Electr. Electron. Eng. 2013, 101, 2470–2494. [Google Scholar] [CrossRef] [PubMed]
  2. Luo, X.; Zhang, D.; Yang, L.T.; Liu, J.; Chang, X.; Ning, H. A Kernel Machine-based Secure Data Sensing and Fusion Scheme in Wireless Sensor Networks for the Cyber-physical Systems. Future Gen. Comput. Syst. 2016, 61, 85–96. [Google Scholar] [CrossRef]
  3. Dawadi, P.N.; Cook, D.J.; Schmitter-Edgecombe, M. Automated Cognitive Health Assessment Using Smart Home Monitoring of Complex Tasks. IEEE Trans. Syst. Man Cybern. Syst. 2013, 43, 1302–1313. [Google Scholar] [CrossRef] [PubMed]
  4. Rashidi, P.; Cook, D.J. COM: A Method for Mining and Monitoring Human Activity Patterns in Home-based Health Monitoring Systems. ACM Trans. Intell. Syst. Technol. 2013, 4, 64. [Google Scholar] [CrossRef]
  5. Dawadi, P.N.; Cook, D.J.; Schmitter-Edgecombe, M. Automated Cognitive Health Assessment from Smart Home-Based Behavior Data. IEEE J Biomed. Health Inform. 2015, 20, 1188–1194. Available online: http://ieeexplore.ieee.org/stamp/stamp.jsp?arnumber=7206522 (accessed on 1 March 2017). [Google Scholar] [CrossRef] [PubMed]
  6. Noury, N.; Berenguer, M.; Teyssier, H.; Bouzid, M.J.; Giordani, M. Building an Index of Activity of Inhabitants from Their Activity on the Residential Electrical Power Line. IEEE Trans. Inform. Technol. Biomed. 2011, 15, 758–766. [Google Scholar] [CrossRef] [PubMed]
  7. Suryadevara, N.K.; Mukhopadhyay, S.C. Wireless Sensor Network Based Home Monitoring System for Wellness Determination of Elderly. IEEE Sens. J. 2012, 12, 1965–1972. [Google Scholar] [CrossRef]
  8. Cook, D.J. How Smart is Your Home? Science 2012, 335, 1579–1581. [Google Scholar] [CrossRef] [PubMed]
  9. Kim, E.; Helal, S.; Cook, D. Human Activity Recognition and Pattern Discovery. IEEE Pervasive Comput. 2010, 9, 48–53. [Google Scholar] [CrossRef] [PubMed]
  10. Krishnan, N.C.; Cook, D.J. Activity Recognition on Streaming Sensor Data. Pervasive Mob. Comput. 2014, 10, 138–154. [Google Scholar] [CrossRef] [PubMed]
  11. Liao, Z.; Liu, M.; Song, T.; Kuang, L.; Zhang, Y.; Liao, Z. Markov Chain-Like Model for Prediction Service Based on Improved Hierarchical Particle Swarm Optimization Cluster Algorithm. Int. J. Softw. Eng. Knowl. Eng. 2016, 26, 653–674. [Google Scholar] [CrossRef]
  12. Das, B.; Cook, D.J.; Krishnan, N.C.; Schmitter-Edgecombe, M. One-class Classification-based Real-time Activity Error Detection in Smart Homes. IEEE J. Sel. Top. Signal Process. 2016, 10, 914–923. [Google Scholar] [CrossRef] [PubMed]
  13. Shin, J.H.; Lee, B.; Park, K.S. Detection of Abnormal Living Patterns for Elderly Living Alone Using Support Vector Data Description. IEEE Trans. Inf. Technol. Biomed. 2011, 15, 438–448. [Google Scholar] [CrossRef] [PubMed]
  14. Zhao, W.; Lun, R.; Gordon, C.; Fofana, A.B.M.; Espy, D.D.; Reinthal, M.A.; Ekelman, B.; Goodman, G.D.; Niederriter, J.E.; Luo, X. A Human-centered Activity Tracking System: Toward a Healthier Workplace. IEEE Trans. Hum. Mach. Syst. 2016, PP, 1–13. [Google Scholar] [CrossRef]
  15. Aran, O.; Sanchez-Cortes, D.; Do, M.T.; Gatica-Perez, D. Anomaly Detection in Elderly Daily Behavior in Ambient Sensing Environments. In Proceedings of the International Workshop on Human Behavior Understanding, Amsterdam, The Netherlands, 16 October 2016; pp. 51–67.
  16. Alcalá, J.; Parson, O.; Rogers, A. Detecting Anomalies in Activities of Daily Living of Elderly Residents via Energy Disaggregation and Cox Processes. In Proceedings of the 2nd ACM International Conference on Embedded Systems for Energy-Efficient Built Environments, Seoul, South Korea, 4–5 November 2015; pp. 225–234.
  17. Cao, N.; Shi, C.; Lin, S.; Lu, J.; Lin, Y.R.; Lin, C.Y. TargetVue: Visual Analysis of Anomalous User Behaviors in Online Communication Systems. IEEE Trans. Vis. Comput. Gr. 2015, 22, 280–289. [Google Scholar] [CrossRef] [PubMed]
  18. Zhao, J.; Cao, N.; Wen, Z.; Song, Y. #FluxFlow: Visual Analysis of Anomalous Information Spreading on Social Media. IEEE Trans. Vis. Comput. Gr. 2014, 20, 1773–1782. [Google Scholar]
  19. Ivanov, Y.; Wren, C.; Sorokin, A.; Kaur, I. Visualizing the History of Living Spaces. IEEE Trans. Vis. Comput. Gr. 2007, 13, 1153–1160. [Google Scholar] [CrossRef]
  20. Kim, S.Y.; Yun, J.; Mellema, A.; Ebert, D.S.; Collinss, T. Visual Analytics on Mobile Devices for Emergency Response. Available online: http://ieeexplore.ieee.org/stamp/stamp.jsp?arnumber=4388994 (accessed on 1 March 2017).
  21. Liao, Z.; Yu, Y.; Chen, B. Anomaly Detection in GPS Data Based on Visual Analytics. Available online: http://ieeexplore.ieee.org/xpls/icp.jsp?arnumber=7206522 (accessed on 1 March 2017).
  22. Liao, Z.F.; Li, Y.; Peng, Y.; Zhao, Y.; Zhou, F.F.; Liao, Z.N.; Dudley, S.; Ghavami, M. A Semantic-enhanced Trajectory Visual Analytics for Digital Forensic. J. Vis. 2015, 18, 173–184. [Google Scholar] [CrossRef]
  23. Röhlig, M.; Luboschik, M.; Krüger, F.; Kirste, T.; Schumann, H.; Bögl, M.; Alsallakh, M.; Miksch, S. Supporting Activity Recognition by Visual Analytics. In Proceedings of the 2015 IEEE Conference on Visual Analytics Science and Technology (VAST), Chicago, IL, USA, 25–30 October 2015; pp. 41–48.
  24. Cook, D.; Crandall, A.; Thomas, B.; Krishnan, N. CASAS: A Smart Home in a Box. IEEE Comput. 2013, 46, 62–69. [Google Scholar] [CrossRef] [PubMed]
Figure 1. Overview of the visualization views.
Applsci 07 00254 g001
Figure 2. Date map.
Figure 2. Date map.
Applsci 07 00254 g002
Figure 3. Left Gantt chart display activities in categories corresponding to heat Gantt charts. Right Gantt chart calculates out duration of each activity of each date. Thus, we can check the total duration of a particular activity on a particular date.
Applsci 07 00254 g003
Figure 4. Comparison four activities within three days through Heat Gantt Chart. We can discover the resident sleep activity lasted a short time on 30 August 2012, and the resident slept late on 14 August. We can also find that the residents’ Sleep Out Of Bed activities continued until the early hours of 30 August 2012, and on that same day the inhabitant watched TV for a long time during a time that he/she habitually sleeps.
Applsci 07 00254 g004
Figure 5. Radar Map: Each axis from the center represents a short-term activity, the grey part refers to the average times of each selected activity, and the different colors refer to different days, where the codification colors are the same as those in Heat Gantt Chart.
Applsci 07 00254 g005
Figure 6. Space Radar Map: One circle refers to one room, and each circle represents the three-day activity selected in the other views, from inside to outside. Sectors with different colors, besides the circle, refer to sensor-recorded duration triggered by different activity.
Applsci 07 00254 g006
Table 1. Data from sensors.
TimestampSensor IDSensor StatusActivity ID
20 July 2012 11:09:18.952332MA015ONToilet = “begin”
20 July 2012 11:09:20.156992MA015OFF
20 July 2012 11:09:21.252048MA015ON
20 July 2012 11:09:25.563333MA015OFF
Table 2. Characteristics analysis of various activities.
ActivityDurationSceneStart TimeTimesIncidence
Enter Homeshortregularirregularirregular1
Leave homeshortregularirregularirregular1
Dressshortregularirregularirregular0.98
Phoneshortregularirregularirregular0.33
Cookshortregularirregularirregular0.22
Eatshortregularirregularirregular0.216
Bed toilet transitionshortregularirregularirregular0.28
Toiletshortregularirregularirregular1
Sleep Out of Bedlongregularirregularirregular1
Relaxlongregularirregularirregular0.58
Watch TVlongregularirregularirregular1
Entertain guestslongirregularregularirregular0.066
Groomshortregularregularirregular0.37
Work at Tableshortregularregularirregular0.05
Readshortregularregularirregular0.45
Batheshortregularregularregular0.93
Sleeplongregularregularregular0.98
Table 3. Activity characteristics used in calculation.
FeaturesDurationTimesStart Time
Activity can be selected fromSleep, Read, Watch TV, Sleep Out of Bed, RelaxEnter Home, Leave home, Dress, Phone, Cook, Eat, Bed Toilet Transition, Toilet, Groom, Cook Lunch, Eat Lunch, Wash Lunch, Personal Hygiene, Wash Dishs, Bathe, Evening Meds, Morning Meds, Cook Dinner, Cook Breakfast, Eat Breakfast, Eat Dinner, Wash Dinner, Wash BreakfastBathe, Evening Meds, Morning Meds, Cook Breakfast, Eat Breakfast, Wash Breakfast, Sleep

