Article

Coupled Effect of Expansion Ratio and Blade Loading on the Aerodynamics of a High-Pressure Gas Turbine

Laboratorio di Fluidodinamica delle Macchine, Energy Department Politecnico di Milano, Via Lambruschini, 4, 20158 Milano, Italy
*
Author to whom correspondence should be addressed.
Appl. Sci. 2017, 7(3), 259; https://doi.org/10.3390/app7030259
Submission received: 31 January 2017 / Accepted: 1 March 2017 / Published: 7 March 2017
(This article belongs to the Special Issue Gas Turbines Propulsion and Power)

Abstract

:
The need of a continuous improvement in gas turbine efficiency for propulsion and power generation, as well as the more demanding operating conditions and power control required to these machines, still ask for great efforts in the design and analysis of the high pressure section of the turbo-expander. To get detailed insights and improve the comprehension of the flow physics, a wide experimental campaign has been performed in the last ten years at Politecnico di Milano on the unsteady aerodynamics of a high-pressure turbine stage considering several operating conditions. This paper presents and discusses the experimental results obtained for the stage operating with different expansion ratios and rotor loading. The turbine stage under study is representative of a modern high-pressure turbine and can be operated in both subsonic and transonic conditions. The experimental tools applied for the current research represents the state of the art when unsteady investigations are foreseen. The detailed flow field, the blade–rows interaction and the overall performance are described and discussed; efforts have been devoted to the discussion of the various contribution to the overall stage efficiency. The direct effects of the expansion ratio, affecting the Reynolds and the Mach numbers, have been highlighted and quantified; similarly, the indirect effects, accounting for a change in the rotor loading, have been commented and quantified as well, thanks to a dedicated set of experiments where different rotor loadings at the same expansion ratio have been prescribed.

1. Introduction

Among the complex targets of gas turbine research, the aerodynamics of the high-pressure section of the turbine (HPT) involve several complex phenomena and still offer a margin for the optimization of future gas turbine systems. The high stage loading and the low aspect ratio typical of HPT blading induce transonic flows, complex shock patterns and large secondary vortices. These effects, coupled with the use of small axial gaps for compactness, drive a severe unsteadiness in the flow of HPTs. In this context, the power control of aero-engines as well as of stationary gas turbines changes the HPT operating point, altering the loading level and the flow regime in the blade rows from transonic to subsonic conditions; these variations in operation may lead to penalties in the efficiency on the HPT and on the whole multistage turbomachine as well.
To develop a comprehensive analysis of a HPT, a proper characterization of the unsteady and three-dimensional flow is required to highlight the individual flow features of the stator and of the rotor blade rows, as well as to identify the several blade–row interaction mechanisms.
The interaction promoted by stator wakes has been widely studied in the literature (see, for example, [1]); the wakes, chopped in segments by the rotor leading edge, are intermittently released downstream of the stage along fixed trajectories, called wake avenues, determined by the turbine-exit (absolute) flow direction [2,3]. In low aspect ratio stages, where endwall flows are relevant, the stator wake, potential field and secondary flows also promote interaction mechanisms with the rotor flow field, affecting the generation and development of the rotor secondary flows, and hence resulting in relevant unsteady effects at the stage exit. Several studies [4,5,6,7,8,9,10,11] focused on the transport of the incoming vortices within the rotor channel and their interaction with the rotor secondary flows; the dependence of these effects on the cascade incidence [12] and on the axial gap [13] was also investigated.
In the case of transonic turbines, shocks can also promote significant unsteady effects, especially on the rotor aerodynamics. In particular, the sweeping of the vane trailing edge shocks in front of the rotor can induce large fluctuations on the rotor loading [14,15,16,17], triggering the unsteadiness on the rotor wake [18,19] and on the rotor secondary flows [20], as well as inducing periodic oscillations in the total pressure distribution downstream of the stage [21]. Finally, the aero-thermal behavior of the HPT is further complicated by the film cooling and the interaction with the combustor, which introduces time-dependent gradients in total pressure and total temperature as well as whirling flow at the stage inlet. These features were found to considerably affect the aerodynamics and the heat transfer [22,23,24] as well as the aero-acoustic behavior [25] of the HPT.
All the aforementioned phenomena are influenced by the Reynolds and Mach number at which the stage operate and are expected to be modified by changes in the HPT operating condition. In principle, these features can be predicted by resorting to Similarity Theory, which introduces non-dimensional quantities to scale the operating and the geometrical parameters. However, for several reasons (mainly for the temperature levels) the full similarity cannot be guaranteed among the different conditions, especially during the gas turbine off-design operation. The prediction of the off-design performance of HPTs is, therefore, a complex as well as crucial target that demands dedicated studies.
In this paper, an experimental analysis of the impact of the expansion ratio on an uncooled research HPT is proposed. In the frame of the FP7 European funded research project “REsearch on COrenoise ReDuction” (RECORD), the research HPT installed in the high-speed close-loop test rig of the Politecnico di Milano was operated in four different conditions, ranging from an almost incompressible flow regime to transonic conditions, by imposing the same mean (absolute) flow direction at the stage exit. This latter constraint matches with relevant technical requirements of the whole system, with the aim to feed the intermediate turbine duct and the intermediate/low pressure turbine as close as possible to their design condition. Some studies discuss the time-mean effects of expansion ratio on the aerodynamics of linear cascades [26] or those of rotational speed in turbines operated in low subsonic conditions [27]; however, the impact of the expansion ratio on the unsteady aerodynamics of a full turbine stage, and in particular on the stator–rotor interaction, is still to be investigated. The present paper aims at filling this gap by comparing different operating conditions with the same stage geometry featured by different flow regimes, and considering both time-averaged and unsteady flow features. Moreover, as the change in expansion ratio has not only “direct” implications on the Reynolds and Mach number level, but has also “indirect” impact on the rotor aerodynamic loading, the experimental data-base was enriched by a set of tests on the stage operated with different rotational speed at the same expansion ratio. This further set of data, which highlights the impact of the change in aerodynamic loading only, are instrumental for properly decoupling the direct from the indirect effects of expansion ratio.
The paper is organized as follows. First, a description of the test rig layout and of the instrumentation is provided. Second, the variation in the stator flow field with the flow regime is analyzed by means of pitch-wise averaged profiles of the flow quantities and by maps on the secondary plane. Then, the rotor-exit flow field and the vane–rotor interaction effects are discussed for different conditions. Finally, a discussion on the impact of the operating conditions on the flow released by the stage, on the contribution of the different effects and on the stage performance concludes the paper.

2. Experimental Setup

The experimental investigation documented in this paper was performed in the High-Speed Closed-Loop Test Rig facility of the Laboratorio di Fluidodinamica delle Macchine (LFM) of Politecnico di Milano (Italy). The facility is equipped with a high-speed centrifugal compressor (internally designed and manufactured) that provides flow rate and pressure ratio to the axial-flow turbine stage; in between the two machines, a cooler is used to set the temperature level of the turbine main flow. The thermal stability of the tests is within ±0.5 °C. The machines are connected to reversible Direct Current engines that allow a continuous and independent control of the rotational speed, in such a way that the angular speed and the expansion ratio of the turbine can be set independently.
Figure 1 provides a schematic view of the turbine section. The turbine stage is fed by a centripetal guide vane composed by 30 high-lift profiles specifically designed to release a meridional flow at the turbine inlet, followed by a straightener. Downstream of the honeycomb, the straight annular duct of 50 mm span connects the volute to the turbine stage. Downstream of the stage the channel span enlarges to 60 mm by reducing the hub radius to exploit a diffuser effect.
The research turbine, whose geometry is not restricted, is representative of a modern highly loaded, low aspect ratio, single-stage HPT operating in subsonic/transonic conditions. The blade profiles and the main geometrical features of the machine are reported in Table 1; both the stator and rotor blades were designed applying fully 3D design concepts, such as twist, lean and lean compound. Even though the facility allows testing different axial gap configurations, in the present study only one axial gap, equal to the vane axial chord, is considered. Full details on the test rig and the HPT stage can be found in [28]; the time-mean and unsteady aerodynamics as well as the performance of this turbine operated in subsonic conditions were extensively studied in the last decade [10,11,12,13].
Several measurement techniques, whose uncertainties are reported in Table 2, were applied to investigate the flow in the turbine throughout this research. At first, conventional total pressure and total temperature measurements were performed upstream of the stage to monitor the stage inflow boundary conditions.
To characterize the inlet endwall boundary layer, the span-wise profile of inlet total pressure was measured with a flattened total pressure probe (probe head dimension 0.5 mm) traversed 1.5 stator axial chord upstream of the stator leading edge: a flat profile of uniform total pressure was found between 20% and 80% of the span. A hot wire probe was also traversed upstream of the stage to determine the inflow turbulence intensity, which resulted 2.5% at midspan and increased to 4% close to the duct endwalls.
The three-dimensional time-averaged flow field downstream of the stator was measured with a 5-Hole Probe (5HP) located 32% of the stator axial chord downstream of the stator trailing edge. The 5HP was calibrated in a reference nozzle up to Mach number equal to 1. The probe head dimension is 1.4 mm and the sensitive area is overhung 30 mm with respect to the stem to minimize the stem blockage in the measurement section. The measurement grid consists of 32 points over the blade height and 41 points along the stator pitch.
The unsteady flow field downstream of the rotor was measured by a cylindrical single-sensor Fast Response Aerodynamic Pressure Probe (FRAPP) at an axial distance of 32% of the rotor axial chord downstream of the rotor trailing edge. The FRAPP is operated as a virtual three-sensor probe, by means of multiple rotations around its own stem, and allows reconstructing the periodic component of the flow phase-locked on the rotor blade passage by means of ensemble averaging. As a result, the phase-resolved components of total and static pressure and of blade-to-blade flow angle are determined. The probe was calibrated up to Mach number equal to 0.8 in a reference nozzle. Dedicated dynamic calibration showed a dynamic response of 80 kHz after digital compensation [29]. The measurement grid consists of 20 points over the blade height, 49 over the rotor pitch and 11 stator–rotor interaction positions.
Finally, a miniaturized thermocouple was traversed upstream and downstream of the stage to measure the total temperature drop across the stage.
Uncertainties for the flow rate, measured by means of a venture nozzle, for the total pressure loss and for the efficiency, calculated by means of pressure and velocity triangles, are reported in Table 2. For these quantities, the repeatability and statistics are also taken into account.

3. Operating Conditions

Two sets of operating conditions were considered for the present investigation. The first group of conditions, denoted as OP in the following, is composed by four configurations tested to characterize the effect of the expansion ratio, ranging from an almost incompressible (OP4) to a transonic one (OP1) including two intermediates (OP3 and OP2) classified according to the expansion ratio. It has to be noted that OP3 is the reference condition for this stage. The second group of conditions, denoted OPL in the following, includes three further configurations close to OP3 and tested to investigate the effects of rotor loading only at constant expansion ratio, namely almost eliminating the Mach and Reynolds effects: these OPLs are reference as OPLU for the unloaded case, OPLR for the reference and OPLL for the loaded one.
As discussed in the Introduction, the pair of expansion ratio and rotational speed in OP1-4 were chosen in order to have the same absolute flow angle at the stage outlet. Notably, as this turbine has a fully three-dimensional geometry and the secondary flows alter the flow pattern at the endwalls, the constraint was imposed on the midspan region, as shown in Figure 2, which reports about measured flow angle distributions at the stage exit.
In order to change the rotor loading, the rotational speed was modified for the same expansion ratio, thus modifying the incidence angle on the rotor and the rotor outlet flow angle, but not significantly the Reynolds and Mach number levels. Due to constraints in the rig operation, the stage inlet temperature was set in the range of 300–325 K with a constant outlet pressure, close to the atmospheric one; Table 3 summarizes the main stage features for the several OP and OPL tested. As the different expansion ratios are achieved by pressurizing the turbine incoming flow, the inlet Mach number weakly varies ranging from M = 0.12 to 0.145; the inlet direction is always axial (thanks to the straightener) and the non-dimensional inlet velocity profile as well as the inflow turbulence intensity do not change. By applying the similarity concepts, the OP1-4 can be expressed in terms of non-dimensional flow rate, peripheral Mach number and expansion ratio, as well as flow and load coefficients, as reported in Table 4.
As clearly visible from the tabular data, the non-dimensional parameters indicate that these OP are not in a fully similarity condition even though a similarity in the outlet velocity directions imposed. The obvious reason lies in the change of the Mach number that cannot be kept constant as this constraint would have required a very high change in the inlet temperature [T/Tref = (rps/rpsref)2], not feasible in the LFM facility nor in a real gas turbine operation. As a result, the inter blade row region has to deal with the change in the kinematic similarity; in other words, the effect of the compressibility is to introduce a deviation in the U/V1 ratio. The following Sections discuss the impact of these deviations on the flow configuration as well as on the overall stage performance.

4. Results

This Section presents the experimental results for the different OP and OPL, first focusing on the effect of expansion ratio, both in the inter blade region and downstream of the rotor. To isolate the loading effects, OP3U and OP3L are then presented and discussed in comparison with the other OP.

4.1. Inter Blade Row Flow Field for Different Expansion Ratios: OP1–OP4

In this section, the flow field in-between the blade rows is discussed for the four operating conditions, to provide an overview on the aerodynamics of the stator cascade and a reference for the subsequent discussion of the rotor-exit flow field.
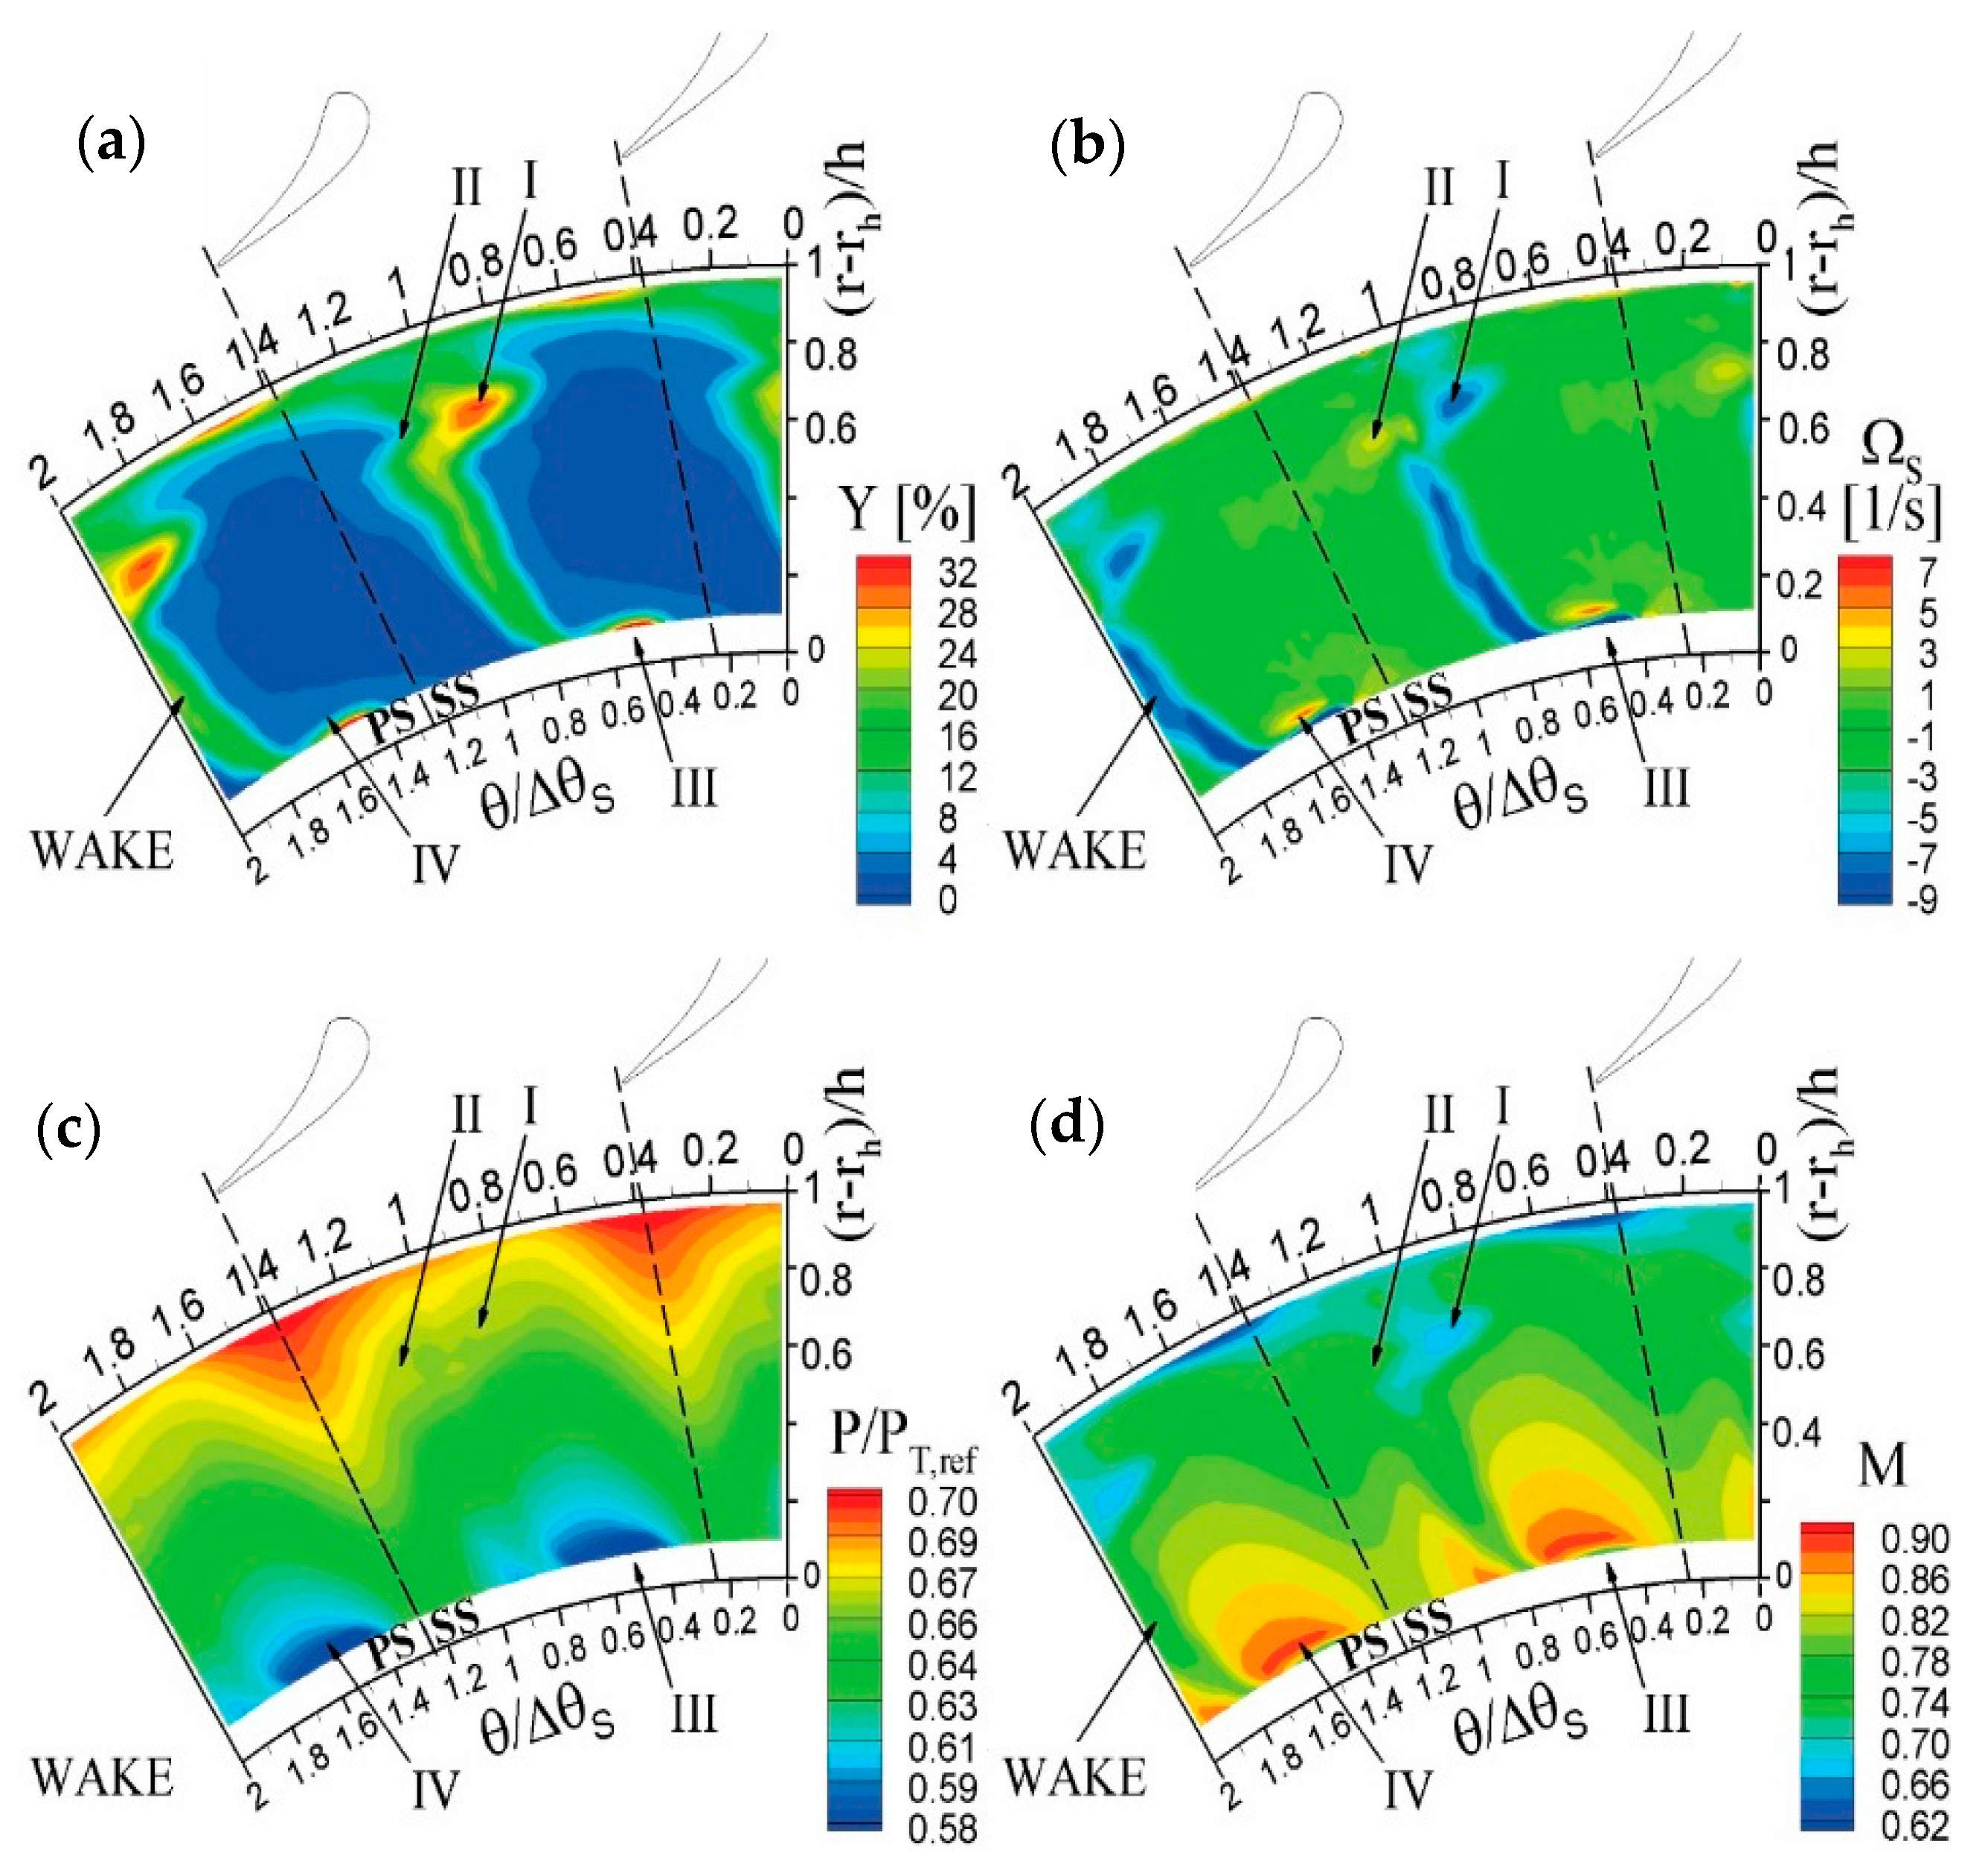
An overview of the stator-exit flow in transonic conditions (OP1) is shown in Figure 3 in terms of distributions of total pressure loss coefficient, Mach number, static pressure and stream-wise vorticity. The distributions of loss coefficient and Mach number show highly non-uniform flow in both pitch-wise and span-wise directions. The vane wake can be clearly identified in the loss distribution, enlarged by concentrated loss cores at 75% span and at 15% span. These concentrated loss cores roughly correspond to the secondary vortices, whose magnitude and orientation are marked by the stream-wise vorticity distribution. Two vortices appear in the tip region, namely the passage vortex (core I, negative) and the associated trailing edge shed vorticity (core II, positive). In the hub region, a weak passage vortex (core IV, positive) is found, while the trailing shed vorticity is smeared along the wake; at the bottom of the map the strongest hub vortex is found (core III, negative), which can be identified as a strong hub corner vortex.
The Mach number and static pressure distribution also show large pitch-wise gradients, because of the vane potential field propagating downstream, and large span-wise gradients as a result of radial equilibrium. The combination between the two pressure fields leads to highest expansion ratio in the hub region (as visible in the static pressure map) inducing transonic flows at the bottom of the measurement area. At the left edge of this low pressure region, high pressure gradients are found, which are probably the trace of a weak shock wave generated on the rear suction side of the blade.
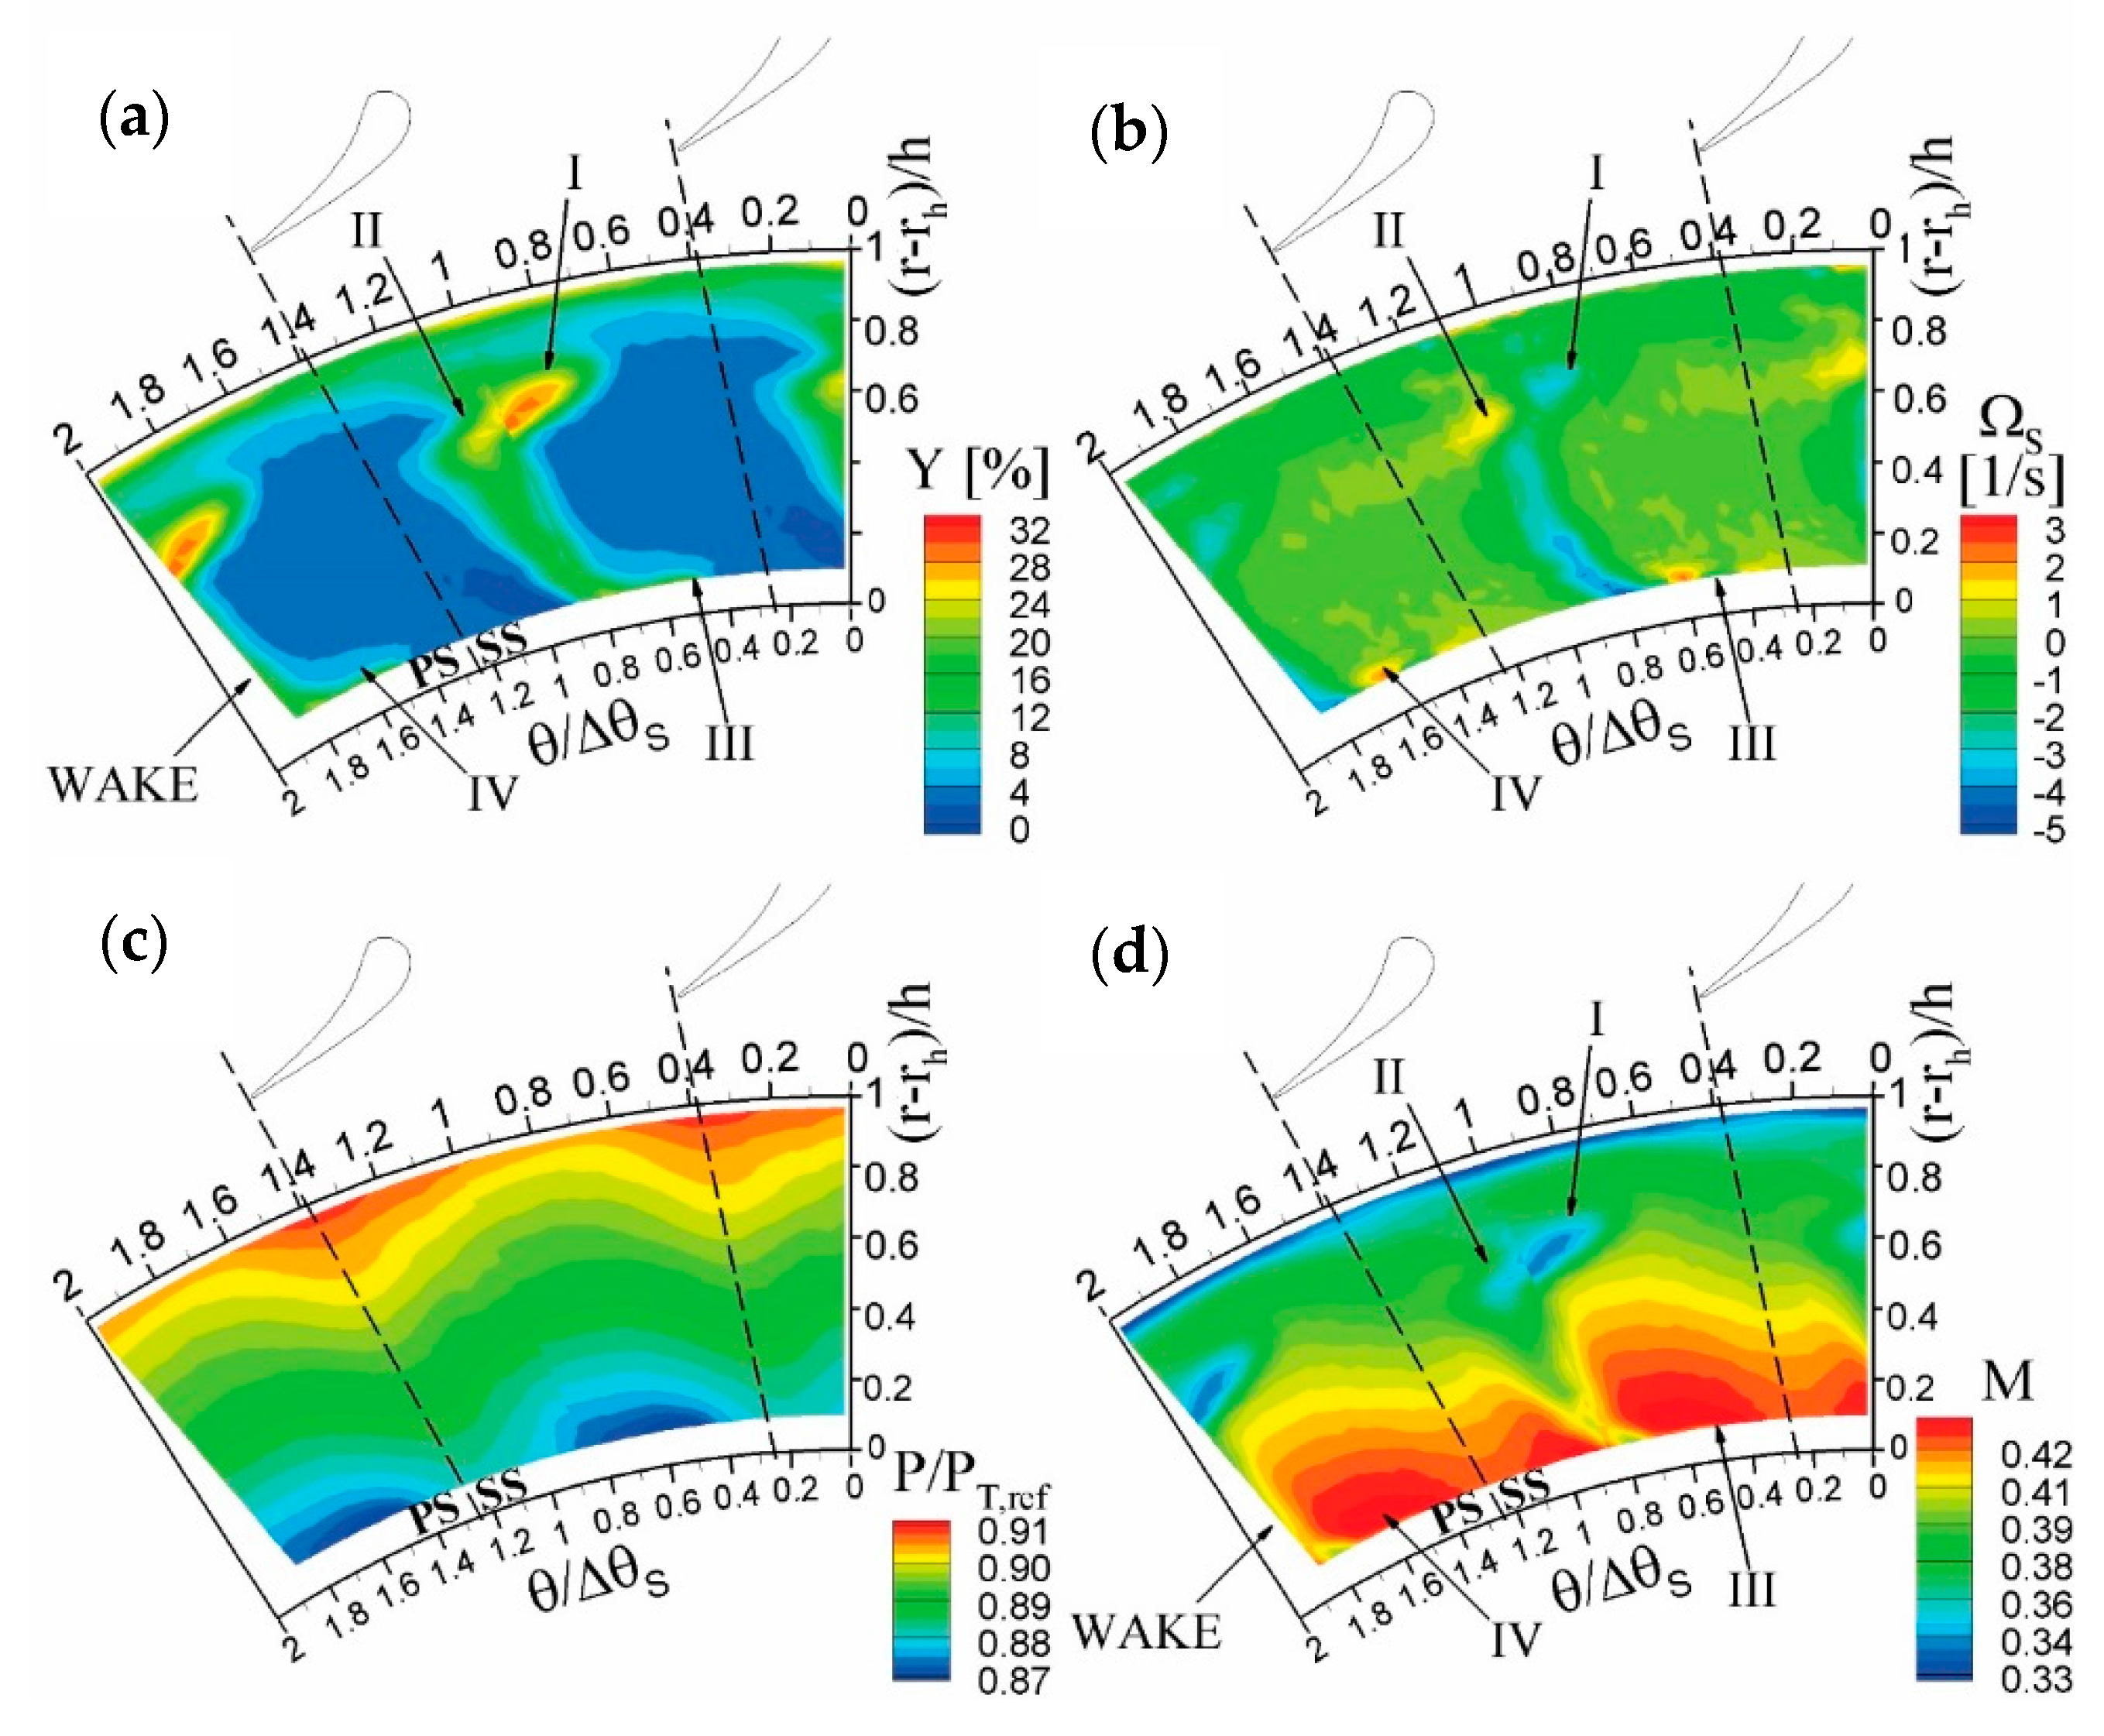
By operating the turbine at the lowest expansion ratio (OP4), a similar flow pattern appears, with some relevant differences (Figure 4). Alongside the relevant reduction of peak Mach number, which goes down to ~0.4, the wake appears significantly wider than that for OP1. This can be explained by resorting to the classic Mach and Reynolds number effects on an accelerating boundary layer where a higher acceleration tends to reduce the boundary layer thickness, and hence the thickness of the wake in transonic condition. The Mach number affects significantly the secondary flows, too; in the tip region for OP4, the vorticity distribution shows vortices with half of the magnitude with respect to that found at OP1; correspondingly, a wider secondary loss core is found for OP4 that evidences more smeared secondary flows in OP4 on the measurement traverse, thus suggesting a faster mixing process at low Mach number. In the hub region, the shed vorticity in the wake and the passage vortex (IV) can still be easily identified, though being very weak; the corner vortex, instead, is not even visible on the measurement plane. All these features are consistent with a reduction of the cross passage pressure gradient connected with a reduction in the expansion ratio. What above described can be referred to, as done in the following, as “direct” Mach and Reynolds number effects.
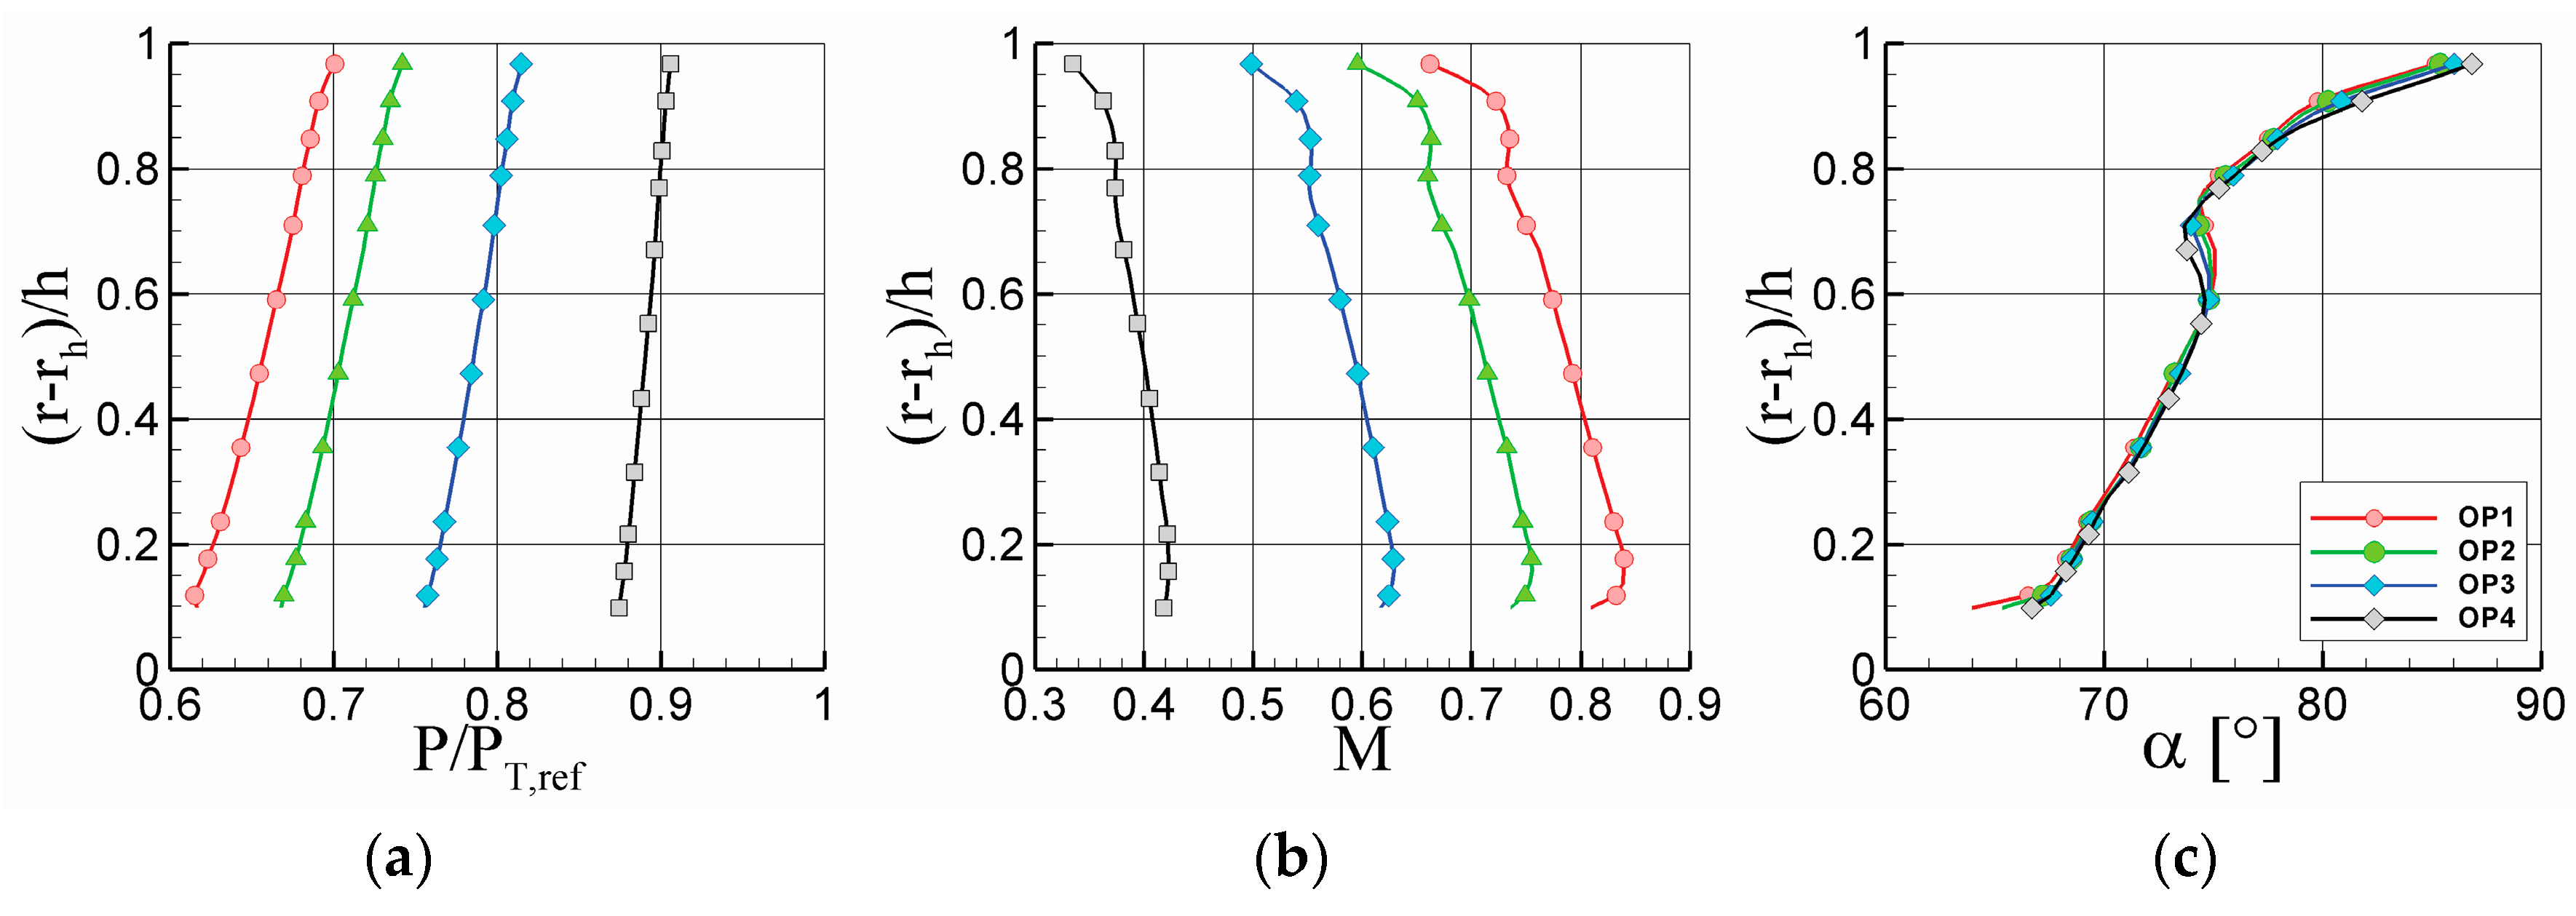
A synthetic overview of the flow field downstream of the stator is provided by the span-wise profiles of pitch-wise averaged quantities, reported in Figure 5 for all the OP. The pressure and Mach number profiles clearly show the different flow regime for the different conditions, even though they provide similar trends. The relevant impact of radial equilibrium is clearly visible, motivated by the relatively large shape factor (h/Dmid) of the present cascade. The flow angle distributions show significant span-wise variations, caused by the twisted and leaned shape of the stator blade; local gradients appear superimposed over the main trend, in correspondence of secondary flows. Interestingly, the mean flow turning imposed by the cascade appears virtually independent of the operating condition, demonstrating the insensitivity of the stator deviation angle on the Mach and Reynolds number and hence on the expansion ratio.
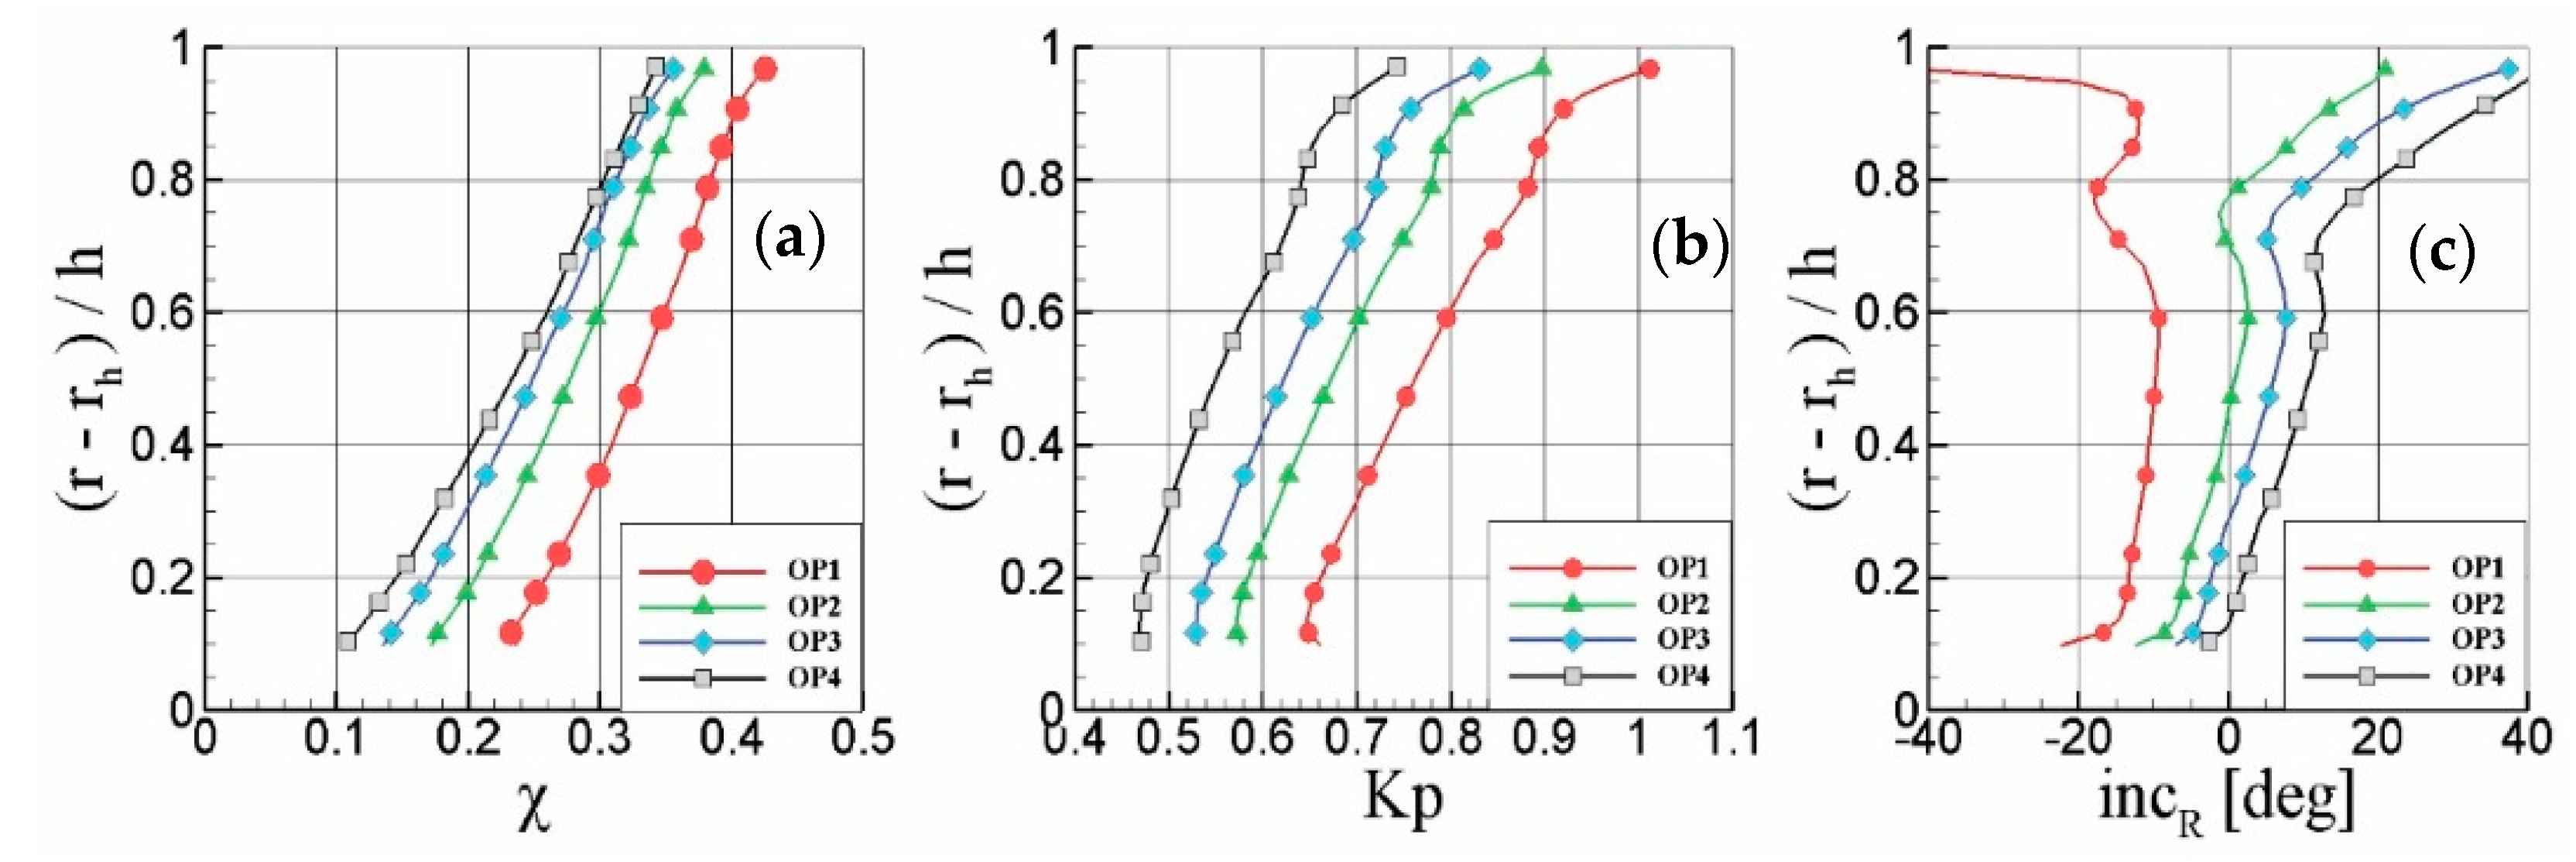
To further investigate the impact of the different OP on the overall stage behavior, Figure 6 reports some global stage parameters, namely the velocity coefficient Kp and the reaction degree χ. A significant radial variation is found for all the OP, driven by the radial equilibrium established at the cascade exit by a high flow turning and a high blade height to mean diameter ratio. The comparison among the trends measured for the different OP marks a large quantitative change with the stage expansion ratio. This effect is actually stronger in the stator, due to the low reaction degree of the present stage, which makes the Mach number to be higher in the stator than in the rotor for any OP. As the compressibility effects do not alter the stator-exit flow angle (Figure 5), the change on the Kp is only due to change in absolute velocity magnitude not proportional to the peripheral speed one. In fact, considering midspan as the reference radial position, from OP4 to OP1 the rotational speed has been increased by 2.7 times, while the absolute velocity only by a ratio of 1.9. The reaction degree increases as the expansion ratio grows from OP4 to OP1, highlighting the nonlinear relationship between the expansion ratio and the resulting velocities.
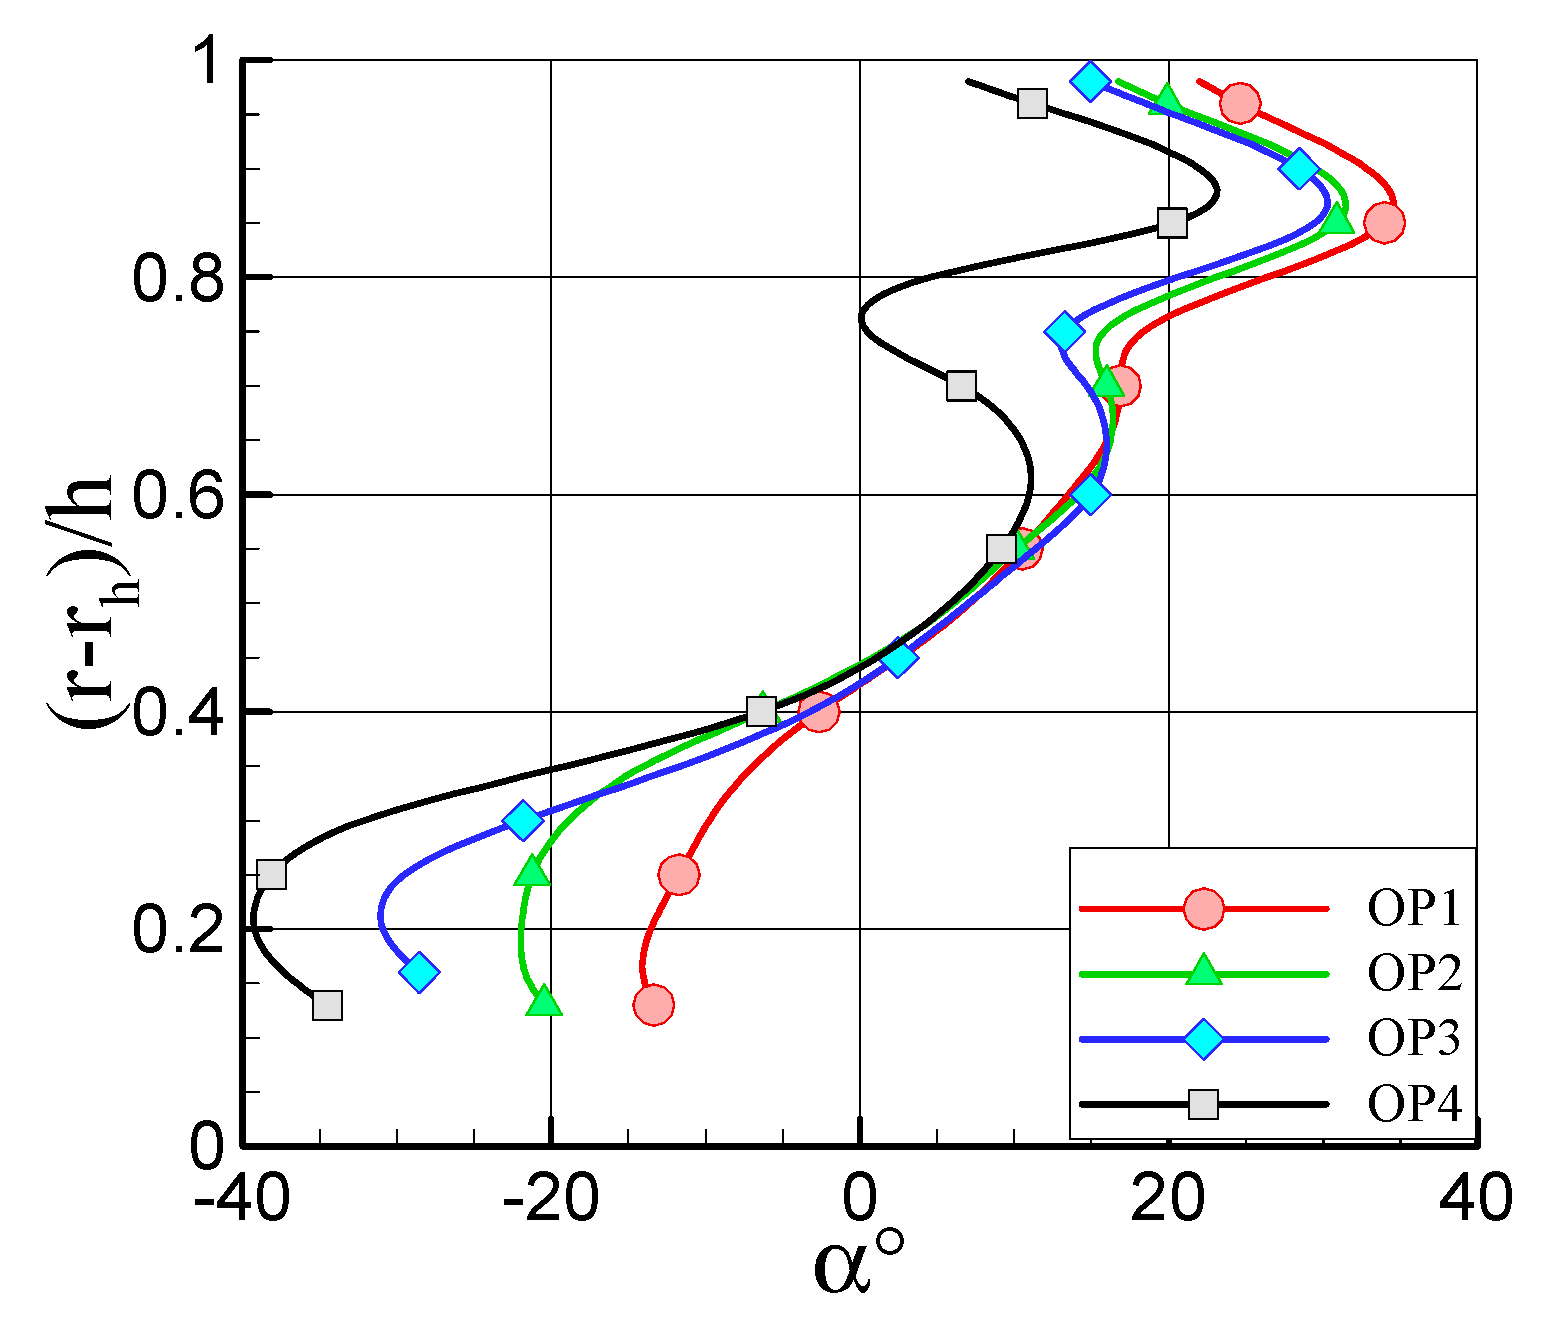
As a consequence of all the changes acknowledged for the different OPs, the incidence angles experiences a large variation. For OP4 it is mainly positive (at midspan ≈ +10°) and moves to negative values for OP1 (at midspan ≈ −10°), being almost null for OP2. To this trend, a span-wise variation is superimposed due to the strong radial equilibrium effects and to the action of the secondary vortices. Peculiar behavior is shown in the tip region where the casing boundary layer and the secondary flows heavily reduce the outlet kinetic energy (see losses in Figure 3 and Figure 4), generating a significant change in the relative flow angle, especially for OP1. This significant change in rotor incidence angle, acknowledged in the following as an “indirect” effect of the expansion ratio, is expected to have a severe impact on the rotor operation and in the stator–rotor interaction, as discussed in the following.

4.2. Rotor Aerodynamics

In this Section, the rotor aerodynamics are discussed on the basis of flow measurements at the rotor-exit for the different OP. To highlight the rotor flow features, the analysis is developed in terms of time-mean and fluctuating relative quantities, as perceived by a rotating observer integral to the rotor blades. This allows identifying the loss mechanisms and the vortex structures generated within the rotor blade row. On the methodology ground, it is worth noting that for time-mean rotor flow measurements an unsteady probe is required (the FRAPP), as the probe does not rotate integral to the rotor. In practice, the time-mean rotor-exit flow field perceived by a rotating observed was reconstructed starting from phase-averaged measurements taken in the stationary frame, converting them in rotating frame data and averaging them in phase (which means, averaged with respect to the different stator–rotor relative positions). The periodic unsteady fluctuations of the flow quantities are here defined as the differences between the mean and the instantaneous flows reconstructed in the rotating frame. For a rotating observer, any fluctuation over the mean value can be caused by the vane–rotor interaction only, and its magnitude marks the relevance of the unsteady coupling between the blade rows. To quantify the interaction, the root mean square of this fluctuation (RMS) was evaluated and it is shown in the present Section for different OP and reference as periodic unsteadiness. Coupled to the periodic unsteadiness, also the unresolved unsteadiness of the relative total pressure (IPT,R) was calculated according to the methodology presented in [30]. This quantity is defined for each stator–rotor interaction phase and for each grid point and it has been shown to be a proficient marker of high turbulence intensity regions, such as wakes and vortex structures (see [13,20] as application examples).
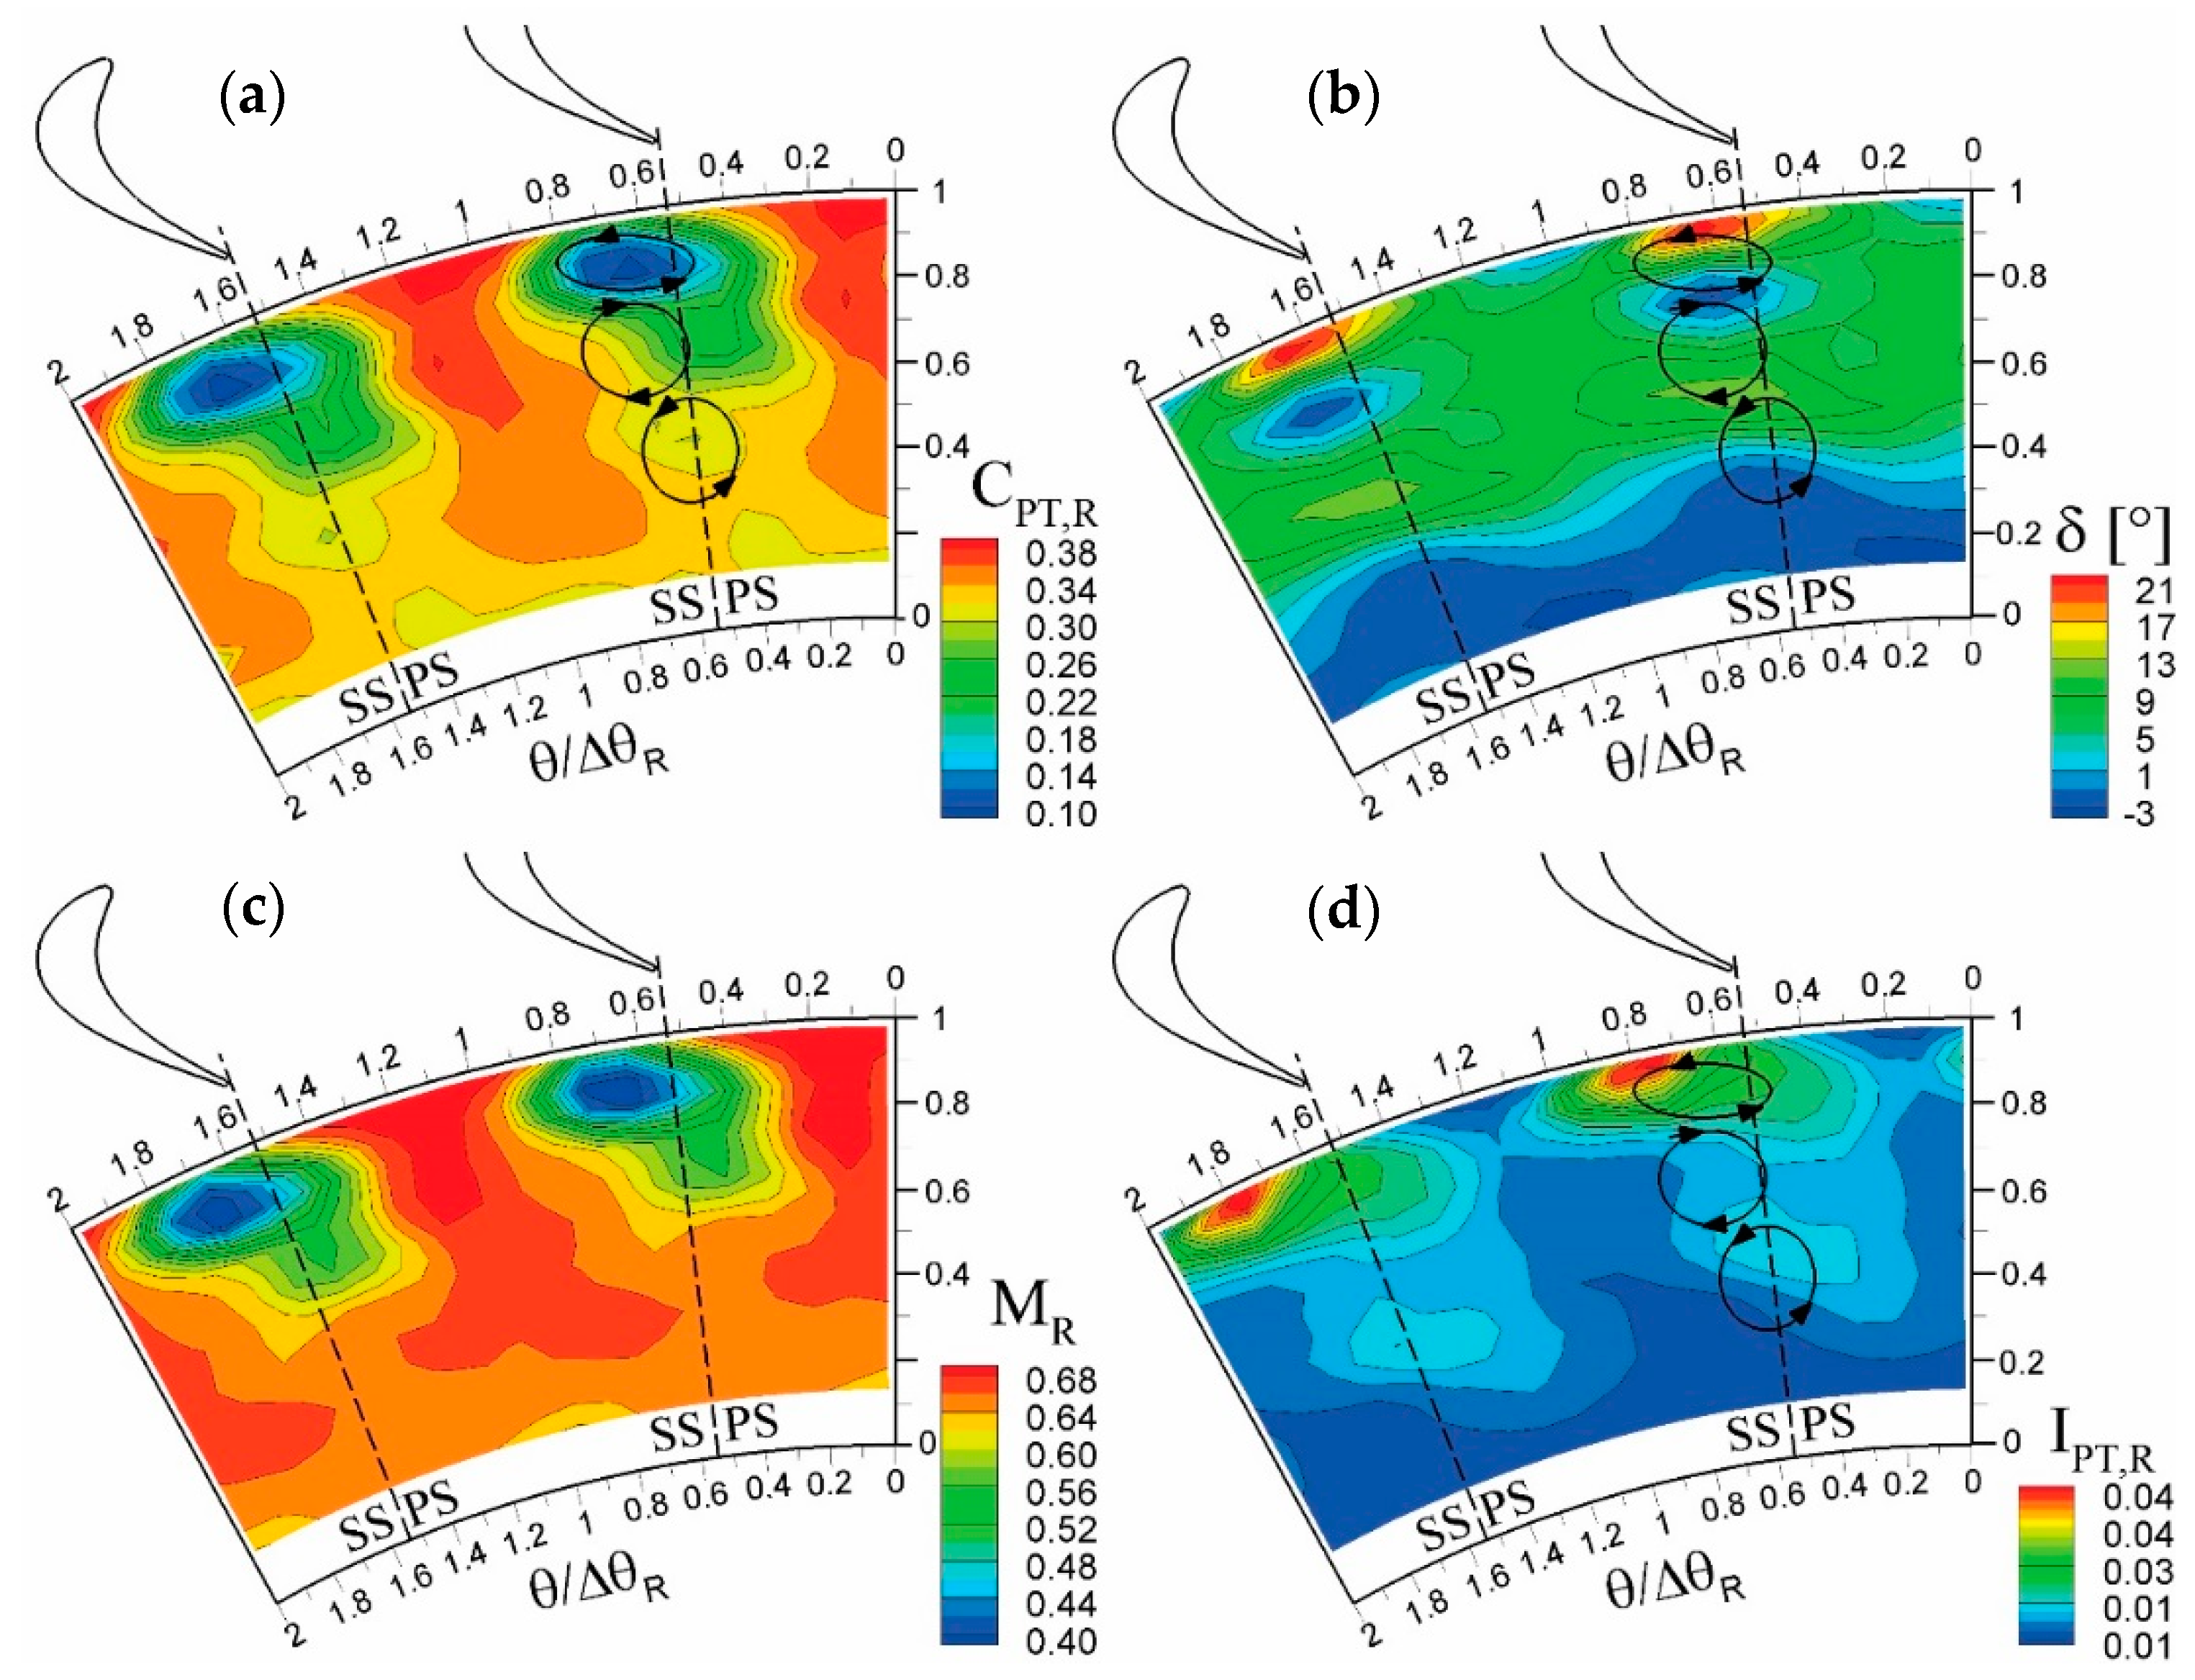
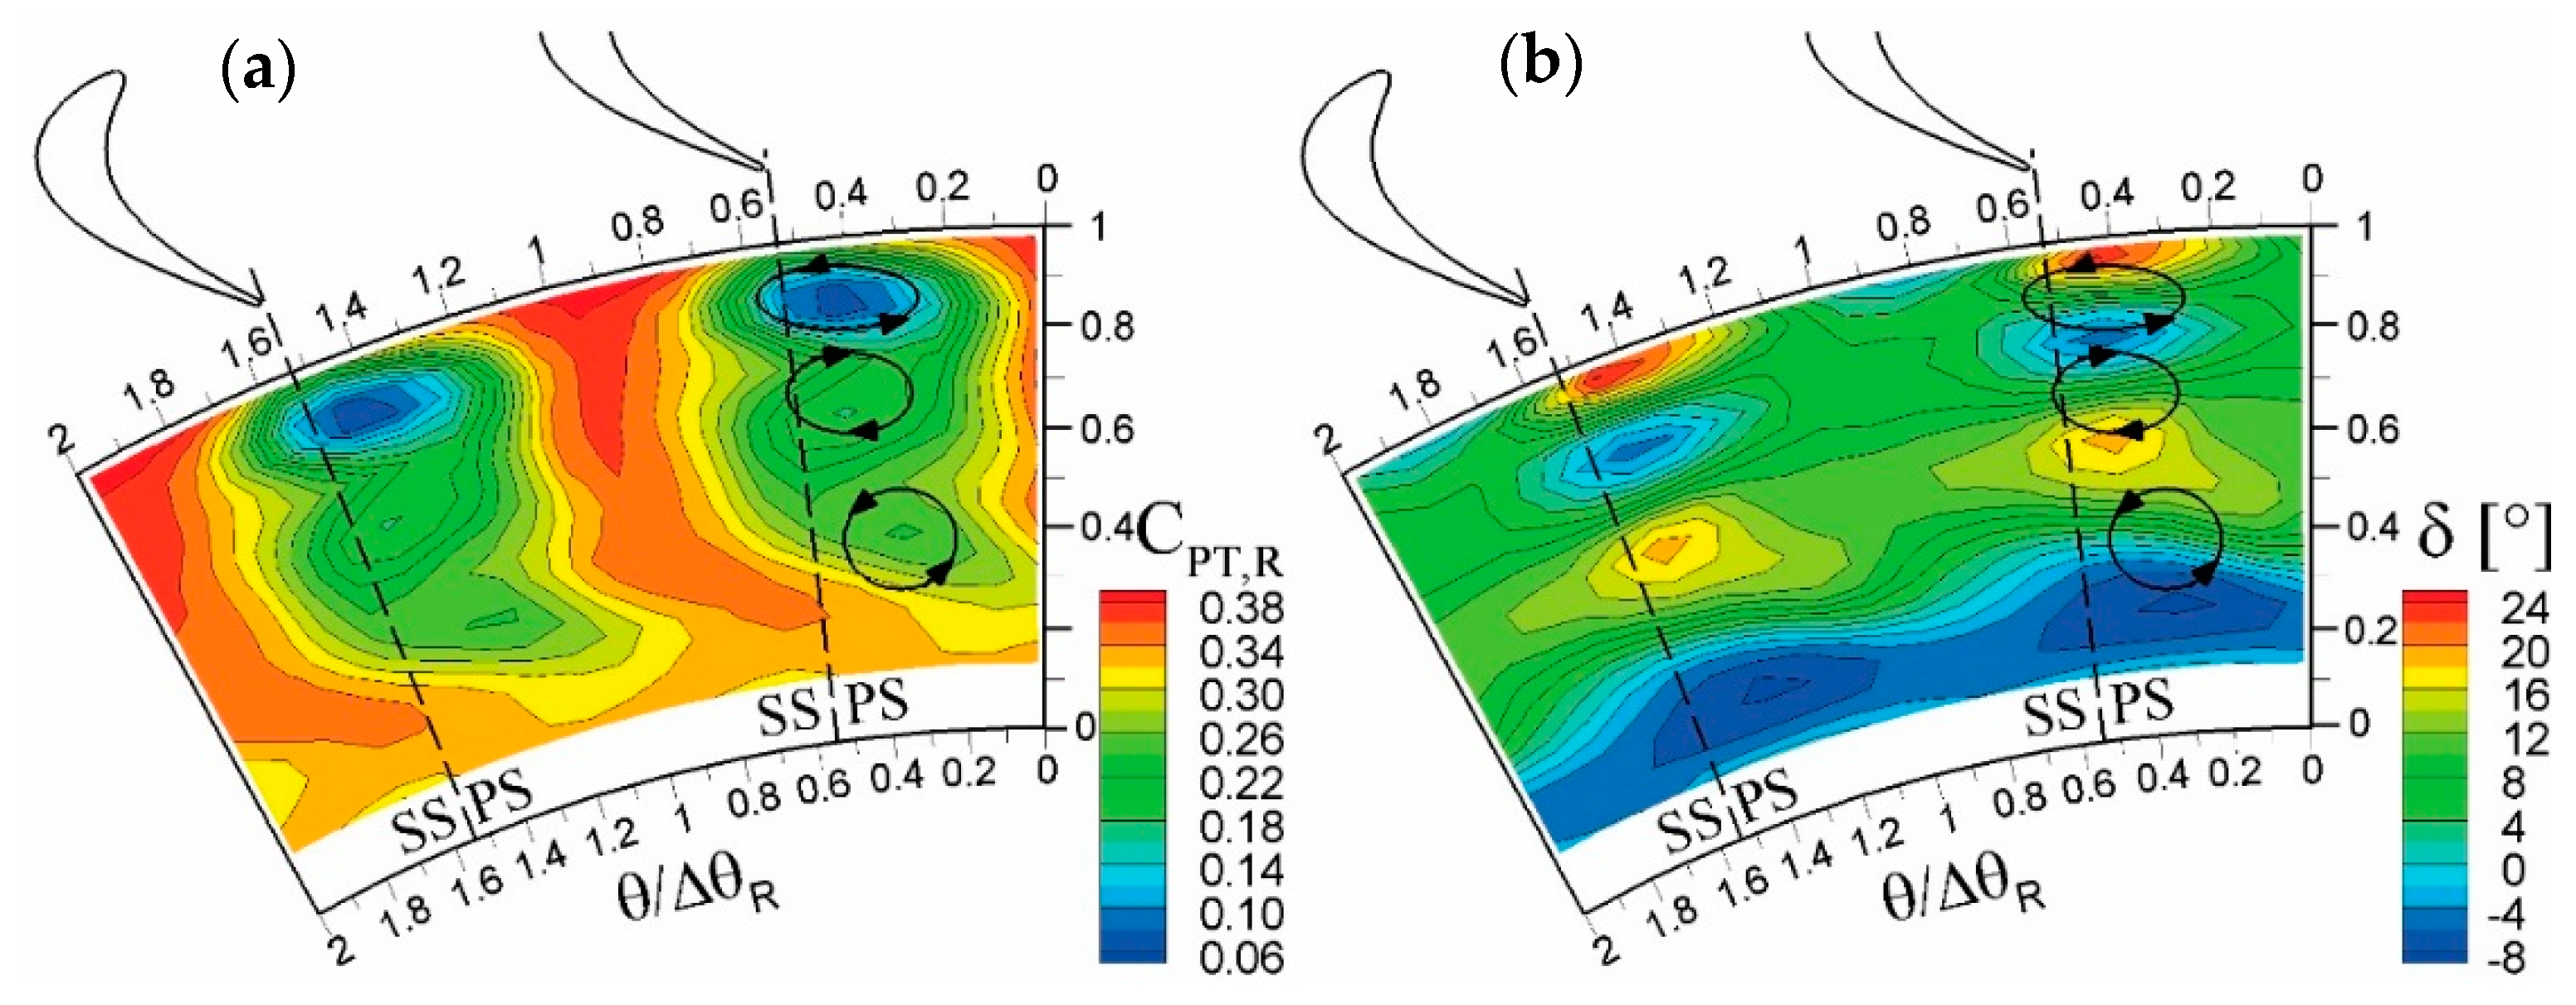
The discussion on the rotor aerodynamics starts from the mean rotor-exit flow field for transonic operating condition (OP1, Figure 7), in terms of relative total pressure coefficient, rotor deviation angle, relative Mach number and unresolved unsteadiness. Low relative total pressure marks loss regions, while strong span-wise gradients in relative flow angle allow for the identification of the whirling structures (by resorting to the Rankine vortex model).
For transonic condition (OP1, Figure 7), some general features of the flow in this rotor can be recognized. First considering the distribution of relative total pressure coefficient, a large loss region affects the top half of the channel: in particular, the huge loss core close to the tip is consistent with the leakage flow, which originates from a tip gap equal to 1.3% of the blade height. Below midspan the gradients connected to the wake are significantly smeared, resulting in an almost uniform flow field. This general feature is even more evident in the Mach number distribution, which is almost wake-free below 60% span.
The distribution of the rotor deviation angle exhibits large local spanwise gradients, with significant under-turning (δ > 0) above 40% span and a weak over-turning (δ < 0) in the hub region. Superimposed to this trend, three local regions of high flow angle variation are clearly visible, corresponding to three vortex structures placed on the suction side of the wake. The tip vortex centered at 90% span, where the maximum velocity deficit is found, is by far the largest structure appearing on the measurement plane and it is caused by the leakage flow. Below this structure two counter-rotating vortices are found, centered at 70% and 40% span, which can be identified as the tip and hub rotor passage vortices, respectively. The migration of the hub vortex close to midspan is motivated by the very high flow turning of this rotor (120°) and by the Coriolis force; corresponding to the hub vortex, a local loss increase is observed. Conversely, the tip passage vortex appears considerably weaker, and its trace into the loss distribution is entrained in the huge wake loss that affects the outer part of the channel. The map of unresolved unsteadiness (Figure 7d) confirms that the most relevant turbulent structures occur in vortex regions at the tip and at midspan. In particular, the highest turbulence is found on the left side of the tip leakage vortex, where the shear layer between the jet leaking through the cascade and the main flow rolls up in a vortex.
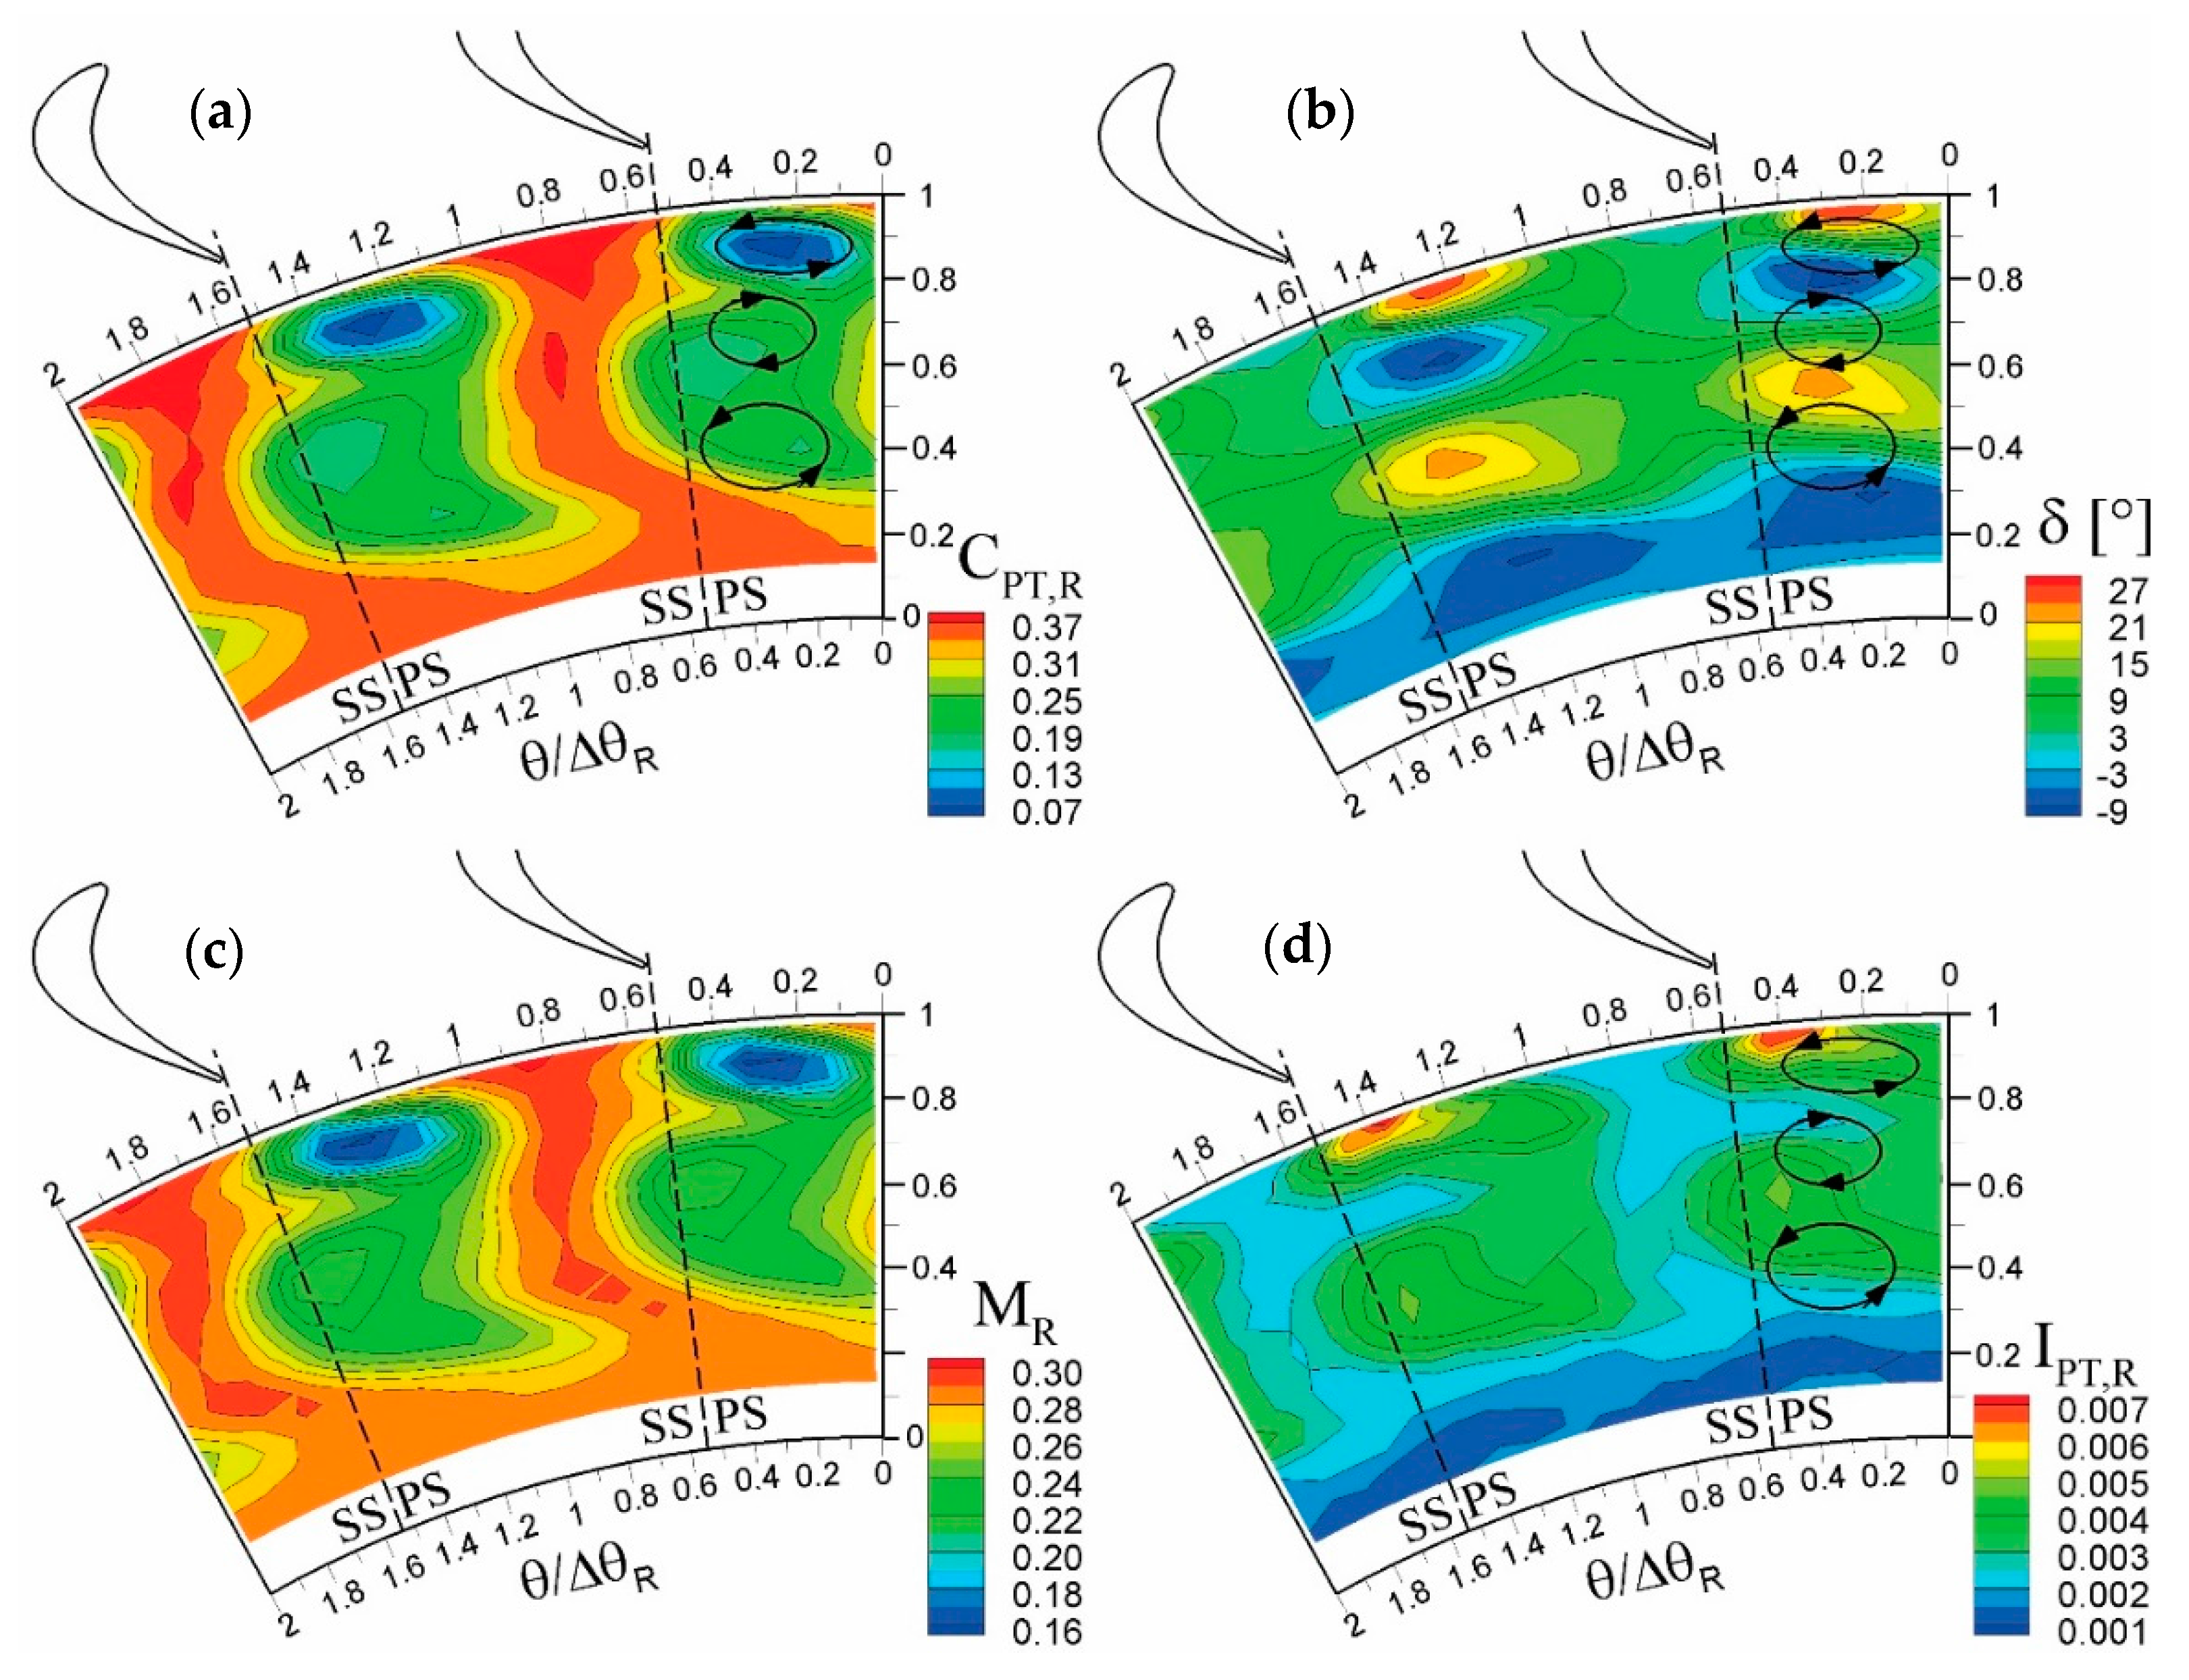
When the stage is run in subsonic conditions, represented in Figure 8 and Figure 9 for OP2 and OP3, respectively, the general flow configuration is similar to that found for OP1, even though the magnitude of the main flow structures changes significantly. Figure 8 and Figure 9 show that the velocity deficit in the wake is now significant all along the span (at least above 20% span), while the tip leakage losses are less sensitive to the operating conditions. In OP2, the loss region extends up the hub, assuming an almost straight shape, even though a reduction of loss is observed from tip to hub. In OP3 the loss region enlarges significantly and appears bent towards the suction side of the channel below 30% span; this is probably connected to the over-turning measured in this region, that appears enhanced for OP3 with respect to OP1 and OP2. Correspondingly, the tip and secondary vortices grow progressively as the stage expansion ratio reduces. Where the vortices magnitude appears increased, corresponding loss cores are found in the CPT,R distribution. As a result, for these conditions the wake and the tip leakage vortex are not the main loss mechanism, and the dissipation connected to the secondary flows contributes significantly to widen the low CPT,R region. For OP3, in particular, the passage vortex regions identify exactly two loss cores; the very large passage vortices, migrated towards midspan, occupy entirely the central part of the channel and make the loss region to be wider in the midspan region.
In terms of flow angle (Figure 8b and Figure 9b), the tip leakage vortex retains the features observed in OP1, while the magnitude of the passage vortices appears enhanced in subsonic conditions, as commonly found in literature about the Mach and Reynolds number effects on secondary flows [26]. It is also of interest to note that the position of the wake and vortices slightly change with respect to those in OP1, as a consequence of the different flow evolution downstream of the rotor, already depicted in Figure 2.
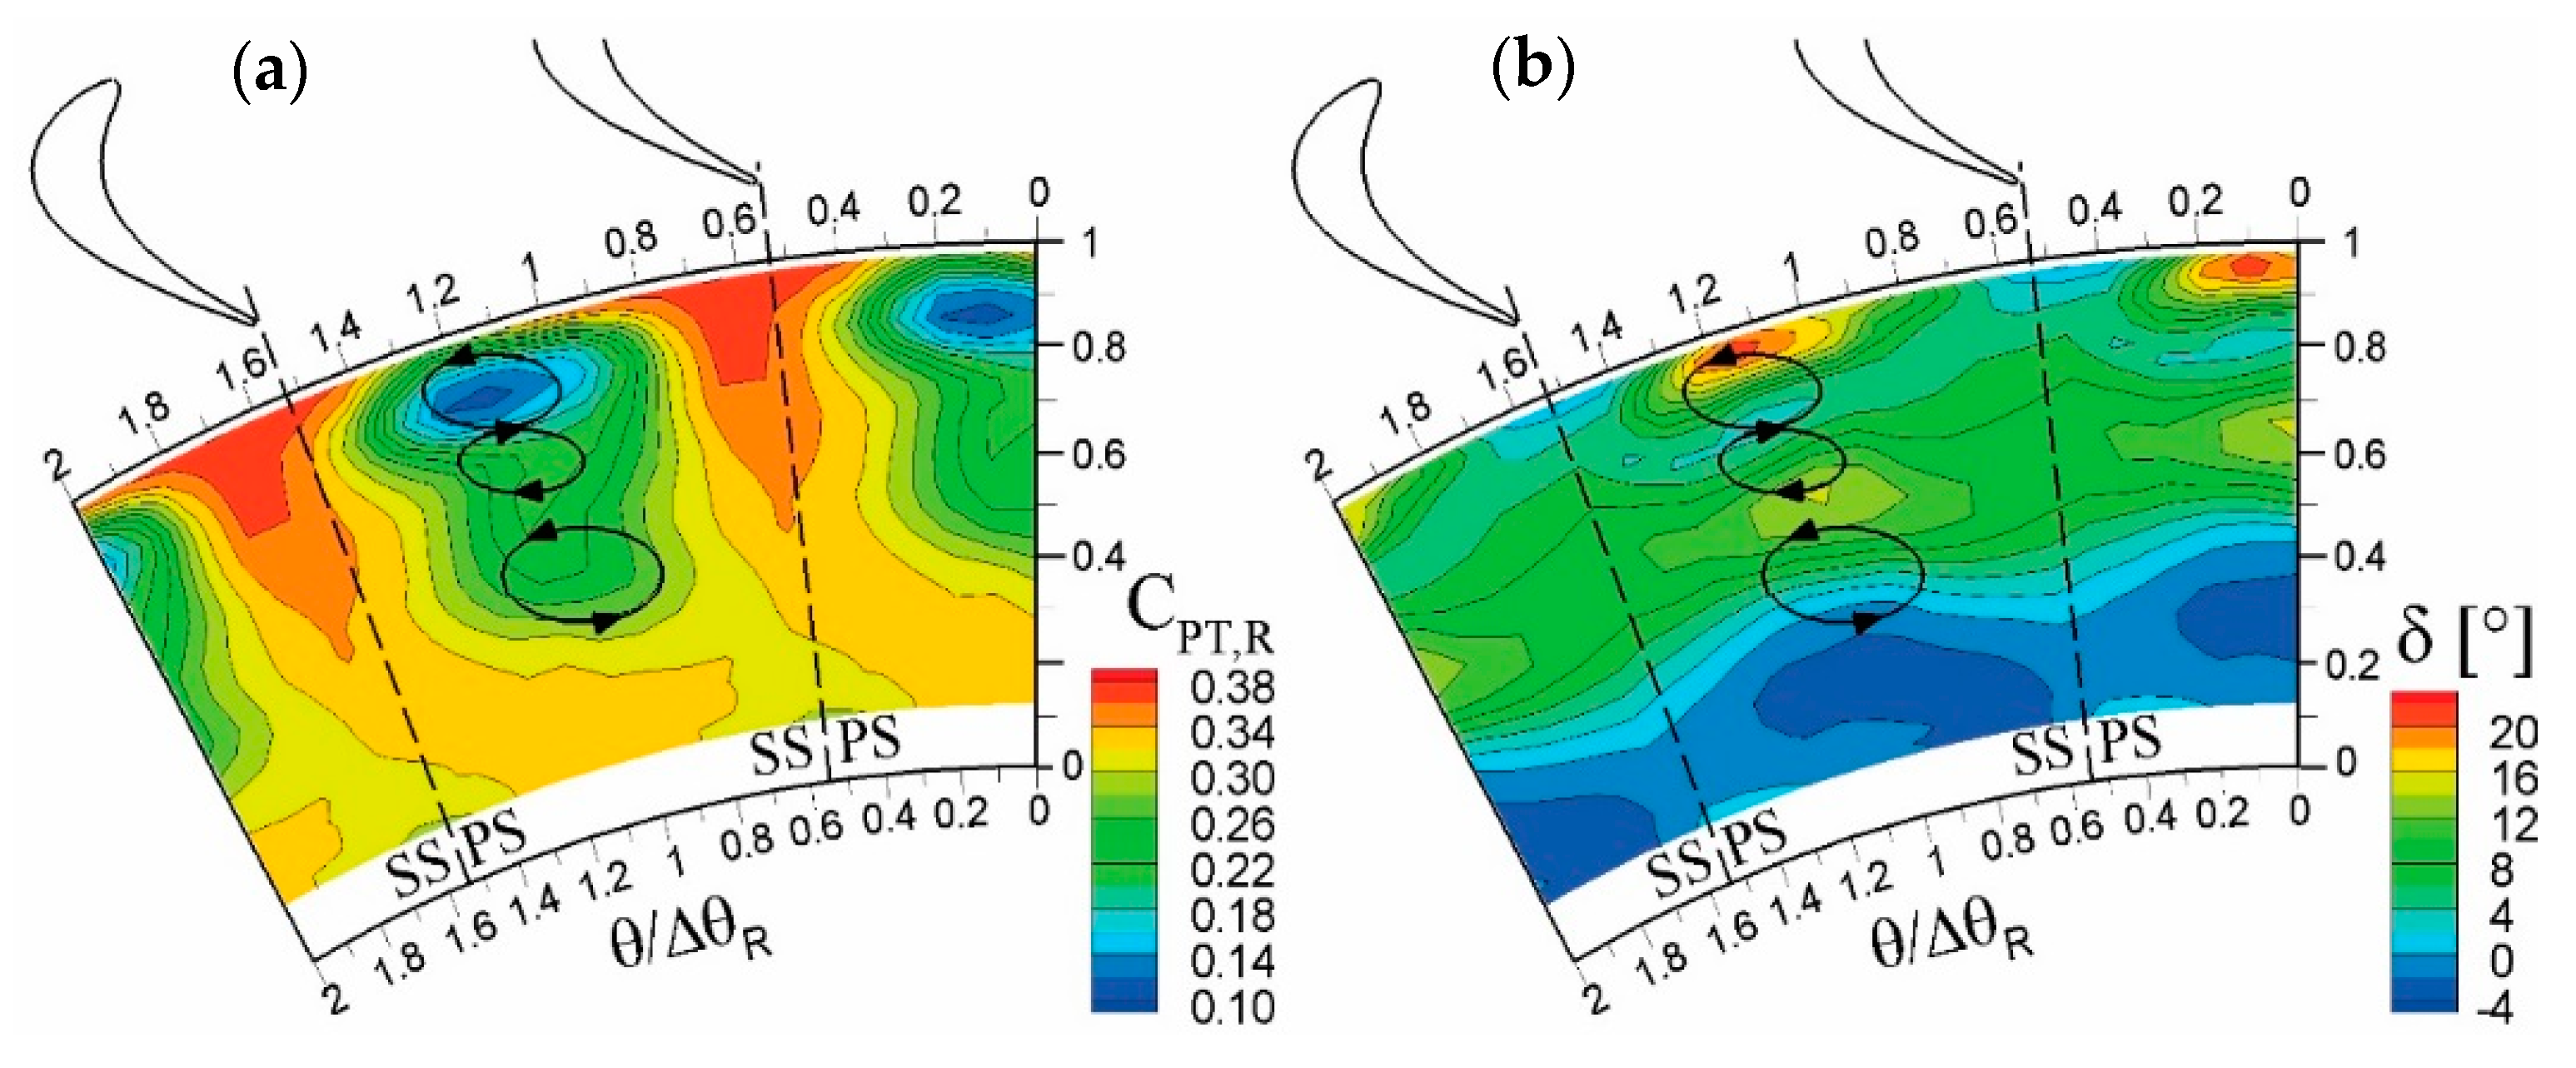
These phenomena appear dramatically amplified for the lowest expansion ratio tested, OP4. Given the specific features of the flow in this condition, all the relative quantities are shown in Figure 10. Except for the tip leakage vortex and its associated loss, that retain the character discussed for the other OP, the low relative total pressure and relative Mach number region in the central part of the channel are greatly enlarged, reducing the free-stream to a narrow area in-between the wakes. Secondary flows grow in both scale and magnitude, as a 30° variation of flow angle is measured in both the local passage vortex regions above and below midspan. In particular, the tip passage vortex undergoes the largest amplification passing from OP1 to OP4. This is consistent with the larger wake extension observed for all the OP above midspan, resulting in a huge loss core just above midspan. This peak loss area, combined with that of the tip leakage vortex, penalizes dramatically the rotor aerodynamic efficiency in the outer part of the channel. Coherently with the general increase in secondary flows, the cross-flow/overturning at the hub is also larger and induces a further pitch-wise deformation of the wake. The unresolved unsteadiness (Figure 10d) also marks a general amplification with respect to the transonic case, with peaks in the wide loss regions in the central part of the channel, but also high levels in the free-stream all along the span (except below 20% span).
The strengthening of the viscous and vortex structures with the reduction of the expansion ratio is only partially caused by a direct Mach and Reynolds number effects. As discussed previously, the rotor incidence angle grows significantly as the expansion ratio reduces (see Figure 6c), as a consequence of the constraint imposed on the stage-exit flow angle. The variation increases from hub to tip, and it is quantitatively relevant for the whole blade span, passing from 10° at the hub to 40° at the tip. For the transonic condition the rotor works with negative incidence all along the span, with a fairly uniform span-wise profile at −10°. This explains the relatively low magnitude of rotor secondary flows, especially the tip passage vortex, in OP1 with respect to the other conditions. For subsonic turbine operation, the incidence exhibits an increasing trend along the span, the profiles being roughly shifted with the OP2 condition centered to null incidence.
The combined changes in the incidence trend and in the mean incidence values contribute to justify the growth of the tip passage vortex between, especially, OP1 and OP2 conditions, as most of the difference in incidence occurs passing from these two OPs. The average incidence variation between OP2 and OP3 is much smaller (≈5°) and further reduces between OP3 and OP4 (< 5° on 110° of flow turning and a mean value of ≈10°). The comparison between the latter two subsonic conditions is particularly interesting as, for similar values of incidence, relatively large change in Reynolds and Mach numbers occur (the Mach number drops from 0.6 to 0.4 at the vane exit, and from 0.5 to 0.3 at the rotor exit; the midspan Reynolds number drops from 0.9 × 10⁶ to 0.55 × 10⁶ for the stator and from 0.5 × 10⁶ to 0.3 × 10⁶ for the rotor, see also Table 5). Hence, the differences between OP3 and OP4 mostly depend on Mach and Reynolds numbers of the rotor profile.
Based on the present measurements, the impact of Reynolds/Mach numbers is shown to be large in the turbine under investigation. In fact, the general flow topology is preserved (see Figure 9 and Figure 10), but both the extension of the loss region and the magnitude of the passage vortices are greatly amplified at low Reynolds/Mach numbers. In OP4 the higher relevance of viscous stresses and the lower flow acceleration connected to the nearly incompressible flow regime both contribute to enlarge the boundary layers, resulting in wider wake and secondary flows.
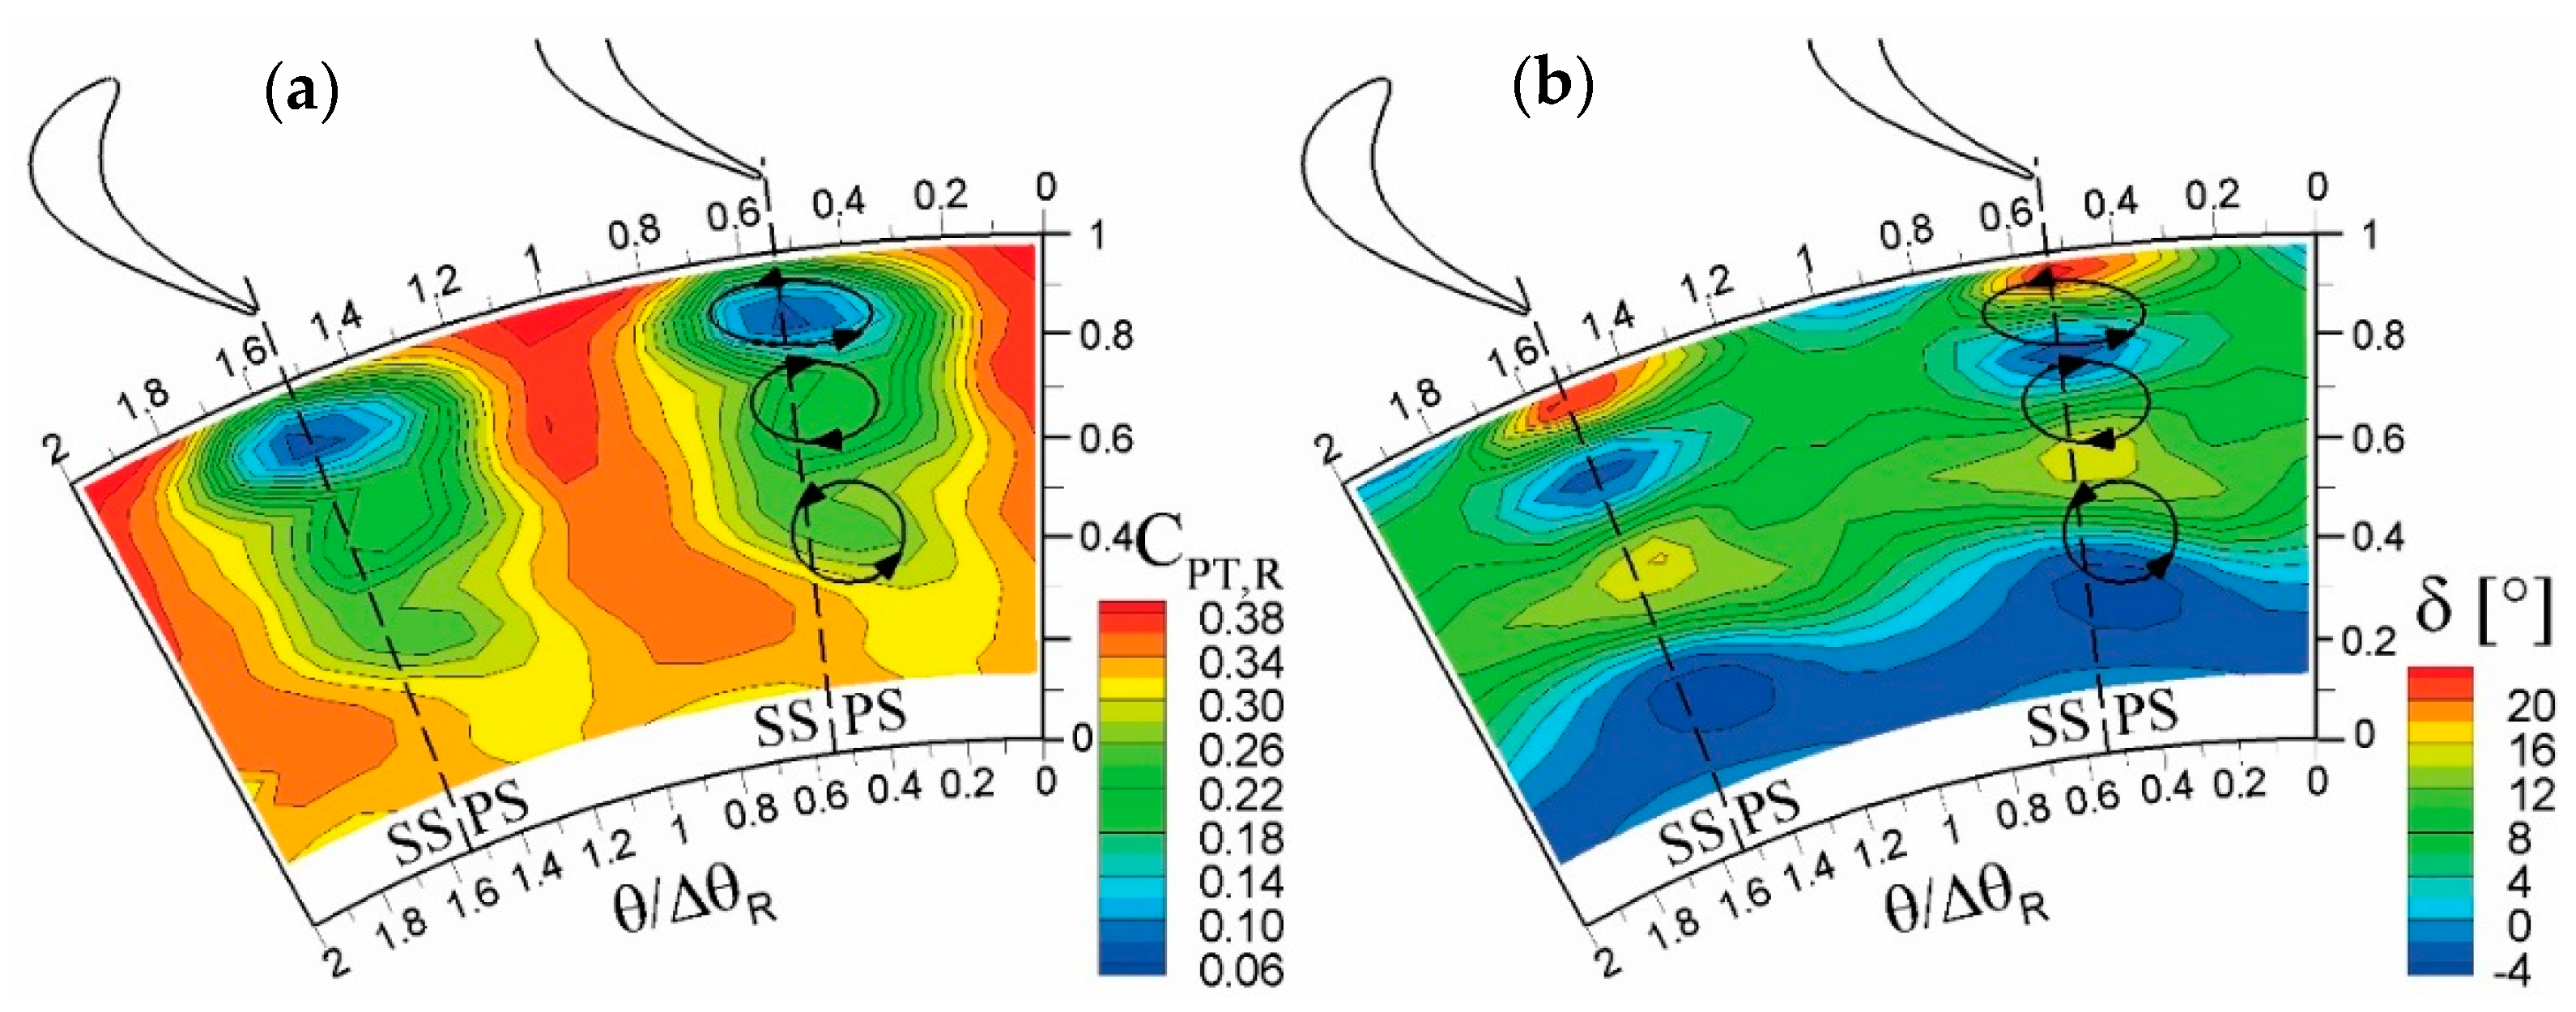
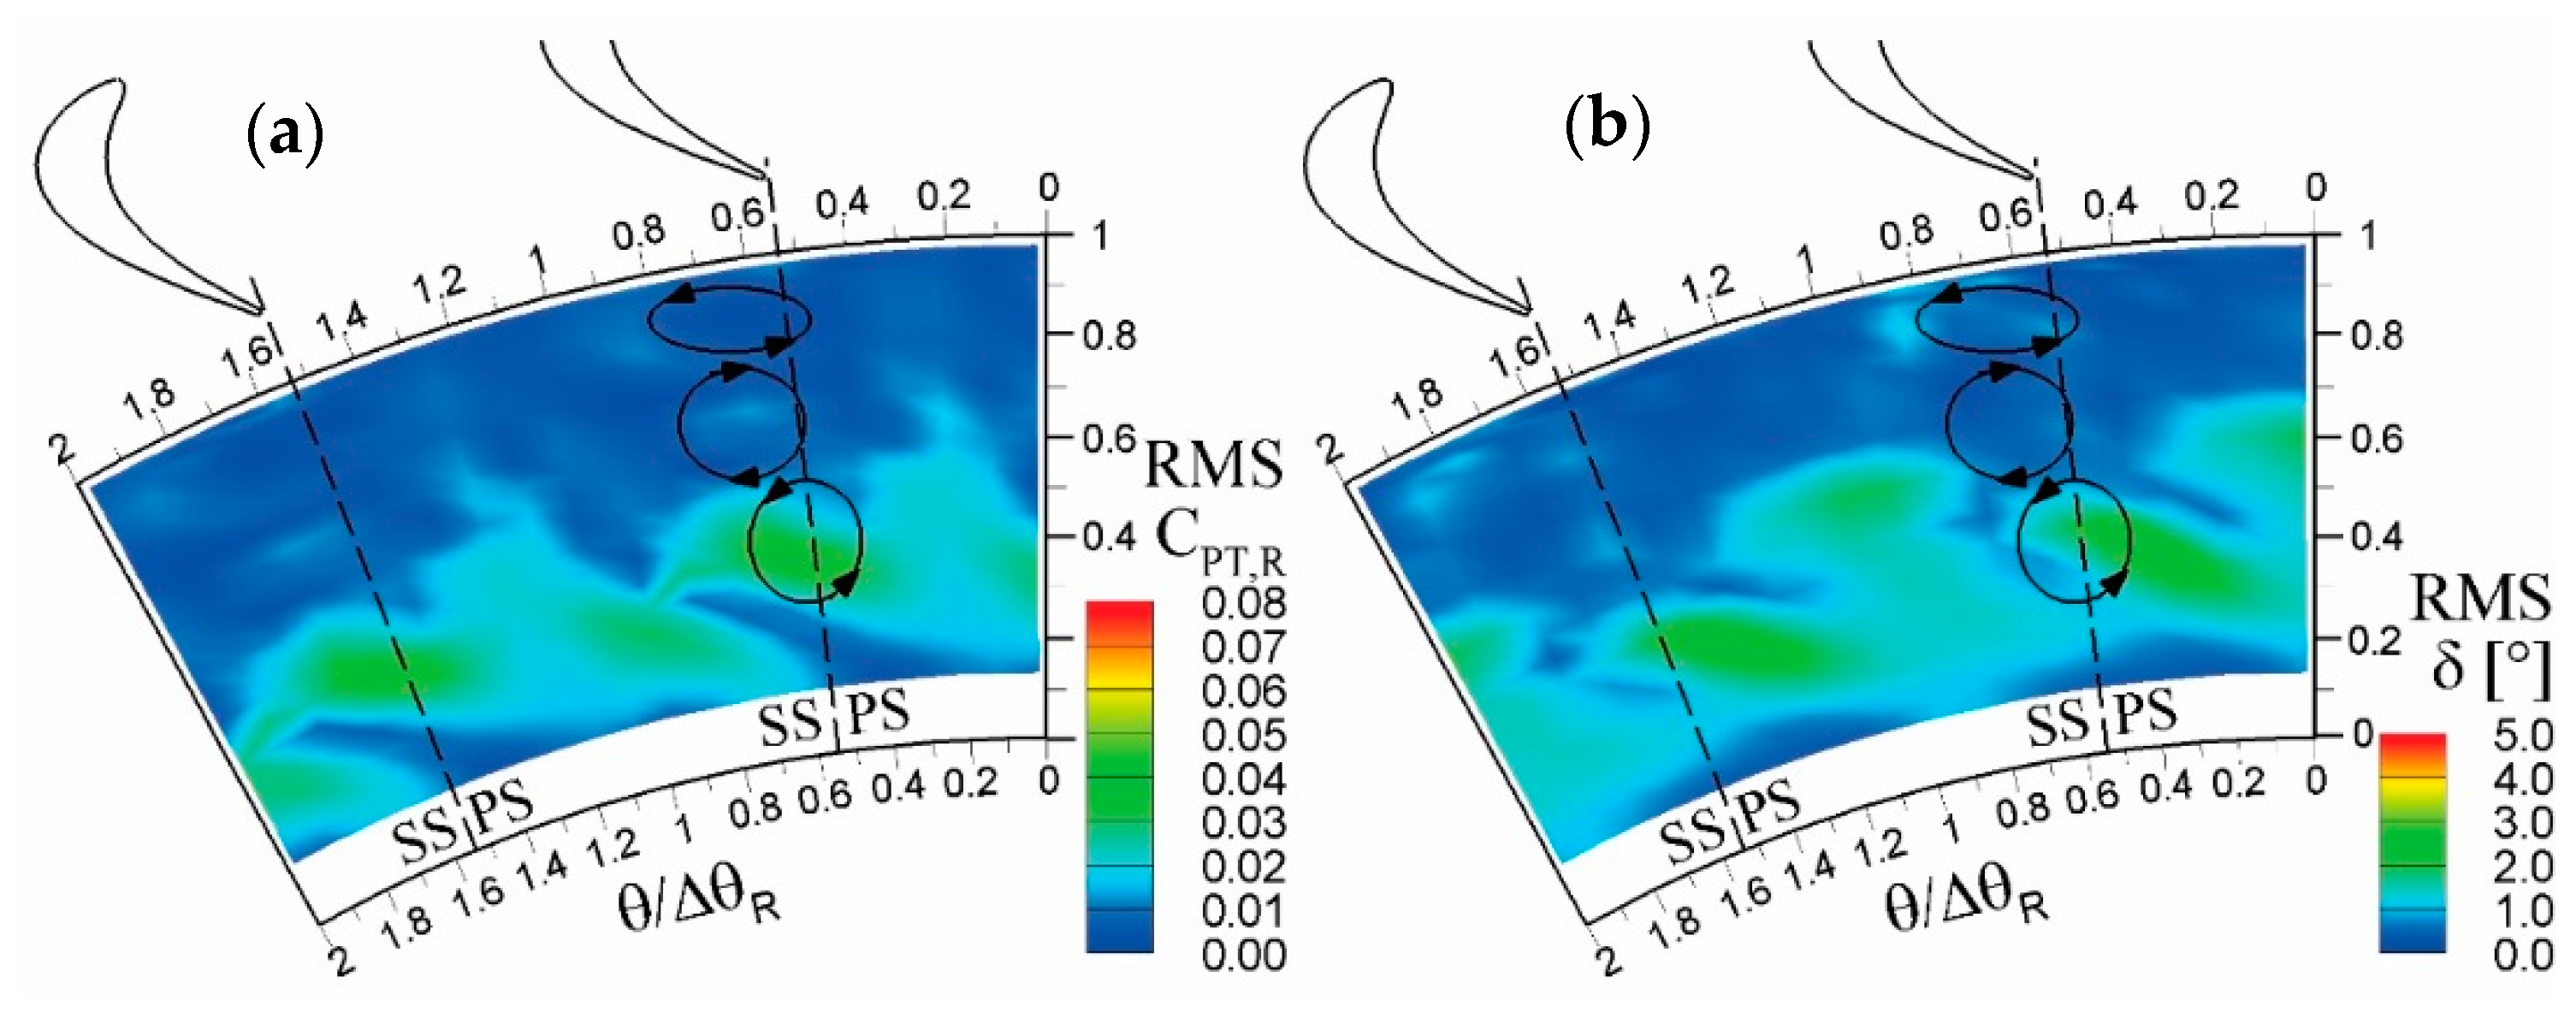
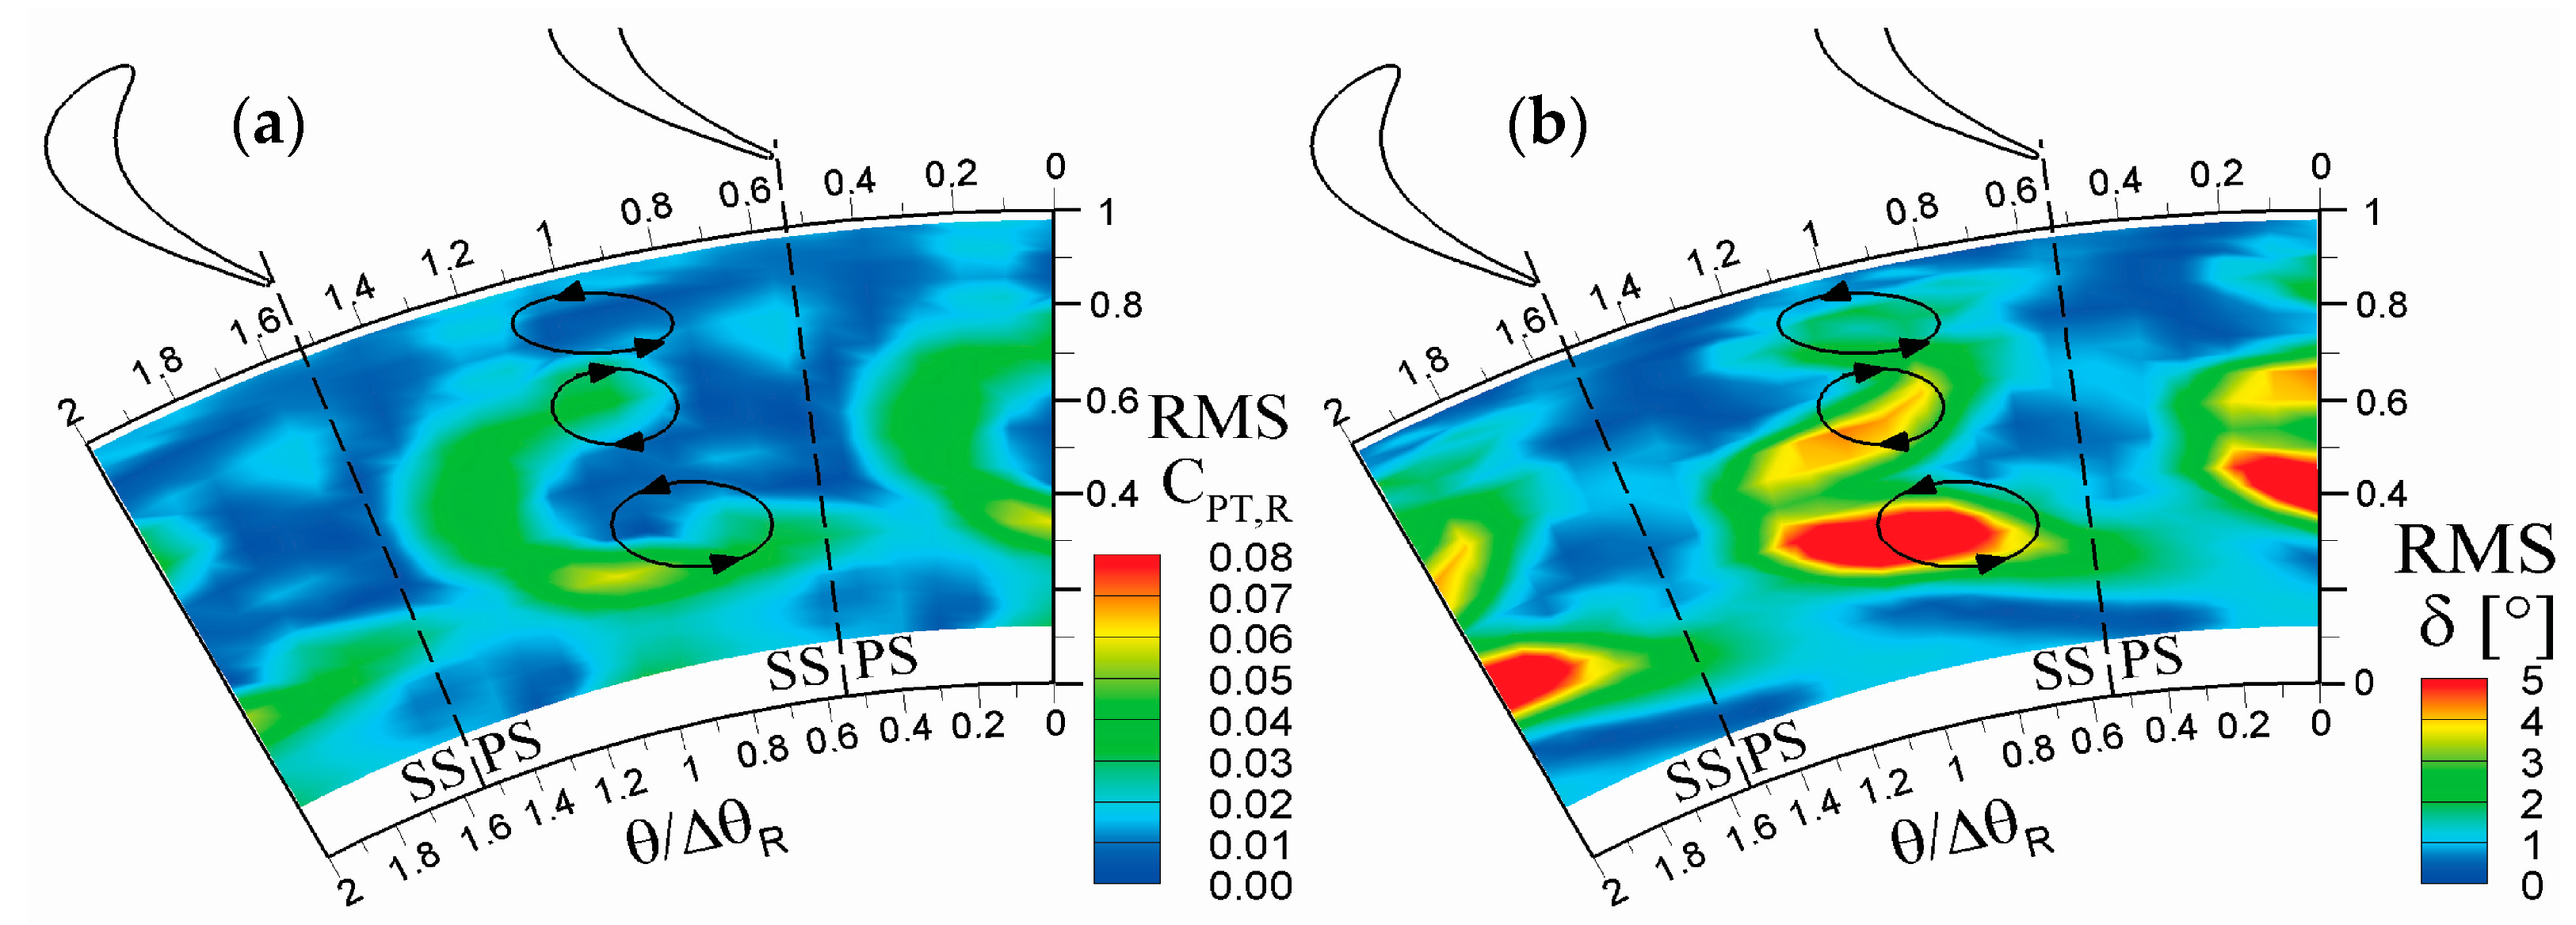
The expansion ratio has also an extremely significant impact on the vane–rotor interaction, which is here discussed by resorting to the periodic fluctuations in the rotating frame.
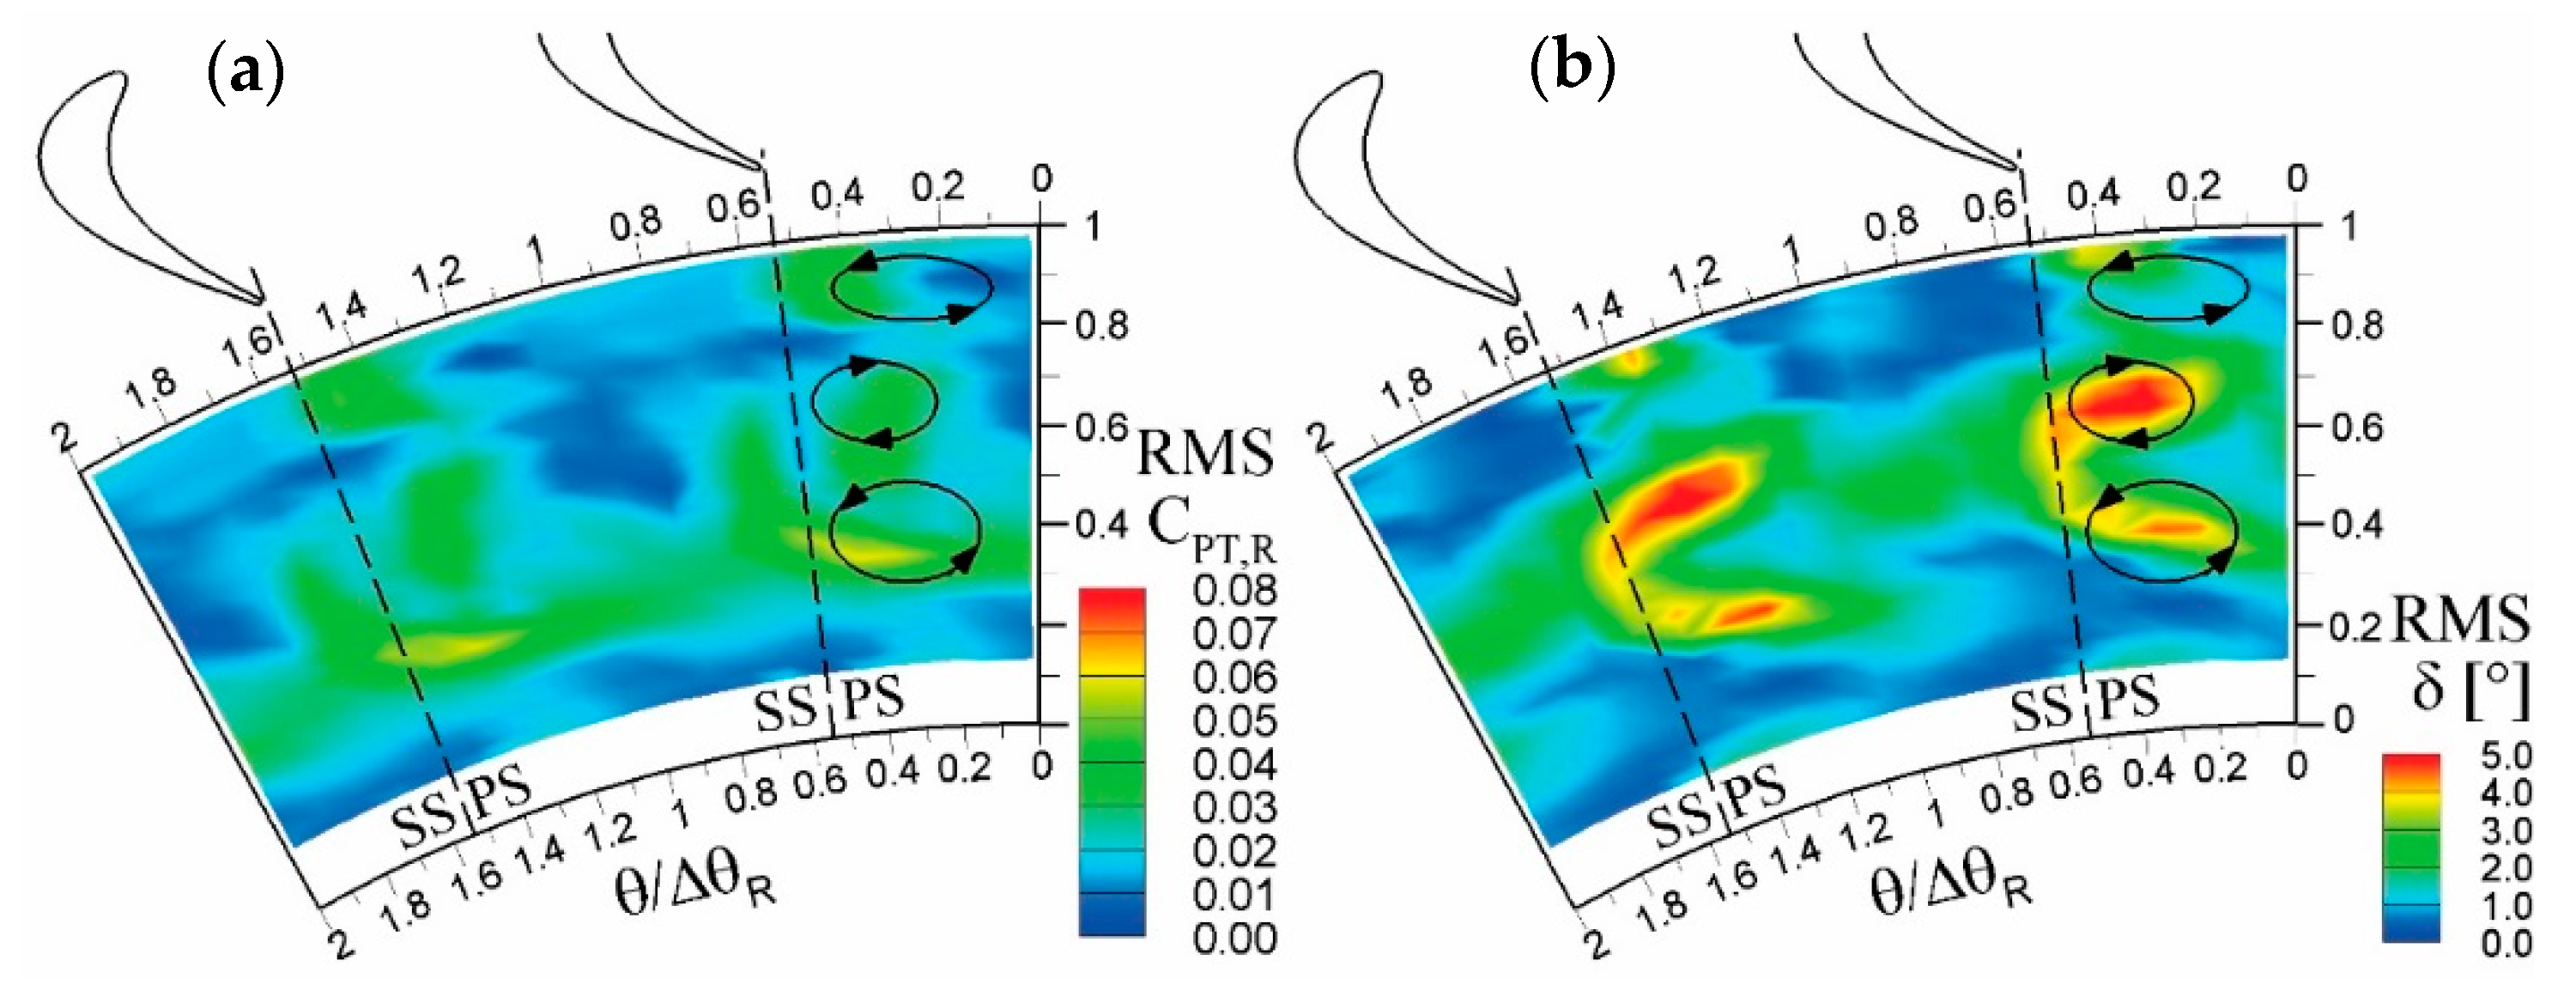
 Figure 11 and Figure 12 show the distribution of periodic unsteadiness (in terms of RMS) of CPT,R and δ for OP1 and OP4 to provide a synthetic view of the flow regions affected by the highest unsteadiness. To aid the reader in the interpretation, the positions of the three main vortex structures are also marked in the figures.
OP1 condition does not exhibit any visible effect of interaction above midspan, where a wide wake, a strong tip leakage flow, and a weak tip passage vortex determine the flow topology. Conversely, the effects of the vane–rotor interaction are well visible below midspan, and especially in the core of the hub passage vortex. Relative total pressure fluctuations affect most of the channel between 30% and 50% of the span; this indicates that the rotor wake below midspan, even though appearing weak on a time-averaged basis, is actually a highly unsteady structure. The high RMS level in the free-stream region in-between the adjacent wakes (θ/ΔθR = 1), is probably connected with the convection of the stator wake within the rotor. The periodic RMS of the flow angle shows a similar trend with a peak value in the core of the hub passage vortex and a second interesting peak in the free-stream at midspan. This feature was already observed in previous investigations on this turbine [11,13], and marks the presence of vortex–blade interaction, namely the transport of the vane secondary vortex filament throughout the rotor channel and its release at the rotor exit.
OP4 condition exhibits a completely different amplitude and pattern of periodic unsteadiness. At first, large fluctuations are found also above midspan, thus affecting the whole viscous/loss region identified on a time-averaged basis. Interestingly, below 30% span, where the rotor wake/loss region is mixed-out (see Figure 10a), also the unsteadiness decays completely. This suggests that, beside wake-blade interaction effects, for OP4 condition the rotor wake in itself is pulsating. Considering the flow angle unsteadiness, in this case all the three vortices undergo periodic fluctuations (even though the tip leakage vortex exhibits the lowest unsteadiness). The tip passage vortex now exhibits the largest unsteadiness, while being virtually steady in transonic condition (OP1). Vortex–blade interaction features are still visible in the free-stream, but the corresponding flow angle oscillations are much weaker than that detected in the core of the passage vortices. As a result, the dominating source of unsteadiness is not the transport of vane-exit vortex structures, but the pulsation of the rotor vortices, as already observed for the wake.
The periodic pulsation of rotor viscous structures arises as a consequence of the pitch-wise gradients in vane-exit flow field, which act as periodic fluctuations in the rotor-inlet flow field. As the blade sweeps in front of the stator wake and potential field, the rotor incidence angle and the rotor inlet relative Mach number fluctuate modifying periodically the rotor aerodynamic loading. Considering the axial gap set for the present investigation, the effect of potential field is mostly decayed at the rotor inlet, hence the vane wake is the main source of unsteadiness in the rotor aerodynamic loading. In transonic conditions (OP1), as negative incidence takes place, the comparison between velocity diagrams in the wake and in the free-stream produced a relatively small incidence angle variation. This explains why most of the unsteadiness in OP1 is caused by transport of viscous structures. Conversely, in OP4, the configuration of the velocity diagram and the wake velocity deficit amplifies the rotor incidence fluctuation, resulting in a severe oscillation in rotor aerodynamic loading.
It can be concluded that, in the present turbine, the rotor aerodynamics are highly penalized by a reduction of the expansion ratio, both in terms of loss generation and aerodynamic forcing. However, it is of particular interest to investigate the actual physical motivations for the observed features, as the change in the expansion ratio alters the relevance of compressibility effects, of viscous effects, as well as of loading effects. To shed some light on this issue, a dedicated analysis is reported in the following subsection on the effects caused only by the rotor aerodynamic loading on the aerodynamics of this turbine.

4.3. Loading Effects

In order to investigate the contribution of the aerodynamic loading on the rotor, the OPL set of tests was performed. As reported in Table 5, the corresponding change in Reynolds and Mach numbers is negligible. Results reported in Figure 13 and Figure 14 for the lower (OPLU) and higher (OPLL) loading respectively, evidences similar features to what found when reducing the expansion ratio. For the loaded case (OPLL), where a mean rotor incidence close to OP4 is imposed, very intense secondary flows and wake appear, somehow similar to what measured for low expansion ratio in OP4. When the incidence is reduced (OPLU) a dramatic reduction in the viscous and vortex structures is detected, as found for OP1. The tip passage vortex is, again, dramatically affected by the change in the rotor incidence, almost doubling its magnitude (in terms of over/under-turning) passing from low to high loading. These results indicate that, when changing the expansion ratio, the “indirect” change in rotor incidence can play a major role on the rotor aerodynamics, comparable to that of the “direct” change in Reynolds and Mach numbers.
Interestingly, the periodic unsteadiness also follows the same trend. Figure 15 and Figure 16 show the periodic unsteadiness measured for the unloaded and loaded cases, respectively, and clearly show that the stator–rotor interaction strongly increases with the rotor loading. In particular, the increase of rotor incidence angle experienced by the rotor for OPLL and OP4 makes both the passage vortices strongly unsteady. This result can be explained by considering the fluctuation of rotor-inlet flow angle in combination to the very large flow turning imparted by the rotor (~110°). Due to the non-linear dependence between the passage vortex magnitude and the flow turning, a given inlet flow fluctuation does produce higher fluctuations at higher rotor loading. This is what actually occurs for both OPLL and OP4, even though in this latter case the increase in incidence is an indirect effect.

4.4. Stage Performance Data

To quantify the weight of the direct effect (due to Mach and Reynolds numbers) with respect to the indirect one (related to the rotor incidence), the stator aerodynamic loss and the overall stage performance are now discussed. Stator losses are expresses by the total pressure loss coefficient (Ystat) while the stage performance is expressed by resorting the stage work, calculated by means of the velocity triangles, divided by the total-to-total isentropic enthalpy drop.
Results are reported in Table 5, alongside the chord-based stator and rotor Reynolds numbers, the Mach numbers downstream of the stator and rotor, and the rotor incidence angle at midspan (the latter being a marker for the rotor loading condition).
First considering the OP, the stator total pressure losses (Ystat) clearly mark the effects of the expansion ratio according to what commonly found in literature on the Mach number effects on secondary flows [26]. 
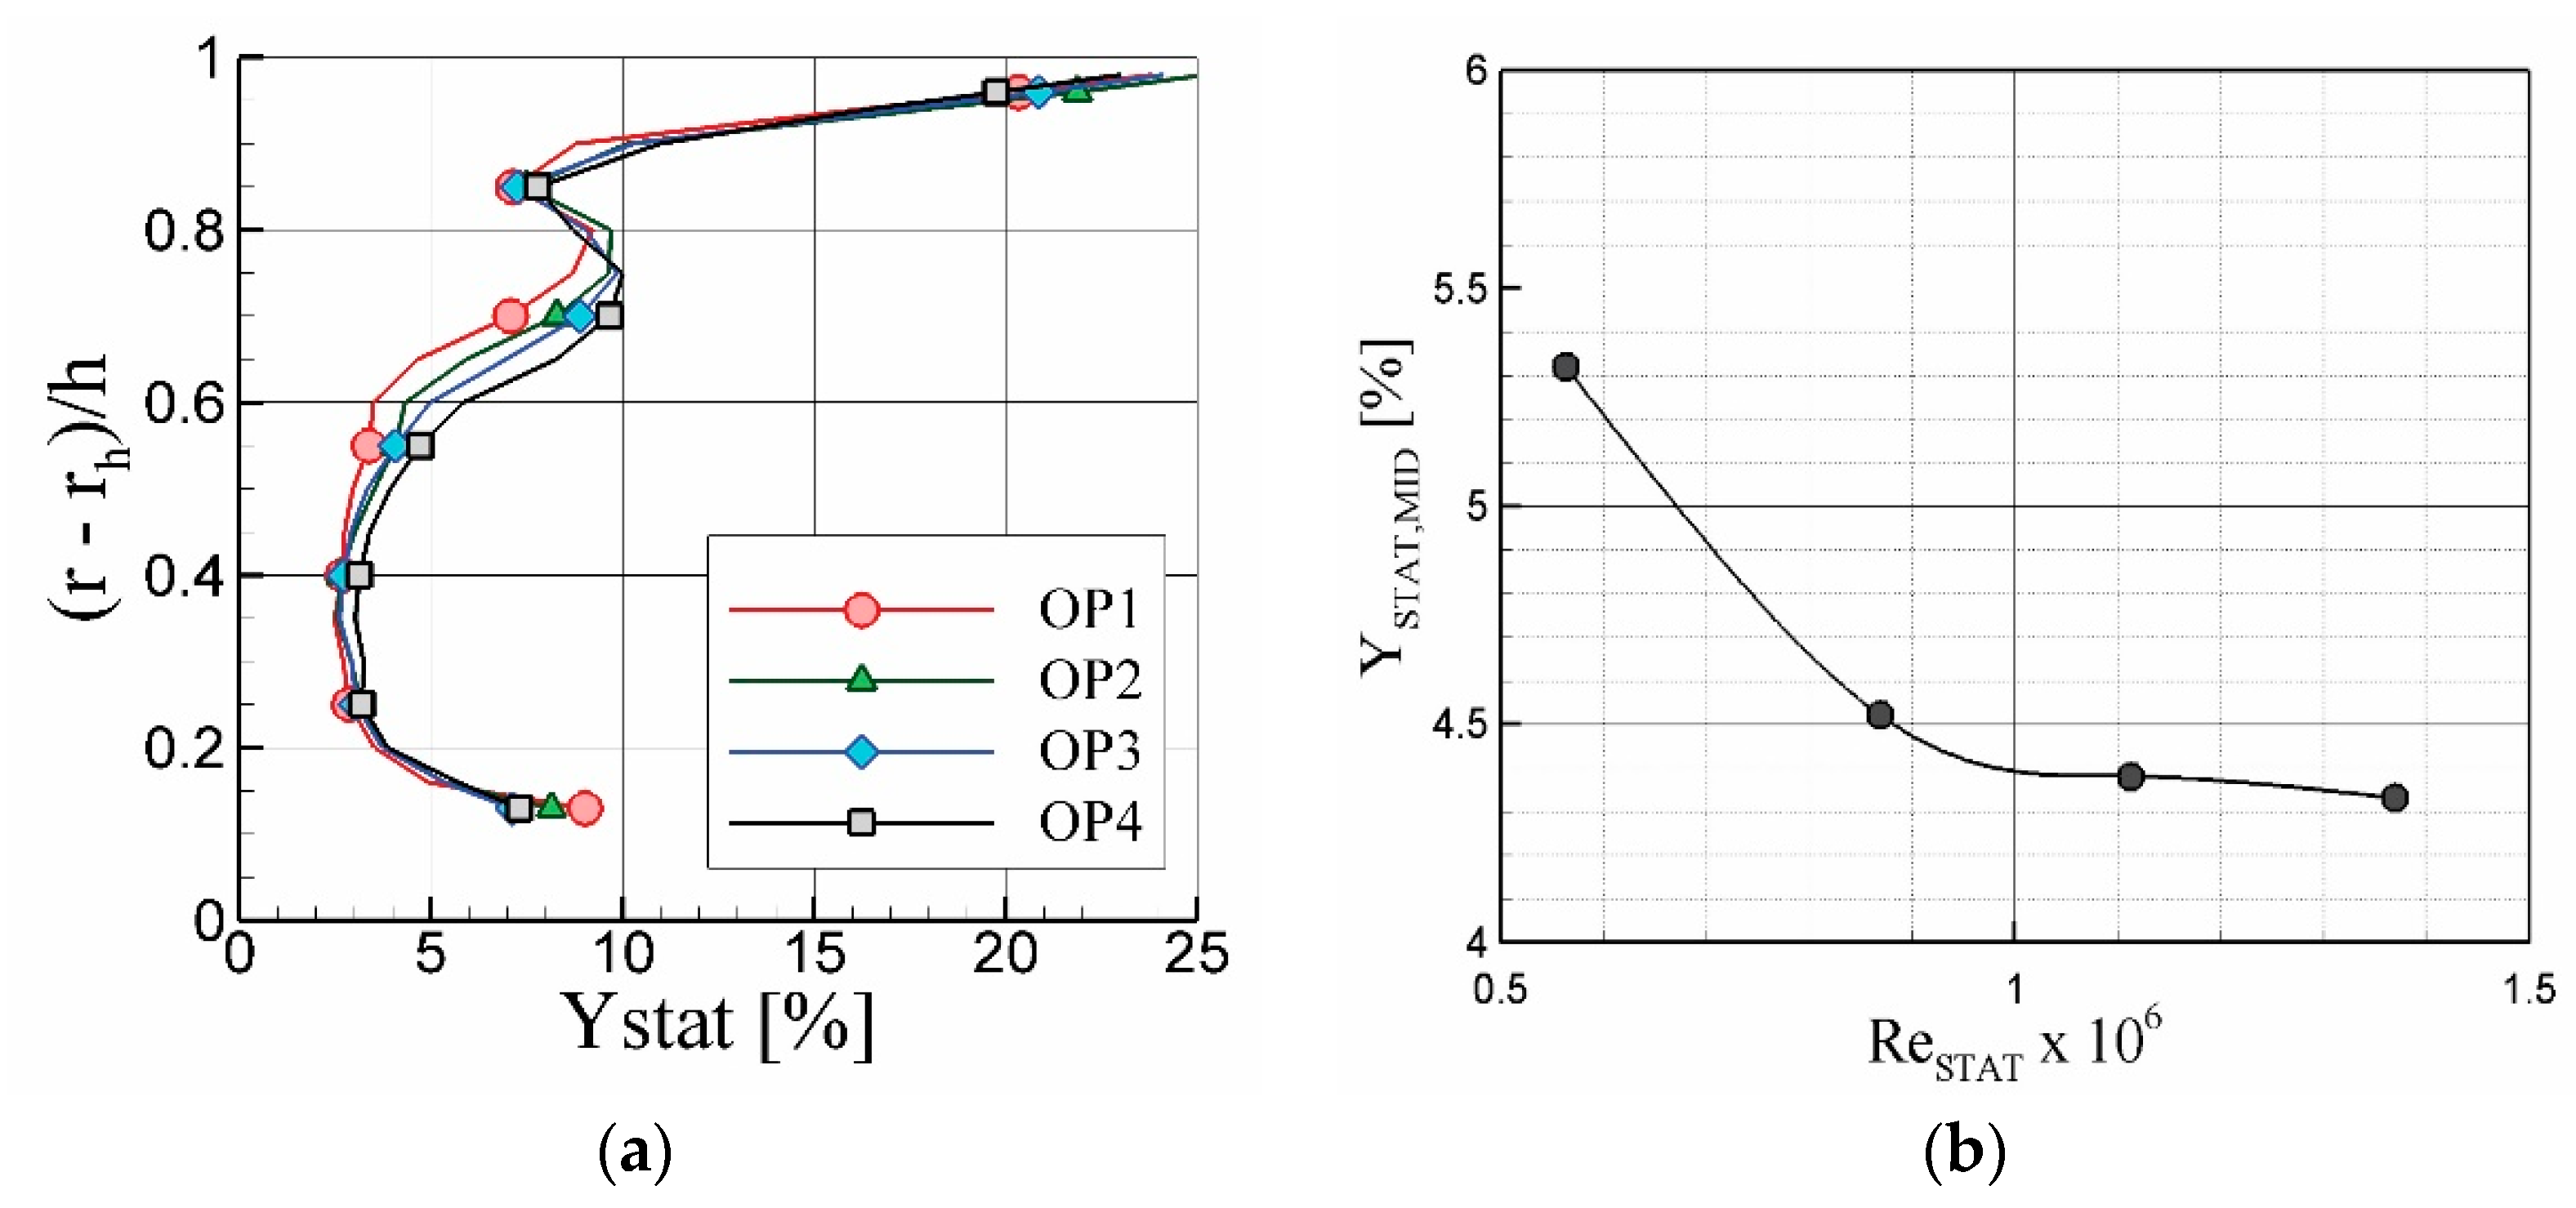
Figure 17a shows their spanwise trend with peaks at tip and hub whose intensities decrease as the Mach number increases.
When the profile losses—evaluated at midspan—are of concern (Figure 17b), a decreasing trend is also found; the loss trend is consistent also with typical Reynolds number effect, which foresees a decrease in friction coefficient as the viscous effects reduces their importance with respect to the inertial one. The limit Reynolds number is located around 106, where the function assumes an asymptotical trend to the value of ≈ 4.35.
In a nutshell, the midspan losses seem to be more related to the effect of Reynolds number than to that of the Mach number on the blade boundary layer.
OPLL and OPLU being different from OPLR only for the rotor rotational speed, they do not evidence any significant difference in the stator flow and for this on its loss coefficient.
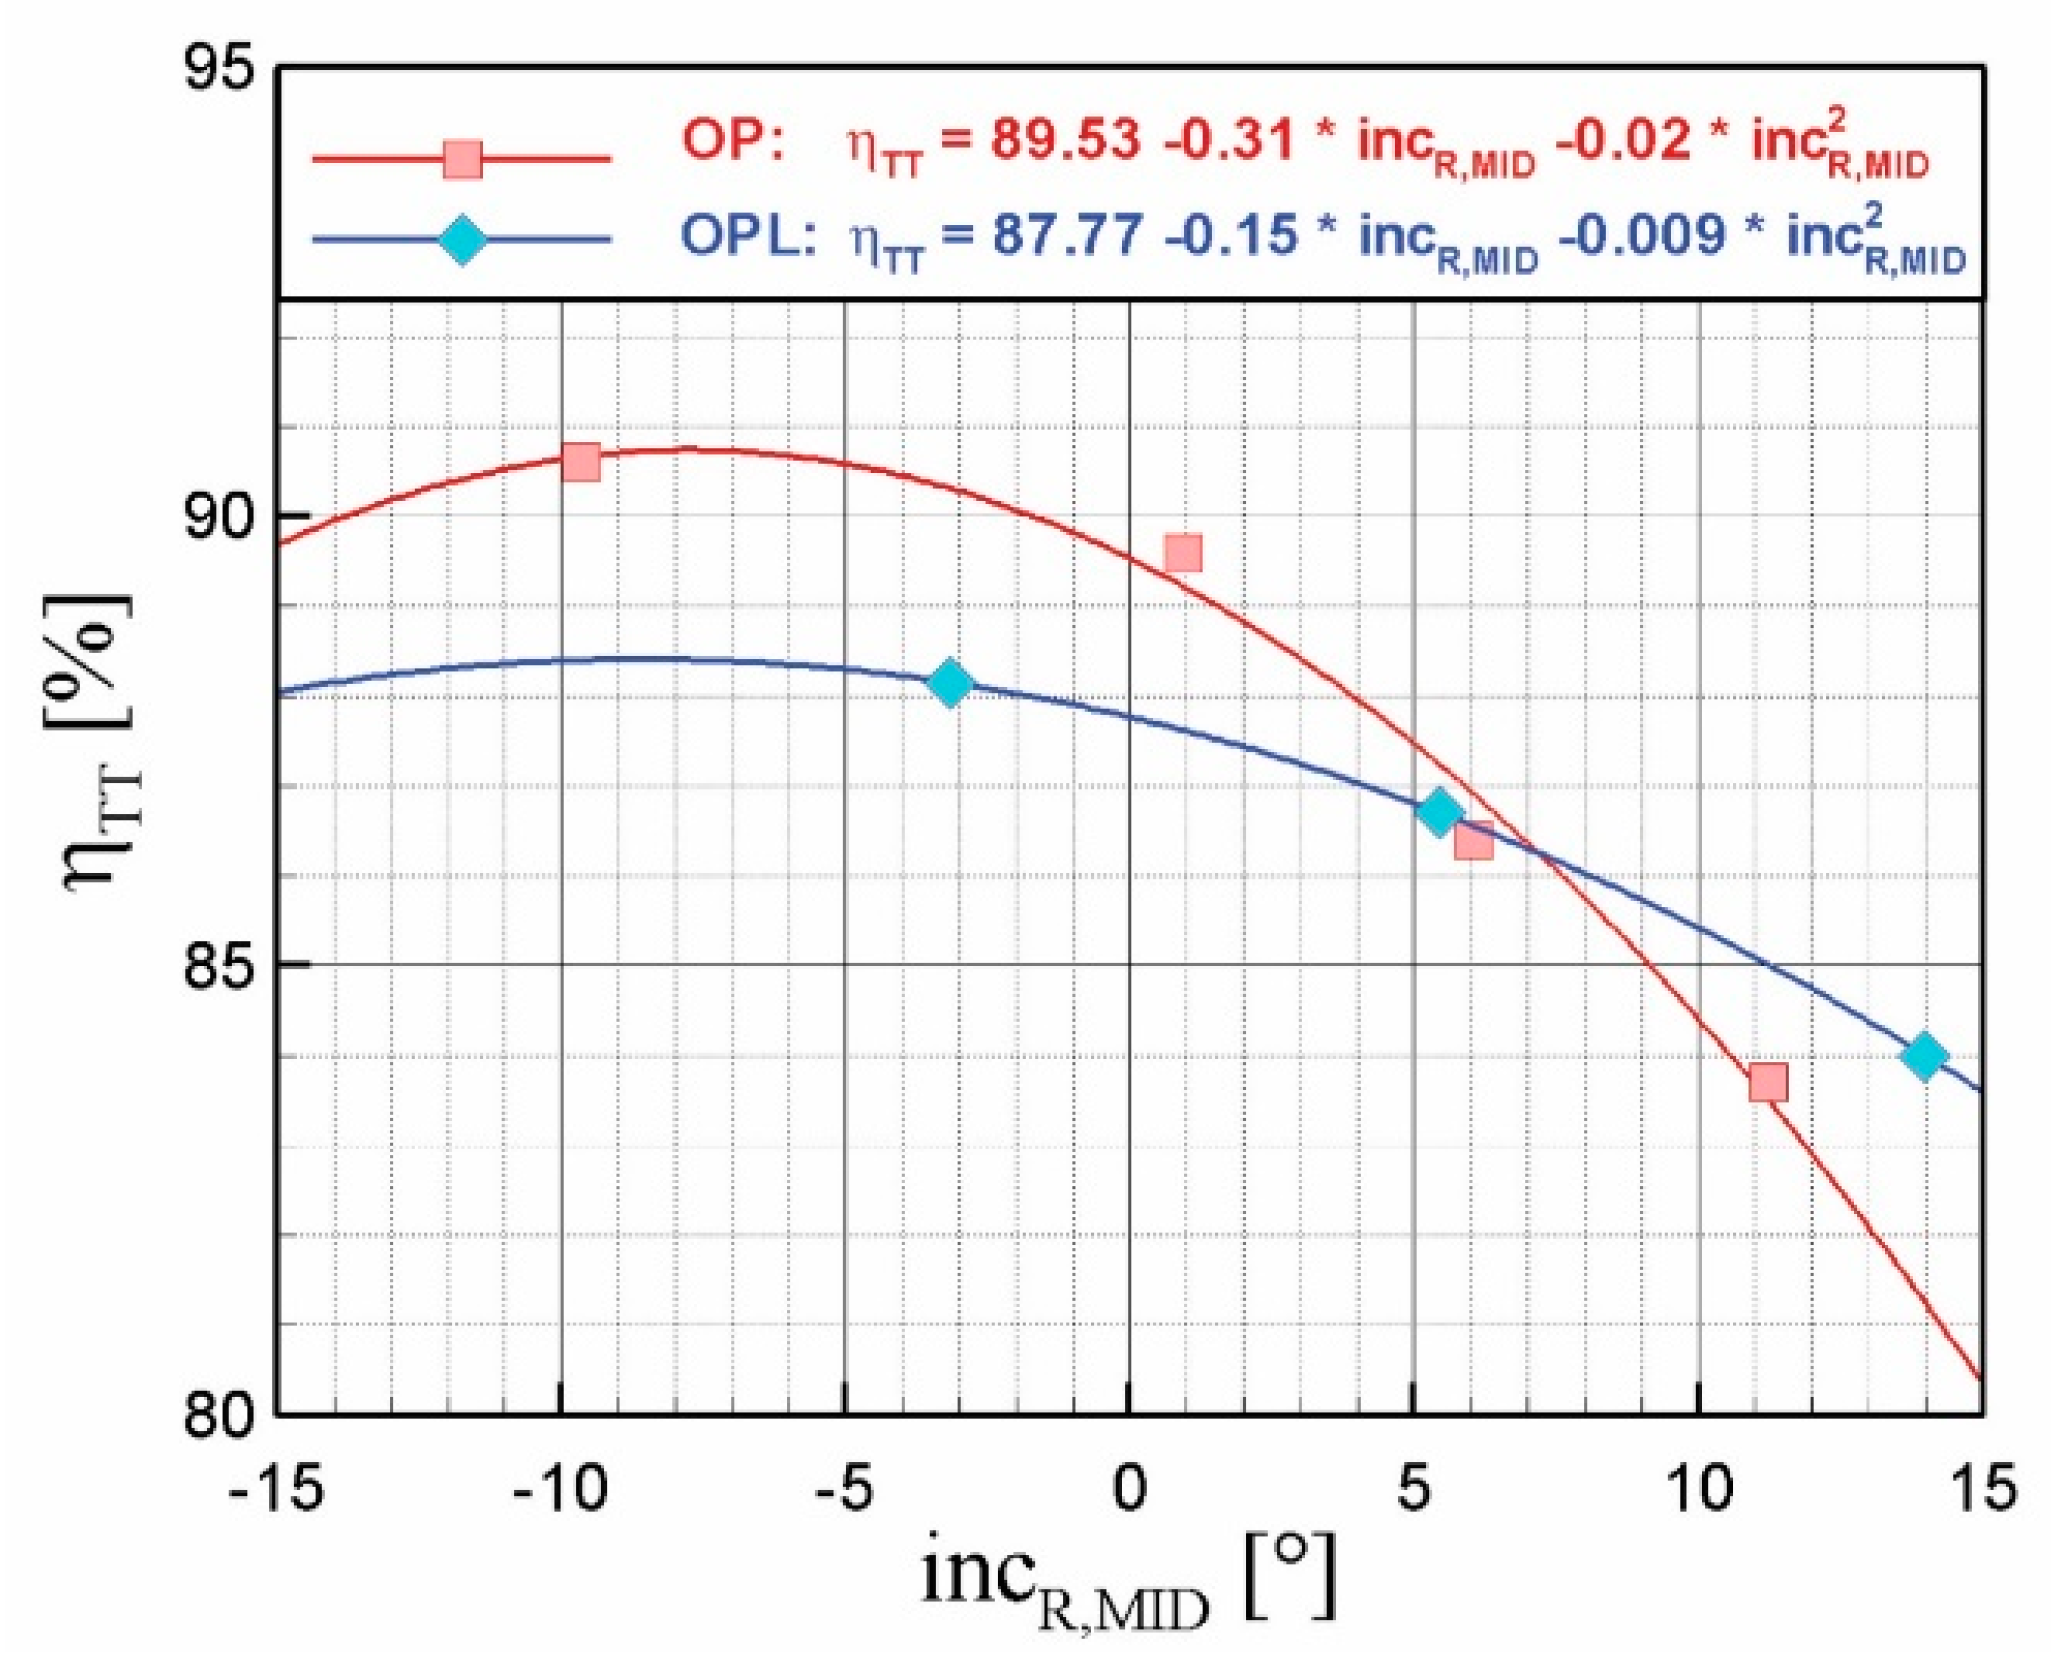
When the effect of stage expansion ratio is of concern, data from Table 5 can be more proficiently analyzed by considering the trends reported in Figure 18, where the total-to-total efficiency is plotted against the incidence angle at midspan, which is taken as indicator for the rotor loading. In general, a decreasing trend is found as the incidence angle increases but some differences appear between the two sets of test OP and OPL.
In the incidence range where the data from the data-sets are comparable (−5 < IR,MID < 15), the two curves have different slopes; OPL tests, that only feature a change in rotor loading with negligible variation in Reynolds and Mach number, exhibit a smaller slope. On the contrary, in OP tests, where both the direct and indirect effects are present, the efficiency is reduced by both the loading effects and by the Mach/Reynolds ones, all of them playing the same role. It is to be noted that the two data sets are quantitatively coherent, as the OP3 and OPLR conditions show a very good repeatability.
In order to provide a quantitative perspective on these effects, the stage performance in an incidence angle range within ±6° with respect to the reference condition OP3 is now considered.
For positive incidence levels with respect to the reference condition, the lower performance of the stage in the OP4 test with respect to the corresponding OPLL (for example: ηTT,OP3L − ηTT,OP4 ≈ 1% for IR,MID = 11°) has probably to be ascribed to the lower Reynolds and Mach numbers experienced by the blade row for low expansion ratio.
On the contrary, for negative incidence levels with respect to the reference conditions, the higher stage performance in the OP2 test with respect to the corresponding OPLU test (for example: ηTT,OP2 − ηTT,OP3U ≈ 2% for IR,MID = 1°) is promoted by the Mach and Reynolds number effects on the rotor induced by the higher expansion ratio (the Reynolds effect on the stator becomes negligible as shown in Figure 17b).
The differences in this trend are related to the non-linear effect of the loading that, when positive, acts so to overshadow the Reynolds and Mach number effects.

5. Discussion and Conclusions

This paper has presented and discussed the results of a wide experimental campaign devoted to the unsteady aerodynamics of an axial turbine stage, representative of a high pressure gas turbine. In particular, the effects of the stage expansion ratio and that of the rotor loading have been considered. In the test campaign on the expansion ratio, as a term of comparison the same stage outlet flow angle at midspan was set by regulating the turbine rotational speed. Four operating conditions were considered, performing comprehensive sets of measurements downstream of the stator and of the rotor in order to provide a complete overview of the stage flow configuration and performance.
In the campaign on the rotor loading, three test conditions were chosen by keeping the same expansion ratio and by changing the rotational speed.
Based on the presented results, some conclusions can be drawn with regard to the impact of the expansion ratio on the stage unsteady aerodynamics and performance. As a general overview, the impact of the expansion ratio, for an assigned stage-exit flow angle, has several features deeply combined one each other, in terms of Mach and Reynolds number effects as well as of rotor aerodynamic loading.
First, looking at the stator aerodynamics, the increase in the expansion ratio—and hence in the Mach and Reynolds numbers—reduces the impact of the secondary flow and wake, thus improving the stator efficiency and providing a more uniform flow at the rotor inlet. Such effects have been acknowledged in the paper as “direct effects” of the expansion ratio.
Since the compressibility affects the relation between the velocity and the expansion ratio, similarity at the rotor inlet cannot be fulfilled once the stage outlet flow direction is preserved. As a result, the rotor incidence changes, and this effect has been acknowledged in the paper as the “indirect effect” of the expansion ratio. So far, transonic conditions (OP1) make the rotor operate under negative incidence and, hence, in reduced loading conditions; on the contrary, at low speed (OP4) the rotor experiences high positive incidence. This behavior has some consequences: at first, the lower rotor loading for the transonic conditions reduces the magnitude of the rotor secondary vortices and wake, resulting in lower losses and a more uniform rotor-exit flow field. This occurrence, combined to more efficient stator aerodynamics, results in a higher overall stage efficiency. On the contrary, the raise of rotor loading—as the OP shifts from the transonic to the subsonic condition—increases the rotor losses, reducing the overall efficiency. Furthermore, the lower the stator-exit Mach number, the higher the unsteady fluctuations at the rotor inlet (in the rotating frame): so far, a larger pulsation in the rotor flow structures takes place, amplifying the aerodynamic forcing and lowering the aerodynamic efficiency at low subsonic conditions. Tests performed for variable rotor loading at constant expansion ratio have allowed better quantifying the magnitude of the indirect effects.
In fact, in the zero incidence range, the direct effects contribute to an increase in the efficiency of about 2%, which reduce to 1% when the rotor blade is loaded (given an incidence level mirrored with respect to the reference one) and only partially accountable to the Mach/Reynolds number reduction, (see the increase in the stator total pressure losses).
To conclude, once the stage-exit flow angle is set, the impact of the expansion ratio leads to a relevant efficiency variation as a combination of direct Reynolds and Mach number effects on the single blade rows and of indirect effects such as the change in the rotor incidence and in the stator–rotor interaction. The increase in stage efficiency passing from low subsonic to transonic condition was found to be about 7%.

Acknowledgments

The research leading to some of these results has received funding from the European Union Seventh Framework Program (FP7/2007-2013) within the framework of the “REsearch on COrenoise ReDuction” (RECORD) project under grant agreement No. 312444.

Author Contributions

Paolo Gaetani is the leading author of this paper, having directed and contributed to all the experiments reported in this paper. Giacomo Persico contributed to and processed the measurements at the rotor exit. Andrea Spinelli contributed to and processed the measurements at the stator exit. All three Authors equally contributed to the writing process of the paper.

Conflicts of Interest

The authors declare there are no conflicts of interest.

Nomenclature

Cchord (m)
CPT,Rrelative total pressure coeff. C P T , R = P T , R P r e f P T , r e f P r e f
Ddiameter (m)
Gflow rate (kg/s)
GNDNon-dimensional flow rate: G N D = G R T i n P i n D r e f 2
hblade height (m)
Itotal pressure unresolved unsteadiness; I P T , R = 1 N P T , R , u n r e s 2 (see Ref. [30] for more details)
incincidence angle (deg.)
Kpvelocity coeff., K p = U V 1
lwork (J/kg)
MMach number
MuPeripheral Mach number: M u = U M I D γ R T i n
OPoperating conditions
Ppressure (bar)
rradius (m)
ReReynolds number
rpsrotational speed (revolution per second)
Ttemperature (K)
Vvelocity (m/s)
Uperipheral speed (m/s)
Ystatstator total pressure loss Y s t a t = P T , i n P T P T , i n P s
αabsolute flow angle (from axial) (deg.)
βexpansion ratio
δdeviation angle (deg.)
χreaction degree: χ = 1 1 β s t a t o r 1 γ γ 1 β s t a g e 1 γ γ
γspecific heat ratio
ηefficiency
Ωsstreamwise vorticity: Ω s = ( × V ) V V
ρdensity (kg/m3)
θcircumferential coordinate (deg.)
ϕFlow coefficient: φ = G / ρ i n r p s D r e f 3
ψWork coefficient: ψ = l i s U r e f 2

Subscripts

aaxial
NDnon dimensional
hhub
ininlet
isisentropic
MIDmidspan
refreference
Rrelative, rotor
statstator
Ttotal
TSTotal to Static
TTTotal to Total
unresunresolved (non-periodic) component of the measured signal
1vane outlet

References

  1. Stieger, R.D.; Hodson, H.P. The Unsteady Development of a Turbulent Wake through a Downstream Low-Pressure Turbine Blade Passage. J. Turbomach. 2005, 127, 388–394. [Google Scholar] [CrossRef]
  2. Hodson, H.P. Measurements of Wake Generated Unsteadiness in the Rotor Passages of Axial Flow Turbines. J. Eng. Gas Turbines Power 1985, 107, 467–475. [Google Scholar] [CrossRef]
  3. Binder, A.; Schroeder, T.; Hourmouziadis, J. Turbulence Measurements in a Multistage Low-Pressure Turbine. J. Turbomach. 1989, 111, 153–161. [Google Scholar] [CrossRef]
  4. Binder, A.; Forster, W.; Mach, K.; Rogge, H. Unsteady Flow Interaction Caused by Stator Secondary Vortices in a Turbine Rotor. J. Turbomach. 1987, 109, 251–256. [Google Scholar] [CrossRef]
  5. Chaluvadi, V.S.P.; Kalfas, A.I.; Benieghbal, M.R.; Hodson, H.P.; Denton, J.D. Blade-Row Interaction in a High-Pressure Turbine. J. Propuls. Power 2001, 17, 892–901. [Google Scholar] [CrossRef]
  6. Chaluvadi, V.S.P.; Kalfas, A.I.; Hodson, H.P.; Ohyama, H.; Watanabe, E. Blade Row Interaction in High-Pressure Steam Turbine. J. Turbomach. 2003, 125, 14–24. [Google Scholar] [CrossRef]
  7. Pullan, G.; Denton, J.D. Numerical Simulation of Vortex-Turbine Blade Interaction. In Proceedings of the 5th European Turbomachinery Conference, Prague, Czech, 17–21 March 2003.
  8. Schlienger, J.; Kalfas, A.I.; Abhari, R.S. Vortex-Wake-Blade Interaction in a Shrouded Axial Turbine. J. Turbomach. 2005, 127, 699–707. [Google Scholar] [CrossRef]
  9. Pullan, G. Secondary Flows Caused by Blade Row Interaction in a Turbine Stage. J. Turbomach. 2006, 128, 484–491. [Google Scholar] [CrossRef]
  10. Gaetani, P.; Persico, G.; Dossena, V.; Osnaghi, C. Investigation of the Flow Field in a High-Pressure Turbine Stage for Two Stator-Rotor Axial Gaps—Part II: Unsteady Flow Field. J. Turbomach. 2007, 129, 580–590. [Google Scholar] [CrossRef]
  11. Persico, G.; Mora, A.; Gaetani, P.; Savini, M. Unsteady Aerodynamics of a Low Aspect Ratio Turbine Stage: Modeling Issues and Flow Physics. J. Turbomach. 2012, 134, 061030. [Google Scholar] [CrossRef]
  12. Persico, G.; Gaetani, P.; Osnaghi, C. A Parametric Study of the Blade Row Interaction in a High Pressure Turbine Stage. J. Turbomach. 2009, 131, 031006. [Google Scholar] [CrossRef]
  13. Gaetani, P.; Persico, G.; Osnaghi, C. Effects of Axial Gap on the Vane-Rotor Interaction in a Low Aspect Ratio Turbine Stage. J. Propuls. Power 2010, 26, 325–334. [Google Scholar] [CrossRef]
  14. Giles, M.B. Stator/Rotor Interaction in a Transonic Turbine. J. Propuls. Power 1990, 6, 621–627. [Google Scholar] [CrossRef]
  15. Dénos, R.; Arts, T.; Paniagua, G.; Michelassi, V.; Martelli, F. Investigation on the Unsteady Rotor Aerodynamics in a Transonic Turbine Stage. J. Turbomach. 2001, 123, 81–89. [Google Scholar] [CrossRef]
  16. Miller, R.J.; Moss, R.W.; Ainsworth, R.W.; Harvey, N.W. Wake, Shock, and Potential Field Interactions in a 1.5 Stage Turbine—Part I: Vane-Rotor and Rotor-Vane Interaction. J. Turbomach. 2003, 125, 33–39. [Google Scholar] [CrossRef]
  17. Paniagua, G.; Yasa, T.; de la Loma, A.; Castillon, L.; Coton, T. Unsteady strong shocks interactions in a transonic turbine: Experimental and numerical analysis. J. Propuls. Power 2008, 24, 722–731. [Google Scholar] [CrossRef]
  18. Göttlich, E.; Neumayer, F.; Pieringer, P.; Woisetschläger, J.; Sanz, W.; Heitmeir, F. Investigation of stator-rotor interaction in a transonic turbine stage using laser-doppler-velocimetry and pneumatic probes. J. Turbomach. 2004, 126, 297–305. [Google Scholar] [CrossRef]
  19. Göttlich, E.; Woisetschläger, J.; Pieringer, P.; Hampel, B.; Heitmeir, F. Investigation of wake vortex shedding and wake-wake interaction in a transonic turbine stage using Laser-Doppler-Velocimetry and Particle-Image-Velocimetry. J. Turbomach. 2006, 128, 178–187. [Google Scholar] [CrossRef]
  20. Paradiso, B.; Persico, G.; Gaetani, P.; Schennach, O.; Peknic, R.; Woisetschlaeger, J. Blade Row Interaction in a One and a Half Stage Transonic Turbine Focusing on Three Dimensional Effects—Part I: Stator-Rotor Interaction. In Proceedings of the ASME Turbo Expo, Berlin, Germany, 9–13 June 2008.
  21. Dénos, R.; Paniagua, G. Effect of vane-rotor interaction on the unsteady flowfield downstream of a transonic HP turbine. Proc. Inst. Mech. Eng. A J. Power Energy 2005, 219, 431–442. [Google Scholar] [CrossRef]
  22. Ong, J.; Miller, R.J. Hot Streak and Vane Coolant Migration in a Downstream Rotor. J. Turbomach. 2012, 134, 051002. [Google Scholar] [CrossRef]
  23. Jacobi, S.; Mazzoni, C.; Chana, K.; Rosic, B. Investigation of unsteady flow phenomena in the first vane caused by the combustor flow with swirl. J. Turbomach. 2017, 139, 041006. [Google Scholar] [CrossRef]
  24. Salvadori, S.; Ottanelli, L.; Jonsson, M.; Ott, P.; Martelli, F. Investigation of High-Pressure Turbine Endwall Film-Cooling Performance Under Realistic Inlet Conditions. J. Propuls. Power 2012, 28, 799–810. [Google Scholar] [CrossRef]
  25. Knoblock, K.; Neuhaus, L.; Bake, F.; Gaetani, P.; Persico, G. Experimental assessment of noise generation and transmission in a high-pressure transonic turbine stage. In Proceedings of the ASME Turbomachinery Technical Conference and Exposition, Seoul, Korea, 13–17 June 2016.
  26. Perdichizzi, A. Mach number effects on Secondary Flow Development of a Turbine Cascade. J. Turbomach. 1990, 112, 643–651. [Google Scholar] [CrossRef]
  27. Schobeiri, M.T.; Gilarranz, J.L.; Johansen, E.S. Aerodynamic and performance studies of a three-stage high pressure research turbine with 3-D-blades, design point and off design experimental investigations. In Proceedings of the ASME Turbo Expo, 2000: Power for Land, Sea, and Air, Munich, Germany, 8–11 May 2000.
  28. Gaetani, P.; Persico, G.; Dossena, V.; Osnaghi, C. Investigation of the Flow Field in a High-Pressure Turbine Stage for Two Stator-Rotor Axial Gaps—Part I: Three-Dimensional Time-Averaged Flow Field. J. Turbomach. 2007, 129, 572–579. [Google Scholar] [CrossRef]
  29. Persico, G.; Gaetani, P.; Guardone, A. Design and analysis of new concept fast-response pressure probes. Meas. Sci. Technol. 2005, 16, 1741–1750. [Google Scholar] [CrossRef]
  30. Persico, G.; Gaetani, P.; Paradiso, B. Estimation of turbulence by single sensor pressure probes. In Proceedings of the 19th Symposium of Measuring Techniques in Turbomachinery, Rhode Saint Genèse, Belgium, 7–8 April 2008.
Figure 1. Meridional sketch of the axial turbine section.
Applsci 07 00259 g001
Figure 2. Absolute flow angle downstream of the stage for the different Operating condition (OP).
Applsci 07 00259 g002
Figure 3. Stator-exit flow field in OP1, (a) total pressure loss coefficient; (b) streamwise vorticity; (c) local expansion ratio; (d) absolute Mach number.
Applsci 07 00259 g003
Figure 4. Stator-exit flow field in OP4, (a) total pressure loss coefficient; (b) streamwise vorticity; (c) local expansion ratio; (d) absolute Mach number.
Applsci 07 00259 g004
Figure 5. Span-wise profiles downstream of the stator, (a) expansion ratio; (b) Mach number; (c) absolute flow angle. Coloured legend applies to all frame.
Applsci 07 00259 g005
Figure 6. (a) Reaction coefficient, (b) Kp and (c) incidence span-wise profiles downstream of the stator.
Applsci 07 00259 g006
Figure 7. Rotor-exit relative flow field in OP1 (transonic), (a) relative total pressure coefficient; (b) deviation angle; (c) relative Mach number; (d) unresolved unsteadiness.
Applsci 07 00259 g007
Figure 8. Rotor-exit relative flow field in OP2, (a) relative total pressure coefficient; (b) deviation angle.
Applsci 07 00259 g008
Figure 9. Rotor-exit relative flow field in OP3, (a) relative total pressure coefficient; (b) deviation angle.
Applsci 07 00259 g009
Figure 10. Rotor-exit relative flow field in OP4, (a) relative total pressure coefficient; (b) deviation angle; (c) relative Mach number; (d) unresolved unsteadiness.
Applsci 07 00259 g010
Figure 11. RMS of periodic unsteadiness for OP1 (transonic), (a) RMS of the relative total pressure coefficient; (b) RMS of the deviation angle.
Applsci 07 00259 g011
Figure 12. RMS of periodic unsteadiness for OP4, (a) RMS of the relative total pressure coefficient; (b) RMS of the deviation angle.
Applsci 07 00259 g012
Figure 13. Rotor-exit relative flow field in OPLU, (a) relative total pressure coefficient; (b) deviation angle.
Applsci 07 00259 g013
Figure 14. Rotor-exit relative flow field in OPLL, (a) relative total pressure coefficient; (b) deviation angle.
Applsci 07 00259 g014
Figure 15. RMS of periodic unsteadiness for OPLU, (a) RMS of the relative total pressure coefficient; (b) RMS of the deviation angle.
Applsci 07 00259 g015
Figure 16. RMS of periodic unsteadiness for OPLL, (a) RMS of the relative total pressure coefficient; (b) RMS of the deviation angle.
Applsci 07 00259 g016
Figure 17. (a) Spanwise profile of the stator total pressure loss coefficient; and (b) stator profile loss coefficient at midspan vs. Reynolds number.
Applsci 07 00259 g017
Figure 18. Total to total efficiency versus rotor incidence angle at midspan, for the two sets of tests, OP and OPL.
Applsci 07 00259 g018
Table 1. Laboratorio di Fluidodinamica delle Macchine (LFM) High-Pressure (HP) turbine stage geometry.
ItemDimension
Diameter (mid)350 mm
Span50 mm
Gap/Cstat,a1.00
VANEROTOR
Profiles Applsci 07 00259 i001 Applsci 07 00259 i002
Blade number2225
Solidity (mid)1.201.25
Aspect ratio0.830.91
Blade turninghubmidtiphubmidtip
72.575.277.5124.6115.393.2
Table 2. Measurement expanded uncertainties, 5HP: 5-Hole Probe; FRAPP: Fast Response Aerodynamic Pressure Probe.
Instrument/DeviceUncertainty
QuantityMagnitude
ThermocoupleTemperature [K]0.25
Flattened probePressures [Pa]60
5HPPressures [Pa]60
Angle [°]0.2
FRAPPPressures [Pa]100
Angle [°]0.25
Venturi nozzleFlow rate0.8%
statorTotal pressure loss0.2%
StageEfficiency0.5%
Table 3. Main flow quantities for different OP.
OPFlow Rate (kg/s)RpmβTSTT,in (K)
OP42.45441501.155303
OP33.7870001.40323
OP24.990001.65323
OP16.0511,1001.95323
OP3L3.7558001.385303
OP3R3.7568001.385303
OP3U3.7576001.385303
Table 4. Non-dimensional flow quantities for OP1-4 (reference diameter = 350 mm).
OPGNDMuβTSϕψ
OP40.2050.2181.1555.002.09
OP30.2690.3561.44.021.80
OP20.2990.4581.653.471.58
OP10.3130.5651.952.951.36
Table 5. Stage efficiency and stator total pressure loss for all the tested operating conditions.
OPβTSηTTYstat %Restat × 106Ystat,MID %Mstat,MIDIR @ MIDReR × 105
OP11.950.9065.791.374.330.79−9.78.2
OP21.650.8965.771.114.380.711.6.6
OP31.40.8645.930.874.520.596.5.0
OP41.1550.8376.620.565.320.4011.23.2
OPLL1.3850.8405.900.854.500.56145.5
OPLR1.3850.8675.900.854.500.565.54.9
OPLU1.3850.8815.900.854.500.56−3.24.5

